Embed Size (px)
Citation preview

Q2 2014 Earnings Results
July 23, 2014
Conference Call and Webcast

Forward-looking Statements
2
The projected financial results presented in the following slides represent management's estimates of Gilead’s future financial results. Gilead cautions
readers that forward-looking statements are subject to certain risks and uncertainties that could cause actual results to differ materially. These risks and
uncertainties include: Gilead's ability to achieve its anticipated full year 2014 financial results; Gilead's ability to sustain growth in revenues for its antiviral,
cardiovascular and respiratory programs; availability of funding for state AIDS Drug Assistance Programs (ADAPs); continued fluctuations in ADAP
purchases driven by federal and state grant cycles which may not mirror patient demand and may cause fluctuations in Gilead's earnings; the possibility
of unfavorable results from clinical trials involving GS-9973, GS-5806, GS-6615, sofosbuvir, including in combination with other product candidates such
as LDV; Gilead's ability to initiate clinical trials in its currently anticipated timeframes; the levels of inventory held by wholesalers and retailers which may
cause fluctuations in Gilead's earnings; Gilead's ability to submit NDAs for new product candidates in the timelines currently anticipated, including the
fixed dose combination of LDV/SOF with the PDMA; Gilead's ability to receive regulatory approvals in a timely manner or at all, for new and current
products, including sofosbuvir in Japan; the fixed-dose combination of LDV/SOF in the United States and elvitegravir and cobicistat as single agents in
the United States; Gilead's ability to successfully commercialize its products, including Sovaldi, Stribild, Vitekta, Tybost and Zydelig; the risk that
estimates of patients with HCV or anticipated patient demand may not be accurate; Gilead's ability to successfully develop its respiratory, cardiovascular,
oncology and inflammation programs; safety and efficacy data from clinical studies may not warrant further development of Gilead's product candidates;
the potential for additional austerity measures in European countries that may increase the amount of discount required on Gilead's products; Gilead's
ability to complete its share repurchase programs due to changes in its stock price, corporate or other market conditions; fluctuations in the foreign
exchange rate of the U.S. dollar that may cause an unfavorable foreign currency exchange impact on Gilead's future revenues and pre-tax earnings; and
other risks identified from time to time in Gilead's reports filed with the U.S. Securities and Exchange Commission (SEC). In addition, Gilead makes
estimates and judgments that affect the reported amounts of assets, liabilities, revenues and expenses and related disclosures. Gilead bases its
estimates on historical experience and on various other market specific and other relevant assumptions that it believes to be reasonable under the
circumstances, the results of which form the basis for making judgments about the carrying values of assets and liabilities that are not readily apparent
from other sources. Actual results may differ significantly from these estimates. You are urged to consider statements that include the words may, will,
would, could, should, might, believes, estimates, projects, potential, expects, plans, anticipates, intends, continues, forecast, designed, goal, or the
negative of those words or other comparable words to be uncertain and forward-looking. Gilead directs readers to its press releases, Quarterly Report on
Form 10-Q for the quarter ended March 31, 2014 and other subsequent disclosure documents filed with the SEC. Gilead claims the protection of the Safe
Harbor contained in the Private Securities Litigation Reform Act of 1995 for forward-looking statements. All forward-looking statements are based on
information currently available to Gilead, and Gilead assumes no obligation to update any such forward-looking statements.
This presentation includes GAAP and non-GAAP financial measures, a complete reconciliation between these two measures is available on the
Company’s website at www.gilead.com within the investor section. Management believes this non-GAAP information is useful for investors, when
considered in conjunction with Gilead’s GAAP financial statements, because management uses such information internally for its operating, budgeting
and financial planning purposes. Non-GAAP information is not prepared under a comprehensive set of accounting rules and should only be used to
supplement an understanding of Gilead’s operating results as reported under U.S. GAAP.

Q2 2014 Earnings Call Agenda
Introduction Patrick O’Brien, VP, Investor Relations
Commentary
Q&A
John Martin, Chairman and CEO
Paul Carter, EVP, Commercial Operations
Robin Washington, EVP and CFO
Also:
John Milligan, President and COO
Norbert Bischofberger, EVP, R&D and CSO
3

John C. Martin, Ph.D.
July 23, 2014
Chairman and CEO

Q2 2014 Corporate Highlights Corporate
- Announced authorization of a new repurchase plan of up to $5 billion of the
company’s common stock
HCV Highlights
- Submitted New Drug Application (NDA) to Japan’s Pharmaceutical and Medical
Devices Agency (PMDA) for sofosbuvir (SOF) in combination with ribavirin
(RBV) in GT 2 patients
- Announced positive Phase 3 results for the single tablet regimen (STR) of
LDV/SOF, with and without RBV, in GT 1 patients in Japan
Oncology Highlights
- Updated interim results of a Phase 2 study evaluating GS-9973 (Syk inhibitor),
for the treatment of patients with relapsed CLL
5
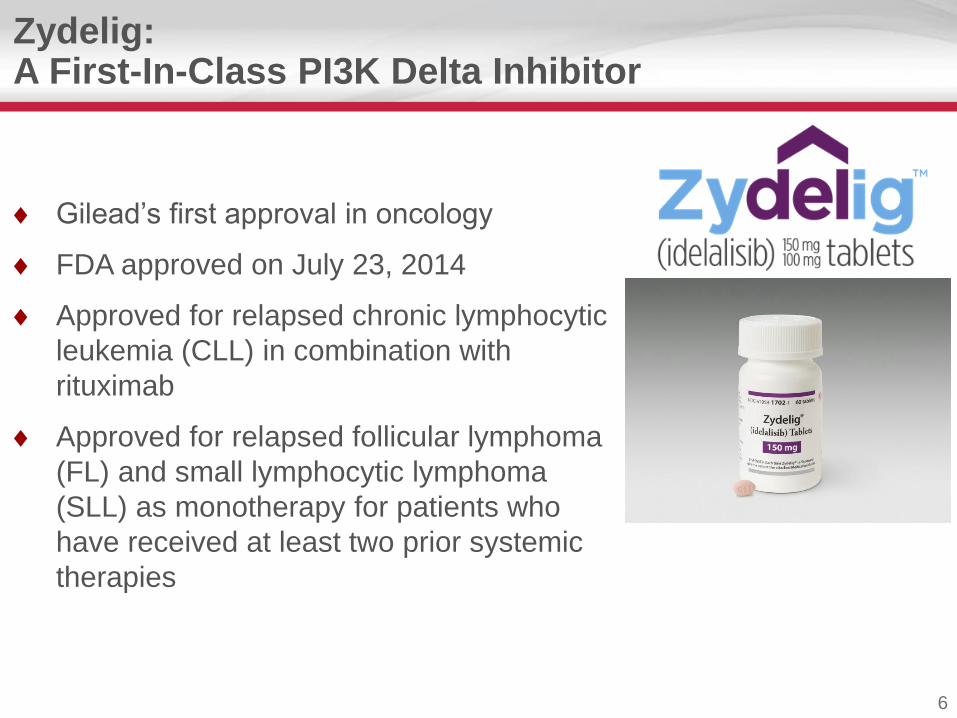
Gilead’s first approval in oncology
FDA approved on July 23, 2014
Approved for relapsed chronic lymphocytic
leukemia (CLL) in combination with
rituximab
Approved for relapsed follicular lymphoma
(FL) and small lymphocytic lymphoma
(SLL) as monotherapy for patients who
have received at least two prior systemic
therapies
6
Zydelig: A First-In-Class PI3K Delta Inhibitor

Pipeline Product Candidates
7
HIV
Cobicistat (PK enhancer) EU Approved as Tybost; U.S. Regulatory Submission
Elvitegravir (integrase inhibitor) EU Approved as Vitekta; U.S. Regulatory Submission
STR of EVG/cobicistat/FTC/TAF
STR of DRV/cobicistat/FTC/TAF
Liver Diseases
HCV
STR of LDV/SOF (NS5A inhibitor/nucleotide NS5B inhibitor) U.S. and European Regulatory Submissions
FDC of SOF/GS-5816 (pan-genotypic NS5B/NS5A inhibitors)
GS-9669 (non-nuc NS5B site 2 polymerase inhibitor)
GS-9451 (NS3 protease inhibitor)
GS-9857 (pan-genotypic NS3 protease inhibitor)
HBV
TAF (nucleotide reverse transcriptase inhibitor)
GS-4774 (Tarmogen T cell immunity stimulator) - HBV
GS-9620 (TLR-7 agonist) - HBV/HCV
Other
Simtuzumab (monoclonal antibody) - Liver Fibrosis
Simtuzumab (monoclonal antibody) - NASH
Simtuzumab (monoclonal antibody) - Primary Sclerosing Cholangitis
GS-5745 (MMP9 mAb inhibitor) - Ulcerative Colitis
GS-6637 (ALDH-2 inhibitor) - Drug Addiction
1 2 3
Regulatory
Submissions
Phase

Pipeline Product Candidates (continued)
8
Oncology/Inflammation
Idelalisib (PI3K delta inhibitor) - iNHL European Regulatory Submission
Idelalisib (PI3K delta inhibitor) - CLL European Regulatory Submission
Idelalisib (PI3K delta inhibitor) - Frontline CLL
Momelotinib (JAK inhibitor) - Myelofibrosis
Idelalisib (PI3K delta inhibitor) - Frontline iNHL
Momelotinib (JAK inhibitor) - Pancreatic Cancer
Simtuzumab (monoclonal antibody) - Pancreatic Cancer
Simtuzumab (monoclonal antibody) - Myelofibrosis
Simtuzumab (monoclonal antibody) - Colorectal Cancer
GS-9973 (Syk inhibitor) - Hematological Malignancies
GS-5745 (MMP9 mAb inhibitor) - Solid Tumors
Cardiovascular
Ranolazine (late sodium current inhibitor) - Incomplete Revascularization Post PCI
Ranolazine (late sodium current inhibitor) - CAD in Type 2 Diabetes Mellitus
Ranolazine (late sodium current inhibitor) - Paroxysmal Atrial Fibrillation
GS-6615 (late sodium current inhibitor) - LQT-3 Syndrome
GS-6615 (late sodium current inhibitor) - Hypertrophic Cardiomyopathy
GS-6615 (late sodium current inhibitor) - Ventricular Tachycardia/Ventricular Fibrillation
GS-4997 (ASK-1 inhibitor) - Diabetic Nephropathy
GS-4997 (ASK-1 inhibitor) - PAH
Respiratory
GS-5806 (fusion inhibitor) - Respiratory Syncytial Virus
Simtuzumab (monoclonal antibody) - IPF
Phase Regulatory
Submissions1 2 3

Submitted NDA on June 27, 2014
Filing is supported by results from SOF Phase 3 study in
GT 2 HCV infected patients
– Regimen of SOF + RBV dosed for 12 weeks
– Achieved overall SVR12 97% (n=148/153)
– Achieved SVR12 98% (n=88/90) in treatment naïve patients
– Achieved SVR12 95% (n=60/63) in treatment experienced
patients
9
Sofosbuvir GT 2 Regulatory Filing in Japan

STR of LDV/SOF Regulatory Filings
10
Filed NDA in the U.S. on February 10, 2014
– Priority review granted with PDUFA date of October 10, 2014
– Granted Breakthrough Therapy designation by FDA
– Treatment naïve and treatment experienced GT 1 patients
– +/- RBV dosed for 8 or 12 weeks of therapy
MAA fully validated by European Medicines Agency (EMA) on
March 27, 2014
– Granted accelerated review by EMA
Agreement with the Japan’s PMDA
– Positive Phase 3 results with overall response rate of 99% SVR12
in GT 1 patients
– Anticipate filing for approval in Q4 2014

Study 102 Phase 2 Study: SOF/GS-5816 in GT 1-6 HCV Treatment-Naïve
12 Study Weeks
11
SOF 400 mg QD / GS-5816 25 mg QD
(GT 3 w/o cirrhosis)
SOF 400 mg QD / GS-5816 100 mg QD
(GT 3 w/o cirrhosis)
SOF 400 mg QD / GS-5816 25 mg QD
(GT 2, 4, 5, or 6 w/o cirrhosis)
SOF 400 mg QD / GS-5816 100 mg QD
(GT 2, 4, 5, or 6 w/o cirrhosis)
SOF 400 mg QD / GS-5816 25 mg QD
(GT 1 w/o cirrhosis)
N = 77
SOF 400 mg QD / GS-5816 100 mg QD
(GT 1 w/o cirrhosis)
(N = 154)
N = 77
SVR12: 94.8% (73/77)
SVR12: 96.1% (74/77)

TAF STR Phase 3 Studies in Treatment Naïve HIV-1 Patients
Studies 104 (n=866) and 111 (n=868):
Randomized 1:1
48 weeks
48 weeks
Treatment Arm 1
Treatment Arm 2
STR TAF 10mg/EVG 150 mg/COBI 150 mg/
FTC 200 mg + placebo-to-match Stribild
Stribild + placebo-to-match STR EVG 150 mg/
COBI 150 mg/FTC200 mg/TAF 10 mg QD
Randomization stratified by:
HIV-1 RNA level (≤ 100,000 c/mL, > 100,000 to ≤400,000 c/mL or >400,000 c/mL),
CD4 count (<50 cells/µL, 50-199 cells/µ or ≥200 cells/µL) and region (US vs. Ex-US at screening).
12

TAF STR Phase 3 Studies Ongoing to Address Several Populations
13
Multiple studies could
support a broad label at
launch
Potential to replace Stribild.
Adult Switch Patients (n = 1,734)
Adults with Mild/Moderate Renal
Impairment (n = 249 Tx Naïve or Tx Exp)
Adults on Failing Treatment (n = ~100)
Adults on Complex, Multi-Pill
Regimen (n = ~170)
Adolescents (n = ~50 Tx Naïve)
EVG/COBI/FTC/TAF
STR

Significant Pipeline Milestones Anticipated in 2014
HIV
TAF
Q2 14
Q2 14
Q3 14
Initiated Phase 3 study: FTC/TAF versus FTC/TDF (Truvada)
Completed enrollment of additional Phase 3 studies for switch
and renal impairment
Top-line data from Phase 3 treatment naïve studies
Elvitegravir Q2 14
Q4 14
Resubmitted U.S. NDA
FDA approval (PDUFA October 4)
Cobicistat Q4 14 FDA approval (PDUFA October 3)
Stribild Q4 14 Complete switch studies (NNRTI and PI/r)
14

Significant Pipeline Milestones Anticipated in 2014 (Continued)
15
Liver Disease
Sofosbuvir Q3 14 Filed Japan NDA for SOF + RBV in GT 2 patients
Ledipasvir/
Sofosbuvir
Q4 14
Q4 14
Q4 14
FDA approval of STR of LDV/SOF (PDUFA October 10) in GT 1
HCV patients
EMA approval of STR of LDV/SOF in GT 1 HCV patients
Japan Regulatory submission for the STR of LDV/SOF in GT 1
patients
Sofosbuvir/
GS-5816 Q3 14 Initiate Phase 3 HCV studies
TAF Q4 14 Complete enrollment in Phase 3 HBV studies
GS-9620 Q3 14 Initiated Phase 2 study in HBV patients
Simtuzumab Q3 14
Q3 14
Complete enrollment of Phase 2 studies in NASH
Complete enrollment of Phase 2 study in PSC

16
Oncology/Inflammation
Idelalisib
Q2 14
Q3 14
Q3 14
Q4 14
Initiated Phase 3 study for Idelalisib use in frontline CLL
Received FDA approval in CLL, FL, and SLL
EMA approval in CLL and iNHL
Initiate Phase 2 study for Idelalisib use in frontline iNHL
Momelotinib
Q2 14
Q2 14
Initiated Phase 3 study in Myelofibrosis in patients previously
treated with Ruxolitinib
Initiated Phase 2 study in frontline Pancreatic Cancer
Simtuzumab Q4 14 Top-line Phase 2 data in Pancreatic and Colorectal Cancer and
Myelofibrosis
Significant Pipeline Milestones Anticipated in 2014 (Continued)
Cardiovascular
Letairis Q3 14 Top-line data from AMBITION study
GS-6615 Q3 14 Initiate Phase 2 studies in cardiovascular conditions
GS-4997 Q3 14 Initiate Phase 2 study in diabetic nephropathy

Paul Carter
July 23, 2014
EVP, Commercial Operations

HIV

$1
,37
4
$1
,39
0
$1
,64
0 $3
,36
1
$4
,52
3
$7
56
$7
50
$7
95
$9
49
$1
,23
3
$0
$1,000
$2,000
$3,000
$4,000
$5,000
$6,000
$7,000
Q2 13 Q3 13 Q4 13 Q1 14 Q2 14
(in
Mil
lio
ns
)
U.S. Europe Other International
Key Metrics
U.S.:
● Growth driven by launch of
Sovaldi
● Inventory for HIV and
cardiopulmonary products
remained at low end of the
range
● Inventory levels for Sovaldi
are within inventory
management agreement
(IMA) ranges
Europe:
● Growth driven by launch of
Sovaldi and continued
uptake of Eviplera and
Stribild
Antiviral Product Sales
19
$2,314 $2,327 $2,641
$4,508
$6,012

U.S. HIV Market Dynamics
0
200
400
600
800
1,000
1,200
1,400
HIV Infected Diagnosed On Antiretroviral
Treatment
On a Gilead HIV
Product
(Es
tim
ate
d P
ati
en
ts i
n 0
00
's)
~1,145*
~964*
~697**
~590**
Up 6%^
~84%
~72%
~85%
Sources:
* CDC estimates at the end of 2010 taken from the HIV Surveillance Supplemental Report vol. 18 no. 5.
** Ipsos Healthcare U.S. HIV Monitor Q1 2014.
^ Growth rate calculated as MAT (moving annual total).
20

Gilead U.S. STR Share in Naïve Patients
Base: All initiations within each quarter.
Source: Ipsos Healthcare HIV U.S. Scope & Monitor Q1 2014.
21
89%
70%
28%
23%19% 19%
0%
10%
20%
30%
40%
50%
60%
70%
80%
90%
100%
On a Gilead HIVProduct
Gilead STR Stribild Complera Truvada Atripla
(% o
f N
aïv
e P
ati
en
ts)
Q1 2012 Q1 2013 Q1 2014

Top Prescribed HIV Regimens
Source: Ipsos Healthcare HIV U.S. Therapy Monitor Q1 2014.
22
Rank Naïve All Patients
1 Stribild Atripla
2 Complera Complera
3 Atripla Stribild
4 Truvada + other 3rd
Agent
Truvada + other 3rd
Agent
5 Other NRTI + other 3rd
Agent
Truvada + other 3rd
Agent
Single tablet regimens
U.S. Europe Big-5
Rank Naïve All Patients
1 Eviplera Atripla
2 Atripla Eviplera
3 Truvada + other 3rd
Agent
Truvada + other 3rd
Agent
4 Stribild Truvada + other 3rd
Agent
5 Truvada + other 3rd
Agent
Truvada + other 3rd
Agent
EU Naïve Source: Ipsos Healthcare HIV EU Scope Q1 2014.
EU All Patient Source: Ipsos Healthcare HIV EU Monitor Q1 2014.

$9
7
$1
35
$1
86
$1
87
$2
29
$0
$50
$100
$150
$200
$250
$300
Q2 13 Q3 13 Q4 13 Q1 14 Q2 14
(In
Millio
ns)
U.S. Europe Other International
Key Metrics*
U.S.:
● Captured 28% of naïve
HIV patient share
● Third most prescribed
HIV regimen across all
treated patients
Europe:
● Captured 5.5% of naïve
HIV patient share in Big-5
● Launched in Big-5 as well
as seventeen additional
countries
*Sources:
U.S. data from Ipsos Healthcare HIV U.S. Therapy Monitor
Q1 2014.
EU data from Ipsos Healthcare HIV EU Scope Q1 2014.
Note: Stribild is indicated for the treatment of HIV-1
infection in antiretroviral treatment naïve patients.
23
$99
Stribild Product Sales
$144
$204 $215
$270

$1
20
$1
27
$1
53
$1
30
$1
54
$5
9 $7
4
$9
5
$1
09
$1
32
$0
$50
$100
$150
$200
$250
$300
$350
Q2 13 Q3 13 Q4 13 Q1 14 Q2 14
(In
Millio
ns)
U.S. Europe Other International
Key Metrics*
U.S.:
● Captured 23% of naïve
HIV patient share
● Number two most
prescribed HIV regimen
across all patients
Europe:
● Captured 25% of naïve
HIV patient share in Big-5
● Preferred status in Big-5
● Most switched to HIV
regimen in Big-5
*Sources:
U.S. data from Ipsos Healthcare HIV U.S. Therapy Monitor
Q1 2014.
EU data from Ipsos Healthcare HIV EU Scope Q1 2014.
Complera/Eviplera Product Sales
24
$211
$189
$262 $251
$299

25
Source: IMS Monthly LRx Data (Aug 2011 to May 2014), data is subject to restatement.
Note: Stribild and Complera are indicated for the treatment of HIV-1 infection in antiretroviral treatment naïve patients. Stribild and Complera are not indicated for use in
treatment-experienced patients and are not promoted to such patients.
Naïve, 42%
Switch Atripla,
15%Switch
Complera, 5%
Switch Other, 9%
Switch PI, 22%
Switch Integrase Inhibitor,
7%
Stribild(Aug 2012 – May 2014)
Naïve, 40%
Switch Atripla,
25%
Switch Other, 12%
Switch PI, 19%
Switch Integrase Inhibitor,
4%
Complera(Aug 2011 – May 2013)
U.S. Stribild and Complera Source of Patients (21 months post-launch)

$6
11
$5
76
$6
15
$4
90
$5
78
$2
71
$2
57
$2
56
$2
37 $
23
4$0
$250
$500
$750
$1,000
$1,250
Q2 13 Q3 13 Q4 13 Q1 14 Q2 14
(In
Millio
ns)
U.S. Europe Other International
Atripla Product Sales
Key Metrics*
U.S.:
● Most prescribed HIV
regimen with 28% of all
treated patients
● Captured 19% of naïve
HIV patient share
Europe:
● Most prescribed HIV
regimen with 20% of all
treated patients
● Captured 18% of naïve
HIV patient share**
*Sources:
U.S. data from Ipsos Healthcare HIV U.S. Therapy Monitor
Q1 2014.
EU data from Ipsos Healthcare HIV EU Therapy Monitor Q1
2014 & Ipsos Healthcare HIV EU Scope Q1 2014.
**Note: In the EU Atripla does not have an indication for the
treatment of naïve patients and there is no Atripla
promotion concerning treatment naïve patients. Note: Efavirenz (the active pharmaceutical component in Atripla purchased
from Bristol-Myers Squibb) accounted for approximately 37% of Atripla sales
in Q2 2014 which represented $318 million to be paid to BMS.
26
$938 $900
$934
$780
$871

$4
16
$4
30
$4
17
$3
68
$4
00
$3
25
$3
14
$3
25
$3
23
$3
38
$0
$250
$500
$750
$1,000
Q2 13 Q3 13 Q4 13 Q1 14 Q2 14
(In
Millio
ns)
U.S. Europe Other International
Key Metrics*
U.S.:
● Captured 30% of all
treated HIV patients
● Captured 19% of naïve
HIV patient share
Europe:
● Most prescribed HIV
product with 34% of all
treated patients
● Captured 33% of naïve
HIV patient share
*Sources:
U.S. data from Ipsos Healthcare HIV U.S. Therapy Monitor
Q1 2014.
EU data from Ipsos Healthcare HIV EU Therapy Monitor.
Q1 2014 & Ipsos Healthcare HIV EU Scope Q1 2014.
27
$808
Truvada Product Sales
$814 $814
$760
$807

HCV

U.S.
─ ~70,000 patients initiated treatment since launch
(through June 30, 2014)
─ Q2 2014 sales of $3.0 billion
o ~65% of usage in GT 1
o Predominately with SMV (COSMOS) or PegIFN +
RBV
European Commission approval January 17, 2014
─ ~10,000 patients initiated treatment since launch
(through June 30, 2014)
─ Q2 2014 sales of $400 million
o Sales predominately in France and Germany
─ Pricing and reimbursement discussions throughout the
year
─ Positive health technology assessments received in
France, Germany, and Scotland
29
Sovaldi: A New Treatment for Patients Infected with HCV
®

Cost of HCV Therapy (GT 1 in U.S.)
$97,095 $96,890 $94,245
Sovaldi Regimen
– Provides higher cure
rates
– Shorter treatment
duration
– Better tolerated
SMV/PegIFN/R*
TVR/PegIFN/R*
SOF/PegIFN/R
*Represents blended 36 weeks
Cost of Regimen
30

U.S. HCV Market Dynamics
0
500
1,000
1,500
2,000
2,500
3,000
3,500
4,000
4,500
Prevalence Diagnosed Under Treater Care Treated
(Es
tim
ate
d P
ati
en
ts i
n 0
00
's)
4.1M
1.7M
64
~41%
~16%
31
393 ~23%
Sources: Chak et al 2008, Armstrong et al 2005, Volk et al 2011, Culver et al 2000, Decision resources: 2008, CDA AASLD 2012,
NHANES 2012, Ipsos Monitor Q1 2014 and Gilead estimates.
Note: Data is applicable to the 12 month period beginning April 2013 through March 2014.

0.8M
210
440
500
1,000
1,500
2,000
2,500
3,000
Prevalence Diagnosed Under Treater Care Treated
(Es
tim
ate
d P
ati
en
ts in
‘0
00
s)
2.6M
Europe Big-5 HCV Market Dynamics
~31%
~26% ~21%
Source: Gilead estimates.
32 Note: Data is pre-European Union approval, January 17, 2014.

Japan HCV Market Dynamics
0
200
400
600
800
1,000
1,200
Prevalence Diagnosed Treated
(Es
tim
ate
d P
ati
en
ts i
n 0
00
's)
1.1M
745
37
~68%
~5%
33
Source: Ipsos HCV Monitor Q212 and Gilead estimates.

Sovaldi Patient Support Path Program
34

Robin Washington
July 23, 2014
EVP and Chief Financial Officer

$2,767 $2,783$3,120
$4,999
$6,535
$0
$1,000
$2,000
$3,000
$4,000
$5,000
$6,000
$7,000
Q2 13 Q3 13 Q4 13 Q1 14 Q2 14
(In
Mil
lio
ns
)
Total Revenues
36

$0.50 $0.52 $0.55
$1.48
$2.36
$0.00
$0.50
$1.00
$1.50
$2.00
$2.50
Q2 13 Q3 13 Q4 13 Q1 14 Q2 14
Non-GAAP Diluted EPS
37
Note: Non-GAAP diluted EPS excludes acquisition-related,
restructuring and stock-based compensation expenses.

$488 $489$511
$558$542
$0
$100
$200
$300
$400
$500
$600
Q2 13 Q3 13 Q4 13 Q1 14 Q2 14
(In
Mil
lio
ns
)
Non-GAAP R&D Expenses
Note: Non-GAAP R&D expenses exclude acquisition-related,
restructuring and stock-based compensation expenses.
Key Metrics
● Higher R&D expenses in
Q2 2014 over Q2 2013
driven primarily by:
- Progression of clinical
studies in HIV and
Oncology
- Expenses to support
geographic expansion,
marketed products and
infrastructure related to
R&D activities
38

$376 $377
$471$500
$569
$0
$100
$200
$300
$400
$500
$600
Q2 13 Q3 13 Q4 13 Q1 14 Q2 14
(In
Millio
ns)
Key Metrics
● Higher SG&A expenses in
Q2 2014 over Q2 2013
driven primarily by:
- Support the expansion of
the business, particularly
in HCV and anticipated
launch of idelalisib
• Pharmaceutical excise tax
for 2014 is estimated
between $150 - $170
million*
Non-GAAP SG&A Expenses
39
Note: Non-GAAP SG&A expenses exclude acquisition-related,
restructuring and stock-based compensation expenses.
*The 2014 pharmaceutical excise tax is based on 2013 sales.

Non-GAAP Effective Tax Rate*
Q2
2013**
Q4
2013**
Q1
2014
Q2
2014
Effective Tax Rate 28.3% 27.5% 23.2% 14.6%
Cumulative Adjustment to Q1 14
Tax Rate to reflect higher HCV sales
projections
3.6%
Year to date 2014 Effective Tax Rate 18.2%
40
*The Non-GAAP Effective Tax Rate excludes the impact of acquisition-related and restructuring expenses.
**The 2013 tax rates include the federal research tax credit which expired on December 31, 2013.

$953$753 $727
$1,568
$4,185
$0
$500
$1,000
$1,500
$2,000
$2,500
$3,000
$3,500
$4,000
$4,500
Q2 13 Q3 13 Q4 13 Q1 14 Q2 14
(In
Millio
ns)
Operating Cash Flows
41
Key Metrics
● Higher Operating Cash
Flow in Q2 2014 driven
primarily by:
- Collections related to the
Sovaldi sales ramp in Q1
2014 and growth in
current quarter Sovaldi
sales*
*As we continue to launch Sovaldi ex-U.S., particularly in Southern Europe, we expect DSO to increase.

Type of
Repurchase
Dollar
Amount* (In Millions)
Shares
Repurchased
Average
Purchase Price
Q1 2014 Open Market $450.0 5,743,223 $78.35
Q2 2014 Open Market $1,200.0 15,176,020 $79.07
YTD 2014 $1,650.0 20,919,243 $78.87
As of June 30, 2014, we had $1.7 billion remaining on our $5.0 billion authorization from January 2011, which we plan to
use in the third quarter 2014, prior to its expiration in September 2014. An additional $5.0 billion share repurchase
program was authorized in May 2014. During the period from January 2010 through June 2014, ~53% of free cash flow
was utilized to purchase and retire ~21% of shares outstanding.
42
2014 Share Repurchase Activity
*Excludes commissions.

43
Initially provided 2/4/14;
Reiterated on 4/22/14 Updated on 7/23/2014
Net Product Sales $ 11,300 – $ 11,500 $ 21,000 – $ 23,000
Non-GAAP**
Product Gross Margin 75% – 77% 85% – 88%
R&D Expenses $ 2,200 – $ 2,300 $ 2,300 – $ 2,400
SG&A Expenses $ 2,100 – $ 2,200 $ 2,300 – $ 2,400
Effective Tax Rate 28% – 29% 17.5% – 20.5%
Diluted EPS Impact of Acquisition-
Related and Stock-Based
Compensation Expenses
$ 0.63 – $ 0.66 $ 0.63 – $ 0.66
*This guidance is subject to a number of uncertainties, including, but not limited to, the assumption the LDV/SOF STR (STR) will be
approved on the PDUFA date, the level and speed of market acceptance of the STR, the pricing and rate of reimbursement for the STR, the
amount of patient warehousing prior to approval, the rate of decrease in wholesaler inventories of Sovaldi as more patients are prescribed
the STR and the launch timing and market acceptance of competitive drugs.
**Non-GAAP product gross margin, expense and effective tax rate exclude the impact of acquisition-related, restructuring and stock-based
compensation expenses where applicable.
Excludes the impact
of HCV Product Sales
Full Year 2014 Guidance (in millions, except percentages and per share amounts)
All Products*

Projected product gross margin GAAP to non-GAAP reconciliation:
GAAP projected product gross margin
Acquisition related-expenses
Non-GAAP projected product gross margin*
Projected research and development expenses GAAP to non-GAAP reconciliation:
GAAP projected research and development expenses
Acquisition related-expenses
Stock-based compensation expenses
Non-GAAP projected research and development expenses
Projected selling, general and administrative expenses GAAP to non-GAAP
reconciliation:
GAAP projected selling, general and administrative expenses
Acquisition related-expenses
Stock-based compensation expenses
Non-GAAP projected selling, general and administrative expenses
Projected diluted EPS impact of acquisition-related and stock-based compensation
expenses:
Acquisition related-expenses
Stock-based compensation expenses
Projected diluted EPS impact of acquisition-related and stock-based compensation expenses
Updated on 7/23/14
(in millions, except percentages and per share amounts)
Full Year 2014 Guidance
82% - 84%
3% - 4%
85% - 88%
$2,477 - $2,589
(1) - (1)
(176) - (188)
$2,300 - $2,400
$0.49 - $0.51
0.14 - 0.15
$0.63 - $0.66
$2,467 - $2,611
(36) - (69)
(131) - (142)
$2,300 - $2,400
*Stock-based compensation expenses have a less than one percent impact on non-GAAP projected product gross margin.
44

Financial Appendix Slides
July 23, 2014

Financial Highlights: Q2 2014 (in millions, except percentages and per share amounts)
*Other Products comprised primarily of Cayston and Lexiscan.
**Non-GAAP costs and expenses, net income and diluted EPS exclude the impact of acquisition-related, restructuring and stock-based
compensation expenses where applicable.
Note: Amounts may not sum due to rounding. 46
Q2 2014 Q2 2013 % Change
Net Product Revenues $6,413 $2,657 141%
Sovaldi 3,480 NA NM
Antiviral products excluding Sovaldi 2,532 2,314 9%
Antiviral products 6,012 2,314 160%
Letairis, Ranexa, AmBisome and Other Products* 401 344 17%
Non-GAAP Costs and Expenses** $1,834 $1,525 20%
COGS 723 661 9%
Product Gross Margin 89% 75%
R&D 542 488 11%
SG&A 569 376 51%
Operating Margin 72% 45%
Non-GAAP Net Income** $3,930 $840 368%
Non-GAAP Diluted EPS** $2.36 $0.50 376%

Financial Highlights: 1H 2014 (in millions, except percentages and per share amounts)
47
YTD 2014 YTD 2013 % Change
Net Product Revenues $11,284 $5,051 123%
Sovaldi 5,755 NA NM
Antiviral products excluding Sovaldi 4,766 4,375 9%
Antiviral products 10,521 4,375 140%
Letairis, Ranexa, AmBisome and Other Products* 763 676 13%
Non-GAAP Costs and Expenses** $3,503 $2,929 20%
COGS 1,334 1,272 5%
Product Gross Margin 88% 75%
R&D 1,100 948 16%
SG&A 1,069 709 51%
Operating Margin 70% 45%
Non-GAAP Net Income** $6,417 $1,642 291%
Non-GAAP Diluted EPS** $3.84 $0.98 293%
*Other Products comprised primarily of Cayston and Lexiscan.
**Non-GAAP costs and expenses, net income and diluted EPS exclude the impact of acquisition-related, restructuring and stock-based
compensation expenses where applicable.
Note: Amounts may not sum due to rounding.

$2,657 $2,710$3,043
$4,871
$6,413
$0
$1,000
$2,000
$3,000
$4,000
$5,000
$6,000
$7,000
Q2 13 Q3 13 Q4 13 Q1 14 Q2 14
(In
Millio
ns)
Total Product Sales
48

Q2 2013 Q3 2013 Q4 2013 Q1 2014 Q2 2014
%
Change
from
Q2 2013
Sovaldi NA NA $139.4 $2,274.3 $3,480.3 NM
Viread $250.2 $231.6 $266.9 $210.6 $260.7 4%
Letairis $128.3 $135.1 $138.5 $122.9 $144.7 13%
Ranexa $106.6 $115.8 $129.9 $111.6 $122.0 14%
AmBisome $75.1 $97.8 $93.6 $92.1 $94.8 26%
Other Products* $33.8 $34.2 $40.0 $35.9 $39.3 16%
49
Other Product Sales (in millions)
*Other Products comprised primarily of Cayston and Lexiscan.

Q2 2014: $6,413
50
Note: Amounts may not sum due to rounding.
Europe: $1,307
(20% of Total)
(60% YoY Growth)
U.S.: $4,821
(75% of Total)
(195% YoY Growth)
Other International: $285
(4% of Total)
(41% YoY Growth)
Product Sales by Geography (in millions, except percentages)

FX impact to European revenues was favorable $15 million
QoQ and favorable $45 million YoY
FX impact to international revenues (including ROW) was
favorable $13 million QoQ and favorable $38 million YoY
FX impact to pre-tax income was favorable $6 million QoQ
and unfavorable $21 million YoY
European Total Product Sales increased 54% Year-over-Year Excluding FX
51
$818 $824 $871
$1,020
$1,307
$0
$200
$400
$600
$800
$1,000
$1,200
$1,400
Q2'13 Q3'13 Q4'13 Q1'14 Q2'14
in M
illio
ns
Note: Amounts may not sum due to rounding.
Q2'14 Q2'13 YoY Excl FX
Atripla $234 $271 (13%) (17%)
Eviplera $132 $59 123% 115%
Stribild $31 $2 NM NM
Truvada $338 $325 4% 0%
Viread $88 $88 (1%) (3%)
Sovaldi $400 $0 NM NM
LDV/SOF $0 $0 NM NM
AmBisome $64 $55 16% 14%
Other $19 $18 4% 0%
Total $1,307 $818 60% 54%

$53
$7 $9
$52 $58
$57
$66 $68
$76 $64
$0
$25
$50
$75
$100
$125
$150
Q2 13 Q3 13 Q4 13 Q1 14 Q2 14
(In
Mil
lio
ns
)
Tamiflu Other
Total Royalty, Contract and Other Revenues
52
$110
$73 $77
$128 $122

75.1% 75.7% 74.5%
87.4% 88.7%
0%
25%
50%
75%
100%
Q2 13 Q3 13 Q4 13 Q1 14 Q2 14
Non-GAAP Product Gross Margins
Note: Non-GAAP product gross margins exclude acquisition-
related and stock-based compensation expenses.
53
Key Metrics
● Higher Non-GAAP
Product Gross Margins
Q2 2014 over Q2 2013
driven primarily by
Sovaldi sales and
favorable HIV mix

44.9% 45.2% 43.6%
66.6%
71.9%
0%
25%
50%
75%
Q2 13 Q3 13 Q4 13 Q1 14 Q2 14
Non-GAAP Operating Margins
Note: Non-GAAP operating margins exclude acquisition-related,
restructuring and stock-based compensation expenses.
54
Key Metrics
● Higher Non-GAAP
Operating Margins in
Q2 2014 over Q2 2013
driven primarily by:
- Higher gross margin from
Sovaldi sales
- Slower operating expense
growth than revenue
growth

GAAP to Non-GAAP
Diluted Earnings Per Share Reconciliation
Q2 2014
GAAP Diluted EPS $2.20
Acquisition-Related Expenses $0.12
Stock-Based Compensation
Expenses $0.04
Non-GAAP Diluted EPS $2.36
Note: Amounts may not sum due to rounding.
55

2014
Notes
2016
Notes
Total
Dilution*
Average share price
Q2 2014 $77.84; YTD 2014 $78.13
Convertible Notes** (Current Outstanding)
$0M $858M
Conversion Price $22.54 $22.71
Q2 2014 Share Dilution 2.2M 29.1M 31.3M
YTD Share Dilution 4.6M 30.5M 35.1M
Warrants
Warrant Exercise Price $28.38 $30.05
Q2 2014 Share Dilution 35.2M 33.8M 69.0M
YTD Share Dilution 35.3M 33.9M 69.2M
Total Q2 2014 Dilution from
Convertible Notes and Warrants*** 100.3M
*May not sum/recalculate due to rounding
**At issuance, the amount outstanding on the 2014 and 2016 convertible notes was $1.25B each. The remaining 2014 convertible notes were repaid in May.
***Represents 6% of diluted non-GAAP shares outstanding. In the third quarter 2014, the warrants (55.5 million shares) related to the May 2014 convertible
debt will expire. We have the ability to settle the warrants in cash or shares. If we settle in cash, we will utilize approximately $3.1 billion to $3.7 billion of our
current U.S. cash balance.
56
Dilution from Outstanding Convertible Notes

Other Selected Financial Information (in millions, except days sales outstanding)
Mar. 31,
2014
Jun. 30,
2014
Cash, Cash Equivalents & Marketable Securities $6,858.9 $9,581.4
Interest Expense and
Other Income (Expense), net ($94.2) ($105.6)
Inventories $2,140.2 $2,068.8
Days Sales Outstanding* (Accounts Receivable) 51 42
Share Repurchases During the Quarter** $450.0 $1,200.0
Diluted Shares Used in Per Share Calculation for the Quarter
(Non-GAAP) 1,679.0 1,663.5
Diluted Shares Used in Per Share Calculation for the Quarter
(GAAP) 1,679.9 1,664.4
Basic Shares Outstanding 1,537.6 1,526.0
57
*With the launch of Sovaldi in the U.S., DSO is historically low. As we continue to launch Sovaldi ex-U.S., particularly in Southern Europe,
we expect DSO to increase.
**Excludes commissions.

Q2 2014 Earnings Results
July 23, 2014
Conference Call and Webcast