Embed Size (px)
Citation preview

Robust Optimal Interval Design with an Application toDose Finding in Drug-Combination Trials
Ruitao Lin1 and Guosheng Yin1,2
1Department of Statistics & Actuarial ScienceThe University of Hong Kong2Department of Biostatistics
University of Texas M.D. Anderson Cancer Center
SCT 36th Annual MeetingMay 18, 2015

Robust Optimal Interval (ROIN) Design Simulation Study Take-Home Messages References
Outline
1 Robust Optimal Interval (ROIN) DesignDose Finding in Phase I Clinical TrialsROIN Design for Single-Agent TrialsROIN Design for Drug-Combination Trials
2 Simulation Study
3 Take-Home Messages
4 References
1 / 48

Robust Optimal Interval (ROIN) Design Simulation Study Take-Home Messages References
Outline
1 Robust Optimal Interval (ROIN) DesignDose Finding in Phase I Clinical TrialsROIN Design for Single-Agent TrialsROIN Design for Drug-Combination Trials
2 Simulation Study
3 Take-Home Messages
4 References
2 / 48

Robust Optimal Interval (ROIN) Design Simulation Study Take-Home Messages References
Dosing Combinations of Neratinib and Temsirolimus
Preclinical studies have shown that neratinib alone is insufficient.With the addition of temsirolimus, the combined therapy wouldresult in synergistic tumor growth inhibition and regression.Enrolled 60 patients with advanced solid tumors to dose combinationsof neratinib and temsirolimus (Gandhi et al., 2014, JCO).
15/5/16 ��10:36Two-dimensional phase I study of neratinib (NER) combined with temsirolimus (TEM) in patients (Pts) with solid tumors. | 2011 ASCO Annual Meeting | Virtual Meeting | Meeting Library
� 2 ��� 4 ��http://meetinglibrary.asco.org/content/63052?format=posterImg&poster=1
3 / 48

Robust Optimal Interval (ROIN) Design Simulation Study Take-Home Messages References
Dosing Combinations of Neratinib and Temsirolimus
Preclinical studies have shown that neratinib alone is insufficient.With the addition of temsirolimus, the combined therapy wouldresult in synergistic tumor growth inhibition and regression.Enrolled 60 patients with advanced solid tumors to dose combinationsof neratinib and temsirolimus (Gandhi et al., 2014, JCO).Primary objective:
Estimate the toxicity contour of the combination;&
Establish recommended phase II doses, i.e., MTD.
r
4 / 48

Robust Optimal Interval (ROIN) Design Simulation Study Take-Home Messages References
Dosing Combinations of Neratinib and Temsirolimus
Four doses of neratinib: {120,160,200,240}mg andFour doses of temsirolimus: {15,25,50,75}mg.Dose assignment was determined by a modified up-and-down rule.
trastuzumab before study entry. Most patients were heavily pre-treated, with 68% of patients having received three or more priortherapies for metastatic disease.
SafetyAll 60 patients had at least one dose of study drug(s) and were
evaluable for safety. The primary drug-related toxicity was diarrheawith an overall rate of 93%, encompassing all grades. Grade 3 or higherdrug-related diarrhea occurred in 22% of patients and seemed to bedose-dependent for neratinib. Hypophosphatemia seemed to bedose-dependent for temsirolimus and occurred in 30% of patientsoverall and was ! grade 3 in 15%. Other common drug-relatedtoxicities included nausea (53%) and vomiting (42%), all but one ofwhich were grade 1 to 2; stomatitis (53%) or mucosal inflammation(32%, with 5% ! grade 3); cytopenias (! grade 3 toxicity rates were8% for anemia, 18% for lymphopenia, 5% for neutropenia, and 7%for thrombocytopenia); hypokalemia (30%, with 5% ! grade 3); andrash (38%, all grade 1 to 2). Table 2 shows the grade 3 and higher AEsoccurring in each dose cohort. A complete listing of drug-related AEsby neratinib and temsirolimus dose is shown in Appendix Tables A1and A2, online only.
MTD DeterminationThe most frequent DLT observed was diarrhea (four of 10 pa-
tients with DLT), with mucositis and neutropenia DLTs occurring intwo patients each. Other dose-limiting events included anorexia, ele-
vated prothrombin time/international normalized ratio, hypophos-phatemia/hypokalemia, and elevated creatine phosphokinase inisolated patients. A high-neratinib MTD (200 mg neratinib/25 mgtemsirolimus) and high-temsirolimus MTD (160 mg/50 mg) werechosen based on the smoothed contour DLT rate as shown in Figure 1.Notably, one patient experienced a DLT of grade 4 creatine phospho-kinase elevation with clinical concern for rhabdomyolysis in the 200mg/25 mg cohort; this was the only patient who required a dosereduction (to 160 mg/15 mg) of the eight patients treated at that doselevel. In contrast, despite the absence of DLTs in the 160 mg/50 mgcohort, four of seven patients required a dose reduction to 160 mg/25mg for a variety of AEs. Overall, 43 patients (71.7%) required doseinterruption, and 18 (30%) required dose reductions of one or bothagents because of AEs (Appendix Tables A3 and A4, online only).
Patient DispositionSafety data were updated as of September 27, 2011. At that time,
two patients remained on treatment (Appendix Fig A1, online only).Disease progression was the most common reason for discontinua-tion (n ! 38, 63%), followed by AEs (n ! 9, 15%). Of those whodiscontinued treatment because of an AE, two discontinued becauseof pneumonitis, and one patient each discontinued because of ventric-ular hypokinesia, elevated creatinine and pyleonephritis, and fatigue.The remaining patients had unconfirmed AEs leading to study discon-tinuation, including dyspnea in the setting of clinical deterioration,proctitis, anemia and thrombocytopenia, and diarrhea. Eight patients
50%(4 patients, 2 DLTs:
grade 3 diarrhea and grade 3hypokalemia/hypophosphatemia
due to chronic diarrhea
12%(4 patients, 0 DLTs)
12%(4 patients, 1 DLT:grade 3 mucositis)
0(2 patients, 0 DLTs)
0(4 patients, 0 DLTs)
11%
12%(4 patients, 1 DLT:grade 3 anorexia)
13%8 patients, 1 DLT:
grade 4 elevated CPK)Confirmed MTD
(neratinib high dose)
12%(5 patients, 0 DLTs )
Confirmed MTD(temsirolimus high dose)
11%(4 patients, 0 DLTs)†
50%(2 patients*, 1 DLT:
grade 3 neutropenia)
50%6 patients, 3 DLTs:
grade 3 diarrhea, grade 3 neutropenia, and grade 3
elevated INR and diarrhea)
Ner
atin
ib (m
g)
Temsirolimus (mg)
240
200
160
120
57055251
(5 patients, 1 DLT:grade 3 mucositis)
Fig 1. Study design for dose-escalation cohorts and DLT rate (as calculated by smoothed toxicity contour). (*) Two patients were evaluated; the non-DLT patient wasreported with 22 neratinib doses and was counted as DLT evaluable, despite only 15 doses captured in the database. (†) Although no DLTs were observed in the firsttwo patients enrolled, as a result of an early discontinuation because of treatment-related toxicity, two additional patients were enrolled at this dose level to confirmsafety/tolerability. The red and blue dose cohorts represent the high-neratinib and high-temsirolimus MTDs defined, respectively. Gray cohorts are those with a DLTrate in excess of MTD. DLT data cutoff was May 2, 2011. CPK, creatine phosphokinase; DLT, dose-limiting toxicity; INR, international normalized ratio; MTD,maximum-tolerated dose.
Combined Neratinib and Temsirolimus in Solid Tumors
www.jco.org © 2013 by American Society of Clinical Oncology 71
27, 2014 from 147.8.204.164Information downloaded from jco.ascopubs.org and provided by at UNIVERSITY OF HONG KONG LIBRARIES on March
Copyright © 2014 American Society of Clinical Oncology. All rights reserved.
5 / 48

Robust Optimal Interval (ROIN) Design Simulation Study Take-Home Messages References
Existing Dual-Agent Phase I Trial Designs
Algorithm-based methodsTraditional “3+3” method: selectively choose some dose combinationsIvanova and Wang (2004): up and down designHuang et al. (2007): two-agent “3+3” designFan et al. (2009): three-stage “2+1+3” design
Model-based methodsThall et al. (2003): six-parameter joint toxicity rate modelYin and Yuan (2009) and Yin and Lin (2014): link the marginaltoxicity rates by a copula-type functionBraun and Wang (2010): Bayesian hierarchical modelWages et al. (2011): partial ordering CRM by laying out somepossible simple orders for the joint toxicity rates.Lin and Yin (2015): apply ensemble (machine learning) techniques(Bagging) to CRM.
6 / 48

Robust Optimal Interval (ROIN) Design Simulation Study Take-Home Messages References
Concerns on Algorithm-Based Methods
True MTD may be excludedAd-hoc rules, not applicable for different target toxicity ratesNo theoretical support and slow convergence
20 40 60 80 100 120 14030
40
50
60
70
80
90
UD
UDT
POCRM
CLAYTON
GUMBEL
LOGLINEAR
7 / 48

Robust Optimal Interval (ROIN) Design Simulation Study Take-Home Messages References
Concerns on Model-Based Methods
Large parameter space, and unstable estimationTwo-stage with a start-up rule required to ensure stable estimates atthe beginning.The performance heavily depends on the model assumptionOnly 1.6% of the phase I cancer trials (20 of 1235) publishedbetween 1991 and 2006 used model-based designs (Rogatko et al.,2007).
8 / 48

Robust Optimal Interval (ROIN) Design Simulation Study Take-Home Messages References
Comparisons of Existing Methods
Riviere et al. (2014, SIM) compared six existing methods for drugcombination trials.
The result in the last column is based on Wages (2015) and Lin and Yin (2015).
9 / 48

Robust Optimal Interval (ROIN) Design Simulation Study Take-Home Messages References
Goal: To propose a dual-agent phase I trial design
Easy to understand and implement for both clinicians andstatisticians.Have nice finite- and large-sample properties:
Overcome the drawback of the existing algorithm-based methods.Be comparable with the model-based methods.
40
50
60
70
80
90
Number of patients
% M
TD
se
lect
ion
s
40 60 80 100 120
UD
UDT
CALYTON
POCRM
BCRM
RW−ROIN
PC−ROIN
10 / 48

Robust Optimal Interval (ROIN) Design Simulation Study Take-Home Messages References
Outline
1 Robust Optimal Interval (ROIN) DesignDose Finding in Phase I Clinical TrialsROIN Design for Single-Agent TrialsROIN Design for Drug-Combination Trials
2 Simulation Study
3 Take-Home Messages
4 References
11 / 48

Robust Optimal Interval (ROIN) Design Simulation Study Take-Home Messages References
Single-Agent Dose Finding
Let f is the target toxicity rate, say f = 0.3.At the current dose level j, assume that a total of nj patients have beentreated, and yj of them have experienced toxicity.
12 / 48

Robust Optimal Interval (ROIN) Design Simulation Study Take-Home Messages References
Single-Agent Interval Design
Let p̂j = yj/nj denote the estimated toxicity rate at dose level j.Use lL(nj) and lU(nj) to denote the prespecified lower and upperboundaries of the interval.
If p̂j lL(nj), we escalate the dose level to j+1;If p̂j > lU(nj), we de-escalate the dose level to j�1;Otherwise if lL(nj)< p̂j < lU(nj), we retain the same dose level j.
13 / 48

Robust Optimal Interval (ROIN) Design Simulation Study Take-Home Messages References
Equivalent Representation
Since p̂j = yj/nj, we consider
DL(nj) = nj ⇥lL(nj), DU(nj) = nj ⇥lU(nj),
where DL(nj) and DU(nj) denote the prespecified toxicity lower andupper boundaries.
If yj DL(nj), we escalate the dose level to j+1;If yj � DU(nj), we de-escalate the dose level to j�1;Otherwise if DL(nj)< yj < DU(nj), we retain the same dose level j.
14 / 48

Robust Optimal Interval (ROIN) Design Simulation Study Take-Home Messages References
Hypotheses
To avoid arbitrary prespecifications of DL(nj) and DU(nj),weconsider a hypothesis setting with a single target rate parameter,
H0j : pj = f , H1j : pj < f , H2j : pj > f ,
wheref is the target rate.H0j, H1j and H2j indicate that the current dose level is the MTD,below and above the MTD, respectively.
15 / 48
Robust Optimal Interval (ROIN) Design Simulation Study Take-Home Messages References
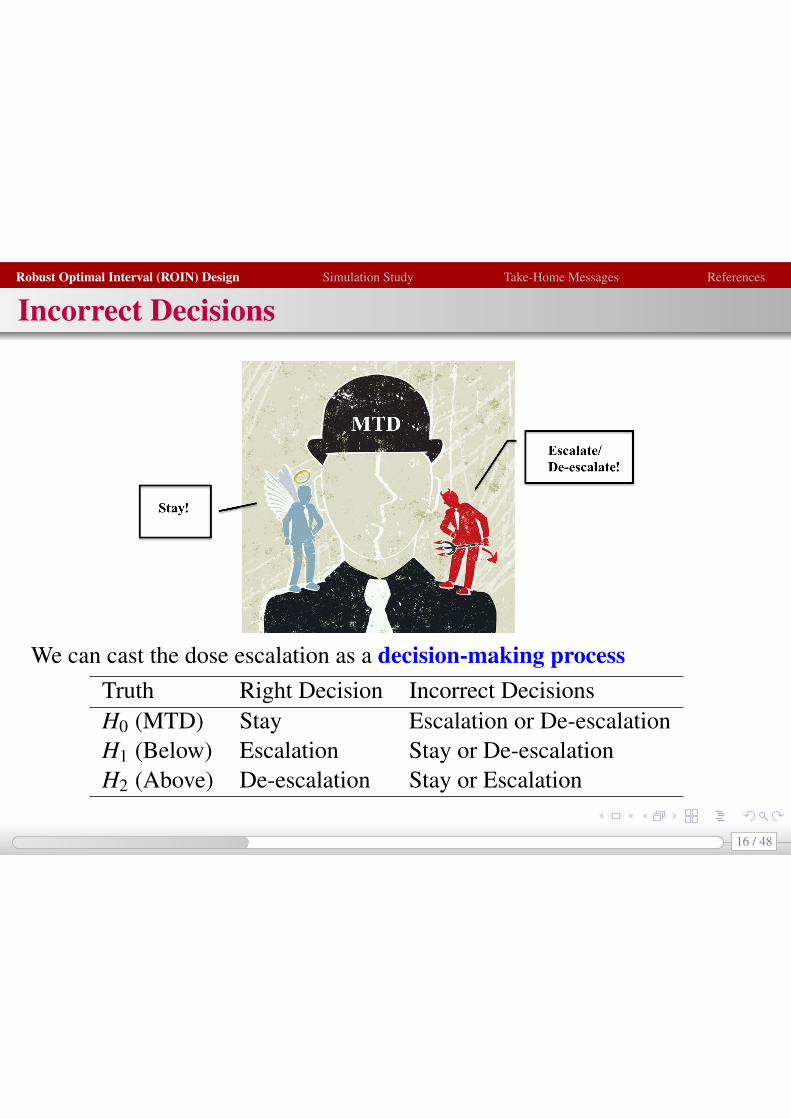
Incorrect Decisions
We can cast the dose escalation as a decision-making processTruth Right Decision Incorrect DecisionsH0 (MTD) Stay Escalation or De-escalationH1 (Below) Escalation Stay or De-escalationH2 (Above) De-escalation Stay or Escalation
16 / 48

Robust Optimal Interval (ROIN) Design Simulation Study Take-Home Messages References
Incorrect Decisions
The probability of incorrect decisions can be formulated as
Pr(Incorrect Decisions | yj) = p0j Pr(E or D|H0j)
+p1j Pr(S or D|H1j)+p2j Pr(S or E|H2j)
= p0j Pr(yj DL(nj) or yj � DU(nj)|H0j)
+p1j Pr(yj > DL(nj)|H1j)
+p2j Pr(yj < DU(nj)|H2j),
where E, D and S stand for “Escalation” ,“De-escalation" and “Stay" respectively, pkjis the posterior probability that Hk is true.
17 / 48

Robust Optimal Interval (ROIN) Design Simulation Study Take-Home Messages References
Optimal Interval Boundaries
By minimizing the posterior probability of incorrect decisions, wecan obtain the optimal values for DL(nj) and DU(nj) as
DL(nj) = max
(m :
f m(1�f)nj�m
R f0 pm(1�p)nj�mf (p | H1j)dp
1
),
DU(nj) = max
(m :
R 1f pm(1�p)nj�mf (p | H2j)dp
f m(1�f)nj�m 1
),
wherepj|H1j ⇠ Unif(0,f), pj|H2j ⇠ Unif(f ,1).
You can obtain the boundaries at the design stage of a trial!
18 / 48

Robust Optimal Interval (ROIN) Design Simulation Study Take-Home Messages References
Optimal Interval Boundaries
By minimizing the posterior probability of incorrect decisions, wecan obtain the optimal values for DL(nj) and DU(nj) as
DL(nj) = max
(m :
f m(1�f)nj�m
R f0 pm(1�p)nj�mf (p | H1j)dp
1
),
DU(nj) = max
(m :
R 1f pm(1�p)nj�mf (p | H2j)dp
f m(1�f)nj�m 1
),
wherepj|H1j ⇠ Unif(0,f), pj|H2j ⇠ Unif(f ,1).
You can obtain the boundaries at the design stage of a trial!
19 / 48

Robust Optimal Interval (ROIN) Design Simulation Study Take-Home Messages References
Illustration
Suppose the target toxicity rate f = 0.3, and 3 patients in a cohortsize. Then the interval boundaries for the number of DLTs in therobust optimal interval design are given below.
n 3 6 9 12 15 18 21 24 27 30 · · ·DL(n) 0 1 1 2 2 3 4 4 5 6 · · ·DU(n) 2 4 5 6 7 9 10 11 12 14 · · ·
The trial can proceed just follow the above table.The only thing you need to do is to specify the target toxicity rate!
20 / 48

Robust Optimal Interval (ROIN) Design Simulation Study Take-Home Messages References
Outline
1 Robust Optimal Interval (ROIN) DesignDose Finding in Phase I Clinical TrialsROIN Design for Single-Agent TrialsROIN Design for Drug-Combination Trials
2 Simulation Study
3 Take-Home Messages
4 References
21 / 48

Robust Optimal Interval (ROIN) Design Simulation Study Take-Home Messages References
Two-Agent Dose Finding
In a two-dimensional dose-finding study, we consider combining Jdose levels of drug A and K levels of drug B.Four doses of neratinib and four doses of temsirolimus, which leadsto a 4⇥4 two-dimensional space.
22 / 48

Robust Optimal Interval (ROIN) Design Simulation Study Take-Home Messages References
Random-Walk ROIN
We define an admissible dose escalation (de-escalation) set.Then we adaptively assign the next cohort of patients to the levelthat has the maximum posterior probability of being theMTD.
23 / 48

Robust Optimal Interval (ROIN) Design Simulation Study Take-Home Messages References
Random-Walk ROIN
Treat the first cohort at the lowest dose combination (1,1).
24 / 48
Robust Optimal Interval (ROIN) Design Simulation Study Take-Home Messages References
Random-Walk ROIN (Cont’d)
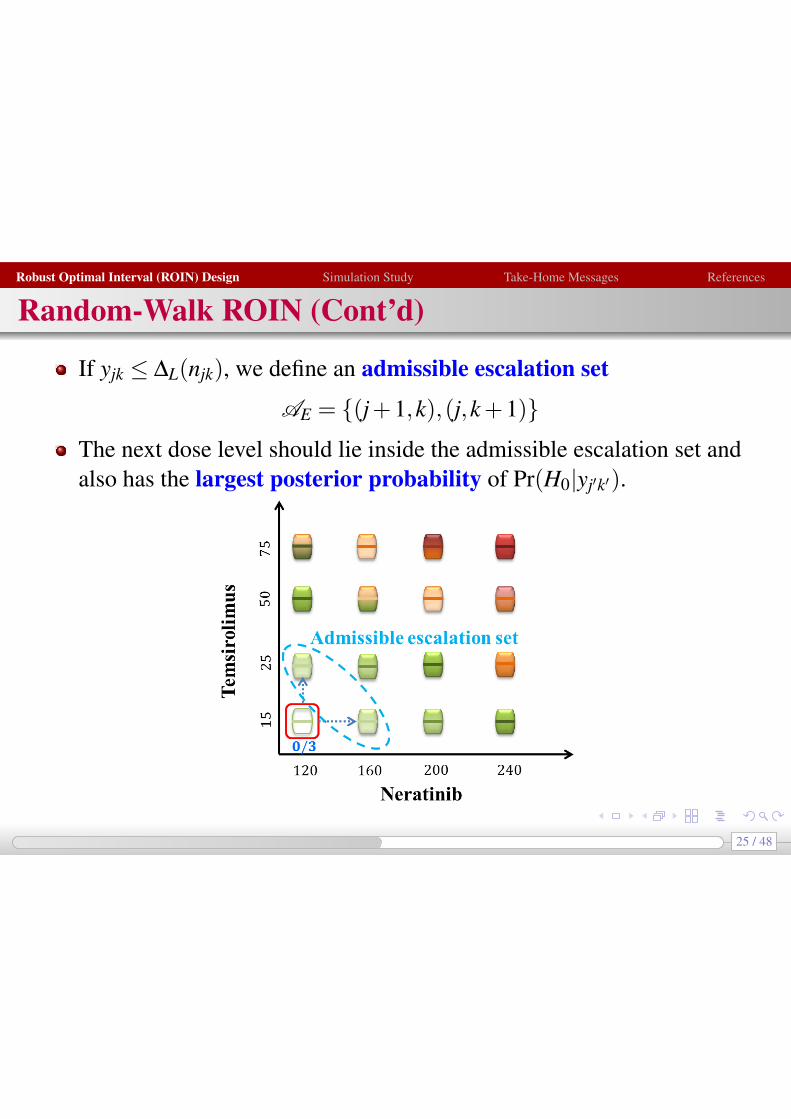
If yjk DL(njk), we define an admissible escalation setAE = {(j+1,k),(j,k+1)}
The next dose level should lie inside the admissible escalation set andalso has the largest posterior probability of Pr(H0|yj0k0).
25 / 48

Robust Optimal Interval (ROIN) Design Simulation Study Take-Home Messages References
Trial Illustration
Current Level: (1,1) yjk: 0 njk : 3Next Level: (1,2) DL(n): 0 DU(n): 2
26 / 48

Robust Optimal Interval (ROIN) Design Simulation Study Take-Home Messages References
Trial Illustration
Current Level: (1,2) yjk: 0 njk : 3Next Level: (1,3) DL(n): 0 DU(n): 2
27 / 48

Robust Optimal Interval (ROIN) Design Simulation Study Take-Home Messages References
Random-Walk ROIN (Cont’d)
If DL(njk)< yjk < DU(njk), the doses stay at the same level (j,k).
Current Level: (2,3) yjk: 1 njk : 3Next Level: (2,3) DL(n): 0 DU(n): 2
28 / 48

Robust Optimal Interval (ROIN) Design Simulation Study Take-Home Messages References
Trial Illustration
Current Level: (2,3) yjk: 1 njk : 6Next Level: (3,3) DL(n): 1 DU(n): 4
29 / 48

Robust Optimal Interval (ROIN) Design Simulation Study Take-Home Messages References
Random-Walk ROIN (Cont’d)
If yjk � DU(njk), we define an admissible de-escalation set
AD = {(j�1,k),(j,k�1)}The next dose level should lie inside the admissible deescalation setand also has the largest posterior probability of Pr(H0|yj0k0).
30 / 48

Robust Optimal Interval (ROIN) Design Simulation Study Take-Home Messages References
Random-Walk ROIN (Cont’d)
If the admissible set contains untried dose levels, we assign a largeinital value to Pr(H0|yj0k0),which facilitates exploration of the untrieddose levels.
Current Level: (3,3) yjk: 2 njk : 3Next Level: (3,2) DL(n): 0 DU(n): 2
31 / 48

Robust Optimal Interval (ROIN) Design Simulation Study Take-Home Messages References
Trial Illustration
Current Level: (3,2) yjk: 2 njk : 3Next Level: (2,2) DL(n): 0 DU(n): 2
32 / 48

Robust Optimal Interval (ROIN) Design Simulation Study Take-Home Messages References
Trial Illustration
Current Level: (2,2) yjk: 1 njk : 3Next Level: (2,2) DL(n): 0 DU(n): 2
33 / 48

Robust Optimal Interval (ROIN) Design Simulation Study Take-Home Messages References
Trial Illustration
Current Level: (2,2) yjk: 1 njk : 6Next Level: (2,3) DL(n): 1 DU(n): 4
34 / 48
Robust Optimal Interval (ROIN) Design Simulation Study Take-Home Messages References
Random-Walk ROIN (Cont’d)
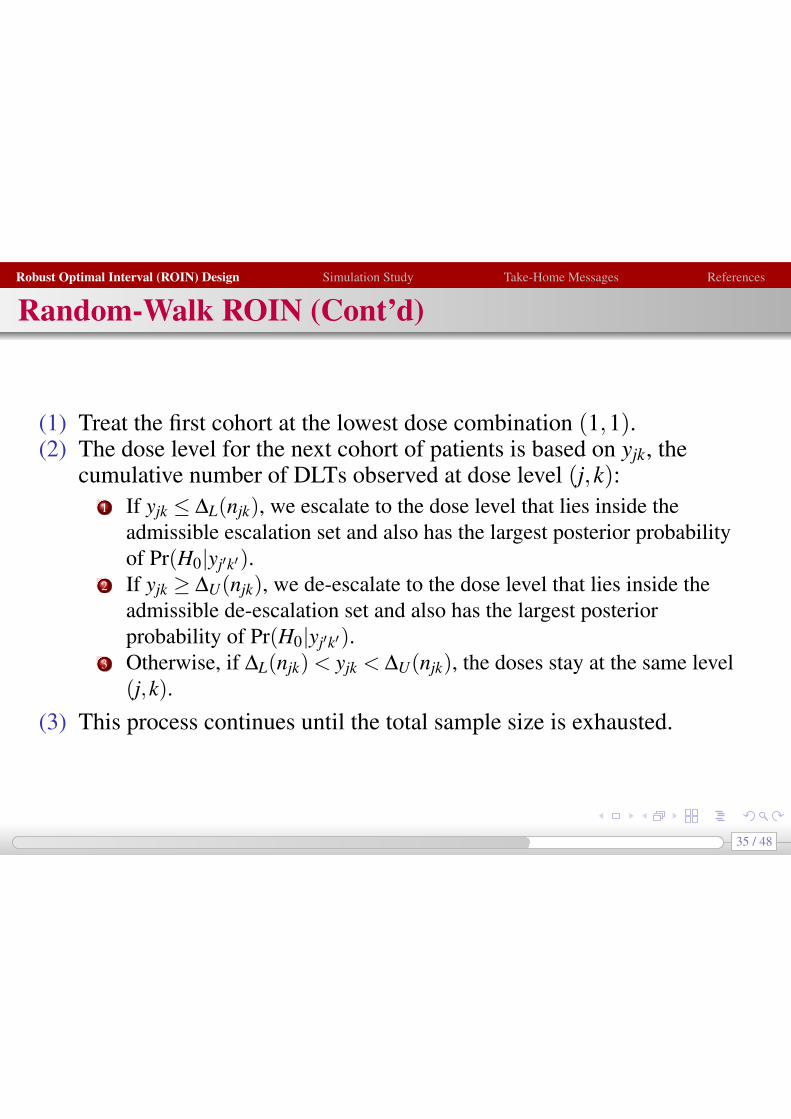
(1) Treat the first cohort at the lowest dose combination (1,1).(2) The dose level for the next cohort of patients is based on yjk, the
cumulative number of DLTs observed at dose level (j,k):1 If yjk DL(njk), we escalate to the dose level that lies inside the
admissible escalation set and also has the largest posterior probabilityof Pr(H0|yj0k0).
2 If yjk � DU(njk), we de-escalate to the dose level that lies inside theadmissible de-escalation set and also has the largest posteriorprobability of Pr(H0|yj0k0).
3 Otherwise, if DL(njk)< yjk < DU(njk), the doses stay at the same level(j,k).
(3) This process continues until the total sample size is exhausted.
35 / 48

Robust Optimal Interval (ROIN) Design Simulation Study Take-Home Messages References
At the End of the Trial
After isotonic regression,
p̃ =
2
664
� � � �� 0.67 0.67 �� 0.17 0.30 0.67
0.00 0.00 0.00 0.67
3
775
36 / 48

Robust Optimal Interval (ROIN) Design Simulation Study Take-Home Messages References
Random-Walk ROIN
Major advantage of the RW-ROINdoes not incorporate any model assumption of thetwo-dimensional toxicity surfacecan be easily implemented
Disadvantage:locating only one of the MTDs without conducting a moreextensive exploration of other MTDs
37 / 48

Robust Optimal Interval (ROIN) Design Simulation Study Take-Home Messages References
1 Robust Optimal Interval (ROIN) DesignDose Finding in Phase I Clinical TrialsROIN Design for Single-Agent TrialsROIN Design for Drug-Combination Trials
2 Simulation Study
3 Take-Home Messages
4 References
38 / 48

Robust Optimal Interval (ROIN) Design Simulation Study Take-Home Messages References
Simulation Settings
Target toxicity rate f = 0.3Sample size N = 60 with a cohort size of 3 patientsTwo existing algorithm-based methods:
Two-dimensional up-and-down design (UD, Ivanova and Wang, 2004)Up and down design using t-statistic (UDT)
Three model-based methods:Partial ordering CRM (POCRM, Wages et al., 2011)Copula regression method using Clayton function (CLAYTON, Yinand Yuan, 2009)Bagging CRM (BCRM, Lin and Yin, 2015)
39 / 48
Robust Optimal Interval (ROIN) Design Simulation Study Take-Home Messages References
Simulation Scenarios
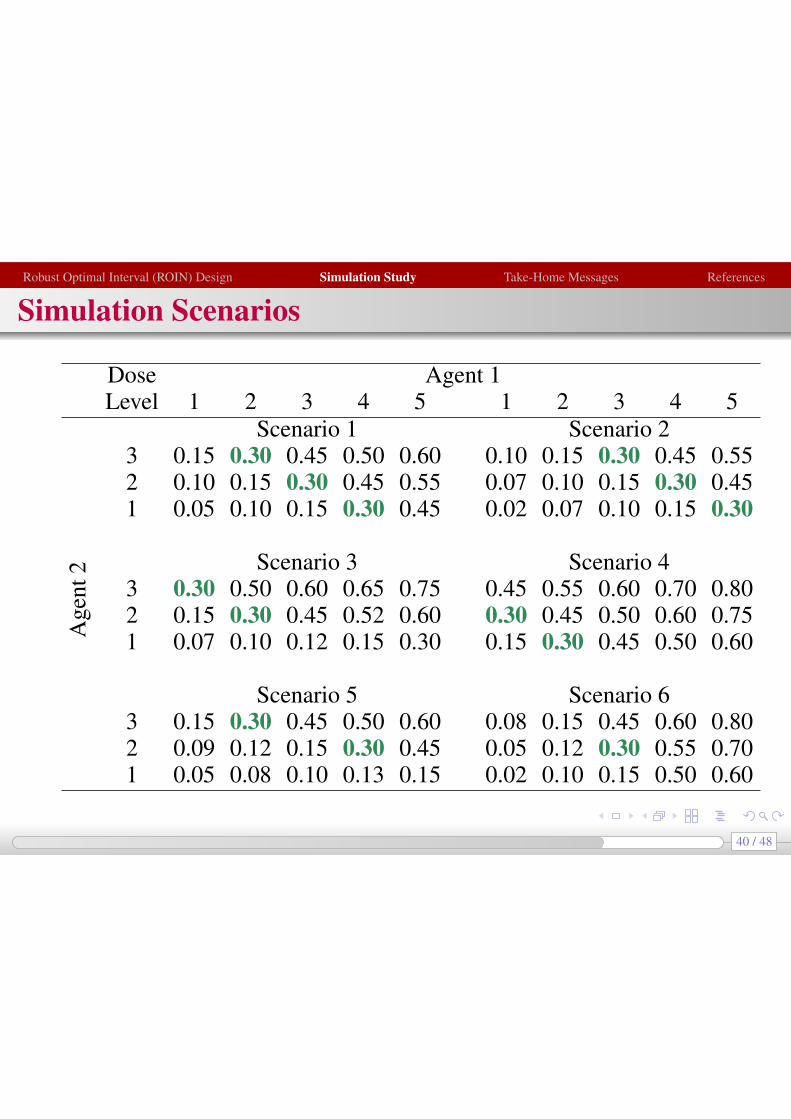
Dose Agent 1Level 1 2 3 4 5 1 2 3 4 5
Age
nt2
Scenario 1 Scenario 23 0.15 0.30 0.45 0.50 0.60 0.10 0.15 0.30 0.45 0.552 0.10 0.15 0.30 0.45 0.55 0.07 0.10 0.15 0.30 0.451 0.05 0.10 0.15 0.30 0.45 0.02 0.07 0.10 0.15 0.30
Scenario 3 Scenario 43 0.30 0.50 0.60 0.65 0.75 0.45 0.55 0.60 0.70 0.802 0.15 0.30 0.45 0.52 0.60 0.30 0.45 0.50 0.60 0.751 0.07 0.10 0.12 0.15 0.30 0.15 0.30 0.45 0.50 0.60
Scenario 5 Scenario 63 0.15 0.30 0.45 0.50 0.60 0.08 0.15 0.45 0.60 0.802 0.09 0.12 0.15 0.30 0.45 0.05 0.12 0.30 0.55 0.701 0.05 0.08 0.10 0.13 0.15 0.02 0.10 0.15 0.50 0.60
40 / 48

Robust Optimal Interval (ROIN) Design Simulation Study Take-Home Messages References
Percentage of MTD Selections
0
25
50
75
100
1 2 3 4 5 6 AverageScenarios
% M
TD
se
lect
ion
s
Method
RW−ROINPC−ROINUDUDTPOCRMCOPULABCRM
41 / 48

Robust Optimal Interval (ROIN) Design Simulation Study Take-Home Messages References
Percentage of Patients Allocated at the MTDs
0
20
40
60
1 2 3 4 5 6 AverageScenarios
% p
atie
nts
at
the
MT
D(s
)
Method
RW−ROINPC−ROINUDUDTPOCRMCOPULABCRM
42 / 48

Robust Optimal Interval (ROIN) Design Simulation Study Take-Home Messages References
Average Number of DLT
0
10
20
30
1 2 3 4 5 6 AverageScenarios
Ave
rag
e n
um
be
r o
f D
LTs
Method
RW−ROINPC−ROINUDUDTPOCRMCOPULABCRM
43 / 48
Robust Optimal Interval (ROIN) Design Simulation Study Take-Home Messages References
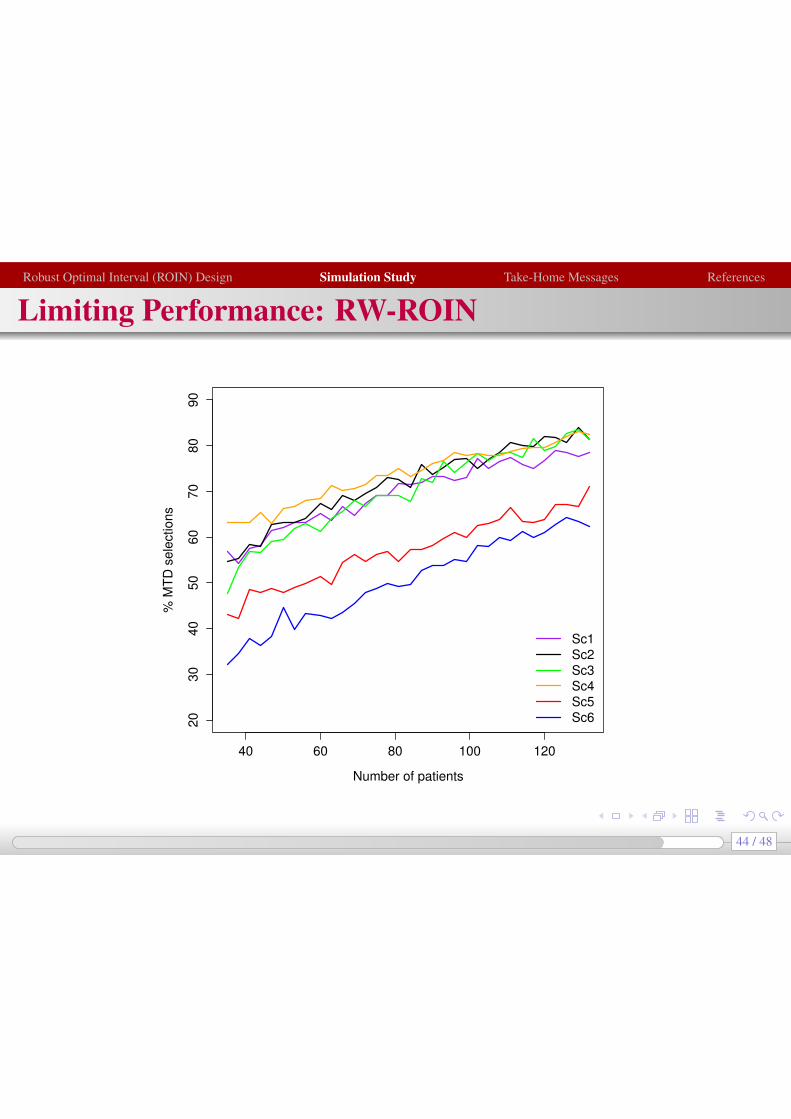
Limiting Performance: RW-ROIN
20
30
40
50
60
70
80
90
Number of patients
% M
TD
sele
ctio
ns
40 60 80 100 120
Sc1 Sc2 Sc3 Sc4 Sc5 Sc6
44 / 48

Robust Optimal Interval (ROIN) Design Simulation Study Take-Home Messages References
Limiting Performance: PC-ROIN
20
30
40
50
60
70
80
90
Number of patients
% M
TD
sele
ctio
ns
40 60 80 100 120
Sc1 Sc2 Sc3 Sc4 Sc5 Sc6
45 / 48

Robust Optimal Interval (ROIN) Design Simulation Study Take-Home Messages References
Take-Home Message
Easy to understand and implement from a statistical and clinicalstandpointRealistic assumptions on the dose-toxicity relationshipFavorable and robust operating characteristicsCan be recommended for general drug-combination trials with morebroad applications
46 / 48

Robust Optimal Interval (ROIN) Design Simulation Study Take-Home Messages References
References
1 Yin G, Yuan Y. Bayesian dose finding in oncology for drug combinations by copula regression.J R Stat Soc Ser C Appl Stat 2009; 61: 211–224.
2 Yuan Y, Yin G. Sequential continual reassessment method for two-dimensional dose finding.Stat Med 2008; 27: 5664–5678.
3 Wages NA, Conaway MR, O’Quigley J. Dose-finding design for multi-drug combinations. ClinTrials 2011; 8: 380–389.
4 Ivanova A, Wang K. A nonparametric approach to the design and analysis of two-dimensionaldose-finding trials. Stat Med 2004; 23: 1861–1870.
5 Liu S, Yuan Y. Bayesian Optimal Interval Designs for Phase I Clinical Trials. J R Stat Soc SerC Appl Stat 2014; doi: 10.1111/rssc.12089.
6 Yin G, Lin R. Comments on ‘Competing designs for drug combination phase I dose-findingclinical trials’ by M-K. Riviere, F. Dubois, S. Zohar. Stat Med 2015; 34: 13–17.
7 Gandhi L, Bahleda R, Tolaney S. M, et al. Phase I study of neratinib in combination withtemsirolimus in patients with human epidermal growth factor receptor 2-dependent and othersolid tumors. J Clin Oncol 2014; 32: 68–75.
8 Lin R, Yin G. Bagging Continual Reassessment Method - A Dynamic Ordering Approach toDrug-Combination Trials.
47 / 48

Robust Optimal Interval (ROIN) Design Simulation Study Take-Home Messages References
48 / 48


![[EN-A-073] Robust Optimal Trajectory Planning under](https://img.pdfslide.net/doc/110x75/6211df51e743c86aea630c41/en-a-073-robust-optimal-trajectory-planning-under-.jpg)