Embed Size (px)
Citation preview
Robust Real-Time Periodic MotionDetection, Analysis, and Applications
Ross Cutler and Larry S. Davis, Fellow, IEEE
AbstractÐWe describe new techniques to detect and analyze periodic motion as seen from both a static and a moving camera. By
tracking objects of interest, we compute an object's self-similarity as it evolves in time. For periodic motion, the self-similarity measure
is also periodic and we apply Time-Frequency analysis to detect and characterize the periodic motion. The periodicity is also analyzed
robustly using the 2D lattice structures inherent in similarity matrices. A real-time system has been implemented to track and classify
objects using periodicity. Examples of object classification (people, running dogs, vehicles), person counting, and nonstationary
periodicity are provided.
Index TermsÐPeriodic motion, motion segmention, object classification, person detection, motion symmetries, motion-based
recognition.
æ
1 INTRODUCTION
OBJECT motions that repeat are common in both natureand the man-made environment in which we live.
Perhaps the most prevalent periodic motions are theambulatory motions made by humans and animals in theirgaits (commonly referred to as ªbiological motionº [16]).Other examples include a person walking, a waving hand, arotating wheel, ocean waves, and a flying bird. Knowingthat an object's motion is periodic is a strong cue for objectand action recognition [16], [11]. In addition, periodicmotion can also aid in tracking objects. Furthermore, theperiodic motion of people can be used to recognizeindividuals [20].
1.1 Motivation
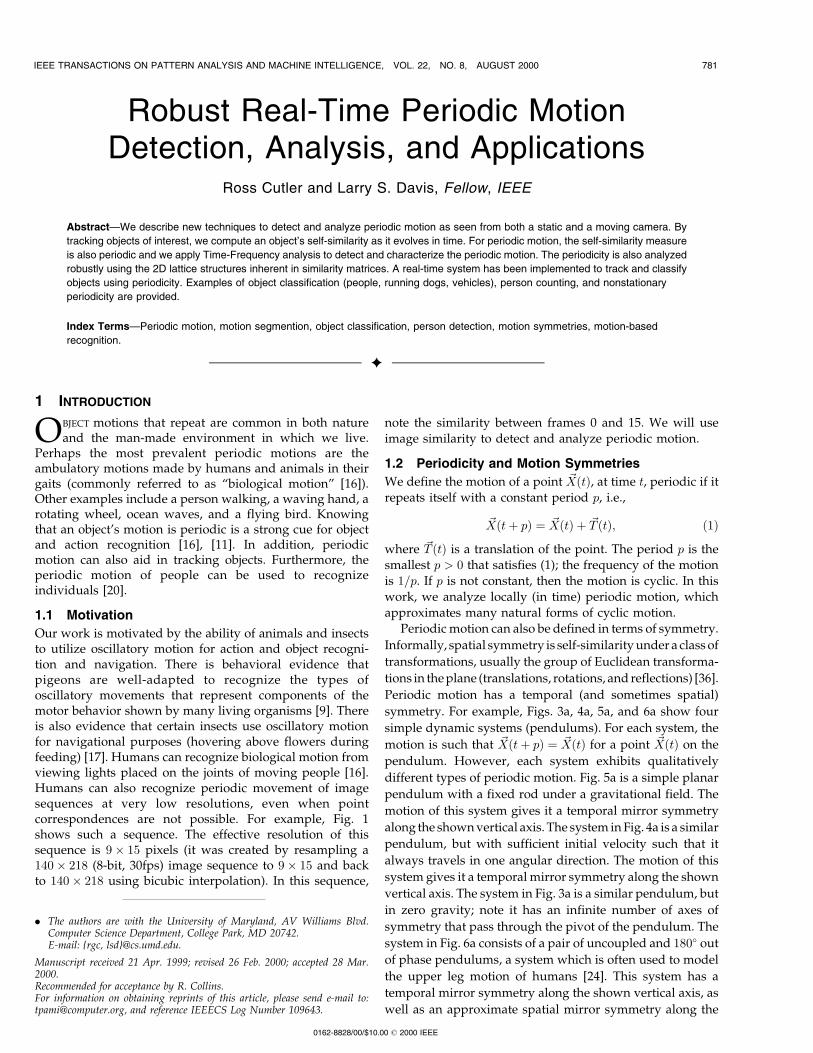
Our work is motivated by the ability of animals and insectsto utilize oscillatory motion for action and object recogni-tion and navigation. There is behavioral evidence thatpigeons are well-adapted to recognize the types ofoscillatory movements that represent components of themotor behavior shown by many living organisms [9]. Thereis also evidence that certain insects use oscillatory motionfor navigational purposes (hovering above flowers duringfeeding) [17]. Humans can recognize biological motion fromviewing lights placed on the joints of moving people [16].Humans can also recognize periodic movement of imagesequences at very low resolutions, even when pointcorrespondences are not possible. For example, Fig. 1shows such a sequence. The effective resolution of thissequence is 9� 15 pixels (it was created by resampling a140� 218 (8-bit, 30fps) image sequence to 9� 15 and backto 140� 218 using bicubic interpolation). In this sequence,
note the similarity between frames 0 and 15. We will useimage similarity to detect and analyze periodic motion.
1.2 Periodicity and Motion Symmetries
We define the motion of a point ~X�t�, at time t, periodic if itrepeats itself with a constant period p, i.e.,
~X�t� p� � ~X�t� � ~T �t�; �1�where ~T �t� is a translation of the point. The period p is thesmallest p > 0 that satisfies (1); the frequency of the motionis 1=p. If p is not constant, then the motion is cyclic. In thiswork, we analyze locally (in time) periodic motion, whichapproximates many natural forms of cyclic motion.
Periodic motion can also be defined in terms of symmetry.
Informally, spatial symmetry is self-similarity under a class of
transformations, usually the group of Euclidean transforma-
tions in the plane (translations, rotations, and reflections) [36].
Periodic motion has a temporal (and sometimes spatial)
symmetry. For example, Figs. 3a, 4a, 5a, and 6a show four
simple dynamic systems (pendulums). For each system, the
motion is such that ~X�t� p� � ~X�t� for a point ~X�t� on the
pendulum. However, each system exhibits qualitatively
different types of periodic motion. Fig. 5a is a simple planar
pendulum with a fixed rod under a gravitational field. The
motion of this system gives it a temporal mirror symmetry
along the shown vertical axis. The system in Fig. 4a is a similar
pendulum, but with sufficient initial velocity such that it
always travels in one angular direction. The motion of this
system gives it a temporal mirror symmetry along the shown
vertical axis. The system in Fig. 3a is a similar pendulum, but
in zero gravity; note it has an infinite number of axes of
symmetry that pass through the pivot of the pendulum. The
system in Fig. 6a consists of a pair of uncoupled and 180� out
of phase pendulums, a system which is often used to model
the upper leg motion of humans [24]. This system has a
temporal mirror symmetry along the shown vertical axis, as
well as an approximate spatial mirror symmetry along the
IEEE TRANSACTIONS ON PATTERN ANALYSIS AND MACHINE INTELLIGENCE, VOL. 22, NO. 8, AUGUST 2000 781
. The authors are with the University of Maryland, AV Williams Blvd.Computer Science Department, College Park, MD 20742.E-mail: {rgc, lsd}@cs.umd.edu.
Manuscript received 21 Apr. 1999; revised 26 Feb. 2000; accepted 28 Mar.2000.Recommended for acceptance by R. Collins.For information on obtaining reprints of this article, please send e-mail to:[email protected], and reference IEEECS Log Number 109643.
0162-8828/00/$10.00 ß 2000 IEEE
same vertical axis (it is approximate because the pendulums
are not identical).The above examples illustrate that while (1) can be used
to detect periodicity, it is not sufficient to classify differenttypes of periodic motion. For classification purposes, it isnecessary to exploit the dynamics of the system of interest,which we do in Section 3.4.
1.3 Assumptions
In this work, we make the following assumptions: 1) theorientation and apparent size of the segmented objects donot change significantly during several periods (or do soperiodically); 2) the frame rate is sufficiently fast forcapturing the periodic motion (at least double the highestfrequency in the periodic motion).
1.4 Contributions
The main contribution of this work is the introduction ofnovel techniques to robustly detect and analyze periodicmotion. We have demonstrated these techniques with videoof the quality typically found in both ground and airbornesurveillance systems. Of particular interest is the utilizationof the symmetries of motion exhibited in nature, which weuse for object classification. We also provide several othernovel applications of periodic motion, all related toautomating a surveillance system.
1.5 Organization of the Paper
In Section 2, we review and critique the related work. Themethodology is described in Section 3. Examples andapplications of periodic motion, particularly for the auto-mated surveillance domain, are given in Section 4. A real-time implementation of the methods is discussed inSection 5, followed by a summary of the paper in Section 6.
2 RELATED WORK
There has been recent interest in segmenting and analyzingperiodic or cyclic motion. Existing methods can becategorized as those requiring point correspondences [33],[35]; those analyzing periodicities of pixels [21], [30]; thoseanalyzing features of periodic motion [27], [10], [14]; andthose analyzing the periodicities of object similarities [6],[7], [33]. Related work has been done in analyzing therigidity of moving objects [34], [25]. Below we review andcritique each of these methods. Due to some similaritieswith the presented method, [33], [21], [30] are described inmore detail than the other related work.
Seitz and Dyer [33] compute a temporal correlation plotfor repeating motions using different image comparisonfunctions, dA and dI . The affine comparison function dA
allows for view-invariant analysis of image motion, butrequires point correspondences (which are achieved bytracking reflectors on the analyzed objects). The imagecomparison function dI computes the sum of absolutedifferences between images. However, the objects are nottracked and, thus, must have nontranslational periodicmotion in order for periodic motion to be detected. Cyclicmotion is analyzed by computing the period-trace, whichare curves that are fit to the surface d. Snakes are used to fitthese curves, which assumes that d is well-behaved nearzero so that near-matching configurations show up as localminima of d. The K-S test is utilized to classify periodic andnonperiodic motion. The samples used in the K-S test arethe correlation matrix M and the hypothesized period-tracePT . The null hypothesis is that the motion is not periodic,i.e., the cumulative distribution function M and PT are notsignificantly different. The K-S test rejects the null hypoth-esis when periodic motion is present. However, it alsorejects the null hypothesis if M is nonstationary. Forexample, when M has a trend, the cumulative distributionfunction of M and PT can be significantly different,resulting in classifying the motion as periodic (even if noperiodic motion present). This can occur if the viewpoint ofthe object or lighting changes significantly during evalua-tion of M (see Fig. 19a). The basic weakness of this methodis it uses a one-sided hypothesis test which assumesstationarity. A stronger test is needed to detect periodicityin nonstationary data, which we provide in Section 3.4.
Polana and Nelson [30] recognize periodic motions in animage sequence by first aligning the frames with respect tothe centroid of an object so that the object remainsstationary in time. Reference curves, which are lines parallelto the trajectory of the motion flow centroid, are extractedand the spectral power is estimated for the image signalsalong these curves. The periodicity measure of eachreference curve is defined as the normalized differencebetween the sum of the spectral energy at the highestamplitude frequency and its multiples and the sum of theenergy at the frequencies half way between.
Tsai et al. [35] analyze the periodic motion of a personwalking parallel to the image plane. Both synthetic and realwalking sequences are analyzed. For the real images, pointcorrespondences were achieved by manually tracking thejoints of the body. Periodicity was detected using Fourieranalysis of the smoothed spatio-temporal curvature func-tion of the trajectories created by specific points on the bodyas it performs periodic motion. A motion-based recognitionapplication is described in which one complete cycle isstored as a model and a matching process is performedusing one cycle of an input trajectory.
782 IEEE TRANSACTIONS ON PATTERN ANALYSIS AND MACHINE INTELLIGENCE, VOL. 22, NO. 8, AUGUST 2000
Fig. 1. Low resolution image sequences of a periodic motion (a person walking on a treadmill). The effective resolution is 9� 15 pixels.
Allmen [1] usedspatio-temporal flow curvesof edge imagesequences (with no background edges present) to analyzecyclic motion. Repeating patterns in the ST flow curves aredetected using curvature scale-space. A potential problemwith this technique is that the curvature of the ST flow curvesis sensitive to noise. Such a technique would likely fail on verynoisy sequences, such as that shown in Fig. 15.
Niyogi and Adelson [27] analyze human gait by firstsegmenting a person walking parallel to the image planeusing background subtraction. A spatio-temporal surface isfit to the XYT pattern created by the walking person. Thissurface is approximately periodic and reflects the periodi-city of the gait. Related work [26] used this surface(extracted differently) for gait recognition.
Liu and Picard [21] assume a static camera and usebackground subtraction to segment motion. Foregroundobjects are tracked and their path is fit to a line using aHough transform (all examples have motion parallel to theimage plane). The power spectrum of the temporal historiesof each pixel is then analyzed using Fourier analysis and theharmonic energy caused by periodic motion is estimated.An implicit assumption in [21] is that the background ishomogeneous (a sufficiently nonhomogeneous backgroundwill swamp the harmonic energy). Our work differs from[21] and [30] in that we analyze the periodicities of theimage similarities of large areas of an object, not justindividual pixels aligned with an object. Because of thisdifference (and the fact that we use a smooth imagesimilarity metric), our Fourier analysis is much simplersince the signals we analyze do not have significantharmonics of the fundamental frequency. The harmonicsin [21] and [30] are due to the large discontinuities in thesignal of a single pixel; our self-similarity metric does nothave such discontinuities.
Fujiyoshi and Lipton [10] segment moving objects from astatic camera and extract the object boundaries. From theobject boundary, a ªstarº skeleton is produced, which is thenFourier analyzed for periodic motion. This method requiresaccurate motion segmentation, which is not always possible(e.g., see Fig. 16). Also, objects must be segmented individu-ally; no partial occlusions are allowed (as shown in Fig. 21a).In addition, since only the boundary of the object is analyzedfor periodic change (and not the interior of the object), someperiodic motions may not be detected (e.g., a textured rollingball, or a person walking directly toward the camera).
Selinger and Wixson [34] track objects and compute self-similarities of that object. A simple heuristic using the peaksof the 1D similarity measure is used to classify rigid andnonrigid moving objects, which in our tests fails to classifycorrectly for noisy images (e.g., the sequence in Fig. 15).
Heisele and Wohler [14] recognize pedestrians usingcolor images from a moving camera. The images aresegmented using a color/position feature space and theresulting clusters are tracked. A quadratic polynomialclassifier extracts those clusters which represent the legsof pedestrians. The clusters are then classified by a timedelay neural network, with spatio-temporal receptive fields.This method requires accurate object segmentation. A3-CCD color camera was used to facilitate the colorclustering and pedestrians are approximately 100 pixels inheight. These image qualities and resolutions are typicallynot found in surveillance applications.
There has also been some work done in classifyingperiodic motion. Polana and Nelson [30] use the dominant
frequency of the detected periodicity to determine thetemporal scale of the motion. A temporally scaled XYT
template, where XY is a feature based on optical flow, is usedto match the given motion. The periodic motions includewalking, running, swinging, jumping, skiing, jumping jacks,
and a toy frog. This technique is view dependent and has notbeen demonstrated to generalize across different subjects
and viewing conditions. Also, since optical flow is used, itwill be highly susceptible to image noise.
Cohen et al. [5] classify oscillatory gestures of a moving
light by modeling the gestures as simple one-dimensionalordinary differential equations. Six classes of gestures are
considered (all circular and linear paths). This techniquerequires point correspondences and has not been shown towork on arbitrary oscillatory motions.
Area-based techniques, such as the present method, have
several advantages over pixel-based techniques, such as[30], [21]. Specifically, area-based techniques allow the
analysis of the dynamics of the entire object, which is notachievable by pixel-based techniques. This allows for
classification of different types of periodic motion, such asthose given in Section 4.1 and Section 4.4. In addition, area-
based techniques allow detection and analysis of periodicmotion that is not parallel to the image plane. All examplesgiven in [30], [21] have motion parallel to the image plane,
which ensures there is sufficient periodic pixel variation forthe techniques to work. However, since area-based methods
compute object similarities which span many pixels, theindividual pixel variations do not have to be large. For
example, our method can detect periodic motion from videosequences of people walking directly toward the camera. Arelated benefit is that area-based techniques allow the
analysis of low S/N images, such as that shown in Fig. 16,since the S/N of the object similarity measure (such as (5)) is
higher than that of a single pixel.
3 METHOD
The algorithm for periodicity detection and analysis
consists of two parts. First, we segment the motion andtrack objects in the foreground. We then align each objectalong the temporal axis (using the object's tracking results)
and compute the object's self-similarity as it evolves in time.For periodic motions, the self-similarity metric is periodic
and we apply Time-Frequency analysis to detect andcharacterize the periodicity. The periodicity is also analyzed
robustly using the 2D lattice structures inherent insimilarity matrices.
3.1 Motion Segmentation and Tracking
Given an image sequence It from a moving camera, we
segment regions of independent motion. The images It arefirst Gaussian filtered to reduce noise, resulting in I�t . Theimage I�t is then stabilized [12] with respect to image I�tÿ� ,resulting in Vt;tÿ� . The images Vt;tÿ� and I�t are differencedand thresholded to detect regions of motion, resulting in a
binary motion image:
CUTLER AND DAVIS: ROBUST REAL-TIME PERIODIC MOTION DETECTION, ANALYSIS, AND APPLICATIONS 783
Mt;ÿ� � 1 if���I�t ÿ Vt;tÿ� ��� > TM
0 otherwise;
(�2�
where TM is a threshold. In order to eliminate false motionat occlusion boundaries (and help filter spurious noise), themotion imagesMt;� andMt;ÿ� are logically anded together:
Mt �Mt;ÿ� ^Mt;� : �3�An example ofMt is shown in Fig. 21b. Note that, for largevalues of � , motion parallax will cause false motion in Mt.In our examples (for a moving camera), � = 300 ms wasused.
Note that, in many surveillance applications, images areacquired using a camera with automatic gain, shutter, andexposure. In these cases, normalizing the image meanbefore comparing images It1 and It2 will help minimize falsemotion due to a change in the gain, shutter, or exposure.
A morphological open operation is performed on Mt
(yielding M�t ), which reduces motion due to image noise.
The connected components forM�t are computed and small
components are eliminated (further reducing image noise).The connected components which are spatially similar (indistance) are then merged and the merged connectedcomponents are added to a list of objects Ot to be tracked.An object has the following attributes: area, centroid,bounding box, velocity, ID number, and age (in frames).Objects in Ot and Ot�k, k > 0, are corresponded usingspatial and temporal coherency.
It should be noted that the tracker is not required to bevery accurate, as the self-similarity metric we use is robustand can handle tracking errors of several pixels (asmeasured in our examples).
Also note that, when the background of a tracked objectis sufficiently homogeneous, and the tracked object does notchange size significantly during several periods, thenaccurate object segmentation is not necessary. In thesecases, we can allow Ot to include both the foreground andbackground. Examples of such backgrounds include grassy
784 IEEE TRANSACTIONS ON PATTERN ANALYSIS AND MACHINE INTELLIGENCE, VOL. 22, NO. 8, AUGUST 2000
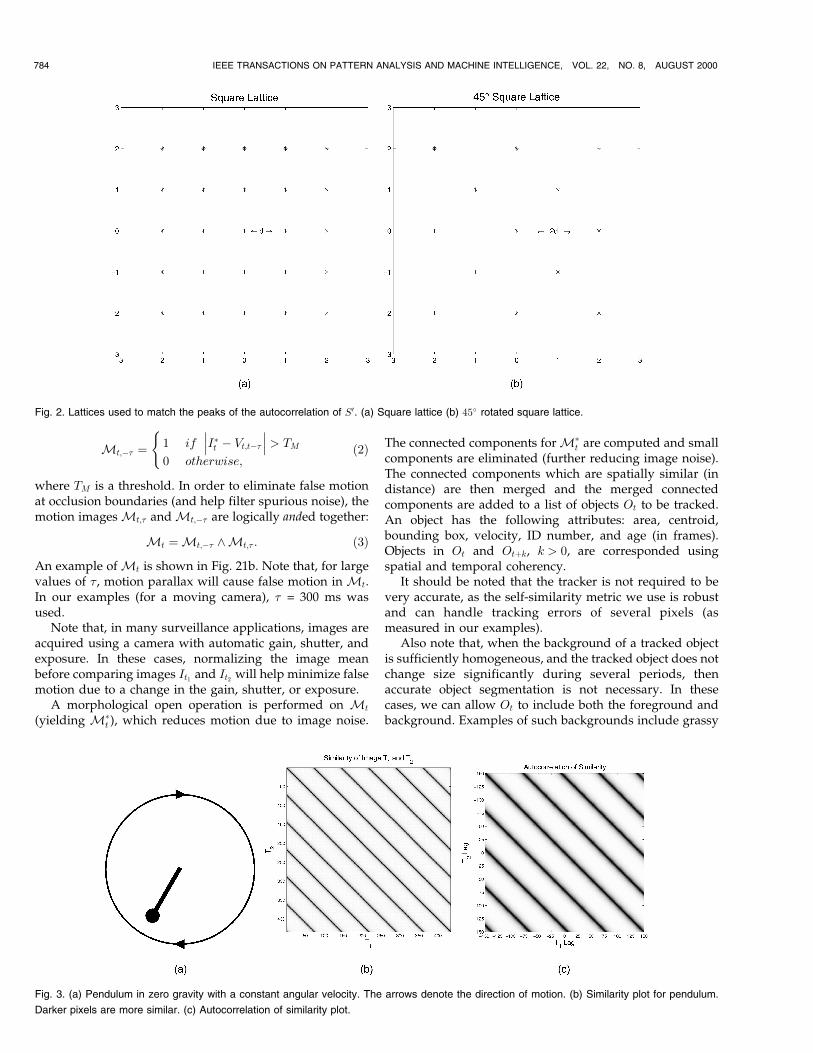
Fig. 2. Lattices used to match the peaks of the autocorrelation of S0. (a) Square lattice (b) 45� rotated square lattice.
Fig. 3. (a) Pendulum in zero gravity with a constant angular velocity. The arrows denote the direction of motion. (b) Similarity plot for pendulum.
Darker pixels are more similar. (c) Autocorrelation of similarity plot.
fields, dirt roads, and parking lots. An example of such a
sequence is given in Fig. 15.
3.2 Periodicity Detection and AnalysisThe output of the motion segmentation and trackingalgorithm is a set of foreground objects, each of which has acentroid and size. To detect periodicity for each object, wefirst align the segmented object (for each frame) using the
object's centroid and resize the objects (using a Mitchell filter[32]) so that they all have the same dimensions. The scaling isrequired to account for an apparent size change due to changein distance from the object to the camera. Because the objectsegmentation can be noisy, the object dimensions areestimated using the median of N frames (where N is thenumber of frames we analyze the object over). The objectOt'sself-similarity is then computed at times t1 and t2. While
CUTLER AND DAVIS: ROBUST REAL-TIME PERIODIC MOTION DETECTION, ANALYSIS, AND APPLICATIONS 785
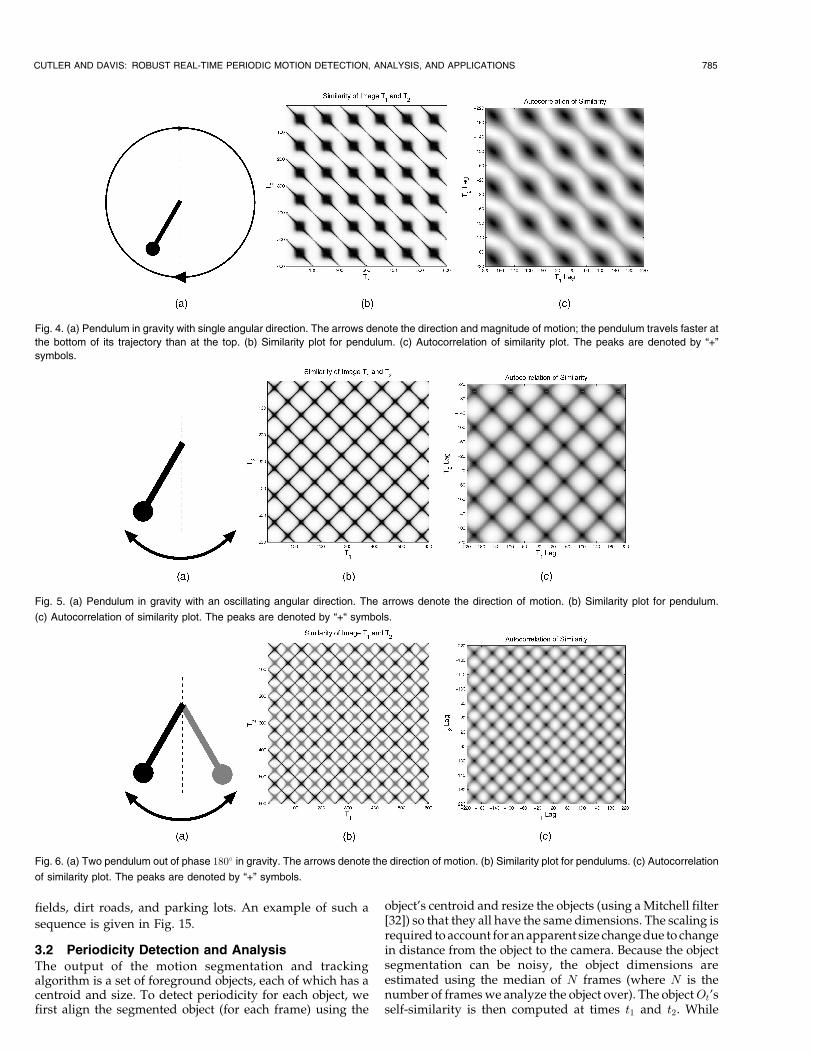
Fig. 4. (a) Pendulum in gravity with single angular direction. The arrows denote the direction and magnitude of motion; the pendulum travels faster at
the bottom of its trajectory than at the top. (b) Similarity plot for pendulum. (c) Autocorrelation of similarity plot. The peaks are denoted by ª+º
symbols.
Fig. 5. (a) Pendulum in gravity with an oscillating angular direction. The arrows denote the direction of motion. (b) Similarity plot for pendulum.
(c) Autocorrelation of similarity plot. The peaks are denoted by ª+ª symbols.
Fig. 6. (a) Two pendulum out of phase 180� in gravity. The arrows denote the direction of motion. (b) Similarity plot for pendulums. (c) Autocorrelation
of similarity plot. The peaks are denoted by ª+º symbols.
many image similarity metrics can be defined (e.g., normal-
ized cross-correlation, Hausdorff distance [15], color index-
ing [2]), perhaps the simplest is absolute correlation:
St1; t2 �X
�x;y�2Bt1
Ot1�x; y� ÿOt2�x; y�j j; �4�
where Bt1 is the bounding box of object Ot1 . In order toaccount for tracking errors, the minimal S is found bytranslating over a small search radius r:
S0t1; t2 � mindx;dyj j<r
X�x;y�2Bt1
Ot1�x� dx; y� dy� ÿOt2�x; y�j j: �5�
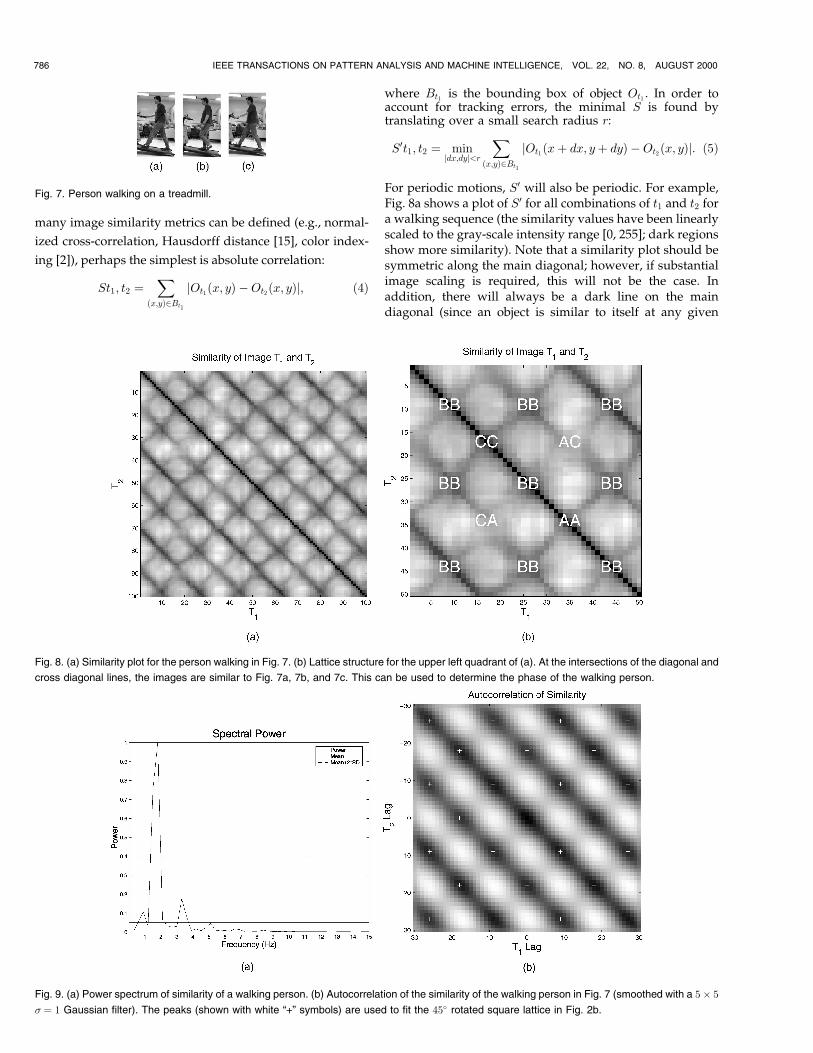
For periodic motions, S0 will also be periodic. For example,Fig. 8a shows a plot of S0 for all combinations of t1 and t2 fora walking sequence (the similarity values have been linearlyscaled to the gray-scale intensity range [0, 255]; dark regionsshow more similarity). Note that a similarity plot should besymmetric along the main diagonal; however, if substantialimage scaling is required, this will not be the case. Inaddition, there will always be a dark line on the maindiagonal (since an object is similar to itself at any given
786 IEEE TRANSACTIONS ON PATTERN ANALYSIS AND MACHINE INTELLIGENCE, VOL. 22, NO. 8, AUGUST 2000
Fig. 7. Person walking on a treadmill.
Fig. 8. (a) Similarity plot for the person walking in Fig. 7. (b) Lattice structure for the upper left quadrant of (a). At the intersections of the diagonal and
cross diagonal lines, the images are similar to Fig. 7a, 7b, and 7c. This can be used to determine the phase of the walking person.
Fig. 9. (a) Power spectrum of similarity of a walking person. (b) Autocorrelation of the similarity of the walking person in Fig. 7 (smoothed with a 5� 5
� � 1 Gaussian filter). The peaks (shown with white ª+º symbols) are used to fit the 45� rotated square lattice in Fig. 2b.
time) and periodic motions will have dark lines (or curves if
the period is not constant) parallel to the diagonal.To determine if an object exhibits periodicity, we
estimate the 1D power spectrum of S0�t1; t2� for a fixed t1
and all values of t2 (i.e., the columns of S0). In estimating the
spectral power, the columns of S0 are linearly detrended
and a Hanning filter is applied. A more accurate spectrum
is estimated by averaging the spectra of multiple t1s [31] to
get a final power estimate P �fi�, where fi is the frequency.
Periodic motion will show up as peaks in this spectrum at
the motion's fundamental frequencies. A peak at frequency
fi is significant if
P �fi� > �P �K�P ; �6�where K is a threshold value (typically 3), �P is the mean of
P , and �P is the standard deviation of P . Note that multiple
peaks can be significant, as we will see in the examples.In the above test, we assume that the period is locally
constant. The locality is made precise using Time-Fre-
quency analysis given in Section 3.3. We also assume that
there are only linear amplitude modulations to the columns
of S0 (so that linear detrending is sufficient to make the data
stationary) and that any additive noise to S0 is Gaussian.
Both of these assumptions are relaxed in the method given
in Section 3.4.
3.2.1 Fisher's Test
If we assume that columns of S0 are stationary andcontaminated with white noise, and that any periodicitypresent consists of a single fundamental frequency, then wecan apply the well-known Fisher's test [29], [3]. Fisher's testwill reject the null hypothesis (that S0 is only white noise) ifP �fi� is substantially larger than the average value.Assuming N is even, let q � b�N ÿ 1�=2c and
Eq � qmax1�i�q P �fi�Pqi�1 P �fi�
: �7�
To apply the test, we compute the realized value x of Eqfrom S0 and then compute the probability:
P �Eq � x� � 1ÿXqj�0
�ÿ1�j q
j
� ��1ÿ jx=q�qÿ1
� ; �8�
where z� � max�z; 0�. If this probability is less than �, thenwe reject the null hypothesis at level � (in practice, we use� � 0:05). This test is optimal if there exists a single periodiccomponent at a Fourier frequency fi in white noisestationary data [29]. To test for periodicities containingmultiple frequencies, Seigel's test [29] can be applied.
In practice, Fisher's test, like the K-S test used by [33],works well if the periodic data is stationary with whitenoise. However, in most of our nonperiodic test data (e.g.,Fig. 19a), which is not stationary, both Fisher's and the K-Stest yield false periodicities with high confidence.
CUTLER AND DAVIS: ROBUST REAL-TIME PERIODIC MOTION DETECTION, ANALYSIS, AND APPLICATIONS 787
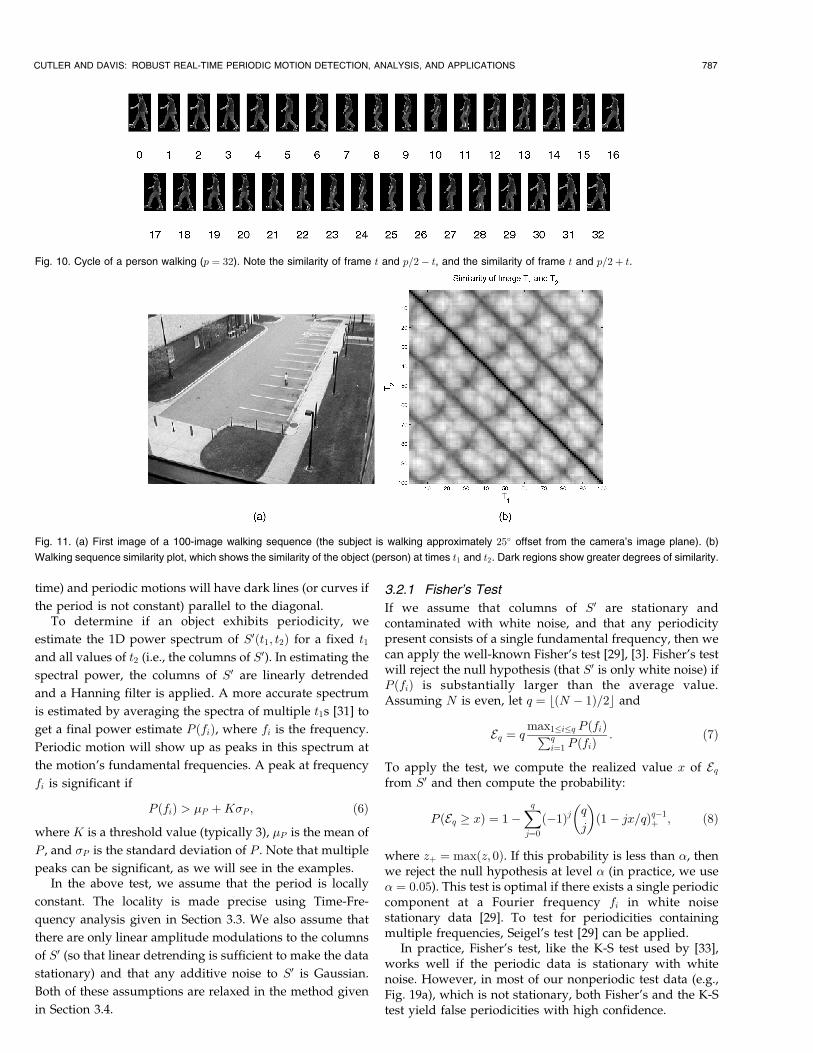
Fig. 10. Cycle of a person walking (p � 32). Note the similarity of frame t and p=2ÿ t, and the similarity of frame t and p=2� t.
Fig. 11. (a) First image of a 100-image walking sequence (the subject is walking approximately 25� offset from the camera's image plane). (b)
Walking sequence similarity plot, which shows the similarity of the object (person) at times t1 and t2. Dark regions show greater degrees of similarity.
3.2.2 Recurrence Matrices
It is interesting to note that S0 is a recurrence matrix [8], [4],
without using time-delayed embedded dimensions. Recur-
rence matrices are a qualitative tool used to perform time
series analysis of nonlinear dynamical systems (both periodic
and nonperiodic). Recurrence matrices make no assumptions
on the stationarity of the data and do not require many data
points to be used (a few cycles of periodic data is sufficient).
The input for a recurrence matrix is a multidimensional
temporally sampled signal. In our use, the input signal is the
tracked object image sequenceOt and the distance measure is
image similarity. Given a recurrence matrix, the initial
trajectory ~X�t� of a point on an object can be recovered up
to an isometry [23]. Therefore, the recurrence plot encodes the
spatiotemporal dynamics of the moving object. The similarity
plot encodes a projection of the spatiotemporal dynamics of
the moving object.
3.3 Time-Frequency Analysis
For stationary periodicity (i.e., periodicity with statistics
that don't change with time), the above analysis is
sufficient. However, for nonstationary periodicity, Fourier
analysis is not appropriate. Instead, we use Time-Frequency
analysis and the Short-Time Fourier Transform (STFT) [28]:
Fx�t; v;h� �Z 1ÿ1
x�u�h��uÿ t�ei2�vudu; �9�
where h��uÿ t� is a short-time analysis window and x�u� is
the signal to analyze (S0 in our case). The short-time
analysis window effectively suppresses the signal x�u�outside a neighborhood around the analysis time point
u � t. Therefore, the STFT is a ªlocalº spectrum of the signal
x�u� around t.We use a Hanning windowing function as the short-time
analysis window. The window length should be chosen to
788 IEEE TRANSACTIONS ON PATTERN ANALYSIS AND MACHINE INTELLIGENCE, VOL. 22, NO. 8, AUGUST 2000
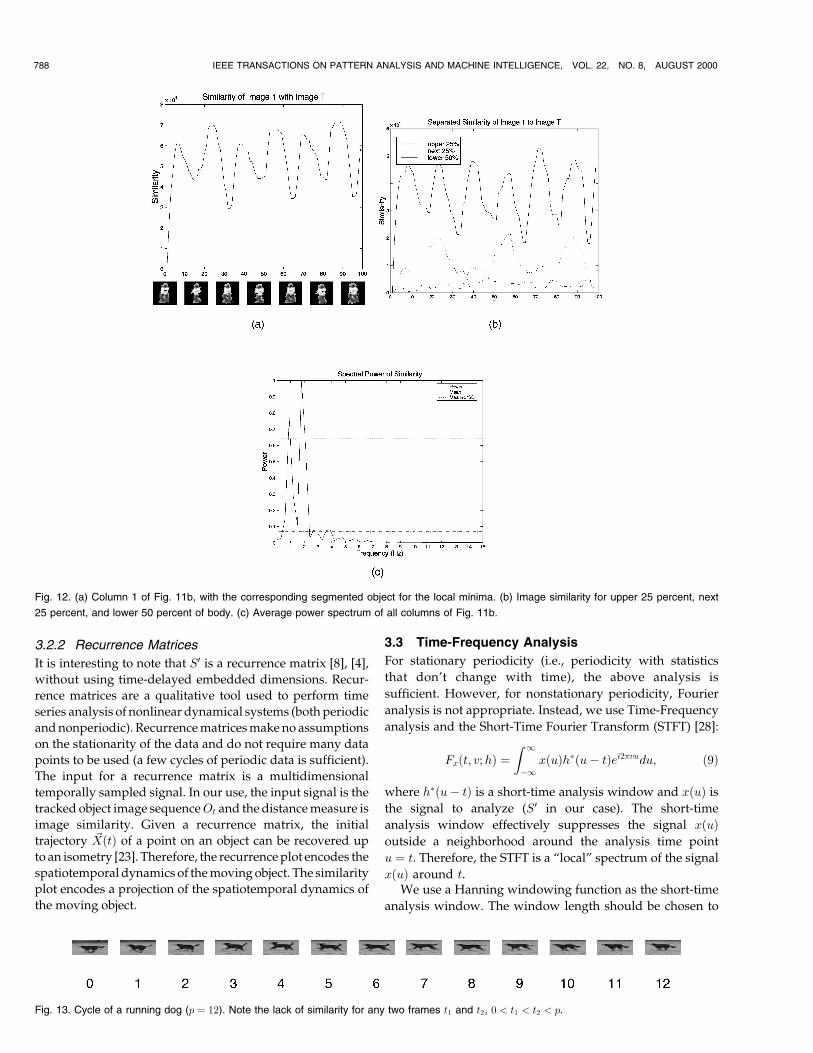
Fig. 12. (a) Column 1 of Fig. 11b, with the corresponding segmented object for the local minima. (b) Image similarity for upper 25 percent, next
25 percent, and lower 50 percent of body. (c) Average power spectrum of all columns of Fig. 11b.
Fig. 13. Cycle of a running dog (p � 12). Note the lack of similarity for any two frames t1 and t2, 0 < t1 < t2 < p.
be long enough to achieve a good power spectrum estimate,
but short enough to capture a local change in the
periodicity. In practice, a window length equal to several
periods works well for typical human motions. An example
of nonstationary periodicity is given in Section 4.7.
3.4 Robust Periodicity Analysis
In Section 3.2, we used a hypothesis test on the 1D power
spectrum of S0 to determine if S0 contained any periodic
motion. The null hypothesis is that there is only white noise
in the spectrum, which is rejected by (6) if significant
periodic motion is present. However, the null hypothesis
can also be rejected if S0 contains significant non-Gaussian
noise, or if the period is locally nonconstant, or if S0 is
amplitude modulated nonlinearly. We seek a technique that
minimizes the number of false periodicities while
maximizing the number of true periodicities. Toward this
end, we devise a test that performs well when the
assumptions stated in Section 3.2 are satisfied, but does
not yield false periodicities when these assumptions are
violated.An alternative technique to Fourier analysis of the 1D
columns of S is to analyze the 2D power spectrum of S0.However, as noted in [19], the autocorrelation of S0 for
regular textures has more prominent peaks than those in
the 2D Fourier spectrum. Let A be the normalized
autocorrelation of S0:
A�dx; dy� � P�x;y�2R S0 �x;y�ÿ �S0R��S0 �x�dx;y�dy�ÿ �S0RL� �P
�x;y�2R S0 �x;y�ÿ �S0R� �2P
�x;y�2R S0 �x�dx;y�dy�ÿ �S0RL� �2� �0:5;
�10�
where �S0R is the mean of S0 over the region R, �S0RLis the
mean of S0 over the region R shifted by the lag �dx; dy�, and
the regions R and RL cover S0 and the lagged S0. If S0 is
periodic, then A will have peaks regularly spaced in a
planar lattice Md, where d is the distance between the lattice
points. In our examples, we will consider two lattices, a
square lattice MS;d (Fig. 2a), and a 45� rotated square lattice
MR;d (Fig. 2b). The peaks P in A are matched to Md using
the match error measure e:
CUTLER AND DAVIS: ROBUST REAL-TIME PERIODIC MOTION DETECTION, ANALYSIS, AND APPLICATIONS 789
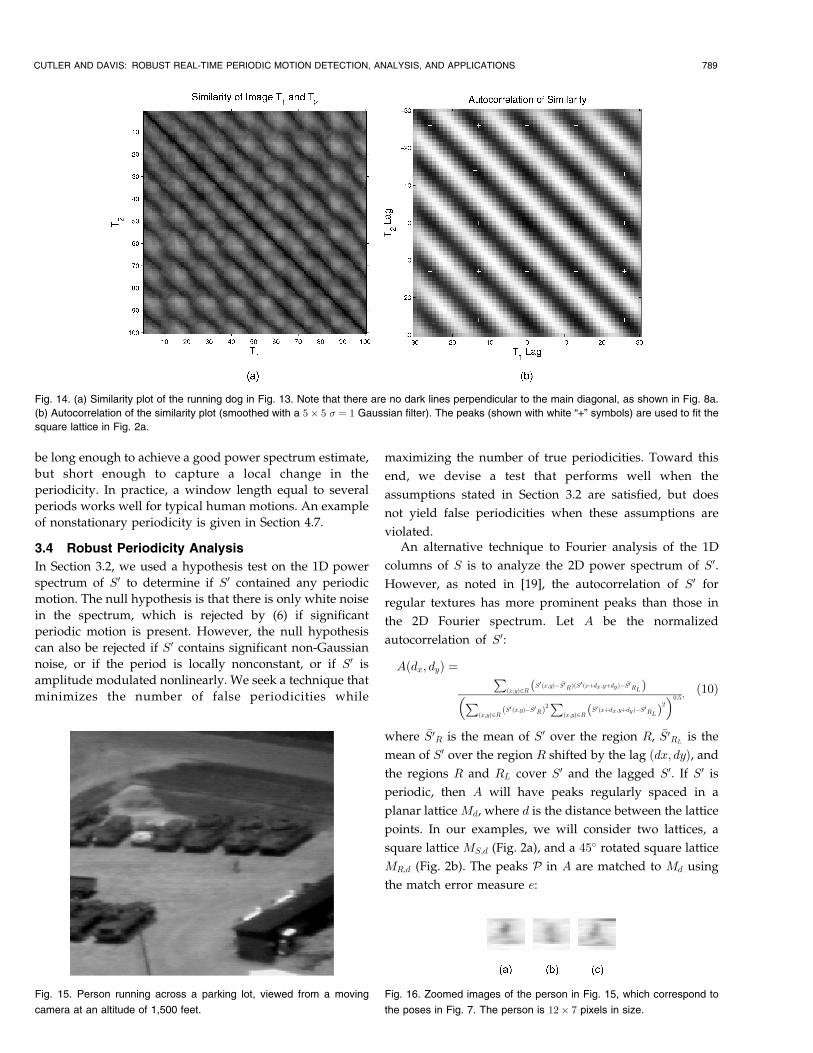
Fig. 14. (a) Similarity plot of the running dog in Fig. 13. Note that there are no dark lines perpendicular to the main diagonal, as shown in Fig. 8a.
(b) Autocorrelation of the similarity plot (smoothed with a 5� 5 � � 1 Gaussian filter). The peaks (shown with white ª+º symbols) are used to fit the
square lattice in Fig. 2a.
Fig. 15. Person running across a parking lot, viewed from a moving
camera at an altitude of 1,500 feet.
Fig. 16. Zoomed images of the person in Fig. 15, which correspond to
the poses in Fig. 7. The person is 12� 7 pixels in size.

Bi �Pi���Md;iÿPij�minj 6�i jMd;iÿPjj^jMd;iÿPij�TD^A�Pi��TA
n o �11�
e�Md� �Xi
jMd;i ÿBij; �12�
where Bi is the closest peak to the lattice point Md;i, TD(TD < d=2) is the maximum distance Pi can deviate from
Md;i, and TA is the minimum autocorrelation value that the
matched peak may have. Md matches P if all the following
are satisfied:
mind1�d�d2
e�Md� < Te; �13�
jBj � TM; �14�where Te is a match threshold; �d1; d2� is the range of d;
TM is the minimum number of points in Md to match. In
practice, we let TD � 1, Te � 2jMdj, Te � 2jMdj, and
TM � 0:9jMdj; TA � 0:25. The range �d1; d2� determines thepossible range of the expected period, with the require-ment 0 < d1 < d2 < L, where L is the maximum lag usedin computing A. The number of points in MR and MS canbe based on the period of the expected periodicity andframe-rate of the camera. The period p � 2d� , where � isthe sampling interval (e.g., � � 33 ms for NTSC video).
Peaks in A are determined by first smoothing A with aGaussian filter G, yielding A�. A��i; j� is a peak if A��i; j� is astrict maximum in a local neighborhood with radius N . Inour examples, G is a 5� 5 filter with � � 1 and N � 5.Lin et al. [19] provide an automatic method for determiningthe optimal size of G.
4 EXAMPLES AND APPLICATIONS
4.1 Synthetic Data
In this section, we demonstrate the methods on syntheticdata examples. We generated images of a periodic planarpendulum, with different initial conditions, parameters,and configurations. Note that the equation of motion for asimple planar pendulum is
d2�
dt2� g
Lsin � � 0; �15�
where g is the gravitational acceleration, L is the length ofthe rigid rod, and � is the angle between the pendulum rodand vertical axis [22]. In the first example (see Fig. 3a), weset g � 0 so that the pendulum has a circular motion with aconstant angular velocity. The diagonal lines in thesimilarity plot (Fig. 3b) are formed due to the self-similarityof the pendulum at every complete cycle. The autocorrela-tion (Fig. 3c) has no peaks.
In the next example, we use the same configuration, butset g > 0 and the initial angular velocity to be sufficient sothat the pendulum still has a single angular direction.However, in this configuration, the angular velocity is not
790 IEEE TRANSACTIONS ON PATTERN ANALYSIS AND MACHINE INTELLIGENCE, VOL. 22, NO. 8, AUGUST 2000
Fig. 18. Spectral power of the running person in Fig. 15.
Fig. 17. (a) Similarity plot of the running person in Fig. 15. (b) Autocorrelation of upper quadrant of S0. The peaks are used to fit the 45� rotated square
lattice in Fig. 2b.
constant, which is reflected in the qualitatively different
similarity plot (Fig. 4b) and autocorrelation (Fig. 4c). Note
that the peaks in A match the lattice structure in Fig. 2a.By decreasing the initial angular velocity, the pendulum
will oscillate with a changing angular direction, as shown in
Fig. 5a. The similarity plot for this system is shown in Fig. 5b
and the autocorrelation in Fig. 5c. Note that the peaks in A
match the lattice structure in Fig. 2b.Finally, for the system of two pendulums 180� out of
phase, shown in Fig. 6a, the similarity plot is shown in Fig. 6b
and the autocorrelation is shown in Fig. 6c. Note that the
peaks inAmatch the lattice structure in Fig. 2b. Also note the
lower measures of similarity for the diagonal lines S0�t; t��k� 1=2�p� and the cross-diagonal lines S�t; �k� 1=2�pÿ t�,and the corresponding effect on A.
4.2 The Symmetry of a Walking Person
In this example, we first analyze periodic motion with no
(little) translational motion, a person walking on a treadmill
(Fig. 7). This sequence was captured using a static JVC KY-
F55B color camera at 640� 480 at 30fps, deinterlaced, and
scaled to 160� 120. Since the camera is static and there is no
CUTLER AND DAVIS: ROBUST REAL-TIME PERIODIC MOTION DETECTION, ANALYSIS, AND APPLICATIONS 791
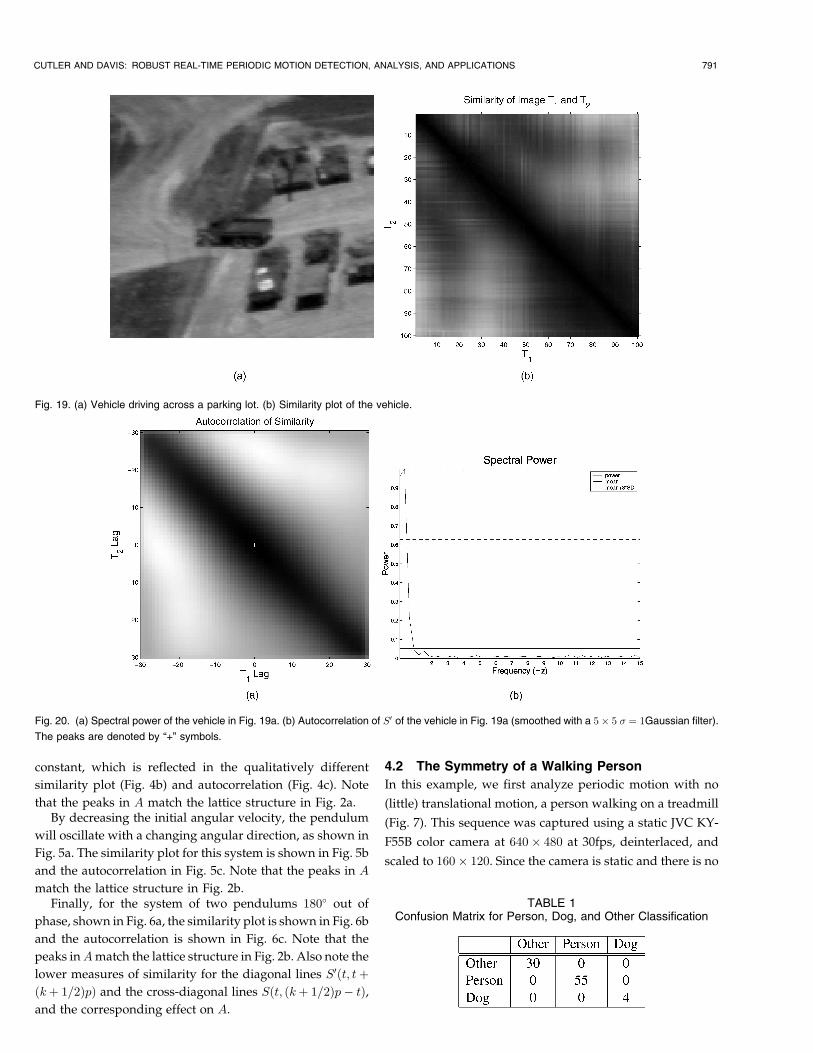
Fig. 19. (a) Vehicle driving across a parking lot. (b) Similarity plot of the vehicle.
Fig. 20. (a) Spectral power of the vehicle in Fig. 19a. (b) Autocorrelation of S0 of the vehicle in Fig. 19a (smoothed with a 5� 5 � � 1Gaussian filter).
The peaks are denoted by ª+º symbols.
TABLE 1Confusion Matrix for Person, Dog, and Other Classification
translational motion, background subtraction was used to
segment the motion [6].The similarity plot S0 for this sequence is shown in
Fig. 8a. The dark lines correspond to two images in the
sequence that are similar. The darkest line is the main
diagonal since S0�t; t� � 0. The dark lines parallel to the
main diagonal are formed since S0�t; kp=2� t� ' 0, where p
is the period, and k is an integer. The dark lines
perpendicular to the main diagonal are formed since
S0�t; kp=2ÿ t� ' 0 and is due to the symmetry of human
walking (see Fig. 10).It is interesting to note that, at the intersections of these
lines, these images are similar to either Fig. 7a, 7b, or 7c, (see
Fig. 8b). That is, S0 encodes the phase of the person walking,
not just the period. This fact is exploited in the example in
Section 4.5.The autocorrelation A of S0 is shown in Fig. 9b. The peaks
in A form a 45� rotated square lattice (Fig. 2b), which is used
for object classification (Section 4.4). Note that the
magnitude of the peaks in A (Fig. 9b) have a pattern similar
to the A in Fig. 6c.
We next analyze the motion of a person who is walking
at an approximately 25� offset to the camera's image plane
from a static camera. (Fig. 11a). The segmented person is
approximately 20 pixels in height, and is shown in Fig. 12a.
The similarity plot (Fig. 11a) shows dark diagonal lines at a
period of approximately 1 second (32 frames), which
correspond to the period of the person's walking. The
lighter diagonal lines shown with a period of approximately
0.5 seconds (16 frames) are explained by first noting that the
person's right arm swing is not fully visible (due to the 25�
offset to the image plane). Therefore, it takes two steps for
the body to be maximally self-similar, while the legs
become very self-similar at every step. The effect of this is
that the similarity measure S0 is the composition of two
periodic signals, with periods differing by a factor of two.
This is shown in Fig. 12b, where the aligned object image is
partitioned into three segments (the upper 25 percent, next
25 percent, and lower 50 percent of the body) and S0 is
computed for each segment. The upper 25 percent, which
includes the head and shoulders, shows no periodic motion;
the next 25 percent, which includes the one visible arm, has
a period double that of the lower 50 percent (which includes
the legs). Fig. 12c shows the average power spectrum for all
the columns in S0.
4.3 The Symmetry of a Running Dog
In this example, we look at the periodicity of a running dog
from a static camera. Fig. 13 shows a complete cycle of a
dog (a Black Labrador). Unlike the symmetry of a walking
or running person, a running dog has a lack of similarity for
S0�t; kpÿ t�. This results in the similarity plot (Fig. 14a)
having dark lines parallel to the main diagonal, formed by
S0�t; kp� t�, but no lines perpendicular to the main diagonal
(as with a walking/running person). The similarity plot has
peaks (Fig. 14a) that correspond to poses of the dog at
frame 0 in Fig. 13. The autocorrelation A of S0 is shown in
Fig. 14b; the peaks in A form a square lattice (Fig. 2a), which
is used in Section 4.4 for object classification.
792 IEEE TRANSACTIONS ON PATTERN ANALYSIS AND MACHINE INTELLIGENCE, VOL. 22, NO. 8, AUGUST 2000
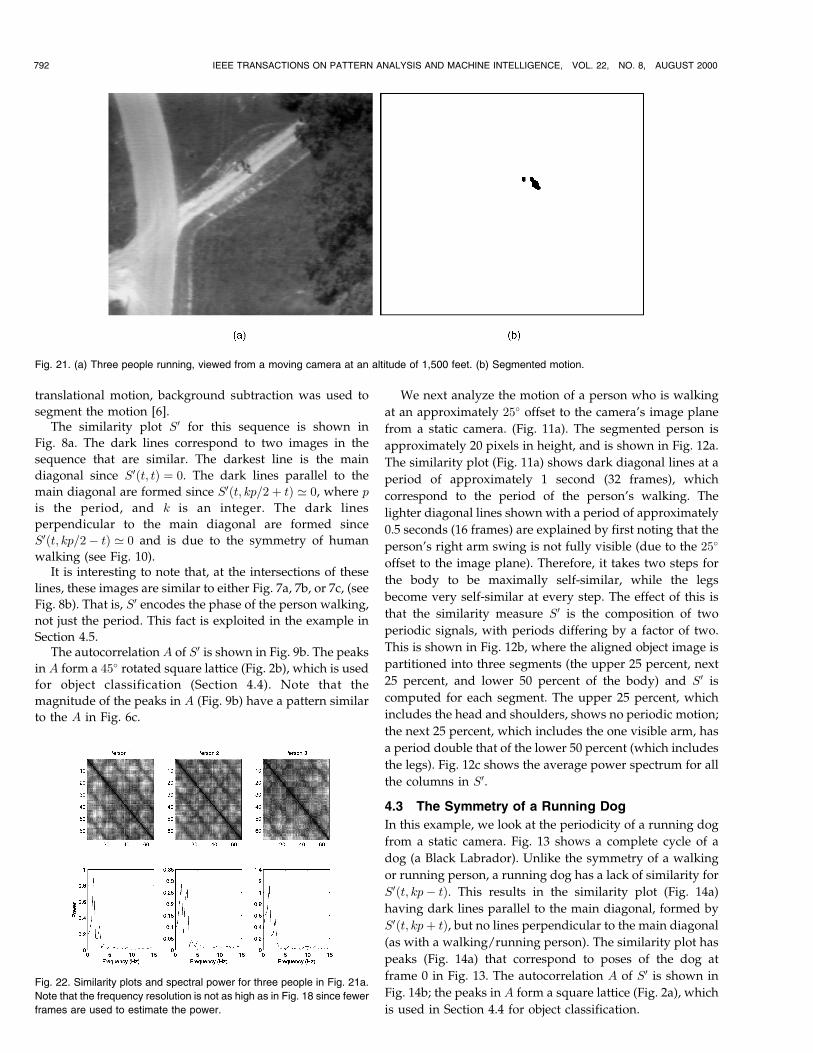
Fig. 21. (a) Three people running, viewed from a moving camera at an altitude of 1,500 feet. (b) Segmented motion.
Fig. 22. Similarity plots and spectral power for three people in Fig. 21a.
Note that the frequency resolution is not as high as in Fig. 18 since fewer
frames are used to estimate the power.
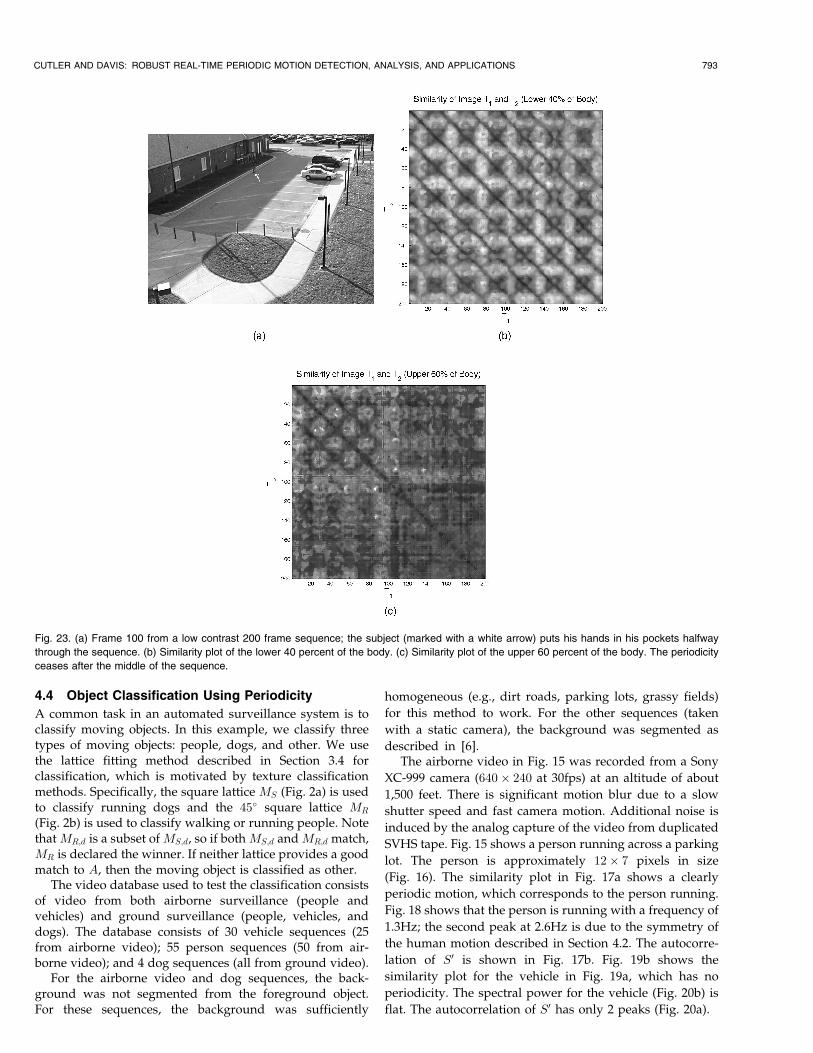
4.4 Object Classification Using Periodicity
A common task in an automated surveillance system is toclassify moving objects. In this example, we classify threetypes of moving objects: people, dogs, and other. We usethe lattice fitting method described in Section 3.4 forclassification, which is motivated by texture classificationmethods. Specifically, the square lattice MS (Fig. 2a) is usedto classify running dogs and the 45� square lattice MR
(Fig. 2b) is used to classify walking or running people. Notethat MR;d is a subset of MS;d, so if both MS;d and MR;d match,MR is declared the winner. If neither lattice provides a goodmatch to A, then the moving object is classified as other.
The video database used to test the classification consistsof video from both airborne surveillance (people andvehicles) and ground surveillance (people, vehicles, anddogs). The database consists of 30 vehicle sequences (25from airborne video); 55 person sequences (50 from air-borne video); and 4 dog sequences (all from ground video).
For the airborne video and dog sequences, the back-ground was not segmented from the foreground object.For these sequences, the background was sufficiently
homogeneous (e.g., dirt roads, parking lots, grassy fields)
for this method to work. For the other sequences (taken
with a static camera), the background was segmented as
described in [6].The airborne video in Fig. 15 was recorded from a Sony
XC-999 camera (640� 240 at 30fps) at an altitude of about
1,500 feet. There is significant motion blur due to a slow
shutter speed and fast camera motion. Additional noise is
induced by the analog capture of the video from duplicated
SVHS tape. Fig. 15 shows a person running across a parking
lot. The person is approximately 12� 7 pixels in size
(Fig. 16). The similarity plot in Fig. 17a shows a clearly
periodic motion, which corresponds to the person running.
Fig. 18 shows that the person is running with a frequency of
1.3Hz; the second peak at 2.6Hz is due to the symmetry of
the human motion described in Section 4.2. The autocorre-
lation of S0 is shown in Fig. 17b. Fig. 19b shows the
similarity plot for the vehicle in Fig. 19a, which has no
periodicity. The spectral power for the vehicle (Fig. 20b) is
flat. The autocorrelation of S0 has only 2 peaks (Fig. 20a).
CUTLER AND DAVIS: ROBUST REAL-TIME PERIODIC MOTION DETECTION, ANALYSIS, AND APPLICATIONS 793
Fig. 23. (a) Frame 100 from a low contrast 200 frame sequence; the subject (marked with a white arrow) puts his hands in his pockets halfway
through the sequence. (b) Similarity plot of the lower 40 percent of the body. (c) Similarity plot of the upper 60 percent of the body. The periodicity
ceases after the middle of the sequence.
The results of the classifications are shown in Table 1.The thresholds used for the lattice matching are those givenin Section 3.4. Each sequence is 100 images (30 fps); a lagtime of 30 images (1 second) is used to compute A.
4.5 Counting People
Another common task in an automated surveillance systemis to count the number of people entering and leaving anarea. This task is difficult since, when people are close toeach other, it is not always simple to distinguish theindividuals. For example, Fig. 21a is a frame from anairborne video sequence that shows three people runningalong a road and the result of the motion segmentation(Fig. 21b). Simple motion blob counting will give aninaccurate estimate of the number of people. However, ifwe know the approximate location of the airplane (via GPS)and have an approximate site model (a ground plane), wecan estimate what the expected image size of an ªaverageºperson should be. This size is used to window a region withmotion for periodic detection. In this example, threenonoverlapping windows were found to have periodicmotion, each corresponding to a person. The similarity plotsand spectral powers are shown in Fig. 22.
The similarity plots in Fig. 22 can also be used to extractthe phase angle of the running person. The phase angle isencoded in the position of the cross diagonals of S0. In thisexample, the phase angles are all significantly differentfrom one another, giving further evidence that we have notover counted the number of people.
4.6 Simple Event Detection
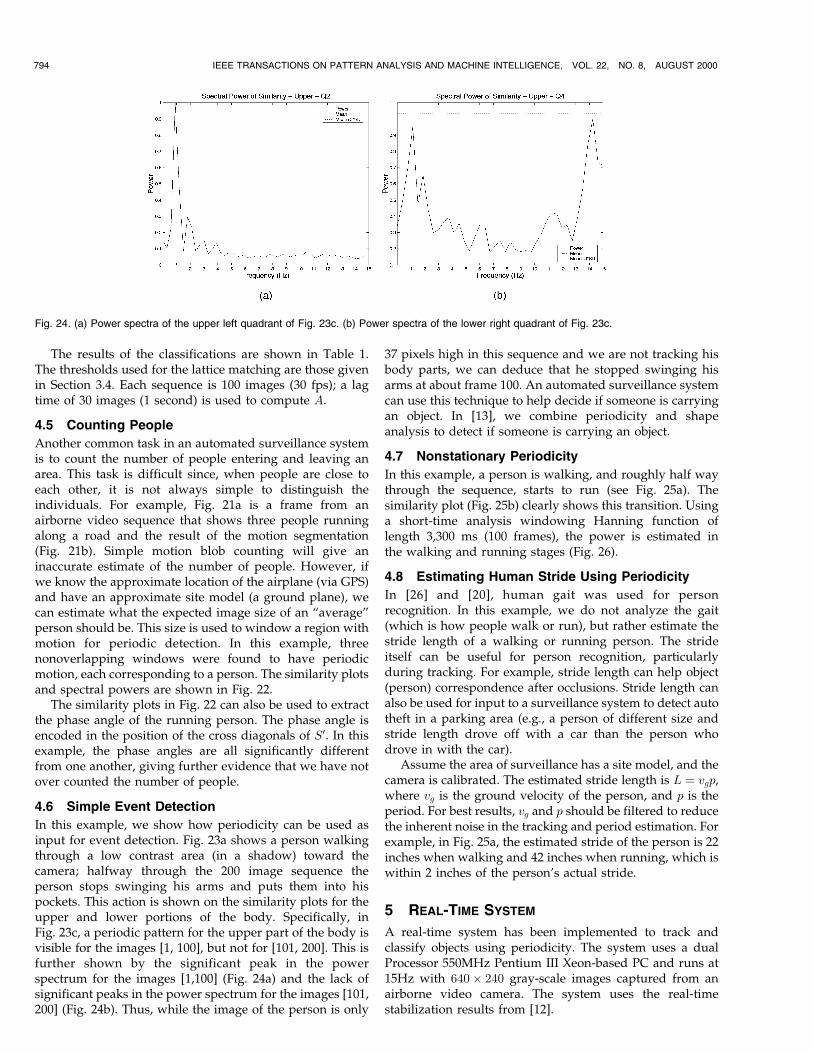
In this example, we show how periodicity can be used asinput for event detection. Fig. 23a shows a person walkingthrough a low contrast area (in a shadow) toward thecamera; halfway through the 200 image sequence theperson stops swinging his arms and puts them into hispockets. This action is shown on the similarity plots for theupper and lower portions of the body. Specifically, inFig. 23c, a periodic pattern for the upper part of the body isvisible for the images [1, 100], but not for [101, 200]. This isfurther shown by the significant peak in the powerspectrum for the images [1,100] (Fig. 24a) and the lack ofsignificant peaks in the power spectrum for the images [101,200] (Fig. 24b). Thus, while the image of the person is only
37 pixels high in this sequence and we are not tracking hisbody parts, we can deduce that he stopped swinging hisarms at about frame 100. An automated surveillance systemcan use this technique to help decide if someone is carryingan object. In [13], we combine periodicity and shapeanalysis to detect if someone is carrying an object.
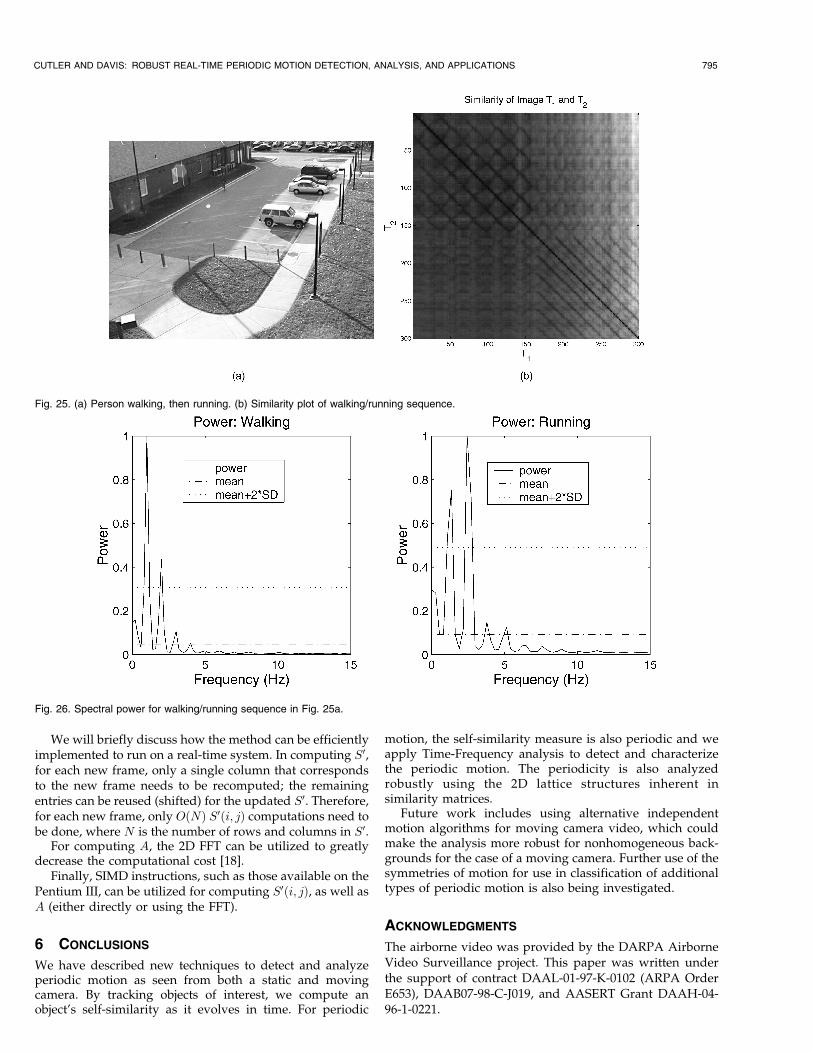
4.7 Nonstationary Periodicity
In this example, a person is walking, and roughly half waythrough the sequence, starts to run (see Fig. 25a). Thesimilarity plot (Fig. 25b) clearly shows this transition. Usinga short-time analysis windowing Hanning function oflength 3,300 ms (100 frames), the power is estimated inthe walking and running stages (Fig. 26).
4.8 Estimating Human Stride Using Periodicity
In [26] and [20], human gait was used for personrecognition. In this example, we do not analyze the gait(which is how people walk or run), but rather estimate thestride length of a walking or running person. The strideitself can be useful for person recognition, particularlyduring tracking. For example, stride length can help object(person) correspondence after occlusions. Stride length canalso be used for input to a surveillance system to detect autotheft in a parking area (e.g., a person of different size andstride length drove off with a car than the person whodrove in with the car).
Assume the area of surveillance has a site model, and thecamera is calibrated. The estimated stride length is L � vgp,where vg is the ground velocity of the person, and p is theperiod. For best results, vg and p should be filtered to reducethe inherent noise in the tracking and period estimation. Forexample, in Fig. 25a, the estimated stride of the person is 22inches when walking and 42 inches when running, which iswithin 2 inches of the person's actual stride.
5 REAL-TIME SYSTEM
A real-time system has been implemented to track andclassify objects using periodicity. The system uses a dualProcessor 550MHz Pentium III Xeon-based PC and runs at15Hz with 640� 240 gray-scale images captured from anairborne video camera. The system uses the real-timestabilization results from [12].
794 IEEE TRANSACTIONS ON PATTERN ANALYSIS AND MACHINE INTELLIGENCE, VOL. 22, NO. 8, AUGUST 2000
Fig. 24. (a) Power spectra of the upper left quadrant of Fig. 23c. (b) Power spectra of the lower right quadrant of Fig. 23c.
We will briefly discuss how the method can be efficientlyimplemented to run on a real-time system. In computing S0,for each new frame, only a single column that correspondsto the new frame needs to be recomputed; the remainingentries can be reused (shifted) for the updated S0. Therefore,for each new frame, only O�N� S0�i; j� computations need tobe done, where N is the number of rows and columns in S0.
For computing A, the 2D FFT can be utilized to greatlydecrease the computational cost [18].
Finally, SIMD instructions, such as those available on thePentium III, can be utilized for computing S0�i; j�, as well asA (either directly or using the FFT).
6 CONCLUSIONS
We have described new techniques to detect and analyzeperiodic motion as seen from both a static and movingcamera. By tracking objects of interest, we compute anobject's self-similarity as it evolves in time. For periodic
motion, the self-similarity measure is also periodic and weapply Time-Frequency analysis to detect and characterizethe periodic motion. The periodicity is also analyzedrobustly using the 2D lattice structures inherent insimilarity matrices.
Future work includes using alternative independentmotion algorithms for moving camera video, which couldmake the analysis more robust for nonhomogeneous back-grounds for the case of a moving camera. Further use of thesymmetries of motion for use in classification of additionaltypes of periodic motion is also being investigated.
ACKNOWLEDGMENTS
The airborne video was provided by the DARPA AirborneVideo Surveillance project. This paper was written underthe support of contract DAAL-01-97-K-0102 (ARPA OrderE653), DAAB07-98-C-J019, and AASERT Grant DAAH-04-96-1-0221.
CUTLER AND DAVIS: ROBUST REAL-TIME PERIODIC MOTION DETECTION, ANALYSIS, AND APPLICATIONS 795
Fig. 26. Spectral power for walking/running sequence in Fig. 25a.
Fig. 25. (a) Person walking, then running. (b) Similarity plot of walking/running sequence.
REFERENCES
[1] M. Allmen, ªImage Sequence Description Using SpatiotemporalFlow Curves: Toward Motion-Based Recognition,º PhD thesis,Univ. of Wisconsin, Madison, 1991.
[2] D.H. Ballard and M.J. Swain, ªColor Indexing,º Int'l J. ComputerVision, vol. 7, no. 1, 11-32, 1991.
[3] P. Brockwell and R. Davis, Time Series: Theory and Methods.Spinger-Verlag, 1987.
[4] M. Casdagli, ªRecurrence Plots Revisited,º Physica D, vol. 108,pp. 12-44, 1997.
[5] C.J. Cohen, L. Conway, and D. Koditschek, ªDynamic SystemRepresentation, Generation, and Recognition of Basic OscillatoryMotion Gestures,º Proc. IEEE Int'l Conf. Automatic Face and GestureRecognition, 1996.
[6] R. Cutler and L. Davis, ªView-Based Detection and Analysis ofPeriodic Motion,º Proc. Int'l Conf. Pattern Recognition, p. SA14,Aug. 1998.
[7] R. Cutler and L. Davis, ªReal-Time Periodic Motion Detection,Analysis, and Applications,º Proc. Computer Vision and PatternRecognition, pp. 326-332, June 1999.
[8] P. Eckmann, S.O. Kamphorst, and D. Ruelle, ªRecurrence Plots ofDynamical Systems,º J. Europhysics Letters, vol. 4, pp. 973-977,1987.
[9] J. Emmerton, ªThe Pigeon's Discrimination of Movement Patterns(Lissajous Figures) and Contour-Dependent Rotational Invar-iance,º Perception, vol. 15, no. 5, pp. 573-588, 1986.
[10] H. Fujiyoshi and A. Lipton, ªReal-Time Human Motion Analysisby Image Skeletonization,º Proc. IEEE Workshop Applications ofComputer Vision, p. session 1A, Oct. 1998.
[11] N. Goddard, ªThe Interpretation of Visual Motion: RecognizingMoving Light Displays,º Proc. IEEE Workshop Motion, pp. 212-220,Mar. 1989.
[12] M. Hansen, P. Anandan, K. Dana, G. van der Wal, and P. Burt,ªReal-Time Scene Stabilization and Mosaic Construction,º Proc.DARPA Image Understanding Workshop, pp. 457-465, Nov. 1994.
[13] I. Haritaoglu, R. Cutler, D. Harwood, and L. Davis, ªBackpack:Detection of People Carrying Objects Using Silhouettes,º Proc.Int'l Conf. Computer Vision, pp. 102-107, 1999.
[14] B. Heisele and C. Wohler, ªMotion-Based Recognition ofPedestrians,º Proc. Int'l Conf. Pattern Recognition, Aug. 1998.
[15] D. Huttenlocher, G.A. Klanderman, and W. Rucklidge, ªCompar-ing Images Using the Hausdorff Distance,º IEEE Trans. PatternAnalysis and Machine Intelligence, vol. 15, no. 9, pp. 805-863, Sept.1993.
[16] G. Johansson, ªVisual Motion Perception,º Scientific Am., vol. 232,pp. 75-88, June 1976.
[17] R. Kern, ªVisual Position Stabilization in the Hummingbird HawkMoth, Macroglossum Stellatarum L. I. Behavioural Analysis,ºJ. Computer Physiology A, vol. 182, no. 2, pp. 225-237, 1998.
[18] J.P. Lewis, ªFast Normalized Cross-Correlation,º Vision Interface,1995.
[19] H.-C. Lin, L.-L. Wang, and S.-N. Yang, ªExtracting Periodicity of aRegular Texture Based on Autocorrelation Functions,º PatternRecognition Letters, vol. 18, pp. 433-443, 1997.
[20] J. Little and J. Boyd, ªRecognizing People by Their Gate: TheShape of Motion,º Videre, vol. 1, no. 2, 1998.
[21] F. Liu and R. Picard, ªFinding Periodicity in Space and Time,ºProc. Int'l Conf. Computer Vision, pp. 376-383, Jan. 1998.
[22] J. Marion, Classical Dynamics of Particles and Systems. AcademicPress, 1970.
[23] G. McGuire, N.B. Azar, and M. Shelhamer, ªRecurrence Matricesand the Preservation of Dynamical Properties,º Physics Letters A,vol. 237, pp. 43-47, 1997.
[24] T.A. McMahon, Muscles, Reflexes, and Locomotion. Princeton Univ.Press, 1984.
[25] D. McReynolds and D. Lowe, ªRigidity Checking of 3D PointCorrespondences Under Perspective Projection,º IEEE Trans.Pattern Analysis and Machine Intelligence, vol. 18, no. 12, pp. 1,174-1,185, 1996.
[26] S. Niyogi and E. Adelson, ªAnalyzing and Recognizing WalkingFigures in XYT,º Proc. Int'l Conf. Computer Vision and PatternRecognition, pp. 469-474, Dec. 1994.
[27] S. Niyogi and E. Adelson, ªAnalyzing Gait with SpatiotemporalSurfaces,º Proc. IEEE Workshop Motion of Non-Rigid and ArticulatedObjects, pp. 64-69, 1994.
[28] A. Oppenheim and R. Schafer, Discrete-Time Signal Processing.Prentice Hall, 1989.
[29] D.B. Percival, ªHarmonic Analysis,º Spectral Analysis for PhysicalApplications: Multitaper and Conventional Univariate Techniques.Cambridge Univ. Press, 1993.
[30] R. Polana and R. Nelson, ªDetection and Recognition of Periodic,Non-Rigid Motion,º Int'l J. Computer Vision, vol. 23, no. 3, pp. 261-282, June/July 1997.
[31] W. Press, S. Teukolsky, W. Vetterling, and B. Flannery, NumericalRecipes in C. Cambridge Univ. Press, 1988.
[32] D. Schumacher, ªGeneral Filtered Image Rescaling,º GraphicsGems III, D. Kirk, ed. Harcourt Brace Jovanovich, 1992.
[33] S.M. Seitz and C.R. Dyer, ªView-Invariant Analysis of CyclicMotion,º Int'l J. Computer Vision, vol. 25, no. 3, pp. 1-23, 1997.
[34] A. Selinger and L. Wixson, ªClassifying Moving Objects as Rigidor Non-Rigid without Correspondences,º Proc. DARPA ImageUnderstanding Workshop, pp. 341-347, Nov. 1998.
[35] P. Tsai, M. Shah, K. Keiter, and T. Kasparis, ªCyclic MotionDetection for Motion Based Recognition,º Pattern Recognition,vol. 27, no. 12, pp. 1,591-1,603, 1994.
[36] H. Weyl, Symmetry. Princeton Univ. Press, 1952.
Ross Cutler received BS degrees in mathe-matics, computer science, and physics in 1992.The MS degree in computer science in 1996 andthe PhD degree in computer science in 2000from the University of Maryland, College Park.His research interests include motion-basedrecognition, motion segmentation, HCI, videoindexing, multimedia databases, gesture recog-nition, augmented reality, and real-time systems.He is currently a faculty research assistant in the
University of Maryland Institute of Advanced Computer Studies. He haspreviously been employed at Johns Hopkins University (research staff inneurology/neurosurgery), and has consulted for Microsoft Research,Emory University, the University of Pennsylvania, and Scientech Inc.
Larry S. Davis received the BA degree fromColgate University in 1970, the MS, and PhDdegrees in computer science from the Universityof Maryland in 1974 and 1976, respectively.From 1977-1981, he was an assistant professorin the Department of Computer Science at theUniversity of Texas, Austin. He returned to theUniversity of Maryland as an associate professorin 1981. From 1985-1994, he was the director ofthe University of Maryland Institute for Advanced
Computer Studies. He is currently a professor in the Institute and theComputer Science Department, as well as acting chair of the ComputerScience Department. He was named a fellow of the IEEE in 1997.Dr. Davis is known for his research in computer vision and highperformance computing. He has published more than 75 papers injournals and has supervised more than 12 PhD students. He is anassociate editor of the International Journal of Computer Vision and anarea editor for Computer Models for Image Processor: Image Under-standing. He has served as program or general chair for most of thefield's major conferences and workshops, including the Fifth Interna-tional Conference on Computer Vision, the field's leading internationalconference.
796 IEEE TRANSACTIONS ON PATTERN ANALYSIS AND MACHINE INTELLIGENCE, VOL. 22, NO. 8, AUGUST 2000