Embed Size (px)
Citation preview

Psychological Test and Assessment Modeling, Volume 55, 2013 (1), 39-61
Robustness and power of the parametric t test and the nonparametric Wilcoxon test under non-independence of observations Wolfgang Wiedermann1 & Alexander von Eye2
Abstract A large part of previous work dealt with the robustness of parametric significance tests against non-normality, heteroscedasticity, or a combination of both. The behavior of tests under violations of the independence assumption received comparatively less attention. Therefore, in applications, researches may overlook that robustness and power properties of tests can vary with the sign and the magnitude of the correlation between samples. The common paired t test is known to be less powerful in cases of negative between-group correlations. In this case, Bortz and Schuster (2010) recommend the application of the nonparametric Wilcoxon test. Using Monte-Carlo simulations, we analyzed the behavior of the t- and the Wilcoxon tests for the one- and two-sample problem under various degrees of positive and negative correlations, population distributions, sample sizes, and true differences in location. It is shown that already minimal departures from independence heavily affect Type I error rates of the two-sample tests. In addition, results for the one-sample tests clearly suggest that the sign of the underlying correlation cannot be used as a basis to decide whether to use the t test or the Wilcoxon test. Both tests show a dramatic power loss when samples are negatively correlated. Finally, in these cases, the well-known power advantage of the Wilcoxon test diminishes when distributions are skewed and samples are small.
Key words: robustness, power, independence assumption, t test, Wilcoxon test
1 Correspondence concerning this article should be addressed to: Wolfgang Wiedermann, PhD, Univer-sity of Vienna, Unit of Research Methods, Liebiggasse 5, A-1010 Vienna, Austria; email: [email protected] 2 University of Vienna, Department of Psychology

W. Wiedermann & A. von Eye 40
s-tical inference about differences in means ( t test), a good deal of research fo-cused on the properties of the t statistic. When the assumptions of normality, homosce-
-sample t test was shown to be the optimal procedure for the comparison of means from independent sam-ples (Hodges & Lehmann, 1956; Randles & Wolfe, 1979). However, in empirical data, violations of one or more assumptions might exist, and robustness properties of signifi-cance tests are of great interest. Early theoretical findings suggest that the two-sample t test is fairly robust against violations of the normality assumption (e.g., Bartlett, 1935). This result was confirmed in numerous simulation studies (e.g., Borneau, 1960; Neave & Granger, 1968; Posten, 1978, 1984; Rasch & Guiard, 2004). Although the two-sample t test is able to protect the nomi -normality, considerable evidence exists that the nonparametric Wilcoxon-Mann-Whitney U test is robust and even more powerful under various non-normal distributions (Hodges & Lehmann, 1956; Neave & Granger, 1968; Randles & Wolfe, 1979). In addition, it has been demonstrated that the two-sample t test is robust against violations of equality of variances when sam-ple sizes are equal (e.g., Hsu, 1938; Scheffè, 1970; Posten, Yeh & Owen, 1982, Tuchscherer & Pierer, 1985; Zimmerman, 2006). When both, variances and sample sizes are unequal, the probability of the Type I error exceeds the nominal significance level if the larger variance is associated with the smaller sample size, and vice versa (Moder, 2010; Wiedermann & Alexandrow t test (Welch, 1938, 1947) is recommended as an adequate alternative (see also a recent reminder of Rasch, Kubinger & Moder, 2011). Although it is well known that the two-sample t test assumes independent observations, less attention has been paid to non-independence. Here, the distinction of between-group and within-group dependency has to be made. Between-group dependence refers to the fact that observations of two samples are correlated (for example, data obtained from a matched samples design or repeated observations). For the analysis of repeated meas-
-that only one sample of research units is drawn from the underlying population of inter-est and the construct of interest is measured repeatedly (for details see Rasch, Kubinger & Yanagida, 2011). In contrast, within-group dependence means that scores are correlat-ed with other scores within the same group (for example, if subjects influence each oth-
error rates of the two-sample t test are strongly affected. It is important to note that the different types of dependencies can have different effects on the behavior of parametric significance tests. For positive between-group correlations (e.g., higher scores in a base-line assessment are associated with higher scores in a follow-up assessment), the proba-bility of a Type I error falls below the nominal significance level. In contrast, positive within-group correlations (e.g., higher scores obtained in a subset of the sample are asso-ciated with higher scores in another subset of the same sample) increase the Type I error rates (Cochran, 1947; Lissitz & Chardos, 1975; Zimmerman, Williams & Zumbo, 1993; Zimmerman, 1997). Paired data (i.e., data exhibiting a non-zero between-group correla-tion) can easily be analyzed using statistical tests developed for the one-sample problem. Given that difference scores follow a normal distribution, the paired t test (essentially a

Robustness and power of the parametric t test ... 41
one-sample t test performed on differences of sample values) is the optimal significance test (Hodges & Lehmann, 1956; Randles & Wolfe, 1979). Several studies have shown that the paired t test is highly robust against violations of the normality assumption with respect to the Type I error (e.g., Herrendörfer, Rasch & Feige, 1983; Posten, 1979; Rasch & Guiard, 2004). However, for various non-normal densities, the nonparametric Wilcoxon-matched-pairs-signed-ranks test has proven to be robust and more powerful (Blair & Higgins, 1985). It is important to note that, although these test statistics were developed for paired data, the tests still assume independent observations within samples. Previous studies reported heavily biased Type I error rates in cases where observations systematically carry information about other observations (Chlaß & Krüger, 2007; Guiard & Rasch, 2004; von Eye, 1983, 2004). The present study focuses on between-group dependencies. In practical data analysis, researchers may overlook that negative between-group correla-tions can have different effects on both two-sample and one-sample tests than positive between-group correlations. Only few studies analyzed the behavior of significance tests considering positive as well as negative correlations (for an exception see Zimmerman, 1997, 2012). This seems surprising considering that the occurrence of negative between-group correlations may be a common result of matching pairs. To give an example, Hays (1994) states that personality dominance of married couples might be negatively corre-lated, if highly dominant women tend to marry men with lower tendencies for dominance and vice versa. In this article, we ask questions concerning the consequences of negative between-group correlations. Bortz and Schuster (2007) indicate that the paired t test is less powerful under negative correlations, which is in line with simulation results of Zimmerman (1997). The authors recommend using the nonparametric Wilcoxon test instead (Bortz & Schuster, 2007, p. 125). The current study aims to systematically investigate the behavior of the parametric t- and the nonparametric Wilcoxon tests, developed for the one- and the two-sample problems, under various degrees of positive and negative between-group correlation, various sample sizes, and various distributions. It will be shown that these tests perform virtually identically with respect to the power to detect true differences between samples.
Methods
In this article, we report results from a Monte-Carlo study in which we focus on dependen-cies between groups (e.g., matched pairs or repeated observations). To perform the simula-tions, a program was written using the R statistical environment (R Core Team, 2012) that varied four factors: Between- n), and difference in means (µ1 µ2). The following sections describe the factors in detail. Between-group correlation. To mimic violations of the between-group independence assumption, correlations between two samples y1 and y2 induced by adding a multiple of one random variate to another. The multiplicative con-stant c was chosen to obtain the desired correlation. Let y1, y2, and z be independent

W. Wiedermann & A. von Eye 42
standard normally distributed variables with zero means and unit variances. If
(1
c , 11 21
y czxc
and 22 2
1
y czxc
follow a standard normal distribution
with a between- m-
was invoked and then the scores of x1 were multiplied by ( 1). Type of distribution. N(0,1) distributed variables were generated using the Ziggurat method of Marsaglia and Tsang (2000). Next, the normal variates were transformed to simulate various non-normal distributions. The following four non-normal shapes were realized (see, for example, Evans, Hastings & Peacock, 2000):
Uniform distribution: Uniformly distributed variates were generated using a proba-
bility integral transformation: '2 '1 exp / 22
x
u F x x dx , where x and F
denote the standard normally distributed random variable and the cumulative distri-bution function of the standard normal distribution, respectively. Resulting variates are expected to exhibit a skewness of 0 and kurtosis of 1.8.
Logistic distribution: Uniformly distributed variates (u) were transformed using log / (1 )x u u and are expected to show a skewness of 0 and a kurtosis of 4.2.
Gumbel distribution: Uniformly distributed variates were transformed using log logx u . The resulting distribution is expected to show an elevated skew-
ness and a kurtosis of 1.14 and 5.4, respectively. Exponential distribution: Exponentially distributed values were obtained applying
log 1x u and are expected to show a skewness of 2 and a kurtosis of 9.
Differences in means. To analyze Type I error rates as well as the power of the signifi-cance tests, constants were added to one sample to produce the following differences in means: µ1 µ2 = 0, 0.25, 0.50, 0.75. Sample size. The number of observations (n) varied from 30 to 250, in increments of 20. For each experimental cell of the 5 (distribution shapes) x 17 (correlation) x 12 (sample sizes) x 4 (differences in means) design 5000 repetitions were realized. In each repeti-tion, the samples x1 and x2 were evaluated using the two-sample t test, the (standard normal-approximated) Wilcoxon-Mann-Whitney U test, the paired t test, and the (stand-ard normal-approximated) Wilcoxon test. Thus, a total of 20,400,000 test statistics for each significance test were retained and further analyzed applying standard ANOVA techniques (for an example see, von Eye, 2004). All significance tests were performed non- . To evaluate the robust-ness of Type I error rates, a 20% rsignificance test is considered robust if the empirical Type I error rates do not exceed the interval 4 6%. The results presented in Figures 2 4 were obtained using 50,000 repe-titions. The implemented R program is freely available from the authors upon request.

Robustness and power of the parametric t test ... 43
Results
Type I error
Due to the large quantity of simulation outcomes, results of the Type I error simulation n = 30, 150, 250. Findings for the
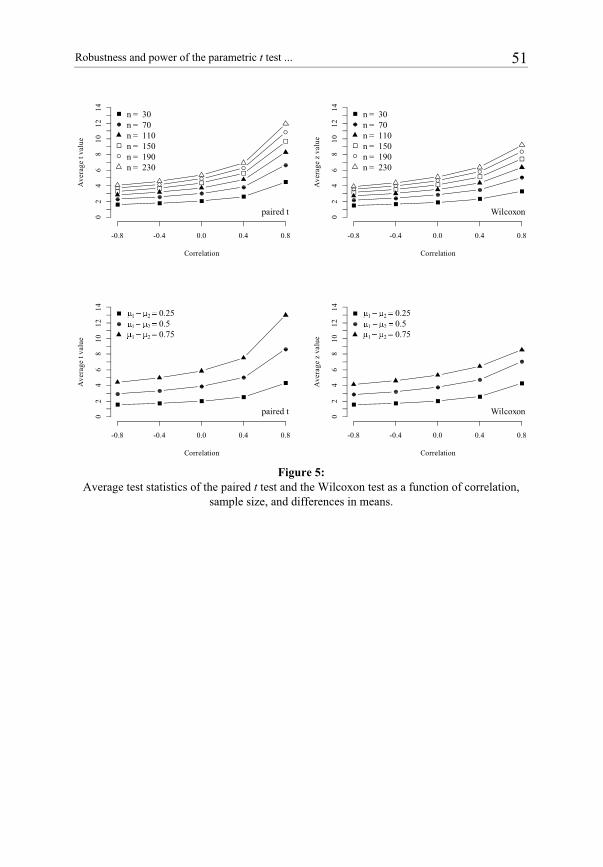
experimental conditions not shown here are very similar to the presented results and can be obtained from the authors upon request. Tables 1 and 23 show the Type I error rates of the four significance tests for the five distributions. Each entry gives the relative fre-quency of rejecting the null hypothesis. As expected, all tests are very well able to pro-
significance tests of the one-sample problem are able to keep Type I error rates close to the 5% level, also as ex-pected. In contrast, the test statistics of the two-sample procedures are heavily biased in these cases. Two different effects were observed depending on the sign of the population correlation. For negatively correlated samples, the probabilities of a Type I error are far above the nominal significance level for the two-sample t test and the U test. However, both tests become overly conservative for positively correlated samples (i.e., the Type I error rates fall far below 5%). Again, this holds for normal as well as for non-normal distributions. Figure 1 illustrates that the magnitude of these biases varies with the magnitude of the correlation. It can be seen that the percentiles of the two-sample t statistic are not inde-pendent of the level of population correlation which leads to biased decisions concerning the null hypothesis (Figure 1, left panel). In contrast, the t values of the paired t test are unaffected by the degree of correlation (Figure 1, right panel). To investigate the sensitivity of the simulated test statistics to the factors of the simula-tion, we employed ANOVAs. Table 3 summarizes the ANOVA results using the corre-sponding t and z values as dependent variables. Due to computational limits, the ANO-VAs were restricted to n n-crements of 0.4. Each of the 150 cells of the resulting 6 (sample size) x 5 (correlation) x 5 (distribution) design contains 5000 observations. Due to the large number of observa-
instead of p-values. In the analyses of the one-sample procedures, the source of variation explains virtually nothing of the variation in means of the simulated t and z distributions
t and z values remain unaffected by the simulation parameters. The ANOVA results for the two-sample tests suggest that the strength of correlation has the largest impact on the mean t and z values. R² estimates for the two-sample t and U test were 0.141 and 0.143, respec-tively. The remaining factors of the simulations did not affect the distributions of the test statistics.
3 See tables and figures at the end of this contribution.

W. Wiedermann & A. von Eye 44
Power
Tables 4 and 5 show the probabilities of rejecting the null hypothesis for a true effect of µ1 µ2 = 0.5 (representing the power of the significance tests) for n = 30, 50, and 70. Again, results for the experimental conditions not shown are quite similar to the present-ed findings. Results suggest that, first, the power of all significance tests increases with the sample size and the true mean difference, as expected. Second, for normal and uni-form deviates, the parametric procedures are generally more powerful than their nonpar-ametric counterparts. This pattern reverses for asymmetric distributions (Gumbel and exponential; see Table 5). In these cases, the U test is more powerful than the two-sample t test and the Wilcox-on test shows a power advantage over the paired t test. Furthermore, for the case of inde-
-sample t test is slightly more powerful than the paired t test. The same holds for the nonparametric procedures. Here, the U test consistently outperforms the Wilcoxon test. Comparing the power entries across the range of correla-tions implemented in the simulations, it becomes evident that the paired t test dramatical-ly loses power in case of negatively correlated samples. The magnitude of the power loss varies with the magnitude of the negative correlation and holds for all considered distri-butions. The power loss is less pronounced for large true differences in means and large sample sizes. However, these are cases for which Schuster and Bortz (2010) recommend using the Wilcoxon test. However, the inspection of the power functions of the Wilcoxon test reveals a very similar power loss. Figures 2 4 show comparisons of the power curves of the Wilcoxon test and the paired t test for the four non-normal distributions and µ1 µ2 = 0.25, 0.50, and 0.75, respectively. Each line represents the difference between the observed power curves based on 50,000 repetitions. Values above zero indicate a power advantage of the Wilcoxon test, values below zero indicate a power advantage of the paired t test. Apparently, the power superiority of the Wilcoxon tests depends on type of distribution, degree of correlation, sample size, and true underlying effect size. For uniformly distributed populations, the well-known power advantage of the paired t test is
more powerful than the paired t test. However, this power advantage decreases for strong positive correlations. For asymmetric distributions, the power differences tend to follow an inversely U-shaped curve. This implies that the advantage of the Wilcoxon test is more pronounced for moderately correlated samples. Most important is that the power advantage of the Wilcoxon test diminishes for negatively correlated samples. Finally, to further explore the sensitivity of the simulated test statistics, ANOVAs were performed. Table 6 shows the ANOVA results for the power simulation again using the t and z values as dependent variables. ANOVAs were restricted to a 6 (sample size: n =
(effect size: µ1 µ2 = 0.25, 0.50, 0.75) design. Again, each of the 450 cells contained 5000 observations. Model fit estimates varied from R² = 0.79 to 0.90 depending on the significance test analyzed (see Table 6). Again, due to the large number of observations for each cell, we
p-values. As expected, the strongest effects result

Robustness and power of the parametric t test ... 45
for sample size (partial 1 µ2
and, only for the one-Average t and z values increase with the correlation between the two variables, the sam-ple size, and the mean differences. In addition, the mean difference significantly interacts
0.23). The analyses of the test statistics of the paired t test and Wilcoxon test further
see Table 6). Figure 5 shows the average t and z values for the interaction effects. Appar-ently, test statistics of the paired t test and the Wilcoxon test increase with sample size and mean difference. This effect is even more pronounced for high positive correlations.
Discussion
Numerous previous studies dealt with robustness and power properties of parametric and nonparametric tests under non-normality, heterogeneity of variances, or a combination of both. Comparatively less attention has been paid to the behavior of the significance tests in cases where independence assumptions are violated (cf. von Eye, 2004). In particular, negative correlations seem underresearched. For a recently published exception see Zimmerman (2012). However, those parts of Zimmernegative correlations were restricted to normally distributed populations and sample sizes of 20, 25, 100, and 400. Furthermore, the study only focused on parametric signifi-cance tests. Using a more complex simulation design, the current study aimed at a more systematic evaluation of parametric and nonparametric tests developed for the one- as well as the two-sample problem under various degrees of negative and positive correla-tions, distribution shapes, sample sizes, and true differences in means. Several conclusions can be drawn from the present results: First, as expected, those significance tests originally developed for the two-sample problem produce seriously biased decisions concerning the null hypothesis when samples are correlated. These results replicate earlier findings (e.g., Zimmerman et al., 1993). For example, even the
0.1 between normally distributed samples produced Type I error rates which were outside the chosen robustness interval of 4 6%. This holds for both, the two-sample t test and the nonparametric U test, and implies that even modest departures from independence can make results of these tests hard to interpret. In addi-tion, whether these tests are too liberal or too stringent depends on the sign of the popula-tion correlation, which is also in accordance with previous studies (Zimmerman, 1997, 2012). In contrast, the significance tests developed for the one-sample problem kept the nominal
over the entire range of the simulated correlations. We conclude that both procedures, the paired t test and the Wilcoxon test, have nonparametric properties with respect to between-group correlation. However, it is important to note that the tests still rely on the assumption of within-group independence. The nonparametric property of the paired t test does not hold for within-group correlations. Von Eye (1983, 2004)

W. Wiedermann & A. von Eye 46
found that the Type I error rates of the one-sample t test are far above (below) the nomi-nal significance level in cases of positive (negative) within-group correlations. Quite similar results were observed for the Wilcoxon test (Chlaß & Krüger, 2007).
1 2 > 0 the two-sample t test constantly outperforms the paired t test because the two-sample t test employs 2n 2 degrees of freedom instead of n 1 degrees of freedom of the paired t test. A quite simi-lar effect can be observed for the U test and the Wilcoxon test which can be explained by the different ranking approaches and resulting number of possible ranks. The Wilcoxon test computes n signed ranks of difference scores. In contrast, the U n possible ranks to the original scores, which increases the sensitivity for true differences (Iman, Hora & Conover, 1984). The power superiority of the U test might be better un-derstood from the perspective of rank transformation theory (Conover & Iman, 1981). It can be shown that various nonparametric tests are asymptotically equivalent to the corre-sponding parametric tests performed on ranks replacing the original scores. Thus, the Wilcoxon test and the paired t test, performed on signed ranks replacing difference scores, will suggest equivalent statistical decisions. Similarly, the two sample t test, performed on ranks, only rejects the null hypothesis when the U test does. Hence, the explanation based on differences in degrees of freedom holds for the nonparametric procedures as well. Third, the ANOVA results for the power simulation suggest that the power of the paired t test heavily depends on the true differences in means and the strength of correlation which is in line with previous results (e.g., Zimmerman, 1997). The latter can be ex-plained by the fact that the variance of differences is defined as
2 2 21 2 1 22 ( , )d cov x x , where 2
1 and 22 denote the variances of x1 and x2, and
1 2( , )cov x x denotes the covariance term of x1 and x2 (Hays, 1994). Thus, a strong positive relationship (i.e., a rather large covariance term) reduces the standard error of differ-ences. In contrast, high negative correlations lead to rather large standard errors, which in turn lead to a loss in power to detect true differences. In these cases, Bortz and Schus-ter (2010) argue that the Wilcoxon test should be applied instead. The current results take exception to this recommendation. The simulated power functions of the Wilcoxon test show that the procedure also loses power when between correlations are negative. The inspection of Figures 2 4 shows that the power loss can sometimes be even greater than that of the paired t test. As a consequence, for uniformly distributed samples, the power advantage of the paired t test is even more pronounced than for negatively correlated samples. Furthermore, the well-known power superiority of the Wilcoxon test for skewed densities (cf. Blair & Higgin, 1985) diminishes for strong negative correlations in smaller samples. Therefore, researchers should not use the direction of correlation as a basis for choosing between the two procedures.
Finally, we hope that the insights from the current study might help to further improve already excellent introductory textbooks to statistics such as the one by Schuster and Bortz (2010). In addition, we would like to encourage future research on a family of significance tests developed by Zimmerman (2005, 2012), which currently seems to receive less attention in the social sciences. The basic idea behind these tests is to apply a modified version of the two-sample t test with a corrective term to account for the ob-

Robustness and power of the parametric t test ... 47
served correlation between samples. The use of the corrective term seems to successfully resolve the problem of distorted Type I error rates. In addition, this modified two-sample t test shows a power advantage over the paired t test under several correlation scenarios due to the larger number of degrees of freedom. For a discussion concerning the larger number of degrees of freedom see also Wiedermann & Alexandrowicz (2011).
Acknowledgment
The authors are indebted to Rainer Alexandrowicz and Ingrid Koller for helpful discus-sions of earlier versions of this article.
Figures and tables
Figure 1:
Probability plots for the simulated t distributions as a function of population correlation.
-4 -2 0 2 4
-4-2
02
4
Normal Distribution
Observed values for t (n = 30)
Expe
cted
val
ues f
or t
(n =
30)
0.80.60.40.2
00.20.40.60.8
two-sample t
-4 -2 0 2 4
-4-2
02
4Normal Distribution
Observed values for t (n = 30)
Expe
cted
val
ues f
or t
(n =
30)

W. Wiedermann & A. von Eye 48
Figure 2:
Differences in empirical power values between the Wilcoxon test and the paired t test as a function of population correlation for non-normal distributions ( 1 2 = 0.25).
Uniform Distribution
Correlation
Pow
er d
iffer
ence
(Wilc
oxon
- pa
ired
t)
-0.8 -0.6 -0.4 -0.2 0.0 0.2 0.4 0.6 0.8
-0.2
-0.1
0.0
0.1
0.2
n = 30n = 50n = 701 2 0.25
Logistic Distribution
Correlation
Pow
er d
iffer
ence
(Wilc
oxon
- pa
ired
t)
-0.8 -0.6 -0.4 -0.2 0.0 0.2 0.4 0.6 0.8
-0.2
-0.1
0.0
0.1
0.2
n = 30n = 50n = 701 2 0.25
Gumbel Distribution
Correlation
Pow
er d
iffer
ence
(Wilc
oxon
- pa
ired
t)
-0.8 -0.6 -0.4 -0.2 0.0 0.2 0.4 0.6 0.8
-0.2
-0.1
0.0
0.1
0.2
n = 30n = 50n = 701 2 0.25
Exponential Distribution
Correlation
Pow
er d
iffer
ence
(Wilc
oxon
- pa
ired
t)
-0.8 -0.6 -0.4 -0.2 0.0 0.2 0.4 0.6 0.8
-0.2
-0.1
0.0
0.1
0.2
n = 30n = 50n = 701 2 0.25

Robustness and power of the parametric t test ... 49
Figure 3:
Differences in empirical power values between the Wilcoxon test and the paired t test as a function of population correlation for non-normal distribut 1 2 = 0.50).
Uniform Distribution
Correlation
Pow
er d
iffer
ence
(Wilc
oxon
- pa
ired
t)
-0.8 -0.6 -0.4 -0.2 0.0 0.2 0.4 0.6 0.8
-0.1
5-0
.10
-0.0
50.
000.
050.
100.
15
n = 30n = 50n = 701 2 0.5
Logistic Distribution
Correlation
Pow
er d
iffer
ence
(Wilc
oxon
- pa
ired
t)
-0.8 -0.6 -0.4 -0.2 0.0 0.2 0.4 0.6 0.8
-0.1
5-0
.10
-0.0
50.
000.
050.
100.
15
n = 30n = 50n = 701 2 0.5
Gumbel Distribution
Correlation
Pow
er d
iffer
ence
(Wilc
oxon
- pa
ired
t)
-0.8 -0.6 -0.4 -0.2 0.0 0.2 0.4 0.6 0.8
-0.1
5-0
.10
-0.0
50.
000.
050.
100.
15
n = 30n = 50n = 701 2 0.5
Exponential Distribution
Correlation
Pow
er d
iffer
ence
(Wilc
oxon
- pa
ired
t)
-0.8 -0.6 -0.4 -0.2 0.0 0.2 0.4 0.6 0.8
-0.1
5-0
.10
-0.0
50.
000.
050.
100.
15
n = 30n = 50n = 701 2 0.5

W. Wiedermann & A. von Eye 50
Figure 4:
Differences in empirical power values between the Wilcoxon test and the paired t test as a function of population correlation for non- 1 2 = 0.75).
Uniform Distribution
Correlation
Pow
er d
iffer
ence
(Wilc
oxon
- pa
ired
t)
-0.8 -0.6 -0.4 -0.2 0.0 0.2 0.4 0.6 0.8
-0.1
5-0
.10
-0.0
50.
000.
050.
100.
15
n = 30n = 50n = 701 2 0.75
Logistic Distribution
Correlation
Pow
er d
iffer
ence
(Wilc
oxon
- pa
ired
t)
-0.8 -0.6 -0.4 -0.2 0.0 0.2 0.4 0.6 0.8
-0.1
5-0
.10
-0.0
50.
000.
050.
100.
15
n = 30n = 50n = 701 2 0.75
Gumbel Distribution
Correlation
Pow
er d
iffer
ence
(Wilc
oxon
- pa
ired
t)
-0.8 -0.6 -0.4 -0.2 0.0 0.2 0.4 0.6 0.8
-0.1
5-0
.10
-0.0
50.
000.
050.
100.
15
n = 30n = 50n = 701 2 0.75
Exponential Distribution
Correlation
Pow
er d
iffer
ence
(Wilc
oxon
- pa
ired
t)
-0.8 -0.6 -0.4 -0.2 0.0 0.2 0.4 0.6 0.8
-0.1
5-0
.10
-0.0
50.
000.
050.
100.
15
n = 30n = 50n = 701 2 0.75
Robustness and power of the parametric t test ... 51
Figure 5:
Average test statistics of the paired t test and the Wilcoxon test as a function of correlation, sample size, and differences in means.
Correlation
Ave
rage
t va
lue
-0.8 -0.4 0.0 0.4 0.8
02
46
810
1214 n = 30
n = 70n = 110n = 150n = 190n = 230
paired t
Correlation
Ave
rage
z v
alue
-0.8 -0.4 0.0 0.4 0.8
02
46
810
1214 n = 30
n = 70n = 110n = 150n = 190n = 230
Wilcoxon
Correlation
Ave
rage
t va
lue
-0.8 -0.4 0.0 0.4 0.8
02
46
810
1214
1 2 0.251 2 0.51 2 0.75
paired t
Correlation
Ave
rage
z v
alue
-0.8 -0.4 0.0 0.4 0.8
02
46
810
1214
1 2 0.251 2 0.51 2 0.75
Wilcoxon
W. Wiedermann & A. von Eye 52
Table 1: Type I error rates for symmetric population shapes ( = correlation, t = two-sample t test,
paired t = paired t test, U = Wilcoxon-Mann-Whitney U test, W = Wilcoxon-matched-pairs-signed-ranks test, n = sample size).

Robustness and power of the parametric t test ... 53
Tab
le 2
: Ty
pe I
erro
r rat
es fo
r asy
mm
etric
pop
ulat
ion
shap
es (
= c
orre
latio
n, t
= tw
o-sa
mpl
e t t
est,
paire
d t =
pai
red
t tes
t,
U =
Wilc
oxon
-Man
n-W
hitn
ey U
test
, W =
Wilc
oxon
-mat
ched
-pai
rs-s
igne
d-ra
nks t
est,
n =
sam
ple
size
).

W. Wiedermann & A. von Eye 54
Table 3: ANOVA results for the Type I error simulation.

Robustness and power of the parametric t test ... 55
Table 4: Relative frequencies of rejecting the null hypothesis for symmetric distributions ( =
correlation, t = two-sample t test, paired t = paired t test, U = Wilcoxon-Mann-Whitney U test, W = Wilcoxon-matched-pairs-signed-ranks test, n = sample size, true differences in means:
1 2 = 0.50).

W. Wiedermann & A. von Eye 56
Tab
le 5
: R
elat
ive
freq
uenc
ies o
f rej
ectin
g th
e nu
ll hy
poth
esis
for a
sym
met
ric d
istri
butio
ns (
= c
orre
latio
n, t
= tw
o-sa
mpl
e t t
est,
paire
d t =
pai
red
t tes
t, U
= W
ilcox
on-M
ann-
Whi
tney
U te
st, W
= W
ilcox
on-m
atch
ed-p
airs
-si
gned
-ran
ks te
st, n
= sa
mpl
e si
ze, t
rue
diff
eren
ces i
n m
eans
: 1
2 =
0.5
0).

Robustness and power of the parametric t test ... 57
Table 6: ANOVA results for the power simulation.
continued

W. Wiedermann & A. von Eye 58

Robustness and power of the parametric t test ... 59
References
Bartlett, M. S. (1935). The effect of non-normality on the t-distribution. Proceedings of the Cambridge Philosophical Society, 31, 223-231.
Blair, R. C., & Higgins, J. J. (1985). Comparison of the power of the paired t test to of Wil-signed-ranks test under various population shapes. Psychological Bulletin, 97,
119-128.
Boneau, C. A. (1960). The effects of violation of assumptions underlying the t-test. Psycholo-gical Bulletin, 57, 49-64.
Bortz, J., & Schuster, C. (2010). Statistik für Human- und Sozialwissenschaftler (7. Aufl.). Berlin Heidelberg: Springer.
Chlaß, N., & Krüger, J. J. (2007). Small sample properties of the Wilcoxon signed rank test with discontinuous and dependent observations, Jena Economic Research Papers, No. 2007,032, http://hdl.handle.net/10419/25598
Cochran, W. G. (1947). Some consequences when the assumption for the analysis of variance are not satisfied. Biometrics, 3, 22-38.
Conover, W. J., & Iman, R. L. (1981). Rank transformation as a bridge between parametric and nonparametric statistics. The American Statistician, 35, 124-129.
Evans, M., Hastings, N., & Peacock, B. (2000). Statistical Distributions (3rd ed.). New York: Wiley.
Metron, 5, 90-104.
Biometrika, 6, 1-25.
Guiard, V., & Rasch, D. (2004). The robustness of two sample tests for means: A reply on Psychology Science, 46, 549-554.
Hays, W. L. (1994). Statistics (5th ed.). Wadsworth: Thompson Learning.
Herrendörfer, G., Rasch, D., & Feige, K. D. (1983). Robustness of statistical methods II. Methods of the one-sample problem. Biometrical Journal, 25, 327-343.
Hodges, J. L., & Lehmann, E. L. (1956). The efficiency of some nonparametric competitors of the t test. Annals of Mathematical Statistic, 27, 324-335.
-test as applied to the problem of two samples. Statistical Research Memoirs, 2, 1-24.
Iman, R. L., Hora S. C., & Conover W. J. (1984). Comparison of asymptotically distribution-free procedures for the analysis of complete blocks. Journal of the American Statistical Association, 79, 674-685.
Lissitz, R. W., & Chardos, S. (1975). A study of the effect of the violations of the assumption of independent sampling upon the type one error rate of the two-sample t-test. Education-al and Psychological Measurement, 35, 353-359.
Marsaglia, G., & Tsang, W. W. (2000). The Ziggurat method for generating random variables. Journal of Statistical Software, 5, http://www.jstatsoft.org/v05/i08/paper.

W. Wiedermann & A. von Eye 60
Moder, K. (2010). Alternatives to F-test in one way ANOVA in case of heterogeneity of variances (a simulation study). Psychological Testing and Assessment Modeling, 52, 343-353.
Neave, H. R., & Granger, C. W. J. (1968). A monte carlo study comparing various two sam-ple tests for differences in means. Technometrics, 10, 509-522.
Posten, H. O. (1978). The robustness of the two sample t-test over the Pearson system. Jour-nal of Statistical Computation and Simulation, 6, 295-311.
Posten, H. O. (1979). The robustness of the one-sample t-test over the Pearson system. Jour-nal of Statistical Computation and Simulation, 6, 133-149.
Posten, H. O. (1984). Robustness of the two-sample t-test. In D. Rasch & M. L. Tiku (eds.), Robustness of statistical methods and nonparametric statistics (p. 92-99). Dordrecht: D. Reidel Publishing Company.
Posten, H. O., Yeh, H. C., & Owen, D. B. (1982). Robustness of the two-sample t-test under violations of the homogeneity of variance assumptions. Communications in Statistics: Theory and Methods, 11, 109-126.
R Core Team (2012). R: A language and environment for statistical computing. R Foundation for Statistical Computing, Vienna, Austria. ISBN 3-900051-07-0, URL http://www.R-project.org/.
Randles, R. H., & Wolfe, D. A. (1979). Introduction to the theory of nonparametric statistics. New York: Wiley.
Rasch, D., & Guiard, V. (2004). The robustness of parametric statistical methods. Psychology Science, 46, 175-208.
Rasch, D., Kubinger, K. D., & Moder, K. (2011). The two-sample t test: Pre-testing its as-sumptions does not pay off. Statistical Papers, 52, 219-231.
Rasch, D., Kubinger, K. D., & Yanagida, T. (2011). Statistics in Psychology using R and SPSS. Chichester: Wiley.
Scheffé, H. (1970). Practical Solutions of the Behrens-Fisher Problem. Journal of the Ameri-can Statistical Association, 65, 1501-1508.
Tuchscherer, A. & Pierer, H. (1985). Simulationsuntersuchungen zur Robustheit verschiede-ner Verfahren zum Mittelwertsvergleich im Zweistichprobenproblem (Simulationsergeb-nisse). [Simulation studies on robustness of several methods for the comparison of means in the two sample problem]. In P. E. Rudolph (ed.), Robustheit V Arbeitsmaterial zum Forschungsthema Robustheit. Probleme der angewandten Statistik, 15, 1-42, Dummers-dorf-Rostock.
von Eye, A. (1983). t-tests for single means of autocorrelated data a simulation study. Bio-metrical Journal, 25, 801-805.
von Eye, A. (2004). Robustness is parameter-robustness study. Psychology Science, 46, 544-548.
Welch, B. L. (1938). The significance of the difference between two means when the popula-tion variances are unequal. Biometrika, 29, 350-362.

Robustness and power of the parametric t test ... 61
several different popula-tion variances are involved. Biometrika, 34, 28-35.
Wiedermann, W., & Alexandrowicz, R. (2007). A plea for more general tests than those for
sta Psychology Science, 49, 2-12.
Wiedermann, W., & Alexandrowicz, R. (2011). A modified normal scores test for paired data. Methodology, 7, 25-38.
Zimmerman, D. W. (1997). A note on interpretation of the paired-samples t test. Journal of Educational and Behavioral Statistics, 22, 349-360.
Zimmerman, D. W. (2005). Increasing power in paired-samples designs by correcting the Student t statistic for correlation. Interstat, http://interstat.statjournals.net/YEAR/2005/ abstracts/0509002.php
Zimmerman, D. W. (2012). Correcting two sample z and t tests for correlation: An alternative to one sample tests on difference scores. Psicológica, 33, 391-418.
Zimmerman, D. W., Williams, R. H., & Zumbo, B. D. (1993). Effect of nonindependence of sample observations on some parametric and nonparametric statistical tests. Communica-tions in Statistics: Simulation and Computation, 22, 779-789.