Embed Size (px)
Citation preview

Robustness of Smart Beta Strategies
October 2014
An ERI Scientific Beta Publication

Table of Contents
Printed in France, October 2014. Copyright © 2014 ERI Scientific Beta. All rights reserved. Please refer to the disclaimer at the end of this document. The authors can be contacted at contact@scientific beta.com.
Introduction .................................................................................................................................................................5
1. Robustness Issues: Potential Sources of a Lack of Robustness .................................................................7
2. Improving Robustness........................................................................................................................................ 19
3. Measurement of Robustness ............................................................................................................................ 33
Conclusion ................................................................................................................................................................. 49
Appendix ..................................................................................................................................................................... 51
References .................................................................................................................................................................. 55
About ERI Scientific Beta ........................................................................................................................................ 59
ERI Scientific Beta Publications ............................................................................................................................ 63
2 An ERI Scientific Beta Publication — Robustness of Smart Beta Strategies — October 2014Copyright © 2014 ERI Scientific Beta. All rights reserved. Please refer to the disclaimer at the end of this document.

There has been significant evidence that systematic equity investment strategies (so-called smart beta strategies) outperform cap-weighted benchmarks in the long run. However, it is important to recognise that performance analysis is typically conducted on back-tests which apply the smart beta methodology to historical stock returns. Concerning actual investment decisions, it is thus relevant to question how robust the outperformance is. The paper makes a distinction between relative robustness and absolute robustness. A strategy is assumed to be ‘relatively robust’ if it is able to deliver similar outperformance under similar market conditions by aligning well with the performance of underlying factor exposure it is seeking and reducing unrewarded risks. Absolute Robustness is the absence of pronounced state and/or time dependencies and a strategy shown to outperform irrespective of prevailing market conditions can be termed as robust in absolute terms The paper goes on to review the importance of robustness for smart beta strategies, it explains various methods by which smart beta strategies try to improve robustness, and discusses how to measure and assess robustness in the performance analysis of smart beta strategies. We thus hope to provide a useful orientation for investors on how to set suitable requirements for robustness.
The lack of relative robustness arises mainly from data mining and the presence of unrewarded risks in non-robust weighting methodologies, while the lack of absolute robustness comes from undiversified factor exposures. On the issue of how to achieve relative robustness, we discuss several methodological ingredients that will have potentially important impacts on robustness. We first consider the importance of a consistent index construction framework and show the various possibilities of data mining in an inconsistent framework and the risks associated with such data mining practices. We also consider how diversification across different strategies improves relative robustness. Finally, we show that risk factors are not perfectly correlated with each other, and therefore a potential for diversification across factors in order to achieve higher absolute robustness exists.
The paper also explains the need for transparency that enables investors to independently verify the performance reported by the index providers, and considers different aspects of transparency such as access to data and unambiguous and publicly accessible methodologies. We review several measures to assess the robustness of smart beta strategies, such as extreme risk measures, factor exposures and conditional performance among others, and we provide an illustration by running a battery of robustness assessments on long-term data for a multi-factor strategy, the Scientific Beta United States Multi-Beta Multi-Strategy index.
Abstract
3An ERI Scientific Beta Publication — Robustness of Smart Beta Strategies — October 2014 Copyright © 2014 ERI Scientific Beta. All rights reserved. Please refer to the disclaimer at the end of this document.

About the Authors
4 An ERI Scientific Beta Publication — Robustness of Smart Beta Strategies — October 2014Copyright © 2014 ERI Scientific Beta. All rights reserved. Please refer to the disclaimer at the end of this document.
4
Felix Goltz is Research Director, ERI Scientific Beta, and Head of Applied Research at EDHEC-Risk Institute. He carries out research in empirical finance and asset allocation, with a focus on alternative investments and indexing strategies. His work has appeared in various international academic and practitioner journals and handbooks. He obtained a PhD in finance from the University of Nice Sophia-Antipolis after studying economics and business administration at the University of Bayreuth and EDHEC Business School.
Noël Amenc is professor of finance at EDHEC Business School, director of EDHEC-Risk Institute and CEO of ERI Scientific Beta. He has conducted active research in the fields of quantitative equity management, portfolio performance analysis, and active asset allocation, resulting in numerous academic and practitioner articles and books. He is on the editorial board of the Journal of Portfolio Management and serves as associate editor of the Journal of Alternative Investments and the Journal of Index Investing. He is a member of the scientific board of the French financial market authority (AMF), the Monetary Authority of Singapore Finance Research Council and the Consultative Working Group of the European Securities and Markets Authority Financial Innovation Standing Committee. He co-heads EDHEC-Risk Institute’s research on the regulation of investment management. He holds a master’s in economics and a PhD in finance.
Ashish Lodh is Senior Quantitative Analyst, ERI Scientific Beta. He does research in empirical finance, focusing on equity indexing strategies and risk management. He has a master’s in management with a major in finance from ESCP Europe. He also has a bachelor’s degree in chemical engineering from Indian Institute of Technology.
Sivagaminathan Sivasubramanian is a Quantitative Research Analyst. He holds a Master of Science degree in Financial Markets from EDHEC Business School as well as a first-class Bachelor’s degree (with distinction) in Computer Science and Engineering. He previously worked as a Software Programmer for a number of years.

Introduction
5An ERI Scientific Beta Publication — Robustness of Smart Beta Strategies — October 2014Copyright © 2014 ERI Scientific Beta. All rights reserved. Please refer to the disclaimer at the end of this document.

6 An ERI Scientific Beta Publication — Robustness of Smart Beta Strategies — October 2014Copyright © 2014 ERI Scientific Beta. All rights reserved. Please refer to the disclaimer at the end of this document.
1 - Concerns over robustness are widely echoed in the media and industry. According to Northern Trust (as cited in Fixsen, 2012), “Some alternative indices add value, but not necessarily under the same market conditions, investors need to understand the underlying biases and the overall fit in their portfolio before selecting the right benchmark”. Buckley (2013) states, “…benchmarks are often being chosen for new products based on their attractive performance history. And, of course, past performance is no guarantee of future results”.2 - Badaoui, S., F. Goltz, V. Le Sourd and A. Lodh. 2014. Alternative Equity Beta Investing: The Status Quo and the Path Ahead. EDHEC-Risk Institute Publication (forthcoming).
Alternative forms of equity indices, which draw from a wide range of portfolio construction practices, have become popular in recent years. For example, a popular approach is to use fundamental or accounting-based metrics for size, instead of market price, to weight stocks. On the other hand, scientific diversification-based approaches exist that either have a deconcentration objective (such as maximum deconcentration or maximum decorrelation) or a risk-return objective (such as maximum Sharpe ratio and minimum volatility). Smart beta indices are rapidly evolving as effective alternatives to cap-weighted (CW) indices because, when compared to active management, they provide attractive performance over a cap-weighted benchmark in a more systematic and cost effective way.
The smart beta indices are usually marketed on the basis of outperformance. However more often than not, the issue of robustness as in extreme risk and performance attribution to well-defined risk factors is not dealt with by index providers. The existence of so many smart beta strategies coupled with so little information on justification of their performance could cast doubts over the very usefulness of these strategies.1
The results of a recent survey conducted by EDHEC-Risk Institute shows that investors are wary of robustness of outperformance provided by various smart beta strategies. Exhibit 1 shows the summary of findings of EDHEC-Risk Alternative Equity Beta Survey conducted as part of the Newedge "Advanced Modelling for Alternative Investments" Research Chair (Badaoui et al., 2014).2
Survey participants were provided with a list of potential reasons on why they would not invest in smart beta strategies and they were asked to rate them from 1 to 5, with 1 being the weakest reason and 5 being the strongest for not choosing smart beta investment strategies. As can be seen from Exhibit 1, the survey reveals that “doubts over robustness” (with an average score of 3.62 out of 5) is the main reason why investors are reluctant in choosing smart beta strategies.
Exhibit 1: Summary of EDHEC Risk Alternative Equity Beta Survey conducted as part of the Newedge "Advanced Modelling for Alternative Investments" Research Chair
Reasons for not investing in Smart Beta strategies Average Score
Doubts over robustness of outperformance 3.62
Issues related to turnover and capacity 3.23
Limited information on risks 3.10
Limited availability of independent research 2.97
Limited availability of data 2.87
High licensing fees 2.82
Insufficient explanation of concepts behind offerings 2.76
Low transparency of rules 2.60
Insufficient number of offerings 2.40
This paper discusses various robustness issues and the sources of a lack of robustness. The paper explains the need for robustness checks in performance analysis of smart beta strategies, it describes various methods by which ERI Scientific Beta improves robustness, and it illustrates how to measure and assess robustness in the performance of smart beta strategies using Scientific Beta analytics.
Introduction

1. Robustness Issues: Potential Sources of a Lack of Robustness
7

8 An ERI Scientific Beta Publication — Robustness of Smart Beta Strategies — October 2014Copyright © 2014 ERI Scientific Beta. All rights reserved. Please refer to the disclaimer at the end of this document.
1.1 What is robustness of smart beta performance?In general, robustness refers to the capacity of a system to perform effectively in a constantly changing environment. In statistics, models are said to be robust if they are not affected by outliers or by minor deviations from the model assumptions. Alternative weighting schemes may expose an investor to the risk of underperforming cap-weighted benchmarks over short investment horizons. Moreover, it seems reasonable to assume that market conditions may influence the capacity of a given strategy to provide outperformance over the cap-weighted reference index, and that certain market environments may be more favourable to the strategy. In the context of smart beta strategies, two kinds of robustness need to be taken into account – relative robustness and absolute robustness.
A strategy is assumed to be ‘relatively robust’ if it is able to deliver similar outperformance in similar market conditions. Single factor indices aim to achieve this kind of robustness. For example, a value factor index is expected to outperform in the times when the value factor is rewarded in the market, and it will underperform when the factor experiences short-term losses. The said value factor index would be deemed relatively robust if it aligns well with the value factor performance and does not suffer idiosyncratic losses due to any other causes including, but not limited to, stock specific and sector specific events. Thus, a strategy which delivers good risk-adjusted performance for a given factor tilt is said to be highly robust in a relative sense.
The concept of relative robustness is not just limited to factor indices. A weighting scheme, which in general could be implicitly exposed to more than one factor, would be considered relatively robust if it is able to diversify as much unrewarded risk as possible. For example, an unconstrained minimum volatility portfolio is likely to be concentrated in fewer stocks and (Monnier and Rulik, 2010) and exposed to defensive sectors (Chan, Karceski and Lakonishok, 1999). This kind of reliance on specific sectors is a hurdle in achieving relative robustness. It is the reason that most commercial minimum volatility strategies are subjected to various sets of additional constraints such as setting a cap and floor on weights of individual stocks (Jagannathan and Ma, 2003), sector weight constraints and deconcentration constraints (DeMiguel et al., 2009).
Absolute robustness is the capacity of the strategy to deliver future risk-adjusted performance to a degree that is comparable to that of the past, owing to a well-understood economic mechanism rather than by just chance. Absolute robustness is, in other words, the absence of pronounced state and/or time dependencies, and a strategy shown to outperform irrespective of prevailing market conditions can be termed as robust in absolute terms. Absolute robustness can be achieved by allocating across different rewarded risk factors rather than concentrating in a single one. This issue is discussed in more detail in Section 1.2.
1. Robustness Issues: Potential Sources of a Lack of Robustness

3 - The methodology can be found at http://www.ftse.com/products/downloads/FTSE_RAFI_Indexes_Methodology_overview.pdf
1.2 Sources of a lack of robustnessA lack of robustness in smart beta strategies can be caused mainly by exposure to four different risks in the strategy construction process – factor fishing, model mining, non-robust weighting schemes and strong factor dependencies.
1.2.1 Factor fishing risksInvestors who wish to benefit from factor premia need to address robustness when selecting a set of factors. Harvey et al. (2013) document a total of 314 of factors with positive historical risk premia showing that the discovery of the premium could be a result of data mining (i.e. strong and statistically significant factor premia may be a result of many researchers searching through the same dataset to find publishable results). The practice of identifying merely empirical factors is known as “factor fishing” (see Ang, 2013; Cochrane, 2001). Therefore, a key requirement of investors to accept factors as relevant in their investment process is that there is clear economic intuition as to why the exposure to this factor constitutes a systematic risk that requires a reward, and why it is likely to continue producing a positive risk premium (Kogan and Tian, 2013). In short, factors selected just based on past performance without considering any theoretical evidence are not robust and must not be expected to deliver similar premia in the future.
Different papers in the empirical literature use different proxies to capture a given factor exposure, and practical implementations of factor exposures may deviate considerably from factor definitions in the literature. For example, when capturing the value premium, one may use extensive fundamental data including not only valuation ratios but also information on the firm’s sales growth for instance. Recently, many fundamental variables such as sales, dividends, book value and cash flow are used as risk factors by many fundamental factor-based funds and indices. This new approach, termed “fundamental”, has been justified in many ways from a marketing perspective, ranging from the capacity to provide a better proxy for firms’ economic footprint (which was not really tested), to the ability to create alpha by rebalancing (which has not really been demonstrated) and more recently from RAFI, the idea that fundamental indices could be high-performance smart proxies for the Value factor, thereby enabling RAFI, who also produce low-volatility indices, to partake in the factor investing approaches that are currently popular with institutional investors. Traditionally, book-to-market value is the consensual variable used as a proxy to capture the value premium and there is sufficient literature to show its effectiveness. We should analyse how the other fundamental factor proxies fare in capturing the value premium.
Exhibit 2 presents the analysis on the effectiveness of various proxy variables used to capture the value premium. Cash flow is computed as Operating Income plus Depreciation and Amortisation as per the definition provided by FTSE RAFI fundamental indexes.3 Cash flow, dividends and sales are smoothed by averaging the past five years. Book value at the end of the previous fiscal year is used as described in the FTSE RAFI index methodology. The percentage of each individual factor is calculated for every security in the 500-stock universe. A composite score of fundamental value is assigned to each stock by averaging the percentages of the four individual factors. The stocks are
1. Robustness Issues: Potential Sources of a Lack of Robustness
An ERI Scientific Beta Publication — Robustness of Smart Beta Strategies — October 2014Copyright © 2014 ERI Scientific Beta. All rights reserved. Please refer to the disclaimer at the end of this document.
9

10 An ERI Scientific Beta Publication — Robustness of Smart Beta Strategies — October 2014Copyright © 2014 ERI Scientific Beta. All rights reserved. Please refer to the disclaimer at the end of this document.
4 - Fama-MacBeth regression coefficients or risk premium reported by authors for B/M factor is 0.50% monthly with a t-statistic of 5.71 over the period from July 1963 to December 1990. E/P factor in the same period results in a risk premium of 0.57% monthly with a t-statistic of 2.28. It must be noted that authors also show that the inclusion of size and B/M factor renders the E/P effect insignificant.
then ranked according to the scores of individual factors and the composite score. Five different long-short factors are then constructed by selecting the top and bottom 30% stocks and cap-weighting them. As can be seen from Exhibit 2, none of the proxies for the value factor used by FTSE RAFI provide a statistically significant risk premium. On the other hand, B/M and E/P factors provide positive risk premia with strong p-values of less than 0.50%. This is not surprising as the rewarded factor documented in academic literature is the valuation ratio – book to market (B/M) or earnings to price (E/P) (Fama and French, 1992)4 and not the fundamental value itself (as shown in last two columns). Numerous studies such as Stattman (1980) and Rosenberg et al. (1985) have shown that the B/M ratio is positively related to average stock returns in the US. In Japan, the role of the B/M factor in explaining the cross section of stock returns has been documented by Chan et al. (1991). Evidence of explanatory power of the E/P ratio in US stocks can be traced back to Basu (1983). If one weights the portfolio by composite weight, it would have an effect similar to tilting the CW portfolio which under-weights low valuation stocks and over-weights high valuation stocks relative to the CW portfolio. A large stock with a poor valuation ratio would still get more weight than a smaller stock with a high valuation ratio. Therefore, although this technique allows tracking error to be managed, it does not use a good proxy for obtaining the value tilt. Above all, we can see that the marketing innovation represented by this approach, termed fundamental, means that the investor loses all reference to academic research results and leads to investment in false risk factors in the sense that there is no guarantee that the factors are rewarded.
Exhibit 2: Annualised returns of long-short portfolios - Book Value factor is the daily return series of a cap-weighted portfolio that is long the highest 30% and short the lowest 30% of stocks based on book value. Sales factor is the daily return series of a cap-weighted portfolio that is long the highest 30% and short the lowest 30% of stocks based on sales and smoothed over previous 5 years. Dividend factor is the daily return series of a cap-weighted portfolio that is long the highest 30% and short the lowest 30% of stocks based on dividends and smoothed over previous 5 years. Cash flow factor is the daily return series of a cap-weighted portfolio that is long the highest 30% and short the lowest 30% of stocks based on cash flows and smoothed over previous 5 years. Composite factor is the daily return series of a cap-weighted portfolio that is long the highest 30% and short the lowest 30% of stocks based on composite value, which is the average of largest 500 individual factor values in the US universe by market cap. Book-to-Market factor is the daily return series of a cap-weighted portfolio that is long the highest 30% and short the lowest 30% of stocks based on the B/M ratio. Earnings-to-Price factor is the daily return series of a cap-weighted portfolio that is long the highest 30% and short the lowest 30% of stocks based on the E/P ratio. The period of analysis is 31/12/1973 to 31/12/2013.
Book Value Sales Dividends Cash Flow Composite Book-to-Market
Earnings-to-Price
Annualised Returns -1.16% -0.79% -1.23% -0.93% -0.51% 5.20% 4.59%
Statistically Significant? No No No No No Yes Yes
p-Value 49.42% 81.21% 51.17% 80.25% 93.28% 0.05% 0.38%
Ultimately and more generally, many value-tilted indices include other large sets of ad hoc methodological choices, opening the door to data mining. This is discussed in more detail in the next section.
1.2.2 Model mining risksModel mining risk is the risk of having an index construction methodology which results in a good track record in back testing. We illustrate the model mining risk through the example of commercially available economic size (fundamentally) weighted indices. Exhibit 3 shows the fundamentally
1. Robustness Issues: Potential Sources of a Lack of Robustness

weighted index construction mechanisms of various index providers. Fundamentally weighted indices are constructed based on various fundamental factors such as profitability, sales, income, etc. with an aim to capture the value premium. In addition, some index providers choose to use the smoothed value of parameters to avoid large shifts in stock weights upon rebalancing. Some other seemingly discretionary choices are made when it comes to defining rebalancing frequency and leverage adjustment.
Exhibit 3: Comparison of index construction methods of various providers
Index Name Stock Selection / Universe
Stock Weighting Adjustment Smoothing Rebalancing
Dow Jones Select Dividend Indices
Dividend / Dividend sustainability /
Liquidity
(Indicated) Dividend yield and dividends
No special dividends
Liquidity measures averaged over 3-5 years
Annually: December or June
FTSE GWA Index Series Market Cap Net income / Cash flow / Book value
Book value is float adjusted
- Quarterly: March, June, September,
December
FTSE RAFI Index Series Sales / Cash flow
/ Book value / Dividend
Same as selection - Sales, cash flow and
dividends are averaged over a 5-year period
Annually March or spread out
quarterly (“QSR” version)
MSCI Value Weighted Indices
Market Cap Book value / Sales / Earnings / Cash
earnings
Free float adjustment
Sales, earnings and cash flows are averaged over
a 3-year period
Semi-annually: May, November
RevenueShares Indices Market Cap Revenue weighting - - Quarterly
Russell Fundamental Indices
Sales / Retained cash flow / Dividend and
buyback Same as selection
Sales adjusted for financial leverage
Fundamentals are averaged over a 5-year
period
Spread out quarterly (June,
September, December, March)
WisdomTree Earnings-Weighted Indices
Market cap / PE ratio / Positive earnings / Avg. daily trading
volume
Earnings-weighted - Cumulative earnings of 4 quarters prior to measurement date
Annual: December
Amenc, Goltz and Le Sourd (2008) show that the outperformance of various complex definition fundamental weighted indices over the S&P 500 index is mostly not statistically significant. The authors show that 13 out of 14 commercially available fundamentals based indices do not exhibit any statistically significant (p-value less than 5%) outperformance over the broad cap-weighted S&P 500 index in the period from January 1998 to December 2006. We find that the value-tilted CW index, which cap-weights the top 50% B/M stocks in the S&P 500 universe, significantly outperforms the S&P 500 index by 7.84% (and has a p-value less than 5%) in the same period. This observation questions the need for such complex ad hoc models and proprietary factor definitions which expose the investors to model mining risk, thus hampering the robustness of these strategies.
As an illustration, one can consider the impact of various specification choices on fundamental equity indexation strategies, which are commonly employed as a way to harvest the value premium. Exhibit 4 summarises the maximum calendar year difference between any two variants of fundamental indices which make different choices for two methodology ingredients – variable
1. Robustness Issues: Potential Sources of a Lack of Robustness
An ERI Scientific Beta Publication — Robustness of Smart Beta Strategies — October 2014Copyright © 2014 ERI Scientific Beta. All rights reserved. Please refer to the disclaimer at the end of this document.
11

12 An ERI Scientific Beta Publication — Robustness of Smart Beta Strategies — October 2014Copyright © 2014 ERI Scientific Beta. All rights reserved. Please refer to the disclaimer at the end of this document.
selection and leverage adjustment. It is evident that the outperformance of a fundamental equity indexation strategy is highly sensitive to strategy specification choices and the difference in returns of two different variants of the same strategy could be as large as 9%.
The value factor performed poorly during the years of 1999 and 2008. Speaking from the point of view of relative robustness, two slightly different versions of the value factor targeting a smart beta strategy are expected to display similar performance in those two years. However, the results show that ‘total leverage adjusted’ portfolio returns +5.3% while ‘operating leverage adjusted’ portfolio returns just -4.0% indicating that the weighting scheme does not reliably capture the value premium. Additionally, to be exposed to the value factor, the strategy is also exposed to some latent undesired risks resulting from proprietary definitions.
Exhibit 4: Impact of Data MiningThe exhibit shows the returns of the best and worst performing variants of each specification of the fundamental weighting schemes in the universe of the top 1000 US stocks. Portfolios are formed using fundamental data from the period of January 1982 to December 2010. Data is obtained from Datastream and Worldscope. The table summarises the maximum calendar year difference between any two variants of fundamental indices which make different choices for one of two methodology ingredients (variable selection and leverage adjustment).
Data Mining Aspects and their Impact on Returns
Best Performance Worst Performance Range Year
Variable Selection Earnings -12.2% Dividends -23.0% 10.8% 1999
Leverage Adjustment Total leverage 5.3%Operating leverage
-4.0% 9.3% 2008
The following illustration is another example of model mining which shows the effect of weight constraints on the performance of minimum volatility strategies. Implementable minimum volatility portfolios put weight constraints either on individual stock weights in the form of lower and upper bounds (lambda) or on the norm of portfolio weights. We simulate nine minimum volatility portfolios – one long only, four lambda-constrained and four norm-constrained. Exhibit 5 shows that all variations post a big improvement over the CW index both in terms of returns and volatility. In general, for the same level of deconcentration (the effective number of stocks or ENS), norm-constrained portfolios deliver better performance than lambda-constrained portfolios. De Miguel et al. (2009) have highlighted the fact that the parsimonious nature of norm constraints helps minimum volatility portfolios achieve better out-of-sample performance compared to portfolios with rigid weight constraints.
The performance of portfolios in general is affected a lot by the constraints they are subject to. Sharpe ratio varies from 0.55 to 0.72 and volatilities vary from 15.89% to 11.75%. It should be noted that a single variation is not superior in performance over all sub-periods of the analysis period. Also, the winning variation in one sub-period is not always the winning variation in the next out-of-sample period. This is illustrated by constructing an active strategy which picks the best performing variation (in total returns) in the past 2/3/4/5 years and holds it for the subsequent year. The results show that compared to the base case of the ‘Long Only’ version, 2 out of 4 active winner-chasing strategies indeed post lower returns. Therefore, if one selects a particular winning variation, after a
1. Robustness Issues: Potential Sources of a Lack of Robustness

tedious exercise of model mining or in this case constraint mining over certain calibration period, there is no guarantee that the chosen variation will be the best-performing one in future. Therefore, while choosing weight constrains, one must be guided by a concentration requirement of the portfolio, give preference to a parsimonious method, and avoid model mining at all costs.
Exhibit 5: Performance of Minimum Volatility Strategies with different weight constraints. Two types of weight constraints – lambda constraint and norm constraint – are analysed. Norm constraint controls the effective number of stocks (ENS). If Norm = 3, then the ENS is at least a third of the nominal number of securities. Lambda constraint specifies the investors’ risk aversion coefficient. After optimisation, an upper bound of λ/N and a lower bound of 1/ λN are imposed, where N is the nominal number of securities. The correlation of stock returns is estimated using an implicit factor – Principal Component Analysis (PCA). Daily total returns in the period from 23/12/1975 to 31/12/2013 are used in the analysis.
Specification Returns Volatility Sharpe Ratio Mean ENS
CW Benchmark - 11.59% 17.28% 0.37 117
Minimum Volatility Strategies with different levels of weight constraints
λ = 2 14.01% 15.89% 0.55 345
λ = 3 14.01% 15.11% 0.58 263
λ = 4 13.98% 14.67% 0.60 221
λ = 5 13.95% 14.40% 0.61 196
Long Only 13.85% 13.54% 0.64 126
Norm = 2 14.04% 13.77% 0.64 250
Norm = 3 13.89% 12.72% 0.68 167
Norm = 4 13.77% 12.13% 0.70 125
Norm = 5 13.67% 11.75% 0.72 100
Active Strategy that selects the best performing (in total returns) Minimum Volatility Strategy in the past ‘Y’ years and holds it for the next year
Y = 2 13.78% 13.36% 0.64 217
Y = 3 14.41% 13.61% 0.68 226
Y = 4 14.28% 13.45% 0.67 223
Y = 5 13.02% 14.00% 0.56 221
1.2.3 Lack of robustness of weighting schemesAll smart beta strategies are exposed to systematic risk factors and strategy specific risks. The strategy specific risks give rise to the lack of robustness of weighting schemes, which in turn translate into the problem of the relative robustness of weighting schemes. Specific risks correspond to all the risks that are unrewarded in the long run, and therefore not ultimately desired by the investor. Many kinds of specific risks exist.
Firstly, in line with portfolio theory, among the unrewarded risks we find specific financial risks (also called idiosyncratic stock risks) which correspond to the risks that are specific to the company itself (its management, the risk of the poor quality of its products, the failure of its sales team, the relevance of its R&D and innovation, etc.). It is these types of risks that asset managers are supposed to be most familiar with, evaluating and selecting them in order to create alpha. However, portfolio theory does not consider specific financial risks to be either predictable or rewarded, so it is better to avoid them by investing in a well-diversified portfolio.
Specific risks can also correspond to important financial risk factors that do not explain, over the long term, the value of the risk premium associated with the index. There are many of these
1. Robustness Issues: Potential Sources of a Lack of Robustness
An ERI Scientific Beta Publication — Robustness of Smart Beta Strategies — October 2014Copyright © 2014 ERI Scientific Beta. All rights reserved. Please refer to the disclaimer at the end of this document.
13

14 An ERI Scientific Beta Publication — Robustness of Smart Beta Strategies — October 2014Copyright © 2014 ERI Scientific Beta. All rights reserved. Please refer to the disclaimer at the end of this document.
5 - Maximum Deconcentration is an equal weighting (1/N) strategy with liquidity and turnover constraints.
unrewarded financial risk factors. For instance, the academic literature considers commodity, currency and sector risks not to have a positive long-term premium. These risks can have a strong influence on the volatility, tracking error, max drawdown or max relative drawdown over a particular period, which might sometimes be greater than that of systematically-rewarded risk factors.
For example, value strategies often lead to pronounced tilts towards financial sector stocks. During the financial crisis (2008), exposure to the financial sector proved to be a major determinant of performance of these strategies. It must be noted that the tilt towards the financial sector may not have been desired, but it came as a by-product of holding value stocks. Exhibit 6 shows a performance comparison between the Eurozone Value Maximum Deconcentration5 index and its sector neutral version. The Eurozone Value Maximum Deconcentration index over-weighted the financial sector by 9.1% in June 2008 which resulted in a loss of about 20% of portfolio value.
Exhibit 6: Performance of the Scientific Beta Eurozone Value Maximum Deconcentration index and the Sector Neutral version during the financial crisis. The benchmark is the cap-weighted index on the Scientific Beta Eurozone universe, which consists of 600 stocks.
A globally effective diversification weighting scheme reduces the quantity of unrewarded risk, whether it involves unrewarded financial risk factors or unrewarded specific financial risks. However, like any model, it is imperfect and can lead to non-negligible residual exposures to certain unrewarded risks. For example, minimum volatility portfolios, which are robust proxies for efficient portfolios, and therefore well diversified, are often exposed to significant sector biases as shown in Exhibit 7. Minimum Volatility and Maximum Sharpe strategies have +7.9% and +5.4% additional exposure (with respect to the CW benchmark) to Utilities respectively at the cost of -6.2% and -4.2% active exposure to Financials. The Maximum Deconcentration weighting scheme over-weights Cyclical Consumer sector and under-weights Technology.
1. Robustness Issues: Potential Sources of a Lack of Robustness

Exhibit 7: Sector Allocation of various weighting schemes of Scientific Beta USA indices as of 20/06/2014 relative to a Cap-Weighted benchmark.
Scientific Beta USA
Sector Max Deconcentration
Max Decorrelation
Efficient Min Volatility
Efficient Max Sharpe
Diversified Risk-Weighted
Energy -0.90% 1.00% -5.20% -0.30% -2.30%
Basic Materials 1.80% 0.50% 0.70% 0.50% 2.00%
Industrials 1.90% -2.60% 0.70% -2.40% 2.50%
Cyclical Consumer G&S 3.40% 3.90% 0.80% 3.80% 1.90%
Non Cyclical Consumer G&S -0.80% 0.40% 4.20% 2.10% 0.20%
Financials 0.50% -4.60% -6.20% -4.20% 0.60%
Healthcare -2.50% 1.10% 3.30% -0.90% -2.00%
Technology -4.30% -1.00% -5.00% -2.10% -5.30%
Telecom Services -1.90% -2.00% -1.30% -2.00% -1.80%
Utilities 2.80% 3.20% 7.90% 5.40% 4.30%
Model-specific risks that are specific to the implementation of the diversification model are also a form of unrewarded risks. As per modern portfolio theory, each investor should optimally combine risky assets so as to achieve highest possible Sharpe ratio. Implementing this objective, however, is a complex task because of the presence of estimation risk for the required parameters, namely expected returns and covariance parameters. In practice, the costs of estimation error may entirely offset the benefits of optimal portfolio diversification (De Miguel, Garlappi and Uppal, 2009, provide evidence that naively-diversified portfolios have higher out-of-sample Sharpe ratios than scientifically-diversified portfolios). Similarly, an investor may be better off for example investing in a proxy for the global minimum variance (GMV) portfolio or the equal risk contribution (ERC) portfolio, which only require estimates for covariance parameters, as opposed to trying to estimate the maximum Sharpe ratio (MSR) portfolio, which also requires expected returns estimates that are known to be noisier (see Merton, 1980).
In other words, the choice in risk and return parameter estimation for efficient diversification is between "trying", which has a cost related to estimation risk (i.e. the risk of a substantial difference between the estimated parameter value and the true parameter value) or "giving up", which has a cost related to optimality risk, that is the risk that the heuristic benchmark (such as the Equal-Weighted (EW) or GMV) can be far from the optimal MSR benchmark. Different portfolios are intuitively expected to incur more estimation risk or more optimality risk.
Martellini, Milhau and Tarelli (2013) provide a quantitative analysis of the trade-off between optimality risk and estimation risk. They look at optimality risk in isolation by considering a large number of possible equity universes, defined in terms of many different possible reasonable true population values for risk and return parameters, and measuring the difference for these parameter values (in terms of ex-ante Sharpe ratios, i.e. based on true parameter values) between the true MSR portfolios and various heuristic portfolios. In a second step of their analysis, estimation risk is introduced so as to help measure the distance of various heuristic benchmarks using imperfect
1. Robustness Issues: Potential Sources of a Lack of Robustness
An ERI Scientific Beta Publication — Robustness of Smart Beta Strategies — October 2014Copyright © 2014 ERI Scientific Beta. All rights reserved. Please refer to the disclaimer at the end of this document.
15

16 An ERI Scientific Beta Publication — Robustness of Smart Beta Strategies — October 2014Copyright © 2014 ERI Scientific Beta. All rights reserved. Please refer to the disclaimer at the end of this document.
estimates with respect to the true MSR portfolio. This analysis allows us to analyse the interaction between estimation risk and optimality risk.
Exhibit 8 shows that under the assumption of true parameter knowledge, the MSR portfolio exhibits a Sharpe ratio (0.876) far superior than that of other strategies, thus underlining the opportunity costs involved in estimation risk for such portfolios. On the other hand, when a realistic estimate of estimation error is introduced for covariance and expected return parameters, the average Sharpe ratio of the scientifically-diversified portfolios is substantially reduced. Interestingly, GMV dominates the MSR portfolio after estimation risk is taken into account, and also that a mixture of GMV and EW portfolios generates the highest average Sharpe ratio, with the lowest standard deviation.
Exhibit 8: Sharpe ratios for selected weighting schemes in the presence of estimation errors in expected excess returns and covariance matrix - Results taken from Martellini, Milhau and Tarelli (2013).The table shows statistics on the ex-ante Sharpe ratio of different portfolios. These results have been obtained by simulating (“true”) population parameters and estimation errors. The first column contains results when expected excess returns and the covariance matrix are perfectly estimated (no estimation risk) in particular the average annualised Sharpe Ratio. The average is taken across different sets of “true” parameters. The 2nd and 3rd columns contain results when we simulate estimation errors for risk and return parameters. We calculate the mean and standard deviation of the distribution of Sharpe ratios that we obtain across our simulations for each set of “true” parameters. The 2nd and 3rd columns show the average of these statistics across all sets of “true” parameters. MSR and GMV are subject to long-only constraints.
Portfolio Strategy Average Sharpe ratio with no estimation risk
Average Sharpe ratio with estimation risk
St. dev. of Sharpe ratio with estimation risk
Maximum Sharpe Ratio 0.876 0.521 0.087
Risk Parity 0.561 0.559 0.014
Global Minimum Variance 0.517 0.503 0.050
Equal-Weighted 0.546 0.546 0.000
50% GMV + 50% EW 0.566 0.560 0.020
1.2.4 Strong dependency on individual factor exposuresSome smart beta strategies have implicit systematic risk exposure while others seek it in an explicit manner. Systematic risks come from the fact that smart beta strategies can be more or less exposed to particular risk factors depending on the methodological choices guiding their construction (implicit), but also on the universe of stocks supporting this construction scheme (explicit).
For example, fundamental-weighted portfolios typically have value tilt and minimum volatility strategies exhibit low beta tilt (see for example Scherer, 2011; Blitz and Swinkels, 2008; Amenc, Goltz and Le Sourd, 2008). More generally, given that a CW index is typically concentrated in the largest capitalisation stocks, any deconcentration of the benchmark will inevitably lead to an increase in the exposure to smaller stocks, such as mid cap stocks. Exhibit 9 shows that all weighting schemes have some exposure to small cap and value factors. Minimum Volatility exhibits low market beta (0.82) while Maximum Deconcentration has a market beta close to 1. Also, all strategies have different exposure to the momentum factor. In short, each weighting scheme exposes the investor to implicit risk factors (which can be seen as unavoidable by-products of optimisation) which may or may not be consistent with the desired risk objective. This is a major limitation of Smart Beta 1.0 strategies – strategies which do not explicitly control for systematic risk factors.
1. Robustness Issues: Potential Sources of a Lack of Robustness

6 - It is worth emphasising that asset pricing theory suggests that factors are (positively) rewarded if and only if they perform poorly during bad times, and more than compensate during good times so as to generate a positive excess return on average across all possible market conditions. In technical jargon, the expected excess return on a factor is proportional to the negative of the factor covariance with the pricing kernel, given by marginal utility of consumption for a representative agent. Hence, if a factor generates an uncertain payoff that is uncorrelated to the pricing kernel, then the factor will earn no reward even though there is uncertainty involved in holding the payoff. On the other hand, if a factor payoff co-varies positively with the pricing kernel, it means that it tends to be high when marginal utility is high, that is when economic agents are relatively poor. Because it serves as a hedge by providing income during bad times, when the marginal utility of consumption is high, investors are actually willing to pay a premium for holding this payoff.
Following this drawback of Smart Beta 1.0 indices, ‘factor indices’ have gained popularity. The factor indices make sure that the portfolio is tilted towards the desired risk factor and hence give investors the option of choosing the risk factor(s) to which they want to be exposed. The strategies that seek explicit exposure fall into the category of factor indices and they usually do so either by selecting a smaller set of stocks as a base, or by using a weighting that favours stocks with certain characteristic, or both.
Exhibit 9: Exposure of various weighting schemes to Equity Risk FactorsThe exhibit shows 4-factor regression results for five weighting schemes on these four factor indices. Factors are based on SciBeta US Long Term Track Records. The Market factor is the daily return of the cap-weighted index of all stocks that constitute the index portfolio in excess of the risk-free rate. Small size factor is the daily return series of a cap-weighted portfolio that is long the smallest 30% of stocks (by market cap) and short the largest 30% of stocks (by market cap) of the extended universe (i.e. including small caps). Value factor is the daily return series of a cap-weighted portfolio that is long the highest 30% and short the lowest 30% of stocks in the investable universe based on B/M ratio. Momentum factor is the daily return series of a cap-weighted portfolio that is long the highest 30% and short the lowest 30% of stocks in the investable universe based on 52-week (minus most recent 4 weeks) past returns. The "Secondary Market US Treasury Bills (3M)" is the risk-free rate in US Dollars. All statistics are annualised. The analysis is based on daily total returns from 31/12/1973 to 31/12/2013. The statistics that satisfy 5% significance level are highlighted in bold.
Scientific Beta USA
Max Deconcentration
Max DecorrelationEfficient Min
VolatilityEfficient Max Sharpe
Diversified Risk Weighted
Annual Alpha 1.27% 1.37% 2.09% 1.76% 1.58%
Market Beta 0.99 0.95 0.82 0.91 0.95
Size Beta 0.21 0.20 0.10 0.16 0.16
Value Beta 0.11 0.09 0.10 0.11 0.11
Momentum Beta -0.05 0.01 0.01 0.02 -0.04
R-Squared 97.36% 96.58% 93.73% 95.85% 96.76%
Whatever be the route to seek systematic risk exposure, the fundamental fact remains that stocks earn a risk premium through their exposure to certain rewarded factors (Ross, 1976). The economic intuition for the existence of a reward for a given risk factor is that exposure to such a factor is undesirable for the average investor because it leads to losses in bad times6 (i.e. when marginal utility is high, see Cochrane, 2001). Thus, risk factors will have prolonged periods of bad performance and each factor will underperform at different time periods.
Exhibit 10 plots cumulative returns of long-short CW indices replicating factors such as market, size, value and momentum. Periods of poor performance in all factors are common throughout the 40-year time horizon and the underperformance occurs at different points in time. Thus, exposure to a single factor is risky in absolute terms as the investor will be exposed the risk of underperforming the broad market benchmark when the factor underperforms. This is not robust approach in absolute terms as the performance will vary greatly over time across different time periods.
1. Robustness Issues: Potential Sources of a Lack of Robustness
An ERI Scientific Beta Publication — Robustness of Smart Beta Strategies — October 2014Copyright © 2014 ERI Scientific Beta. All rights reserved. Please refer to the disclaimer at the end of this document.
17

18 An ERI Scientific Beta Publication — Robustness of Smart Beta Strategies — October 2014Copyright © 2014 ERI Scientific Beta. All rights reserved. Please refer to the disclaimer at the end of this document.
Exhibit 10: Cumulative Returns of Long-Short Cap-Weighted FactorsCumulative Returns of Factors – Factors are from SciBeta US Long-Term Track Records. All statistics are based on simulated long-term track records. The Market factor is the daily return of the cap-weighted index of all stocks that constitute the index portfolio in excess of the risk-free rate. Small size factor is the daily return series of a cap-weighted portfolio that is long cap-weighted market portfolio deciles 6-8 (NYSE, Nasdaq, and AMEX) and short the largest 30% of stocks (by market cap) from the top 500 stock universe. Value factor is the daily return series of a cap-weighted portfolio that is long the highest 30% and short the lowest 30% of stocks in the US 500 universe based on the B/M ratio. Momentum factor is the daily return series of a cap-weighted portfolio that is long the highest 30% and short the lowest 30% of stocks in the US 500 universe based on 52-week (minus the most recent 4 weeks) past returns. The "Secondary Market US Treasury Bills (3M)" is the risk-free rate in US Dollars. The analysis is based on daily total returns from 31/12/1973 to 31/12/2013.
1. Robustness Issues: Potential Sources of a Lack of Robustness

2. Improving Robustness
19

20 An ERI Scientific Beta Publication — Robustness of Smart Beta Strategies — October 2014Copyright © 2014 ERI Scientific Beta. All rights reserved. Please refer to the disclaimer at the end of this document.
ERI Scientific Beta proposes three ways by which robustness of various smart beta strategies can be improved. This section describes each one of them in detail and explains how ERI Scientific Beta incorporates them in its smart beta index construction.
2.1 Avoidance of data miningIn the context of index performance reporting, data mining refers to the process of identifying periods, strategies and/or securities that provide good performance and including them in the index creation process or that of performance reporting, and selectively excluding bad performers. When track records rely, to any material extent, on back-tested data—which is notably the case with smart beta indices—there are risks that the index methodology may have been optimised on the basis of the hindsight-contaminated data (in-sample) with little or no regard for the stability or persistence of its performance beyond this period (out of sample). This creates a bias by amplifying the past performance and such biased performances are less likely to continue in future. Investors must be cautious and carefully watch out for any potential instances of data mining in smart beta strategies.
2.1.1 Importance of a consistent frameworkA very effective mechanism to avoid data mining is by establishing a consistent framework, thus limiting the choices yet providing the flexibility needed for smart beta index creation. Consistency in the index framework has two main benefits. First, it prevents model mining by limiting the number of choices by which indices can be constructed. A uniform framework is the best safeguard against post hoc index design, or model mining (i.e. the possibility of testing a large number of smart beta strategies, and publishing the ones that have good results).
Second, analysis across specification choices is vital because the range of outcomes gives a more informative view than a single specification which could always have been picked. An index that performs well across multiple specification choices is more robust than an index that performs only in a single specification choice which could very well have been by chance rather than due to the robustness of the strategy. Pre-packaged indices do not allow investors to make comparisons across specifications, depriving them of the possibility of observing the sensitivity of performance with respect to index specification choices and thus leaving them exposed to a risk of unintended consequences of undesired risks.
The ERI Scientific Beta platform offers 23 different stock selection choices, each defined by a risk factor. Exhibit 11 represents the frequency distribution of difference in Sharpe Ratios of Diversified Multi-Strategy indices over their corresponding tilted CW indices for each of these 23 stock selection choices using US long-term track records. It is shown that, for all the stock selection choices, the Diversified Multi-Strategy indices have higher a Sharpe Ratio. Thus we can conclude that the performance of Diversified Multi-Strategy weighting scheme is robust across all stock selection choices (i.e. it outperforms the cap-weighting on same stocks irrespective of the factor inclination of
2. Improving Robustness

underlying universe). It is able to do so because it does not take as much as unrewarded risk as the cap-weighted portfolio does. In that sense, the weighting scheme can be termed as highly relative robust.
Exhibit 11: Frequency Distribution of Difference in Sharpe Ratios of Multi-Strategy Indices with different stock selections with respect to Cap-Weighted ReferencesERI SciBeta Diversified Multi-Strategy Indices with 23 different stock selection choices built upon a consistent framework and their corresponding cap-weighted benchmarks are used. The analysis is based on daily total returns from 31/12/1973 to 31/12/2013. The chart represents the frequency distribution of difference in Sharpe Ratios of Multi-Strategy indices over their corresponding cap-weighted benchmarks for 23 different stock selection choices.
2.1.2 Scientific Beta consistent design frameworkERI Scientific Beta uses a consistent smart beta index design framework for the construction of its entire set of smart beta indices known as the Smart Beta 2.0 approach. In this approach to index construction, a clear separation of the selection and weighting phases is done which enables investors to choose the risks to which they do or do not wish to be exposed. A well-diversified weighting scheme provides efficient access to the risk premia associated with this factor exposure. The idea is to construct an investable proxy for the risk factor (beta) chosen while reducing unrewarded risks through the use of a well-diversified weighting scheme.
Such ex-ante methodological framework for constructing a portfolio is a tool to avoid the trap of constructing ad hoc methodologies that only perform well in the backtest. All the available variations (or choices) provided within the framework are based on proven academic or applied research allowing flexibility to accommodate various investor preferences. Moreover, publishing a wide range of indices that correspond to variations within a given index design framework allows investors to assess the sensitivity of each index construction strategy to the model specification choices.
2. Improving Robustness
An ERI Scientific Beta Publication — Robustness of Smart Beta Strategies — October 2014Copyright © 2014 ERI Scientific Beta. All rights reserved. Please refer to the disclaimer at the end of this document.
21

22 An ERI Scientific Beta Publication — Robustness of Smart Beta Strategies — October 2014Copyright © 2014 ERI Scientific Beta. All rights reserved. Please refer to the disclaimer at the end of this document.
Exhibit 12: Overview of Smart Beta
Exhibit 13 shows the list of factor tilts available in the Smart Beta 2.0 platform. All the factors can be optionally combined with liquidity screening to ensure investability of the indices in different geographical regions. Each factor tilt offers two variations – one tilting towards the factor exposure in order to obtain the long-term risk premium of the corresponding factor and the other tilting away in order to reap short-term benefits, even though there is no long-term risk premium. The true potential of smart beta lies in its diversification potential which is achieved through various heuristic and scientific weighting schemes aimed at providing systematic diversification. ERI Scientific Beta provides the following weighting schemes (Exhibit 13) for index construction: Maximum Deconcentration, Maximum Decorrelation, Efficient Minimum Volatility, Efficient Maximum Sharpe Ratio, Diversified Risk Weighted and Diversified Multi-Strategy. A brief description of each weighting scheme is presented in the appendix for reference. A detailed description and calculation methodology of each weighting scheme can be found on the website, www.scientificbeta.com. In addition to the various weighting schemes, ERI Scientific Beta provides various risk control options to limit the tracking error from the cap-weighted index, which is still the widely used benchmark. Geographical and sector neutrality conditions can also be imposed.
Exhibit 13: ERI Scientific Beta’s Consistent Index Design Framework
2. Improving Robustness

2.1.3 Consistency of competitors and Scientific Beta indicesTraditional factor indices fall into two major categories. The first involves maximising the exposure to a factor by selecting stocks that are most exposed to the desired risk factor and the application of a cap-weighting scheme to this selection. The MSCI High Dividend Yield index is an example of this approach. While this approach brings the exposure to the desired factor, the problem of poor diversification arising from high concentration in a small number of stocks remains unanswered. The second method weights either the whole of the universe (MSCI Value) or a part of universe (MSCI Momentum) by the exposure to this factor resulting in score/rank weighting. Here again, the maximisation of the factor exposure does not guarantee that the indices are well diversified.
To overcome these difficulties, index providers that generally offer factor indices on the basis of the first two approaches have recently sought to take advantage of the development of smart beta indices to offer investors a new framework for smart factor investing (Bender et al., 2013). This approach recognises that smart betas have implicit risk exposures and aim to select and combine them according to these varying exposures. The drawback of this approach is that it maximises neither the factor exposure nor the diversification of the indices. For example, a minimum volatility index on broad universe does not guarantee either the highest exposure to low volatility stocks or the best diversification of this low volatility portfolio. Moreover, it brings about other kinds of undesired risks such as exposure to defensive sectors, a problem discussed earlier. Similarly, seeking exposure to the size factor through equal weighting of a broad universe is certainly less effective than selecting the smallest size stocks in the universe and then diversifying them, including with an equal-weighted scheme. Also, no control for the undesired liquidity risk is implemented.
Exhibit 14 compares the design framework of the factor based strategy indices offered by MSCI and ERI Scientific Beta. MSCI follows different stock selection schemes, weighting schemes and risk control options for different risk factors. Not only is the approach not the optimal from the standpoint of a well-diversified factor index, but the lack of uniformity in index design across factor indices may also introduce the data mining bias described earlier.
ERI Scientific Beta, on the other hand, offers a single consistent framework, which forms the basis on which all the factor indices are constructed. Clearly the consistent design is superior as it leaves no room for discretionary manipulation and mining by limiting the number of ways an index can be constructed.
2. Improving Robustness
An ERI Scientific Beta Publication — Robustness of Smart Beta Strategies — October 2014Copyright © 2014 ERI Scientific Beta. All rights reserved. Please refer to the disclaimer at the end of this document.
23

24 An ERI Scientific Beta Publication — Robustness of Smart Beta Strategies — October 2014Copyright © 2014 ERI Scientific Beta. All rights reserved. Please refer to the disclaimer at the end of this document.
Exhibit 14: Comparison of consistency in index construction framework between MSCI and ERI SciBeta
Factor Index Stock Selection Weighting Scheme Risk Controls
MSCI Index Methodologies
Size MSCI Equal-Weight Index All stocks in CW parent
index universe Equal-weighted None
Value MSCI Value-Weighted
index All stocks in CW parent
index universe Score adjusted by investability factor
None
Mom. MSCI Momentum Index
Selection by momentum score (fixed number of
constituents to target 30% market cap coverage)
Market cap * momentum score
Cap on weight of individual security
Low Vol. MSCI Minimum Volatility
Index All stocks in CW parent
index universe Optimisation to minimise
portfolio risk
Sector and country weight constraints Cap on multiple of market cap of
individual security
Yield MSCI High Dividend Yield
Index
Select stocks with dividend yield > 1.3x
parent index dividend yield
Market cap weighted Cap on weight of
individual security
Scientific Beta Index Methodologies
Size SciBeta Div. Multi-Strategy
Mid Cap Index
Half the stocks by relevant score
Same weighting scheme for selected stocks
(Diversified Multi-Strategy by default)
Cap on multiple of market cap and weight of
individual securities
Value SciBeta Div. Multi-Strategy
Value Index
Mom. SciBeta Div. Multi-Strategy
High Momentum Index
Low Vol. SciBeta Div. Multi-Strategy
Low Volatility Index
Yield SciBeta Div. Multi-Strategy High Dividend Yield Index
Another approach to the inconsistency of conceptual framework, in addition to comparing construction methods for different factors as we did for MSCI, is by looking at the evolution or change of methodology over time for same strategy or for same factor. Russell launched new factor indices to create a new brand known as ‘High Efficiency’ (HE) indices when it already had the following factor indices in the market – Russell 1000 High Momentum, Russell 1000 Low Volatility and Russell 1000 Value. The new indices have the same objective as old ones, but different construction principles.
This phenomenon has a striking resemblance to the practice of fund or asset managers of creating new funds or changing the strategy of funds in order to overshadow the bad track record of the old fund. Exhibit 15 shows the performance difference between the new and old set of Russell indices. Thus, an inconsistent framework (over time) is also a form of model mining that allows the index providers to launch new indices with better track records.
2. Improving Robustness

Exhibit 15 : Russell Factor Indices Performance ComparisonAll statistics are annualised and daily total returns are used for the analysis.
USA Russell Factor Indices
Methodology Time PeriodAnnual Returns
Annual Volatility
Sharpe Ratio
Russell 1000 High Efficiency Momentum
Tilt the portfolio based on Momentum score taking market cap weight of stock in the Russell 1000 Index as starting point. 01/01/2005
to 31/12/2013
8.69% 21.62% 0.33
Russell 1000 High Momentum
Cap weight up to 200 highest momentum stocks in Russell 1000 Index.
8.05% 20.59% 0.31
Russell 1000 High Efficiency Low Volatility
Tilt the portfolio based on Low Volatility score taking market cap weight of stock in the Russell 1000 Index as starting point. 01/01/2005
to 31/12/2013
7.89% 17.73% 0.36
Russell 1000 Low Volatility
Cap weight up to 200 highest least volatile stocks in Russell 1000 Index.
7.69% 16.35% 0.37
Russell 1000 High Efficiency Value
Tilt the portfolio based on Value score (B/M and E/P ratios) taking market cap weight of stock in the Russell 1000 Index as starting
point. 31/12/2003 to
31/12/2013
9.76% 22.55% 0.36
Russell 1000 Value
Tilt the portfolio based on Value probability (B/M, sales per share growth, I/B/E/S growth) taking market cap weight of stock in the
Russell 1000 Index as starting point.7.56% 21.96% 0.27
2.2 Improving relative robustness: Avoidance of unrewarded risksAs seen in Section 1.2.2, smart beta strategies are prone to sources of various unrewarded risks which limit the ability of the strategies to provide robust performance with respect to the underlying factors. The true MSR portfolio is the only portfolio that contains zero unrewarded risk. It can be shown that for a factor model with the assumption of zero alpha and replicable factors, the specific risk of the true (long-short) MSR portfolio is zero. Therefore, everything that distances the portfolio from true MSR (i.e. parameter estimation risk and optimality risk) will result in the introduction of unrewarded risk. Hence, it is essential to avoid these unrewarded risks in order to improve robustness. This section explains the various methods by which ERI Scientific Beta improves robustness of its smart beta strategies.
2.2.1 Robust risk parameter estimationFollowing Tobin’s Separation Theorem (Tobin, 1958), one must allocate wealth between the MSR portfolio and a riskless investment in proportion to the investor’s risk appetite. In that sense, the only portfolio of risky assets that should be of interest to a rational investor is the Maximum Sharpe Ratio (MSR) portfolio. Proxies for MSR portfolios suffer from the error associated with the estimation of expected returns. There is ample academic research to suggest that the loss associated with errors in estimation of expected return may outweigh the benefits arising from its use in the mean-variance optimisation (Britten-Jones, 1999; Jagannathan and Ma, 2003; Merton, 1980).
While aforementioned research has not produced any solution to the problem of expected return estimation, extant academic literature proposes numerous approaches to improve statistical estimation of risk parameters. The sample estimator of the covariance matrix produces extremely
2. Improving Robustness
An ERI Scientific Beta Publication — Robustness of Smart Beta Strategies — October 2014Copyright © 2014 ERI Scientific Beta. All rights reserved. Please refer to the disclaimer at the end of this document.
25

26 An ERI Scientific Beta Publication — Robustness of Smart Beta Strategies — October 2014Copyright © 2014 ERI Scientific Beta. All rights reserved. Please refer to the disclaimer at the end of this document.
high estimation errors when the ratio of universe size (N) to sample size (T) is large (Kan and Zhou, 2007) – otherwise known as sample risk.
One solution to this problem is to reduce the number of estimated parameters by imposing a structure on the covariance matrix. This is done either by using a constant correlation model (Elton and Gruber, 1973) or by postulating a factor model (Chan et al., 1999). An explicit multi-factor model decomposes the returns of an asset into its expected rewards for exposure to risk factors. Using the loadings of the stocks on these factors, the correlation can be estimated while avoiding the noise in the estimation of individual correlation terms. Although this method reduces sample risk, its drawback is that the estimator is biased if the risk model does not conform to the true stock return generating process – otherwise known as model risk.
Exhibit 16: Number of factors vs. Number of parameters in estimation
Number of Stocks
50 100 500
Parameters in full sample covariance 1,275 5,050 125,250
Parameters in a five-factor model 315 615 3,015
Parameters in a one-factor model 101 201 1,001
The next generation of estimators aims to achieve a trade-off between sample risk and model risk by combining sample estimators and structured estimators. This approach is known as Shrinkage estimators (Ledoit and Wolf, 2003, 2004) as the structured estimator is shrunk towards a fixed target covariance matrix. Another way to reduce sample risk and not necessarily at the cost of model risk is to use implicit factor model such as principal component analysis (PCA) where each factor is modelled as a linear combination of returns of the index constituents. This approach is adopted by ERI Scientific Beta to estimate covariance matrices.
The factors from the PCA have the benefit of being uncorrelated and of providing the best summary of the information contained in the dataset (i.e. zero model risk). However, some sample risk still exists, namely the risk of recovering factors that only explain the variability of returns in the sample period. To reduce this risk, the number of statistical factors is limited using a criterion from Random Matrix Theory in order to achieve parsimony and robustness (Plerou et al., 2002). Coqueret and Milhau (2014) show that minimum volatility strategies using Principal Component (PC) and Shrinkage estimators tend to have lower volatilities compared to other estimation techniques. More importantly, PC estimators result in lower turnover than Shrinkage estimators, which is an extremely desirable property in portfolio construction.
As shown in Section 1.2.3, ex-post, the proxy for traditional MSR portfolio contains more estimation risk than a proxy for minimum volatility portfolio. However, it is possible to reduce this estimation risk by not directly estimating the expected returns which, as shown by Merton (1980), are impossible to estimate due to the diverging nature of the estimator. Instead, one could use a hypothesis that links expected returns to the level of risk and estimate this risk parameter using a convergent estimator.
2. Improving Robustness

7 - This is in contrast to the CAPM, which predicts that expected excess returns are proportional to betas.8 - Jagannathan and Ma (2003) show that long only constraints not only control the concentration but also improve the performance of Minimum Volatility portfolios.9 - We impose an upper bound ui and a lower bound li on the weight of each constituent security, where i=1,…, N and N is the nominal number of constituents. Stock weights are bound to be below 3/N and above 1/3N, where N denotes the number of constituents.
Thus under the Scientific Beta Efficient MSR Index methodology, we try to minimise expected return estimation error for MSR by using a risk based approach instead of relying on either direct estimation of expected return from past returns or from specifying an asset pricing model to derive expected return estimates. In particular, we use downside risk as a measure of a stock's risk, which is consistent with existing literature (Chen et al., 2009) documenting a positive relation between expected return and downside risk.7
2.2.2 Improved diversification through weight constraintsOne serious concern with optimisation based weighting schemes is that the stocks with the highest estimation error may receive the highest weight – a process commonly known as “Error Maximisation”. This could lead to the problem of concentration in fewer stocks or in specific sectors. The concentration in few stocks exposes the strategy to idiosyncratic or stock-specific risk. Similarly, over-weighting of certain sectors exposes the strategy to sector shocks. In both cases, the presence of unrewarded risk prevents the weighting scheme from being robust in a relative sense.
It is well understood that application of weight constraints to control risk exposures and to limit portfolio concentration is necessary in most, if not all, cases. Most index providers use some form of weight constraint in their portfolio weighting process. Attention must be paid at this step because complex definitions of weight constraint can again expose one to the risk of data mining. One could backtest portfolios using many different weight constraints and could select the one which has the best performance. Therefore, overly complex weight constraints must be avoided and one must make sure that the design of a weight constraint is well justified. Lastly, it must be noted that the primary role of weight constraints is to control under- and over-weighting of stocks, and not performance generation. Therefore weight constraints that affect performance more than the optimisation itself are not robust.
The most straightforward solution to the problem of high concentration in few stocks is to impose weight constraints on individual stocks. Imposing lower and/or upper bounds on stock weights provides quite rigid constraints which leaves reduced room for optimisation, but can help to obtain more reasonable portfolios.8 ERI Scientific Beta uses two types of constraints to improve diversification – a long only constraint and a deconcentration constraint. Jagannathan and Ma (2003) provided empirical evidence that imposing non-negativity constraints remove large outliers and hence provide better performance through better diversification. Deconcentration constraints ensure sufficiently balanced weights across constituents.9 DeMiguel et al. (2009) introduce flexible quadratic constraints on portfolio concentration (so-called “norm constraints”) in minimum volatility portfolios and show that this leads to better out-of-sample risk and return properties. Such constraints put limits on the overall amount of concentration in the portfolio (e.g. on the sum of squares of portfolio weights) rather than limiting the weight of each stock in the portfolio, thus leaving more room for the optimiser while avoiding overall concentration.
2. Improving Robustness
An ERI Scientific Beta Publication — Robustness of Smart Beta Strategies — October 2014Copyright © 2014 ERI Scientific Beta. All rights reserved. Please refer to the disclaimer at the end of this document.
27

28 An ERI Scientific Beta Publication — Robustness of Smart Beta Strategies — October 2014Copyright © 2014 ERI Scientific Beta. All rights reserved. Please refer to the disclaimer at the end of this document.
10 - = Effective Number of Stocks= , where N is the number of constituent stocks in the index and Wi is the weight of stock i in the index.
11 - See Timmermann (2006), Kan and Zhou (2007), Tu and Zhou (2010) and Amenc et al. (2012) on benefits of combining portfolio strategies.12 - The intuition presented by the authors is the following: the 1/N rule (i.e. equal-weighting) is biased but has zero variance. However, a sophisticated rule (i.e. alternative weighting) is asymptotically unbiased but can have large variance (especially in small samples). When we combine the 1/N rule with a sophisticated rule, an increase of the weight on the 1/N rule increases the bias but decreases the variance. Thus the performance of the combination rule depends on the trade-off between the bias and the variance. Finally, the authors add that the performance of the combination rule can be improved and maximised by choosing an optimal weight.
ERI Scientific Beta applies norm constraints for the Minimum Volatility weighting scheme by putting a lower bound on the effective number of stocks of the portfolio – Neff.10
It is important to understand that parameter estimation risk can only be diminished and cannot be removed completely. Even a robust estimation technique can result in large individual stock weights. Therefore whatever the method chosen, weight constraint becomes an important safeguard against undesired risks, especially in the case of optimisation based strategies. Implementing suitable weight constraint is an important step towards diversifying these unintended hidden risks and therefore achieving relative robustness.
2.2.3 Diversification of model risksEven though the different weighting schemes offer efficient diversification of stocks, there is an additional need for diversification of the weighting schemes to diversify away the strategy specific risks – a concept called “Diversifying the Diversifiers”.11 Martellini, Milhau and Tarelli (2013) find that combining equal-weighted portfolios and Minimum Volatility portfolios leads to a higher Sharpe ratio than holding any of the component strategies in isolation. Tu and Zhou (2010) combine the equal-weighted portfolio with Markowitz type portfolio optimisation strategies and show that it is valuable to combine portfolio strategies in the presence of estimation errors.12 Kan and Zhou (2007) show that when there is parameter uncertainty, following the standard prescription of portfolio theory to hold only the MSR (or tangency) portfolio and the riskless asset is never optimal. An investor can benefit by holding some other risky portfolios that help reduce the parameter estimation risk of the MSR portfolio. The combination of different strategies allows the diversification of risks that are specific to each strategy by exploiting the imperfect correlation between the different strategies’ parameter estimation errors. Thus, diversifying the model risks further reduces the unrewarded risks and renders the weighting scheme more robust. ERI Scientific Beta Diversified Multi-Strategy index combines, in equal proportions, the Efficient Maximum Sharpe Ratio, the Efficient Minimum Volatility, the Maximum Deconcentration, the Maximum Decorrelation and the Diversified Risk Parity weighting schemes.
2. Improving Robustness

Exhibit 17: Diversification of Model-Specific Risks
2.3 Improving absolute robustness: Avoiding concentration in a single factorInvestors who rely on exposure to a single factor take the risk of the underlying factor likely underperforming in short periods. Using smart beta indices as well-diversified ingredients that provide exposure to desired risk factors, we now analyse the potential benefits of combining factor tilts (“multi-beta allocations”). There is strong intuition suggesting that multi-factor allocations will tend to result in improved risk-adjusted performance. In fact, as shown earlier in Section 1.2.3, even if the factors to which the factor indices are exposed are all positively rewarded over the long term, there is extensive evidence that they may each encounter prolonged periods of underperformance. More generally, the reward for exposure to these factors has been shown to vary over time (see e.g. Harvey, 1989; Asness, 1992; Cohen, Polk and Vuolteenaho, 2003). If this time variation in returns is not completely in sync for different factors, allocating across factors allows investors to diversify the sources of their outperformance and smooth their performance across market conditions. In brief, the cyclicality of returns differs from one factor to another (i.e. the different factors work at different times) and combing them offers further diversification benefits. Exhibit 18 shows the correlation of relative returns of factor tilted multi-strategy indices over cap-weighted benchmark. The indices are not perfectly correlated with each other, showing a potential for diversification across factors in order to reduce risk and generate smoother outperformance over time.
2. Improving Robustness
An ERI Scientific Beta Publication — Robustness of Smart Beta Strategies — October 2014Copyright © 2014 ERI Scientific Beta. All rights reserved. Please refer to the disclaimer at the end of this document.
29
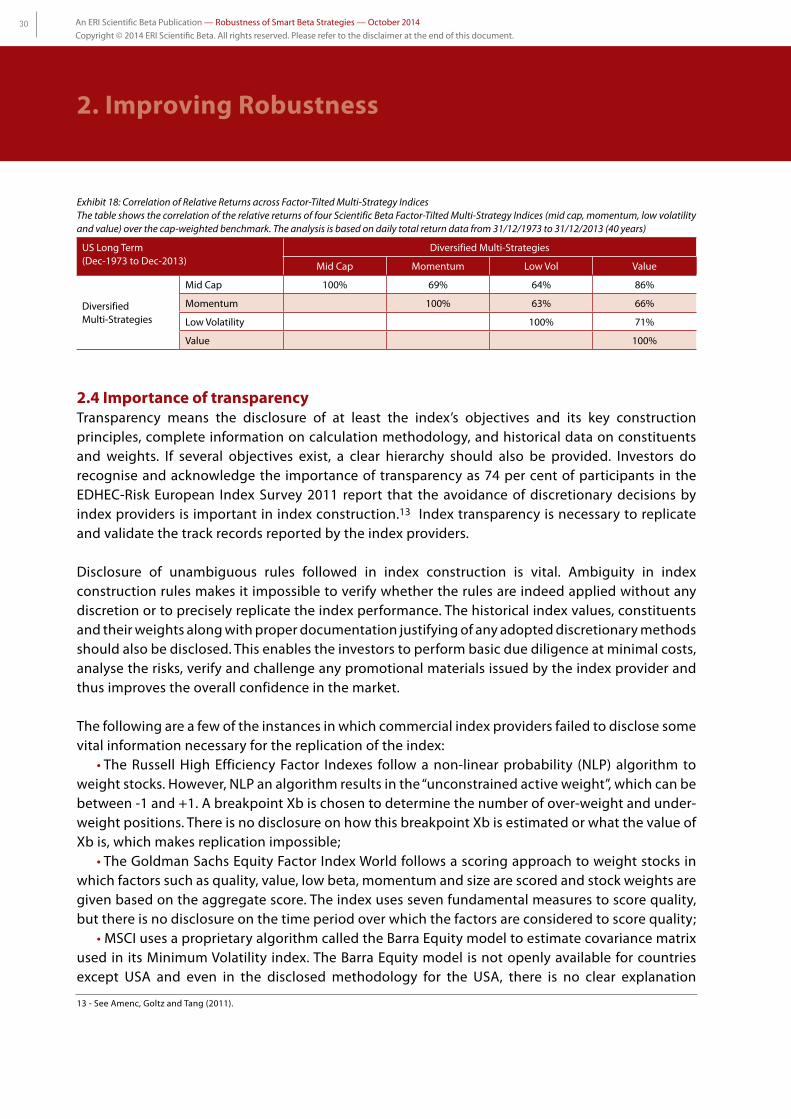
30 An ERI Scientific Beta Publication — Robustness of Smart Beta Strategies — October 2014Copyright © 2014 ERI Scientific Beta. All rights reserved. Please refer to the disclaimer at the end of this document.
13 - See Amenc, Goltz and Tang (2011).
Exhibit 18: Correlation of Relative Returns across Factor-Tilted Multi-Strategy IndicesThe table shows the correlation of the relative returns of four Scientific Beta Factor-Tilted Multi-Strategy Indices (mid cap, momentum, low volatility and value) over the cap-weighted benchmark. The analysis is based on daily total return data from 31/12/1973 to 31/12/2013 (40 years)
US Long Term (Dec-1973 to Dec-2013)
Diversified Multi-Strategies
Mid Cap Momentum Low Vol Value
Diversified Multi-Strategies
Mid Cap 100% 69% 64% 86%
Momentum 100% 63% 66%
Low Volatility 100% 71%
Value 100%
2.4 Importance of transparencyTransparency means the disclosure of at least the index’s objectives and its key construction principles, complete information on calculation methodology, and historical data on constituents and weights. If several objectives exist, a clear hierarchy should also be provided. Investors do recognise and acknowledge the importance of transparency as 74 per cent of participants in the EDHEC-Risk European Index Survey 2011 report that the avoidance of discretionary decisions by index providers is important in index construction.13 Index transparency is necessary to replicate and validate the track records reported by the index providers.
Disclosure of unambiguous rules followed in index construction is vital. Ambiguity in index construction rules makes it impossible to verify whether the rules are indeed applied without any discretion or to precisely replicate the index performance. The historical index values, constituents and their weights along with proper documentation justifying of any adopted discretionary methods should also be disclosed. This enables the investors to perform basic due diligence at minimal costs, analyse the risks, verify and challenge any promotional materials issued by the index provider and thus improves the overall confidence in the market.
The following are a few of the instances in which commercial index providers failed to disclose some vital information necessary for the replication of the index: • The Russell High Efficiency Factor Indexes follow a non-linear probability (NLP) algorithm to weight stocks. However, NLP an algorithm results in the “unconstrained active weight”, which can be between -1 and +1. A breakpoint Xb is chosen to determine the number of over-weight and under-weight positions. There is no disclosure on how this breakpoint Xb is estimated or what the value of Xb is, which makes replication impossible; • The Goldman Sachs Equity Factor Index World follows a scoring approach to weight stocks in which factors such as quality, value, low beta, momentum and size are scored and stock weights are given based on the aggregate score. The index uses seven fundamental measures to score quality, but there is no disclosure on the time period over which the factors are considered to score quality; • MSCI uses a proprietary algorithm called the Barra Equity model to estimate covariance matrix used in its Minimum Volatility index. The Barra Equity model is not openly available for countries except USA and even in the disclosed methodology for the USA, there is no clear explanation
2. Improving Robustness

on covariance matrix estimation. MSCI Barra does not disclose what and how many factors are considered while estimating the covariance matrix.
Withholding the abovementioned vital information increases the risks of proprietary discretion and prevents the investors from carrying out independent checks to make informed decisions. Such restrictions prevent the provision of research and analysis, including academic research, on indices. In the area of smart beta indices, there is a strong scarcity of relevant research and so there is no way of challenging the publications of index providers.
ERI Scientific Beta offers full transparency on the index construction methodology which is based on unambiguous ground rules, the historical values, constituents and their weights, various performance measures and documentation on how they are computed and long-term track records. Exhibit 19 summarises how to improve robustness in smart beta performance.
Exhibit 19: Best practices to improve robustness
Category Best Practices: Requirements for Robustness
Common practice: Risk of a Lack of Robustness
Methodology Consistent Framework
Ad hoc Methodologies open the door for data mining / model mining
Factor Definitions Simple, Tried and Tested Factors
(e.g. Price to book for ‘value’)
Complex, Proprietary and Unproven Factor Definitions(e.g. Use of proprietary variables, adjustments or
constraints)
Weighting scheme Diversification of model risk and robust risk parameter estimation
Choice of a single weighting model and high sensitivity to input parameters
Transparency Full Transparency – Free access to historical constituents and weights and unambiguous
ground rules
Opaque and restricted or no access to back test data with ambiguous ground rules
2. Improving Robustness
An ERI Scientific Beta Publication — Robustness of Smart Beta Strategies — October 2014Copyright © 2014 ERI Scientific Beta. All rights reserved. Please refer to the disclaimer at the end of this document.
31

32 An ERI Scientific Beta Publication — Robustness of Smart Beta Strategies — October 2014Copyright © 2014 ERI Scientific Beta. All rights reserved. Please refer to the disclaimer at the end of this document.
2. Improving Robustness

3. Measurement of Robustness
33

34 An ERI Scientific Beta Publication — Robustness of Smart Beta Strategies — October 2014Copyright © 2014 ERI Scientific Beta. All rights reserved. Please refer to the disclaimer at the end of this document.
There are a wide range of measures that can be used to assess the robustness of smart beta strategies. In this section, we will explore some of the essential measures that allow investors to carry out a comprehensive robustness check of the smart beta strategies. We categorise these measures into two groups – one instrumental in assessing relative robustness of strategies, and another used for assessing absolute robustness. Extreme risk measures including a relative drawdown analysis and a factor attribution exercise are useful measures of relative robustness. On the other hand, outperformance probability and analysis of performance conditional on market condition are some of the useful tools to measure absolute robustness. In subsequent sub-sections, we provide the definition of each robustness measure, explain how to compute it and explain its relevance through relevant illustrations using Scientific Beta’s single beta and multi-beta factor indices.
Multi-Beta Multi-Strategy (MBMS) indices are combination of individual factor based multi-strategy indices such as the mid-cap multi-strategy index, the momentum multi-strategy index, the low volatility multi-strategy index and the value multi-strategy index. The individual factor tilted indices offer exposure to the desired risk factor to capture its premium. ERI Scientific Beta offers two variants of the MBMS index – Equally-Weighted (EW) and Equal Risk Contribution (ERC). The MBMS EW Allocation is the equal combination of the four Factor-Tilted Diversified Multi-Strategies (low volatility, mid-cap, value and momentum). The MBMS ERC Allocation is an optimised combination of the four tilted indices in which beginning-of-quarter optimal allocations to the component indices are determined from the covariance of the daily relative returns of the component indices over the last 6 quarters (18 months), so as to obtain (in-sample) equal contributions to the (tracking error) risk.
3.1 Extreme RiskThere are two risk measures commonly used to estimate the downside tail risk of a strategy: Value-at-Risk (VaR) and Conditional Value-at-Risk (CVaR). VaR measures risk as the maximum amount of the loss that the strategy is expected to suffer over a given period and for a given tail probability, while CVaR measures risk as the average loss provided that the loss exceeds a given reference VaR threshold. Various methodologies exist for estimation of VaR and CVaR including the non-parametric historical method (Historical VaR), the non-parametric Cornish Fisher method (Cornish-Fisher 5% VaR), and various parametric methods. The reliability of the methods varies depending on the tail probability embedded in the definition of VaR and CVaR. If the investor is interested in risk statistics reflecting the deeper left tail of the strategy return distribution, the two non-parametric methods generally become less reliable for two reasons: (i) there are fewer data points because by definition the extreme losses are rare events; and (ii) the information on skewness, kurtosis, and higher-order moments in general contained in the data points from the body of the distribution becomes less relevant for the lower quintiles in the left tail. On the other hand, a full parametric approach relies on an explicit parametric specification of the strategy return distribution which is related to taking model risk. A good trade-off between the non-parametric methods and the full parametric method is the semi-parametric approach based on Extreme Value Theory (EVT).
3. Measurement of Robustness

ERI Scientific Beta uses a GARCH-EVT model to estimate VaR and CVaR in which EVT is applied through the POT (Peak-over-Threshold) method. In particular, a GARCH(1,1) model is estimated and then the residuals are extracted from the estimated model – see Furió and Climent (2013) for additional information about the adequacy of the GARCH(1,1) model. The important threshold parameter in the POT method is set to be equal to the 10% quantile of the residuals, as suggested by Chavez-Demoulin et al. (2011). The 1% VaR and 1% CVaR are calculated through the fitted Generalised Pareto Distribution (GPD) and a forecast of volatility generated through the GARCH(1,1) model. For additional details about the model and an empirical study, see Loh and Stoyanov (2013). The Extreme Risk module provides 1% VaR and 1% CVaR risk statistics of strategies and the cap-weighted benchmark aggregated for a selected period of time, the risk-return ratios based on the 1% VaR and 1% CVaR risk statistics, and also monthly forecasts of the two risk statistics. The same analysis is provided both for absolute and relative returns.
Exhibit 20 shows that the extreme risk such as EVT 1% VaR and EVT 1% CVaR of smart beta strategies is less than that of the cap-weighted benchmark. Since Scientific Beta factor and multi-factor indices rely on two levels of diversification – one at stock level and another at strategy level – the concentration in fewer individual stocks or sectors is reduced. The lower level of tail risk of smart beta strategies provides an evidence of the said reduction of unrewarded risk and is therefore an indicator of improved relative robustness.
Exhibit 20: Extreme Risk Analysis of USA Long-Term MBMS and Single Factor IndicesComplete stock universe consists of 500 largest stocks in USA. S&P-500 is used as the cap-weighted benchmark. The table shows summary statistics of extreme risks of the MBMS and Single Factor Multi-Strategies from 31/12/1973 to 31/12/2013 (40 years). The corresponding statistics of the cap-weighted reference index (Broad CW) are also reported.*
US Long Term (Dec-1973 to Dec-2013)
SciBeta US Broad CW
Diversified Multi-Strategies
Mid Cap Momentum Low Vol Value Multi-Beta Multi-Strategy EW
Multi-Beta Multi-Strategy ERC
Absolute Extreme Risks
Annual Returns 10.95% 15.67% 14.57% 13.90% 15.70% 15.04% 14.84%
EVT 1% VaR 2.37% 2.10% 2.15% 1.90% 2.12% 2.04% 2.04%
EVT 1% CVaR 2.91% 2.55% 2.64% 2.32% 2.59% 2.49% 2.49%
Ret to EVT 1% VaR ratio 0.15 0.31 0.27 0.28 0.30 0.30 0.29
Ret to EVT 1% CVaR ratio 0.12 0.25 0.22 0.23 0.25 0.24 0.24
Monthly EVT 1% VaR(F)* 8.56% 7.97% 8.18% 7.10% 8.41% 7.78% 7.74%
Monthly EVT 1% CVaR(F)* 10.65% 9.66% 10.06% 8.73% 10.37% 9.50% 9.43%
Relative Extreme Risks
Excess Returns - 4.72% 3.62% 2.95% 4.75% 4.09% 3.88%
EVT 1% VaTER - 0.89% 0.65% 0.79% 0.77% 0.67% 0.64%
EVT 1% CVaTER - 1.09% 0.80% 0.97% 0.94% 0.82% 0.78%
Ret to EVT 1% VaTER ratio - 0.33 0.34 0.23 0.38 0.38 0.38
Ret to EVT 1% CVaTER ratio - 0.27 0.28 0.19 0.31 0.31 0.31
Monthly EVT 1% VaTER(F)* - 2.44% 2.06% 2.50% 2.03% 1.80% 1.77%
Monthly EVT 1% CVaTER(F)* - 2.96% 2.52% 3.03% 2.47% 2.22% 2.18%
3. Measurement of Robustness
An ERI Scientific Beta Publication — Robustness of Smart Beta Strategies — October 2014Copyright © 2014 ERI Scientific Beta. All rights reserved. Please refer to the disclaimer at the end of this document.
35

36 An ERI Scientific Beta Publication — Robustness of Smart Beta Strategies — October 2014Copyright © 2014 ERI Scientific Beta. All rights reserved. Please refer to the disclaimer at the end of this document.
3.2 Relative DrawdownExtreme losses occur in any risky investment and smart beta is not an exception. What matters most is the how big is the loss, how long it takes to recover from the loss and if the loss can be explained by a clear economic rationale or if it is a result of some random phenomenon. It is important to see if the losses can be explained through market fundamentals and if the reasons are in line with the index construction methodology. If not, then there are other unintended risks at play which reduce the relative robustness of the strategy.
Reporting of maximum loss statistics is another important pillar in robustness analysis. Drawdown analysis, both in absolute and relative terms, must be performed to identify the maximum potential loss that could happen. Maximum Drawdown measures the maximum loss experienced by a strategy between a peak and a valley over a specified period. The Maximum Relative Drawdown measures the maximum relative loss experienced by a strategy between a peak and a valley over a specified period.Maximum Drawdown represents the maximum loss an investor can suffer from investing in the strategy at the highest point and selling at the lowest. It is the largest single drop from peak to bottom in the value of a portfolio (before a new peak is achieved). Time under water is the length of the time the drawdown lasted. The maximum relative drawdown measure is the maximum drawdown experiment by an index long in strategy and short in cap-weighted benchmark. The measure represents the maximum relative loss that can be incurred by the strategy.
Exhibit 21 presents the results of absolute drawdown analysis. In absolute terms, the multi-beta and single factor multi-strategies suffer almost identical maximum drawdowns as that of the cap-weighted reference. The maximum drawdown occurred during 2008 sub-prime mortgage crisis. The recovery from the loss happened much quicker for smart beta strategies compared to their cap-weighted counterpart.
Exhibit 21: Maximum Drawdown AnalysisThe analysis is based on daily total returns data from 31/12/1973 to 31/12/2013 (40 years). The S&P-500 is used as the cap-weighted benchmark. Maximum Drawdown represents the maximum loss an investor can suffer from investing in the strategy at the highest point and selling at the lowest. It is the largest single drop from peak to bottom in the value of a portfolio (before a new peak is achieved).
US Long Term (Dec-1973 to Dec-2013)
SciBeta US Broad CW
Diversified Multi-Strategies
Mid Cap Momentum Low Vol Value Multi-Beta Multi-Strategy EW
Multi-Beta Multi-Strategy ERC
Maximum Drawdown 54.53% 58.11% 49.00% 50.13% 58.41% 53.86% 53.30%
Start of Maximum DD 09/10/2007 13/07/2007 19/07/2007 04/06/2007 04/06/2007 04/06/2007 04/06/2007
Maximum Loss Point 09/03/2009 09/03/2009 09/03/2009 09/03/2009 09/03/2009 09/03/2009 09/03/2009
Recovery Completed on 26/03/2012 10/12/2010 08/02/2011 08/02/2011 17/02/2011 18/01/2011 27/01/2011
Exhibit 22 presents the results of relative drawdown analysis of MBMS indices and the individual factor indices. For the vast majority of the years the MBMS indices outperform the cap-weighted benchmark except for the period from 1994 to 1999, marking the formation of the technology bubble which eventually burst in 2000. During the formation of the bubble, the cap-weighted benchmark over-weighted the booming technology stocks compared to the smart beta strategies which maintained
3. Measurement of Robustness

effective diversification and, during that period, MBMS indices thus underperformed relative to the cap-weighted benchmark. For the smart beta strategies, the maximum relative loss happened during the late 1990s technology bubble when the cap-weighted benchmark was concentrated in few technology stocks. The maximum relative drawdown started 1994 and the maximum loss point is on 2000 just when the bubble exploded and the recovery was complete by 2001 for both multi-beta and single factor strategies.
Exhibit 22: Maximum Relative Drawdown AnalysisThe analysis is based on daily total returns data from 31/12/1973 to 31/12/2013 (40 years). The S&P-500 is used as the cap-weighted benchmark. Maximum relative drawdown is the maximum drawdown of the long-short index whose return is given by the fractional change in the ratio of the strategy index to the benchmark index.
US Long Term (Dec-1973 to Dec-2013)
Diversified Multi-Strategies
Mid Cap Momentum Low Vol Value Multi-Beta Multi-Strategy EW
Multi-Beta Multi-Strategy ERC
Maximum Relative DD 42.06% 17.28% 43.46% 32.68% 33.65% 28.74%
Start of Max Rel DD 24/03/1994 23/03/1994 20/09/1993 22/03/1994 24/03/1994 25/03/1994
Maximum Loss Point 27/03/2000 22/12/1999 10/03/2000 23/03/2000 27/03/2000 27/03/2000
Recovery Completed on 06/09/2001 03/04/2001 06/09/2001 02/03/2001 04/04/2001 04/04/2001
The graphical illustration below (Exhibit 23) of the relative drawdown of MBMS indices gives a better picture of the maximum relative loss and the time period they take to recover from the same.
Exhibit 23: Relative Drawdown Graphical RepresentationThe analysis is based on daily total returns data from 31/12/1973 to 31/12/2013 (40 years). The S&P-500 index is used as the cap-weighted benchmark. Maximum relative drawdown is the maximum drawdown of the long-short index whose return is given by the fractional change in the ratio of the strategy index to the benchmark index.
3. Measurement of Robustness
An ERI Scientific Beta Publication — Robustness of Smart Beta Strategies — October 2014Copyright © 2014 ERI Scientific Beta. All rights reserved. Please refer to the disclaimer at the end of this document.
37

38 An ERI Scientific Beta Publication — Robustness of Smart Beta Strategies — October 2014Copyright © 2014 ERI Scientific Beta. All rights reserved. Please refer to the disclaimer at the end of this document.
Exhibit 24 shows the yearly excess returns of the multi-beta strategies with respect to the cap-weighted reference. It confirms the findings of drawdown analysis. During 1994-1999, because of the tech bubble formation, the concentration of technology stocks in the cap-weighted benchmark provided superior performance to the benchmark. In the short run such concentration may add value because of the high performance of a few large stocks, but in the long run well-diversified indices provide better performance. There are other periods when the factors failed to provide returns but in multi-beta indices these periods are very rare and short.
Exhibit 24: Excess Returns of Multi-Beta Multi-Strategy EW (Panel A) and ERC (Panel B) IndicesThe analysis is based on daily total return data from 31/12/1973 to 31/12/2013 (40 years). The complete stock universe consists of the 500 largest stocks in the USA. The S&P-500 index is used as the cap-weighted benchmark.
PANEL A
PANEL B
3. Measurement of Robustness

3.3 Factor ExposureOne should also analyse the risk exposure of the strategy to common risk factors such as market, value, size and momentum. It is a particularly important robustness check in the case of single and multi-factor indices because it discloses what portion of a strategy’s performance is indeed derived from its exposure to intended risk factor and how much can be attributed to other factors and unexplained alpha. The attribution exercise can be extended to tracking error to monitor the role of each factor in the deviation of strategy from its benchmark.
Many studies have underlined the importance of factor exposures in explaining part of the outperformance of portfolio strategies over cap-weighted indices (see Jun and Malkiel, 2007; Kaplan, 2008; Blitz and Swinkels, 2008; Amenc, Goltz and Le Sourd, 2008). It is crucial for investors to be aware of the factor tilts that result (explicitly or implicitly) from the construction methodology of a smart beta index so that they can assess if such factor tilts are consistent with their investment objectives; or if the performance of the strategy is driven solely by certain factor tilts. The analysis provides information on relative robustness by indicating if the strategy is tilted to the intended risk factor(s) ex-post and if the risk and performance of the strategy is explained by the said factor(s).
Exhibit 25 summarises the results of the five factor model regression analysis of the MBMS indices and the component single factor indices. Each of the individual factor indices, by the nature of their construction, tends to tilt more towards the corresponding risk factors than other indices. For example, the Mid Cap Multi-Strategy index has SMB beta of 0.31, and the Momentum Multi-Strategy index has MOM beta of 0.17. MBMS indices, however, have a balanced to exposure to the rewarded risk factors.
Exhibit 25: Exposure of Single-Factor Multi-Strategy Indices and Multi-Beta Allocations to Equity Risk FactorsThe exhibit shows Carhart 4-factor regression results for Multi-Strategy Factor Indices for four factor tilts – mid cap, high momentum, low volatility, and value – and for EW and ERC allocations on these four factor indices. Factors are based on SciBeta US Long-Term Track Records. The Market factor is the daily return of the cap-weighted index of all stocks that constitute the index portfolio in excess of the risk-free rate. Small size factor is the daily return series of a cap-weighted portfolio that is long the smallest 30% of stocks (by market cap) and short the largest 30% of stocks (by market cap) of the extended universe (i.e. including small caps). Value factor is the daily return series of a cap-weighted portfolio that is long the highest 30% and short the lowest 30% of stocks in the investable universe based on the B/M ratio. Momentum factor is the daily return series of a cap-weighted portfolio that is long the highest 30% and short the lowest 30% of stocks in the investable universe based on 52-week (minus most recent 4 weeks) past returns. The "Secondary Market US Treasury Bills (3M)" is the risk-free rate in US Dollars. All statistics are annualised. The analysis is based on daily total returns from 31/12/1973 to 31/12/2013. The statistics that satisfy 5% significance level are highlighted in bold.
US Long-Term(Dec-1973 to Dec-2013)
Diversified Multi Strategies
Mid Cap Momentum Low Vol Value Multi-Beta Multi-Strategy EW
Multi-Beta Multi-Strategy ERC
Annual Alpha 2.66% 1.84% 2.85% 2.33% 2.45% 2.35%
Market Beta 0.93 0.94 0.78 0.91 0.89 0.89
SMB Beta 0.31 0.16 0.02 0.16 0.16 0.15
HML Beta 0.16 0.09 0.14 0.31 0.17 0.16
MOM Beta 0.00 0.17 0.00 0.03 0.05 0.06
R-Squared 92.20% 95.52% 90.14% 95.00% 94.76% 95.46%
3. Measurement of Robustness
An ERI Scientific Beta Publication — Robustness of Smart Beta Strategies — October 2014Copyright © 2014 ERI Scientific Beta. All rights reserved. Please refer to the disclaimer at the end of this document.
39

40 An ERI Scientific Beta Publication — Robustness of Smart Beta Strategies — October 2014Copyright © 2014 ERI Scientific Beta. All rights reserved. Please refer to the disclaimer at the end of this document.
Exhibit 26 provides further insights into the sources of performance of the single beta and MBMS indices. The return, volatility and tracking error of these strategies are disintegrated into their sources to analyse how much each factor contributes to the returns and risks of each single-factor index and the multi-factor indices. In Panel A – Return attribution, we can see that the market risk factor is the major source of return and the factors contribute to their corresponding factor indices with a significant amount of returns. The MBMS indices on the other hand have their returns sourced across all the factors. In Panel B — Tracking error attribution, risk arises not only from the individual risk factors but also from the interaction of each factor with the others because the factors are imperfectly but correlated with each other. We can notice in Panel B that the MBMS indices diversify away most of idiosyncratic volatility.
Exhibit 26: Factor Attribution AnalysisThe Market factor is the daily return of the cap-weighted index of all stocks that constitute the index portfolio in excess of the risk-free rate. Small size factor is the daily return series of a cap-weighted portfolio that is long the smallest 30% of stocks (by market cap) and short the largest 30% of stocks (by market cap) of the extended universe (i.e. including small caps). Value factor is the daily return series of a cap-weighted portfolio that is long the highest 30% and short the lowest 30% of stocks in the investable universe based on the B/M ratio. Momentum factor is the daily return series of a cap-weighted portfolio that is long the highest 30% and short the lowest 30% of stocks in the investable universe based on 52-week (minus most recent 4 weeks) past returns. The analysis is based on daily total returns from 31/12/1973 to 31/12/2013. The "Secondary Market US Treasury Bills (3M)" is the risk-free rate in US Dollars.PANEL A – Return Attribution to the 4 Factors
3. Measurement of Robustness

PANEL B– Tracking Error Attribution to the 4 Factors and Cross Factors
3.4 Outperformance ProbabilitySince the performance of smart beta varies over time, the analytics reported over long horizons, for example excess returns over 40 years; have limited information because of averaging over time periods. Probability of outperformance is a measure that overcomes this limitation. The probability of outperformance is defined as the empirical frequency of outperforming the cap-weighted reference index over a given investment horizon. It is an intuitive and relevant measure which shows how often and consistently the strategy would be able to outperform the cap-weighted reference index in the past for all possible entry points.
Since smart beta strategies expose the investor to the risk of short term underperformance relative to CW benchmark, the frequency of underperformance becomes an important measure to evaluate consistency of outperformance across time. It comes in handy to differentiate between two strategies which have similar long-term performance, although one of them has small but consistent outperformance while the other benefits from few periods of high gain combined with long runs of losses. In this example, the former strategy is more robust in an absolute sense and the performance of latter is disrupted and accompanied with risk.
The probability of outperformance is calculated using a rolling window of one-week step size. It is calculated by computing the frequency of obtaining positive excess returns if one invests in the strategy for a period of 1, 3 or 5 years at any point in time (we use end-of-week starting points) during the complete history of the strategy. Exhibit 27 shows the probability of outperforming the cap-weighted benchmark of MBMS EW, ERC and the simple average of the four component single beta indices with various investment horizons for two stock universes. Panel A shows the probability of outperformance in the US stock universe and Panel B shows the probability of outperformance in the Developed World stock universe.
3. Measurement of Robustness
An ERI Scientific Beta Publication — Robustness of Smart Beta Strategies — October 2014Copyright © 2014 ERI Scientific Beta. All rights reserved. Please refer to the disclaimer at the end of this document.
41

42 An ERI Scientific Beta Publication — Robustness of Smart Beta Strategies — October 2014Copyright © 2014 ERI Scientific Beta. All rights reserved. Please refer to the disclaimer at the end of this document.
Two observations can be made from the plot. First, the outperformance probability increases with time horizon for both single and multi-beta indices. The outperformance probability for horizons greater than 4 years is more than 80% in USA and that for horizons greater than 3.5 years is 100% for Developed world market MBMS indices. This is due to the fact that factors are rewarded in long term and undergo loss periods in the short term. Second, the MBMS indices have a higher probability of outperformance than the average of the four component single factor indices, especially in the short term in both the stock universes. This shows that combination of factors indeed improves the chances of outperforming CW benchmark (improves absolute robustness) compared to single factors in isolation.
Exhibit 27: Outperformance Frequency of average of Factor-Tilted Multi-Strategy Indices and Multi-Beta Multi-Strategy Allocations over Different HorizonsPANEL A - United States Long Term (31/12/1973 to 31/12/2013)The analysis is based on daily total return data from 31/12/1973 to 31/12/2013 (40 years). The complete stock universe consists of the 500 largest stocks in the USA. The S&P-500 is used as the cap-weighted benchmark. Probability of outperformance is the historical empirical probability of outperforming the cap-weighted benchmark over an investment horizon of 1 month, 3 months, 6 months, 9 months, 1 year, 18 months, 2 years, 36 months, and so on up to 5 years, irrespective of the entry point in time. It is computed using a rolling window analysis with window length corresponding to the investment horizon and one-week step size.
3. Measurement of Robustness

PANEL B – Developed World Short Term (31/12/2003 to 31/12/2013)The analysis is based on daily total return data from 31/12/2003 to 31/12/2013 (10 years). The complete stock universe consists of stocks from SciBeta Developed World Indices. The SciBeta Developed World Cap-Weighted Index is used as the benchmark. Probability of outperformance is the historical empirical probability of outperforming the cap-weighted benchmark over an investment horizon of 1 month, 3 months, 6 months, 9 months, 1 year, 18 months, 2 years, 36 months, and so on up to 5 years, irrespective of the entry point in time. It is computed using a rolling window analysis with window length corresponding to the investment horizon and one-week step size.
3.5 Conditional PerformanceAnalysing the conditional performance of the smart beta strategies in bull-bear market conditions or in contraction-expansion business cycles is a powerful tool in robustness analysis because the performance of smart beta strategies is shown to vary over market phases (Gonzalez and Thabault, 2013).
Market conditions such as bullish or bearish markets may have a considerable impact on how different portfolio strategies perform. In particular, it has been shown that the performance of Smart Beta strategies is often related to market conditions. Considering the performance of four index strategies based on alternative weighting schemes, over six-month periods from January 2003 to December 2011, Amenc et al. (2012b) show considerable variation of strategy performance in different sub-periods, as well as pronounced differences between strategies in terms of when they tend to outperform and underperform. A strategy which performs well in different market conditions and shows little or no state and time dependency can be said to be robust in absolute sense.
Ferson and Qian (2004) note that an unconditional evaluation made for example during bearish markets will not be a meaningful estimation of forward performance if the next period was to be bullish. Separating bull and bear market periods to evaluate performance was proposed by various authors such as Levy (1974), Turner, Starz and Nelson (1989) and, more recently, Faber (2007). Bull and
3. Measurement of Robustness
An ERI Scientific Beta Publication — Robustness of Smart Beta Strategies — October 2014Copyright © 2014 ERI Scientific Beta. All rights reserved. Please refer to the disclaimer at the end of this document.
43

44 An ERI Scientific Beta Publication — Robustness of Smart Beta Strategies — October 2014Copyright © 2014 ERI Scientific Beta. All rights reserved. Please refer to the disclaimer at the end of this document.
bear markets can be classified according to the reference index if the average returns are positive or negative. This kind of analysis demands long-term data and thus investors should be provided with long history of track records.
Exhibit 28 analyses the relative performance of single and multi-beta indices in market phases conditional on following parameters: • Bull and Bear markets (Panel A) - Positive market (broad CW) return quarters are classified as bull and negative market return quarters are classified as bear regimes;• Top 25% and bottom 25% markets (Panel B) – Out of 160 quarters analysed, the 40 most bullish and 40 most bearish quarters are separated, defined by CW returns;• Positive and Negative Months (Panel C) – To provide more granularity to bull/bear analysis, months with positive returns of the CW index and with negative returns of the CW index are separated.
Panel A shows that MBMS indices outperform the CW benchmarks on both the bull and bear regimes, whereas the component indices perform very differently in different market conditions. For example, the low volatility index performs very poor in bull markets, but perform extremely well on bear markets and the mid-cap index performs well in bull markets, but has a relatively poor information ratio in bear markets. Panel B shows that multi-beta strategies give a stable risk-adjusted outperformance in the extreme market conditions with an Information Ratio of 0.6 (EW and ERC) in extreme bull markets and 0.68 and 0.67 (EW and ERC, respectively) in extreme bear markets. The mid-cap and low volatility indices show extreme outperformance in one of the two extreme market scenarios and very poor performance in the other extreme market scenario.
Panel C shows similar results. The Information Ratio of the MBMS index with EW allocation is 0.51 and 0.82 in positive and negative months, respectively, and that of the ERC allocation is 0.43 and 0.88, respectively. Compared to component indices such as low volatility and mid-cap indices, multi-beta indices have much smoother outperformance. The observation is justified as Asness, Friedman, Krail and Liew (2000) as well as Cohen, Polk and Vuolteenaho (2003) have shown that equity, value and momentum premia do not reward investors constantly over time. Relative to the broad market, the low volatility factor is more rewarded in bear markets while mid cap factor is favoured in bull markets.
The fact that the Low Volatility Diversified Multi-Strategy index underperforms in extreme bull markets does not mean that the strategy is not relatively robust. The low volatility factor performs poorly in extreme bull markets therefore it is expected of a low volatility portfolio to show similar dependence on markets. On the contrary, the results confirm that the strategy is quite robust in the relative sense as it is well correlated with the associated factor. The results show that the single factor indices have a high degree of relative robustness, indicated by overall high outperformance in full period, but they are not robust in absolute terms. The multi-beta allocations on the other hand are highly robust in absolute terms.
3. Measurement of Robustness

Exhibit 28 : Conditional Performance of Multi-Beta Multi-Strategy Allocations and Single-Beta Multi-StrategyThe exhibit shows relative performance of Multi-Strategy Factor Indices for four factor tilts – mid cap, high momentum, low volatility, and value as well as the Multi-Beta EW and ERC allocations on these tilts in two distinct market conditions – Bull markets and bear markets.
PANEL A - Calendar quarters with positive market index returns comprise bull markets and the rest constitute bear markets. All statistics are annualised. The analysis is based on daily total return data from 31/12/1973 to 31/12/2013 (40 years). The complete stock universe consists of the 500 largest stocks in the USA. The S&P-500 index is used as the cap-weighted benchmark.
US Long Term (Dec-1973 to Dec-2013)
Diversified Multi-Strategies
Mid Cap Momentum Low Vol Value Multi-Beta Multi-Strategy EW
Multi-Beta Multi-Strategy ERC
Bull Markets
Annual Relative Returns 5.12% 3.28% -0.99% 3.54% 2.79% 2.71%
Annual Tracking Error 5.76% 4.04% 5.11% 5.00% 4.38% 4.13%
Information Ratio 0.89 0.81 -0.19 0.71 0.64 0.66
Bear Markets
Annual Relative Returns 3.83% 3.77% 8.12% 5.99% 5.49% 5.14%
Annual Tracking Error 8.33% 6.26% 7.94% 7.12% 6.57% 6.12%
Information Ratio 0.46 0.60 1.02 0.84 0.83 0.84
PANEL B - The top 25% of quarters with highest market returns are considered as extremely bullish and the bottom 25% quarters with the least returns are considered as extremely bearish. The analysis is based on daily total return data from 31/12/1973 to 31/12/2013 (40 years). The complete stock universe consists of the 500 largest stocks in the USA. The S&P-500 index is used as the cap-weighted benchmark
US Long Term (Dec-1973 to Dec-2013)
Diversified Multi-Strategies
Mid Cap Momentum Low Vol Value Multi-Beta Multi-Strategy EW
Multi-Beta Multi-Strategy ERC
Top 25% Quarters by Market Returns
Annual Relative Returns 9.76% 4.15% -5.53% 2.91% 2.86% 2.75%
Annual Tracking Error 6.38% 4.63% 5.29% 5.45% 4.77% 4.57%
Information Ratio 1.53 0.90 -1.05 0.53 0.60 0.60
Bottom 25% Quarters by Market Returns
Annual Relative Returns 2.97% 3.39% 7.56% 4.68% 4.71% 4.38%
Annual Tracking Error 8.83% 6.68% 8.36% 7.46% 6.94% 6.49%
Information Ratio 0.34 0.51 0.90 0.63 0.68 0.67
PANEL C - Calendar months with positive market index returns comprise bull markets and the rest constitute bear markets. All statistics are annualised. The analysis is based on daily total return data from 31/12/1973 to 31/12/2013 (40 years). The complete stock universe consists of the 500 largest stocks in the USA. The S&P-500 index is used as the cap-weighted benchmark.
US Long Term (Dec-1973 to Dec-2013)
Diversified Multi-Strategies
Mid Cap Momentum Low Vol Value Multi-Beta Multi-Strategy EW
Multi-Beta Multi-Strategy ERC
Months with Positive Market Returns
Annual Relative Returns 7.22% 3.30% -5.13% 4.05% 2.37% 1.91%
Annual Tracking Error 6.01% 4.38% 5.51% 5.30% 4.67% 4.41%
Information Ratio 1.20 0.75 -0.93 0.76 0.51 0.43
Months with Negative Market Returns
Annual Relative Returns 2.34% 3.35% 8.65% 4.60% 4.77% 4.78%
Annual Tracking Error 7.57% 5.47% 6.96% 6.37% 5.84% 5.43%
Information Ratio 0.31 0.61 1.24 0.72 0.82 0.88
3. Measurement of Robustness
An ERI Scientific Beta Publication — Robustness of Smart Beta Strategies — October 2014Copyright © 2014 ERI Scientific Beta. All rights reserved. Please refer to the disclaimer at the end of this document.
45

46 An ERI Scientific Beta Publication — Robustness of Smart Beta Strategies — October 2014Copyright © 2014 ERI Scientific Beta. All rights reserved. Please refer to the disclaimer at the end of this document.
Exhibits 29 and 30 depict the conditional relative performance of the strategies based on US business cycles (as defined by NBER). Contractions comprise the days from peak to trough of business cycles, and expansions comprise the days from trough to peak of business cycles. The dependency of the performance of single factor indices on business cycles is not as strong as it was on stock market cycles.
Exhibit 29: Conditional Performance of Multi-Beta Multi-Strategy indices and Single-Beta Multi-Strategy in Economic Contraction and Expansion PhasesContraction and expansion periods are defined by NBER US Business cycles (http://www.nber.org/cycles/cyclesmain.html). Contractions comprise the days from peak to trough of business cycles, and expansions comprise the days from trough to peak of business cycles. All statistics are annualised and daily total returns from 31/12/1973 to 31/12/2013 are used for the analysis. The complete stock universe consists of the 500 largest stocks in the USA. The S&P-500 index is used as the cap-weighted benchmark.
US Long Term (Dec-1973 to Dec-2013)
Contraction Periods Expansion Periods
Mid Cap
Mom Low Vol
Value EW MBMS
ERC MBMS
Mid Cap
Mom Low Vol
Value EW MBMS
ERC MBMS
Annual Relative Returns
6.29% 3.67% 5.67% 4.66% 5.19% 4.96% 4.34% 3.60% 2.47% 4.80% 3.87% 3.67%
Information Ratio
0.69 0.52 0.74 0.60 0.75 0.75 0.70 0.82 0.42 0.89 0.80 0.82
Exhibit 30: Graphical Conditional Performance of Multi-Beta Multi-Strategy indices in Economic Contraction and Expansion PhasesContraction and expansion periods are defined by NBER US Business cycles (http://www.nber.org/cycles/cyclesmain.html). Contractions comprise the days from peak to trough of business cycles, and expansions comprise the days from trough to peak of business cycles. All statistics are annualised and daily total returns from 31/12/1973 to 31/12/2013 are used for the analysis. The complete stock universe consists of the 500 largest stocks in the USA. The S&P-500 index is used as the cap-weighted benchmark. PANEL A shows conditional relative performance of Multi-Beta Multi-Strategy EW index and PANEL B shows conditional relative performance of Multi-Beta Multi-Strategy ERC index
PANEL A
3. Measurement of Robustness

PANEL B
3. Measurement of Robustness
An ERI Scientific Beta Publication — Robustness of Smart Beta Strategies — October 2014Copyright © 2014 ERI Scientific Beta. All rights reserved. Please refer to the disclaimer at the end of this document.
47

48 An ERI Scientific Beta Publication — Robustness of Smart Beta Strategies — October 2014Copyright © 2014 ERI Scientific Beta. All rights reserved. Please refer to the disclaimer at the end of this document.
3. Measurement of Robustness

Conclusion
49

50 An ERI Scientific Beta Publication — Robustness of Smart Beta Strategies — October 2014Copyright © 2014 ERI Scientific Beta. All rights reserved. Please refer to the disclaimer at the end of this document.
In conclusion, it is essential that smart beta strategy performance reporting be accompanied with measurement of relative and absolute robustness of its performance. The lack of relative robustness arises mainly from data mining and non-robust weighting methodologies, while the lack of absolute robustness comes from undiversified factor exposures. Relative robustness can be improved by reducing all sources of unrewarded risks with the use of a consistent framework (to prohibit data mining), robust parameter estimation techniques, weight constraints and strategy specific risk. Absolute robustness can be achieved through allocating across several rewarded factors. Our results show that the single factor indices have a high degree of relative robustness, but they are not robust in absolute terms. The multi-beta allocations, on the other hand, are highly robust in absolute terms.
Conclusion

Appendix
51

52 An ERI Scientific Beta Publication — Robustness of Smart Beta Strategies — October 2014Copyright © 2014 ERI Scientific Beta. All rights reserved. Please refer to the disclaimer at the end of this document.
A brief description of the diversification weighting schemes implemented in Smart Beta 2.0 framework is presented below.
Maximum DeconcentrationEqual Weighting is a simple way of "deconcentrating" a portfolio, thus allowing it to benefit from systematic rebalancing back to fixed weights. Depending on the universe and on whether additional implementation rules are used, the rebalancing feature of equal-weighting can be associated with relatively high turnover and liquidity problems. Maximum Deconcentration can be perceived as a generalisation of a simple equal weighting scheme: the aim being to maximise the effective number of stocks.
Diversified Risk WeightedExtending the notion of deconcentration in terms of weights to deconcentration in terms of contributions to risk, the general Risk Parity approach aims to achieve diversification by equalising the contributions of constituent stocks to the total portfolio volatility. The Diversified Risk Weighted strategy – which is based on a specific case of the general Risk Parity approach – it is a weighting scheme that attempts to equalise the individual stock contributions to the total risk of the index, assuming uniform correlations across stocks.
Maximum DecorrelationGoing beyond the creation of balanced portfolios based on various forms of deconcentration, the Maximum Decorrelation strategy focuses explicitly on maximising the benefits of exploiting the correlation structure of stock returns. In fact, the Maximum Decorrelation approach attempts to achieve reduced portfolio volatility by estimating only the correlations across constituent stocks, while assuming their volatilities are identical, so as to avoid the risk of error in estimating expected returns and volatilities of individual stocks. The approach has in fact been introduced to measure the diversification potential within a given investment universe (Christoffersen et al., 2010). Thus, just as the Maximum Deconcentration weighting scheme reduces concentration in a nominal sense, the Maximum Decorrelation weighting scheme reduces the correlation-adjusted concentration.
Efficient Minimum VolatilityIn contrast with the three ad hoc diversification strategies above, the true minimum volatility portfolio lies on the efficient frontier and coincides with the optimal portfolio of Modern Portfolio Theory (the tangency portfolio) if, and only if, expected returns are identical across all stocks. However, due to the presence of estimation risk affecting the input parameters, the minimum volatility portfolio is an attractive strategy because there is no need to estimate expected returns (only risk parameters need to be estimated). Thus, minimum volatility strategies can, in practice, hope to be decent proxies of truly efficient portfolios.
Appendix

Efficient Maximum Sharpe RatioIn line with Modern Portfolio Theory, the Maximum Sharpe Ratio strategy is an implementable proxy for the tangency portfolio. As in any mean-variance optimisation, the estimation of input parameters is a central ingredient in the implementation of the methodology. In contrast to minimum volatility strategies which only require estimates of risk parameters (volatilities and correlations), the Maximum Sharpe Ratio strategy relies on estimates of both risk parameters and expected returns.
Diversified Multi-StrategyFinally, on top of these diversification-based weighting schemes, one can add an extra-layer of diversification, by “diversifying the diversifiers”. Indeed, each particular weighting scheme presented above diversifies at the stock level, avoiding potentially fatal concentration in specific stocks. As demonstrated by Kan and Zhou (2007) and Amenc et al. (2012a), combining the different weighting schemes helps in removing any remaining model risk. In this logic, Scientific Beta offers the “Diversified Multi-Strategy” approach, which combines the five different diversification-based weighting schemes in equal proportions so as to diversify away unrewarded risks and parameter estimation errors.
Appendix
An ERI Scientific Beta Publication — Robustness of Smart Beta Strategies — October 2014Copyright © 2014 ERI Scientific Beta. All rights reserved. Please refer to the disclaimer at the end of this document.
53

54 An ERI Scientific Beta Publication — Robustness of Smart Beta Strategies — October 2014Copyright © 2014 ERI Scientific Beta. All rights reserved. Please refer to the disclaimer at the end of this document.
Appendix

References
55

56 An ERI Scientific Beta Publication — Robustness of Smart Beta Strategies — October 2014Copyright © 2014 ERI Scientific Beta. All rights reserved. Please refer to the disclaimer at the end of this document.
• Amenc, N., F. Goltz, N. Gonzalez, A. Thabault. 2014. Investability of Scientific Beta Indices. ERI Scientific Beta White Paper Series.
• Amenc, N., F. Goltz and A. Lodh. 2014. Scientific Beta USA Indices: Long-Term Analytics. ERI Scientific Beta White Paper Series.
• Amenc, N., F. Goltz and A. Thabault. 2014. A Multifaceted Approach to Index Investing. Journal of Indexes. July/August: 15-25.
• Amenc, N., F. Goltz and A. Thabault. 2014. Scientific Beta Multi-Beta Multi-Strategy Indices: Implementing Multi-Factor Equity Portfolios with Smart Factor Indices. ERI Scientific Beta White Paper Series.
• Amenc, N., F. Goltz, A. Lodh and L. Martellini. 2014. Scientific Beta Multi-Strategy Factor Indices: Combining Factor Tilts and Improved Diversification. ERI Scientific Beta White Paper Series.
• Amenc, N., F. Goltz, L. Martellini and P. Retkowsky. 2010. Efficient Indexation: An Alternative to Cap-Weighted Indices. EDHEC-Risk Institute Publication.
• Amenc, N., F. Goltz and L. Tang. 2011. EDHEC-Risk European Index Survey 2011. EDHEC-Risk Institute Publication.
• Amenc, N., F. Goltz and V. Le Sourd. 2008. The Performance of Characteristics-based Indices. European Financial Management 15(2): 241-278.
• Amenc, N., F. Goltz, A. Lodh and L. Martellini. 2012a. Diversifying the Diversifiers and Tracking the Tracking Error: Outperforming Cap-Weighted Indices with Limited Risk of Underperformance. Journal of Portfolio Management 38(3): 72-88.
• Amenc, N., F. Goltz and A. Lodh. 2012b. Choose Your Betas: Benchmarking Alternative Equity Index Strategies. Journal of Portfolio Management 39(1): 88-111.
• Amenc, N., F. Goltz and L. Martellini. 2013. Smart Beta 2.0. EDHEC-Risk Institute Position Paper.
• Amenc, N., R. Deguest, F. Goltz, A. Lodh and L. Martellini. 2014. Towards Smart Equity Factor Indices: Harvesting Risk Premia without Taking Unrewarded Risks. EDHEC-Risk Institute Working Paper.
• Amenc, N., F. Goltz, A. Lodh and L. Martellini. 2014. Investing in Multi Smart Beta Portfolios: Reconciling Risk Factor Allocation and Smart Beta Allocation. EDHEC-Risk Institute Working Paper.
• Ang, A., W. Goetzmann and S. Schaefer. 2009. Evaluation of Active Management of the Norwegian Government Pension Fund - Global.
• Asness, C. 1992. Changing Equity Risk Premia and Changing Betas over the Business Cycle and January. University of Chicago Working Paper.
• Asness C., J. Friedman, R. Krail, and J. Liew. 2000. Style Timing Value versus Growth. The Journal of Portfolio Management. 26(3): 50-60.
• Badaoui, S. and A. Lodh. 2014. Scientific Beta Diversified Multi-Strategy Index. ERI Scientific Beta White Paper Series.
• Badaoui, S., F. Goltz, V. Le Sourd and A. Lodh. 2014 (forthcoming). Alternative Equity Beta Investing: The status quo and the path ahead. EDHEC-Risk Institute Publication.
• Basu, S. 1983. The relationship between earnings yield, market value, and return for NYSE common stocks: Further evidence. Journal of Financial Economics 12: 129-156.
References

• Bender, J., R. Briand, D. Melas, R. Subramanian and M. Subramanian. 2013. Deploying Multi-Factor Index Allocations in Institutional Portfolios. MSCI White Paper.
• Blitz, D. and L. Swinkels. 2008. Fundamental Indexation: An Active Value Strategy in Disguise. Journal of Asset Management 9(4): 264-269.
• Britten-Jones, M. 1999. The Sampling Error in Estimates of Mean-Variance Efficient Portfolio Weights. Journal of Finance 54 (2): 655-671.
• Buckley, T. 2013. It’s not your father’s “indexing”. Vanguard Blog for Advisors. http://vanguardadvisorsblog.com/2013/05/30/its-not-your-fathers-indexing/
• Carhart, M. 1997. On Persistence in Mutual Fund Performance. Journal of Finance 52(1): 57-82.
• Chan, L.K.C., J. Karceski and J. Lakonishok. 1999. On Portfolio Optimization: Forecasting Covariances and Choosing the Risk Model. Review of Financial Studies 12(5): 937-974.
• Chambers, D, E. Dimson and A. Ilmanen. 2012. The Norway Model. Journal of Portfolio Management 38(2): 67-81.
• Chavez-Demoulin, V., P. Embrechts, and S. Sardy. 2011. Extreme-quantile tracking for financial time series. Swiss Finance Institute. Research Paper Series 11-27.
• Cohen, R. B., C. Polk and T. Vuolteenaho. 2003. The Value Spread. Journal of Finance 58(2): 609-642.
• Cochrane, J. 2001. Asset Pricing. Princeton, NJ: Princeton University Press.
• Coqueret, G. and V. Milhau. 2014. Estimating Covariance Matrices for Portfolio Optimisation. EDHEC-Risk Institute Publication.
• DeMiguel, V., L. Garlappi, F. Nogales and R. Uppal. 2009. A Generalized Approach to Portfolio Optimization: Improving Performance by Constraining Portfolio Norms. Management Science 55(5):798-812.
• Ducoulombier, F. 2013. Index Transparency—A European Perspective. Journal of Indexes Europe. May/June: 8-13.
• Elton, E. J. and M. J. Gruber. 1973. Estimating the dependence structure of share prices. Journal of Finance 28.
• Faber, M.T. 2007. A Quantitative Approach to Tactical Asset Allocation. Journal of Wealth Management 9(4): 69-79.
• Fama, E. and K. French. 1993. Common Risk Factors in the Returns on Stocks and Bonds. Journal of Financial Economics 33(1): 3-56.
• Ferson, W. H. and M. Qian. 2004. Conditional Performance Evaluation Revisited. Research Foundation of CFA Institute.
• Fixsen, R. 2012. Smart Beta: New generation of choices. Investments & Pensions Europe (June).
• Furió, D. and F. J. Climent. 2013. Extreme value theory versus traditional GARCH approaches applied to financial data: A comparative evaluation. Quantitative Finance 13(1): 45-63.
• Gonzalez, N. and A. Thabault. 2013. Overview of Diversification Strategies. ERI Scientific Beta White Paper.
• Grinold, R. C. 1992. Are Benchmark Portfolios Efficient? Journal of Portfolio Management 19(1): 34-40.
• Harvey, C. R. 1989. Time-Varying Conditional Covariances in Tests of Asset Pricing Models. Journal of Financial Economics 24: 289-317.
References
An ERI Scientific Beta Publication — Robustness of Smart Beta Strategies — October 2014Copyright © 2014 ERI Scientific Beta. All rights reserved. Please refer to the disclaimer at the end of this document.
57

58 An ERI Scientific Beta Publication — Robustness of Smart Beta Strategies — October 2014Copyright © 2014 ERI Scientific Beta. All rights reserved. Please refer to the disclaimer at the end of this document.
• Harvey, C., Y. Liu, and H. Zhu. 2013.… and the Cross-Section of Expected Returns. Duke University Working Paper.
• Haugen, R. A. and N. L. Baker. 1991. The Efficient Market Inefficiency of Capitalization-weighted Stock Portfolios. Journal of Portfolio Management 17(3): 35-40.
• Ilmanen, A. and J. Kizer. 2012. The death of diversification has been greatly exaggerated. Journal of Portfolio Management 38: 15-27.
• Jagannathan, R. and T. Ma. 2003. Risk Reduction in Large Portfolios: Why Imposing the Wrong Constraints Helps. Journal of Finance 58(4): 1651-1684.
• Jun, D. and B. Malkiel. 2007. New Paradigms in Stock Market Indexing. European Financial Management 14(1): 118-126.
• Kan, R. and G. Zhou. 2007. Optimal Portfolio Choice with Parameter Uncertainty. Journal of Financial and Quantitative Analysis 42(3): 621-656.
• Kaplan, P. 2008. Why Fundamental Indexation Might—or Might Not—Work. Financial Analysts Journal 64(1): 32-39.
• Kogan, L., and M. Tian. 2013. Firm Characteristics and Empirical Factor Models: A Data-Mining Experiment. MIT Working Paper.
• Ledoit, O. and M. Wolf. 2003. Improved estimation of the covariance matrix of stock returns with an application to portfolio selection. Journal of Empirical Finance 10: 603-621.
• Levy, R.A. 1974. Beta Coefficients as Predictors of Returns. Financial Analysts Journal 30(1): 61-69.
• Markowitz, H. 1952. Portfolio Selection. Journal of Finance 7(1): 77-91.
• Martellini, L., V. Milhau and A. Tarelli. 2013. The Trade-Off between Estimation Risk and Ignorance Risk in Portfolio Construction. EDHEC-Risk Institute Working Paper.
• Merton, R. 1980. On Estimating the Expected Return on the Market: An Exploratory Investigation. Journal of Financial Economics 8: 323-361.
• Plerous, V., P. Gopikrishnan, B. Rosenow, L. Amaral, T. Guhr, H. Stanley. 2002. Random matrix approach to cross correlations in financial data. Physical Review E 65 (6): 066126.
• Rosenberg, B., K. Reid, and R. Lanstein. 1985. Persuasive Evidence of Market Inefficiency. Journal of Portfolio Management 11(3): 9 - 17.
• Ross, S.A. 1976. The Arbitrage Theory of Capital Asset Pricing. Journal of Economic Theory 13: 341-360.
• Scherer, B. 2011. A Note on the Returns from Minimum Variance Investing. Journal of Empirical Finance 18(4): 652-660.
• Stattman, D. 1980. Book Value and Stock Returns, The Chicago MBA: A Journal of Selected Papers 4: 25-45.
• Timmermann, A. 2006. Forecast Combinations. In Elliott, G., C.W.J. Granger and A. Timmermann (Eds.), Handbook of Economic Forecasting. 135-196. Amsterdam: North Holland.
• Tobin, J. 1958. Liquidity Preferences as Behavior Towards Risk. Review of Economic Studies 25(2): 65-68.
• Tu, J. and G. Zhou. 2011. Markowitz meets Talmud: A Combination of Sophisticated and Naive Diversification Strategies. Journal of Financial Economics 99 (1): 204-215.
• Turner, C. M., R. Starz and C. R. Nelson. 1989. A Markov Model of Heteroskedasticity, Risk and Learning in the Stock Market. Journal of Financial Economics 25(1): 3-22.
References

About ERI Scientific Beta
59

ERI Scientific Beta aims to be the first provider of a smart beta indices platform to help investors understand and invest in advanced beta equity strategies. It has three principles:• Choice: A multitude of strategies are available allowing users to build their own benchmark, choosing the risks to which they wish, or do not wish, to be exposed. This approach, which makes investors responsible for their own risk choices, referred to as Smart Beta 2.0, is the core component of the index offerings proposed by ERI Scientific Beta.
• Transparency: The rules for all of the Scientific Beta series are replicable and transparent. The track records of the Scientific Beta indices can be checked and justified through unrestricted access to historical compositions.
• Clarity: Exhaustive explanations of construction methodologies are provided, as well as detailed performance and risk analytics.
Established by EDHEC-Risk Institute, one of the very top academic institutions in the field of fundamental and applied research for the investment industry, ERI Scientific Beta shares the same concern for scientific rigour and veracity, which it applies to all the services that it offers investors and asset managers.
Part of EDHEC Business School, a not-for-profit organisation, EDHEC-Risk Institute has sought to provide the ERI Scientific Beta services in the best possible economic conditions.
The ERI Scientific Beta offering covers three major services: • Scientific Beta Indices Scientific Beta Indices are smart beta indices that aim to be the reference for the investment and analysis of alternative beta strategies. Scientific Beta Indices reflect the state-of-the-art in the construction of different alternative beta strategies and allow for a flexible choice among a wide range of options at each stage of their construction process. This choice enables users of the platform to construct their own benchmark, thus controlling the risks of investing in this new type of beta (Smart Beta 2.0). The Scientific Beta platform is currently offering 2,916 smart beta indices.
Within the framework of Smart Beta 2.0 offerings, ERI Scientific Beta provides access to smart factor indices, which give exposure to risk factors that are well rewarded over the long term while at the same time diversifying away unrewarded specific risks. By combining these smart factor indices, one can design very high performance passive investment solutions.
• Scientific Beta Analytics Scientific Beta Analytics are detailed analytics and exhaustive information on its smart beta indices to allow investors to evaluate the advanced beta strategies in terms of risk and performance. The analytics capabilities include risk and performance assessments, factor and sector attribution, and relative risk assessment. Scientific Beta Analytics also allow the liquidity, turnover and diversification quality of the indices offered to be analysed. In the same way, analytics provide an evaluation of the probability of out-of-sample outperformance of the various strategies present on the platform.
We believe that it is important for investors to be able to conduct their own analyses, select their preferred time period and choose among a wide range of analytics in order to produce their own picture of strategy performance and risk.
About ERI Scientific Beta
60 An ERI Scientific Beta Publication — Robustness of Smart Beta Strategies — October 2014Copyright © 2014 ERI Scientific Beta. All rights reserved. Please refer to the disclaimer at the end of this document.

• Scientific Beta Fully-Customised BenchmarksThe Scientific Beta Fully-Customised Benchmarks service enables investors and asset managers to benefit from its expertise and the ability to determine and implement their choice of stocks, weighting schemes, and absolute and relative risk constraints in keeping with their objectives.
With a concern to provide worldwide client servicing, ERI Scientific Beta is present in Boston, London, Nice, Singapore and Tokyo.
ERI Scientific Beta has a dedicated team of 45 people who cover not only client support from Nice, Singapore and Boston, but also the development, production and promotion of its index offering.
About ERI Scientific Beta
An ERI Scientific Beta Publication — Robustness of Smart Beta Strategies — October 2014Copyright © 2014 ERI Scientific Beta. All rights reserved. Please refer to the disclaimer at the end of this document.
61

62 An ERI Scientific Beta Publication — Robustness of Smart Beta Strategies — October 2014Copyright © 2014 ERI Scientific Beta. All rights reserved. Please refer to the disclaimer at the end of this document.
About ERI Scientific Beta

ERI Scientific Beta Publications
63

64 An ERI Scientific Beta Publication — Robustness of Smart Beta Strategies — October 2014Copyright © 2014 ERI Scientific Beta. All rights reserved. Please refer to the disclaimer at the end of this document.
2014 Publications• Amenc, N., F. Goltz, A. Lodh and S.Sivagaminathan. Robustness of Smart Beta Strategies (October).
• Amenc, N., F. Goltz, and A. Thabault. Scientific Beta Multi-Beta Multi-Strategy Indices: Implementing Multi-Factor Equity Portfolios with Smart Factor Indices (October).
• Badaoui, S., V. Le Sourd, and A. Lodh. Scientific Beta Analytics: Examining the Performance and Risks of Smart Beta Strategies. (September).
• Goltz, F. and N. Gonzalez. Scientific Beta Maximum Decorrelation Indices. (September).
• Gonzalez, N. and A. Thabault. Overview of Diversification Strategy Indices. (July).
• Amenc, N., F. Goltz, and L. Martellini. Smart Beta 2.0. (June).
• Goltz, F. and N. Gonzalez. Risk managing Smart Beta Strategies. (June).
• Amenc, N., F. Goltz, A. Lodh and L. Martellini. Scientific Beta Multi-Strategy Factor Indices: Combining Factor Tilts and Improved Diversification (May).
• Lodh, A. and A. Thabault. Scientific Beta Diversified Risk Weighted Indices. (April).
• Martellini, L., V. Milhau and A. Tarelli. Estimation Risk versus Optimality Risk : An Ex-Ante Efficiency Analysis of Heuristic and Scientific Equity Portfolio Diversification Strategies. (March).
• Badaoui, S. and A. Lodh. Scientific Beta Diversified Multi-Strategy Index. (March).
• Amenc, N., F. Goltz, and A. Lodh. Scientific Beta USA Indices: Long-Term Analytics (January).
• Coqueret, G. and V. Milhau. Estimating Covariance Matrices for Portfolio Optimisation (January).
• Gautam, K. and N. Gonzalez. A Comparison of Construction Methodologies and Performances of Cap-Weighted Indices (January).
• Gautam, K. and N. Gonzalez. Scientific Beta Cap-weighted Indices: Tools for Relative Performance and Risk Analysis of Scientific Beta’s Smart Beta Strategies (January).
2014 Factsheet• Smart Factor Indices (October).
• Multi-Beta Multi-Strategy Indices (October).
2013 Publications• Gautam, K. and A. Lodh. Scientific Beta Efficient Maximum Sharpe Ratio Indices. (October).
• Goltz, F. and A. Lodh. Scientific Beta Efficient Minimum Volatility Indices. (October).
• Gonzalez, N. and A. Thabault. Overview of Diversification Strategy Indices. (October).
• Gonzalez, N. and S. Ye. Scientific Beta Maximum Deconcentration Indices. (October).
• Shirbini, E. and S. Ye. Scientific Beta Global Developed Universe. (October).
• Amenc, N., F. Goltz, and A. Lodh. Alternative Equity Benchmarks. (February).
ERI Scientific Beta Publications

Disclaimer Copyright © 2014 ERI Scientific Beta. All rights reserved. Scientific Beta is a registered trademark licensed to EDHEC Risk Institute Asia Ltd (“ERIA”). All information provided by ERIA is impersonal andnot tailored to the needs of any person, entity or group of persons. Past performance of an index isnot a guarantee of future results.
This material, and all the information contained in it (the “information”), have been prepared by ERIAsolely for informational purposes, are not a recommendation to participate in any particular tradingstrategy and should not be considered as an investment advice or an offer to sell or buy securities. Theinformation shall not be used for any unlawful or unauthorised purposes. The information is providedon an "as is" basis. Although ERIA shall obtain information from sources which ERIA considers reliable,neither ERIA nor its information providers involved in, or related to, compiling, computing or creatingthe information (collectively, the "ERIA Parties") guarantees the accuracy and/or the completeness of any of this information. None of the ERIA Parties makes any representation or warranty, express or implied, as to the results to be obtained by any person or entity from any use of this information,and the user of this information assumes the entire risk of any use made of this information. None of the ERIA Parties makes any express or implied warranties, and the ERIA Parties hereby expressly disclaim all implied warranties (including, without limitation, any implied warranties of accuracy, completeness, timeliness, sequence, currentness, merchantability, quality or fitness for a particular purpose) with respect to any of this information. Without limiting any of the foregoing, in no eventshall any of the ERIA Parties have any liability for any direct, indirect, special, punitive, consequentialor any other damages (including lost profits) even if notified of the possibility of such damages. All Scientific Beta indices and data are the exclusive property of ERIA.
Information containing any historical information, data or analysis should not be taken as an indicationor guarantee of any future performance, analysis, forecast or prediction. Past performance does notguarantee future results. In many cases, hypothetical, back-tested results were achieved by means ofthe retroactive application of a simulation model and, as such, the corresponding results have inherentlimitations. The index returns shown do not represent the results of actual trading of investableassets/securities. ERIA maintains the index and calculates the index levels and performance shown or discussed, but does not manage actual assets. Index returns do not reflect payment of any sales charges or fees an investor may pay to purchase the securities underlying the index or investment funds that are intended to track the performance of the index. The imposition of these fees and charges would cause actual and back-tested performance of the securities/fund to be lower than theindex performance shown. Back-tested performance may not reflect the impact that any materialmarket or economic factors might have had on the advisor’s management of actual client assets.
The information may be used to create works such as charts and reports. Limited extracts of informationand/or data derived from the information may be distributed or redistributed provided this is doneinfrequently in a non-systematic manner. The information may be used within the framework ofinvestment activities provided that it is not done in connection with the marketing or promotion ofany financial instrument or investment product that makes any explicit reference to the trademarkslicensed to ERIA (ERI SCIENTIFIC BETA, SCIENTIFIC BETA, SCIBETA, EDHEC RISK and any other trademarkslicensed to ERIA) and that is based on, or seeks to match, the performance of the whole, or any part,of a Scientific Beta index. Such use requires that the Subscriber first enters into a separate licenseagreement with ERIA. The information may not be used to verify or correct other data or informationfrom other sources.
An ERI Scientific Beta Publication — Robustness of Smart Beta Strategies — October 2014Copyright © 2014 ERI Scientific Beta. All rights reserved. Please refer to the disclaimer at the end of this document.
65

For more information, please contact: Séverine Anjubault on: +33 493 187 863 or by e-mail to: [email protected]
www.scientificbeta.com
ERI Scientific Beta—Europe 10 Fleet Place, Ludgate
London EC4M 7RBUnited Kingdom
Tel: +44 207 871 6742
ERI Scientific Beta—Asia-PacificEast Tower 4th Floor, Otemachi First Square,
1-5-1 Otemachi, Chiyoda-ku, Tokyo 100-0004 Japan
Tel: +81 352 191 418
ERI Scientific Beta HQ & Asia1 George Street
#07-02Singapore 049145Tel: +65 6438 0030
ERI Scientific Beta R&D393 promenade des Anglais
BP 3116 - 06202 Nice Cedex 3France
Tel: +33 493 187 863
ERI Scientific Beta—North AmericaOne Boston Place, 201 Washington Street
Suite 2608/2640, Boston, MA 02108United States of America
Tel: +1 857 239 8891