Embed Size (px)
Citation preview
1
Robustness Tests and Statistical Inference
Thomas Plümper1 and Eric Neumayer2
1 Department of Socioeconomics, Vienna University of Economics and Business
2 Department of Geography & Environment, London School of Economics and Political
Science (LSE)
Abstract: Robustness tests emerged as social scientists’ response to the uncertainty they
face in specifying empirical models. We argue that the logic of robustness testing
warrants a fundamental change in how researchers make inferences in their analysis of
observational data. The dominant conception of robustness, which assesses whether the
estimated effects remain statistically significant in all robustness test models, results in
a flawed inferential logic. Even if the baseline estimation model were correctly specified,
null hypothesis significance testing is problematic. It loses its inferential value when
multiple models are estimated to explore the stability of the baseline model’s estimated
effect to plausible alternative specification choices. We provide an operational
definition of robustness as stability in effect size and show how, despite model
uncertainty, robustness tests can improve the validity of inferences if such tests are
embraced as an integral part of research design.

2
1. Introduction
In the ideal world of deductive quantitative research, researchers begin with a well-
specified and consistent theory. This theory enables them to identify the population for
which the theory is valid and, with the help of econometric tests, to specify an
estimation model which closely resembles the true data-generating process.
Researchers draw a perfect random sample from the population and estimate the model
using an estimator which is as efficient as estimators can be for the sample size at hand.
Inferences can then be derived from a single point estimate taking the sampling
distribution into consideration. Traditionally and despite all its known shortcomings
and flaws (Gill 1999; Rainey 2014; Gross 2015), most researchers base their inferences
on whether an estimated effect is statistically significant.1
Like all other ideal worlds, this one does not exist either. Applied empirical researchers
accept that the reality of everyday regression analysis is far removed from this ideal.
They do not know the true data-generating process in observational data and
understand that empirical models simplify the complexity of the social world. However,
rather than giving up on observational data altogether and seeking solace in social
science experiments and identification approaches, they increasingly rely on robustness
tests2 to analyse the dependence or independence of estimated results on model
1 The majority of empirical researchers seem to interpret the result of significance test as a measure of the probability that the coefficient of interest is zero, while in fact it measures the probability that random deviations of errors from the assumed normal distribution random deviation of errors from the assumed standard normal are correlated with x in such a way that the estimated effect of x on y given the model becomes zero or changes signs. 2 Robustness testing is growing in importance across all social sciences. An analysis of published articles indexed in the Social Sciences Citation Index shows that the number of articles reporting robustness tests increases quasi-exponentially, though the growth rates appear to be higher in some disciplines, most notably in economics and political science, than in others, e.g., sociology and business

3
specification assumptions. From this perspective, inferences become more valid if
estimated results are sufficiently independent from the model specification, that is, if all
plausible alternative specifications give similar results (Neumayer and Plümper 2016).
The practice of robustness testing put an end to the idea that a single model, a single
parameter estimate and its sampling error can be used to make valid statistical
inferences. It did not, however, put an end to statistical significance as the predominant
criterion for making inferences, which maintained its status through the back door by
becoming the dominant way in which robustness is assessed. Starting from Leamer’s
idea of sensitivity testing (Leamer 1978), most applied scholars even today define
robustness through an extreme bounds analysis: a baseline model estimate is robust to
plausible alternative model specifications if and only if all estimates have the same
direction and are all statistically significant.
In this article we argue that robustness testing warrants a fundamental change in how
social scientists make inferences. Robustness testing emerges from the insight that
model uncertainty rather than stochastic sampling error is the principal source of
uncertainty social scientists face in the analysis of observational data. Model uncertainty
results from not knowing which specification represents the optimal trade-off between
generality (trying to closely model the complexity of the data-generating process) and
the need to simplify given data constraints. The shift toward model uncertainty as the
principal source of uncertainty requires basing inferences on the evidence provided by
robustness tests and robustness needs to be defined as stability in estimated effect size
or effect strength.
studies. Despite the uneven take-up, robustness tests today form an important element of statistical inference in observational data across all the social sciences.
4
Our argument goes beyond existing critiques of the concept of statistical significance
that are well documented in contributions by, predominantly, psychologists (Goodman
1992; Harlow et al. 1997; Krantz 1999; Nickerson 2000; Oakes 1986; Simmons et al.
2011; Ziliak and McCloskey 2008) with some rare input by political scientists (Gill
1999; Gross 2015; Rainey 2014; Ward et al. 2010).3 We focus on why employing
statistical significance as a criterion for assessing robustness results in a flawed
inferential logic and provide an alternative operational definition of robustness as
stability in effect size, which is independent of the statistical significance of effects.
The paper is organized as follows: We track the origin and rise of robustness testing as
an answer to model uncertainty in section 2. While there is no consensus, the majority
of researchers seem to subscribe to the view that in order to be called robust an
estimate should remain statistically significant with the same sign in all robustness
tests. In section 3, we provide a detailed critique of this conception arguing that its
inferential logic is flawed and inconsistent with the very idea of robustness testing. An
alternative operational definition is conspicuously absent in the extant literature even if
some researchers vaguely refer to the stability of effects either instead of or in addition
to statistical significance. In section 4, we provide an operational definition of
robustness as stability in effect strength. In short, we define robustness as the extent of
overlap of the probability density function of a robustness test estimate with the 95-
3 It is a concept that has been misused and abused to a perhaps unrivalled extent. All of us have at times been guilty of at least loosely interpreting the meaning of statistical significance and of p-values. Nickerson (2000: 289) summarises the criticism that has been raised against null hypothesis significance testing as follows: “…it has been described as ‘thoroughly discredited’, ‘a perversion of the scientific method,’ ‘a bone-headedly misguided procedure,’ ‘grotesquely fallacious,’ a ‘disaster,’ and ‘mindless,’ among other things”. Jeff Gill (1999: 661) concludes his analysis of null hypothesis significance testing: “Failing to reject the null hypothesis essentially provides almost no information about the state of the world.” Others have countered by saying: “Significance tests fill an important need in answering some key questions, and if they did not exist they would have to be invented.” (Abelson 1997: 117). See also Hagen (1997).
5
percent confidence interval of the baseline model estimate. In section 5, we conclude
with what else needs to change so that robustness testing can fulfil its promise to
improve the validity of inferences based on observational data.
2. Model Uncertainty and the Origins of Robustness Testing
Social scientists have long since been aware of the problem of potential model
misspecification. Many have stressed that “all models are wrong” (Box 1976, Box and
Draper 1987), “all econometric specifications are necessarily false models” (Feldstein
1982: 829) and “statistical models are always simplifications” (Keele 2008: 1). Kennedy
(2008: 71) not only accepts that all empirical models are misspecified, he also suggests
that this fact is generally known: “It is now generally acknowledged that econometric
models are false and there is no hope, or pretence, that through them truth will be
found.”
It is straightforward to see why, strictly speaking, all empirical social science estimation
models must be misspecified to a greater or lesser extent. To capture the true data-
generating processes of a complex social world, researchers would need to know the set
of explanatory variables, include all relevant variables and exclude all irrelevant var-
iables, operationalize and measure these variables without systematic measurement
error, model the functional form of each variable correctly, get all conditionalities right,
correctly account for dynamics, common trends and structural breaks and spatial
dependence among units, and so on. There is no way of knowing and, in any case, given
limited information in available data, trying to capture the true data-generating process

6
is not even desirable. Theory and econometric tests can help reduce model
misspecification but cannot eliminate it.
Admitting that all models are wrong is a dead end, however, unless empirical
researchers have a methodology to cope with the fact of model misspecification and the
resulting uncertainty over which of all the necessarily misspecified models provides the
best trade-off between generality on the one hand and simplicity on the other hand.
Early initiatives to take model uncertainty seriously date back to the 1970s. These ideas
laid the foundations of robustness testing as an inferential strategy.
George Box was – to the best of our knowledge – the first methodologist to use the term
‘robustness’ in relation to empirical analyses. According to Box (1979: 201),
“robustness may be defined as the property of a procedure which renders the answers
it gives insensitive to departures, of a kind which occur in practice, from ideal
assumptions.” A quote from Otis Dudley Duncan (1975: 101-102) captures the essence
of what became later known as robustness testing: “The analysis of specification error
relates to a rhetorical strategy in which we suggest a model as the ‘true’ one for the sake
of argument, determine how our working model differs from it and what the
consequences of the differences are, and thereby get some sense of how important the
mistakes we will inevitably make may be. Sometimes it is possible to secure genuine
comfort by this route.”
Robustness testing takes model uncertainty seriously by assessing whether the baseline
model results are sensitive to plausible changes to specific aspects of the baseline model
specification. If estimates do not differ much regardless of which of the plausible
specifications researchers employ to estimate their model, then this increases the
validity of inferences. To be sure, it does not generate inferences that are valid with
7
certainty since, firstly, none of the estimated models are correctly specified and,
secondly, there is no guarantee that one has employed all important plausible
alternative model specifications in robustness testing.4 Therefore, even robust results
may deviate from the truth to an extent that invalidates inferences.
The first elaborate attempt to deal with model uncertainty stems from Edward Leamer.
He suggests that since one cannot make model specification decisions “with complete
confidence, the researcher is willing to change (…) the specification of his statistical
model.” (Leamer 1978: 5-6) In a later publication, Leamer (1985: 311) clarifies that the
scope of his proposed global sensitivity testing is very broad: “One thing that is clear is
that the dimension of the parameter space should be very large by traditional stand-
ards. Large numbers of variables should be included, as should different functional
forms, different distributions, different serial correlation assumptions, different
measurement error processes, etcetera, etcetera.” Yet, global sensitivity analysis never
took off. Instead, it became narrowed to dealing with uncertainty about the set of
explanatory variables and even then generated only few empirical applications (Levine
and Renelt 1992; Sala-i-Martin 1997; Sala-i-Martin, Doppelhofer and Miller 2004). In
this analysis, a set of regressors are randomly drawn from a larger set of potential
regressors – the model space – into an estimation model that contains a pre-determined
set of variables which are included in all estimations. Depending on the size of the
model space and the selection algorithm, the total number of permutations can easily
reach many millions of models – one million potential model permutations is reached
4 A good example is an important confounding variable not included in either baseline or robustness test models.
8
when the model space includes more than 19 independent variables, a billion
permutations is reached with more than 29 independent variables.5
Despite some superficial similarities, Leamer’s sensitivity testing is thus quite different
from robustness testing as now undertaken by legions of empirical social scientists.6
Robustness testing is both broader and narrower. It is broader because it not only
analyses the influence of alternative sets of regressors, but the influence of alternative
plausible choices in all model specification dimensions. Robustness testing is also
narrower, however, because clearly misspecified models are not accepted as plausible
alternatives, whereas the algorithm-based permutation character of sensitivity analysis
that results in the estimation of thousands or even millions of models not only does not
preclude the inclusion of clearly misspecified models, but to the contrary makes those
very likely.
All robustness testing shares one common ground, namely that plausible alternative
model specifications to the baseline model exist. However, social scientists disagree
about the meaning of robustness and few if any have developed an operational
definition that distinguishes between ‘robust’ and ‘not robust’. In political science at
least – the discipline we have surveyed most closely – the only consensus that seems to
exist is that robustness is not evaluated as a property of the empirical model as a whole
but rather with respect to the variable(s) of interest (no one seems to care what
5 Given that Sala-i-Martin’s famous growth model sensitivity test uses a model space of 58 potentially included variables, the 2 million models he estimated are not representative for the total number of permutations, which is 288 trillion. In other words, Sala-i-Martin estimated 1/144,115,188,075 of the true model space, a share of all permutations that cannot be representative. 6 No one invented robustness testing as such. Instead it grew as a grassroots movement becoming an increasingly common practice adopted by many empirical researchers over time. Nevertheless, in addition to Leamer, robustness testing owes intellectual heritage to Rosenbaum (2002, though there are many earlier contributions with many co-authors), and Ken Frank and co-authors (Frank 2000; Pan and Frank 2003; Frank and Min 2007).

9
happens to the control variable estimates). Despite this lack of consensus, most social
scientists explicitly or implicitly seem to revert back to statistical significance when they
assess robustness.
3. Statistical Significance in Robustness Testing: In Through the Back Door?
Robustness tests explore the dependence of parameter estimates to plausible changes
in model specification (Neumayer and Plümper 2016). The ‘natural’ definition of
robustness and thus the most plausible criterion for making inferences based on
robustness tests would be some measure of effect stability. However, path dependence
ensured that researchers would not relinquish significance despite all the well-
understood flaws of null hypothesis significance testing.
In fact, statistical significance maintained its status as the predominant criterion for
making inferences even among scholars who doubted the assumption that estimation
models sufficiently closely model the true data-generating process. While Leamer’s
sensitivity testing is – at least in principle – consistent with any type of inferential rule,
in reality Leamer (1978) suggested an extreme bounds analysis in which inferences are
perceived as valid if all model permutations generate parameter estimates for the
variable of interest that have the same sign and are statistically significant. Most social
scientists who undertake robustness tests have followed suit. For example, in
robustness tests for their analysis of the presence of multiple veto players on the
credibility of monetary commitments, Keefer and Stasavage (2002: 772) find that the
“test statistics are significant in most cases at the one percent level and in all but one
case at the ten percent level of confidence.” In a paper analysing how the stock values of
10
seven European defence companies respond to EU summit decisions on defence policy,
Bechtel and Schneider (2010: 219) conclude their robustness test as follows: “The
coefficient of the summit outcome variable (…) remains positive and statistically
significant”. Nordås and Davenport (2013: 934f.) find that “the results for youth bulges
remain highly significant (at the 1% level)” in robustness tests for their analysis of the
effect of large youth cohorts on state repression.7
Assessing robustness as stability in the direction of an effect and its statistical
significance – or what we call Leamer-robustness for short – is flawed and should be
abandoned. On the most fundamental level, it ignores that the difference between a
statistically significant baseline model result and an insignificant robustness test result
need not be statistically significant. For the same reason a statistically insignificant
result in a replication exercise does not necessarily demonstrate that a statistically
significant prior result has proven non-replicable (Goodman 1992). Gelman and Stern
(2006: 329) correctly point out that if one were to make statistical significance the
criterion for inference from multiple estimations, then “one should look at the statistical
significance of the difference” in two results “rather than the difference between their
significance levels”.
Thus, Leamer-robustness is at odds with an understanding of robustness as the ability
of the baseline model to withstand ‘perturbations to its specification’. Robustness
testing in the tradition of George Box, Otis Dudley Duncan and others asks to what
extent the robustness test estimate is compatible with and supports the baseline
model’s estimate. This cannot be assessed without direct reference to the baseline
7 We could cite many more examples, including from our own publications.

11
model and its estimated effect size. The robustness of the baseline model estimate is not
tested by merely checking whether the robustness point estimate has the same sign and
remains statistically significant when the actual point estimate and its associated
confidence interval can be very different from the baseline model estimate. Would one
really call a baseline model estimate of 10 with small standard errors robust to a
robustness test estimate of 2 with sufficiently small standard errors so that it remains
statistically significant?
Perhaps more importantly, due to the fact that multiple models can never all be
assumed to represent the optimal trade-off between generality and simplicity,
employing Leamer-robustness to reject null hypotheses is based on a flawed inferential
logic. At best, Leamer-robustness provides a one-sided test: If all estimates have the
same sign and remain significant, one can reject the null hypothesis with greater
confidence. However, the opposite inference that the null hypothesis is correct – usually
that there is no effect – cannot be derived from the fact that not all models generate
estimates with the same sign and the minimum level of statistical significance since one
of the models could be severely misspecified or inefficiently estimated. In other words,
Leamer-robustness has an extremely low probability for making type-I (false positives)
errors but an unreliably high probability for committing type-II (false negatives) errors
(Plümper and Traunmüller 2016). Rejecting hypotheses based on a lack of Leamer-
robustness, thus, potentially allows the worst specified model or the model estimated
with lowest efficiency to determine the overall inference. Since both type-I and type-II
errors are equally problematic and can lead to costly faulty policy recommendations
(Lemons et al. 1997), there is no ‘conservative research design strategy’ excuse for
adopting Leamer-robustness.

12
This problem of one-sidedness is exacerbated by the fact that in a number of robustness
tests one would expect an increase in standard errors due to an unnecessary decline in
efficiency. The estimated effect may well become statistically insignificant, but this does
not necessarily cast doubt on the robustness of the baseline model estimate. For
example, many authors employ robustness tests in which they restrict the sample in
some way and thus discard some observations. Naturally, the reduced sample size
lowers the efficiency of the estimates and renders finding a statistically non-significant
estimate more likely.8 This similarly applies to any robustness test that discards
information – for example, unit fixed effects robustness test models that drop all the
between variation in the data.
One-sidedness would pose less of a problem if robustness were to be assessed by
averaging across all robustness test models since then a severely misspecified model or
an inefficiently estimated model would only exert an influence in line with its weight in
the model averaging instead of exerting full ‘inferential veto right’. Model averaging is
indeed what later disciples of Leamer’s sensitivity analysis have resorted to,
acknowledging explicitly that Leamer-robustness is far too restrictive as an inferential
criterion when millions of models are estimated (Sala-i-Martin 1997; Sala-i-Martin,
Doppelhofer and Miller 2004). Yet, Monte Carlo analysis demonstrates that even model
averaging combined with Leamer-robustness suffers from a large likelihood of
committing type-II errors (Plümper and Traunmüller 2016). Also, one should not
8 In the study by Bechtel and Schneider (2010) cited above, for example, one robustness test restricts the sample to estimating immediate effects (abnormal returns on the day after the summit). The estimated effect becomes statistically insignificant at the 5-percent level. The increase in standard errors is obviously triggered by the sharp decline in the number of observations (from 1,554 to 222). Why would a result become not robust only because researchers artificially reduce the available information used to estimate the effects?

13
employ model averaging across robustness tests that address different aspects of model
specification. Strong robustness in one or more dimensions of model specification
should not cover up the lack of robustness in one or more other dimensions. Contrary to
sensitivity analyses that only address the set of explanatory variables, robustness
testing addresses multiple dimensions of model specification.
Finally, the hunt for statistical significance has always caused authors to carefully select
model specifications according to p-values. Adopting Leamer-robustness as the
inferential criterion with a small number of highly selected robustness tests – most
researchers report only few robustness tests – will fuel the undesirable tendency to find
everything significant and hence robust in empirical analyses. Ever since Fisher’s
(1925) original proposal of null hypothesis significance testing, applied researchers
have learned how to ‘tweak’ significance and to conceal the lack thereof. Coupled with
the fact that “undisclosed flexibility in data collection and analysis allows presenting
anything as significant” (Simmons et al. 2011: 1359), published empirical social science
research would seem to be robust to an astonishing degree.9
In sum then, the objections against defining robustness as effects remaining statistically
significant with the same sign combine old arguments against null hypothesis
significance testing and new arguments that the inferential logic of robustness testing is
at odds with such a conception of robustness. The next section provides an operational
9 Negative findings are important and in need of robustness testing. We wholeheartedly agree with the editors of 8 health economics journals who issued an editorial statement on negative findings that clearly states that results from well-designed studies “have potential scientific and publication merit regardless of whether such studies’ empirical findings do or do not reject null hypotheses that may be specified” (Editors 2015: 505).
14
definition of robustness that represents a superior inferential alternative to what we
have called Leamer-robustness for short.
4. A Superior Inferential Alternative: Robustness as Effect Size Stability
Some researchers employing robustness tests seem to adopt a different inferential
criterion for assessing robustness that refers to stability in effect size.10 For example,
Stratman claims robustness for his findings because the robustness tests’ “point
estimates were very similar” (Stratmann 2006: 794). Similarly, Cesarini et al. (2014)
state that, given the absence of correlation between the variable of interest and the
variable added in their robustness test, “it is not surprising that the estimates hardly
move”. Some political scientists seemingly combine stability in effect size with Leamer-
robustness. Cederman et al. (2011: 491) in their analysis of the effect of ‘horizontal
inequalities’ on the risk of ethnonationalist civil war onset, for example, drop extreme
cases from their analysis in a robustness test and find that while this “weakens the
results, the inequality effect remains statistically significant and strong.” Gerber and
Huber (2010: 164) observe that the coefficient of their variable of interest and its level
of significance remain “virtually unchanged”. In fact, we suspect that many who use
language that might suggest they subscribe to a conception of robustness as stability in
effect size actually exclusively or additionally mean stability in the direction of an effect
and its statistical significance.
10 Logically, it is not necessary to define robustness and the criterion for inferences in the same way. For example, it is possible to define robustness as effect size stability, and the inference criterion as robustness plus significance.

15
Understanding robustness as stability in effect size concurs with modern approaches to
statistical inference which rely on relevance rather than statistical significance. As an
ever growing number of authors argues, social scientists should focus on the
substantive importance of their estimated effects (Ziliak and McCloskey 2008; Esarey
and Danneman 2015). As Gill (1999: 657f.) has put it: “Finding population-effect sizes is
actually the central purpose of political science research since any difference can be
found to be statistically significant given enough data”.
Yet, researchers who seem to use stability in effect strength as a criterion for assessing
robustness have – to the best of our knowledge – failed to define how similar estimates
have to be to be considered as robust and how much difference is too much. To
overcome this shortcoming, we define robustness as the share of the probability density
distribution of the robustness test estimated effect that lies within the 95-percent
confidence interval of the baseline model estimated effect. Assume for expositional
simplicity that we have an estimation model in which coefficients represent effects so
we can express our definition of robustness simply in terms of estimated coefficients
and their standard errors. It is easy to extend this definition to estimated effects and
their standard errors when coefficients do not represent effects. Let
22ˆ ˆ21
ˆ ˆ, ,ˆ 2
b b b
b b b
b
af a e
(1)
be the probability density function, normally distributed because noise is assumed to be
normally distributed, for the baseline model with ßb being the point estimate of variable
of interest x and σb its standard error. We define the degree of robustness ρ (rho) as the
share or percentage of the probability density function of the robustness test model

16
estimate that falls within the 95-percent confidence interval of the probability density
function of the baseline model estimate, which is
2 2ˆ ˆ ˆ ˆ
ˆ ˆ
1ˆ
ˆ 2
b br r
b b
C a C
rC
r
e da
.11 (2)
Definitions are neither right nor wrong but useful. In this respect, our definition has the
following useful properties:
First, this operational definition of robustness captures the spirit of George Box’s
general description of robustness as the insensitivity of results to realistic departures
from ideal assumptions (Box 1979: 201). It measures the insensitivity of estimated
effects – given the estimated sampling uncertainty of these effects – to departures from
the baseline model, which describes ideal assumptions. The closer the point estimate of
the robustness test estimate to the baseline model estimate, the higher is ρ. Conversely,
for any given standard errors in baseline model and robustness test model estimate, ρ is
always and unambiguously smaller the larger the difference in point estimates.
Second, another useful property of our operational definition is that ρ is a continuous
measure, ranging from 0 (lack of robustness) to 1 (strong robustness). Robustness
comes in degrees and not as a dichotomy. Higher values of ρ represent a higher degree
of robustness and lower values represent a lower degree of robustness. This differs
from all alternative conceptions we know of, where results are either robust or not. Ro-
bustness tests can increase the confidence in the baseline model’s estimated effect size
if ρ exceeds 0.95. Yet, the majority of robustness tests will result in a ρ smaller than
11 Note that C decreases from approximately 2.04 to approximately 1.96 as the sample size grows to infinity.
17
0.95, which suggests a higher level of uncertainty than the baseline model implies. Ro-
bustness tests provide a more realistic picture of the uncertainty of the baseline model’s
point estimate. The true uncertainty not only stems from sampling variation expressed
by the baseline model estimate’s standard error but also by model uncertainty and its
consequences.
Third, different from definitions of robustness that rely on significance, our operational
definition of robustness is left-right symmetric: identical positive and negative
deviations of the robustness test compared to the baseline model give the same degree
of robustness. It does not matter for ρ in which direction the robustness test estimate
deviates. Only the difference matters.
Fourth, contrary to practically all vague definitions of robustness as effect size stability
that we have seen in the extant literature, our definition explicitly takes into account
that both the baseline model and robustness test model are estimated with sampling
error as represented by their respective standard errors. Robustness as effect size
stability not only needs to take into account the difference in point estimates but also
the precision that the point estimates come with.12 Loosely speaking, our operational
definition of robustness measures the extent to which one can be confident that the
plausible range for the estimated effect of the robustness test model supports the plau-
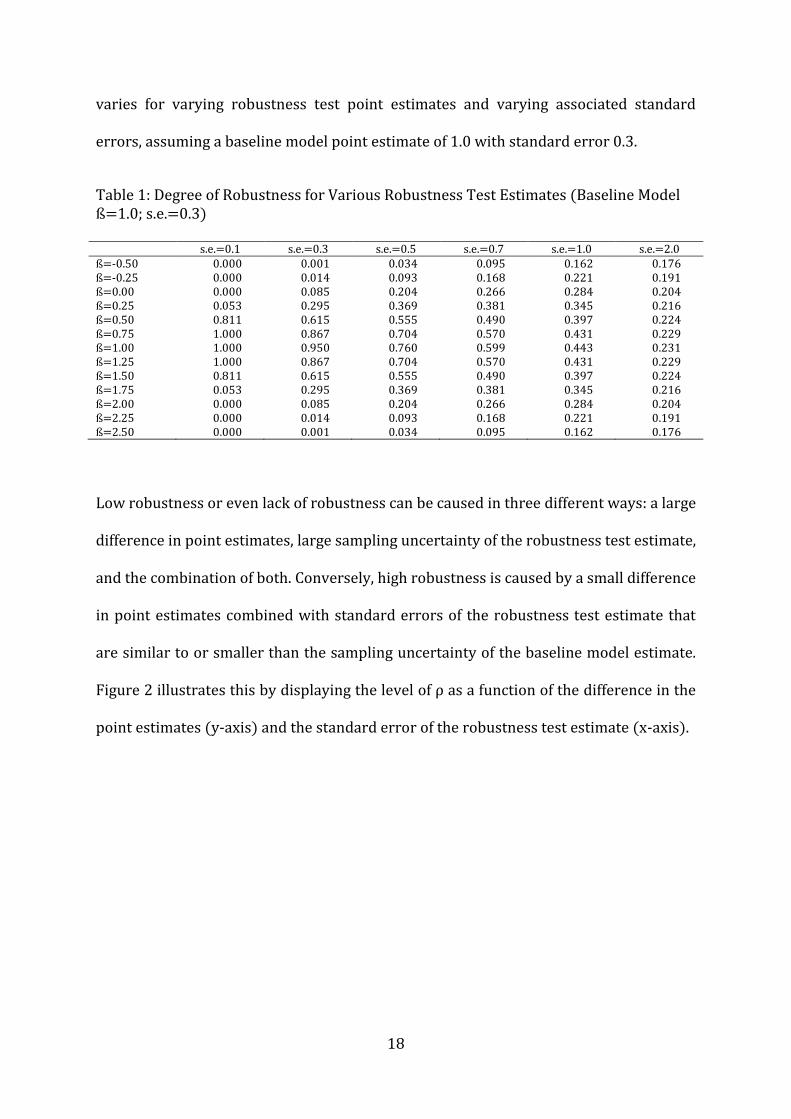
sible range for the estimated effect from the baseline model. Table 1 illustrates how ρ
12 In its absence, it is entirely unclear what researchers mean when they claim their estimates are “quite similar” (Bailey and Maltzman 2008: 379; Baum 2013: 450), “close” (Gehlbach, Sonin, and Zhuravskaya 2010: 732), “substantively similar” (Lipsmeyer and Zhu 2011: 652) or “essentially the same” and “unchanged” (Mukherjee and Singer 2010: 50; Hafner-Burton, Helfer and Fariss 2011: 701; Braumoeller 2008: 86).
18
varies for varying robustness test point estimates and varying associated standard
errors, assuming a baseline model point estimate of 1.0 with standard error 0.3.
Table 1: Degree of Robustness for Various Robustness Test Estimates (Baseline Model ß=1.0; s.e.=0.3)
s.e.=0.1 s.e.=0.3 s.e.=0.5 s.e.=0.7 s.e.=1.0 s.e.=2.0 ß=-0.50 0.000 0.001 0.034 0.095 0.162 0.176 ß=-0.25 0.000 0.014 0.093 0.168 0.221 0.191 ß=0.00 0.000 0.085 0.204 0.266 0.284 0.204 ß=0.25 0.053 0.295 0.369 0.381 0.345 0.216 ß=0.50 0.811 0.615 0.555 0.490 0.397 0.224 ß=0.75 1.000 0.867 0.704 0.570 0.431 0.229 ß=1.00 1.000 0.950 0.760 0.599 0.443 0.231 ß=1.25 1.000 0.867 0.704 0.570 0.431 0.229 ß=1.50 0.811 0.615 0.555 0.490 0.397 0.224 ß=1.75 0.053 0.295 0.369 0.381 0.345 0.216 ß=2.00 0.000 0.085 0.204 0.266 0.284 0.204 ß=2.25 0.000 0.014 0.093 0.168 0.221 0.191 ß=2.50 0.000 0.001 0.034 0.095 0.162 0.176
Low robustness or even lack of robustness can be caused in three different ways: a large
difference in point estimates, large sampling uncertainty of the robustness test estimate,
and the combination of both. Conversely, high robustness is caused by a small difference
in point estimates combined with standard errors of the robustness test estimate that
are similar to or smaller than the sampling uncertainty of the baseline model estimate.
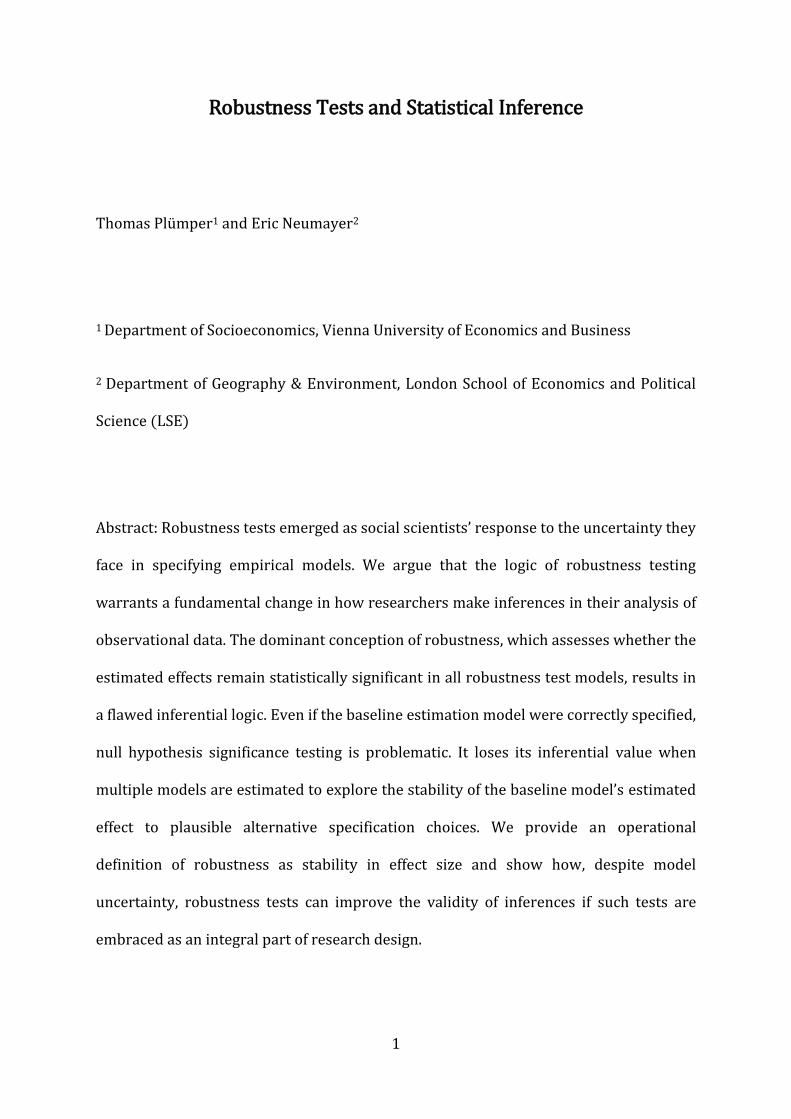
Figure 2 illustrates this by displaying the level of ρ as a function of the difference in the
point estimates (y-axis) and the standard error of the robustness test estimate (x-axis).
19
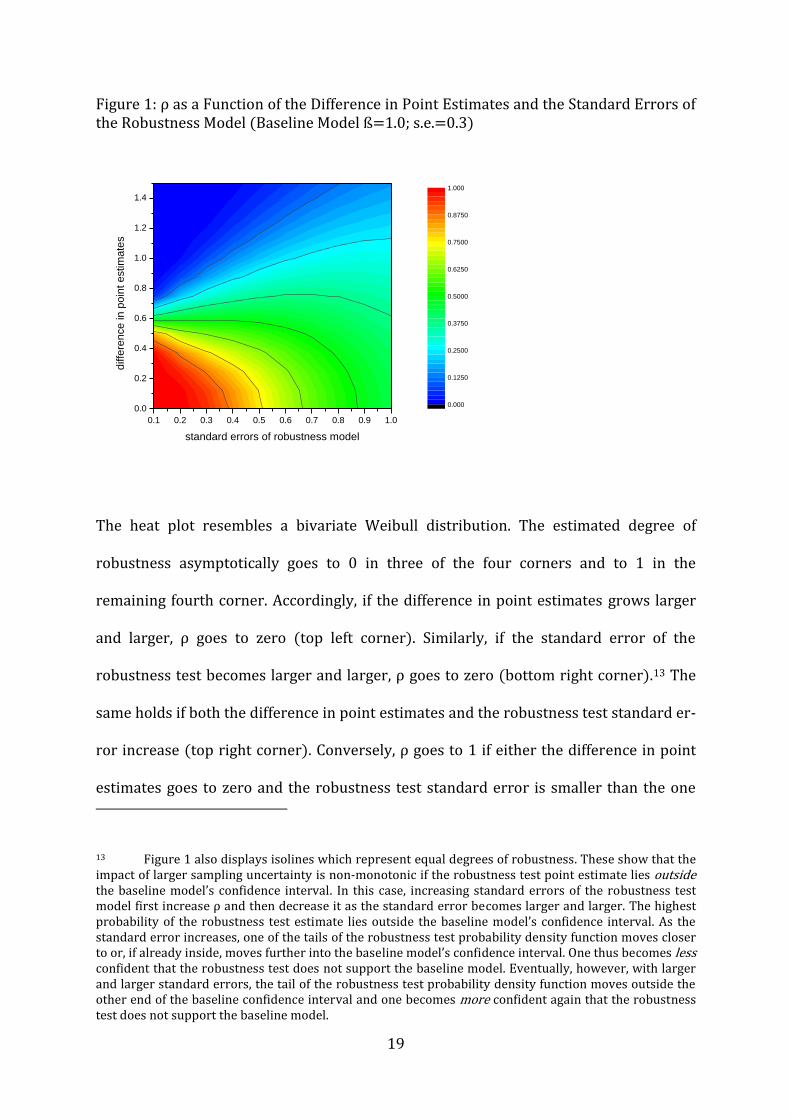
Figure 1: ρ as a Function of the Difference in Point Estimates and the Standard Errors of the Robustness Model (Baseline Model ß=1.0; s.e.=0.3)
0.1 0.2 0.3 0.4 0.5 0.6 0.7 0.8 0.9 1.0
0.0
0.2
0.4
0.6
0.8
1.0
1.2
1.4
standard errors of robustness model
diffe
ren
ce
in
po
int e
stim
ate
s
0.000
0.1250
0.2500
0.3750
0.5000
0.6250
0.7500
0.8750
1.000
The heat plot resembles a bivariate Weibull distribution. The estimated degree of
robustness asymptotically goes to 0 in three of the four corners and to 1 in the
remaining fourth corner. Accordingly, if the difference in point estimates grows larger
and larger, ρ goes to zero (top left corner). Similarly, if the standard error of the
robustness test becomes larger and larger, ρ goes to zero (bottom right corner).13 The
same holds if both the difference in point estimates and the robustness test standard er-
ror increase (top right corner). Conversely, ρ goes to 1 if either the difference in point
estimates goes to zero and the robustness test standard error is smaller than the one
13 Figure 1 also displays isolines which represent equal degrees of robustness. These show that the impact of larger sampling uncertainty is non-monotonic if the robustness test point estimate lies outside the baseline model’s confidence interval. In this case, increasing standard errors of the robustness test model first increase ρ and then decrease it as the standard error becomes larger and larger. The highest probability of the robustness test estimate lies outside the baseline model’s confidence interval. As the standard error increases, one of the tails of the robustness test probability density function moves closer to or, if already inside, moves further into the baseline model’s confidence interval. One thus becomes less confident that the robustness test does not support the baseline model. Eventually, however, with larger and larger standard errors, the tail of the robustness test probability density function moves outside the other end of the baseline confidence interval and one becomes more confident again that the robustness test does not support the baseline model.
20
from the baseline model or if the robustness test standard error goes to zero and the
difference in point estimates remains sufficiently small.
Fifth, our operational definition leads to assessments of robustness as a function of the
uncertainty of the baseline and robustness test model estimates and the deviation in
estimated effects in ways that make intuitive sense. The lower the uncertainty of the
baseline and robustness test model estimates, the lower is robustness if point estimates
deviate. If scholars face low sampling uncertainty, then a deviating point estimate in the
robustness test should lead to a large increase in uncertainty that the true effect size is
indeed within the 95-percent confidence interval of the baseline model estimate. It is
this property of our definition of robustness that differs most clearly from the
properties of Leamer-robustness. Our definition has the largest potential for lack of
robustness if both the baseline model and the robustness test model are potentially well
specified and efficiently estimated – but unfortunately the two results differ. Hence, in
our concept, robustness is particularly at stake if two or more efficiently estimated and
potentially well-specified models give different results. In Leamer’s concept of
robustness, robustness is at stake if one of the robustness test models is poorly
specified or inefficiently estimated.
Equally importantly, the validity of properly formulated inferences increases with our
definition of robustness even if the estimated degree of robustness is low or zero. This is
a second marked difference between our definition and Leamer-robustness, which
interprets lack of statistical significance in one of the robustness tests as evidence that
the baseline model inference of a statistically significant effect is invalid. Consider two
point estimates that are relatively precisely estimated, for example, a baseline model
point estimate of 10 with standard error 0.2 and a robustness test model estimate of 9
21
with equally small standard error such that ρ is close to zero. The baseline model’s
estimated effect size of 10 is indeed not robust to the robustness test model. After this
robustness test, we are much less confident that the true effect size lies in the range of
approximately 9.6 to 10.4 than we were based on the baseline model estimate alone.
But the inference that the effect size is no less than 8.6 (the lower bound of the 95-
percent confidence interval of the robustness test estimate) has become more valid
after the robustness test despite the fact that the baseline model’s estimated effect was
found to be non-robust. Because robustness tests provide more evidence and a more
realistic picture of the true uncertainty of estimated effect sizes that stems from both
sampling error and model uncertainty, inferences formulated on the basis of the entire
set of evidence become more valid even if ρ is well below 0.95 or even 0. Our definition
of robustness has this advantage over Leamer-robustness because it makes estimated
effects the object of robustness testing and formulates inferences based on the evidence
from robustness testing, whereas Leamer-robustness erroneously makes the inference
of a statistically significant effect itself the object of robustness testing.
A final useful property is that our operational definition allows for varying degrees of
robustness across cases and therefore for what we term ‘partial robustness’. So far, we
have defined robustness as stability of the estimated effect size of a variable, implicitly
assuming one single estimated effect. In all non-linear estimation models, however,
coefficients do not represent effects and estimated effects are a function of the values of
all explanatory variables in the model. Non-linear models, thus, do not have a single
effect of variable x on outcome y, but a quasi-infinite number of potential effects at
various combinations of explanatory variable values. The same applies to linear models
with non-linear effects, conditional effects, or causal or temporal heterogeneity. In all of

22
these cases, estimated effects which are representative for the entire sample do not
exist. Instead, estimated effects differ across cases and so does therefore ρ. It may well
be that robustness is high for some parts of the sample and low for other parts of the
sample, i.e. that the baseline model’s estimated effect size is partially robust.
5. Conclusion
While correctly modelling the true data-generating process is an impossible task,
robustness tests offer a feasible way forward. By testing the robustness of the baseline
model’s estimated effect researchers explore the impact of model uncertainty on
estimated effects and on inferences. Crucially, even if robustness tests increase
researchers’ uncertainty about the point estimates, they can improve the validity of
inferences because inferences are no longer based on one selected model specification
but on a multitude of plausible model specifications. It is impossible to quantify a priori
how much the validity of inferences will increase since this will depend on how well
designed the research analysis is, how well specified the baseline model is (despite
knowing that it cannot be correctly specified) and how well justified the robustness
tests are, both in the eyes of the researcher herself and her peers.
We follow George Box (1979: 201) who understands robustness as the “property of a
procedure which renders the answers it gives insensitive to departures, of a kind which
occur in practice, from ideal assumptions.” We operationalize robustness as the share of
the sampling variation of the estimated effect of the robustness test model which falls
within the 95 percent confidence interval of the baseline model’s estimate. In our
definition of robustness as effect size stability, statistical significance plays no role and
23
the statistical significance of one, a few, or all robustness test estimates does not in itself
render the baseline model estimated effect non-robust.
This marks a dramatic departure from predominant current practice and we have
argued in detail why conceiving robustness as stability in the direction of an effect and
its statistical significance – what we have called Leamer-robustness – is based on a
flawed inferential logic. Most importantly, Leamer-robustness misunderstands the
purpose of robustness testing. In order to test the robustness to plausible changes in
model specification, robustness tests need to relate to the baseline model’s estimated
effect size and its confidence interval. Robustness tests cannot serve their purpose if
they simply test whether the robustness model estimate is statistically significant.
A lack of clear operational definition and the misplaced focus on statistical significance
are not the only problems with the current practice of robustness testing. Robustness
tests are inadequately justified and appear to be carefully pre-selected to demonstrate
robustness – just like plenty of evidence suggests that estimation models are specified
in order to ‘lift’ the statistical significance of the effect of interest over the 5-percent
threshold (Gerber et al. 2001; Gerber and Malhotra 2008; Simonsohn et al. 2013). For
robustness testing to deliver on its inferential promise, it must be undertaken
systematically and form part and parcel of a research strategy instead of a mere
strategy to get one’s paper past reviewers and editors. Robustness testing only reduces
the inferential challenge that stems from model uncertainty if the selection of tests has
been made with a serious intention to test and explore (rather than to demonstrate) the
robustness of the baseline model’s estimated effect size. The problem of cherry-picking
results becomes less severe if reviewers and editors increasingly demand additional ro-
bustness tests from authors or if it becomes more common in the social sciences to rep-
24
licate and subject to further robustness testing the findings of important publications.
The more the power and potential of robustness tests become known to reviewers and
editors, the smaller the potentially biasing autonomy of authors to pre-select their
robustness tests.
In fact, in our view, social science would be served best if researchers abandoned their
preference for finding everything robust. Every applied researcher understands that
estimates can be massaged to suit the eyes of the reviewers – in fact, even reviewers
understand this. Therefore, a shallow demonstration of robustness does not take social
science much further. In contrast, an identified lack of robustness in a dimension of
model specification poses an interesting question that complementary research might
be able to answer.

25
References
Abelson, R.P., 1997. “A retrospective on the significance test ban of 1999 (If there were
no significance tests, they would be invented).” In: Harlow, LL, Muliak, SA, and
Steiger, JH (eds.), What If There Were No Significance Tests? Mahwah, NJ: Lawrence
Erlbaum, pp.117-141.
Bailey, Michael A., and Forrest Maltzman. “Does legal doctrine matter? Unpacking law
and policy preferences on the US Supreme Court.” American Political Science
Review 102(3): 369-384.
Baum, M.A., 2013. “The Iraq Coalition of the Willing and (Politically) Able: Party
Systems, the Press, and Public Influence on Foreign Policy.” American Journal of
Political Science, 57(2): 442-458.
Bechtel, M.M. and Schneider, G., 2010. “Eliciting substance from ‘hot air’: Financial
market responses to EU summit decisions on European defense.” International
Organization, 64(2): 199-223.
Box, George EP, and Norman Richard Draper. 1987. Empirical model-building and re-
sponse surfaces. New York: Wiley.
Box, George EP. 1976. “Science and statistics.” Journal of the American Statistical Associ-
ation 71(356): 791-799.
Box, George EP. 1979. “Robustness in the strategy of scientific model building.” In
Robert L. Launer and Graham N. Wilkinson (eds.): Robustness in statistics, New
York: Academic Press: 201-236.
Braumoeller, Bear F. 2008. “Systemic politics and the origins of Great Power conflict.”
American Political Science Review 102(1): 77-93.

26
Cederman, L.E., Weidmann, N.B. and Gleditsch, K.S., 2011. “Horizontal inequalities and
ethnonationalist civil war: A global comparison.” American Political Science
Review, 105(3): 478-495.
Cesarini, D., Johannesson, M. and Oskarsson, S., 2014. “Pre-birth factors, post-birth
factors, and voting: Evidence from Swedish adoption data.” American Political
Science Review, 108(1): 71-87.
Duncan, Otis Dudley. 1975. Introduction to structural equation models. Elsevier.
Editors. 2015. “Editorial statement on negative findings.” Health Economics, 24: 505.
Esarey, J. and Danneman, N., 2015. “A quantitative method for substantive robustness
assessment.” Political Science Research and Methods, 3(1): 95-111.
Feldstein, M., 1982. “Inflation, Tax Rules and Investment: Some Econometric Evidence.”
Econometrica, 50: 825-862.
Fisher, Ronald A. 1925. Statistical Methods for Research Workers. Edinburgh, UK: Oliver
and Boyd.
Frank, Kenneth, and Kyung Seok Min. 2007. “Indices of robustness for sample represen-
tation.” Sociological Methodology 37(1): 349-392.
Frank, Kenneth. 2000. “Impact of a Confounding Variable on the Inference of a Regres-
sion Coefficient.” Sociological Methods and Research 29(2): 147-194.
Gehlbach, Scott, Konstantin Sonin, and Ekaterina Zhuravskaya. 2010. “Businessman can-
didates.” American Journal of Political Science 54(3): 718-736.
Gelman, A. and Stern, H., 2006. “The difference between ‘significant’ and ‘not significant’
is not itself statistically significant.” The American Statistician, 60(4): 328-331.
Gerber, A.S., Green, D.P. and Nickerson, D., 2001. “Testing for publication bias in political
science.” Political Analysis, 9(4): 385-392.
27
Gerber, Alan S., and Gregory A. Huber. 2010. “Partisanship, political control, and eco-
nomic assessments.” American Journal of Political Science 54(1): 153-173.
Gerber, A. and Malhotra, N., 2008. “Do statistical reporting standards affect what is
published? Publication bias in two leading political science journals.” Quarterly
Journal of Political Science, 3(3): 313-326.
Gill, Jeff. 1999. “The insignificance of null hypothesis significance testing.” Political Re-
search Quarterly 52(3): 647-674.
Goodman, S.N., 1992. “A comment on replication, p-values and evidence.” Statistics in
medicine, 11(7): 875-879.
Gross, J.H., 2015. “Testing What Matters (If You Must Test at All): A Context-Driven
Approach to Substantive and Statistical Significance.” American Journal of Political
Science, 59(3): 775-788.
Hafner-Burton, Emilie M., Laurence R. Helfer, and Christopher J. Fariss. 2011. “Emergen-
cy and escape: explaining derogations from human rights treaties.” International
Organization 65(4): 673-707.
Hagen, R.L., 1997. “In praise of the null hypothesis statistical test.” The American
psychologist, 52(1): 15-24.
Harlow, LL, Muliak, SA, and Steiger, JH (eds.). 1997. What If There Were No Significance
Tests? Mahwah, NJ: Lawrence Erlbaum.
Keefer, P. and Stasavage, D., 2002. “Checks and balances, private information, and the
credibility of monetary commitments.” International Organization, 56(4): 751-774.
Keele, Luke John. 2008. Semiparametric regression for the social sciences. John Wiley &
Sons.
Kennedy, Peter. 2008. A guide to econometrics. Blackwell Publishing.
28
Krantz, D.H., 1999. “The null hypothesis testing controversy in psychology.” Journal of
the American Statistical Association, 94(448): 1372-1381.
Leamer, Edward E. 1978. Specification searches: Ad hoc inference with non-
experimental data. John Wiley & Sons Incorporated.
Leamer, Edward E. 1985. “Sensitivity analyses would help.” The American Economic Re-
view, 75(3): 308-313.
Lemons, John, Kristin Shrader-Frechette, and Carl Cranor. 1997. “The precautionary
principle: Scientific uncertainty and type I and type II errors.” Foundations of Sci-
ence 2(2): 207-236.
Levine, Ross, and David Renelt. 1992. “A sensitivity analysis of cross-country growth re-
gressions.” The American economic review, 82(4): 942-963.
Lipsmeyer, Christine S., and Ling Zhu. 2011. “Immigration, globalization, and unemploy-
ment benefits in developed EU states.” American Journal of Political Science 55(3):
647-664.
Mukherjee, Bumba, and David Andrew Singer. 2010. “International institutions and do-
mestic compensation: the IMF and the politics of capital account liberalization.”
American Journal of Political Science 54(1): 45-60.
Neumayer, Eric and Thomas Plümper. 2016. Robustness Tests – Causal Inference with
Observational Data. Book manuscript.
Nickerson, R.S., 2000. “Null hypothesis significance testing: a review of an old and
continuing controversy.” Psychological methods, 5(2): 241-301.
Nordås, R. and Davenport, C., 2013. “Fight the youth: Youth bulges and state repression.”
American Journal of Political Science, 57(4): 926-940.
Oakes, M.W., 1986. Statistical inference: A Commentary for the Social and Behavioural
Sciences. Chichester: John Wiley & Sons.
29
Pan, Wei, and Kenneth A. Frank. 2003. “A probability index of the robustness of a causal
inference.” Journal of Educational and Behavioral Statistics 28(4): 315-337.
Plümper, Thomas and Richard Traunmüller. 2016. The Sensitivity of Sensitivity Tests.
Unpublished manuscript, Vienna University of Economics.
Rainey, C., 2014. “Arguing for a negligible effect.” American Journal of Political Science,
58(4): 1083-1091.
Rosenbaum, Paul R. 2002/2010. Observational Studies (1st ed./2nd ed.). Springer.
Sala-i-Martin, Xavier X. 1997. “I just ran two million regressions.” The American Econo-
mic Review 87(2): 178-183.
Sala-i-Martin, Xavier X., Gernot Doppelhofer and Ronald I. Miller. 2004. “Determinants
of Long-Term Growth: A Bayesian Averaging of Classical Estimates (BACE)
Approach.” American Economic Review 94(4): 813-835.
Simmons, J.P., Nelson, L.D. and Simonsohn, U., 2011. “False-Positive Psychology:
Undisclosed Flexibility in Data Collection and Analysis Allows Presenting Anything
as Significant.” Psychological Science, 22(11): 1359-1366.
Simonsohn, U., Nelson, L.D. and Simmons, J.P., 2014. “P-curve: A key to the file-drawer.”
Journal of Experimental Psychology: General, 143(2): 534-547.
Stratmann, T., 2006. “Is spending more potent for or against a proposition? Evidence
from ballot measures.” American Journal of Political Science, 50(3): 788-801.
Ward, M.D., Greenhill, B.D. and Bakke, K.M., 2010. “The perils of policy by p-value:
Predicting civil conflicts.” Journal of Peace Research, 47(4): 363-375.
Ziliak, S.T. and McCloskey, D.N., 2008. The cult of statistical significance: How the
standard error costs us jobs, justice, and lives. University of Michigan Press.