Embed Size (px)
Citation preview

Roche Ireland Limited
Annual Environmental Report 2010
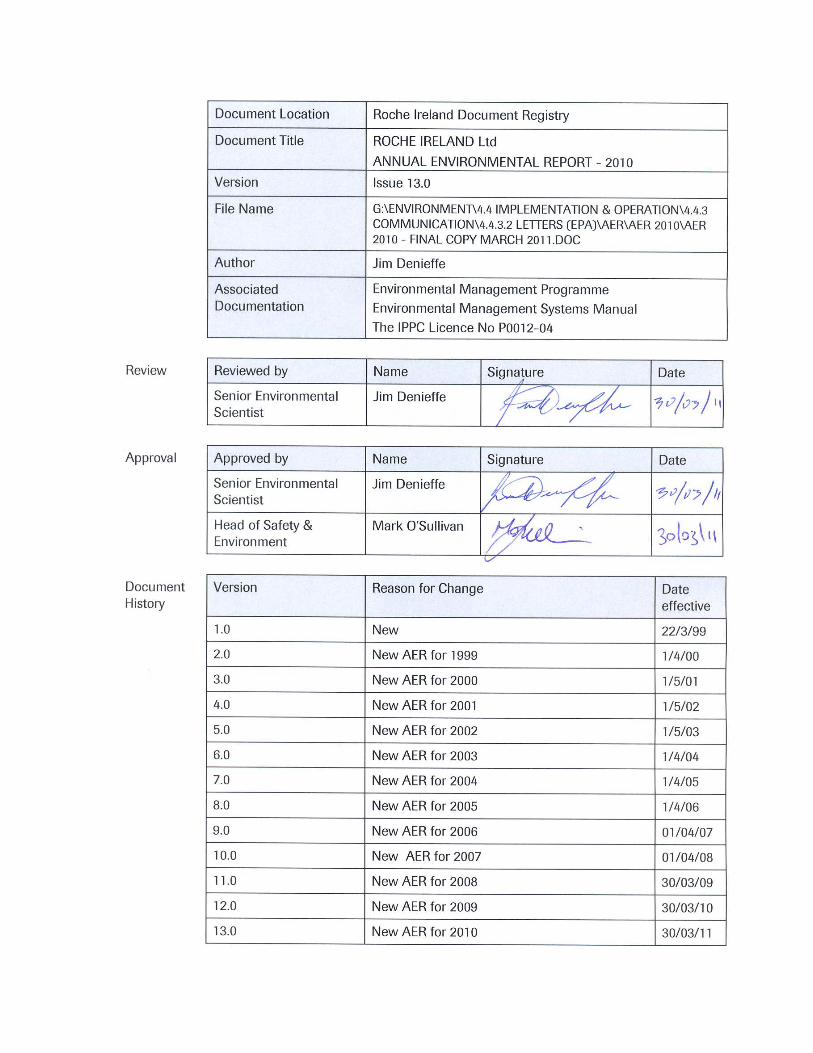
Document Location Roche Ireland Document Registry
Document Title ROCHE IRELAND Ltd
ANNUAL ENVIRONMENTAL REPORT - 2010
Version Issue 13.0
File Name G:\ENVIRONMENT\4.4 IMPLEMENTATION & OPERATION\4.4.3 COMMUNICATION\4.4.3.2 LETTERS (EPA)\AER\AER 2010\AER 2010 - FINAL COPY MARCH 2011.DOC
Author Jim Denieffe
Associated Documentation
Environmental Management Programme
Environmental Management Systems Manual
The IPPC Licence No P0012-04
Review Reviewed by Name Signature Date
Senior Environmental Scientist
Jim Denieffe
Approval Approved by Name Signature Date
Senior Environmental Scientist
Jim Denieffe
Head of Safety & Environment
Mark O’Sullivan
Document History
Version Reason for Change Date effective
1.0 New 22/3/99
2.0 New AER for 1999 1/4/00
3.0 New AER for 2000 1/5/01
4.0 New AER for 2001 1/5/02
5.0 New AER for 2002 1/5/03
6.0 New AER for 2003 1/4/04
7.0 New AER for 2004 1/4/05
8.0 New AER for 2005 1/4/06
9.0 New AER for 2006 01/04/07
10.0 New AER for 2007 01/04/08
11.0 New AER for 2008 30/03/09
12.0 New AER for 2009 30/03/10
13.0 New AER for 2010 30/03/11
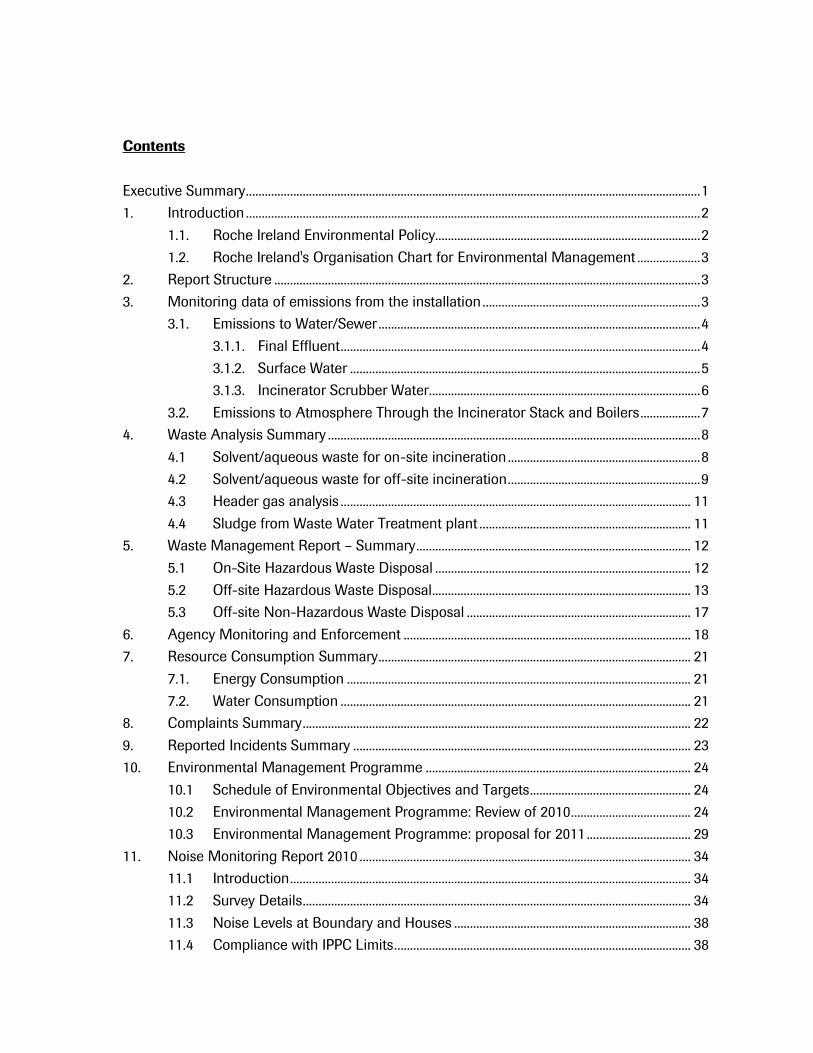
Contents
Executive Summary................................................................................................................................................1
1. Introduction ................................................................................................................................................2
1.1. Roche Ireland Environmental Policy....................................................................................2
1.2. Roche Ireland's Organisation Chart for Environmental Management ....................3
2. Report Structure .......................................................................................................................................3
3. Monitoring data of emissions from the installation .....................................................................3
3.1. Emissions to Water/Sewer ......................................................................................................4
3.1.1. Final Effluent..................................................................................................................4
3.1.2. Surface Water ...............................................................................................................5
3.1.3. Incinerator Scrubber Water......................................................................................6
3.2. Emissions to Atmosphere Through the Incinerator Stack and Boilers...................7
4. Waste Analysis Summary ......................................................................................................................8
4.1 Solvent/aqueous waste for on-site incineration.............................................................8
4.2 Solvent/aqueous waste for off-site incineration.............................................................9
4.3 Header gas analysis ............................................................................................................... 11
4.4 Sludge from Waste Water Treatment plant ................................................................... 11
5. Waste Management Report – Summary....................................................................................... 12
5.1 On-Site Hazardous Waste Disposal ................................................................................. 12
5.2 Off-site Hazardous Waste Disposal.................................................................................. 13
5.3 Off-site Non-Hazardous Waste Disposal ....................................................................... 17
6. Agency Monitoring and Enforcement ........................................................................................... 18
7. Resource Consumption Summary................................................................................................... 21
7.1. Energy Consumption ............................................................................................................. 21
7.2. Water Consumption ............................................................................................................... 21
8. Complaints Summary........................................................................................................................... 22
9. Reported Incidents Summary ........................................................................................................... 23
10. Environmental Management Programme .................................................................................... 24
10.1 Schedule of Environmental Objectives and Targets................................................... 24
10.2 Environmental Management Programme: Review of 2010...................................... 24
10.3 Environmental Management Programme: proposal for 2011 ................................. 29
11. Noise Monitoring Report 2010 ......................................................................................................... 34
11.1 Introduction............................................................................................................................... 34
11.2 Survey Details........................................................................................................................... 34
11.3 Noise Levels at Boundary and Houses ........................................................................... 38
11.4 Compliance with IPPC Limits.............................................................................................. 38
11.5 Comparison with Previous Years ...................................................................................... 38
11.6 Tonal/Impulsiveness Analysis............................................................................................. 38
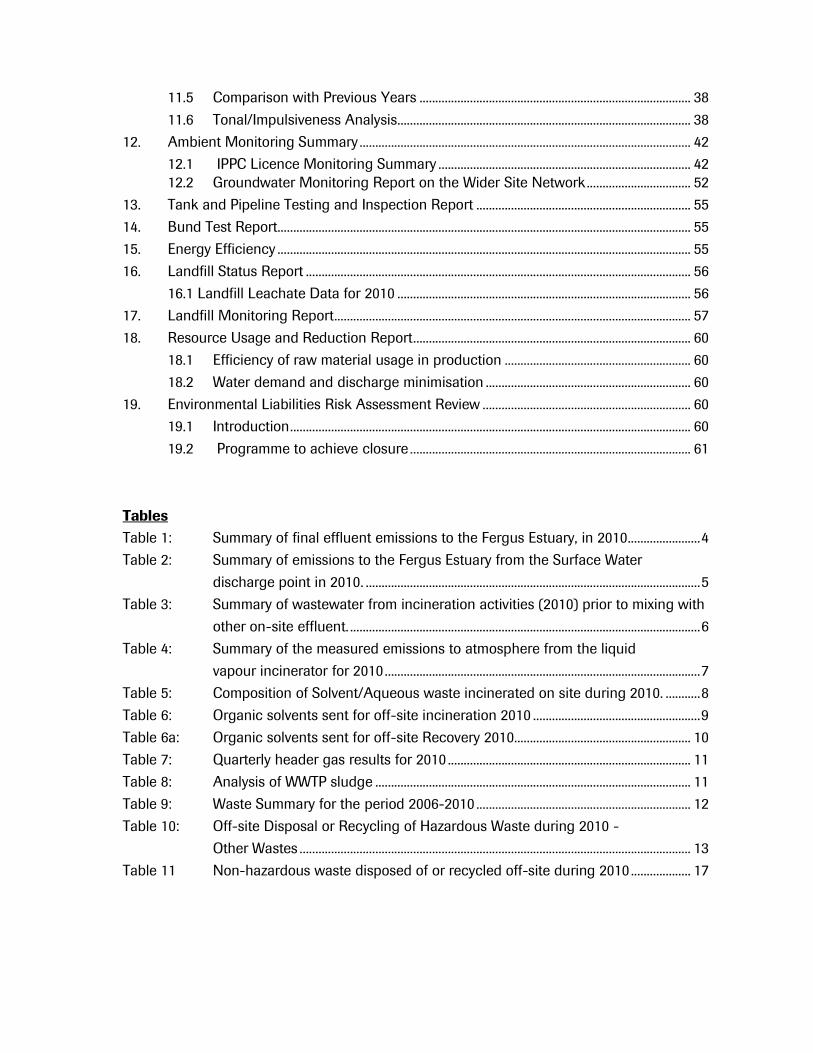
12. Ambient Monitoring Summary ......................................................................................................... 42
12.1 IPPC Licence Monitoring Summary ................................................................................ 42 12.2 Groundwater Monitoring Report on the Wider Site Network................................. 52
13. Tank and Pipeline Testing and Inspection Report .................................................................... 55
14. Bund Test Report................................................................................................................................... 55
15. Energy Efficiency ................................................................................................................................... 55
16. Landfill Status Report .......................................................................................................................... 56
16.1 Landfill Leachate Data for 2010 ............................................................................................. 56
17. Landfill Monitoring Report................................................................................................................. 57
18. Resource Usage and Reduction Report........................................................................................ 60
18.1 Efficiency of raw material usage in production ........................................................... 60
18.2 Water demand and discharge minimisation ................................................................. 60
19. Environmental Liabilities Risk Assessment Review .................................................................. 60
19.1 Introduction............................................................................................................................... 60
19.2 Programme to achieve closure ......................................................................................... 61
Tables
Table 1: Summary of final effluent emissions to the Fergus Estuary, in 2010.......................4
Table 2: Summary of emissions to the Fergus Estuary from the Surface Water
discharge point in 2010. ..........................................................................................................5
Table 3: Summary of wastewater from incineration activities (2010) prior to mixing with
other on-site effluent. ...............................................................................................................6
Table 4: Summary of the measured emissions to atmosphere from the liquid
vapour incinerator for 2010....................................................................................................7
Table 5: Composition of Solvent/Aqueous waste incinerated on site during 2010. ...........8
Table 6: Organic solvents sent for off-site incineration 2010 .....................................................9
Table 6a: Organic solvents sent for off-site Recovery 2010........................................................ 10
Table 7: Quarterly header gas results for 2010 ............................................................................. 11
Table 8: Analysis of WWTP sludge .................................................................................................... 11
Table 9: Waste Summary for the period 2006-2010 .................................................................... 12
Table 10: Off-site Disposal or Recycling of Hazardous Waste during 2010 -
Other Wastes ............................................................................................................................ 13
Table 11 Non-hazardous waste disposed of or recycled off-site during 2010 ................... 17
Table 13: Agency data obtained for split samples of final effluent taken by the
Agency from the installation............................................................................................... 18
Table 14: Agency data obtained for storm water taken the installation in 2010................. 20
Table 15: Energy consumption in GJ/annum for 2010.................................................................. 21
Table 16: Water consumption for 2010. ............................................................................................. 21
Table 17: Complaints received during 2005 to 2010 ..................................................................... 22
Table 18: Mean Specific Noise levels, Roche Irl. Ltd., May 2010............................................. 39
Table 19: Measured noise levels, Roche, May 2010...................................................................... 40
Table 20: Comparison of Night time Specific Noise Levels, (attributed to Roche)
2005-2010 boundary and houses...................................................................................... 41
Table 21: Borehole data for routine parameters. Sampled May 2010 ................................... 42
Table 22: Borehole data for routine parameters. Sampled October 2010 ............................ 43
Table 23: Groundwater Analysis:- VOC’s (mg/l) Round 1 May 2010 ...................................... 44
Table 24: Groundwater Analysis :- Semi volatiles (mg/l) Round 1 May 2010 ...................... 46
Table 25: Groundwater Analysis:- VOC’s (mg/l) Round 2 October 2010............................... 48
Table 26: Groundwater Analysis :- Semi volatiles (mg/l) Round 2 October 2010............... 50
Table 27: Landfill Leachate Analytical Data for 2010.................................................................... 56
Table 28: Boundary Drain Analytical Data for 2010....................................................................... 57
Table 29: Landfill Gas Monitoring for 2010 ...................................................................................... 57
Figure 1: Flow Diagram of Likely Order of Full Site Closure ...................................................... 63
Annex 1: Data set for emissions to atmosphere from incinerator and notification review
Annex 2: Noise Monitoring Locations
Annex 3: AER/PRTR 2010

Page 1 of 63
Executive Summary
Roche Ireland Ltd. operates to IPPC Licence No. P0012-04.
The following is a summary of the contents of the AER. Further details are available in the full report.
Roche Ireland retained registration to ISO 14001, Environmental Management System.
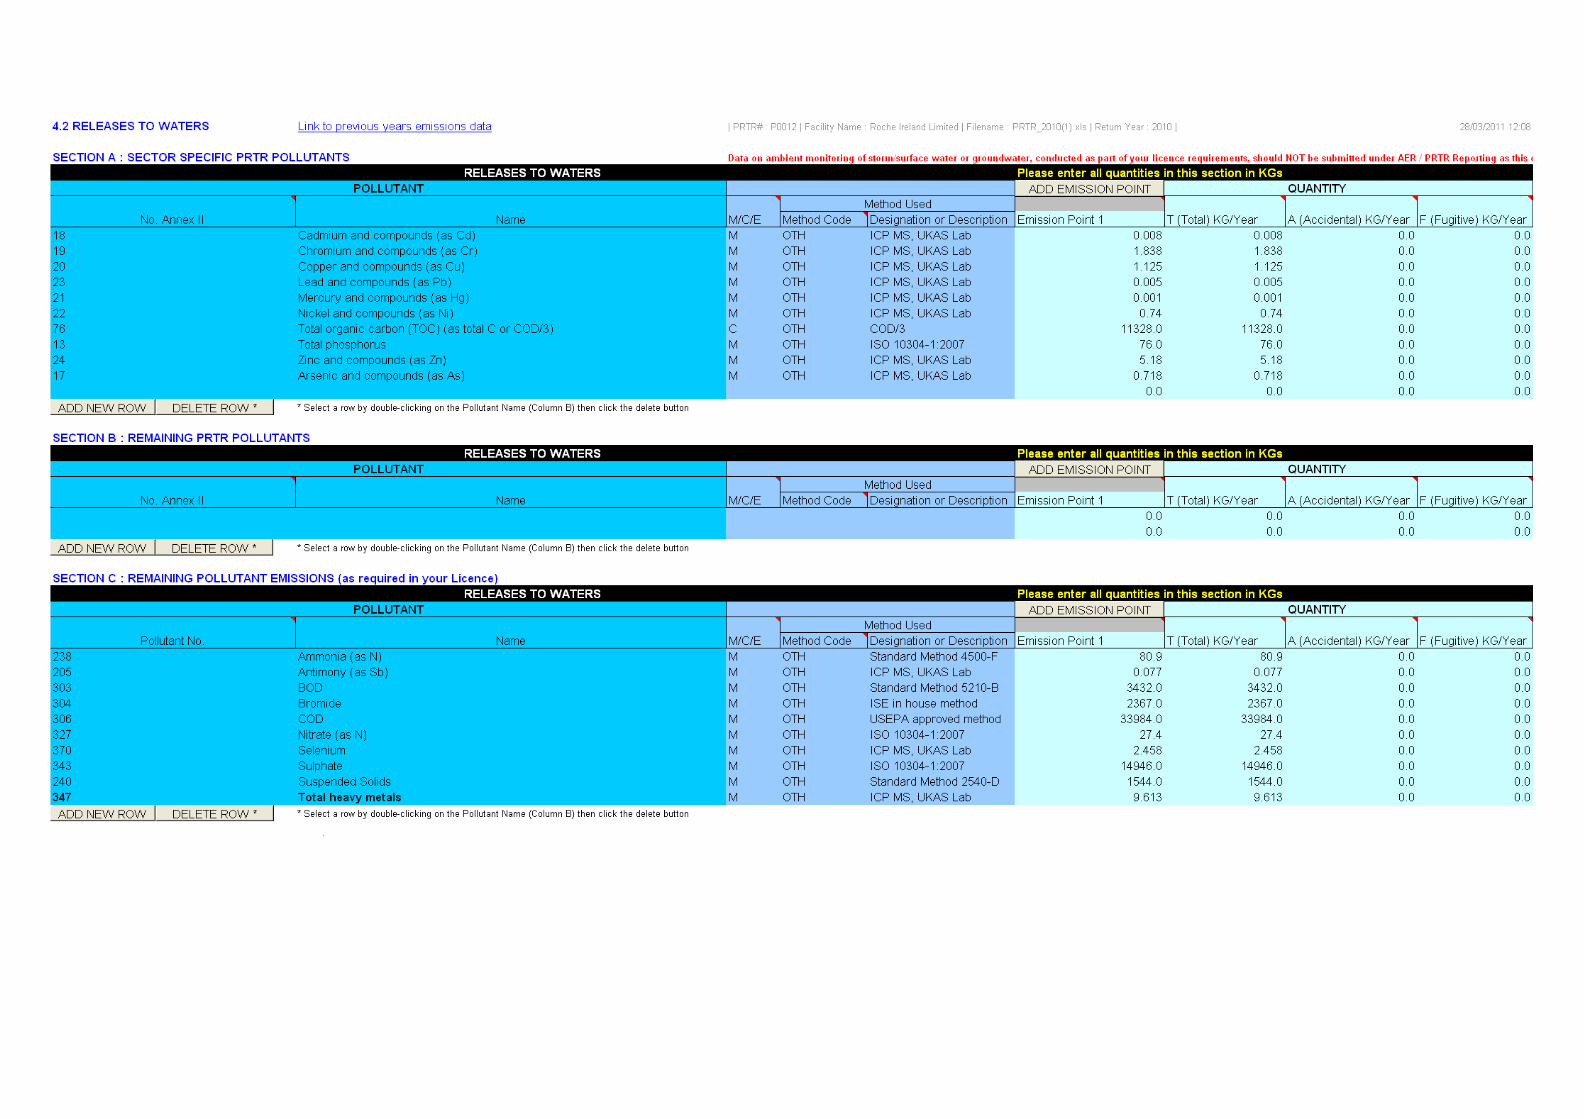
Emissions to Water
Roche treated effluent is emitted to the Fergus Estuary at Emission Point 15. Table 1 contains analytical details of the of the emissions for 2010. All licenced parameters are monitored in accordance with Schedule C.2.2 of the IPPC Licence, P0012-04.
On one occasion in 2010 the level of ammonia in the effluent exceeded the emission limit value. This was formally notified to the EPA. Corrective actions have been put in place to prevent a re-occurrence. In all other cases the results were well within the emission limit values set out in Schedule B.2 of the licence.
The results of independent monitoring carried out by the EPA on four occasions in 2010 are shown in Table 13. All parameters are well within the emission limit values.
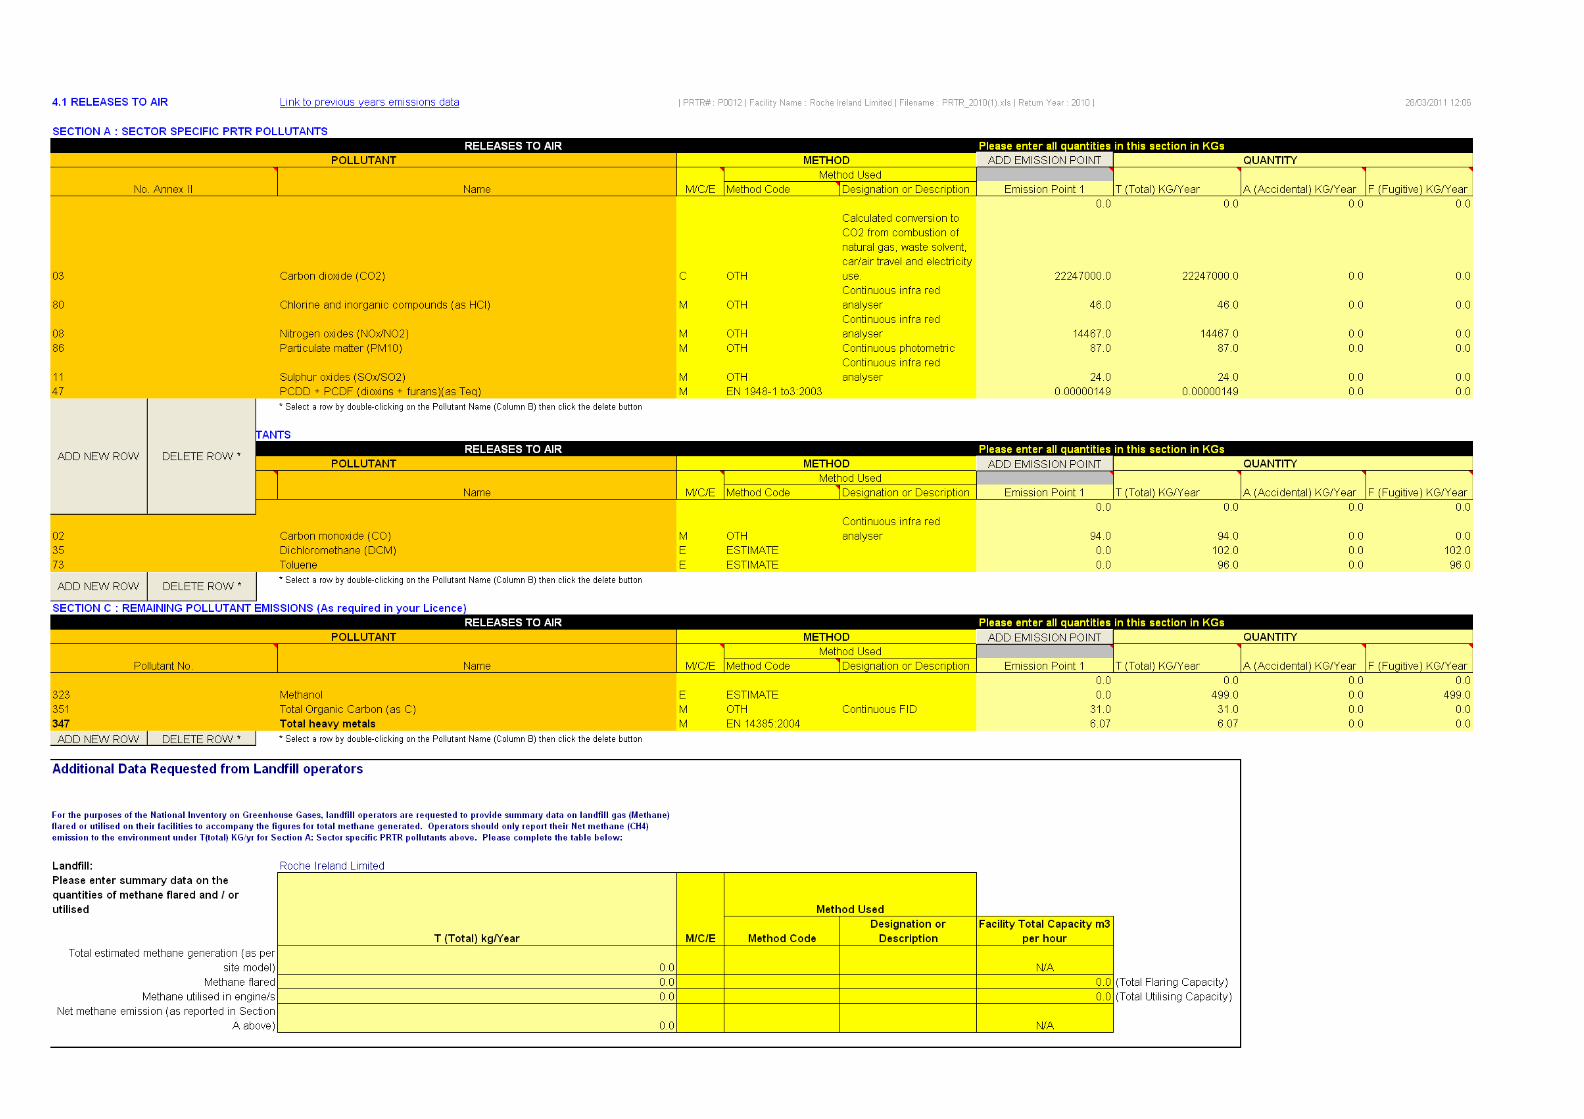
Emissions to Air
Emissions to air from the liquid/vapour incinerator occur at Emission point 16.
Table 5 contains analytical details of the of the emissions to atmosphere in 2010. Continuous monitoring is carried out as per Schedule C1.1 of the licence and the emission limit values are detailed in Schedule B.1 of the licence.
In every case the emissions are well within the licenced requirements.
Waste Management
Table 10 shows a summary of all waste produced on site with comparisons to previous years.
Table 11 shows details of all hazardous waste generated on site and shipped off site for treatment or recycling.
Table 12 shows details of the continued emphasis being placed on recycling.
2010 shows a reduction in quantity of waste produced on 2009.
Water Consumption
Water consumption continues to be reduced year on year due to continued emphasis on the reduction of water usage/ waste (Table 16).
Energy Consumption
The efficient use of energy is emphasised on site. Continued focus on energy management in 2010 has resulted in ongoing improvements (Table 15). Roche Ireland retained registration to IS EN 16001, Energy Management System.
Page 2 of 63
1. Introduction
Roche Ireland Register Number: P0012-04 The Roche Ireland plant, a bulk pharmaceutical facility, is located in the village of Clarecastle, Co. Clare, on a 79 acre site, National Grid Reference E1353-N1738. Roche Ireland is both an ISO 14001:2004 and IS EN 16001 accredited site. Reporting date for the site is 31st March annually. 1.1 Roche Ireland Environmental Policy
Roche Ireland Limited aims to achieve the highest standards of environmental performance in the interests of all our stakeholders, be they employees, owners, neighbours, the public at large or the natural environment itself. We will make every effort to fully comply with the terms of our Integrated Pollution Prevention and Control Licence and with other applicable and relevant environmental legislation. We will adhere to the principles of Responsible Care and will pursue a policy of continuous improvement in the implementation of its associated codes. These codes will be referenced in the register of aspects and the site's objectives and targets. We reiterate our commitment to Pollution Prevention which comprises one of these codes. By preparing and implementing environmental policies, systems and procedures and regularly reviewing them at senior management level, we will administer a continuous improvement programme designed to minimise the impact of our operations on the environment. The company's environmental aspects register will be reviewed on a regular basis and environmental objectives and targets will be set accordingly. Progress against these will be reviewed regularly and results will be shared with management and employees. The environmental implications of introducing new processes and products will be carefully evaluated and cleaner technologies will be utilised where possible. Waste avoidance and waste reduction and minimisation initiatives will be vigorously pursued, in accordance with the best eco-efficiency practices. Materials and energy used in manufacturing and associated activities will be carefully conserved. This will be done by optimising product yield, maximising the recycle of materials where this is feasible and eliminating, leaks, spills and reworks. We will ensure that processes are safe by subjecting them to rigorous hazard analysis and by administering comprehensive training to operating staff. Emergency procedures and equipment will be maintained in readiness to minimise the impact of any accidents that could occur and to safeguard the environment. Emergency crews will continue to be trained in techniques for dealing with incidents. ______________________ Managing Director
Page 3 of 63
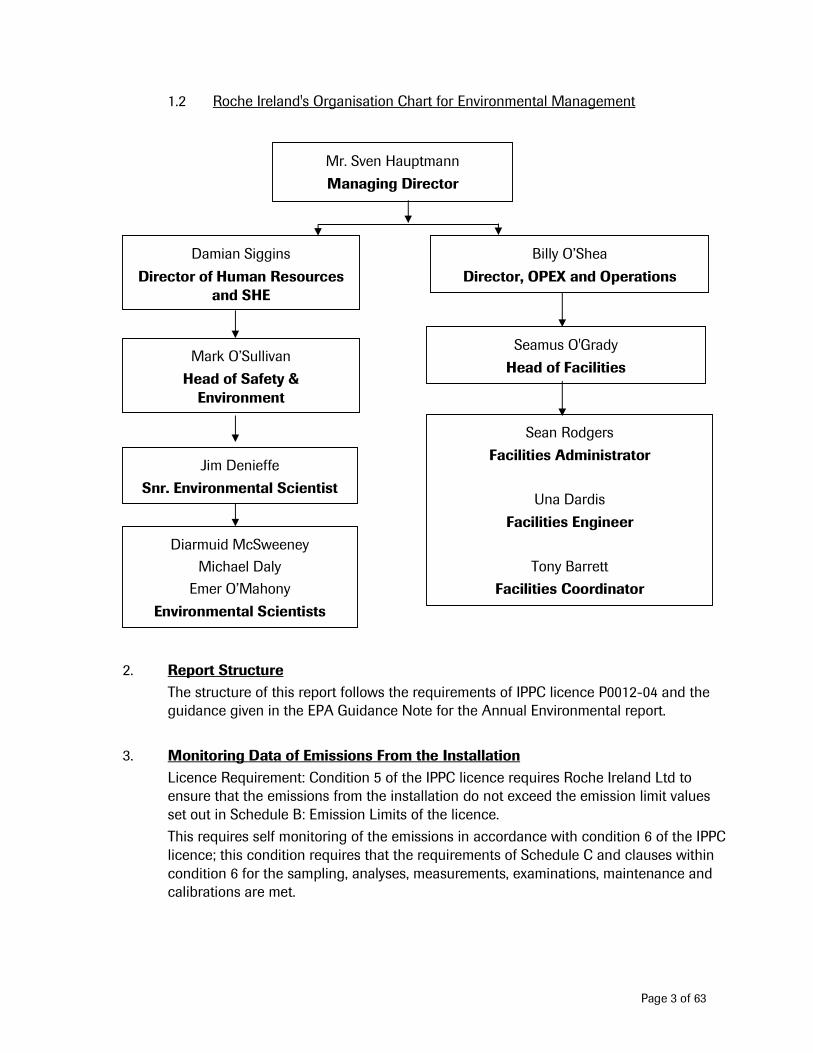
1.2 Roche Ireland's Organisation Chart for Environmental Management
2. Report Structure
The structure of this report follows the requirements of IPPC licence P0012-04 and the guidance given in the EPA Guidance Note for the Annual Environmental report.
3. Monitoring Data of Emissions From the Installation
Licence Requirement: Condition 5 of the IPPC licence requires Roche Ireland Ltd to ensure that the emissions from the installation do not exceed the emission limit values set out in Schedule B: Emission Limits of the licence.
This requires self monitoring of the emissions in accordance with condition 6 of the IPPC licence; this condition requires that the requirements of Schedule C and clauses within condition 6 for the sampling, analyses, measurements, examinations, maintenance and calibrations are met.
Mr. Sven Hauptmann
Managing Director
Damian Siggins
Director of Human Resources and SHE
Billy O’Shea
Director, OPEX and Operations Support
Seamus O'Grady
Head of Facilities
Sean Rodgers
Facilities Administrator
Una Dardis
Facilities Engineer
Tony Barrett
Facilities Coordinator
Jim Denieffe
Snr. Environmental Scientist
Diarmuid McSweeney
Michael Daly
Emer O’Mahony
Environmental Scientists
Mark O’Sullivan
Head of Safety & Environment
Page 4 of 63
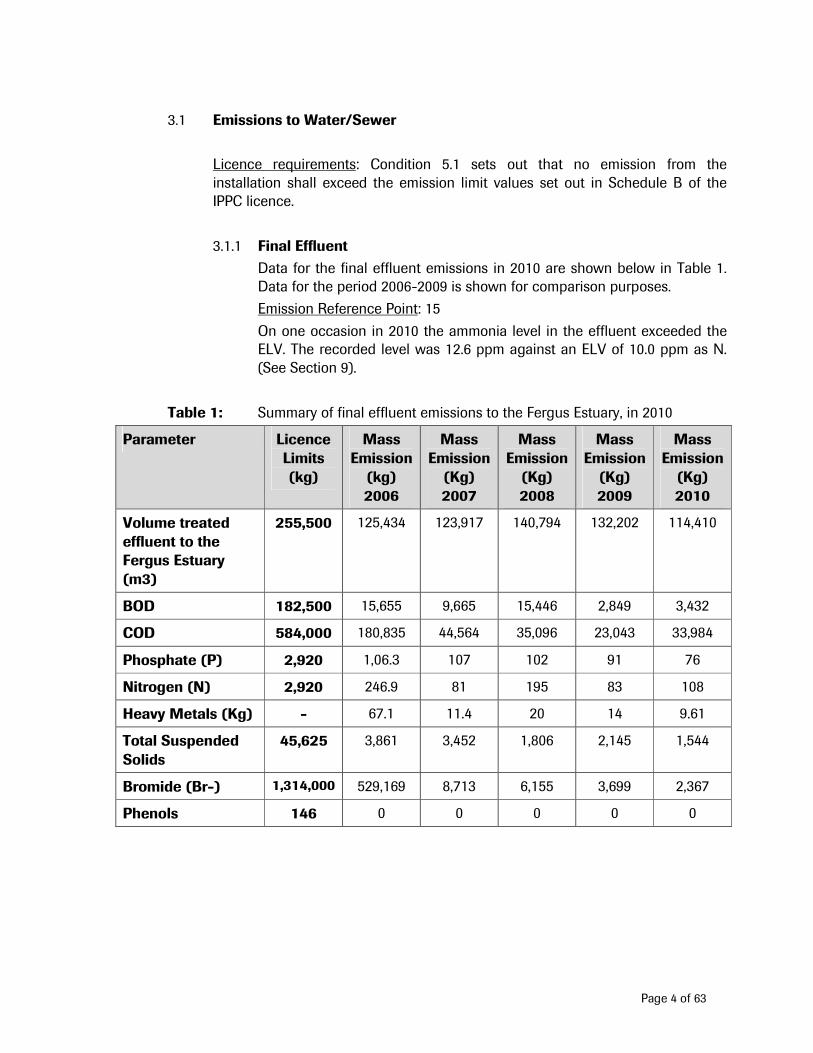
3.1 Emissions to Water/Sewer
Licence requirements: Condition 5.1 sets out that no emission from the installation shall exceed the emission limit values set out in Schedule B of the IPPC licence.
3.1.1 Final Effluent
Data for the final effluent emissions in 2010 are shown below in Table 1. Data for the period 2006-2009 is shown for comparison purposes.
Emission Reference Point: 15
On one occasion in 2010 the ammonia level in the effluent exceeded the ELV. The recorded level was 12.6 ppm against an ELV of 10.0 ppm as N. (See Section 9).
Table 1: Summary of final effluent emissions to the Fergus Estuary, in 2010
Parameter Licence Limits (kg)
Mass Emission
(kg) 2006
Mass Emission (Kg) 2007
Mass Emission (Kg) 2008
Mass Emission (Kg) 2009
Mass Emission (Kg) 2010
Volume treated effluent to the Fergus Estuary (m3)
255,500 125,434 123,917 140,794 132,202 114,410
BOD 182,500 15,655 9,665 15,446 2,849 3,432
COD 584,000 180,835 44,564 35,096 23,043 33,984
Phosphate (P) 2,920 1,06.3 107 102 91 76
Nitrogen (N) 2,920 246.9 81 195 83 108
Heavy Metals (Kg) - 67.1 11.4 20 14 9.61
Total Suspended Solids
45,625 3,861 3,452 1,806 2,145 1,544
Bromide (Br-) 1,314,000 529,169 8,713 6,155 3,699 2,367
Phenols 146 0 0 0 0 0
Page 5 of 63
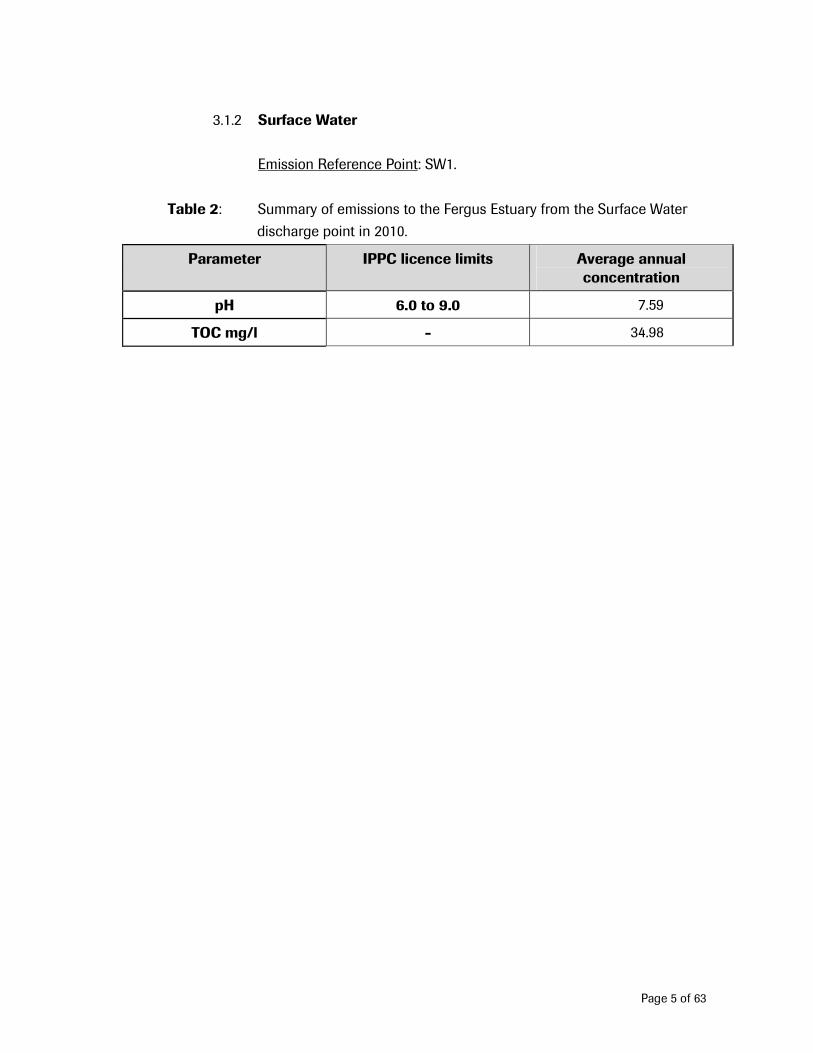
3.1.2 Surface Water
Emission Reference Point: SW1.
Table 2: Summary of emissions to the Fergus Estuary from the Surface Water
discharge point in 2010.
Parameter IPPC licence limits Average annual concentration
pH 6.0 to 9.0 7.59
TOC mg/l - 34.98
Page 6 of 63
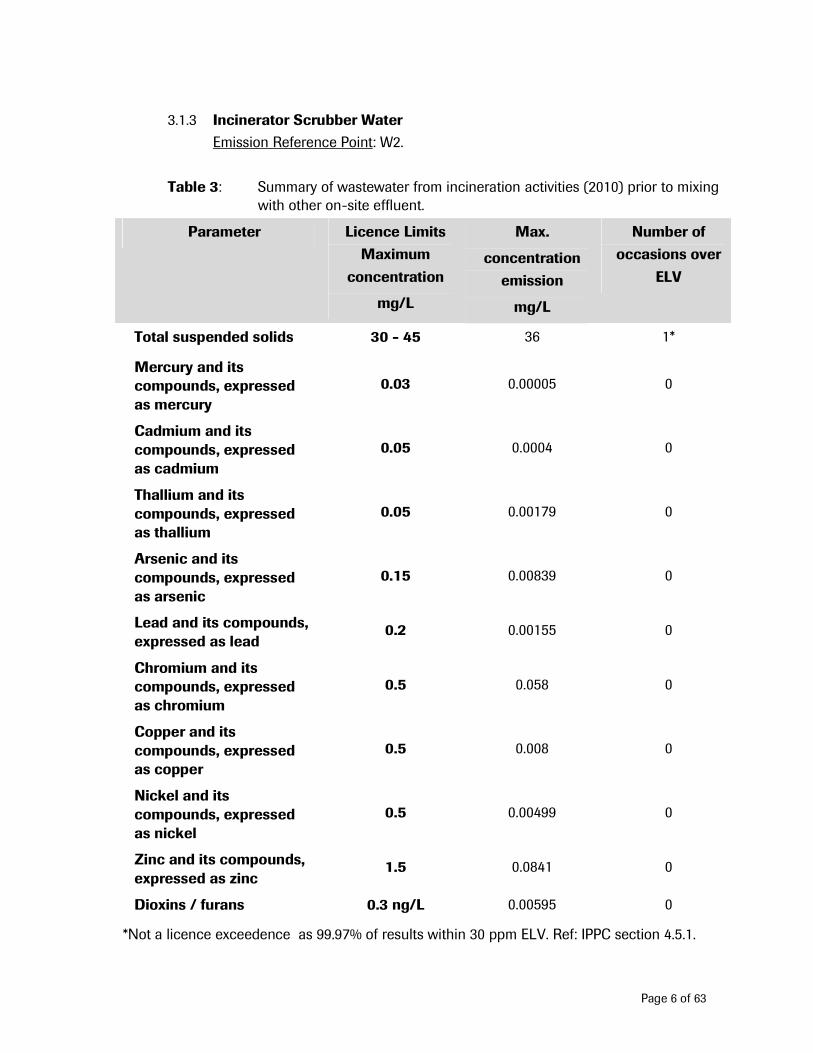
3.1.3 Incinerator Scrubber Water
Emission Reference Point: W2.
Table 3: Summary of wastewater from incineration activities (2010) prior to mixing with other on-site effluent.
Parameter Licence Limits
Maximum
concentration
mg/L
Max.
concentration
emission
mg/L
Number of
occasions over
ELV
Total suspended solids 30 - 45 36 1*
Mercury and its compounds, expressed as mercury
0.03 0.00005 0
Cadmium and its compounds, expressed as cadmium
0.05 0.0004 0
Thallium and its compounds, expressed as thallium
0.05 0.00179 0
Arsenic and its compounds, expressed as arsenic
0.15 0.00839 0
Lead and its compounds, expressed as lead
0.2 0.00155 0
Chromium and its compounds, expressed as chromium
0.5 0.058 0
Copper and its compounds, expressed as copper
0.5 0.008 0
Nickel and its compounds, expressed as nickel
0.5 0.00499 0
Zinc and its compounds, expressed as zinc
1.5 0.0841 0
Dioxins / furans 0.3 ng/L 0.00595 0
*Not a licence exceedence as 99.97% of results within 30 ppm ELV. Ref: IPPC section 4.5.1.
Page 7 of 63
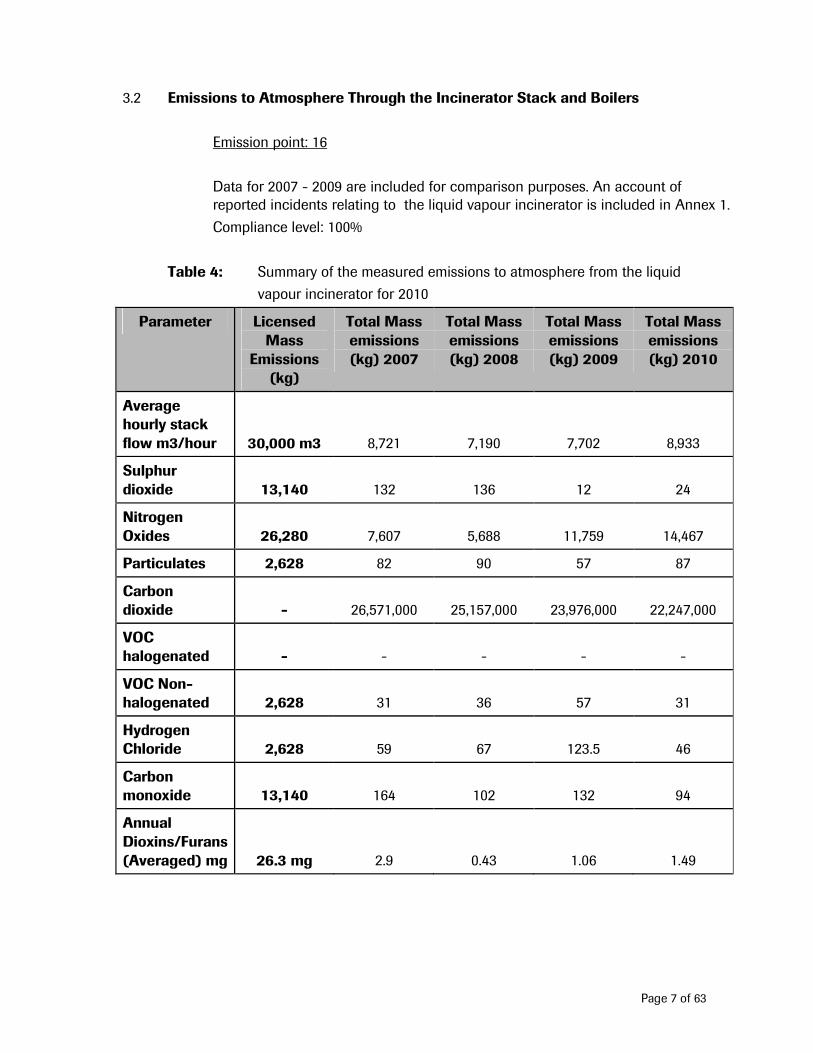
3.2 Emissions to Atmosphere Through the Incinerator Stack and Boilers
Emission point: 16
Data for 2007 - 2009 are included for comparison purposes. An account of reported incidents relating to the liquid vapour incinerator is included in Annex 1.
Compliance level: 100%
Table 4: Summary of the measured emissions to atmosphere from the liquid
vapour incinerator for 2010
Parameter Licensed Mass
Emissions (kg)
Total Mass emissions (kg) 2007
Total Mass emissions (kg) 2008
Total Mass emissions (kg) 2009
Total Mass emissions (kg) 2010
Average hourly stack flow m3/hour 30,000 m3 8,721 7,190 7,702 8,933
Sulphur dioxide 13,140 132 136 12 24
Nitrogen Oxides 26,280 7,607 5,688 11,759 14,467
Particulates 2,628 82 90 57 87
Carbon dioxide - 26,571,000 25,157,000 23,976,000 22,247,000
VOC halogenated - - - - -
VOC Non-halogenated 2,628 31 36 57 31
Hydrogen Chloride 2,628 59 67 123.5 46
Carbon monoxide 13,140 164 102 132 94
Annual Dioxins/Furans (Averaged) mg 26.3 mg 2.9 0.43 1.06 1.49
Page 8 of 63
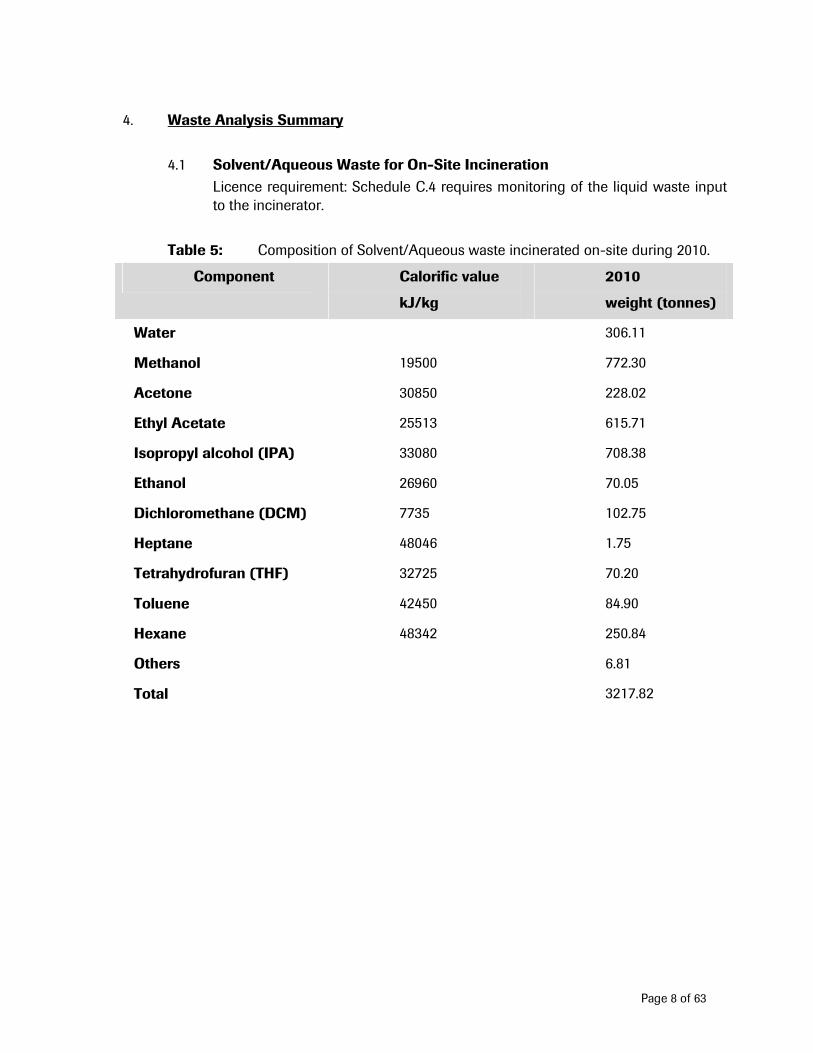
4. Waste Analysis Summary
4.1 Solvent/Aqueous Waste for On-Site Incineration
Licence requirement: Schedule C.4 requires monitoring of the liquid waste input to the incinerator.
Table 5: Composition of Solvent/Aqueous waste incinerated on-site during 2010.
Component Calorific value
kJ/kg
2010
weight (tonnes)
Water 306.11
Methanol 19500 772.30
Acetone 30850 228.02
Ethyl Acetate 25513 615.71
Isopropyl alcohol (IPA) 33080 708.38
Ethanol 26960 70.05
Dichloromethane (DCM) 7735 102.75
Heptane 48046 1.75
Tetrahydrofuran (THF) 32725 70.20
Toluene 42450 84.90
Hexane 48342 250.84
Others 6.81
Total 3217.82
Page 9 of 63
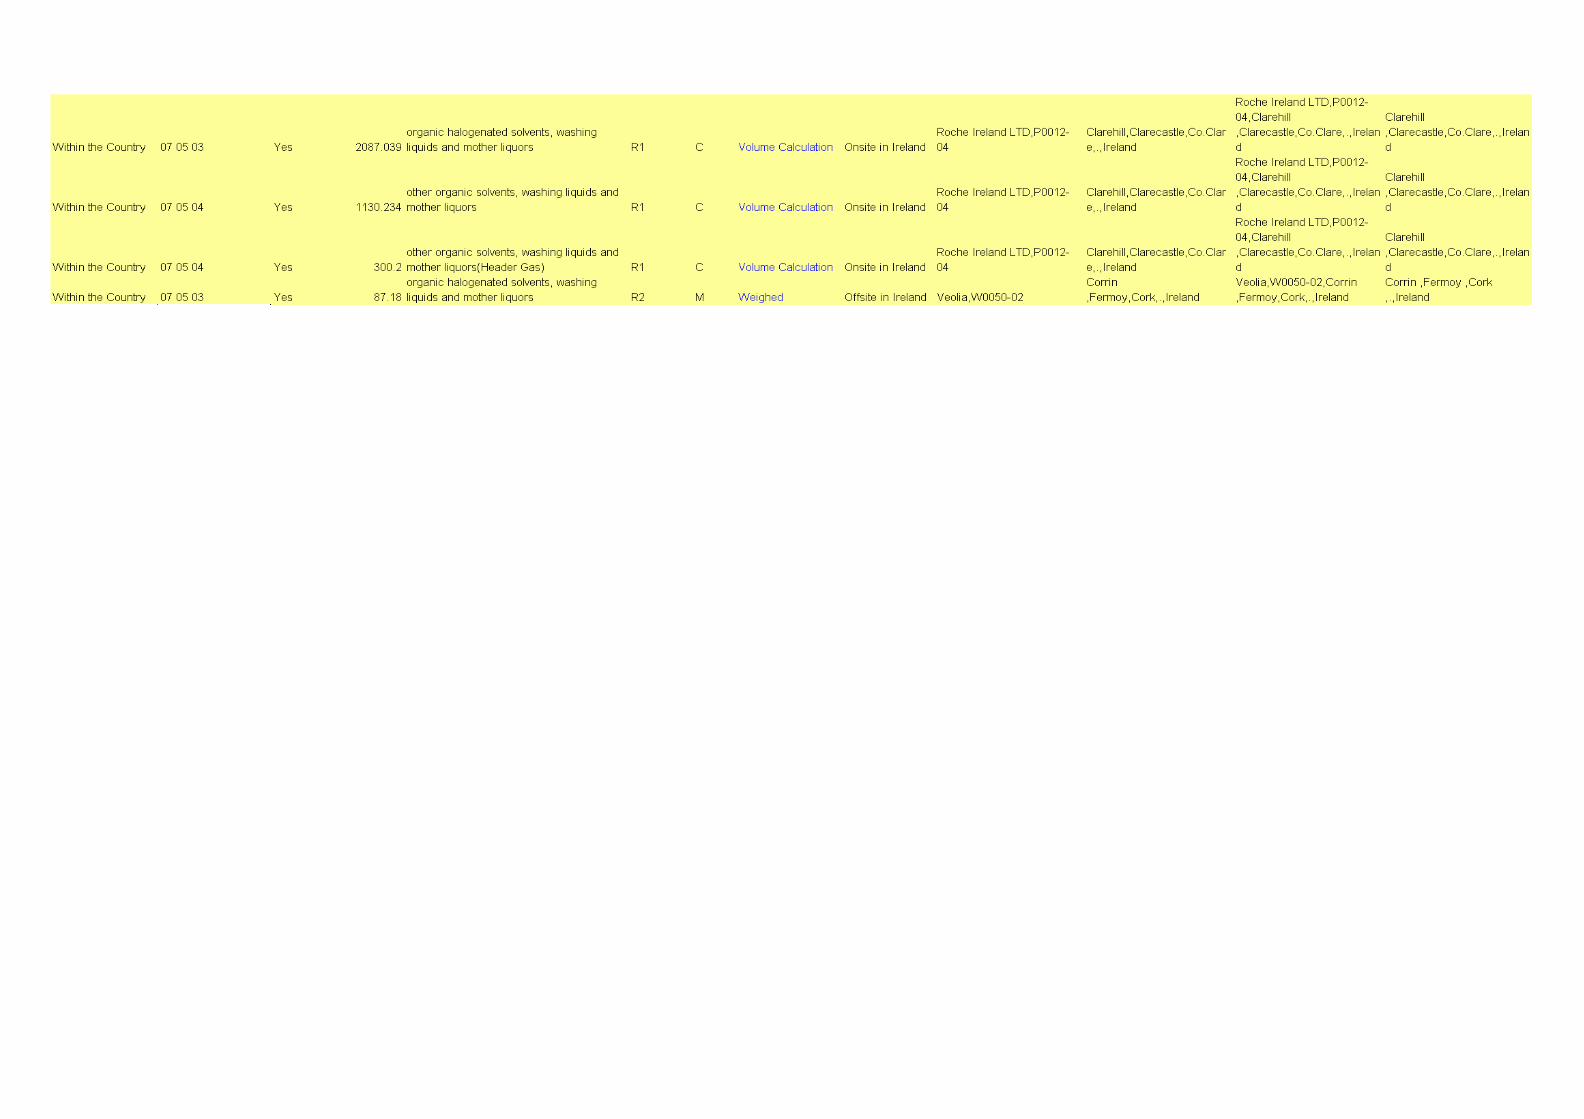
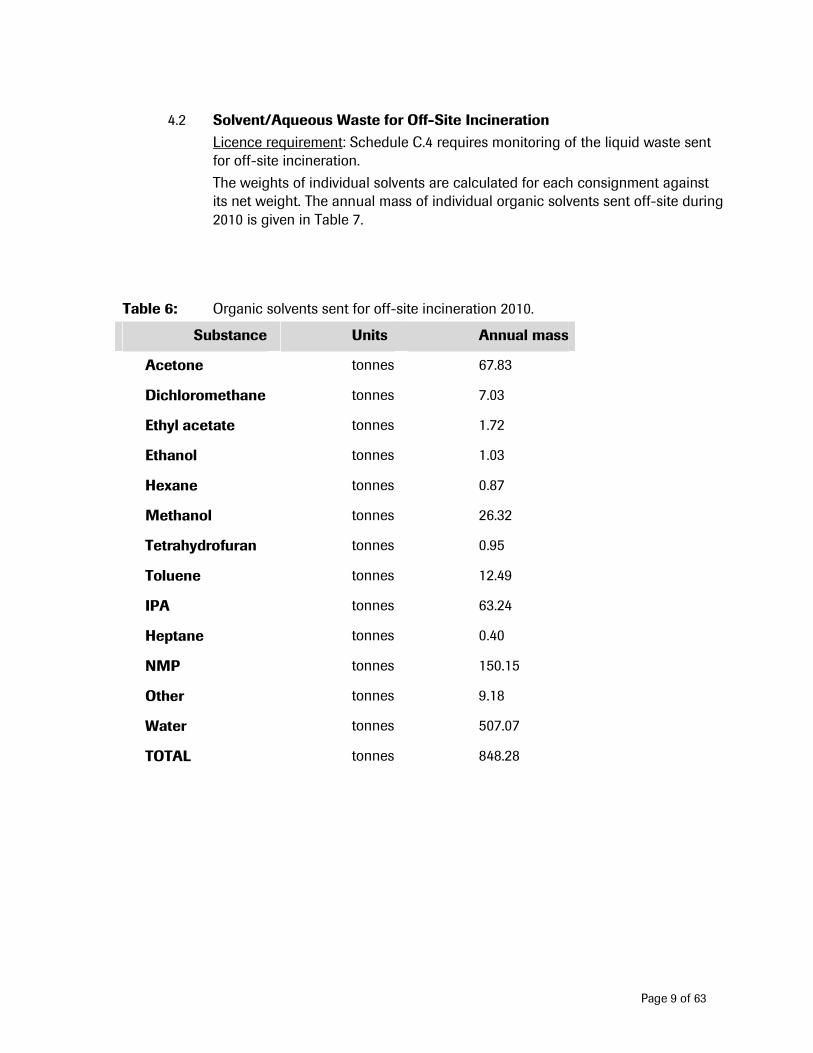
4.2 Solvent/Aqueous Waste for Off-Site Incineration
Licence requirement: Schedule C.4 requires monitoring of the liquid waste sent for off-site incineration.
The weights of individual solvents are calculated for each consignment against its net weight. The annual mass of individual organic solvents sent off-site during 2010 is given in Table 7.
Table 6: Organic solvents sent for off-site incineration 2010.
Substance Units Annual mass
Acetone tonnes 67.83
Dichloromethane tonnes 7.03
Ethyl acetate tonnes 1.72
Ethanol tonnes 1.03
Hexane tonnes 0.87
Methanol tonnes 26.32
Tetrahydrofuran tonnes 0.95
Toluene tonnes 12.49
IPA tonnes 63.24
Heptane tonnes 0.40
NMP tonnes 150.15
Other tonnes 9.18
Water tonnes 507.07
TOTAL tonnes 848.28
Page 10 of 63
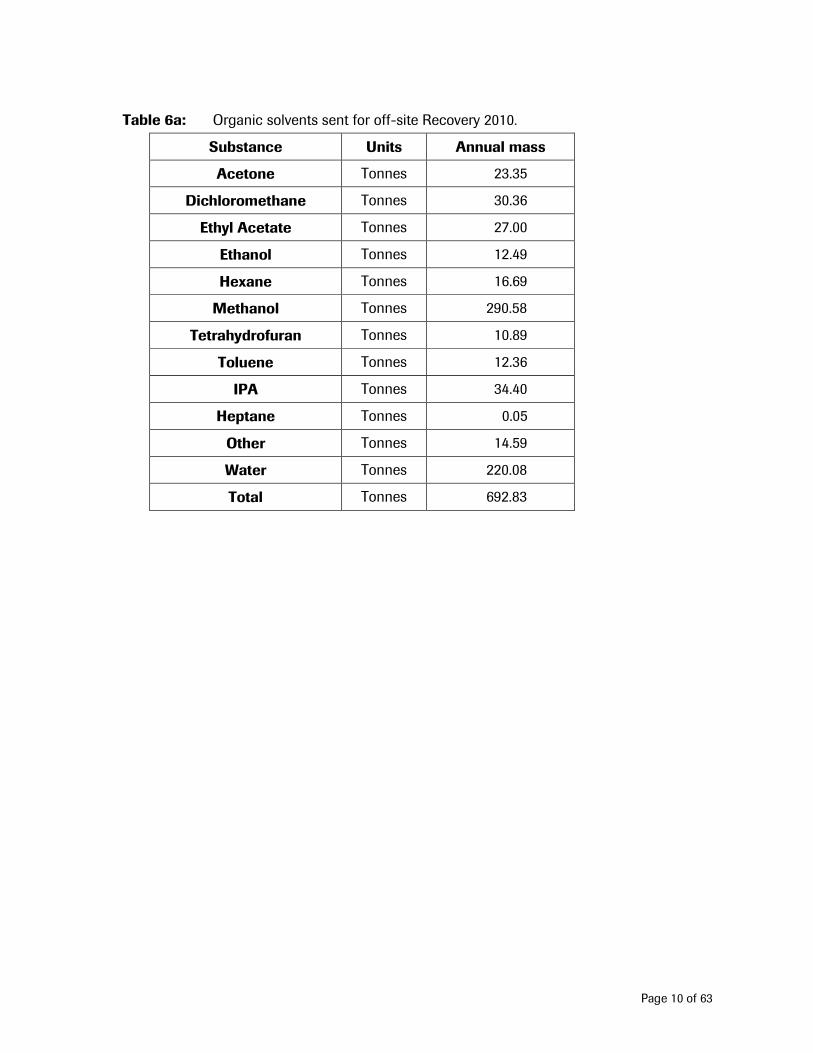
Table 6a: Organic solvents sent for off-site Recovery 2010.
Substance Units Annual mass
Acetone Tonnes 23.35
Dichloromethane Tonnes 30.36
Ethyl Acetate Tonnes 27.00
Ethanol Tonnes 12.49
Hexane Tonnes 16.69
Methanol Tonnes 290.58
Tetrahydrofuran Tonnes 10.89
Toluene Tonnes 12.36
IPA Tonnes 34.40
Heptane Tonnes 0.05
Other Tonnes 14.59
Water Tonnes 220.08
Total Tonnes 692.83
Page 11 of 63
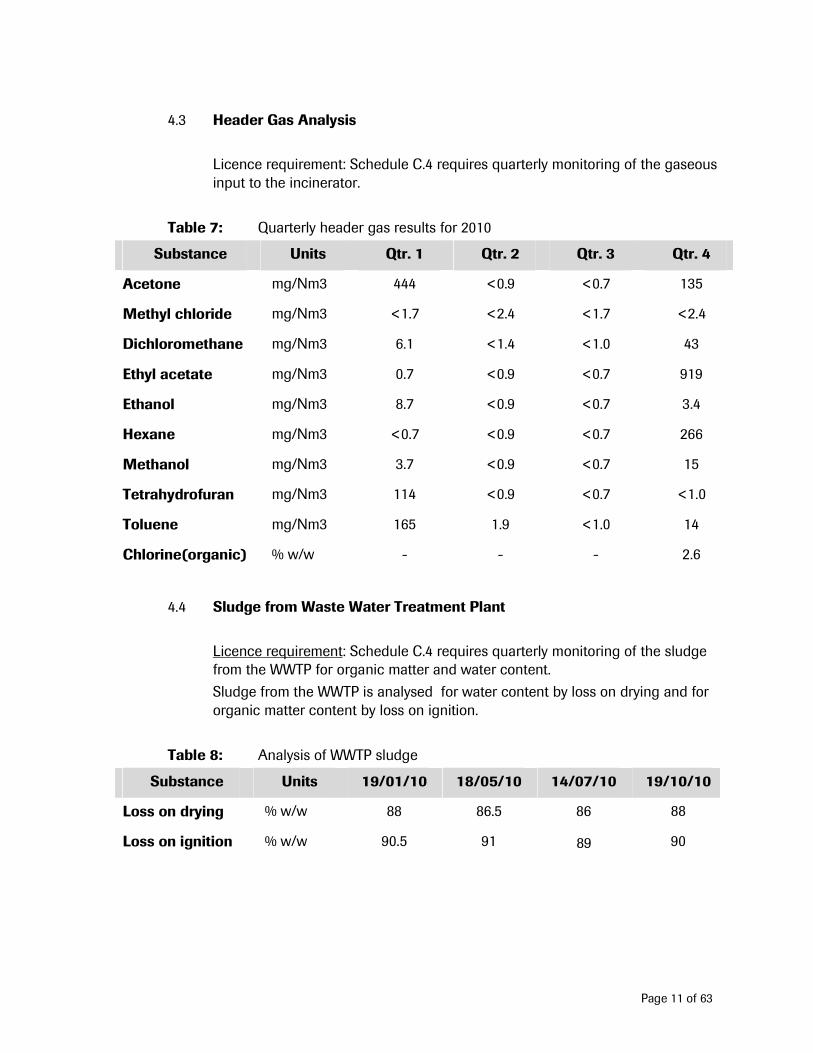
4.3 Header Gas Analysis
Licence requirement: Schedule C.4 requires quarterly monitoring of the gaseous input to the incinerator.
Table 7: Quarterly header gas results for 2010
Substance Units Qtr. 1 Qtr. 2 Qtr. 3 Qtr. 4
Acetone mg/Nm3 444 <0.9 <0.7 135
Methyl chloride mg/Nm3 <1.7 <2.4 <1.7 <2.4
Dichloromethane mg/Nm3 6.1 <1.4 <1.0 43
Ethyl acetate mg/Nm3 0.7 <0.9 <0.7 919
Ethanol mg/Nm3 8.7 <0.9 <0.7 3.4
Hexane mg/Nm3 <0.7 <0.9 <0.7 266
Methanol mg/Nm3 3.7 <0.9 <0.7 15
Tetrahydrofuran mg/Nm3 114 <0.9 <0.7 <1.0
Toluene mg/Nm3 165 1.9 <1.0 14
Chlorine(organic) % w/w - - - 2.6
4.4 Sludge from Waste Water Treatment Plant
Licence requirement: Schedule C.4 requires quarterly monitoring of the sludge from the WWTP for organic matter and water content.
Sludge from the WWTP is analysed for water content by loss on drying and for organic matter content by loss on ignition.
Table 8: Analysis of WWTP sludge
Substance Units 19/01/10 18/05/10 14/07/10 19/10/10
Loss on drying % w/w 88 86.5 86 88
Loss on ignition % w/w 90.5 91 89 90

Page 12 of 63
5. Waste Management Report – Summary
Table 9: Waste Summary for the period 2006-2010
Waste 2006 (tonnes)
2007 (tonnes)
2008 (tonnes)
2009 (tonnes)
2010 (tonnes)
Total waste produced 28,936.52 8,898.97 5353 5672 5632.34
Total waste disposed of on-site 54.28 0 0 0 0
Total waste disposed of off-site 4,912.54 4,049.09 3501.07 2907 3031.18
Total waste recovered on site 23,164.63 4,356.57 989 1557 1658
Total waste recovered off-site 805.07 493.31 862.93 1208 943.16
Quantity of non-hazardous waste produced
2,428.2 1383 1032.225 2284 2231.91
Non hazardous waste disposed of on-site
54.28 0 0 0 0
Non-hazardous waste disposed of off-site
2,079 997 609.07 1946 1956.04
Non-hazardous waste recovered on-site
0 0 0 0 0
Non-hazardous waste recovered off-site
295 386 423.155 338 275.87
Quantity of hazardous waste produced
26,508.32 7,515.97 4320.775 3388 3400.43
Hazardous waste disposed of on-site
0 0 0 0 0
Hazardous waste disposed of off site
2,834.01 3,052.09 2892 961 1075.14
Hazardous waste recovered on-site
23,164.63 4,356.57 989 1557 1658
Hazardous waste recovered off-site
509.68 107.31 439.775 870 667.29
Page 13 of 63
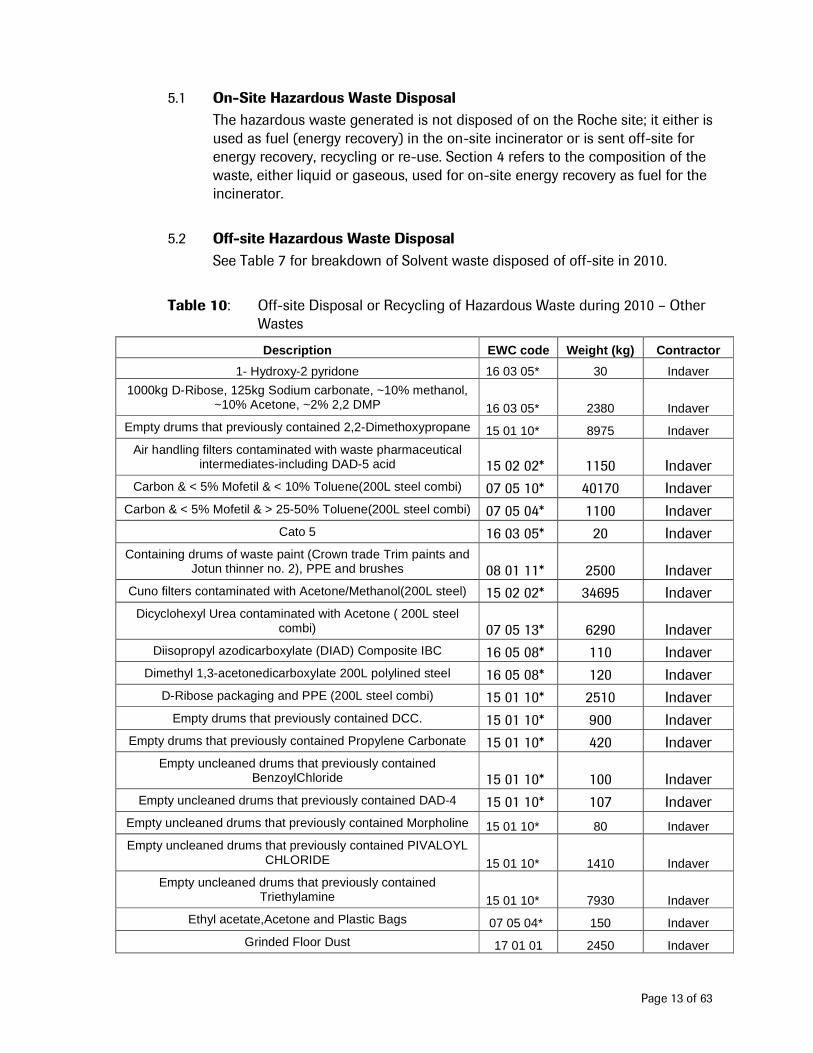
5.1 On-Site Hazardous Waste Disposal
The hazardous waste generated is not disposed of on the Roche site; it either is used as fuel (energy recovery) in the on-site incinerator or is sent off-site for energy recovery, recycling or re-use. Section 4 refers to the composition of the waste, either liquid or gaseous, used for on-site energy recovery as fuel for the incinerator.
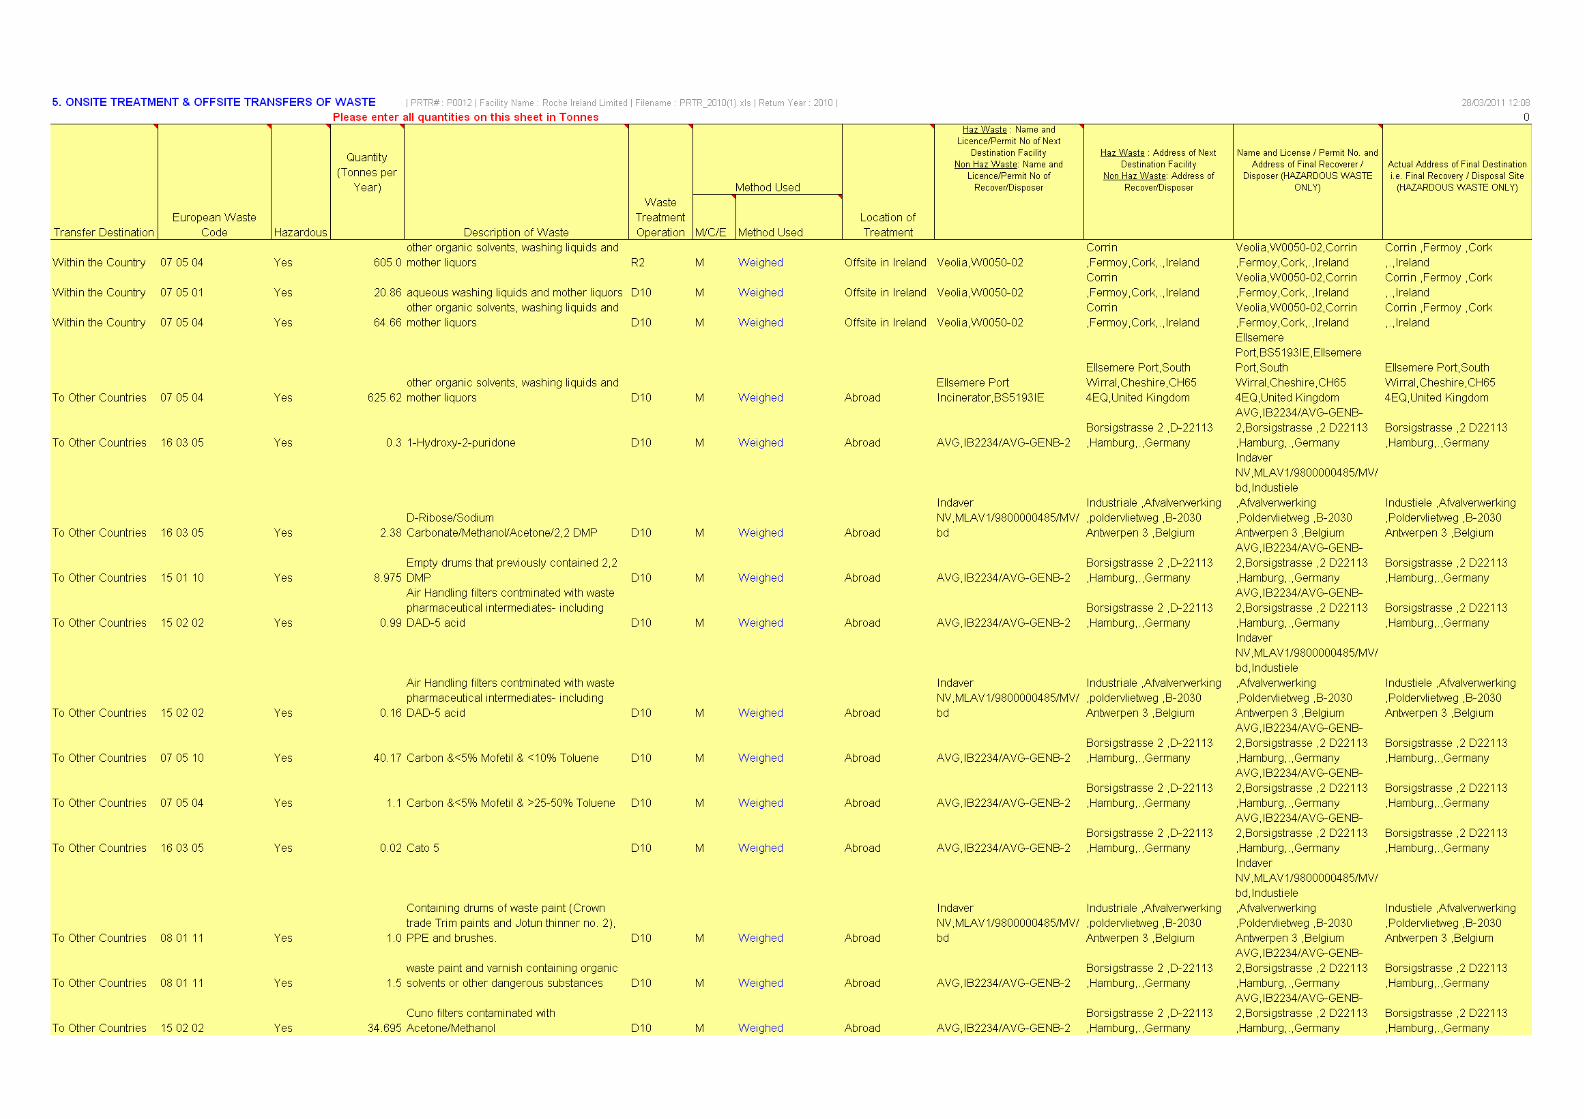
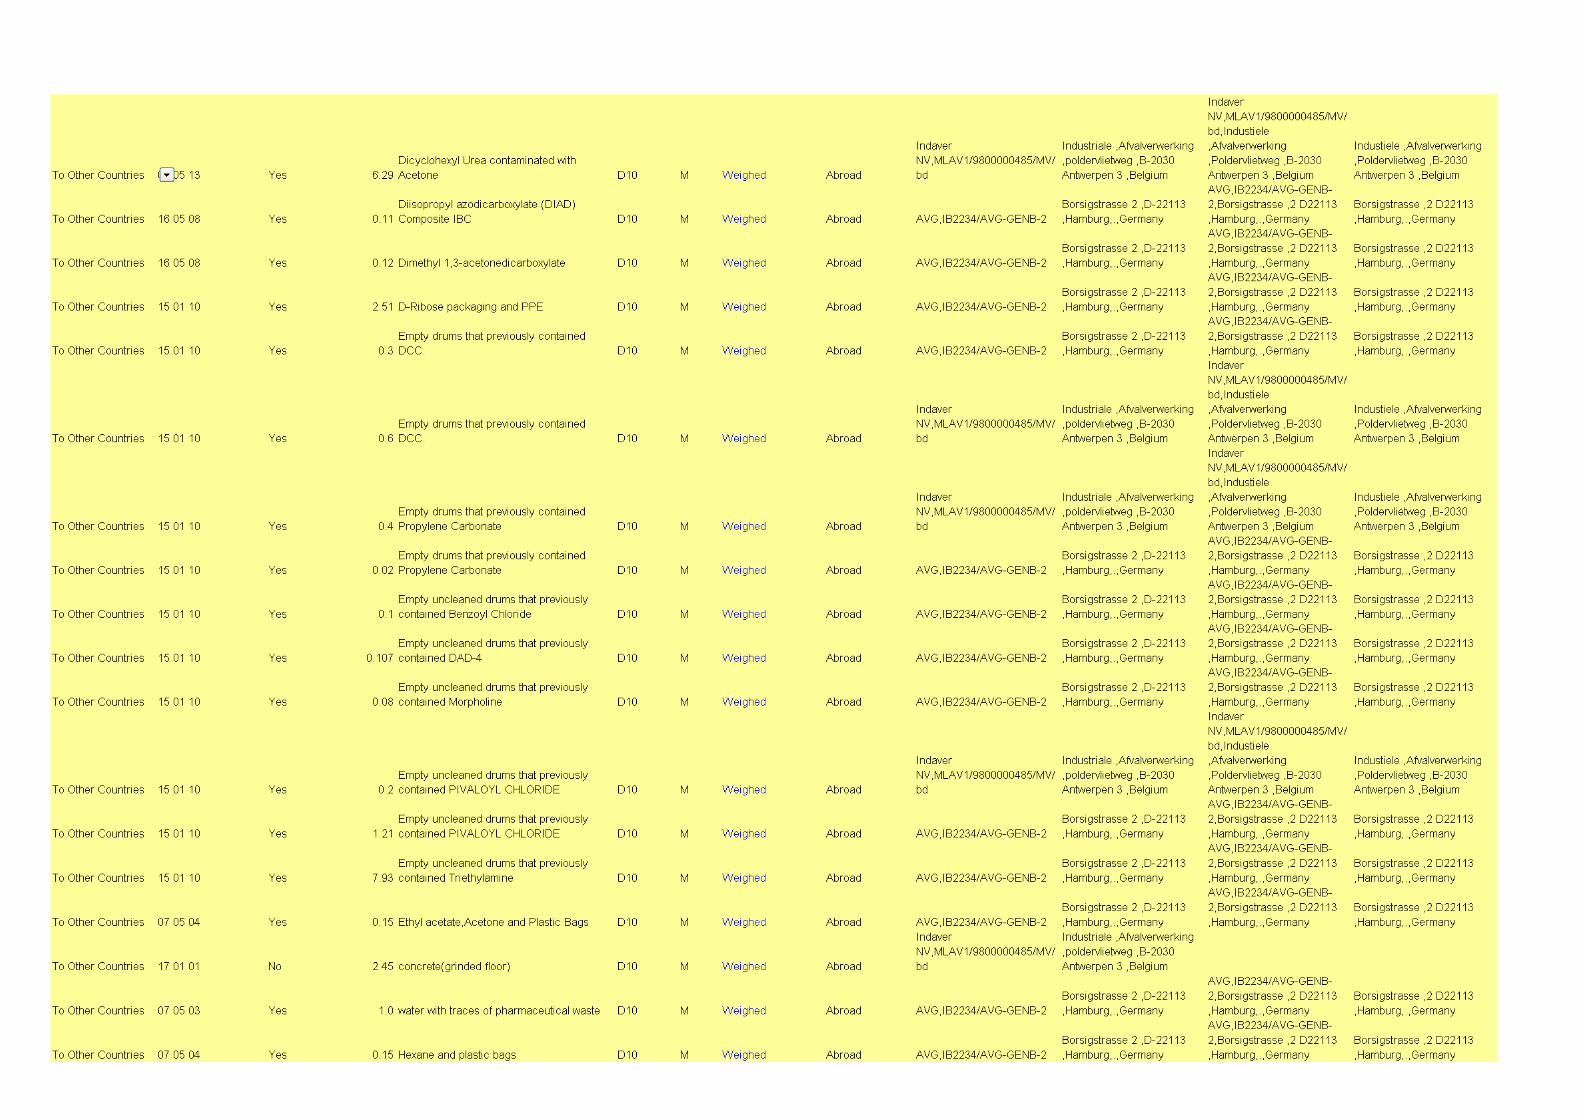
5.2 Off-site Hazardous Waste Disposal
See Table 7 for breakdown of Solvent waste disposed of off-site in 2010.
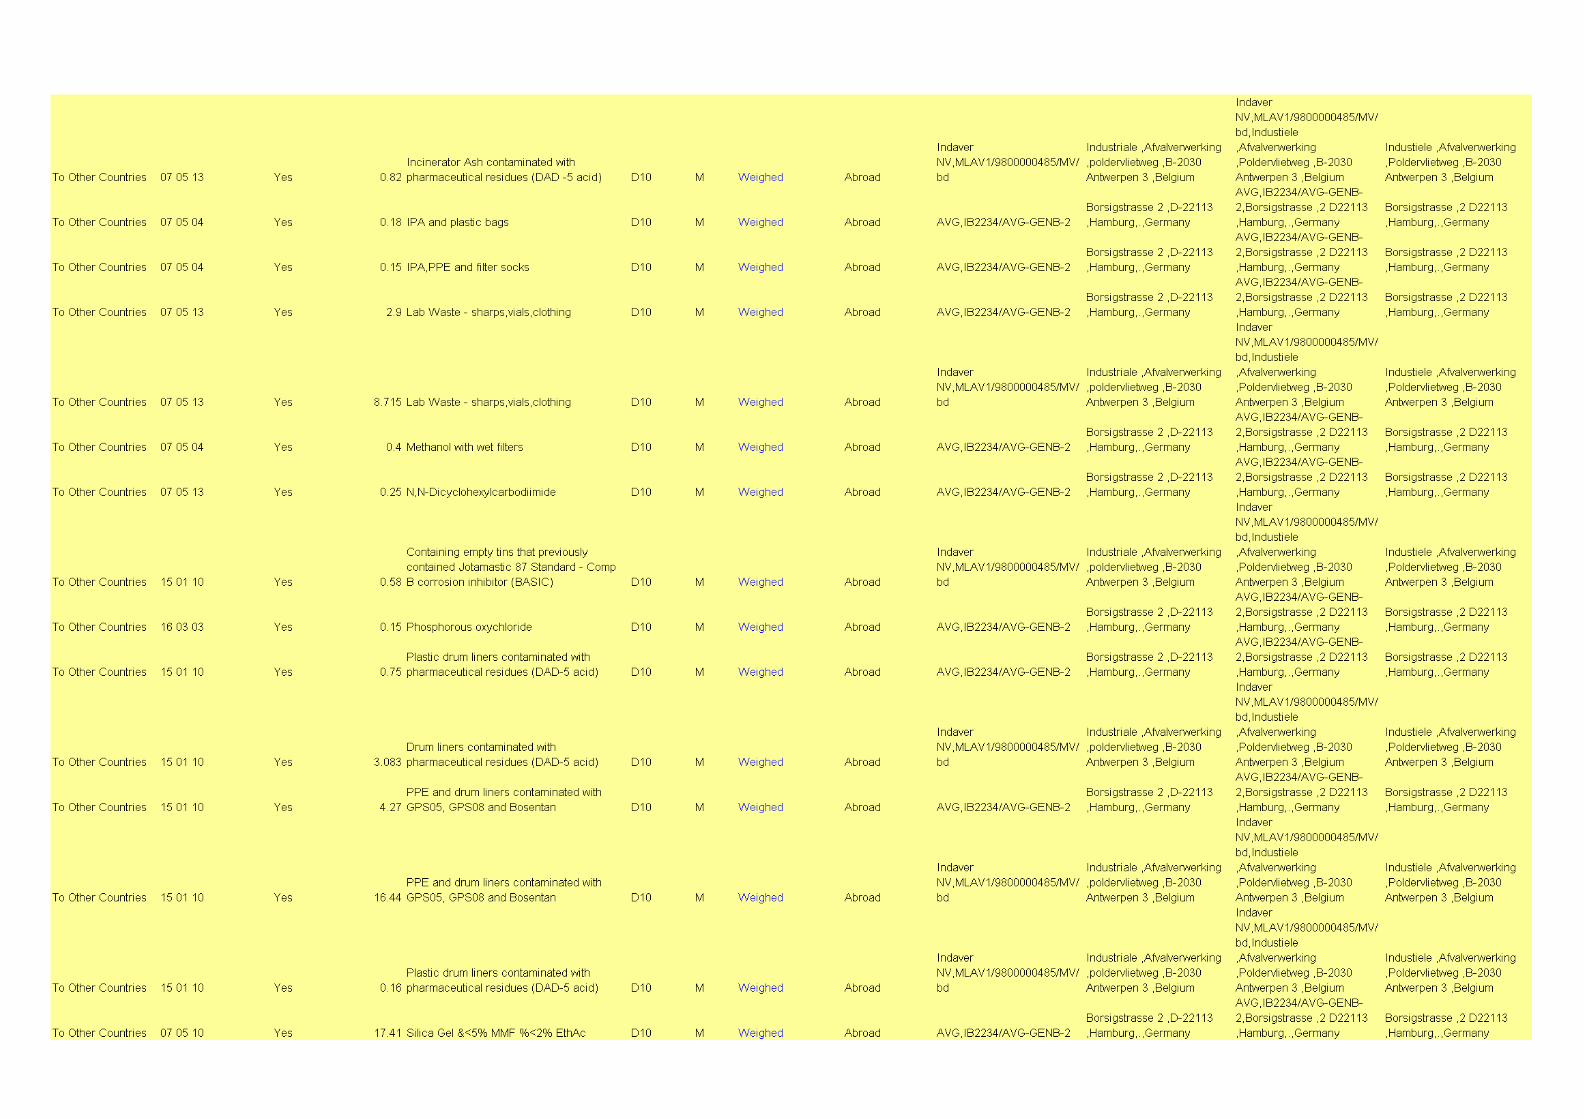
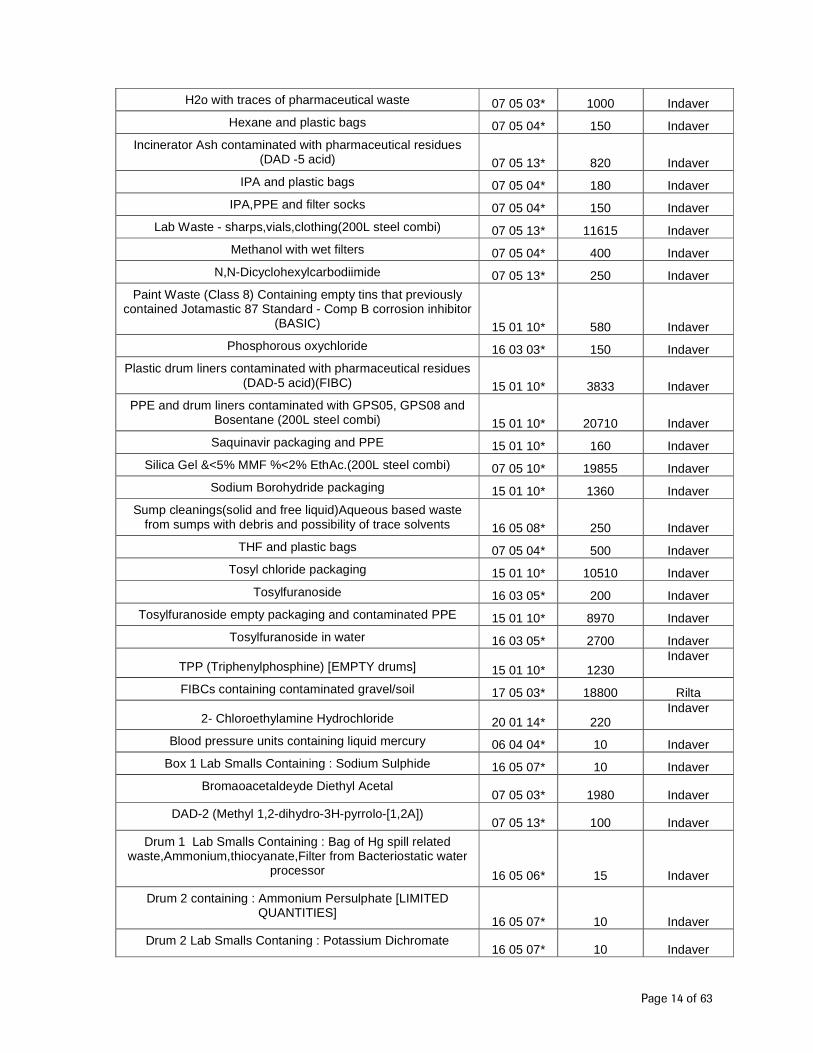
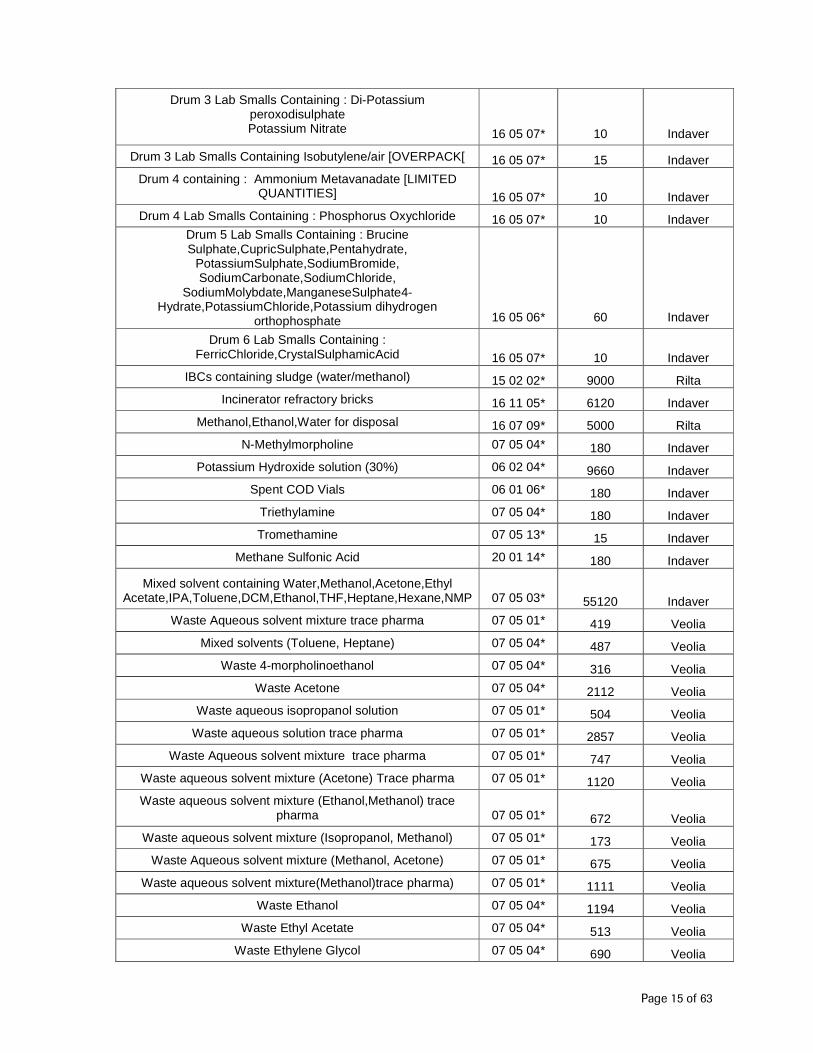
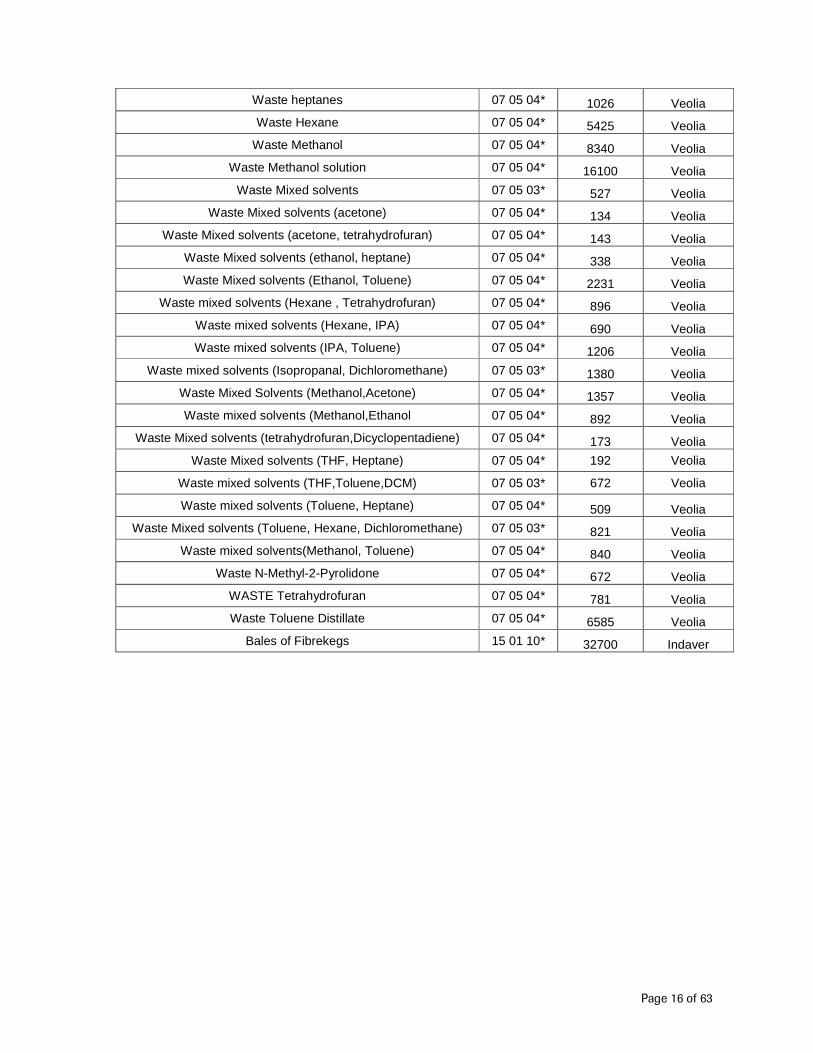
Table 10: Off-site Disposal or Recycling of Hazardous Waste during 2010 – Other Wastes
Description EWC code Weight (kg) Contractor
1- Hydroxy-2 pyridone 16 03 05* 30 Indaver
1000kg D-Ribose, 125kg Sodium carbonate, ~10% methanol, ~10% Acetone, ~2% 2,2 DMP 16 03 05* 2380 Indaver
Empty drums that previously contained 2,2-Dimethoxypropane 15 01 10* 8975 Indaver
Air handling filters contaminated with waste pharmaceutical intermediates-including DAD-5 acid 15 02 02* 1150 Indaver
Carbon & < 5% Mofetil & < 10% Toluene(200L steel combi) 07 05 10* 40170 Indaver Carbon & < 5% Mofetil & > 25-50% Toluene(200L steel combi) 07 05 04* 1100 Indaver
Cato 5 16 03 05* 20 Indaver Containing drums of waste paint (Crown trade Trim paints and
Jotun thinner no. 2), PPE and brushes 08 01 11* 2500 Indaver Cuno filters contaminated with Acetone/Methanol(200L steel) 15 02 02* 34695 Indaver
Dicyclohexyl Urea contaminated with Acetone ( 200L steel combi) 07 05 13* 6290 Indaver
Diisopropyl azodicarboxylate (DIAD) Composite IBC 16 05 08* 110 Indaver Dimethyl 1,3-acetonedicarboxylate 200L polylined steel 16 05 08* 120 Indaver
D-Ribose packaging and PPE (200L steel combi) 15 01 10* 2510 Indaver Empty drums that previously contained DCC. 15 01 10* 900 Indaver
Empty drums that previously contained Propylene Carbonate 15 01 10* 420 Indaver Empty uncleaned drums that previously contained
BenzoylChloride 15 01 10* 100 Indaver Empty uncleaned drums that previously contained DAD-4 15 01 10* 107 Indaver
Empty uncleaned drums that previously contained Morpholine 15 01 10* 80 Indaver
Empty uncleaned drums that previously contained PIVALOYL CHLORIDE 15 01 10* 1410 Indaver
Empty uncleaned drums that previously contained Triethylamine 15 01 10* 7930 Indaver
Ethyl acetate,Acetone and Plastic Bags 07 05 04* 150 Indaver
Grinded Floor Dust 17 01 01 2450 Indaver
Page 14 of 63
H2o with traces of pharmaceutical waste 07 05 03* 1000 Indaver
Hexane and plastic bags 07 05 04* 150 Indaver
Incinerator Ash contaminated with pharmaceutical residues (DAD -5 acid) 07 05 13* 820 Indaver
IPA and plastic bags 07 05 04* 180 Indaver
IPA,PPE and filter socks 07 05 04* 150 Indaver
Lab Waste - sharps,vials,clothing(200L steel combi) 07 05 13* 11615 Indaver
Methanol with wet filters 07 05 04* 400 Indaver
N,N-Dicyclohexylcarbodiimide 07 05 13* 250 Indaver
Paint Waste (Class 8) Containing empty tins that previously contained Jotamastic 87 Standard - Comp B corrosion inhibitor
(BASIC) 15 01 10* 580 Indaver
Phosphorous oxychloride 16 03 03* 150 Indaver
Plastic drum liners contaminated with pharmaceutical residues (DAD-5 acid)(FIBC) 15 01 10* 3833 Indaver
PPE and drum liners contaminated with GPS05, GPS08 and Bosentane (200L steel combi) 15 01 10* 20710 Indaver
Saquinavir packaging and PPE 15 01 10* 160 Indaver
Silica Gel &<5% MMF %<2% EthAc.(200L steel combi) 07 05 10* 19855 Indaver
Sodium Borohydride packaging 15 01 10* 1360 Indaver
Sump cleanings(solid and free liquid)Aqueous based waste from sumps with debris and possibility of trace solvents 16 05 08* 250 Indaver
THF and plastic bags 07 05 04* 500 Indaver
Tosyl chloride packaging 15 01 10* 10510 Indaver
Tosylfuranoside 16 03 05* 200 Indaver
Tosylfuranoside empty packaging and contaminated PPE 15 01 10* 8970 Indaver
Tosylfuranoside in water 16 03 05* 2700 Indaver
TPP (Triphenylphosphine) [EMPTY drums] 15 01 10* 1230 Indaver
FIBCs containing contaminated gravel/soil 17 05 03* 18800 Rilta
2- Chloroethylamine Hydrochloride 20 01 14* 220 Indaver
Blood pressure units containing liquid mercury 06 04 04* 10 Indaver
Box 1 Lab Smalls Containing : Sodium Sulphide 16 05 07* 10 Indaver
Bromaoacetaldeyde Diethyl Acetal 07 05 03* 1980 Indaver
DAD-2 (Methyl 1,2-dihydro-3H-pyrrolo-[1,2A]) 07 05 13* 100 Indaver
Drum 1 Lab Smalls Containing : Bag of Hg spill related waste,Ammonium,thiocyanate,Filter from Bacteriostatic water
processor 16 05 06* 15 Indaver
Drum 2 containing : Ammonium Persulphate [LIMITED QUANTITIES]
16 05 07* 10 Indaver
Drum 2 Lab Smalls Contaning : Potassium Dichromate 16 05 07* 10 Indaver
Page 15 of 63
Drum 3 Lab Smalls Containing : Di-Potassium peroxodisulphate Potassium Nitrate 16 05 07* 10 Indaver
Drum 3 Lab Smalls Containing Isobutylene/air [OVERPACK[ 16 05 07* 15 Indaver
Drum 4 containing : Ammonium Metavanadate [LIMITED QUANTITIES] 16 05 07* 10 Indaver
Drum 4 Lab Smalls Containing : Phosphorus Oxychloride 16 05 07* 10 Indaver Drum 5 Lab Smalls Containing : Brucine Sulphate,CupricSulphate,Pentahydrate,
PotassiumSulphate,SodiumBromide, SodiumCarbonate,SodiumChloride,
SodiumMolybdate,ManganeseSulphate4-Hydrate,PotassiumChloride,Potassium dihydrogen
orthophosphate 16 05 06* 60 Indaver
Drum 6 Lab Smalls Containing : FerricChloride,CrystalSulphamicAcid 16 05 07* 10 Indaver
IBCs containing sludge (water/methanol) 15 02 02* 9000 Rilta
Incinerator refractory bricks 16 11 05* 6120 Indaver
Methanol,Ethanol,Water for disposal 16 07 09* 5000 Rilta
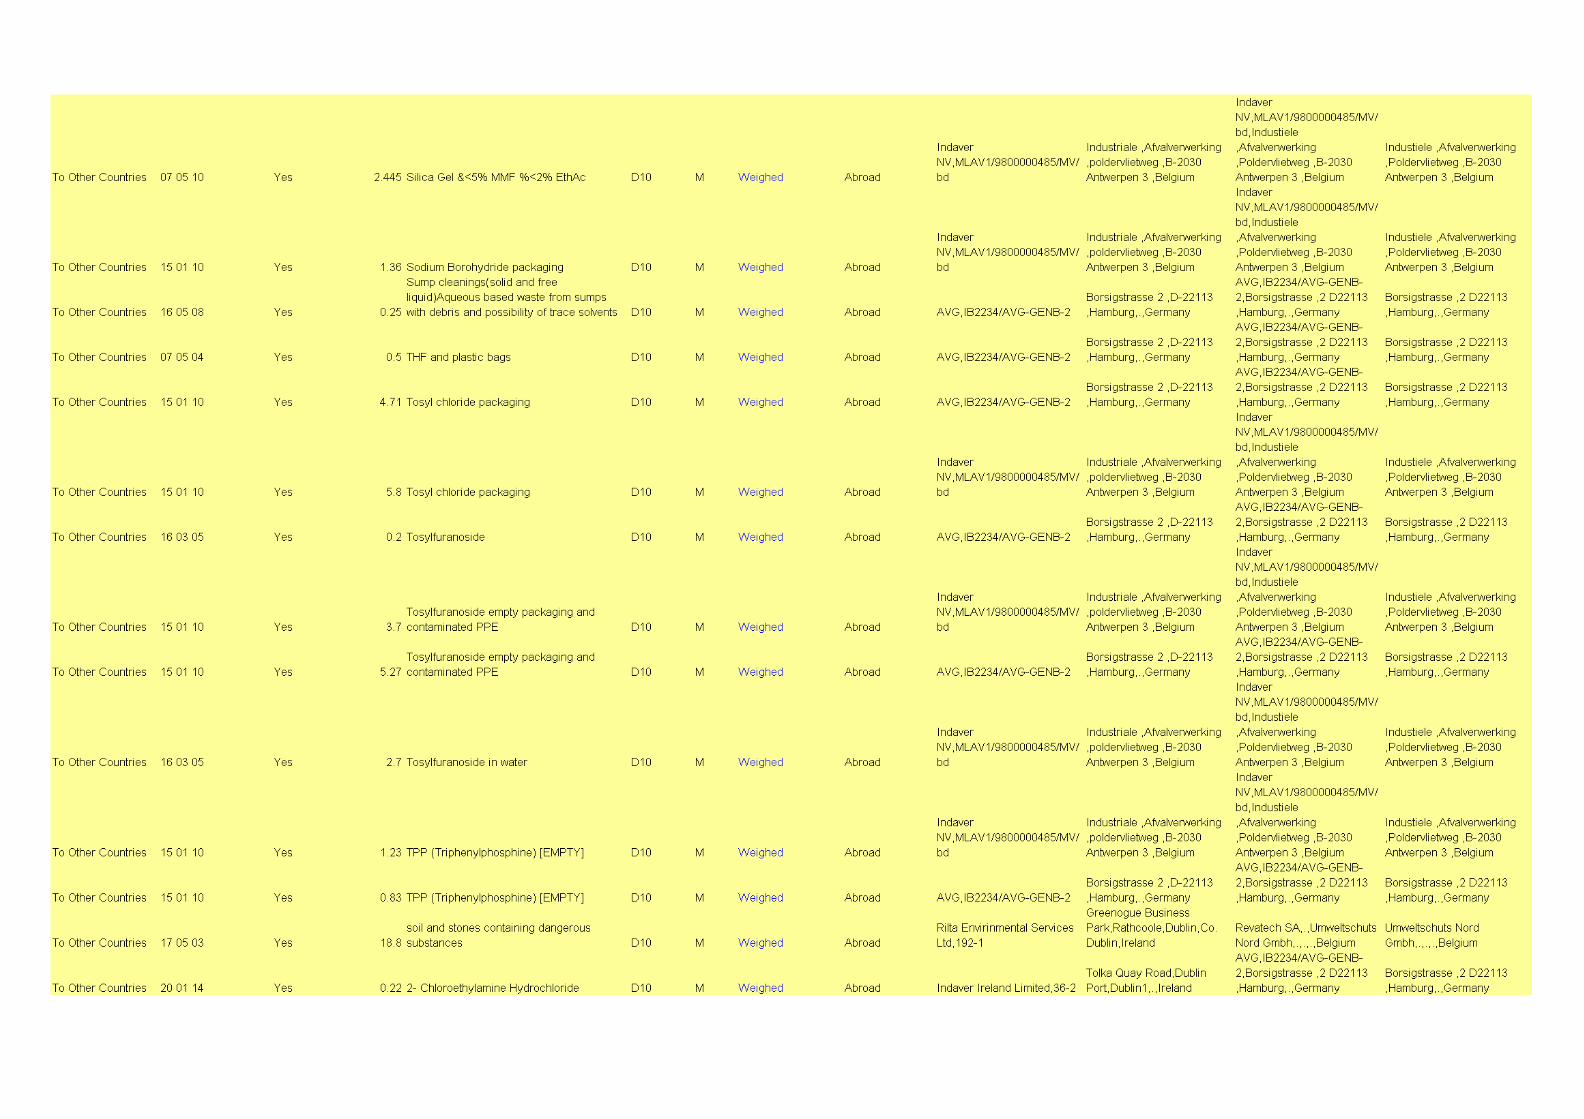
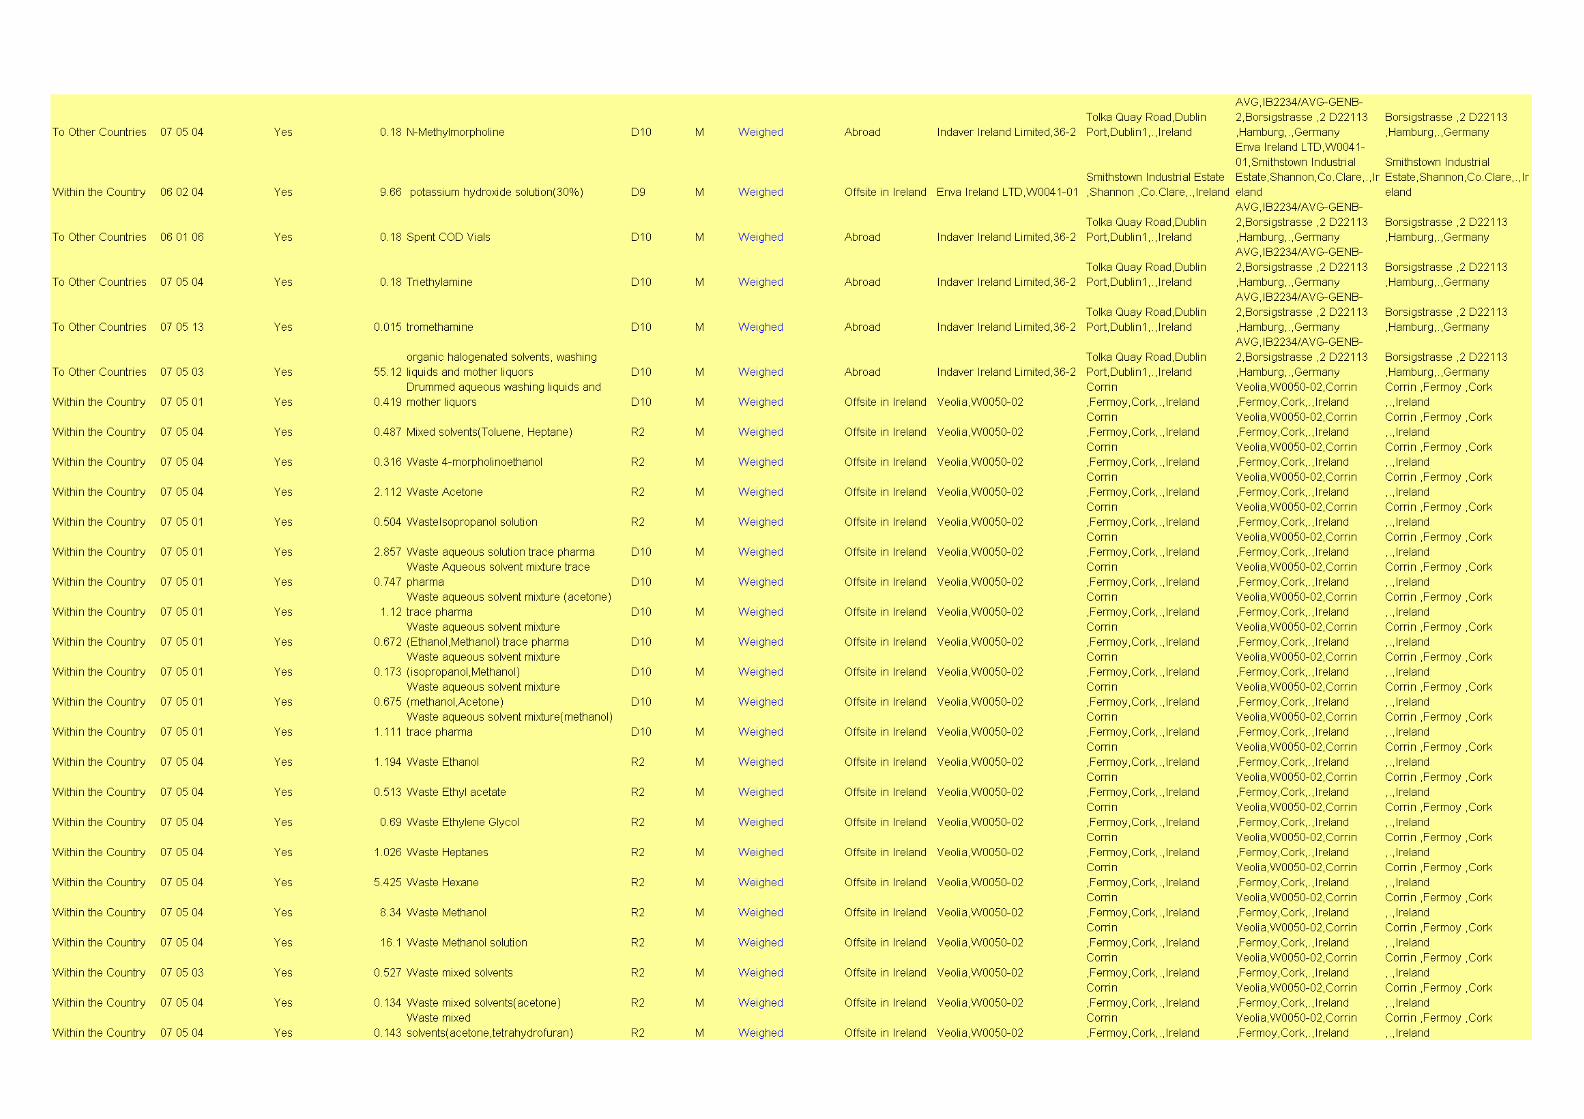
N-Methylmorpholine 07 05 04* 180 Indaver
Potassium Hydroxide solution (30%) 06 02 04* 9660 Indaver
Spent COD Vials 06 01 06* 180 Indaver
Triethylamine 07 05 04* 180 Indaver
Tromethamine 07 05 13* 15 Indaver
Methane Sulfonic Acid 20 01 14* 180 Indaver
Mixed solvent containing Water,Methanol,Acetone,Ethyl Acetate,IPA,Toluene,DCM,Ethanol,THF,Heptane,Hexane,NMP
07 05 03* 55120 Indaver
Waste Aqueous solvent mixture trace pharma 07 05 01* 419 Veolia
Mixed solvents (Toluene, Heptane) 07 05 04* 487 Veolia
Waste 4-morpholinoethanol 07 05 04* 316 Veolia
Waste Acetone 07 05 04* 2112 Veolia
Waste aqueous isopropanol solution 07 05 01* 504 Veolia
Waste aqueous solution trace pharma 07 05 01* 2857 Veolia
Waste Aqueous solvent mixture trace pharma 07 05 01* 747 Veolia
Waste aqueous solvent mixture (Acetone) Trace pharma 07 05 01* 1120 Veolia
Waste aqueous solvent mixture (Ethanol,Methanol) trace pharma 07 05 01* 672 Veolia
Waste aqueous solvent mixture (Isopropanol, Methanol) 07 05 01* 173 Veolia
Waste Aqueous solvent mixture (Methanol, Acetone) 07 05 01* 675 Veolia
Waste aqueous solvent mixture(Methanol)trace pharma) 07 05 01* 1111 Veolia
Waste Ethanol 07 05 04* 1194 Veolia
Waste Ethyl Acetate 07 05 04* 513 Veolia
Waste Ethylene Glycol 07 05 04* 690 Veolia
Page 16 of 63
Waste heptanes 07 05 04* 1026 Veolia
Waste Hexane 07 05 04* 5425 Veolia
Waste Methanol 07 05 04* 8340 Veolia
Waste Methanol solution 07 05 04* 16100 Veolia
Waste Mixed solvents 07 05 03* 527 Veolia
Waste Mixed solvents (acetone) 07 05 04* 134 Veolia
Waste Mixed solvents (acetone, tetrahydrofuran) 07 05 04* 143 Veolia
Waste Mixed solvents (ethanol, heptane) 07 05 04* 338 Veolia
Waste Mixed solvents (Ethanol, Toluene) 07 05 04* 2231 Veolia
Waste mixed solvents (Hexane , Tetrahydrofuran) 07 05 04* 896 Veolia
Waste mixed solvents (Hexane, IPA) 07 05 04* 690 Veolia
Waste mixed solvents (IPA, Toluene) 07 05 04* 1206 Veolia
Waste mixed solvents (Isopropanal, Dichloromethane) 07 05 03* 1380 Veolia
Waste Mixed Solvents (Methanol,Acetone) 07 05 04* 1357 Veolia
Waste mixed solvents (Methanol,Ethanol 07 05 04* 892 Veolia
Waste Mixed solvents (tetrahydrofuran,Dicyclopentadiene) 07 05 04* 173 Veolia
Waste Mixed solvents (THF, Heptane) 07 05 04* 192 Veolia
Waste mixed solvents (THF,Toluene,DCM) 07 05 03* 672 Veolia
Waste mixed solvents (Toluene, Heptane) 07 05 04* 509 Veolia
Waste Mixed solvents (Toluene, Hexane, Dichloromethane) 07 05 03* 821 Veolia
Waste mixed solvents(Methanol, Toluene) 07 05 04* 840 Veolia
Waste N-Methyl-2-Pyrolidone 07 05 04* 672 Veolia
WASTE Tetrahydrofuran 07 05 04* 781 Veolia
Waste Toluene Distillate 07 05 04* 6585 Veolia
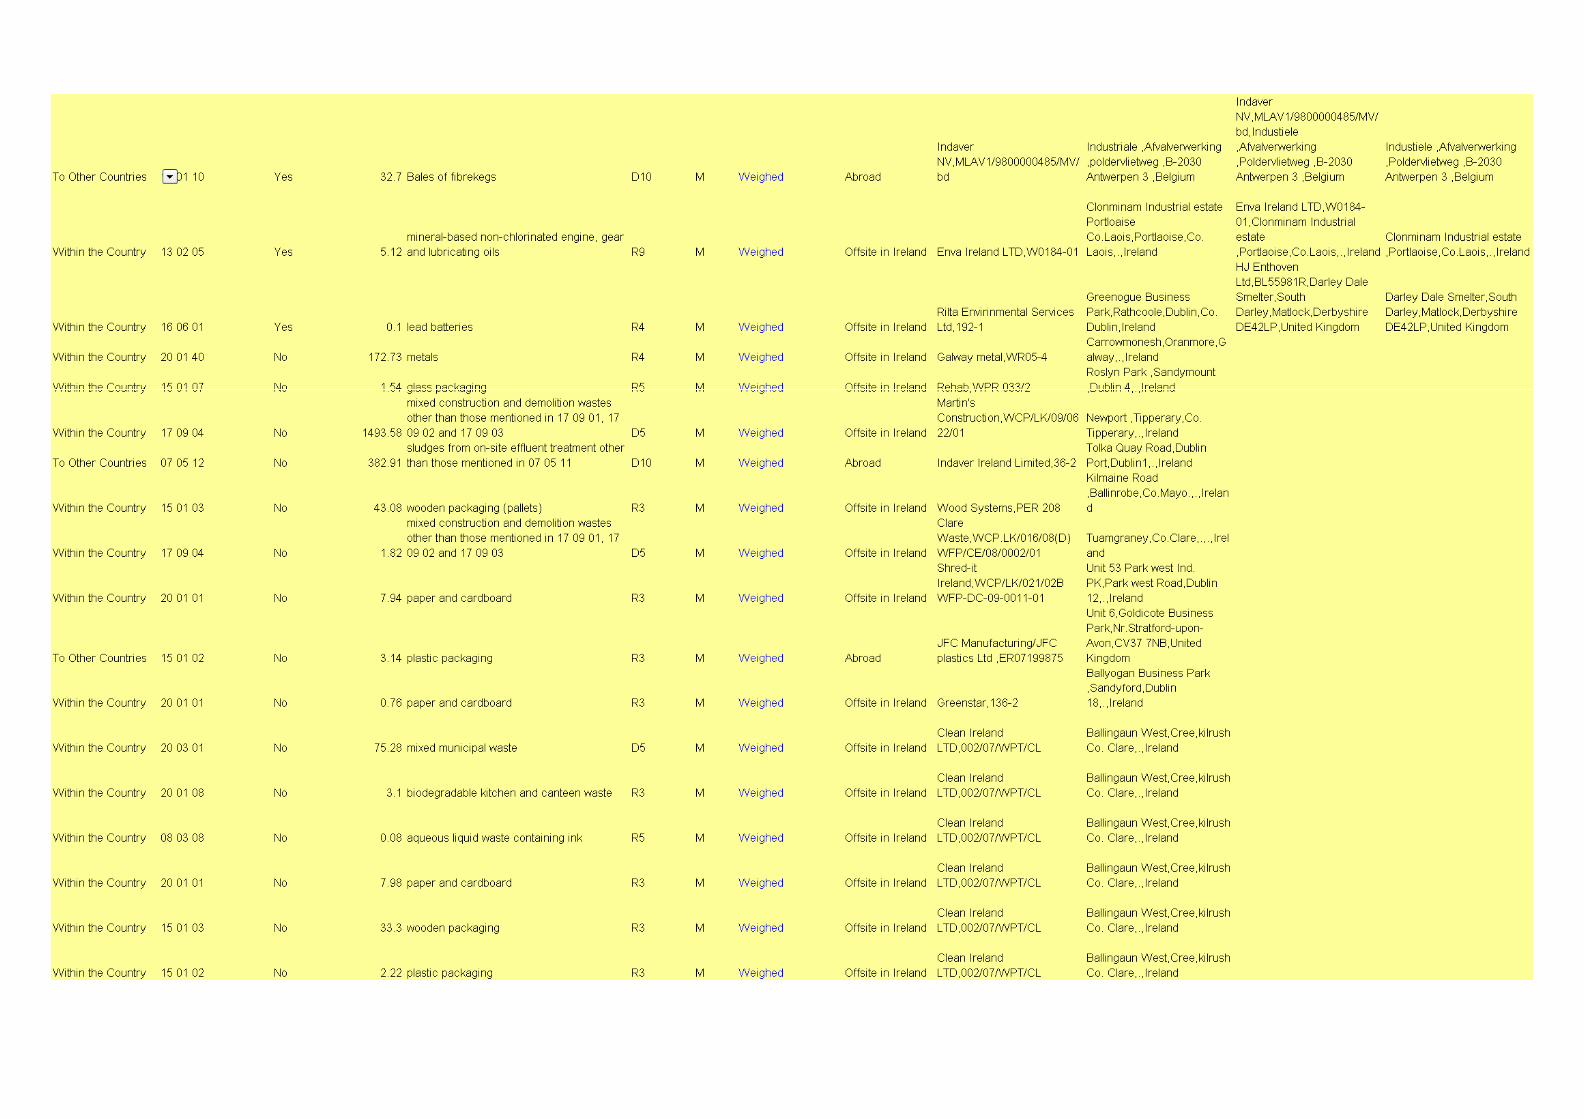
Bales of Fibrekegs 15 01 10* 32700 Indaver
Page 17 of 63
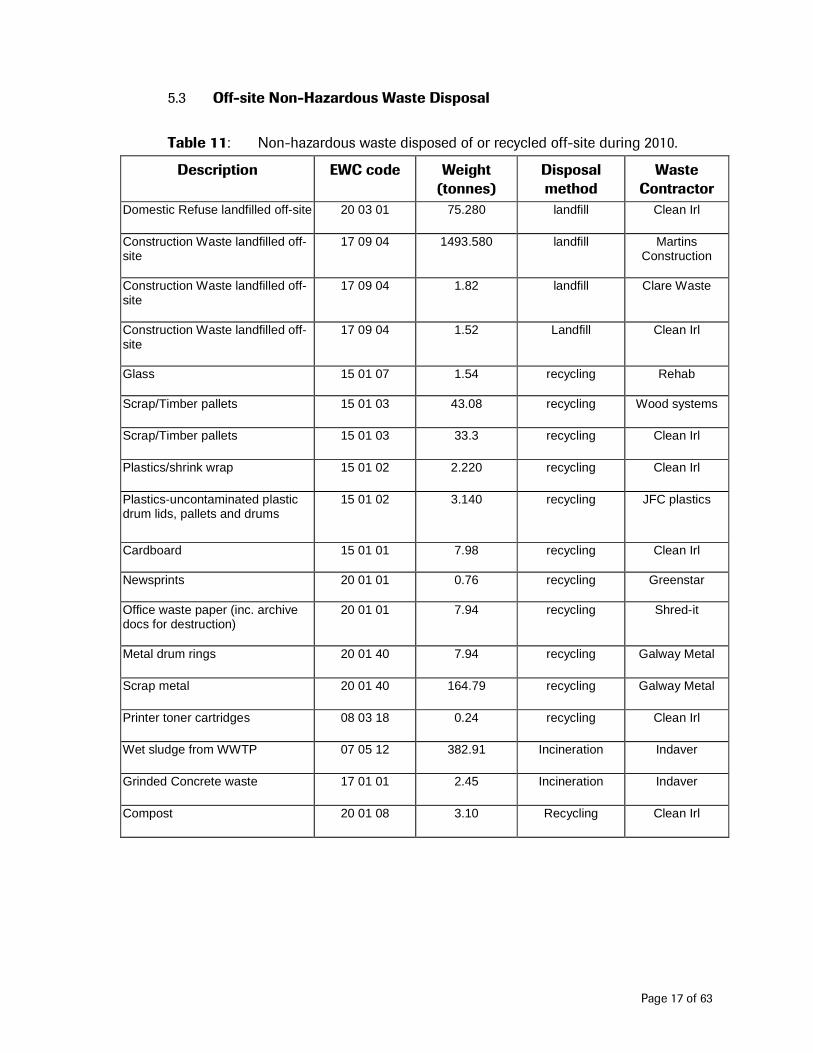
5.3 Off-site Non-Hazardous Waste Disposal
Table 11: Non-hazardous waste disposed of or recycled off-site during 2010.
Description EWC code Weight (tonnes)
Disposal method
Waste Contractor
Domestic Refuse landfilled off-site 20 03 01 75.280 landfill Clean Irl
Construction Waste landfilled off-site
17 09 04 1493.580 landfill Martins Construction
Construction Waste landfilled off-site
17 09 04 1.82 landfill Clare Waste
Construction Waste landfilled off-site
17 09 04 1.52 Landfill Clean Irl
Glass
15 01 07 1.54 recycling Rehab
Scrap/Timber pallets 15 01 03 43.08 recycling Wood systems
Scrap/Timber pallets 15 01 03 33.3 recycling Clean Irl
Plastics/shrink wrap 15 01 02 2.220 recycling Clean Irl
Plastics-uncontaminated plastic drum lids, pallets and drums
15 01 02 3.140 recycling JFC plastics
Cardboard
15 01 01 7.98 recycling Clean Irl
Newsprints
20 01 01 0.76 recycling Greenstar
Office waste paper (inc. archive docs for destruction)
20 01 01 7.94 recycling Shred-it
Metal drum rings 20 01 40 7.94 recycling Galway Metal
Scrap metal 20 01 40 164.79 recycling Galway Metal
Printer toner cartridges 08 03 18 0.24 recycling Clean Irl
Wet sludge from WWTP 07 05 12 382.91 Incineration Indaver
Grinded Concrete waste 17 01 01 2.45 Incineration Indaver
Compost 20 01 08 3.10 Recycling Clean Irl
Page 18 of 63
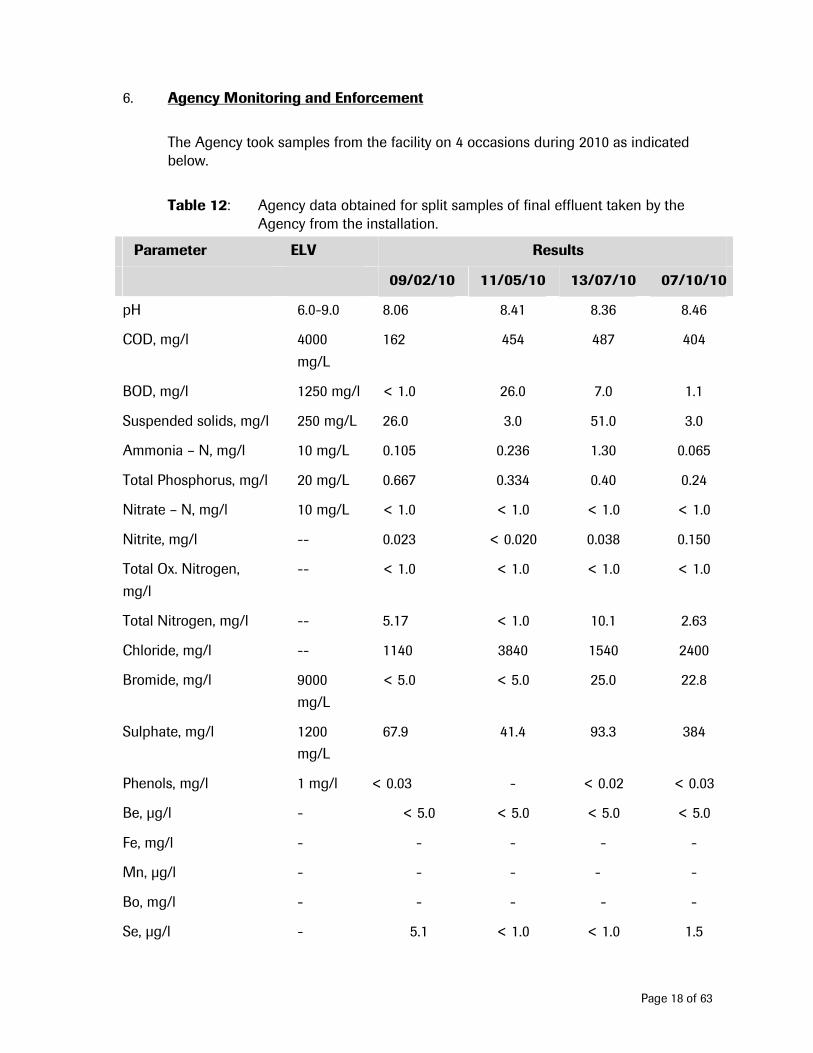
6. Agency Monitoring and Enforcement
The Agency took samples from the facility on 4 occasions during 2010 as indicated below.
Table 12: Agency data obtained for split samples of final effluent taken by the Agency from the installation.
Parameter ELV Results
09/02/10 11/05/10 13/07/10 07/10/10
pH 6.0-9.0 8.06 8.41 8.36 8.46
COD, mg/l 4000
mg/L
162 454 487 404
BOD, mg/l 1250 mg/l < 1.0 26.0 7.0 1.1
Suspended solids, mg/l 250 mg/L 26.0 3.0 51.0 3.0
Ammonia – N, mg/l 10 mg/L 0.105 0.236 1.30 0.065
Total Phosphorus, mg/l 20 mg/L 0.667 0.334 0.40 0.24
Nitrate – N, mg/l 10 mg/L < 1.0 < 1.0 < 1.0 < 1.0
Nitrite, mg/l -- 0.023 < 0.020 0.038 0.150
Total Ox. Nitrogen,
mg/l
-- < 1.0 < 1.0 < 1.0 < 1.0
Total Nitrogen, mg/l -- 5.17 < 1.0 10.1 2.63
Chloride, mg/l -- 1140 3840 1540 2400
Bromide, mg/l 9000
mg/L
< 5.0 < 5.0 25.0 22.8
Sulphate, mg/l 1200
mg/L
67.9 41.4 93.3 384
Phenols, mg/l 1 mg/l < 0.03 - < 0.02 < 0.03
Be, µg/l - < 5.0 < 5.0 < 5.0 < 5.0
Fe, mg/l - - - - -
Mn, µg/l - - - - -
Bo, mg/l - - - - -
Se, µg/l - 5.1 < 1.0 < 1.0 1.5

Page 19 of 63
Parameter ELV Results
09/02/10 11/05/10 13/07/10 07/10/10
Cd, mg/l - - - - -
As, µg/l - 1.9 < 1.0 < 1.0 < 1.0
Sb, µg/l - < 1.0 < 1.0 < 0.5 0.5
Cr, mg/l - < 0.005 0.018 0.023 0.007
Cu, mg/l - 0.020 0.024 0.019 0.006
Ni, mg/l - 0.010 0.050 0.090 0.020
Pb, mg/l - < 1.000 < 0.001 < 0.001 < 0.500
Zn, mg/l - 0.135 0.034 0.066 0.044
VOC, µg/l - 331 - 33.7 26.9
Mo, mg/l - - - - -
Hg, µg/l - 0.14 < 0.10 < 0.10 < 0.10
Th, mg/l - - - - -
Tin, mg/l - - - - -
Tl - - - - -
Appearance - - - - -
Dioxins . furans, ng/m3 0.1 ng/m3 - - - -
Page 20 of 63
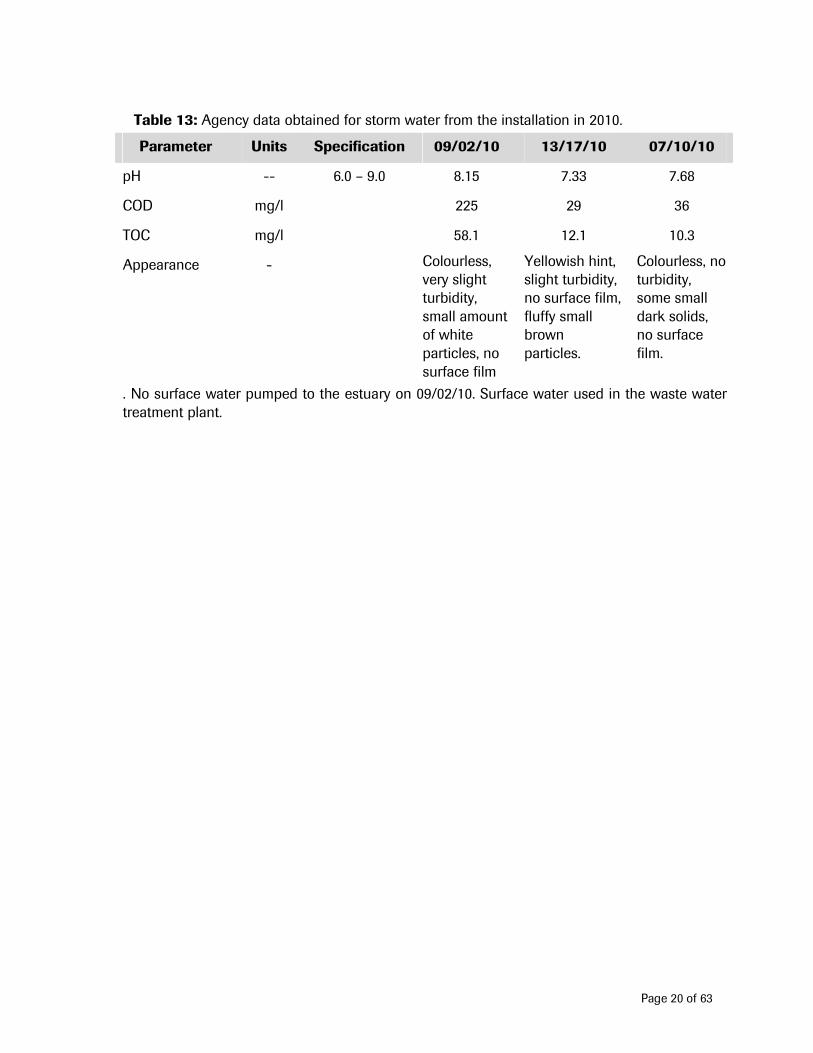
Table 13: Agency data obtained for storm water from the installation in 2010.
Parameter Units Specification 09/02/10 13/17/10 07/10/10
pH -- 6.0 – 9.0 8.15 7.33 7.68
COD mg/l 225 29 36
TOC mg/l 58.1 12.1 10.3
Appearance - Colourless, very slight turbidity, small amount of white particles, no surface film
Yellowish hint, slight turbidity, no surface film, fluffy small brown particles.
Colourless, no turbidity, some small dark solids, no surface film.
. No surface water pumped to the estuary on 09/02/10. Surface water used in the waste water treatment plant.
Page 21 of 63
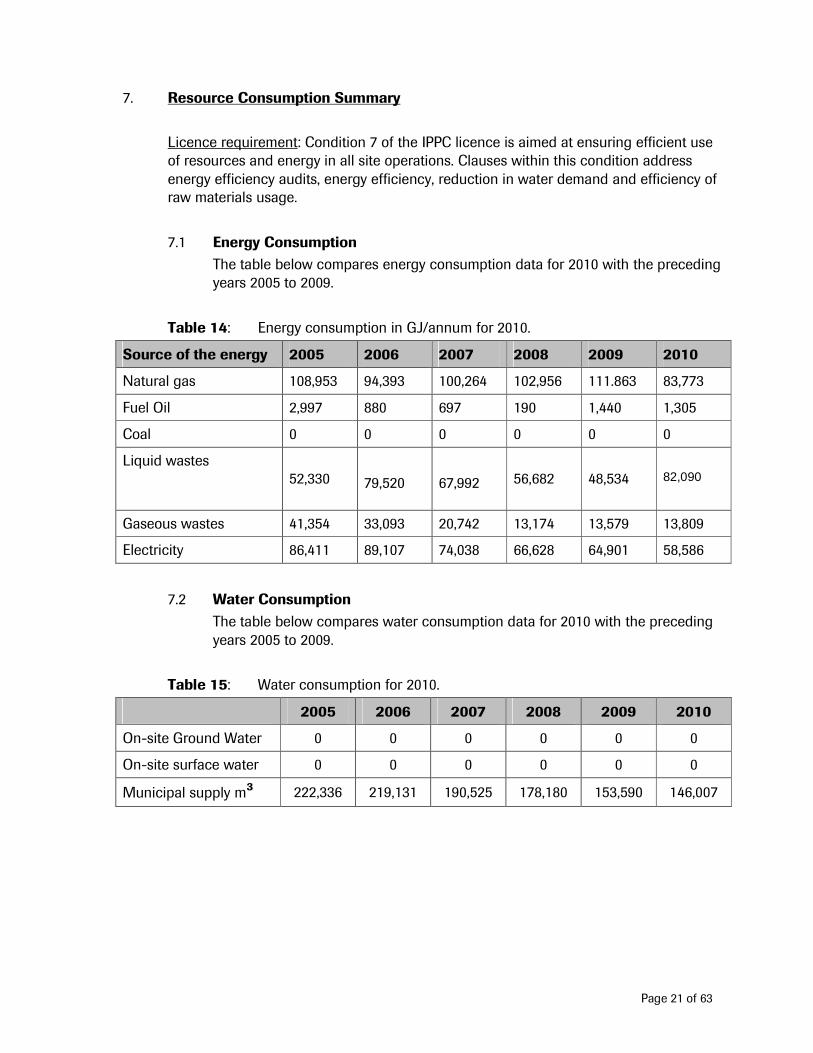
7. Resource Consumption Summary
Licence requirement: Condition 7 of the IPPC licence is aimed at ensuring efficient use of resources and energy in all site operations. Clauses within this condition address energy efficiency audits, energy efficiency, reduction in water demand and efficiency of raw materials usage.
7.1 Energy Consumption
The table below compares energy consumption data for 2010 with the preceding years 2005 to 2009.
Table 14: Energy consumption in GJ/annum for 2010.
Source of the energy 2005 2006 2007 2008 2009 2010
Natural gas 108,953 94,393 100,264 102,956 111.863 83,773
Fuel Oil 2,997 880 697 190 1,440 1,305
Coal 0 0 0 0 0 0
Liquid wastes 52,330
79,520
67,992 56,682 48,534
82,090
Gaseous wastes 41,354 33,093 20,742 13,174 13,579 13,809
Electricity 86,411 89,107 74,038 66,628 64,901 58,586
7.2 Water Consumption
The table below compares water consumption data for 2010 with the preceding years 2005 to 2009.
Table 15: Water consumption for 2010.
2005 2006 2007 2008 2009 2010
On-site Ground Water 0 0 0 0 0 0
On-site surface water 0 0 0 0 0 0
Municipal supply m³ 222,336 219,131 190,525 178,180 153,590 146,007
Page 22 of 63
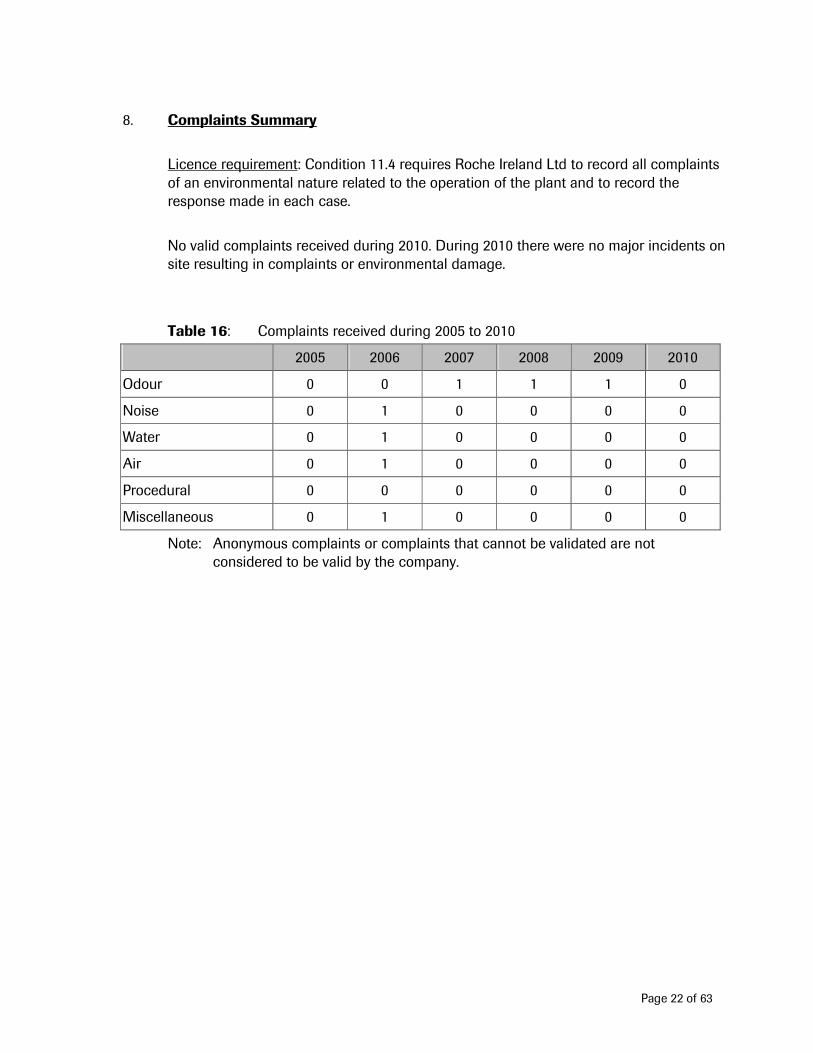
8. Complaints Summary
Licence requirement: Condition 11.4 requires Roche Ireland Ltd to record all complaints of an environmental nature related to the operation of the plant and to record the response made in each case.
No valid complaints received during 2010. During 2010 there were no major incidents on site resulting in complaints or environmental damage.
Table 16: Complaints received during 2005 to 2010
2005 2006 2007 2008 2009 2010
Odour 0 0 1 1 1 0
Noise 0 1 0 0 0 0
Water 0 1 0 0 0 0
Air 0 1 0 0 0 0
Procedural 0 0 0 0 0 0
Miscellaneous 0 1 0 0 0 0
Note: Anonymous complaints or complaints that cannot be validated are not considered to be valid by the company.
Page 23 of 63
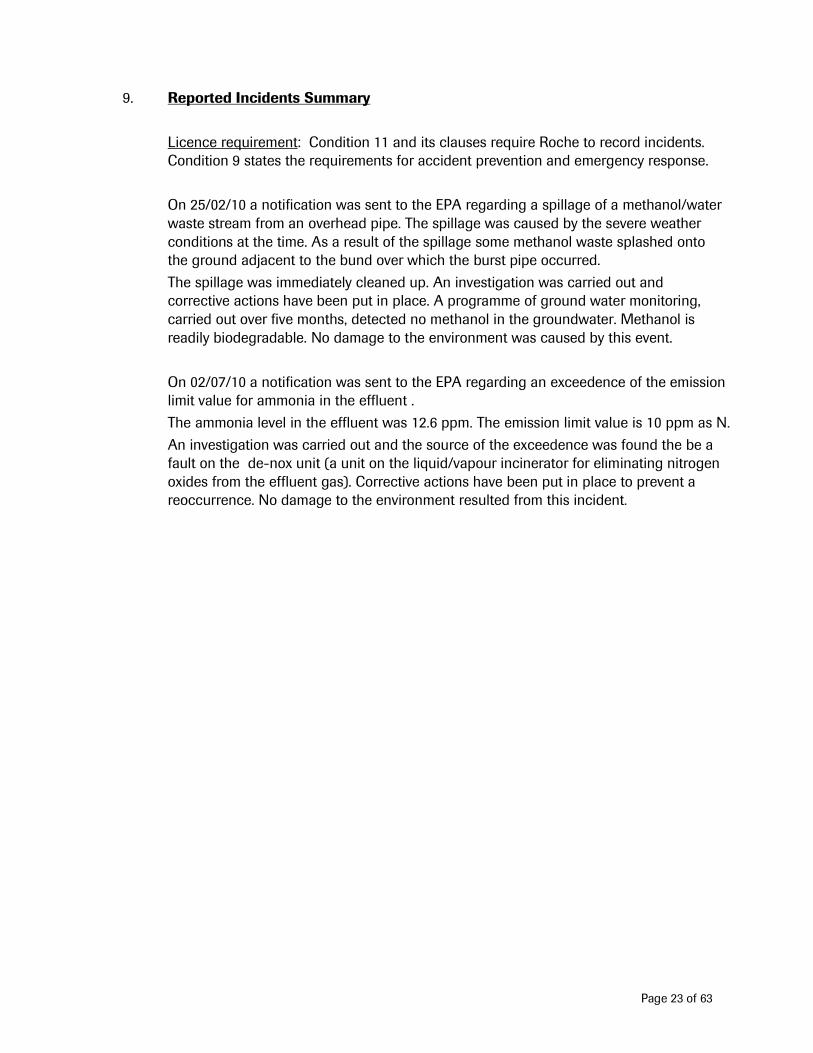
9. Reported Incidents Summary
Licence requirement: Condition 11 and its clauses require Roche to record incidents. Condition 9 states the requirements for accident prevention and emergency response.
On 25/02/10 a notification was sent to the EPA regarding a spillage of a methanol/water waste stream from an overhead pipe. The spillage was caused by the severe weather conditions at the time. As a result of the spillage some methanol waste splashed onto the ground adjacent to the bund over which the burst pipe occurred.
The spillage was immediately cleaned up. An investigation was carried out and corrective actions have been put in place. A programme of ground water monitoring, carried out over five months, detected no methanol in the groundwater. Methanol is readily biodegradable. No damage to the environment was caused by this event.
On 02/07/10 a notification was sent to the EPA regarding an exceedence of the emission limit value for ammonia in the effluent .
The ammonia level in the effluent was 12.6 ppm. The emission limit value is 10 ppm as N.
An investigation was carried out and the source of the exceedence was found the be a fault on the de-nox unit (a unit on the liquid/vapour incinerator for eliminating nitrogen oxides from the effluent gas). Corrective actions have been put in place to prevent a reoccurrence. No damage to the environment resulted from this incident.
Page 24 of 63
10. Environmental Management Programme
Licence Requirement: condition 2.2 and its clauses of the IPPC licence requires the licencee to maintain an Environmental Management System (EMS). As part of this requirement an Environmental Management Programme is required.
10.1 Schedule of Environmental Objectives and Targets
Four objectives were identified for the site in 2011:-
Objective 1: Waste Minimisation
Objective 2: Waste Water Treatment Plant
Objective 3: Energy
Objective 4: Projects
10.2 Environmental Management Programme: Review of 2010
Page 25 of 63
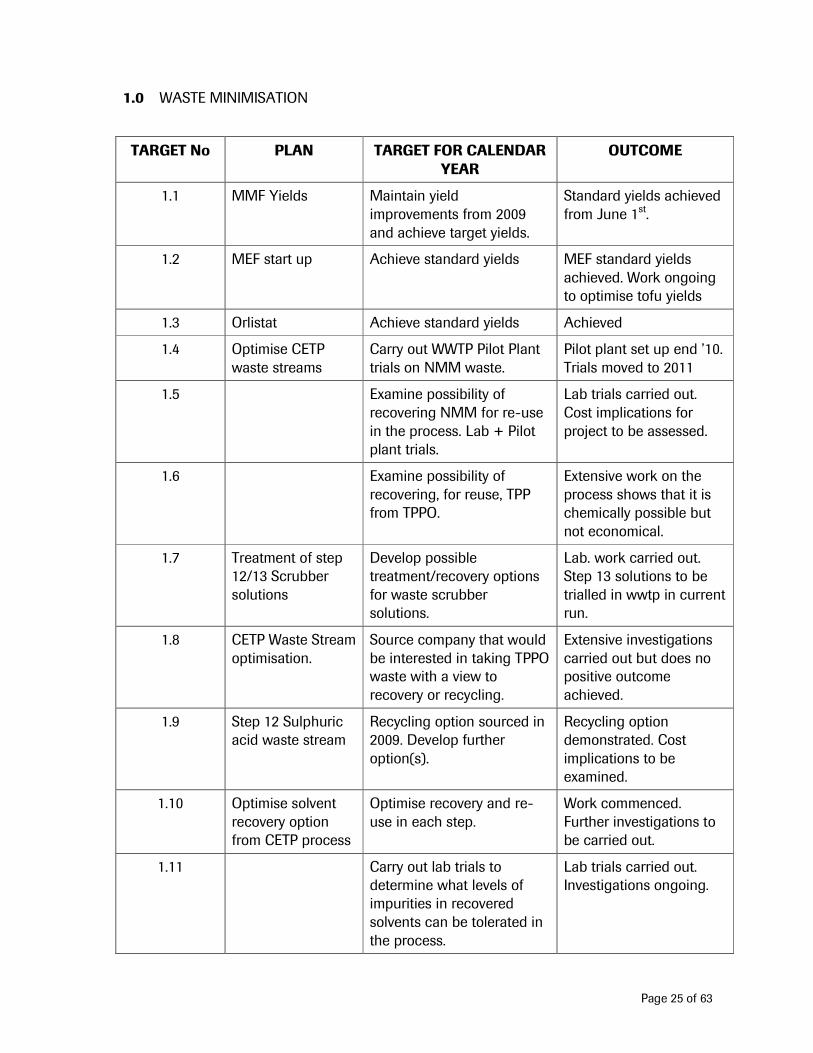
1.0 WASTE MINIMISATION
TARGET No PLAN TARGET FOR CALENDAR YEAR
OUTCOME
1.1 MMF Yields Maintain yield improvements from 2009 and achieve target yields.
Standard yields achieved from June 1st.
1.2 MEF start up Achieve standard yields MEF standard yields achieved. Work ongoing to optimise tofu yields
1.3 Orlistat Achieve standard yields Achieved
1.4 Optimise CETP waste streams
Carry out WWTP Pilot Plant trials on NMM waste.
Pilot plant set up end ’10. Trials moved to 2011
1.5 Examine possibility of recovering NMM for re-use in the process. Lab + Pilot plant trials.
Lab trials carried out. Cost implications for project to be assessed.
1.6 Examine possibility of recovering, for reuse, TPP from TPPO.
Extensive work on the process shows that it is chemically possible but not economical.
1.7 Treatment of step 12/13 Scrubber solutions
Develop possible treatment/recovery options for waste scrubber solutions.
Lab. work carried out. Step 13 solutions to be trialled in wwtp in current run.
1.8 CETP Waste Stream optimisation.
Source company that would be interested in taking TPPO waste with a view to recovery or recycling.
Extensive investigations carried out but does no positive outcome achieved.
1.9 Step 12 Sulphuric acid waste stream
Recycling option sourced in 2009. Develop further option(s).
Recycling option demonstrated. Cost implications to be examined.
1.10 Optimise solvent recovery option from CETP process
Optimise recovery and re-use in each step.
Work commenced. Further investigations to be carried out.
1.11 Carry out lab trials to determine what levels of impurities in recovered solvents can be tolerated in the process.
Lab trials carried out. Investigations ongoing.
Page 26 of 63
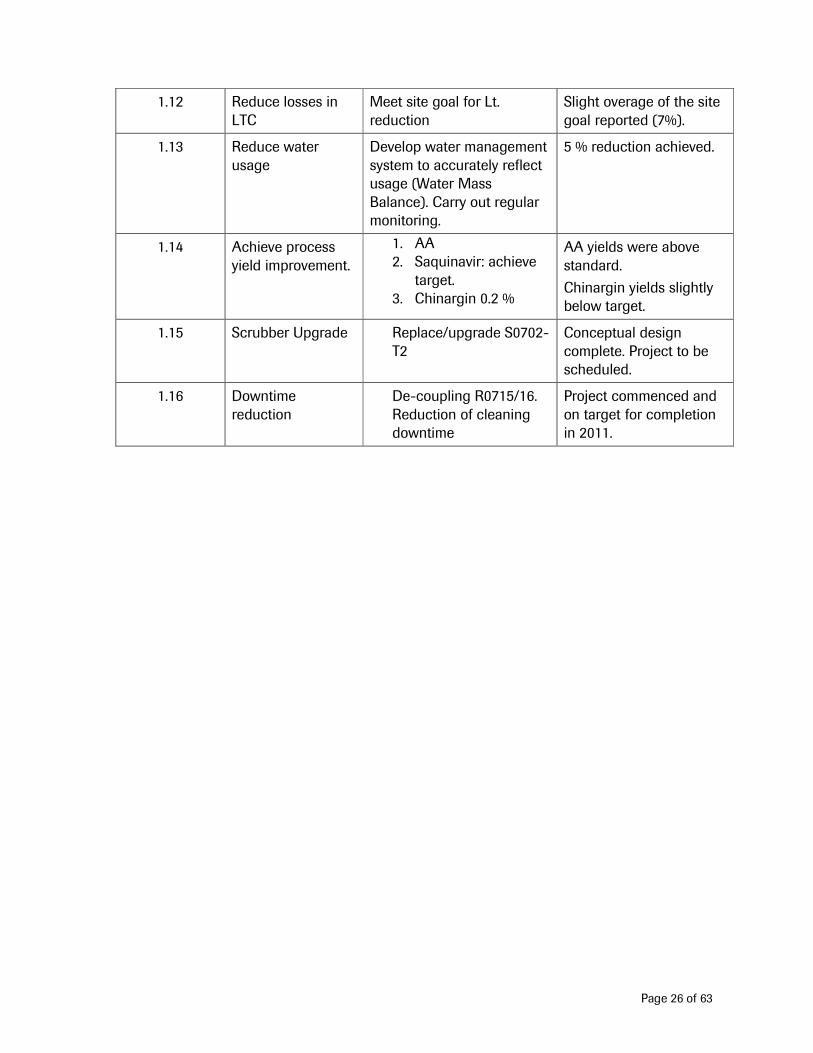
1.12 Reduce losses in LTC
Meet site goal for Lt. reduction
Slight overage of the site goal reported (7%).
1.13 Reduce water usage
Develop water management system to accurately reflect usage (Water Mass Balance). Carry out regular monitoring.
5 % reduction achieved.
1.14 Achieve process yield improvement.
1. AA 2. Saquinavir: achieve
target. 3. Chinargin 0.2 %
AA yields were above standard.
Chinargin yields slightly below target.
1.15 Scrubber Upgrade Replace/upgrade S0702-T2
Conceptual design complete. Project to be scheduled.
1.16 Downtime reduction
De-coupling R0715/16. Reduction of cleaning downtime
Project commenced and on target for completion in 2011.

Page 27 of 63
2.0 WASTE WATER TREATMENT PLANT
TARGET NO. PLAN TARGET FOR CALENDAR YEAR
OUTCOME
2.1 Installation of in-line Turbidity meter.
Improve efficiency of the decanter with increased in-line technology.
Installation complete. Commissioning due in 2011. Trials on a new Poly yielded improved decanter performance.
2.2 Increase application of in- line technology.
Install and validate in-line TOC/TKN meter------ improved WWTP controls.
Considerable work carried out but application not successful. New area of application to be examined.
2.3 Improved Stormwater management
Cross functional approach to develop new management system.
Scheduled work complete. Project for improved management and use of C/R tanks for stormwater for approval in 2011.
2.4 Increased Env Lab efficiency.
Reduce number of samples taken and analysed daily without adverse effect on WWTP management.
In depth analysis of lab work carried out. New WWTP Batchsheet installed. Large reduction in tests carried out achieved.
2.5 Improved compliance Install new analytical methods that meet EPA requirement for CEN approval.
Work commenced and ongoing. Investigation into ISO 17025 commenced.
2.6 Validation of analytical methods in Env. Lab.
Following introduction of CEN methodology: Validation including Test Matrix assessment to be completed for 4 new methods in 2010.
Work complete for NO3, PO4, and SO4. Bromide work to be carried out in 2011.
Page 28 of 63
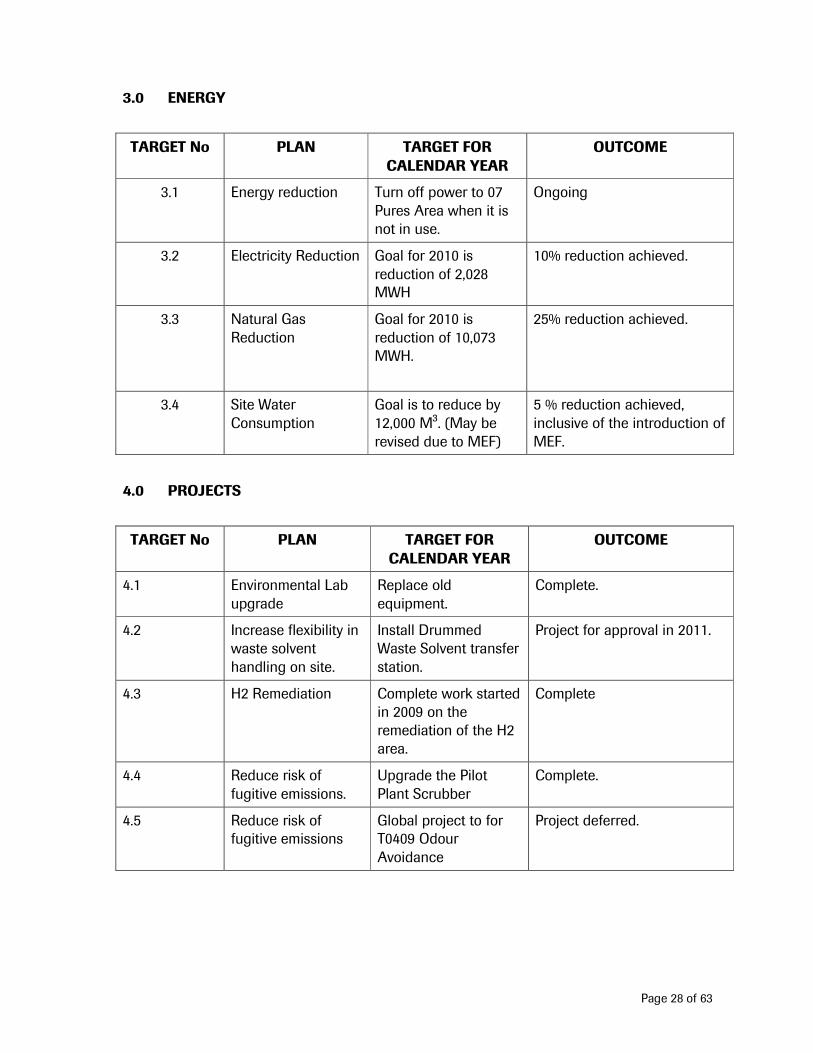
3.0 ENERGY
TARGET No PLAN TARGET FOR CALENDAR YEAR
OUTCOME
3.1 Energy reduction Turn off power to 07 Pures Area when it is not in use.
Ongoing
3.2 Electricity Reduction Goal for 2010 is reduction of 2,028 MWH
10% reduction achieved.
3.3 Natural Gas Reduction
Goal for 2010 is reduction of 10,073 MWH.
25% reduction achieved.
3.4 Site Water Consumption
Goal is to reduce by 12,000 M³. (May be revised due to MEF)
5 % reduction achieved, inclusive of the introduction of MEF.
4.0 PROJECTS
TARGET No PLAN TARGET FOR CALENDAR YEAR
OUTCOME
4.1 Environmental Lab upgrade
Replace old equipment.
Complete.
4.2 Increase flexibility in waste solvent handling on site.
Install Drummed Waste Solvent transfer station.
Project for approval in 2011.
4.3 H2 Remediation Complete work started in 2009 on the remediation of the H2 area.
Complete
4.4 Reduce risk of fugitive emissions.
Upgrade the Pilot Plant Scrubber
Complete.
4.5 Reduce risk of fugitive emissions
Global project to for T0409 Odour Avoidance
Project deferred.

Page 29 of 63
10.3 Environmental Management Programme: proposal for 2011
1.0 Waste Minimisation
TARGET No
PLAN TARGET FOR CALENDAR YEAR
RESPONSIBILITY VALUE
1.1 MMF yield Achieve ½ - 1 % improvement. Incorporate silica gel wash.
Manager 04 area Achieve target yields. Increased efficiency reduced waste.
1.2 Orlistat yield Achieve ½ - 1 % yield improvement. Incorporate step to recycle Pannevis belt wash.
Manager 05 Plant Achieve target yields. Increased efficiency reduced waste
1.3 MEF waste reduction
Set up study with MSAT to review waste streams from MEF process.
MSAT Manager Snr. Environmental Scientist
Waste reduction. Improved treatment efficiency
1.4 TOFU yield Achieve 3 – 4 % yield improvement.
Manager 05 Plant Increased process efficiency resulting in reduced waste production
1.5 Pilot trials Carry out pilot trials to eliminate sulphuric acid from stage 12 of new process.
MSAT Manager Product introduction Project Leader
Possible elimination of a waste stream for the process.
1.6 Waste reduction
Lab trials to examine possibility of single solvent (heptane) for new process.
MSAT Manager Product introduction Project Leader
Waste reduction/Green Chemistry/increased solvent reuse in process
1.7 Solvent recovery
Examine recovery of EtOH m/l’s and possible reuse in process.
Manager 07 area. Product Introduction Project Leader.
Waste reduction. Improved reuse of solvents in process.
1.8 Examine AA process efficiency
Process improvement to achieve standard volume of aqueous waste per batch.
Manager 07 area. Improved efficiency. Resulting in greater WWTP efficiency
1.9 AA yield Achieve 0.5 % improvement. Optimize distillation step.
Manager 07 area. Achieve target yields. Increased efficiency reduced waste
Page 30 of 63
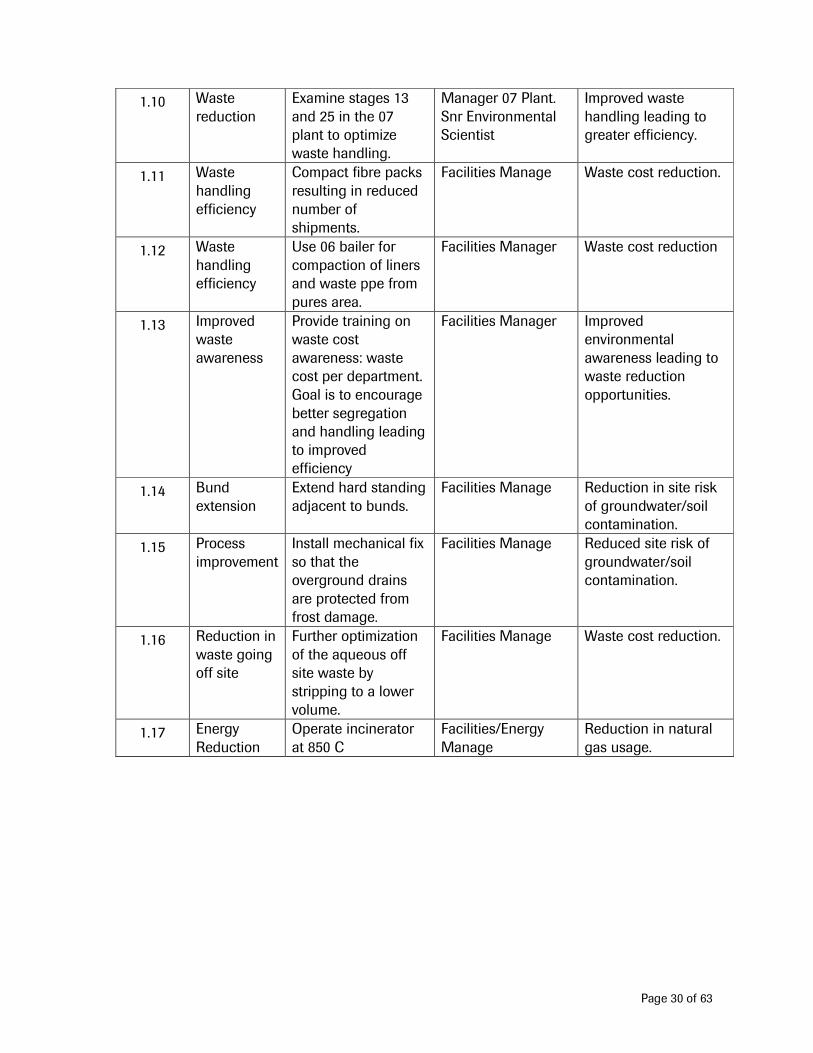
1.10 Waste reduction
Examine stages 13 and 25 in the 07 plant to optimize waste handling.
Manager 07 Plant. Snr Environmental Scientist
Improved waste handling leading to greater efficiency.
1.11 Waste handling efficiency
Compact fibre packs resulting in reduced number of shipments.
Facilities Manage Waste cost reduction.
1.12 Waste handling efficiency
Use 06 bailer for compaction of liners and waste ppe from pures area.
Facilities Manager Waste cost reduction
1.13 Improved waste awareness
Provide training on waste cost awareness: waste cost per department. Goal is to encourage better segregation and handling leading to improved efficiency
Facilities Manager Improved environmental awareness leading to waste reduction opportunities.
1.14 Bund extension
Extend hard standing adjacent to bunds.
Facilities Manage Reduction in site risk of groundwater/soil contamination.
1.15 Process improvement
Install mechanical fix so that the overground drains are protected from frost damage.
Facilities Manage Reduced site risk of groundwater/soil contamination.
1.16 Reduction in waste going off site
Further optimization of the aqueous off site waste by stripping to a lower volume.
Facilities Manage Waste cost reduction.
1.17 Energy Reduction
Operate incinerator at 850 C
Facilities/Energy Manage
Reduction in natural gas usage.
Page 31 of 63
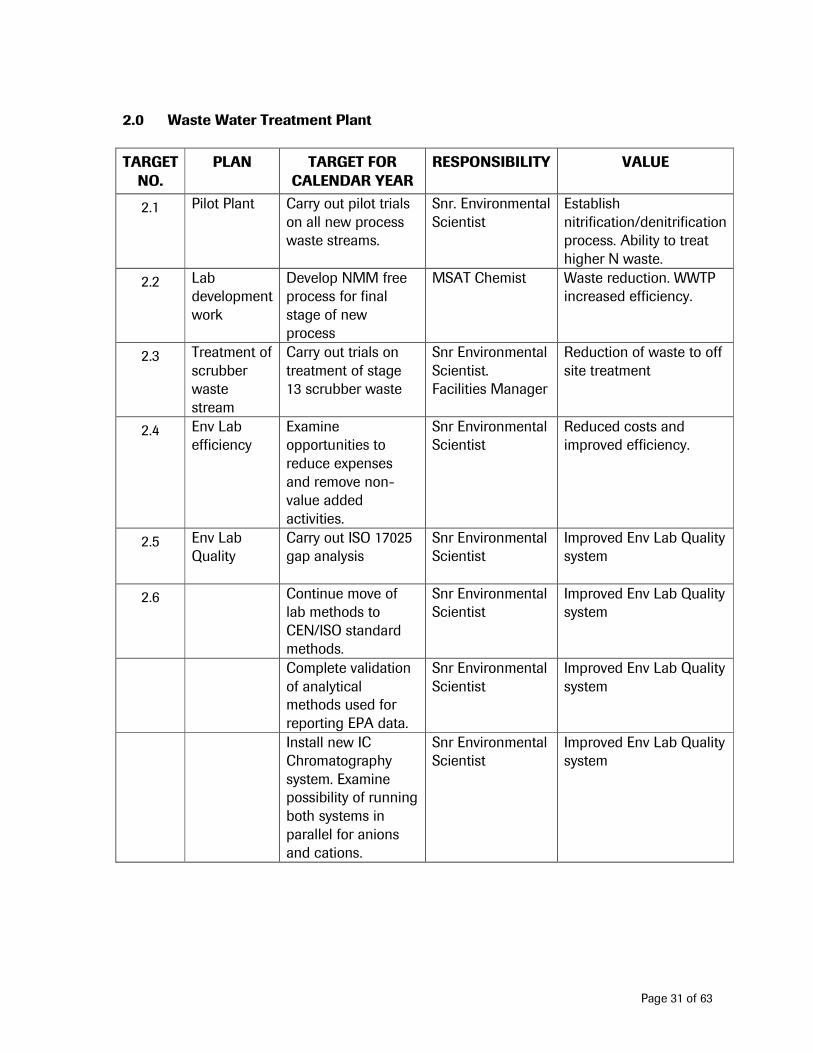
2.0 Waste Water Treatment Plant
TARGET NO.
PLAN TARGET FOR CALENDAR YEAR
RESPONSIBILITY VALUE
2.1 Pilot Plant Carry out pilot trials on all new process waste streams.
Snr. Environmental Scientist
Establish nitrification/denitrification process. Ability to treat higher N waste.
2.2 Lab development work
Develop NMM free process for final stage of new process
MSAT Chemist Waste reduction. WWTP increased efficiency.
2.3 Treatment of scrubber waste stream
Carry out trials on treatment of stage 13 scrubber waste
Snr Environmental Scientist. Facilities Manager
Reduction of waste to off site treatment
2.4 Env Lab efficiency
Examine opportunities to reduce expenses and remove non-value added activities.
Snr Environmental Scientist
Reduced costs and improved efficiency.
2.5 Env Lab Quality
Carry out ISO 17025 gap analysis
Snr Environmental Scientist
Improved Env Lab Quality system
2.6 Continue move of lab methods to CEN/ISO standard methods.
Snr Environmental Scientist
Improved Env Lab Quality system
Complete validation of analytical methods used for reporting EPA data.
Snr Environmental Scientist
Improved Env Lab Quality system
Install new IC Chromatography system. Examine possibility of running both systems in parallel for anions and cations.
Snr Environmental Scientist
Improved Env Lab Quality system
Page 32 of 63
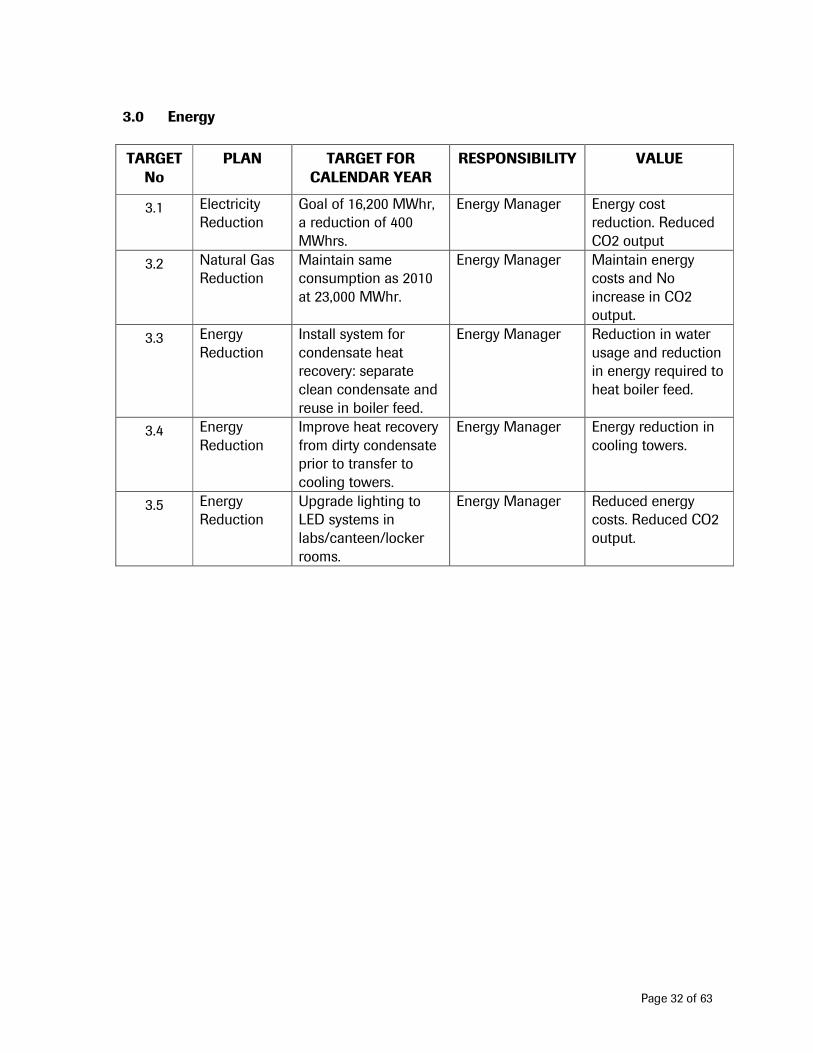
3.0 Energy
TARGET No
PLAN TARGET FOR CALENDAR YEAR
RESPONSIBILITY VALUE
3.1 Electricity Reduction
Goal of 16,200 MWhr, a reduction of 400 MWhrs.
Energy Manager Energy cost reduction. Reduced CO2 output
3.2 Natural Gas Reduction
Maintain same consumption as 2010 at 23,000 MWhr.
Energy Manager Maintain energy costs and No increase in CO2 output.
3.3 Energy Reduction
Install system for condensate heat recovery: separate clean condensate and reuse in boiler feed.
Energy Manager Reduction in water usage and reduction in energy required to heat boiler feed.
3.4 Energy Reduction
Improve heat recovery from dirty condensate prior to transfer to cooling towers.
Energy Manager Energy reduction in cooling towers.
3.5 Energy Reduction
Upgrade lighting to LED systems in labs/canteen/locker rooms.
Energy Manager Reduced energy costs. Reduced CO2 output.
Page 33 of 63
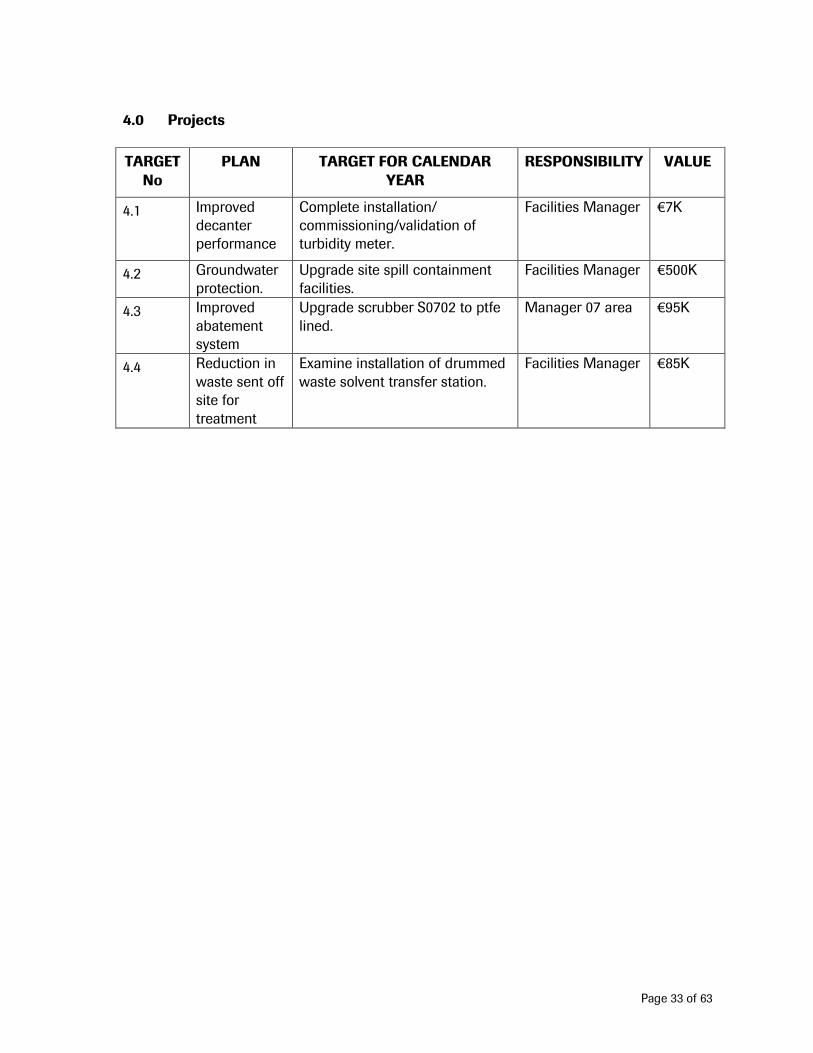
4.0 Projects
TARGET No
PLAN TARGET FOR CALENDAR YEAR
RESPONSIBILITY VALUE
4.1 Improved decanter performance
Complete installation/ commissioning/validation of turbidity meter.
Facilities Manager €7K
4.2 Groundwater protection.
Upgrade site spill containment facilities.
Facilities Manager €500K
4.3 Improved abatement system
Upgrade scrubber S0702 to ptfe lined.
Manager 07 area €95K
4.4 Reduction in waste sent off site for treatment
Examine installation of drummed waste solvent transfer station.
Facilities Manager €85K
Page 34 of 63
11. Noise Monitoring Report 2010
11.1 Introduction
An environmental noise survey was commissioned by Roche Ireland Ltd to fulfil the requirements for an annual noise survey as specified in the IPPC licence
Reg No. P0012-04 from the Environmental Protection Agency.
The survey was carried out on the 27th and 28th May 2010. It consisted of measurement of noise levels around the plant boundary and at nearby residences, by day and by night.
11.2 Survey Details
Methodology
The survey methodology followed the EPA ‘’Environmental Noise Survey Document (2003)’’, the EPA ‘’Guidance Note for Noise in Relation to Scheduled Activities (2006)’’ and ISO 1996 ‘’Description and measurement of environmental noise’’.
Page 35 of 63
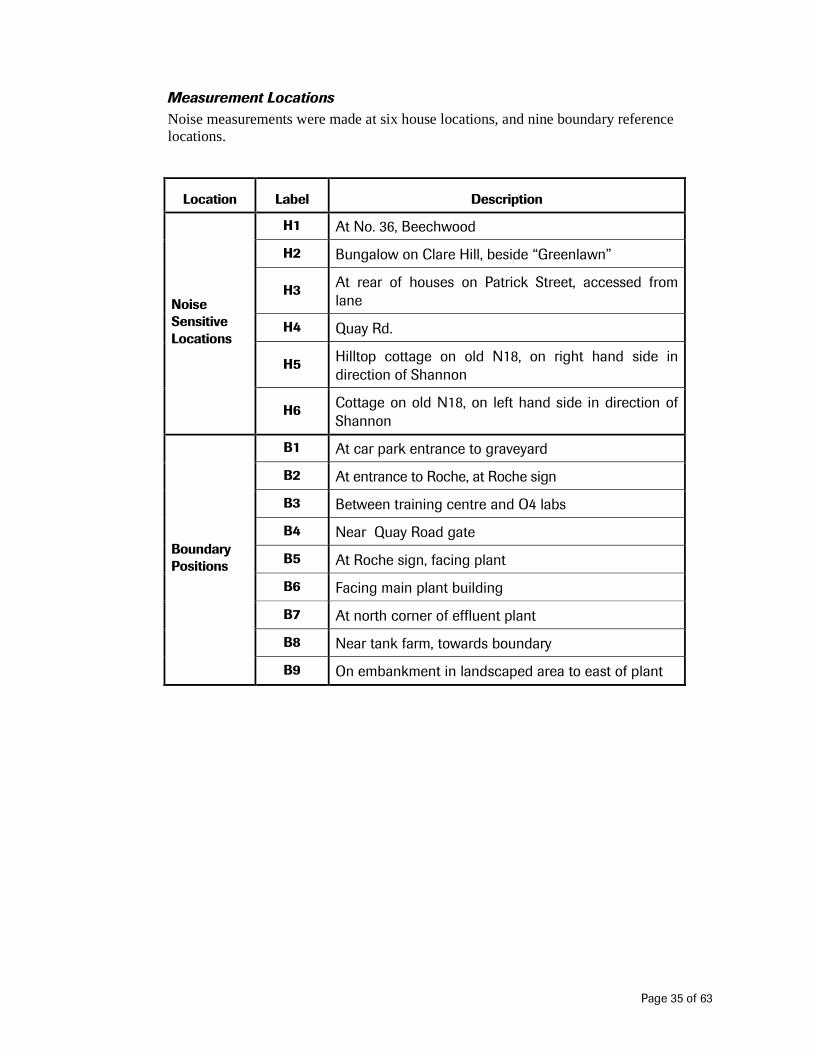
Measurement Locations
Noise measurements were made at six house locations, and nine boundary reference locations.
Location Label Description
H1 At No. 36, Beechwood
H2 Bungalow on Clare Hill, beside “Greenlawn”
H3 At rear of houses on Patrick Street, accessed from lane
H4 Quay Rd.
H5 Hilltop cottage on old N18, on right hand side in direction of Shannon
Noise Sensitive Locations
H6 Cottage on old N18, on left hand side in direction of Shannon
B1 At car park entrance to graveyard
B2 At entrance to Roche, at Roche sign
B3 Between training centre and O4 labs
B4 Near Quay Road gate
B5 At Roche sign, facing plant
B6 Facing main plant building
B7 At north corner of effluent plant
B8 Near tank farm, towards boundary
Boundary Positions
B9 On embankment in landscaped area to east of plant
B 4
Page 36 of 63
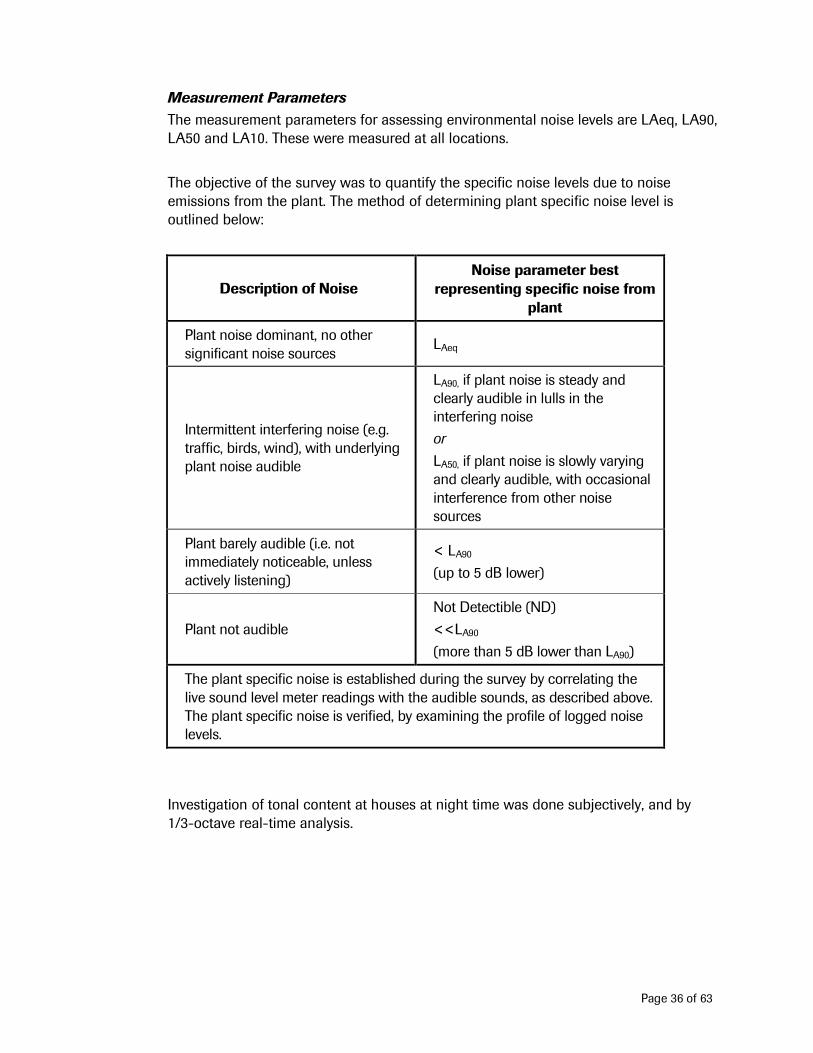
Measurement Parameters
The measurement parameters for assessing environmental noise levels are LAeq, LA90, LA50 and LA10. These were measured at all locations.
The objective of the survey was to quantify the specific noise levels due to noise emissions from the plant. The method of determining plant specific noise level is outlined below:
Description of Noise Noise parameter best
representing specific noise from plant
Plant noise dominant, no other significant noise sources
LAeq
Intermittent interfering noise (e.g. traffic, birds, wind), with underlying plant noise audible
LA90, if plant noise is steady and clearly audible in lulls in the interfering noise
or
LA50, if plant noise is slowly varying and clearly audible, with occasional interference from other noise sources
Plant barely audible (i.e. not immediately noticeable, unless actively listening)
< LA90
(up to 5 dB lower)
Plant not audible
Not Detectible (ND)
<<LA90
(more than 5 dB lower than LA90)
The plant specific noise is established during the survey by correlating the live sound level meter readings with the audible sounds, as described above. The plant specific noise is verified, by examining the profile of logged noise levels.
Investigation of tonal content at houses at night time was done subjectively, and by 1/3-octave real-time analysis.
Page 37 of 63
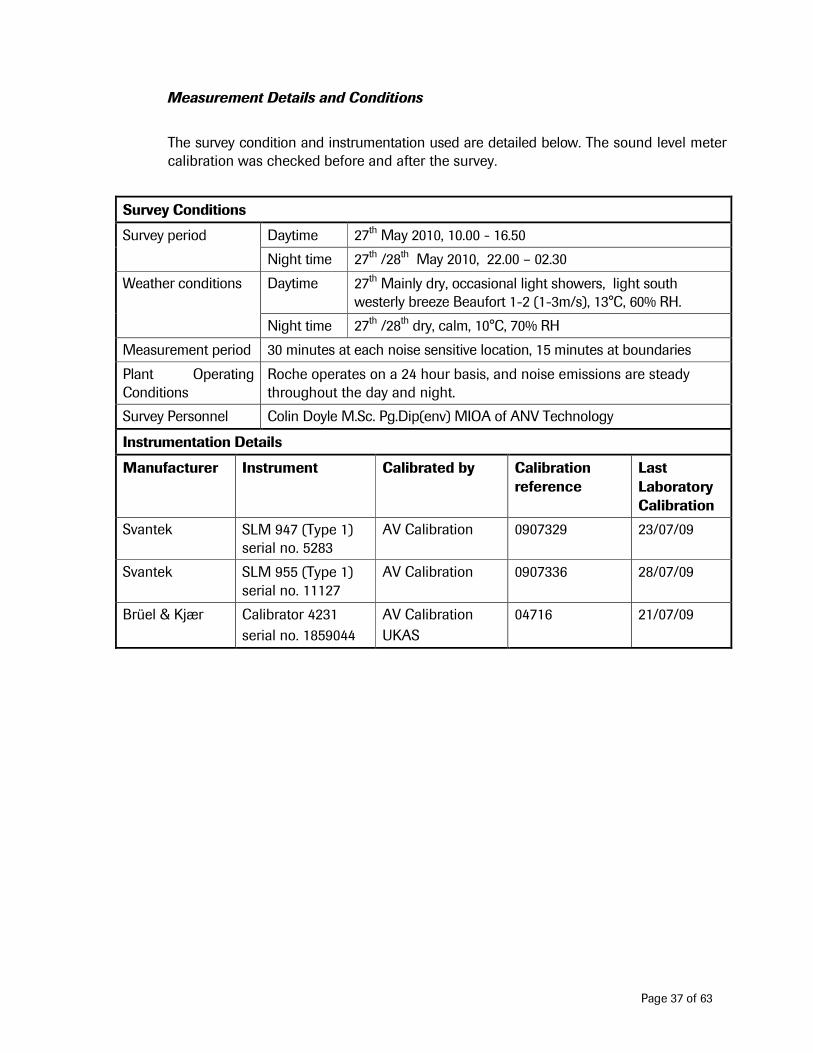
Measurement Details and Conditions
The survey condition and instrumentation used are detailed below. The sound level meter calibration was checked before and after the survey.
Survey Conditions
Daytime 27th May 2010, 10.00 - 16.50 Survey period
Night time 27th /28th May 2010, 22.00 – 02.30
Daytime 27th Mainly dry, occasional light showers, light south westerly breeze Beaufort 1-2 (1-3m/s), 13°C, 60% RH.
Weather conditions
Night time 27th /28th dry, calm, 10°C, 70% RH
Measurement period 30 minutes at each noise sensitive location, 15 minutes at boundaries
Plant Operating Conditions
Roche operates on a 24 hour basis, and noise emissions are steady throughout the day and night.
Survey Personnel Colin Doyle M.Sc. Pg.Dip(env) MIOA of ANV Technology
Instrumentation Details
Manufacturer Instrument Calibrated by Calibration reference
Last Laboratory Calibration
Svantek SLM 947 (Type 1) serial no. 5283
AV Calibration 0907329 23/07/09
Svantek SLM 955 (Type 1) serial no. 11127
AV Calibration 0907336 28/07/09
Brüel & Kjær Calibrator 4231
serial no. 1859044
AV Calibration
UKAS
04716 21/07/09
Page 38 of 63
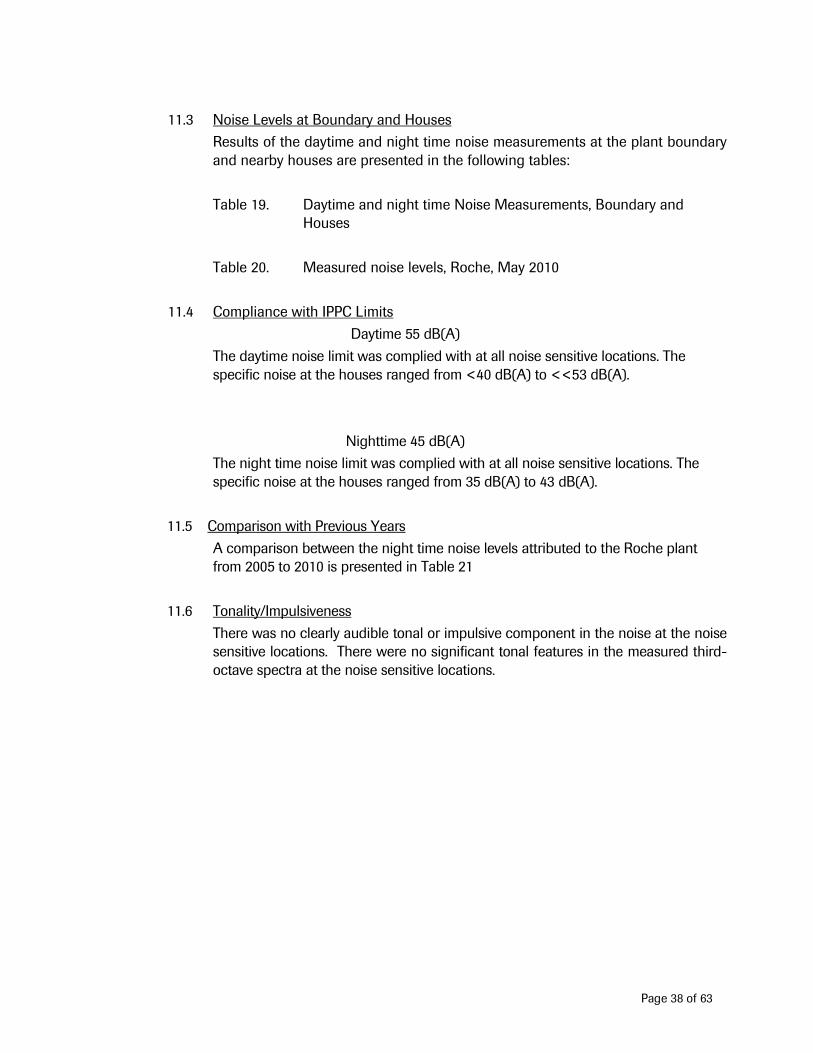
11.3 Noise Levels at Boundary and Houses
Results of the daytime and night time noise measurements at the plant boundary and nearby houses are presented in the following tables:
Table 19. Daytime and night time Noise Measurements, Boundary and Houses
Table 20. Measured noise levels, Roche, May 2010
11.4 Compliance with IPPC Limits
Daytime 55 dB(A)
The daytime noise limit was complied with at all noise sensitive locations. The specific noise at the houses ranged from <40 dB(A) to <<53 dB(A).
Nighttime 45 dB(A)
The night time noise limit was complied with at all noise sensitive locations. The specific noise at the houses ranged from 35 dB(A) to 43 dB(A).
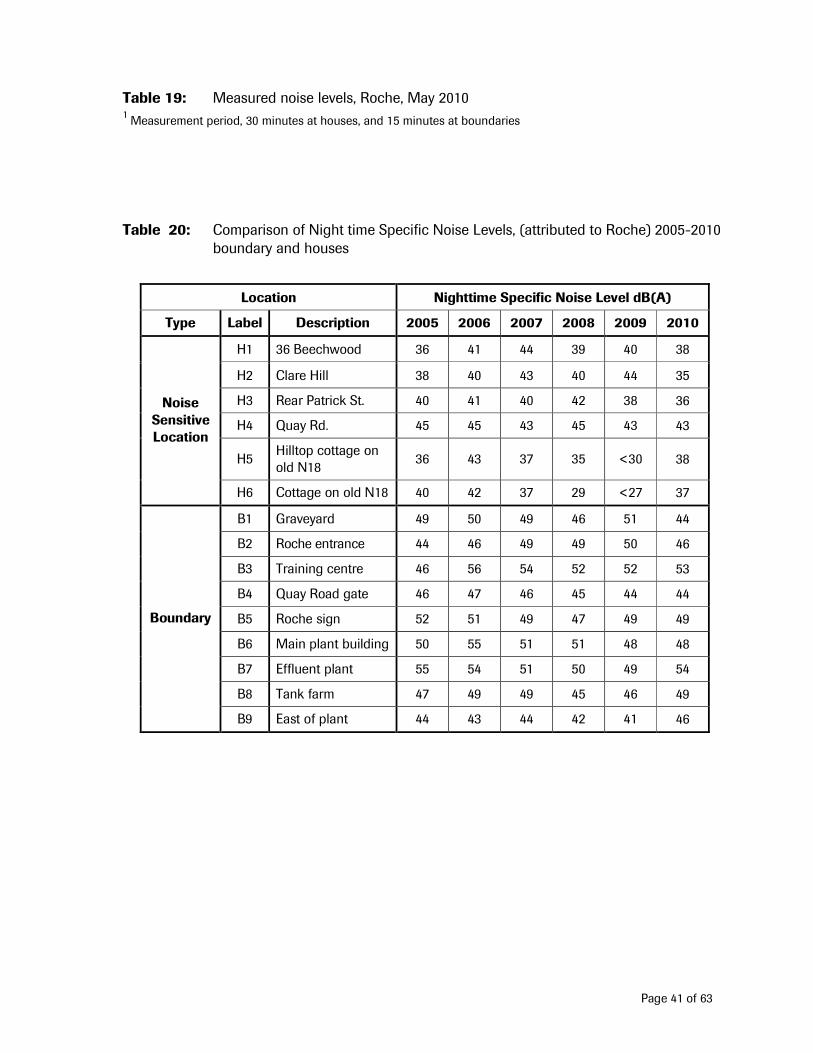
11.5 Comparison with Previous Years
A comparison between the night time noise levels attributed to the Roche plant from 2005 to 2010 is presented in Table 21
11.6 Tonality/Impulsiveness
There was no clearly audible tonal or impulsive component in the noise at the noise sensitive locations. There were no significant tonal features in the measured third-octave spectra at the noise sensitive locations.
Page 39 of 63
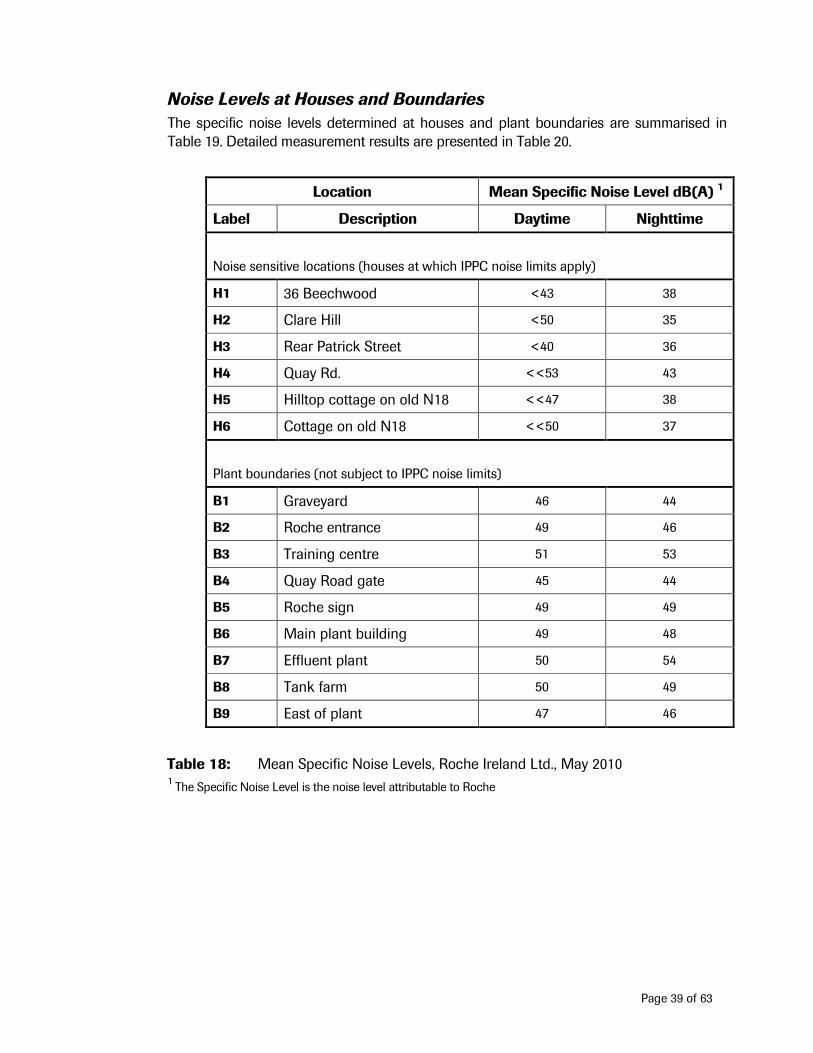
Noise Levels at Houses and Boundaries
The specific noise levels determined at houses and plant boundaries are summarised in Table 19. Detailed measurement results are presented in Table 20.
Location Mean Specific Noise Level dB(A) 1
Label Description Daytime Nighttime
Noise sensitive locations (houses at which IPPC noise limits apply)
H1 36 Beechwood <43 38
H2 Clare Hill <50 35
H3 Rear Patrick Street <40 36
H4 Quay Rd. <<53 43
H5 Hilltop cottage on old N18 <<47 38
H6 Cottage on old N18 <<50 37
Plant boundaries (not subject to IPPC noise limits)
B1 Graveyard 46 44
B2 Roche entrance 49 46
B3 Training centre 51 53
B4 Quay Road gate 45 44
B5 Roche sign 49 49
B6 Main plant building 49 48
B7 Effluent plant 50 54
B8 Tank farm 50 49
B9 East of plant 47 46
Table 18: Mean Specific Noise Levels, Roche Ireland Ltd., May 2010 1 The Specific Noise Level is the noise level attributable to Roche
Page 40 of 63
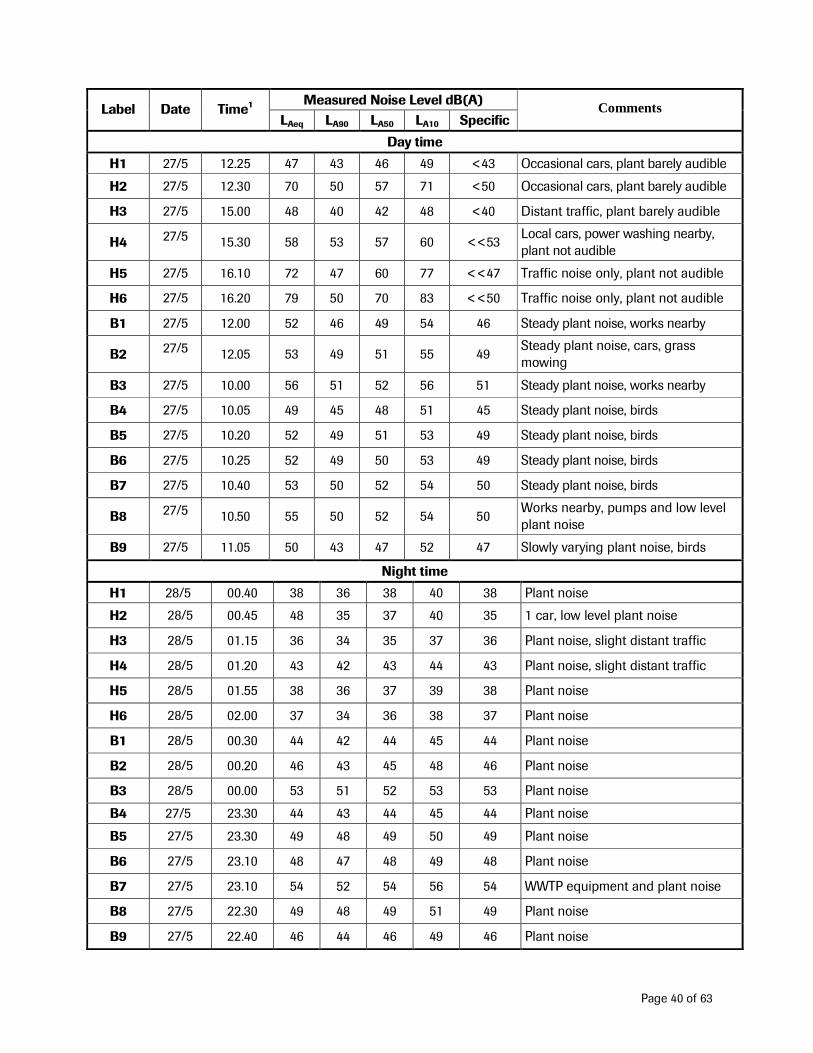
Measured Noise Level dB(A) Label Date Time1
LAeq LA90 LA50 LA10 Specific Comments
Day time
H1 27/5 12.25 47 43 46 49 <43 Occasional cars, plant barely audible
H2 27/5 12.30 70 50 57 71 <50 Occasional cars, plant barely audible
H3 27/5 15.00 48 40 42 48 <40 Distant traffic, plant barely audible
H4 27/5 15.30 58 53 57 60 <<53 Local cars, power washing nearby, plant not audible
H5 27/5 16.10 72 47 60 77 <<47 Traffic noise only, plant not audible
H6 27/5 16.20 79 50 70 83 <<50 Traffic noise only, plant not audible
B1 27/5 12.00 52 46 49 54 46 Steady plant noise, works nearby
B2 27/5 12.05 53 49 51 55 49 Steady plant noise, cars, grass mowing
B3 27/5 10.00 56 51 52 56 51 Steady plant noise, works nearby
B4 27/5 10.05 49 45 48 51 45 Steady plant noise, birds
B5 27/5 10.20 52 49 51 53 49 Steady plant noise, birds
B6 27/5 10.25 52 49 50 53 49 Steady plant noise, birds
B7 27/5 10.40 53 50 52 54 50 Steady plant noise, birds
B8 27/5 10.50 55 50 52 54 50 Works nearby, pumps and low level plant noise
B9 27/5 11.05 50 43 47 52 47 Slowly varying plant noise, birds
Night time
H1 28/5 00.40 38 36 38 40 38 Plant noise
H2 28/5 00.45 48 35 37 40 35 1 car, low level plant noise
H3 28/5 01.15 36 34 35 37 36 Plant noise, slight distant traffic
H4 28/5 01.20 43 42 43 44 43 Plant noise, slight distant traffic
H5 28/5 01.55 38 36 37 39 38 Plant noise
H6 28/5 02.00 37 34 36 38 37 Plant noise
B1 28/5 00.30 44 42 44 45 44 Plant noise
B2 28/5 00.20 46 43 45 48 46 Plant noise
B3 28/5 00.00 53 51 52 53 53 Plant noise
B4 27/5 23.30 44 43 44 45 44 Plant noise
B5 27/5 23.30 49 48 49 50 49 Plant noise
B6 27/5 23.10 48 47 48 49 48 Plant noise
B7 27/5 23.10 54 52 54 56 54 WWTP equipment and plant noise
B8 27/5 22.30 49 48 49 51 49 Plant noise
B9 27/5 22.40 46 44 46 49 46 Plant noise
Page 41 of 63
Table 19: Measured noise levels, Roche, May 2010 1 Measurement period, 30 minutes at houses, and 15 minutes at boundaries
Table 20: Comparison of Night time Specific Noise Levels, (attributed to Roche) 2005-2010 boundary and houses
Location Nighttime Specific Noise Level dB(A)
Type Label Description 2005 2006 2007 2008 2009 2010
H1 36 Beechwood 36 41 44 39 40 38
H2 Clare Hill 38 40 43 40 44 35
H3 Rear Patrick St. 40 41 40 42 38 36
H4 Quay Rd. 45 45 43 45 43 43
H5 Hilltop cottage on old N18
36 43 37 35 <30 38
Noise Sensitive Location
H6 Cottage on old N18 40 42 37 29 <27 37
B1 Graveyard 49 50 49 46 51 44
B2 Roche entrance 44 46 49 49 50 46
B3 Training centre 46 56 54 52 52 53
B4 Quay Road gate 46 47 46 45 44 44
B5 Roche sign 52 51 49 47 49 49
B6 Main plant building 50 55 51 51 48 48
B7 Effluent plant 55 54 51 50 49 54
B8 Tank farm 47 49 49 45 46 49
Boundary
B9 East of plant 44 43 44 42 41 46
Page 42 of 63
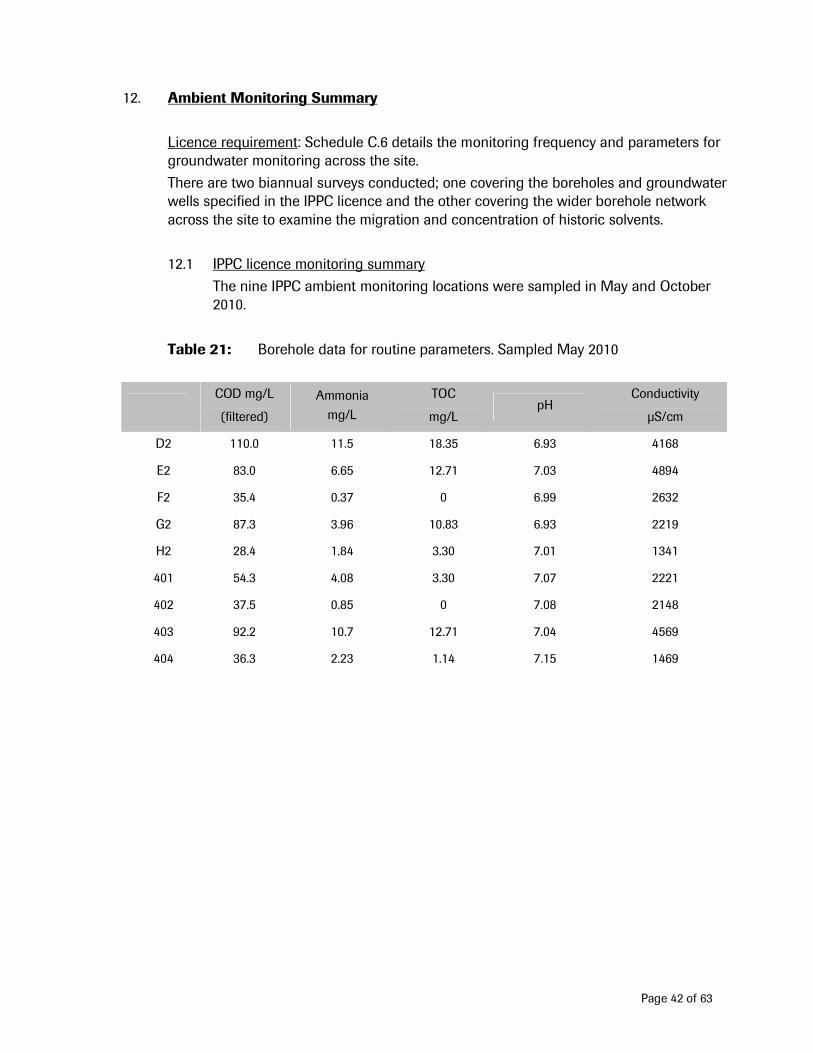
12. Ambient Monitoring Summary
Licence requirement: Schedule C.6 details the monitoring frequency and parameters for groundwater monitoring across the site.
There are two biannual surveys conducted; one covering the boreholes and groundwater wells specified in the IPPC licence and the other covering the wider borehole network across the site to examine the migration and concentration of historic solvents.
12.1 IPPC licence monitoring summary
The nine IPPC ambient monitoring locations were sampled in May and October 2010.
Table 21: Borehole data for routine parameters. Sampled May 2010
COD mg/L
(filtered)
Ammonia
mg/L
TOC
mg/L pH
Conductivity
µS/cm
D2 110.0 11.5 18.35 6.93 4168
E2 83.0 6.65 12.71 7.03 4894
F2 35.4 0.37 0 6.99 2632
G2 87.3 3.96 10.83 6.93 2219
H2 28.4 1.84 3.30 7.01 1341
401 54.3 4.08 3.30 7.07 2221
402 37.5 0.85 0 7.08 2148
403 92.2 10.7 12.71 7.04 4569
404 36.3 2.23 1.14 7.15 1469
Page 43 of 63
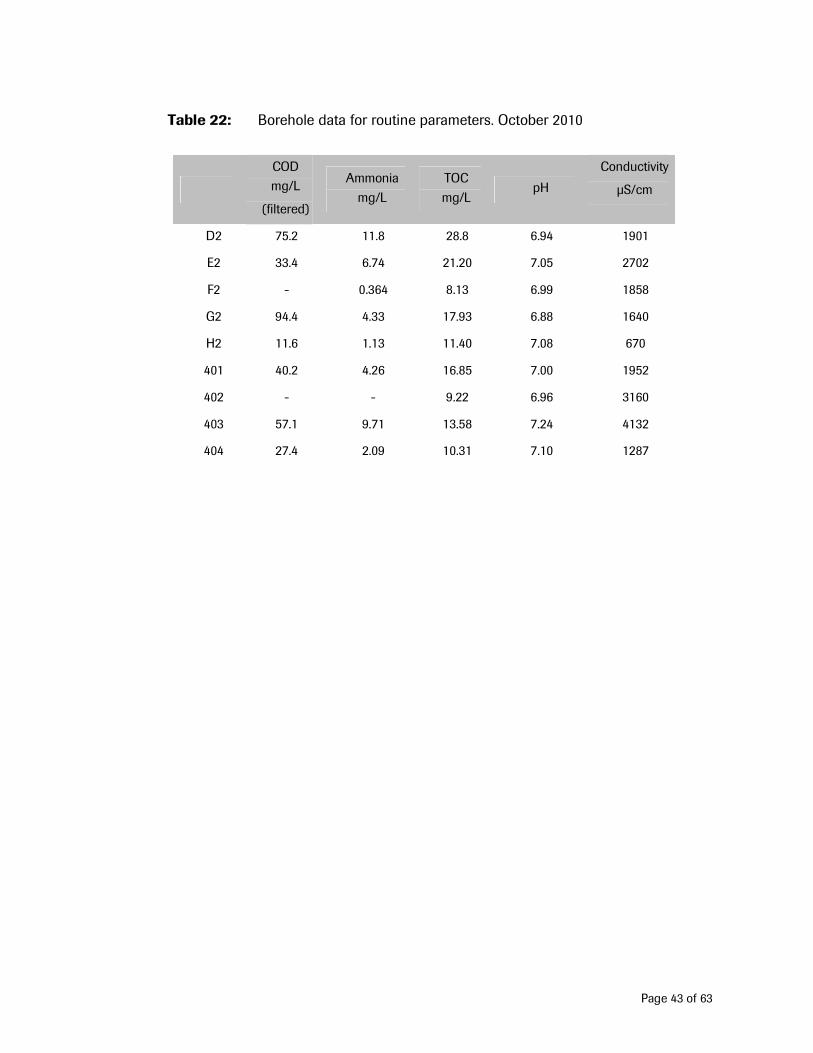
Table 22: Borehole data for routine parameters. October 2010
COD
mg/L
(filtered)
Ammonia
mg/L
TOC
mg/L pH
Conductivity
µS/cm
D2 75.2 11.8 28.8 6.94 1901
E2 33.4 6.74 21.20 7.05 2702
F2 - 0.364 8.13 6.99 1858
G2 94.4 4.33 17.93 6.88 1640
H2 11.6 1.13 11.40 7.08 670
401 40.2 4.26 16.85 7.00 1952
402 - - 9.22 6.96 3160
403 57.1 9.71 13.58 7.24 4132
404 27.4 2.09 10.31 7.10 1287
Page 44 of 63
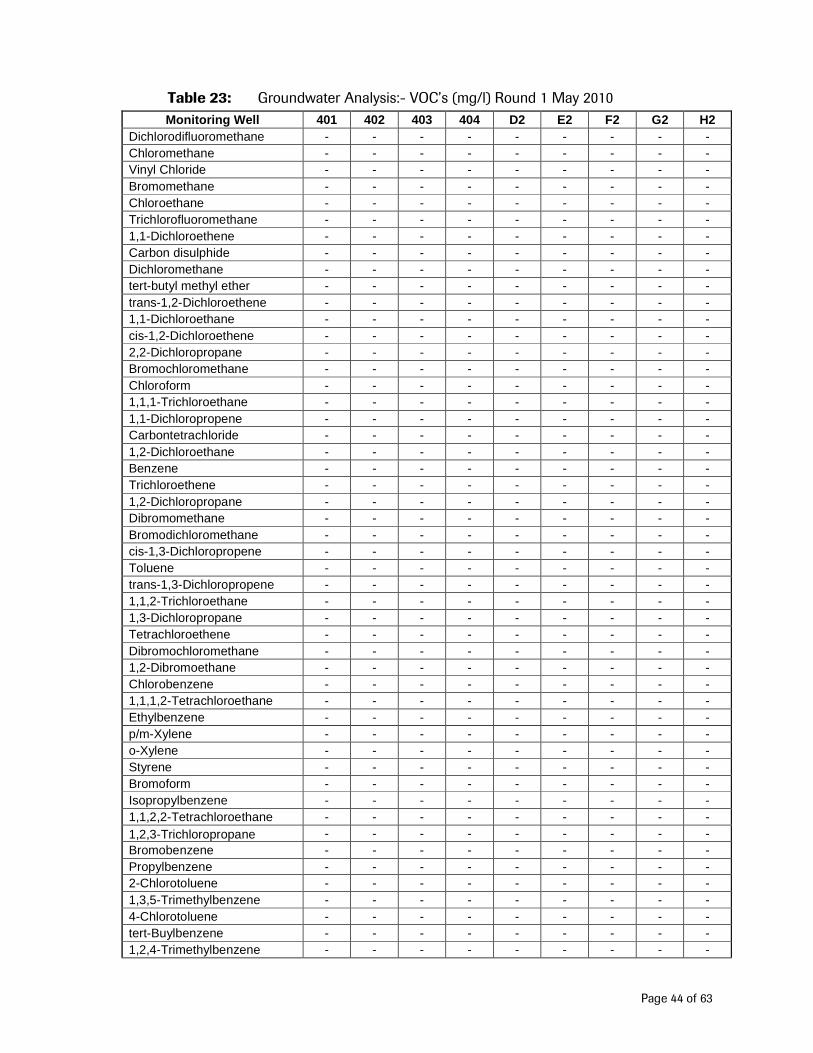
Table 23: Groundwater Analysis:- VOC’s (mg/l) Round 1 May 2010
Monitoring Well 401 402 403 404 D2 E2 F2 G2 H2 Dichlorodifluoromethane - - - - - - - - - Chloromethane - - - - - - - - - Vinyl Chloride - - - - - - - - - Bromomethane - - - - - - - - - Chloroethane - - - - - - - - - Trichlorofluoromethane - - - - - - - - - 1,1-Dichloroethene - - - - - - - - - Carbon disulphide - - - - - - - - - Dichloromethane - - - - - - - - - tert-butyl methyl ether - - - - - - - - - trans-1,2-Dichloroethene - - - - - - - - - 1,1-Dichloroethane - - - - - - - - - cis-1,2-Dichloroethene - - - - - - - - - 2,2-Dichloropropane - - - - - - - - - Bromochloromethane - - - - - - - - - Chloroform - - - - - - - - - 1,1,1-Trichloroethane - - - - - - - - - 1,1-Dichloropropene - - - - - - - - - Carbontetrachloride - - - - - - - - - 1,2-Dichloroethane - - - - - - - - - Benzene - - - - - - - - - Trichloroethene - - - - - - - - - 1,2-Dichloropropane - - - - - - - - - Dibromomethane - - - - - - - - - Bromodichloromethane - - - - - - - - - cis-1,3-Dichloropropene - - - - - - - - - Toluene - - - - - - - - - trans-1,3-Dichloropropene - - - - - - - - - 1,1,2-Trichloroethane - - - - - - - - - 1,3-Dichloropropane - - - - - - - - - Tetrachloroethene - - - - - - - - - Dibromochloromethane - - - - - - - - - 1,2-Dibromoethane - - - - - - - - - Chlorobenzene - - - - - - - - - 1,1,1,2-Tetrachloroethane - - - - - - - - - Ethylbenzene - - - - - - - - - p/m-Xylene - - - - - - - - - o-Xylene - - - - - - - - - Styrene - - - - - - - - - Bromoform - - - - - - - - - Isopropylbenzene - - - - - - - - - 1,1,2,2-Tetrachloroethane - - - - - - - - - 1,2,3-Trichloropropane - - - - - - - - - Bromobenzene - - - - - - - - - Propylbenzene - - - - - - - - - 2-Chlorotoluene - - - - - - - - - 1,3,5-Trimethylbenzene - - - - - - - - - 4-Chlorotoluene - - - - - - - - - tert-Buylbenzene - - - - - - - - - 1,2,4-Trimethylbenzene - - - - - - - - -
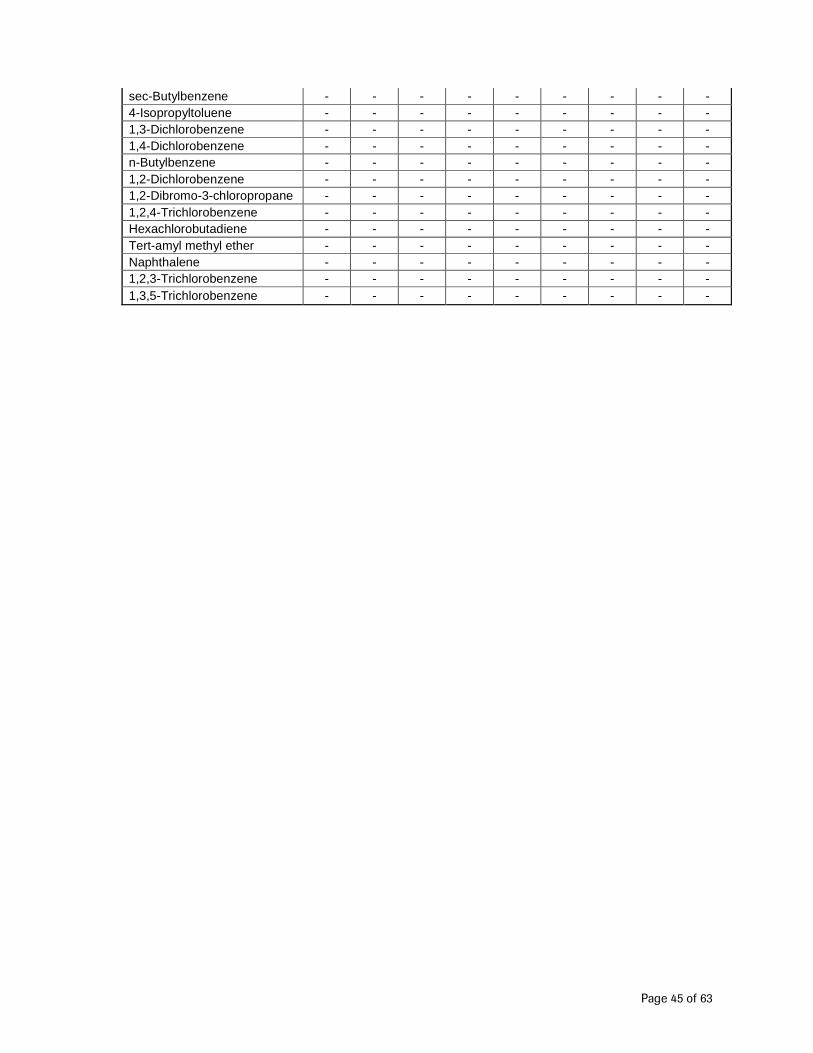
Page 45 of 63
sec-Butylbenzene - - - - - - - - - 4-Isopropyltoluene - - - - - - - - - 1,3-Dichlorobenzene - - - - - - - - - 1,4-Dichlorobenzene - - - - - - - - - n-Butylbenzene - - - - - - - - - 1,2-Dichlorobenzene - - - - - - - - - 1,2-Dibromo-3-chloropropane - - - - - - - - - 1,2,4-Trichlorobenzene - - - - - - - - - Hexachlorobutadiene - - - - - - - - - Tert-amyl methyl ether - - - - - - - - - Naphthalene - - - - - - - - - 1,2,3-Trichlorobenzene - - - - - - - - - 1,3,5-Trichlorobenzene - - - - - - - - -

Page 46 of 63
Table 24: Groundwater Analysis :- Semi volatiles (mg/l) Round 1 May 2010
Monitoring Well 401 402 403 404 D2 E2 F2 G2 H2 Acenaphthene - - - - - - - - - Acenaphthylene - - - - - - - - - Anthracene - - - - - - - - - Azobenzene - - - - - - - - - Benzo(a)anthracene - - - - - - - - - Benzo(a)pyrene - - - - - - - - - Benzo(b)fluoranthene - - - - - - - - - Benzo(ghi)perylene - - - - - - - - - Benzo(k)fluoranthene - - - - - - - - -
Bis(2-chloroethoxy)methane - - - - - - - - -
Bis(2-chloroethyl)ether - - - - - - - - - Bis(2-ethylhexyl)phthalate - - - - - - - - -
4- Bromophenylphenylether - - - - - - - - - Butylbenzylphthalate - - - - - - - - - Carbazole - - - - - - - - -
4- Chloro-3-methylphenol - - - - - - - - - 4- Chloroaniline - - - - - - - - - 2- Chloronaphthalene - - - - - - - - - 2- Chlorophenol - - - - - - - - - 4- Chlorophenylphenylether - - - - - - - - -
Chrysene - - - - - - - - - Dibenzo(a,h)anthracene - - - - - - - - - Dibenzofuran - - - - - - - - -
1,2- Dichlorobenzene - - - - - - - - - 1,3- Dichlorobenzene - - - - - - - - - 1,4- Dichlorobenzene - - - - - - - - - 2,4- Dichlorophenol - - - - - - - - -
Diethyl phthalate - - - - - - - - - Dimethyl phthalate - - - - - - - - -
2,4- Dimethylphenol - - - - - - - - - Di-n-butylphthalate - - - - - - - - -
2,4- Dinitrotoluene - - - - - - - - - 2,6- Dinitrotoluene - - - - - - - - -
Di-n-octylphthalate - - - - - - - - - Fluoranthene - - - - - - - - - Fluorene - - - - - - - - - Hexachlorobenzene - - - - - - - - - Hexachlorobutadiene - - - - - - - - - Hexachloroethane - - - - - - - - - Hexchlorocyclopentadiene - - - - - - - - - Indeno(123-cd)Pyrene - - - - - - - - - Isophorone - - - - - - - - -
2- Methylnaphthalene - - - - - - - - - 2- Methylphenol - - - - - - - - - 4- Methylphenol - - - - - - - - -
Naphthalene - - - - - - - - - 2- Nitroanaline - - - - - - - - - 3- Nitroaniline - - - - - - - - -
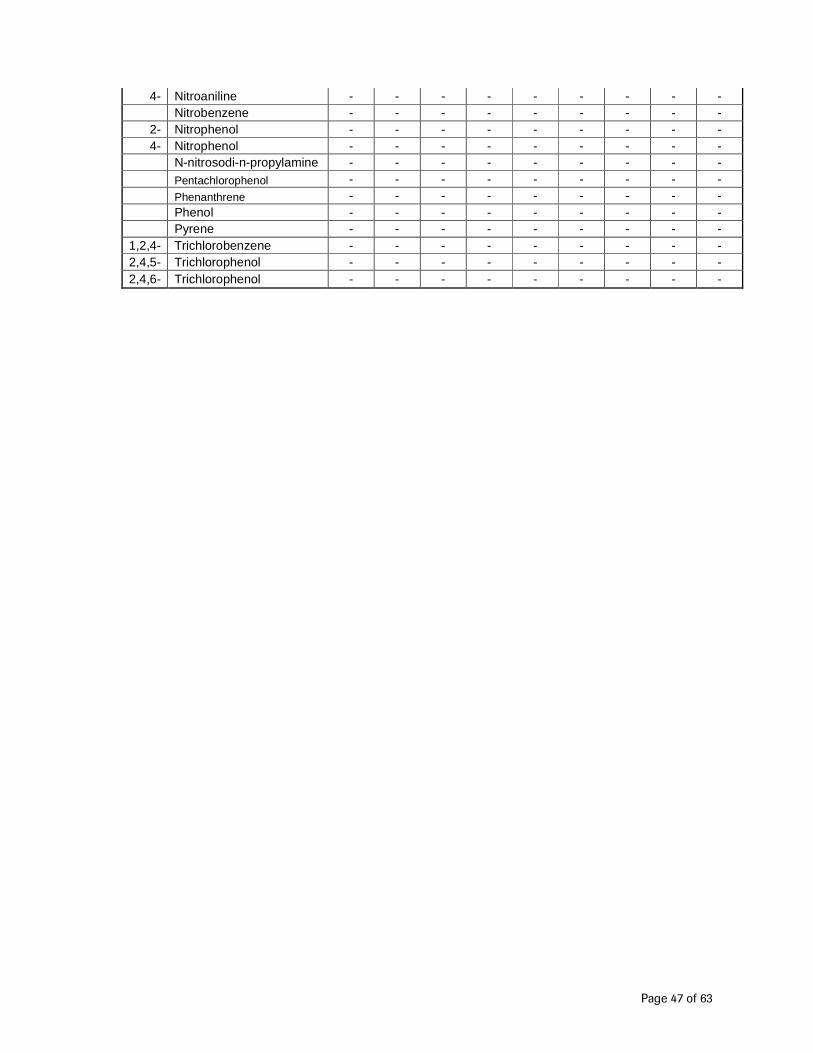
Page 47 of 63
4- Nitroaniline - - - - - - - - - Nitrobenzene - - - - - - - - -
2- Nitrophenol - - - - - - - - - 4- Nitrophenol - - - - - - - - -
N-nitrosodi-n-propylamine - - - - - - - - - Pentachlorophenol - - - - - - - - - Phenanthrene - - - - - - - - - Phenol - - - - - - - - - Pyrene - - - - - - - - -
1,2,4- Trichlorobenzene - - - - - - - - - 2,4,5- Trichlorophenol - - - - - - - - - 2,4,6- Trichlorophenol - - - - - - - - -
Page 48 of 63
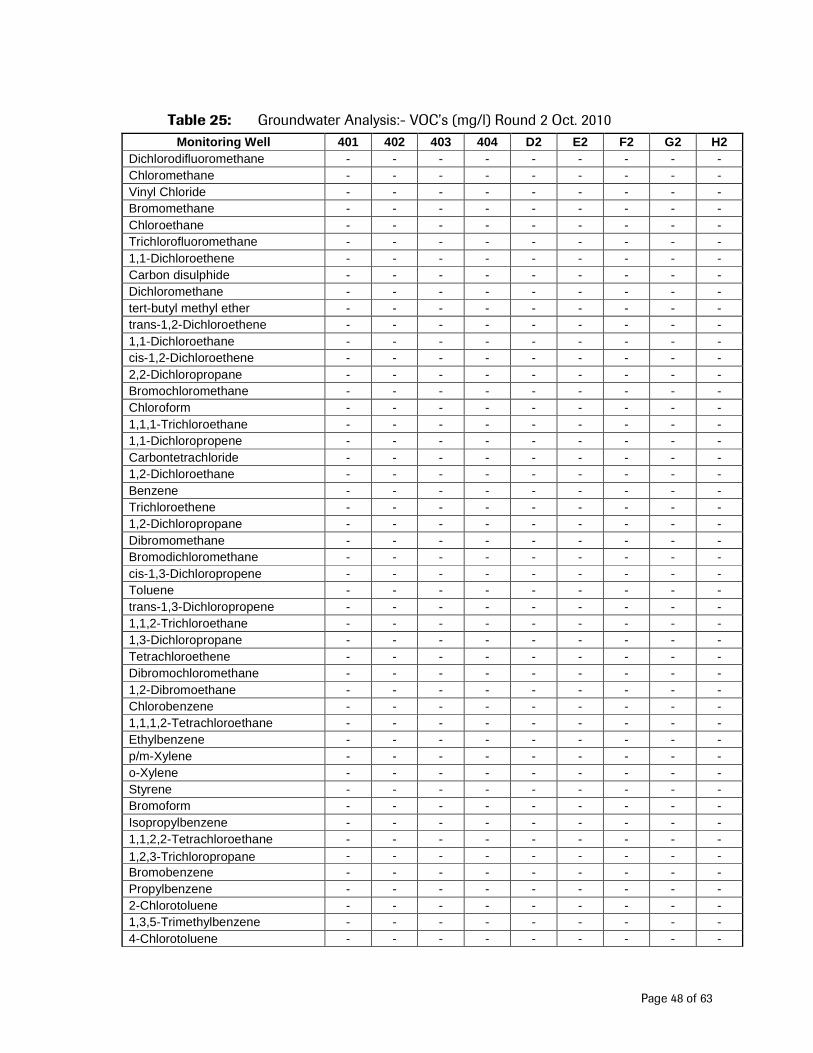
Table 25: Groundwater Analysis:- VOC’s (mg/l) Round 2 Oct. 2010
Monitoring Well 401 402 403 404 D2 E2 F2 G2 H2 Dichlorodifluoromethane - - - - - - - - - Chloromethane - - - - - - - - - Vinyl Chloride - - - - - - - - - Bromomethane - - - - - - - - - Chloroethane - - - - - - - - - Trichlorofluoromethane - - - - - - - - - 1,1-Dichloroethene - - - - - - - - - Carbon disulphide - - - - - - - - - Dichloromethane - - - - - - - - - tert-butyl methyl ether - - - - - - - - - trans-1,2-Dichloroethene - - - - - - - - - 1,1-Dichloroethane - - - - - - - - - cis-1,2-Dichloroethene - - - - - - - - - 2,2-Dichloropropane - - - - - - - - - Bromochloromethane - - - - - - - - - Chloroform - - - - - - - - - 1,1,1-Trichloroethane - - - - - - - - - 1,1-Dichloropropene - - - - - - - - - Carbontetrachloride - - - - - - - - - 1,2-Dichloroethane - - - - - - - - - Benzene - - - - - - - - - Trichloroethene - - - - - - - - - 1,2-Dichloropropane - - - - - - - - - Dibromomethane - - - - - - - - - Bromodichloromethane - - - - - - - - - cis-1,3-Dichloropropene - - - - - - - - - Toluene - - - - - - - - - trans-1,3-Dichloropropene - - - - - - - - - 1,1,2-Trichloroethane - - - - - - - - - 1,3-Dichloropropane - - - - - - - - - Tetrachloroethene - - - - - - - - - Dibromochloromethane - - - - - - - - - 1,2-Dibromoethane - - - - - - - - - Chlorobenzene - - - - - - - - - 1,1,1,2-Tetrachloroethane - - - - - - - - - Ethylbenzene - - - - - - - - - p/m-Xylene - - - - - - - - - o-Xylene - - - - - - - - - Styrene - - - - - - - - - Bromoform - - - - - - - - - Isopropylbenzene - - - - - - - - - 1,1,2,2-Tetrachloroethane - - - - - - - - - 1,2,3-Trichloropropane - - - - - - - - - Bromobenzene - - - - - - - - - Propylbenzene - - - - - - - - - 2-Chlorotoluene - - - - - - - - - 1,3,5-Trimethylbenzene - - - - - - - - - 4-Chlorotoluene - - - - - - - - -
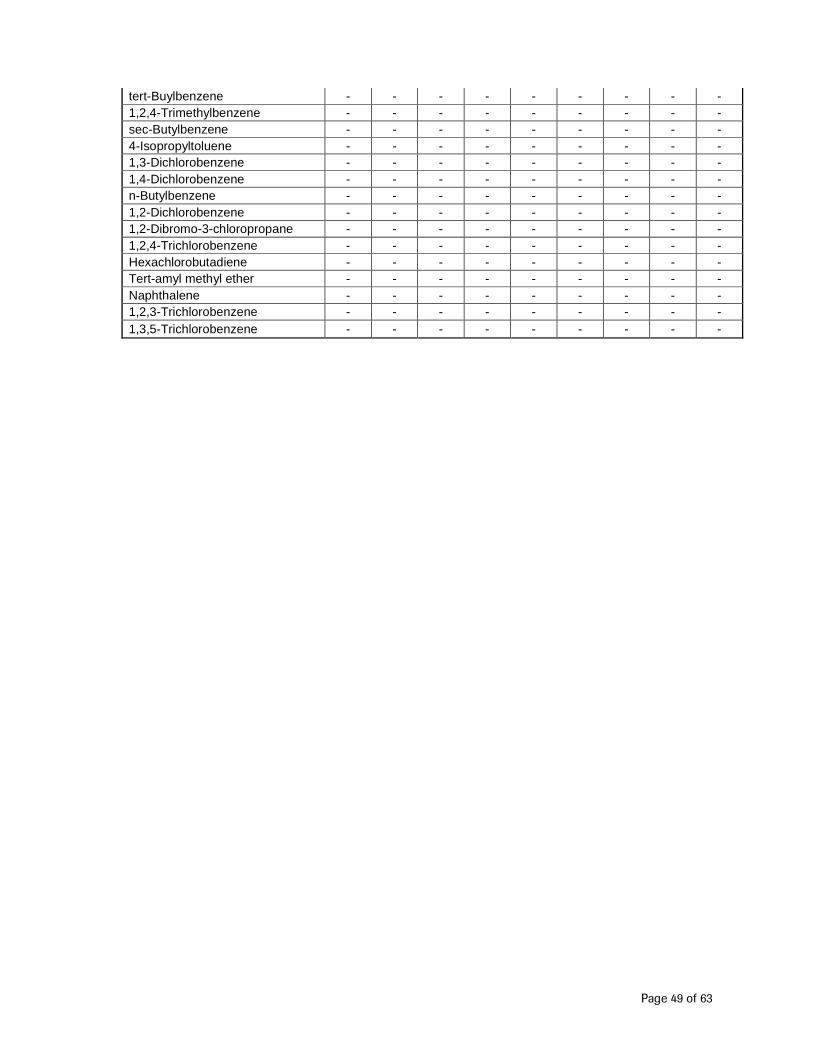
Page 49 of 63
tert-Buylbenzene - - - - - - - - - 1,2,4-Trimethylbenzene - - - - - - - - - sec-Butylbenzene - - - - - - - - - 4-Isopropyltoluene - - - - - - - - - 1,3-Dichlorobenzene - - - - - - - - - 1,4-Dichlorobenzene - - - - - - - - - n-Butylbenzene - - - - - - - - - 1,2-Dichlorobenzene - - - - - - - - - 1,2-Dibromo-3-chloropropane - - - - - - - - - 1,2,4-Trichlorobenzene - - - - - - - - - Hexachlorobutadiene - - - - - - - - - Tert-amyl methyl ether - - - - - - - - - Naphthalene - - - - - - - - - 1,2,3-Trichlorobenzene - - - - - - - - - 1,3,5-Trichlorobenzene - - - - - - - - -
Page 50 of 63
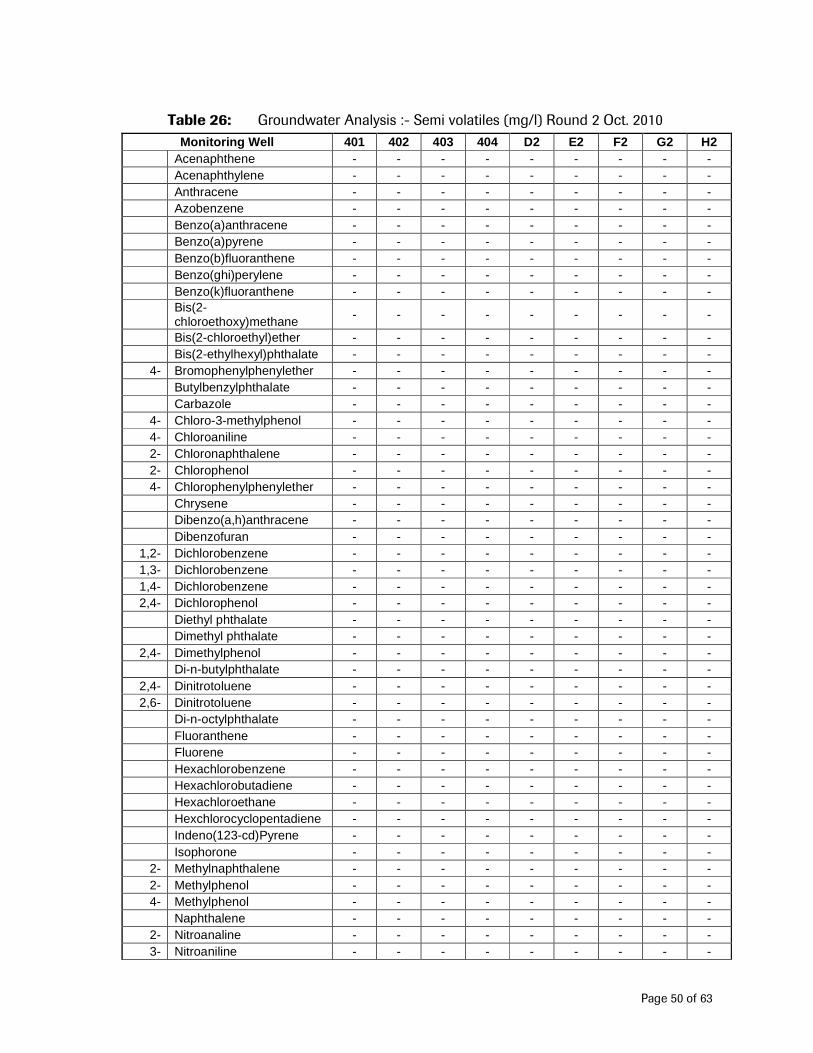
Table 26: Groundwater Analysis :- Semi volatiles (mg/l) Round 2 Oct. 2010
Monitoring Well 401 402 403 404 D2 E2 F2 G2 H2 Acenaphthene - - - - - - - - - Acenaphthylene - - - - - - - - - Anthracene - - - - - - - - - Azobenzene - - - - - - - - - Benzo(a)anthracene - - - - - - - - - Benzo(a)pyrene - - - - - - - - - Benzo(b)fluoranthene - - - - - - - - - Benzo(ghi)perylene - - - - - - - - - Benzo(k)fluoranthene - - - - - - - - -
Bis(2-chloroethoxy)methane - - - - - - - - -
Bis(2-chloroethyl)ether - - - - - - - - - Bis(2-ethylhexyl)phthalate - - - - - - - - -
4- Bromophenylphenylether - - - - - - - - - Butylbenzylphthalate - - - - - - - - - Carbazole - - - - - - - - -
4- Chloro-3-methylphenol - - - - - - - - - 4- Chloroaniline - - - - - - - - - 2- Chloronaphthalene - - - - - - - - - 2- Chlorophenol - - - - - - - - - 4- Chlorophenylphenylether - - - - - - - - -
Chrysene - - - - - - - - - Dibenzo(a,h)anthracene - - - - - - - - - Dibenzofuran - - - - - - - - -
1,2- Dichlorobenzene - - - - - - - - - 1,3- Dichlorobenzene - - - - - - - - - 1,4- Dichlorobenzene - - - - - - - - - 2,4- Dichlorophenol - - - - - - - - -
Diethyl phthalate - - - - - - - - - Dimethyl phthalate - - - - - - - - -
2,4- Dimethylphenol - - - - - - - - - Di-n-butylphthalate - - - - - - - - -
2,4- Dinitrotoluene - - - - - - - - - 2,6- Dinitrotoluene - - - - - - - - -
Di-n-octylphthalate - - - - - - - - - Fluoranthene - - - - - - - - - Fluorene - - - - - - - - - Hexachlorobenzene - - - - - - - - - Hexachlorobutadiene - - - - - - - - - Hexachloroethane - - - - - - - - - Hexchlorocyclopentadiene - - - - - - - - - Indeno(123-cd)Pyrene - - - - - - - - - Isophorone - - - - - - - - -
2- Methylnaphthalene - - - - - - - - - 2- Methylphenol - - - - - - - - - 4- Methylphenol - - - - - - - - -
Naphthalene - - - - - - - - - 2- Nitroanaline - - - - - - - - - 3- Nitroaniline - - - - - - - - -

Page 51 of 63
4- Nitroaniline - - - - - - - - - Nitrobenzene - - - - - - - - -
2- Nitrophenol - - - - - - - - - 4- Nitrophenol - - - - - - - - -
N-nitrosodi-n-propylamine - - - - - - - - - Pentachlorophenol - - - - - - - - - Phenanthrene - - - - - - - - - Phenol - - - - - - - - - Pyrene - - - - - - - - -
1,2,4- Trichlorobenzene - - - - - - - - - 2,4,5- Trichlorophenol - - - - - - - - - 2,4,6- Trichlorophenol - - - - - - - - -
Page 52 of 63
12.2 Groundwater monitoring report on the wider site network
Groundwater from seventeen selected monitoring wells was sampled by URS in May 2010. Sampling was conducted in accordance with strict URS protocol to minimise the risk of cross-contamination between sample events and maintain sample integrity. The samples were analysed for a site specific suite of four compounds – tetrahydrofuran (THF), toluene, dichloromethane (DCM) and acetone.
Compared to previous monitoring results, concentrations of the four site-specific
contaminants in May 2010 have remained relatively low and stable across the site.
The main concentration increases of note between May 2009 and May 2010 were:
THF
Well G2 from 0.056 mg/L to 0.489 mg/L;
Well 21 from 0.179 mg/L to 0.566 mg/L;
Well 514 from 0.173 mg/L to 0.385 mg/L;
Well 702 from 0.446 mg/L to 0.773 mg/L.
Toluene
Well 216 from 40 mg/L to 163 mg/L;
Well 22 from <0.001 mg/L to 4.23 mg/L.
DCM
Well 216 from <0.003 mg/L to 13.8 mg/L.
The main concentration decreases of note in May 2010 were:
THF
Well 216 from 1.004 mg/L to <0.01 mg/L;
Well 308 from 0.058 mg/L to <0.01 mg/L;
Well 302 from 2.032 mg/L to 1.67 mg/L.
Toluene
Well 301 from 3.5 mg/L to 0.252 mg/L.
The following points summarise the May 2010 hydraulic containment monitoring round results:
Acetone was below reporting limits in all monitoring wells across the site, suggesting that the net flux of acetone to the River Fergus via groundwater flow in May 2010 is zero.

Page 53 of 63
DCM was detected in well 216 only in May 2010, which is located within the Nature Area and some distance from the site boundary with the River Fergus, therefore the net flux of DCM to the river in May 2010 is considered to be zero.
Concentrations of toluene ranged from below the method reporting limit (wells 21,
205, 207, 308, 401, 402, 403, 404, 514, 517, 702, D2 and G2) to 163 mg/L (well 216 in the H2 landfill area). In the Production Area, toluene was detected in wells 301 and 302 at concentrations of 0.252 mg/L and 24.4 mg/L respectively.
Toluene was detected in one well down gradient of the Waste Water Treatment Area, well 22 at 4.23 mg/L.
The low concentrations of toluene detected (generally 0.001 mg/L or less) along the down gradient site boundary in May 2010 suggest that toluene is being attenuated by biodegradation and/or sorption along the groundwater flow path to the site boundary. The net flux of toluene to the River Fergus via groundwater flow is therefore inferred to be negligible in May 2010.
Concentrations of THF ranged from below the method reporting limit (wells 22, 205, 207, 216, 308, 402, 403 and 404) to 1.67 mg/L (well 302) in the Production Area.
The majority of THF detections were in the Landfill and Nature Area, where
concentrations up to 1.03 mg/L were recorded.
Whilst THF is not adsorbed or biodegraded as readily as toluene, in May 2010 it was not detected in groundwater from any monitoring well along the down-gradient site boundary, therefore the net flux of THF to the river in May 2010 is considered to be zero.
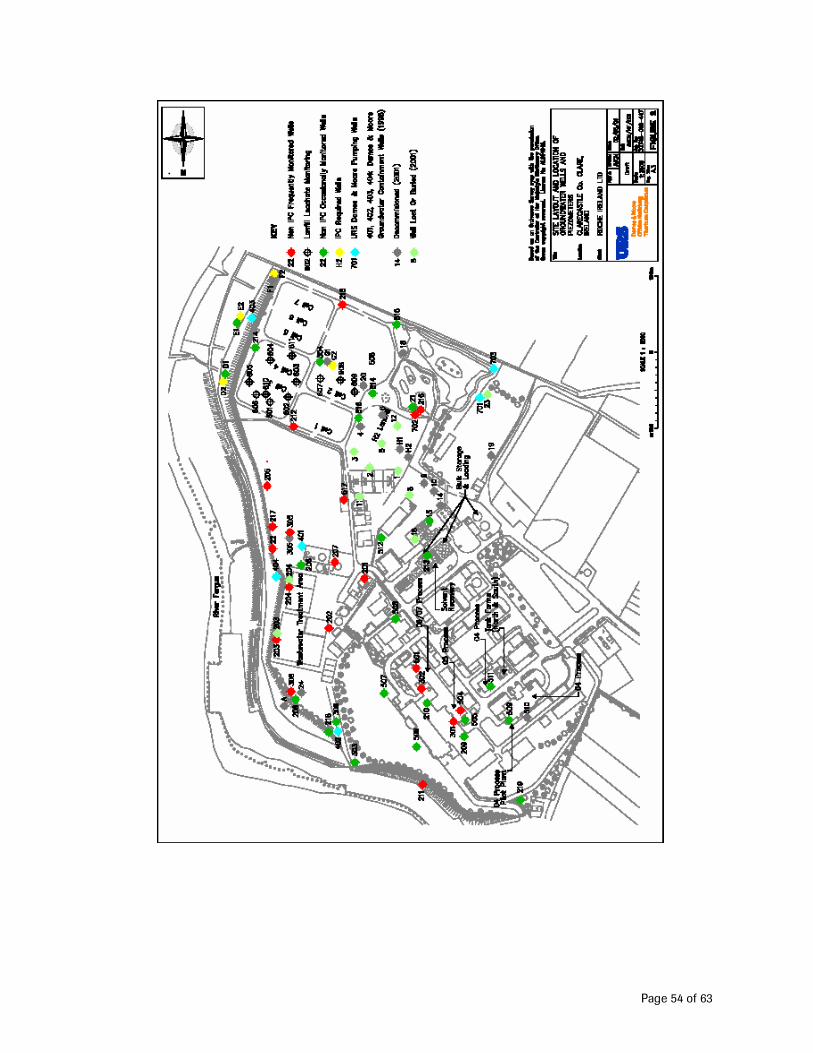
Page 54 of 63
.
Page 55 of 63
13 Tank and Pipeline Testing and Inspection Report
Underground Storm water/Foul Sewer Inspection Pipe Relining / Repairs at Roche Ireland. The foul sewer drainage system was improved and repaired during 2010. The repairs/improvements were identified during a 2009 CCTV underground survey. This mainly consisted of high pressure washing and patching/relining of foul lines. This was a planned undertaking in line with the three year rolling plan for all underground services.
14 Bund Test Report An inspection strategy is in place to inspect every concrete containment bund for leak tightness and mechanical integrity. This is carried out on an annual basis & the schedule was fully complied with. No issues of failed integrity were found.
15 Energy Efficiency
• 2010 Electricity Consumption reduced by 9% • 2010 Natural Gas Consumption significantly reduced despite significant weather related
challenges (HDD significantly up on 2009) • Maintained accreditation to IS EN 16001 • Promoted employee energy awareness week • Hosted SEAI LIEN group meeting • Shortlisted as finalist “Sustainable Energy Efficiency Award~ Large Industry” by SEI • Awarded corporate excellence award for our energy reduction plans 2009-2014
2011 Initiatives/Plan
• Develop “Utilities on demand” concept further and implement any opportunities that arise
• Repeat Steam trap survey and continue to improve thermal efficiencies
• Quarterly Compressed Air/N2 leak survey using Ultrasonic Technology
• Continue with occupancy lighting switches.
• Incinerator at 850 C.
• Maintain accreditation to Energy Management System EN 16001
• Continue with Employee suggestion scheme & implement opportunities as they arise
• Continue to optimize and reduce air change rates in production plants
• Improve condensate return efficiencies
• Improve heat recovery from exhausted HVAC
• Install aeration cell off gas heating to incinerator
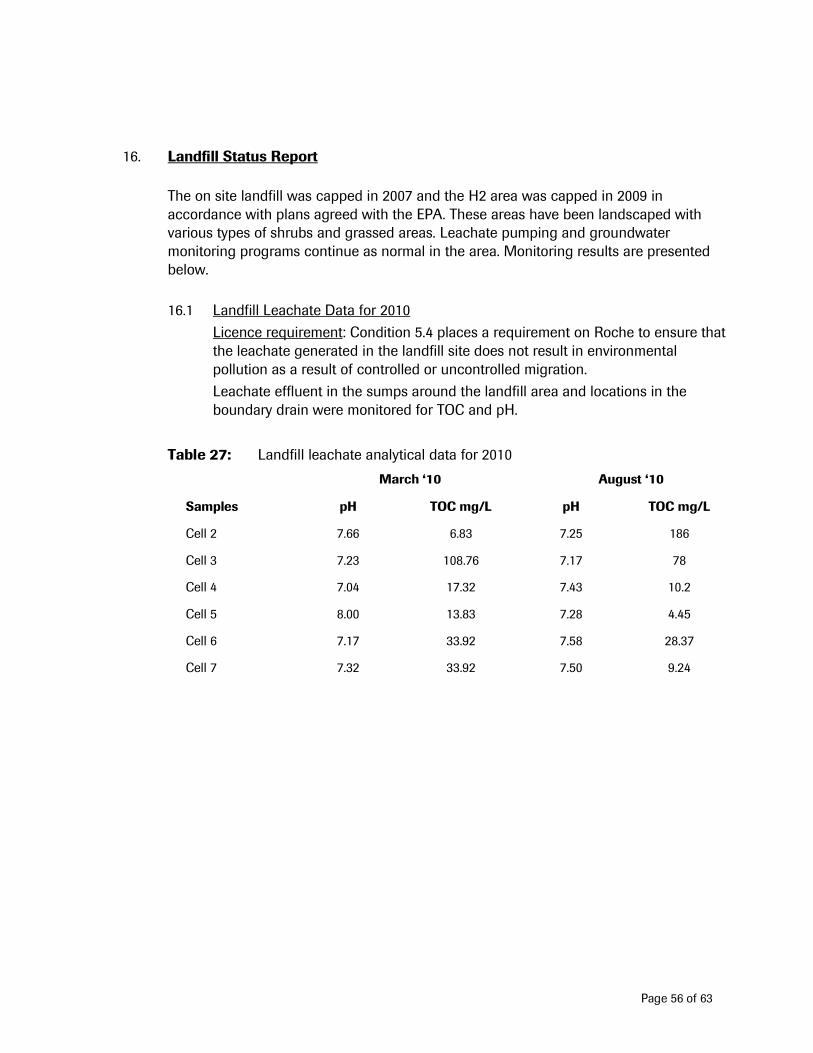
Page 56 of 63
16. Landfill Status Report
The on site landfill was capped in 2007 and the H2 area was capped in 2009 in accordance with plans agreed with the EPA. These areas have been landscaped with various types of shrubs and grassed areas. Leachate pumping and groundwater monitoring programs continue as normal in the area. Monitoring results are presented below.
16.1 Landfill Leachate Data for 2010
Licence requirement: Condition 5.4 places a requirement on Roche to ensure that the leachate generated in the landfill site does not result in environmental pollution as a result of controlled or uncontrolled migration.
Leachate effluent in the sumps around the landfill area and locations in the boundary drain were monitored for TOC and pH.
Table 27: Landfill leachate analytical data for 2010
March ‘10 August ‘10
Samples pH TOC mg/L pH TOC mg/L
Cell 2 7.66 6.83 7.25 186
Cell 3 7.23 108.76 7.17 78
Cell 4 7.04 17.32 7.43 10.2
Cell 5 8.00 13.83 7.28 4.45
Cell 6 7.17 33.92 7.58 28.37
Cell 7 7.32 33.92 7.50 9.24
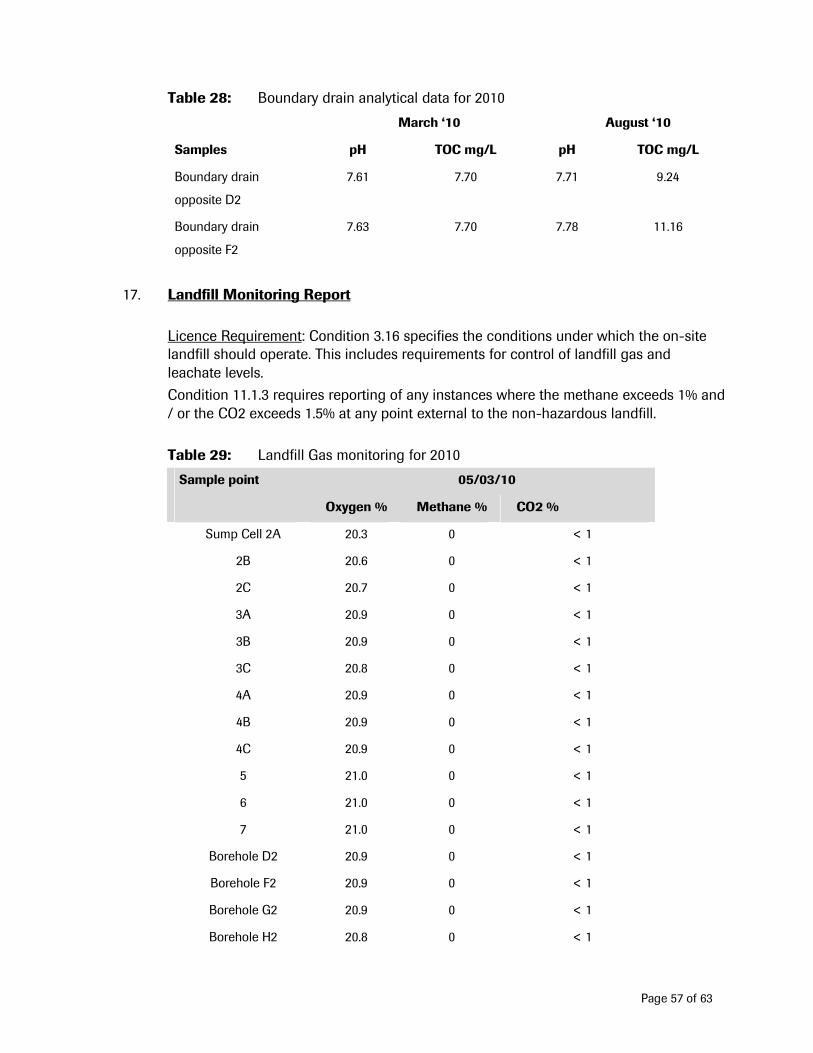
Page 57 of 63
Table 28: Boundary drain analytical data for 2010
March ‘10 August ‘10
Samples pH TOC mg/L pH TOC mg/L
Boundary drain
opposite D2
7.61 7.70 7.71 9.24
Boundary drain
opposite F2
7.63 7.70 7.78 11.16
17. Landfill Monitoring Report
Licence Requirement: Condition 3.16 specifies the conditions under which the on-site landfill should operate. This includes requirements for control of landfill gas and leachate levels.
Condition 11.1.3 requires reporting of any instances where the methane exceeds 1% and / or the CO2 exceeds 1.5% at any point external to the non-hazardous landfill.
Table 29: Landfill Gas monitoring for 2010
Sample point 05/03/10
Oxygen % Methane % CO2 %
Sump Cell 2A 20.3 0 < 1
2B 20.6 0 < 1
2C 20.7 0 < 1
3A 20.9 0 < 1
3B 20.9 0 < 1
3C 20.8 0 < 1
4A 20.9 0 < 1
4B 20.9 0 < 1
4C 20.9 0 < 1
5 21.0 0 < 1
6 21.0 0 < 1
7 21.0 0 < 1
Borehole D2 20.9 0 < 1
Borehole F2 20.9 0 < 1
Borehole G2 20.9 0 < 1
Borehole H2 20.8 0 < 1
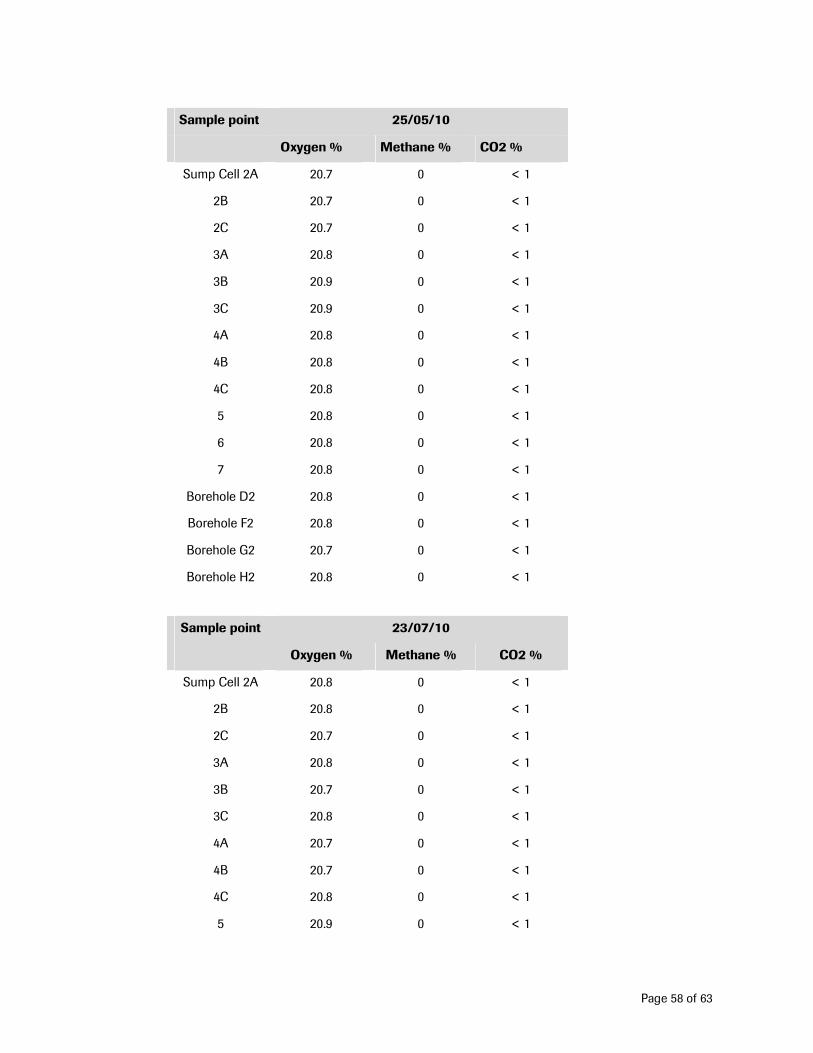
Page 58 of 63
Sample point 25/05/10
Oxygen % Methane % CO2 %
Sump Cell 2A 20.7 0 < 1
2B 20.7 0 < 1
2C 20.7 0 < 1
3A 20.8 0 < 1
3B 20.9 0 < 1
3C 20.9 0 < 1
4A 20.8 0 < 1
4B 20.8 0 < 1
4C 20.8 0 < 1
5 20.8 0 < 1
6 20.8 0 < 1
7 20.8 0 < 1
Borehole D2 20.8 0 < 1
Borehole F2 20.8 0 < 1
Borehole G2 20.7 0 < 1
Borehole H2 20.8 0 < 1
Sample point 23/07/10
Oxygen % Methane % CO2 %
Sump Cell 2A 20.8 0 < 1
2B 20.8 0 < 1
2C 20.7 0 < 1
3A 20.8 0 < 1
3B 20.7 0 < 1
3C 20.8 0 < 1
4A 20.7 0 < 1
4B 20.7 0 < 1
4C 20.8 0 < 1
5 20.9 0 < 1

Page 59 of 63
Sample point 23/07/10
Oxygen % Methane % CO2 %
6 20.9 0 < 1
7 20.8 0 < 1
Borehole D2 20.8 0 < 1
Borehole F2 20.9 0 -
Borehole G2 20.8 0 < 1
Borehole H2 20.8 0 < 1
Sample point 19/11/10
Oxygen % Methane % CO2 %
Sump Cell 2A 20.7 0 < 1
2B 20.7 0 < 1
2C 20.8 0 < 1
3A 20.8 0 < 1
3B 20.8 0 < 1
3C 20.8 0 < 1
4A 20.7 0 < 1
4B 20.7 0 < 1
4C 20.8 0 < 1
5 20.8 0 < 1
6 20.7 0 < 1
7 20.7 0 < 1
Borehole D2 20.8 0 < 1
Borehole F2 20.8 0 < 1
Borehole G2 20.8 0 < 1
Borehole H2 20.7 0 < 1
Page 60 of 63
18. Resource Usage and Reduction Report
18.1 Efficiency of raw material usage in production
A review of raw material efficiency in 2010 is contained in Section 10.2 EMP Review 2010.
The goals around the efficient use of resources and materials for 2011 are contained in the EMP for 2011, section 10.3.
MMF:
Following on from the Kaizen event last year an incremental yield improvement of 0.7% (approx) over the 2009 campaign standard yield was achieved for a large number of batches following procedural changes. A further 1% yield improvement opportunity was identified and this will be implemented in 2011.
Saquinavir:
The Saquinavir process has remained static in 2010 with the same quantities of raw materials required per kg as in 2009.
MEF:
A review of the process during the year resulted in a 3% yield improvement demonstrable over a number of batches. Additional development work has predicted a further 3 – 5% yield opportunity may be achieved.
Orlistat:
An investigation into the quality of one of the process reagents indicates potential to improve the yield for this step by 1% while reducing the quantity of the reagent itself. This will be implemented in the 2011 campaign.
18.2 Water demand and discharge minimisation
Water is used extensively in the manufacturing process to provide either heating or cooling of the production process. The site also uses water for domestic purposes. In 2010 the overall water withdrawal from the public supply decreased from 153,590 m³ in 2008 to 146,007 m³. Ref. Table 16.
19. Environmental Liabilities Risk Assessment Review
19.1 Introduction
The 2006 Environmental Liabilities Risk Assessment estimated potential liabilities associated with operational risks at the Roche facility. Where appropriate, additional mitigation/control measures were recommended with the aim of reducing the potential risk and liability for each hazard. Since 2006, a number of these additional measures have been implemented or examined in detail. Where successful implementation of these measures took place, a reduction in risk score and associated financial liability estimates has occurred.
Page 61 of 63
Condition 12.2 of IPPC licence Reg No. P0012-04 relates to the requirement to complete a fully costed ELRA. Roche appointed RPS as the independent consultant to undertake this work in 2006.
IPPC Condition 12.2 Environmental Liabilities:
12.2.2 ‘The licensee shall arrange for the completion, by an independent and
appropriately qualified consultant, of a comprehensive and fully costed
Environmental Liabilities Risk Assessment (ELRA), which addresses the liabilities
from past and present activities. The assessment shall include those liabilities and
costs identified in Condition 10 for execution of the RMP/CRAMP.
A report on this assessment shall be submitted to them Agency for agreement
within twelve
months of date of grant of this licence. The ELRA shall be reviewed as necessary
to reflect
any significant change on site, and in any case every three years following initial
agreement:
review results are to be notified as part of the AER.
12.2.3 As part of the measures identified in Condition 12.2.1, the licensee shall, to the satisfaction for the Agency, make financial provision to cover any liabilities identified in Condition 12.2.2
The original ELRA was completed in 2006. As per Condition 12.2.2, RPS and Roche EHS personnel undertook a review of the ELRA in 2009.
The outcome of the review showed a significant reduction in the risk scores for most hazards, with a number of risks removed from the matrix. This resulted from the implementation of risk control measures on site.
The new revision (2009) of the ELRA/CRAMP has been submitted to the EPA.
There were no significant changes on site during 2010 that necessitated an update to the site ELRA.
19.2 Programme to achieve closure
The production processes at Roche Ireland are carried out under well-defined and strict controls. These controls include Standard Operating Procedures (SOPs), Good Manufacturing Practice (GMP) and legislative and regulatory controls.
In the event that the entire facility is closed, all areas of the facility shall be decommissioned and decontaminated. Figure 1 summarises the likely methodology employed in fully decommissioning and decontaminating the entire facility.
Page 62 of 63
Decontamination of production equipment is included as part of these controls and is part of regular practice in the plant and therefore would not incur significant additional costs, resources or time to undertake at time of closure.
Ground investigations, soil and groundwater testing programmes have been undertaken at the Roche facility over a number of decades. These investigations have focused on the landfill area, the area under the production building and the vicinity of the WWTP. As identified in the Closure Plan, contamination may exist in certain areas of the production facility as well as in the landfill. It is therefore proposed to deal with the Restoration and Aftercare of the facility as follows:
• RAMP for the production area, utilities and wastewater treatment plant
• RAMP for the Engineered Landfill
• RAMP for the H2 CELL
Figure 1 below summarises the steps to be taken in the event of a full site closure being necessary.
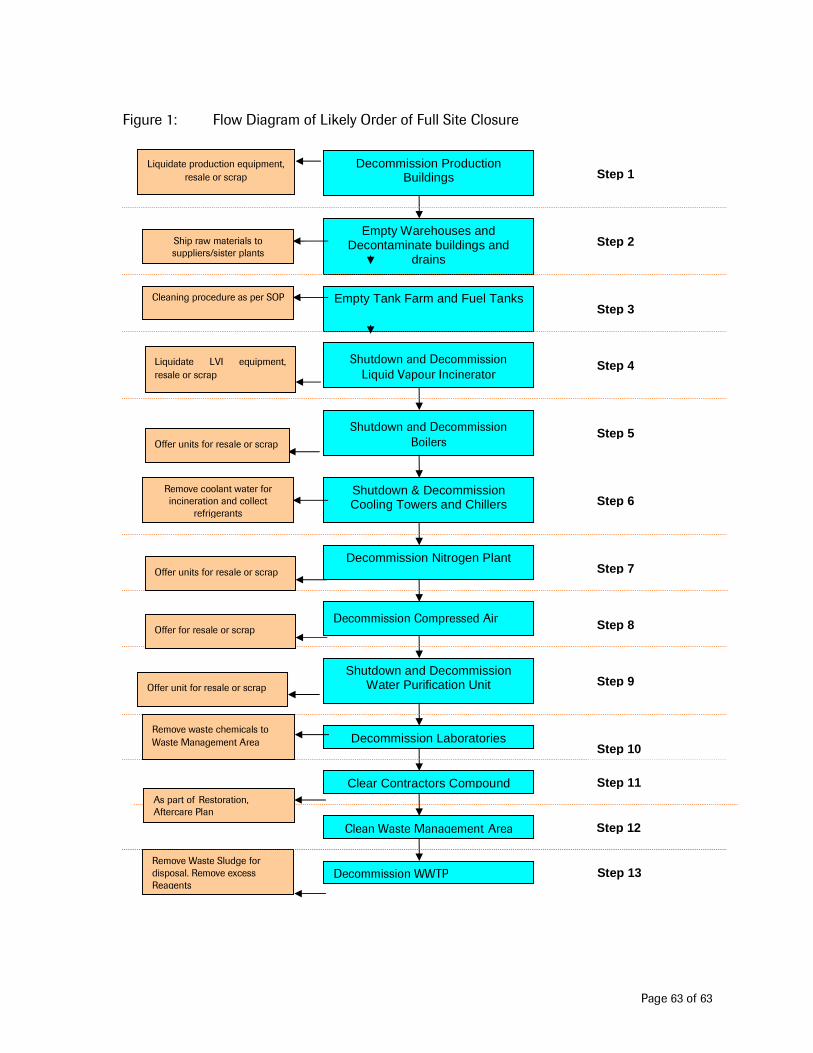
Page 63 of 63
Figure 1: Flow Diagram of Likely Order of Full Site Closure
Decommission Production Buildings
Empty Warehouses and Decontaminate buildings and
drains
Empty Tank Farm and Fuel Tanks
Shutdown and Decommission Liquid Vapour Incinerator
Shutdown and Decommission Boilers
Shutdown & Decommission Cooling Towers and Chillers
Decommission Nitrogen Plant
Decommission Compressed Air
Shutdown and Decommission Water Purification Unit
Decommission Laboratories
Clear Contractors Compound
Ship raw materials to suppliers/sister plants
Cleaning procedure as per SOP
Remove coolant water for incineration and collect
refrigerants
Clean Waste Management Area
Step 1
Step 2
Step 3
Step 4
Step 5
Step 6
Step 7
Step 8
Step 10
Step 9
Step 11
Step 12
Remove waste chemicals to Waste Management Area
Decommission WWTP Remove Waste Sludge for disposal. Remove excess Reagents
Step 13
Liquidate production equipment, resale or scrap
Liquidate LVI equipment, resale or scrap
Offer for resale or scrap
Offer units for resale or scrap
Offer unit for resale or scrap
As part of Restoration, Aftercare Plan
Offer units for resale or scrap
Annex 1: Emissions to atmosphere from incinerator and notification review
Table 5 contains a summary of the measured emissions to atmosphere from the liquid/vapour incinerator for 2010. All licenced parameters were well within the emission limit values required by the licence.
Reported Incidents
• In January ’10 an operational problem with the stack analyser was notified. Monitoring was switched to the back up analyser while the main analyser was out of service.
• In January ’10 an operational problem with the Norsk HCl analyser was notified. Monitoring was switched to the FTIR stack analyser while the Norsk was out of service.
• In September ’10 an operational problem with the main stack analyser was notified. Liquid waste feed was immediately ramped down and operating parameters recorded as per standard operating procedures.
• In October ’10 a notification was made concerning the existence of a dust handling unit. This unit was the same as those referred to as Emission Points 9, 10, 11, 12 and 13 in the IPPC Licence.
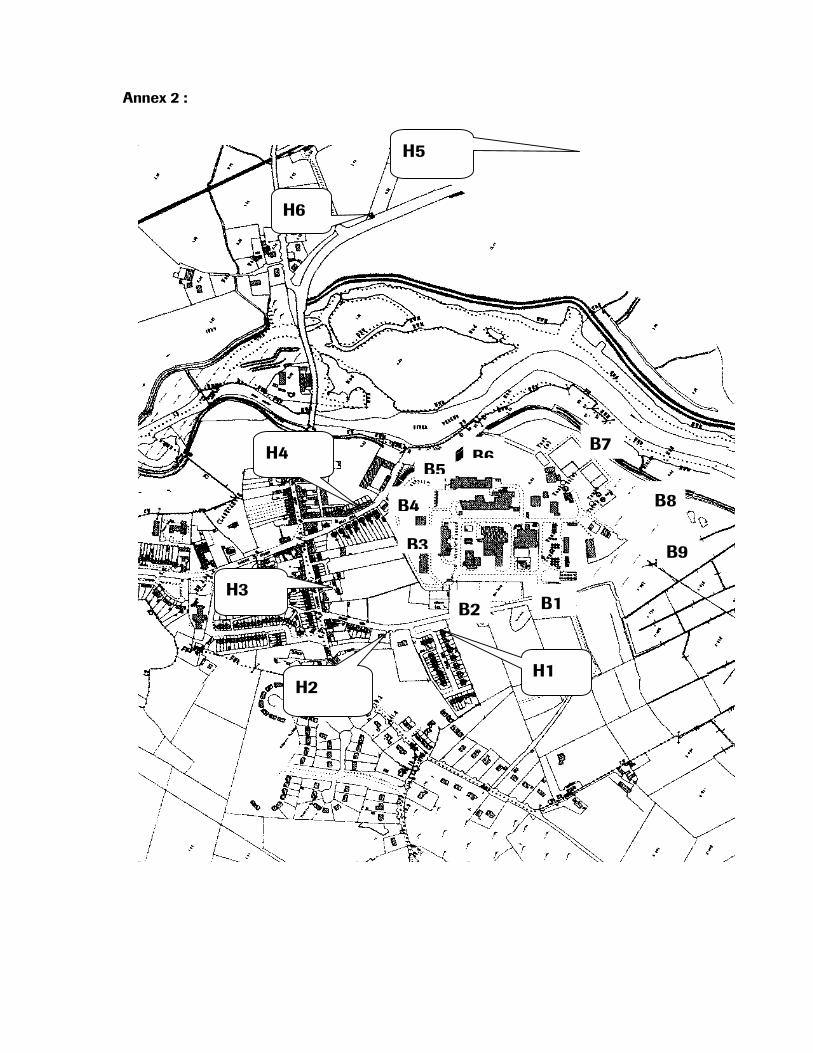
Annex 2 :
H1
H2
H3
H4
H6
H5
B1 B2
B3
B4
B5 B6
B7
B8
B9

Annex 3 : AER/PRTR 2010