Embed Size (px)
Citation preview
ORIGINAL PAPER
Rock Mass Grouting in the Løren Tunnel: Case Studywith the Main Focus on the Groutability and Feasibilityof Drill Parameter Interpretation
Are Havard Høien • Bjørn Nilsen
Received: 29 June 2012 / Accepted: 1 February 2013 / Published online: 21 February 2013
� The Author(s) 2013. This article is published with open access at Springerlink.com
Abstract The Løren road tunnel is a part of a major
project at Ring road 3 in Oslo, Norway. The rock part of
the tunnel is 915 m long and has two tubes with three lanes
and breakdown lanes. Strict water ingress restriction was
specified and continuous rock mass grouting was, there-
fore, carried out for the entire tunnel, which was excavated
in folded Cambro-Silurian shales intruded by numerous
dykes. This paper describes the rock mass grouting that
was carried out for the Løren tunnel. Particular emphasis is
placed on discussing grout consumption and the challenges
that were encountered when passing under a distinct rock
depression. Measurement while drilling (MWD) technol-
ogy was used for this project, and, in this paper, the rela-
tionships between the drill parameter interpretation (DPI)
factors water and fracturing are examined in relation to
grout volumes. A lowering of the groundwater table was
experienced during excavation under the rock depression,
but the groundwater was nearly re-established after com-
pletion of the main construction work. A planned 80-m
watertight concrete lining was not required to be built due
to the excellent results from grouting in the rock depression
area. A relationship was found between leakages mapped
in the tunnel and the DPI water factor, indicating that water
is actually present where the DPI water factor shows water
in the rock. It is concluded that, for the Løren tunnel,
careful planning and high-quality execution of the rock
mass grouting made the measured water ingress meet the
restrictions. For future projects, the DPI water factor may
be used to give a better understanding of the material in
which the rock mass grouting is performed and may also be
used to reduce the time spent and volumes used when
grouting.
Keywords Rock mass grouting � Grouting procedures �Groundwater � Fracturing � Measurement while drilling �MWD � Drill parameter interpretation � DPI
1 Introduction
Tunnelling in urban areas involves many challenges. One
of the biggest challenges is the risk of lowering the
groundwater table, which may harm buildings and the
environment. Urban tunnels usually have strict water
ingress restrictions and systematic pre-grouting of the rock
mass is usually described. In these cases, the rock mass
grouting is a major part of the construction process and
must be given great attention in the planning and execution
phases in order to obtain a satisfactory result. In this paper,
the typical challenges of such projects will be discussed
based on the experiences from rock mass grouting in the
Løren road tunnel, which is presently under construction in
Oslo, Norway (see Fig. 1).
The rock part of the Løren tunnel is 915 m long (see
Fig. 2). The tunnel has two tubes with three lanes and
breakdown lanes, which results in face areas of 105–135 m2.
The tunnel is excavated from one side by drill and blast
technology and continuous grouting. Tube B is excavated
approximately 30 m ahead of tube A on descending profile
numbers. In the area above the tunnel, there is a mix of
residential and commercial buildings founded on soft, sen-
sitive clay and sandy, gravelly soil, with a thickness of up to
A. H. Høien (&)
Norwegian Public Roads Administration, Postboks 8142 Dep,
0033 Oslo, Norway
e-mail: [email protected]
B. Nilsen
Norwegian University of Science and Technology,
Sem Sælands veg 1, 7491 Trondheim, Norway
123
Rock Mech Rock Eng (2014) 47:967–983
DOI 10.1007/s00603-013-0386-7

30 m. Strict water ingress restrictions from 7 to 10 l/min/
100 m were, therefore, given.
This article will describe the rock mass grouting that has
been done for the Løren project and present some issues
and findings which are believed to be of particular interest.
One such issue is groundwater and grouting aspects of the
excavation under a depression with low rock overburden
below 30 m of soil. Another issue which is discussed in
more detail is the use of drill parameter interpretation (DPI)
and its possible use for grouting purposes.
DPI is a new, innovative system for logging boreholes
(measurement while drilling, MWD) and interpretation of
these logs into factors that describe the rock mass. The DPI
system at the Løren tunnel provided three factors: hardness,
fracturing and water.
The main objectives in the following are, thus:
• To describe the geological and hydrogeological char-
acteristics and the grouting procedures for the Løren
tunnel.
• To describe the grouting results: in general, in relation to the
rock depression and in relation to the grout consumptions.
• To describe the relationships between DPI water and
fracturing factors and grout volumes
2 Ground Conditions and Grouting Procedure
for the Løren Tunnel
The Løren tunnel is situated in a developed area with a mix
of residential and commercial buildings. The residential
SWED
EN
NO
RWAY
RU
SSIA
FIN
LAN
D
OsloLøren tunnel
Carboniferous - Cretaceous(Permian in SE-Norway)Cambro - Silurian(Caledonian)
Precambrian
Fig. 1 Location of the Løren road tunnel, Oslo, Norway
Fig. 2 Plan view and longitudinal profile of the Løren tunnel. The coloured areas on the plan view are the rock parts of the tunnel. The orange
area is the section in focus on this article regarding drill parameter interpretation (DPI) and grout volumes
968 A. H. Høien, B. Nilsen
123

buildings are mostly 1–2-floor townhouses or single-family
houses constructed from wood and some larger concrete
constructions with 4–7 floors. The commercial buildings
are concrete constructions with 4–6 floors. An assessment
of the potential settlement caused by lowering the
groundwater level that could damage these buildings was,
therefore, performed. During the pre-investigations, a large
number of ground investigation boreholes were drilled to
establish a theoretical rock surface and soil profiles.
Observation wells were also established to survey the
groundwater over time.
2.1 Ground Conditions
2.1.1 Soil and Rock Overburden
Throughout the tunnel, the rock overburden was mostly
satisfactory, except for an area between profile nos.
1150–1300, where the rock surface has a depression as
shown in Fig. 2. Due to alignment restrictions at the start
and end point of the tunnel and road gradient restrictions,
the rock overburden in this area was only 6–8 m for a 50-m
stretch.
The soil cover in the same area was approximately
30 m, with 3–5-m-thick dry crust clay on top of soft,
sensitive clay, with sandy, gravelly soil at the bottom
8–10 m. This makes the area sensitive for settlement in
case of lowering the groundwater level (Henriksen and
Føyn 2004).
2.1.2 Groundwater
Before and during construction, 20 observation wells with
automatic logging surveyed the groundwater level in the
influential area for the tunnel. To obtain the seasonal and
yearly variations in the groundwater levels, these wells had
approximately 3 years of logging before the construction
started. A few other wells had data from 5 years ahead of
construction commencement. The long-term logging is
important as a background when evaluating groundwater
levels during construction.
Prior to the excavation, one infiltration well was estab-
lished from the surface in the area mentioned above. In
addition, in the same area, two infiltration holes were
drilled during excavation from each of the tunnel tubes.
These two holes were drilled along the tunnel axis with a
small angle away from the tubes.
2.1.3 Bedrock Geology
During excavation, an engineering geologist mapped the
geology, as illustrated in Fig. 3, and estimated a Q value
124012201200118011601140 1300 13201120 12801100 1260
1080 11001060104010201000980960940920900880
860 880840820800780760740720700680660
146014401420140013801360 1520 15401340 15001320 1480
Fig. 3 Tunnel geology based on blast round mapping. The map is drawn as a fold-out tunnel profile. The rock types represented by the different
colours are explained in Table 1. The black lines represent major joints and faults/weakness zones
Rock Mass Grouting in the Løren Tunnel 969
123
after each blast. The geology information was registered in
a tunnel documentation software called Novapoint Tunnel
(Vianova 2011) on a fold-out tunnel profile (Humstad et al.
2012). A geological longitudinal section map as shown in
Fig. 4 was made based on this mapping and the pre-con-
struction investigations.
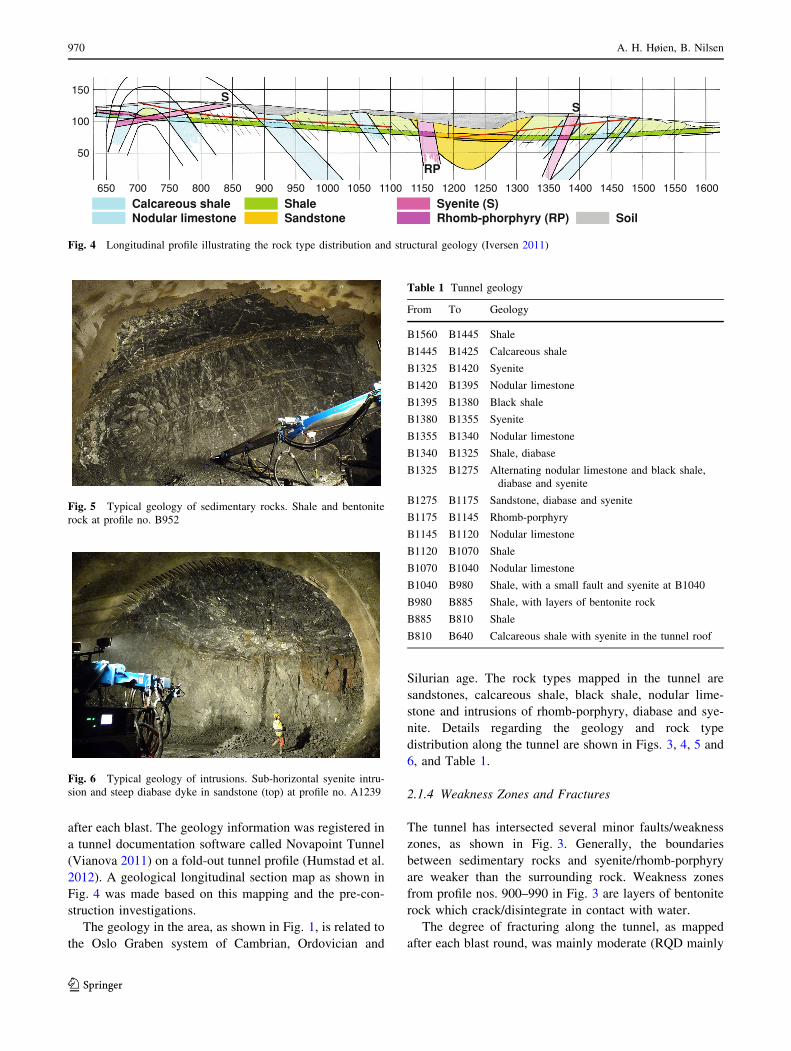
The geology in the area, as shown in Fig. 1, is related to
the Oslo Graben system of Cambrian, Ordovician and
Silurian age. The rock types mapped in the tunnel are
sandstones, calcareous shale, black shale, nodular lime-
stone and intrusions of rhomb-porphyry, diabase and sye-
nite. Details regarding the geology and rock type
distribution along the tunnel are shown in Figs. 3, 4, 5 and
6, and Table 1.
2.1.4 Weakness Zones and Fractures
The tunnel has intersected several minor faults/weakness
zones, as shown in Fig. 3. Generally, the boundaries
between sedimentary rocks and syenite/rhomb-porphyry
are weaker than the surrounding rock. Weakness zones
from profile nos. 900–990 in Fig. 3 are layers of bentonite
rock which crack/disintegrate in contact with water.
The degree of fracturing along the tunnel, as mapped
after each blast round, was mainly moderate (RQD mainly
50
100
150S
RP
650 700 750 800 850 900 950 1000 1050 1100 1150 1200 1250 1300 1350 1400 1450 1500 1550 1600
S
Shale Sandstone
Syenite (S) Rhomb-phorphyry (RP) Soil
Calcareous shale Nodular limestone
Fig. 4 Longitudinal profile illustrating the rock type distribution and structural geology (Iversen 2011)
Fig. 5 Typical geology of sedimentary rocks. Shale and bentonite
rock at profile no. B952
Fig. 6 Typical geology of intrusions. Sub-horizontal syenite intru-
sion and steep diabase dyke in sandstone (top) at profile no. A1239
Table 1 Tunnel geology
From To Geology
B1560 B1445 Shale
B1445 B1425 Calcareous shale
B1325 B1420 Syenite
B1420 B1395 Nodular limestone
B1395 B1380 Black shale
B1380 B1355 Syenite
B1355 B1340 Nodular limestone
B1340 B1325 Shale, diabase
B1325 B1275 Alternating nodular limestone and black shale,
diabase and syenite
B1275 B1175 Sandstone, diabase and syenite
B1175 B1145 Rhomb-porphyry
B1145 B1120 Nodular limestone
B1120 B1070 Shale
B1070 B1040 Nodular limestone
B1040 B980 Shale, with a small fault and syenite at B1040
B980 B885 Shale, with layers of bentonite rock
B885 B810 Shale
B810 B640 Calcareous shale with syenite in the tunnel roof
970 A. H. Høien, B. Nilsen
123

within the range 50–70), but with some variation, as
illustrated in Fig. 7.
2.2 Water Ingress Restrictions
During construction, thresholds across the tunnel floor
were made to measure the water ingress, and water ingress
restrictions (threshold values) were defined as shown in
Table 2.
Regarding the potential settlement of buildings, the
depression between profile nos. 1300 and 1150 was the
main concern during planning and excavation. Based on
settlement calculations and empirical data of water ingress
and pore pressure reduction in the Oslo region, a relation-
ship was established between water ingress and settlement
at profile no. 1250 (Henriksen and Føyn 2004), as shown in
Table 3. This relationship was used during construction
when deciding whether a planned watertight concrete lining
between profile nos. 1220 and 1300 should be built or not.
An extensive monitoring programme was established to
survey the potential settlement of buildings above the
tunnel.
2.3 Grouting
Due to the very strict water ingress restrictions, maximum
7–10 l/min/100 m for both tubes combined, systematic
pre-excavation grouting was planned and carried out for
the entire tunnel.
2.3.1 Grout Rig
The grouting rig was equipped with three separate pumping
lines and a storage cement mixer for each line. The cement was
first mixed in the main cement mixer and then pumped into the
storage mixers. There was also a tank and a pump for the
accelerator to ensure controlled curing. The rig was operated by
an electronic panel with predefined cement recipes.
2.3.2 Grout Curtains1
Grout curtains with 45–46 holes circumferencing the face
and 7–9 holes in the face itself, as shown in Fig. 8, have
been used. The hole length was 15, 21 or 23 m, depending
on the distance between the curtains and the blast length,
and the curtain overlap was 7–9 m. Spacings between the
holes were 1.0 m at the floor and 0.8 m in the walls and
crown.
After completing the drilling of a curtain, grouting rods
were placed in the holes with the tap open. For large
leakages, the rods were placed in the holes during drilling
with the tap closed. The grouting rods were 3 m long and
had a disposable packer with a mechanical expansion
sleeve at the end. The packer reflux valve was left open
before grouting to let water pass, by inserting a nail in the
cross opening.
RQD
90807060504030
Fre
qu
ency
30
20
10
0
Fig. 7 Fracture frequencies (RQD) from Q value mapping during
excavation
Table 2 Water ingress restrictions
From To Leakage for both tubes
combined (l/min/100 m)
640 800 \10
800 1350 \7
1350 1500 \10
1500 1560 \7
Table 3 Relationship between pore pressure reduction, settlement
and water ingress restrictions at profile no. 1250 (Henriksen and Føyn
2004)
Pore pressure
reduction (m)
Settlement
(cm)
Water ingress for both tubes
combined (l/min/100 m)
1 3 3
3 8 7
5 12 10
10 20 20
1 In this article, also the word ‘section’ is used as a term for one
grouting round, which consists of one grout curtain. The profile
number relating to this is from where the grout curtain is drilled.
Rock Mass Grouting in the Løren Tunnel 971
123

2.3.3 Grouting Procedure
Cement has been used for all systematic grouting, normally
with a w/c ratio span of 1.0 to 0.5, see Table 4. The gro-
uting sequence started with two lines in the middle of the
bottom holes. The lines were then moved from this position
to both sides, and further up the walls, until they met at the
crown. The third line was either used in the face holes or
together with one of the other lines to grout two holes next
to each other (see Fig. 9). The choice of grout cement type
was mainly based on overburden evaluation and ingress
restrictions. Rapid cement has the lowest cost and was,
therefore, the preferred choice. Micro-cement is believed to
have a better penetration than rapid cement (Axelsson et al.
2009) and was used when the overburden was low and high
pressures might cause the grout to reach the surface and in
cases when rapid cement did not give a satisfactorily tight
tunnel. The cement was defined as rapid cement when it
had a grain size d95 [ 20 lm and micro-cement when it
had a grain size d95 \ 20 lm.
The stop criterion for grouting was when the pressure in
the hole reached a certain value (the end pressure) and zero
grout flow. In areas with small rock cover, the stop crite-
rion (end pressure) was divided into bottom and top, where
the top holes were defined as those above the invert (see
Table 5).
When grouting, it is generally important to have some
grout consumption and pressure build-up in the hole in
order to make a tight tunnel (Brantberger et al. 2000).
Therefore, grouting at the Løren tunnel, as shown in
Table 5, was started with a highly liquid grout, which was
made less liquid by lowering the w/c ratio (for rapid
cement) or adding curing liquid (for micro-cement) to build
up pressure during the grouting process for the hole. If
there was no sign of pressure build-up after this, the hole
was set on hold (e.g. for an hour) before grouting was
resumed.
For the controlled curing, the accelerator was mixed
with the grout at the rod. The contractually described
controlled curing for rapid cement (see Table 5) did not
work due to the chemical composition of the cement.
During construction, it was detected that the pumping
system for the accelerator was not operating as it was
supposed to. It was found that the pump fed a lower amount
than the percentage shown on the panel. Towards the end
of the construction time (around profile no. B757), this was
taken into account by using a higher setting than that
described.
3 MWD and DPI
3.1 Background and Basic Principles
Measurement while drilling (MWD has a history from the
early 1900s when Schlumberger introduced downhole
electrical logging to the oil industry (Segui and Higgins
2002; Smith 2002). When the mining industry started to
adapt the method, the logged data were plotted on paper
Fig. 8 Typical drill plan for grout curtains
Table 4 Sections with different cement types
From To Cement type
B1550 B1301 Rapid cement
B1294 B1165 Micro-cement
B1159 B1022 Rapid cement, used some micro-cement in extra
curtain at B1022
B1011 B0936 Micro-cement
B924 B762 Rapid cement
B757 B667 Micro-cement
B745 Single section with rapid cement
B1186 Single section with rapid cement
Fig. 9 Grouting in progress
972 A. H. Høien, B. Nilsen
123
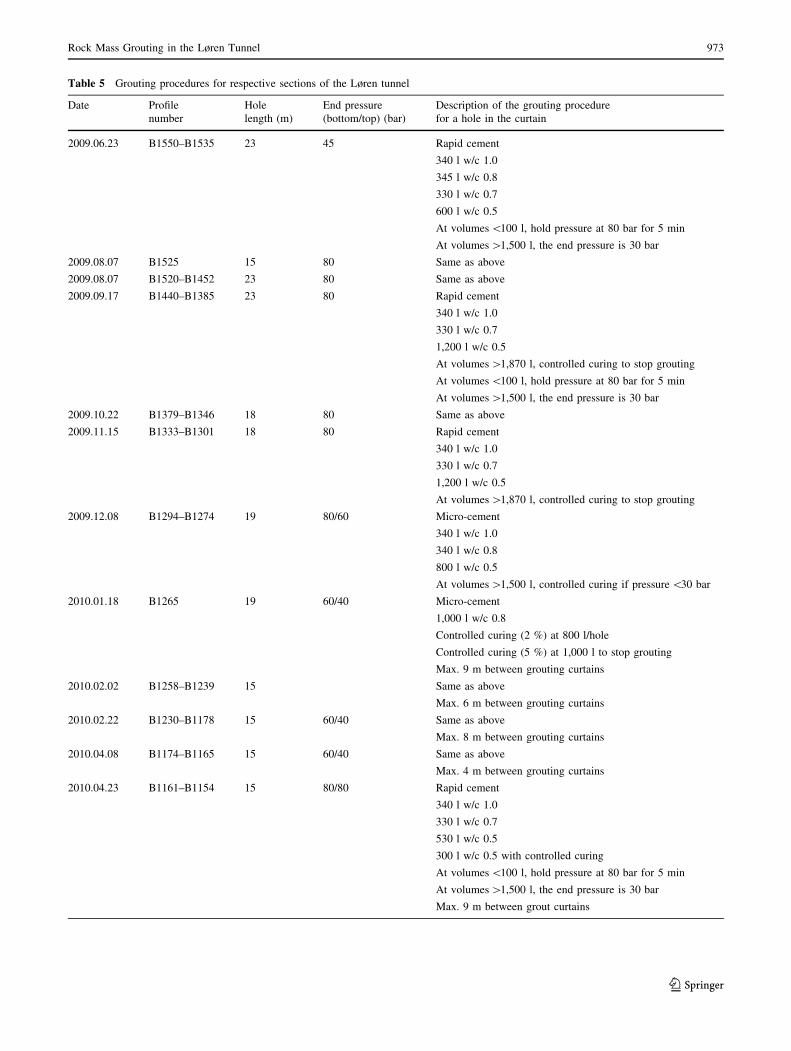
Table 5 Grouting procedures for respective sections of the Løren tunnel
Date Profile
number
Hole
length (m)
End pressure
(bottom/top) (bar)
Description of the grouting procedure
for a hole in the curtain
2009.06.23 B1550–B1535 23 45 Rapid cement
340 l w/c 1.0
345 l w/c 0.8
330 l w/c 0.7
600 l w/c 0.5
At volumes \100 l, hold pressure at 80 bar for 5 min
At volumes [1,500 l, the end pressure is 30 bar
2009.08.07 B1525 15 80 Same as above
2009.08.07 B1520–B1452 23 80 Same as above
2009.09.17 B1440–B1385 23 80 Rapid cement
340 l w/c 1.0
330 l w/c 0.7
1,200 l w/c 0.5
At volumes [1,870 l, controlled curing to stop grouting
At volumes \100 l, hold pressure at 80 bar for 5 min
At volumes [1,500 l, the end pressure is 30 bar
2009.10.22 B1379–B1346 18 80 Same as above
2009.11.15 B1333–B1301 18 80 Rapid cement
340 l w/c 1.0
330 l w/c 0.7
1,200 l w/c 0.5
At volumes [1,870 l, controlled curing to stop grouting
2009.12.08 B1294–B1274 19 80/60 Micro-cement
340 l w/c 1.0
340 l w/c 0.8
800 l w/c 0.5
At volumes [1,500 l, controlled curing if pressure \30 bar
2010.01.18 B1265 19 60/40 Micro-cement
1,000 l w/c 0.8
Controlled curing (2 %) at 800 l/hole
Controlled curing (5 %) at 1,000 l to stop grouting
Max. 9 m between grouting curtains
2010.02.02 B1258–B1239 15 Same as above
Max. 6 m between grouting curtains
2010.02.22 B1230–B1178 15 60/40 Same as above
Max. 8 m between grouting curtains
2010.04.08 B1174–B1165 15 60/40 Same as above
Max. 4 m between grouting curtains
2010.04.23 B1161–B1154 15 80/80 Rapid cement
340 l w/c 1.0
330 l w/c 0.7
530 l w/c 0.5
300 l w/c 0.5 with controlled curing
At volumes \100 l, hold pressure at 80 bar for 5 min
At volumes [1,500 l, the end pressure is 30 bar
Max. 9 m between grout curtains
Rock Mass Grouting in the Løren Tunnel 973
123

with pen strip recorders and the drill parameters were
inspected manually. When computers were introduced,
new possibilities with filtering and advanced statistical
analysis became available (Schunnesson 1997) for proper
drill parameter interpretation (DPI). The latest software on
the market uses 3D technology to present the data and,
together with easy-to-use interfaces, the method is now a
good tool to predict the rock conditions for mining and
tunnelling purposes.
During drilling, the parameters from the machine con-
trol are logged and saved in files. These data are stored
together with the hole position, hole direction, drill ham-
mer ID and other relevant data. An example of the logged
parameters is shown in Table 6.
In tunnelling and mining, the DPI usually gives three
factors that describe the rock condition: rock hardness,
fracturing and water. The levels of these three factors can
be combined to describe other types of rock properties, e.g.
drillability and blastability, and it can be evaluated, for
instance, when to start spiling and rock mass grouting.
In the case of mining for example, the hardness factor
can be used to find the boundary between the ore body and
Table 5 continued
Date Profile
number
Hole
length (m)
End pressure
(bottom/top) (bar)
Description of the grouting procedure
for a hole in the curtain
2010.05.04 B1144–B1085 21 80/80 Rapid cement
340 l w/c 1.0
330 l w/c 0.7
230 l w/c 0.5
200 l w/c 0.5, controlled curing if pressure is \30 bar
At volumes \100 l, hold pressure at 80 bar for 5 min
Max. 10 m between grouting fans
2010.05.20 B1074–B1122 23 80/80 Same as above
Max. 12 m between grout curtains
2010.08.11 B1011–B935 23 60/40 Micro-cement
800 l w/c 0.8
200 l w/c 0.8, controlled curing 2 %
At volumes [1,000 l, controlled curing 5 %
Max. 12 m between grouting curtains
2010.09.21 B924a–B901 23 60/40 Rapid cement
700 l w/c 0.7
500 l w/c 0.5
At volumes [1,200, grouting is ended
Max. 12 m between grouting curtains
2010.10.06 B892–B762 23 60/60 Rapid cement
300 l w/c 1.0
300 l w/c 0.7
400 l w/c 0.5
After 900 l and pressure \30 bar, a break in grouting is taken
Max. 12 m between grouting curtains
2010.12.03 B757b–B735 23 60/60 Micro-cement
300 l w/c 0.8
300 l w/c 0.5
150 l w/c 0.5, controlled curing 3 %
150 l w/c 0.5, controlled curing 6–8 %
Max. 12 m between grouting curtainsc
2011.01.03 B723–B767 23 60/40 Same as above
a The grouting procedure used from B924 was changed because the grout volumes were too low to obtain a tight tunnelb There was grouting twice at B762, first with rapid cement and then micro-cement, because of an initially poor grouting result. Only the rapid
cement grouting curtain is included in the datasetc On some occasions, the distance is 6 m
974 A. H. Høien, B. Nilsen
123

the side rock. In tunnelling, a common use of DPI is to
evaluate the quality of the rock mass in exploratory bore-
holes in order to adjust the support level when advancing
towards weakness zones.
The water and fracturing factors are not yet very com-
monly used, but one example is Norra Lanken in Stock-
holm, where the interpreted parameters were evaluated
while drilling the grout curtain. When starting on a new
curtain, every second of the holes were drilled first and the
drill logs sent to the site office. An engineering geologist
evaluated the interpreted data and ordered extra holes if
required according to the DPI grouting class (Carlsvard and
Wallgren 2009).
The DPI software that has been used at the Løren tunnel
is GPM? Tunnel, delivered by Rockma AB (2011).
GPM? calculates three factors: hardness, fracturing and
water. The values are on a relative scale, but the hardness
factor can be adjusted based on rock strength tests (e.g.
Schmidt hammer or point load) to estimate the uniaxial
strength (Valli 2010).
GPM? uses different statistical methods and filtering
for the calibration and processing of data. The calibration
must be done at each work site and for each drill rig in
order to obtain a satisfactory result. The calibration is done
based on a principal component analysis to discover which
of the parameters are relevant, and to what degree they are
relevant. The algorithms are based on the work of Schun-
nesson (1997).
For calculating the DPI factors, GPM? uses the values
from the parameters in the log file (see Table 6) for each
sample, and returns a value for each of the DPI factors
(hardness, fracture and water) for each sample point. The
hardness is, in this case, calibrated to show the uniaxial
strength. The fracturing factor indicates that the rock is
fractured and the water factor indicates that water is flowing
from the rock. A higher value indicates a higher degree of
fractures or more water. In GPM?, the water factor is set to
show water for values higher than 1.5 and to show fracturing
for fracturing values higher than 1.0. See Figs. 10 and 11.
3.2 Data Collection
3.2.1 Water Ingress Measurement
As mentioned in Sect. 2.2, thresholds across the tunnel
floor were made to measure the water ingress during con-
struction. The construction road runs over the thresholds,
Fig. 10 Screenshot from GPM? showing the water factor for a
grouting section in 3D
Table 6 Example of logged parameters from a log file
HD (mm)a PR (dm/min)b HP (bar)c FP (bar)d DP (bar)e RS (r/min)f RP (bar)g WF (l/min)h WP (bar)i Time
32 0 69.76 19.69 39.65 216.86 42.47 76.09 21.4 8:18:49
59 31.83 101.44 17.12 40.08 217.77 38.61 76.84 20.97 8:18:49
84 30.28 111.71 17.12 40.08 218.68 39.47 75.72 20.97 8:18:50
108 28.37 116.42 19.26 40.51 219.60 42.04 75.72 21.83 8:18:50
131 26.75 123.26 20.97 40.51 214.11 53.20 76.46 20.97 8:18:51
152 24.88 124.98 24.82 40.51 198.56 51.48 76.46 22.26 8:18:52
… … … … … … … … … …a Hole depthb Percussion ratec Hammer pressured Feeding pressuree Dampening pressuref Rotation speedg Rotation pressureh Water flowi Water pressure
Rock Mass Grouting in the Løren Tunnel 975
123

with a ditch on the side for the water to flow and stop
behind the threshold. The water was lead through the
threshold with a pipe and the water volume was measured
by collecting the water in buckets for 1 min. The water
volume from the upstream threshold was subtracted and the
spacing between them taken into account by dividing the
distance and multiplying by 100 (m) to obtain l/min/100 m.
The main concern by using this method is that blasting
and crushing by large vehicles creates mud and silt that fills
up behind the thresholds and clogs the drainage in the top
layer of the construction road. The space behind the
thresholds, therefore, have to be maintained regularly by
removing the silt and clay. To lead all the water into the
ditch and, at the same time, having the construction road
driveable for vehicles is challenging, and water may easily
follow the construction road and pass over the thresholds.
Also, other uses of the tunnel space during construction,
e.g. storing and temporary installations, may conflict with
leading the water into the thresholds. In addition, an area at
the low point lacks water ingress measurement because of
the cross-cut and space for water sedimentation.
3.2.2 Leakage Mapping and Comparison with the DPI
Water Factor
After the excavation of the tunnel was completed, a manual
mapping of leakages from the tunnel roof and walls was
performed. The mapping covered point as well as area
leakages. The volume of leakages is measured in drops/min
or l/min. The registration is done on a fold-out tunnel
profile and is registered in Novapoint Tunnel.
In GPM?, there is an export function where the DPI
factors are interpolated and saved to a fold-out tunnel
profile. These files were imported to Novapoint Tunnel and
can be viewed together with the water leakage information.
Small impacts of the water factor may be erased during the
interpolation process.
3.3 Processing of DPI and Grouting Data
To investigate the relationship between DPI and grouting
data, some processing of the DPI data and matching of DPI
and grouting data had to be done. The dataset consists of
data from two sources: interpreted drill data done by
GPM? Tunnel and grout logs from the grouting rig. The
statistical software program SPSS (IBM 2010) was used to
pair up these datasets and recalculate DPI values. The
program has also been used for descriptive purposes and
chart building.
3.3.1 Interpreted Drill Data
GPM? mainly shows the interpreted data graphically, with
colour scales representing different values. For the purpose
of statistical analyses and charts, number values are nee-
ded, and Rockma Systems AB, therefore, exported all
measuring points (one point every 2–3 cm in all holes) into
text files. These text files were imported into SPSS and
resulted in a dataset with over 2 million measuring points.
To compare the interpreted data with the grouting data,
one value for each factor (water and fracturing) for each
hole is needed. Based on the experience of Rockma Sys-
tems AB, values for water higher than 1.5 indicate water-
bearing fractures and fracturing values higher than 1.0
indicate fractured rock. To provide one value for each hole,
a filtering and recalculation for each factor was performed.
214.9
-47.03.2
0.15.0
-3.7
1.5
1.0
10 2 3 4 5 6 7 8 9 10 11 12 13 14 15 16 17 18 19 20 21 22 [m]
Hardness
Fracturing
Water
Fig. 11 Screenshot from GPM? showing (from the top) hardness, fracturing and water along one borehole
976 A. H. Høien, B. Nilsen
123

For the water factor, all sample values B1.5 were fil-
tered out. Sample values C1.5 were subtracted 1.5 and
multiplied with their sample length and then added:
W ¼Xn
i¼m
ðð w� 1:5ð Þ � 1:5Þ � lÞi ð1Þ
where W is the water value for a hole, n the number of
samples for a hole, w a single water value and l is the
sample length.
For the fracturing factor, all sample values B1.0 were
filtered out. Sample values C1.0 were subtracted 1.0 and
multiplied with their sample length and then added:
F ¼Xn
i¼m
ð ð f � 1:0ð Þ � 1:0Þ � lÞi ð2Þ
where F is the fracturing value for a hole, n the number of
samples for a hole, f a single fracturing value and l is the
sample length.
W and F factors were then added in a new dataset, along
with their section numbers, hole numbers and hole lengths.
This dataset contained 3,611 cases (holes).
When water and fracturing values are presented for a
section, the W and F factors are added for that section. In
the results for the water factor, it is a trend that the impact
is larger with decreasing profile number. A linear trend line
was calculated and the difference quotient for this line has
been used to normalise the data by recalculating the values
to have a horizontal trend line, to make them comparative
through the tunnel.
3.3.2 Grouting Data
The grouting data were obtained based on the log files from
the grouting rig and saved as spreadsheets containing the
weight of cement used and the amount of grout in litres for
each recipe and hole. The values for each hole were added,
giving the weight of cement and litres of grout for each
hole. The weight of cement was divided into three cate-
gories: rapid cement, micro-cement and micro-cement with
controlled curing.
3.3.3 Hole Number Matching
The hole numbers from grouting data and drill data were
not corresponding. The hole numbering for the grouting
data started at the lower right corner and proceeded
clockwise around the contour, with the face holes as the
last numbers. The hole numbering for the drill data was
more or less random, but could be viewed together with the
drill pattern in GPM?.
The hole numbers, therefore, were punched manually to
make the two data sources correspond. For the start of the
tunnel, it was hard to decide where to start the hole num-
bering, and this part is, therefore, excluded from the
dataset, as well as a couple of sections where there was
doubt about where the hole numbering started. All face
holes are also excluded from the dataset due to difficulties
with the hole numbers matching.
3.3.4 Content of the Dataset
The dataset spans over profile nos. B1224 to B641 and has
59 different sections/grouting rounds and 2,606 cases/
holes. This data was picked out because tube B was
excavated approximately 30 m ahead of tube A and the
grouting, therefore, is done without any disturbance from
the other face. Hole number matching was difficult
between B1560 and B1224, and this section was, therefore,
excluded.
The main variables in the dataset are:
• Section number
• Hole number
• Hole length
• Hole number from drill data
• Hole number from grouting data
• Rapid cement weight
• Micro-cement weight
• Micro-cement with controlled curing weight
• Grout volume
• W: water factor for a hole
• F: fracturing factor for a hole
4 Results From the Tunnelling
The presentation of the results is divided into two main
parts, grouting and DPI. The grouting part has its main
focus on describing water ingress and on how the chal-
lenging grouting past the rock depression between profile
nos. 1300 and 1150 was handled. Some findings regarding
grout consumption in holes are also presented. The DPI
part focuses on a comparison between the grouting vol-
umes and DPI factors for selected sections.
4.1 Grouting
4.1.1 Water Ingress
As shown in Table 7, the water ingress values are generally
below the restriction (threshold) values for one tube, and
sometimes slightly exceed the restrictions when the values
for the two tubes are added.
The sampled distances do not match the ingress
restrictions because the placing of the thresholds had to be
Rock Mass Grouting in the Løren Tunnel 977
123

adjusted to the placing of low points, cross-cuts etc.
Because of this, some assessment of the values had to be
made when considering whether the restrictions are met or
not.
The 7 l/min/100 m restriction for profile nos.
1560–1500 is a part of a bigger sample interval, but when
looking at the leakage mapping, there are not many leak-
ages in this area and, therefore, it is probably below the
restriction value. The same assumption applies for profile
nos. 800–640, where a part of this interval is not a part of a
sample.
4.1.2 Passing the Rock Depression, Profile nos.
1300–1150
The biggest challenge during the construction of the Løren
tunnel was passing the rock depression between profile nos.
1300–1150. As mentioned before, the rock overburden was
6–8 m and the soil thickness was 30 m for a 50-m section
in this area. The excavation through this section was done
with 3-m blast rounds, and spiling, shotcrete, rock bolts and
rebar-reinforced shotcrete ribs as rock support. Exploratory
boreholes from the tunnel face were drilled to make sure
that the overburden was as expected.
Because of the potential consequences for buildings at
the surface if the water ingress was too high after rock mass
grouting, it was prepared for a watertight concrete lining
between profile nos. 1300–1220. During excavation, a
larger profile with an arched floor was blasted to make
room for this construction.
Due to problems during rock mass grouting around the
building pit, the water level in the depression was lowered
5–6 m before tunnel excavation started. This lowering was
expected to be temporary because barriers and watertight
constructions would allow the water level to rise in the
building pit when excavation was finished.
To raise the groundwater level and reduce the settle-
ment, infiltration from the surface was started prior to
tunnel excavation. In addition, infiltration from the two
infiltration boreholes in the tunnel tubes was started when
the excavation had passed the depression.
To decide whether the watertight lining should be built
or not, a thorough evaluation of water ingress, groundwater
level and ground reaction due to the lowering of the
groundwater had to be made. To get a better understanding
on how the infiltration affected the groundwater level, the
infiltration was stopped for two periods. The curves from
the observation wells were flattening out after approxi-
mately 14 days and showed a lowering of the groundwater
level by approximately 2 m (Boge 2010).
The calculated settling was 50–100 mm, and without
water infiltration, an additional 50 mm. The registered
settlements of buildings were smaller than expected and it
is reason to believe that soil is more pre-consolidated than
the laboratory testing shows. Levelling measurements on a
building founded on rock showed a 30-mm lifting, which is
assumed to be a result from hydraulic splitting of the rock
from the rock mass grouting (Boge 2010). Measurements
done on buildings on other parts of the tunnel also indicate
this.
When deciding whether the watertight lining should be
built or not, a conservative assumption was made of further
settling of 70–100 mm if the water infiltration was turned
off. This was believed to represent minor harm for build-
ings. It was also concluded that the building of the
watertight lining would have a minor influence on the
groundwater level (Boge 2010). It was, therefore, decided
not to build the lining and to turn off the water infiltration
(Barstad 2010).
The grouting in the rock depression area resulted in
water ingress corresponding to the requirements in the
contract. After the groundwater level in the building pit
was re-established, the groundwater level in the area is
nearly the same as before the project started. Settlements of
the most exposed buildings are in the order of magnitude of
30–40 mm. The settlement seems to have stopped and
there has been little damage to buildings due to ground-
water lowering (Boge 2012).
4.1.3 Grout Consumption
The grout volume frequencies for all holes are shown in
Fig. 12. The histogram illustrates that a large amount of
holes had a grout consumption less than 100 l. For most of
the grouting procedures in the dataset, the maximum grout
volume for a hole was 1,000 l. For holes with a con-
sumption of more than about 1,000 l, the end pressure was
hard to achieve. Holes with a grout consumption above
Table 7 Water ingress for tubes A and B measured 03.01.2011
From To l/m l/m/100 m
A1545 A1355 6.0a 3.2a
A1300 A1220 2.7 3.4
A1220 A1050 8.0 4.7
A1050 A749 4.0 1.3
B1562 B1385 12.0b 6.8b
B1303 B1232 3.0 4.2
B1232 B1060 5 2.9
B1060 B723 7.6c 2.3c
a Measured 05.04.2012b Measured 03.01.2012c Measured 02.01.2011. There are some uncertainties regarding this
measurement
978 A. H. Høien, B. Nilsen
123

1,250–1,500 may be a result of flow back into the tunnel
through fractures.
In Fig. 13, a detailed frequency diagram is shown for
holes with 23 m length grouted with rapid cement. The
theoretical volume of these holes is 47 l,2 but the volume
might be larger because the actual hole diameter might
have been wider and because fall-out of small rock pieces
might have occurred. In addition, pressure buildup in the
hoses and filling of the rods uses some grout. The peak
around 52 l is, therefore, an indication that a large part of
the holes only is filled with grout, with no penetration into
the rock mass.
As shown in Fig. 14, holes grouted with micro-cement
does not have a peak at around 55 l, as in the holes grouted
with rapid cement. A large amount of holes with almost no
grout consumption can be observed in this figure, in contrast
to what can be observed for the rapid cement holes in Fig. 13.
4.2 Drill Parameter Interpretation
4.2.1 Water Leakage
The mapped water leakage has a generally good match
with the DPI water factor, although the mapping is done
after the grouting was finished. This match indicates that,
when the water factor shows water, water is quite likely
actually present in the hole. Since the water may find new
channels during grouting and positioning while mapping ischallenging, an exact match cannot be expected. An
example of mapped leakage versus water factor from DPI
is shown in Fig. 15.
Grout volume in litres160140120100806040200
Fre
qu
ency
, rap
pid
cem
ent,
ho
le le
ng
th
23 m
eter
60
50
40
30
20
10
0
Fig. 13 Grout volume frequencies of holes filled with rapid cement
and hole length C23 m (grout volume is cut at 160 l), N = 986
Grout volume in litres160140120100806040200
Fre
qu
ency
, mic
ro c
emen
t
60
50
40
30
20
10
0
Fig. 14 Grout volume frequencies of holes grouted with micro-
cement (grout volume is cut at 160 l), N = 1,098
Grout volume in litres
3000
2750
2500
2250
2000
1750
1500
1250
1000
750
500
250
0
Fre
qu
ency
400
300
200
100
0
Fig. 12 Grout volume frequencies for all holes, N = 2,606
2 Drill bit diameter 54 mm, 23 m hole length minus 2.5 m for packer
placement.
Rock Mass Grouting in the Løren Tunnel 979
123

4.2.2 Grouting Volumes and the DPI Factors Water
and Fracture
The water factors for the respective sections are plotted in
Fig. 16. A trend indicating that the water factor is
increasing (seen in the excavation direction) from B1224 to
the end of the tunnel (plotted with a red linear line) can be
observed. Based on this trend line, the water factor has
been normalised as described in Sect. 3.3.
In Figs. 17 and 18, the normalised water factor and the
fracturing factor, respectively, and the grout volumes are
plotted versus the profile number, and the main grouting
parameters are given. The curves are simply fitted over
each other to display possible connections between the
parameters.
For Fig. 17, some sections seem to have fairly good
correlation between the water factor and grout volumes, i.e.
for B1203–B1154 and B1085–B991, the lines have a rel-
atively good match. For B735–B667, the lines follow each
other’s paths, but have a scale difference. Also, an area
with less fluctuation, B901–B862, may have a certain
relationship.
1230 126012201210120011901180117011601150 12501240 1270
1230 126012201210120011901180117011601150 12501240 1270
Mapped leakages
DPI water factor
Dry High water fl owArea leakage Point leakage
Fig. 15 Leakage mapping in the tunnel (upper part) and interpolated water factor from DPI (lower part)
Profile No12001150110010501000950900850800750700650
Wat
er f
acto
r
50
40
30
20
10
0
Fig. 16 Water factor for each section, along with the trend line used in the normalisation
980 A. H. Høien, B. Nilsen
123

In Fig. 18, there are a few small areas that might indi-
cate a relationship between the fracturing factor and grout
volumes, i.e. B1055–B1033 and B784–B762.
5 Discussion and Conclusions
The pre-injection grouting that has been carried out for the
Løren tunnel has given a water ingress which is lower than
the pre-defined very strict restrictions, and, therefore,
seems to have been successful. The reservation, however,
has to be taken that this tunnel project is not quite com-
pleted, and there is a chance that the water ingress may
increase when the groundwater level is back to normal.
As shown in Table 5, the grouting procedures were
continuously modified during the construction process. To
obtain a satisfactory grouting result, it is important to
always evaluate the grouting procedures and observe the
water leakages in the tunnel. At the Løren tunnel, the
grouting procedures were adjusted to ensure satisfactory
grout consumption and the possibility for the pressure to
build up. Another adjustment for ensuring a satisfactory
grouting result was the regulation of distances between
curtains and grout hole lengths.
The experience from the Løren tunnel also emphasises
that, during tunnelling, it is very important to observe the
groundwater level and settlement of buildings for potential
reconsideration of settlement calculations, need for extra
waterproofing and/or need for permanent water injection.
In the Løren case, based on such considerations, a planned
watertight concrete lining and water infiltration system
were found not to be required. The temporary infiltration
125012001150110010501000950900850800750700650
50
40
30
20
10
0
50000
40000
30000
20000
10000
0
Water factor, normalized, WGrout volume
Profile No
Wat
er f
acto
r, n
orm
aliz
ed, W
Gro
ut vo
lum
e MicroMicro
04/0606/0604/06 60/40 80/80
MicrodipaRdipaR
Fig. 17 Normalised water factor and grout volume for each section (grouting parameters at the top)
125012001150110010501000950900850800750700650
200
160
120
80
40
0
50000
40000
30000
20000
10000
0
Fracturing, FGrout volume
Profile No
Fra
ctu
rin
g f
acto
r, F G
rou
t volu
me
MicroMicro
04/0606/0604/06 60/40 80/80
MicrodipaRdipaR
Fig. 18 Fracturing factor and grout volume for each section (grouting parameters at the top)
Rock Mass Grouting in the Løren Tunnel 981
123

boreholes in the tunnel were made permanent in case set-
tlement on buildings should resume (but are not in use).
During the grouting operation, a large portion of the
holes grouted with rapid cement was filled with approxi-
mately 52 l of grout, while for the holes grouted with micro-
cement, this same trend was not found (as shown in Figs. 14
and 15). This indicates that only the holes grouted with
rapid cement are filled, and that there is no penetration into
the rock mass. This illustrates that, in areas where water is
expected, it should always be considered to switch to micro-
cement in order to penetrate narrow water-bearing fractures.
It was also observed that a large portion of the holes
grouted with micro-cement had almost no grout con-
sumption (see Fig. 14). This may have been caused by
micro-cement intrusion from nearby holes, with controlled
curing, which cause the cement from nearby holes to
harden and impede the grouting. Because of this, one
should limit the quantities used when grouting with con-
trolled curing. Another large portion of the holes in Fig. 14
range from very small grout consumption to about 60 l. A
possible cause of the low grout consumption in these cases
may be explained by micro-cement without controlled
curing which may have intruded from distant holes, par-
tially hardened and interfered with the grout consumption.
As explained in Sect. 2.3, it was detected during con-
struction that the cement accelerator pump fed a lower amount
of grout than it was supposed to while performing controlled
curing. The pump used was a rotation pump, which was not
suitable for this application. It should, therefore, be empha-
sised that a piston pump, which can follow the strokes and flow
of the cement pump, should be used when dealing with
accelerator. This will ensure the right amount of accelerator
for a successful controlled curing process.
The DPI and grout volumes in the Løren tunnel indicate
that there may be a relationship between the grout volume
and water factor if special geological features are taken
into account.
There are many factors that may have had an influence
on the grouting volumes and DPI factors. The main vari-
ables that may affect the results are as follows:
• Structural geology
• Rock properties
• Rock cover
• Rock stress
• Surrounding terrain/topography
• Type of grout and w/c
• End pressure
• Groundwater level
• The order in which the holes are drilled
• The order in which the holes are grouted
From approximately B990–B900, layers of bentonite
rock have probably affected the grouting volumes. During
grouting in this area, grout reached the surface on several
occasions. The area above the tunnel had a lifting of the
ground likely caused by the grouting and grout was
observed as layers in the bedding plane direction during
mapping. This indicates that hydraulic fracturing of the
rock has caused new fractures that were not registered by
the DPI. The peaks in the water parameter seen in Fig. 14
at B1173 and B1055 can be related to syenite intrusions
(see Fig. 3). Peaks in grout consumption and an enlarge-
ment in water leakages can be observed in these areas. The
fluctuations in the area from B720 to B760 may arise from
a flat-lying syenite intrusion in the crown and it is also here
seen an enlargement in the mapped water leakages.
The sequence in which the holes are drilled may affect the
impact on the water factor. When a water-bearing fracture
that crosses several holes is drilled through for the first time,
this may drain the fracture and the impact on the following
holes might be smaller. It is hard to estimate how much this
affect the results, but since a relation can be seen between the
mapped water leakages and the water factor, it is assumed
that the water factor shows water where water is present.
The calculation of water and fracturing values (Eqs. 1 and
2) for the holes was created in such a way that it should take
into account that a large single sample value should count
more than a small value. This is because it is expected that a
rock with a large single water or fracturing value would
consume more grout than a small value, since it is expected
that there is more water in the rock (larger crack) or a more
distinct fracture. The increasing impacts, seen in Fig. 16, on
the water factor through the tunnel may be a result of lower
incoming water pressure on the tunnel rig caused by the
increasing length of water pipes and the tunnel gradient
which makes B667 32 m higher than B1224.
There are many factors that must be taken into account
when evaluating the grout consumption and DPI results.
For the study described in this paper, the interpretation of
the figures consists of a subjective and visual comparison,
where it may have been difficult to set cut-offs for where
the data were correlating or not. Still, some quite signifi-
cant relationships between the data for different areas have
been found. In Figs. 14 and 15, the lines for the water
factor, fracturing factor and grout volume are simply fitted
over each other. Scale differences can be seen even with
the normalised water data. This is not unexpected because
of changes in overburden, grouting procedures etc. Still, it
is possible to see a relationship between the variables if
areas with the special geological conditions are taken into
account. The area B735–B667 grouted with micro-cement
in Fig. 14 seems to have a scale difference between grout
volumes and the water factor, and similar grouting proce-
dures (micro-cement and stop criterion 60/40 bar). This
may be because of the increased percentages used for the
controlled curing, which have limited the grout volumes.
982 A. H. Høien, B. Nilsen
123

For future projects, a potentially very interesting use of
the DPI during grouting would be to distinguish between
the two basically different situations: (1) where there is
water and (2) where it is not water. In areas with no water
from the DPI, a grouting procedure with lower volumes
and end pressure should be used to save time and cement.
This might be achieved by using different grouting inten-
sity number (GIN) values (Brantberger et al. 2000; Lom-
bardi and Deere 1993) for different rock conditions based
on the DPI factors.
Based on the experience from the Løren project and
other Norwegian road tunnels, the MWD/DPI technology
is believed to have a great potential for predicting water
ingress and other rock mass parameters ahead of the tunnel
face. The interpretation of data is, however, still uncertain,
and more experience from tunnel projects is required in
order for the technology to become a fully reliable, routine
prediction tool. It is the intention that data collection for
further refinement of this technology will be done at sev-
eral road projects in the near future.
Acknowledgments The authors would like to thank the Norwegian
Public Roads Administration for giving them the opportunity to write
this article and Mr. Kari Bro, Mr. Patric Martenson and Mr. Greger
Burman at Rockma Systems AB for providing the data and sharing
their knowledge on the subject. In addition, thanks go to Ms. Inger
Aakre, Mr. Arild Neby, Mr. Henki Ødegaard and Mr. Alf Kveen for
the consultations during the writing process.
Open Access This article is distributed under the terms of the
Creative Commons Attribution License which permits any use, dis-
tribution, and reproduction in any medium, provided the original
author(s) and the source are credited.
References
Axelsson M, Gustafson G, Fransson A (2009) Stop mechanism for
cementitious grouts at different water-to-cement ratios. Tunn
Undergr Space Technol 24(4):390–397
Barstad M (2010) E 20 Lørentunnelen-Vanntett utstøpning av
dyprenne i Lørentunnelen. The Norwegian Public Roads
Administration, teknisk vurdering
Boge K (2010) Lørentunnelen. Vanntett utstøpning i dyprenne, Aas-
Jakobsen AS
Boge K (2012) E-mail on the current developments on groundwater
levels and settlements in the Løren tunnel project
Brantberger M, Stille H, Eriksson M (2000) Controlling grout
spreading in tunnel grouting—analyses and developments of the
GIN-method. Tunn Undergr Space Technol 15(4):343––352
Carlsvard C, Wallgren EE (2009) Utvardering av MWD-teknikens
mojligheter att identifiera vatternforande zoner vid Norra
Lankenprojektet i Stockholm, Master. Kungliga Tekniska hog-
skolan, Stockholm
Henriksen JP, Føyn T (2004) RV 150 Ring 3 Ulven-Sinsen—Forslag
til innlekkasjekreav for tunnelene—konsekvenser for omgivel-
sene. Norconsult AS
Humstad T, Høien AH, Hoel JE, Kveen A (2012) Complete software
overview of rock mass and support in Norwegian road tunnels.
In: Eurock 2012, Stockholm, Sweden, May 2012
IBM (2010) IBM SPSS Statistics. IBM SPSS, version 19.0.0.1. IBM,
Somers, NY
Iversen E (2011) Lørentunnelen—Longitudinal general geology
section map
Lombardi G, Deere D (1993) Grouting design and control using the
GIN-principle. Int Water Power Dam Constr 45(6):15–22
Rockma (2011) GPM? Tunnel. GPM?. Rockma System AB,
Skelleftea
Schunnesson H (1997) Drill process monitoring in percussive drilling
for location of structural features, lithological boundaries and
rock properties, and for drill productivity evaluation. Doctoral
thesis, Lulea University of Technology, Lulea
Segui JB, Higgins M (2002) Blast design using measurement while
drilling parameters. Fragblast 6(3–4):287–299
Smith B (2002) Improvements in blast fragmentation using measure-
ment while drilling parameters. Fragblast 6(3–4):301–310
Valli J (2010) Investigation ahead of the tunnel face by use of a
measurement-while-drilling system at Olkiluoto. Finland Work-
ing Report, vol 2010. Posiva Oy, Eurajoki
Vianova (2011) Novapoint Tunnel. Novapoint, 18.10 FP2c edn.
Vianova Systems AS, Sandvika
Rock Mass Grouting in the Løren Tunnel 983
123