Embed Size (px)
Citation preview
C A T E N A VOL. 6, 131 - 144 BRAUNSCHWEIG 1979
ROCK WEATHERING RATES AT THE SOIL SURFACE IN AN ALPINE ENVIRONMENT
Nel Caine I n s t i t u t e of Arc t ic and Alpine Research
and Department of Geography, Un ivers i ty of Colorado, Boulder, Colorado 80309, U.S.A.
SUMMARY
Mass loss from 60 g samples of crushed rhyodacite exposed on 71 plots at two loca- l i t i e s above t r ee l i ne in the San Juan Mountains, Colorado are used to estimate weathering rates at the soi l surface. The resu l ts define an average rate of loss of 0.079 ± 0.012 %/yr (mean of 42 plots over 5 years, ± 2 standard e r ro rs ) , with an apparent slowing of the rate as the period of observation increased. Two fea- tures of the so i l surface environment inf luence the observed weathering rates: the so i l pH (which is dependent on the vegetation cover); and the volume and residence time of water moving through and over the s o i l . Both of these are contro l led basic- a l l y by the d i s t r i b u t i o n of the winter snow cover.
RESUME
Dans le mi l ieu a lp in des San Juan Mountains (sudouest Colorado), on a m~sur~ la perte de masse des ~chant i l lons fragment,s d'andesite resul tant de l ' a l t ~ r a t i o n la surface du sol . Les r~su l ta ts montrent une perte moyenne de 0.079 ± 0.012 %/yr (moyenn~ f a i t e ~ p a r t i r de 42 parcel les de ter ra ine pendant 5 ann~es, ± 2 ~carts- types de la moyenne). La v i tesse d 'a l t~ ra t i on est inversement propor t ionel le ~ la dur~e d'observat ion. A la surface du sol , deux facteurs inf luencent la v i tesse de l ' a l t ~ r a t i o n des echant i l lons: l ' a c i d i t ~ su sol (pH); et la volume et la dur~e de r~sidence de l 'eau de fonte. En f i n de compte, ces deux facteurs r~f lech issent la r epa r t i t i on du couvert neigeux d 'h iver .
i . INTRODUCTION
In empir ical studies of geomorphic a c t i v i t y and soi l development, rock weathering processes f requent ly remain unconsidered although they are obviously important in providing the material input to both geomorphic and soi l systems. In a geomorphic context, solute t ransport has been shown to be important by many studies of the water draining from r i v e r basins (e.g. JACKLI 1957, RAPP 1960, HEMBREE & RAINWATER 1961, DOUGLAS 1973). However these studies usual ly say l i t t l e about the local sour- ces of solutes and cannot be used to estimate bedrock weathering rates without an assumption of steady state in the system. Such an assumption is dangerous given the natural and man-made changes in environment systems of the recent geologic past (DOUGLAS 1967, JENNINGS 1965, TRIMBLE 1975).
Laboratory experiments on weathering processes in contro l led environments o f fe r a par t ia l solut ion to these problems and have been espec ia l l y useful in def in ing l i t h o l o g i c influences on rock weathering (e.g. HENIN & PEDRO 1965, POTTS 1970,
131
GOUDIE 1974). However, simulated and natural environments may not be analogous. Some workers ( p a r t i c u l a r l y those concerned with limestone weathering) have recent- l y used a composite of f i e l d and laboratory techniques, invo lv ing the measurement of solut ion loss from 'rock tab le ts ' (TRUDGILL 1975, 1976). PEARCE (1976) describes another procedure for est imating to ta l weathering rates of exposed bedrock in s i t u , though his resu l ts do not suggest a high level of precis ion.
This paper reports on an evaluat ion of weathering rates and t he i r controls in the soi l surface environment. The approach used is s im i la r in many respects to that of rock tab le t studies, in pa r t i cu la r because i t has been conducted in the f i e l d on an approximately uniform rock mater ia l . The study was i n i t i a l l y intended to tes t the inf luence of snow accumulation on weathering rates in alpine areas (CAINE 1976), but the data also al low an empirical evaluat ion of other environmental inf luences, many of which are related to the d i s t r i bu t i on of the alpine snow cover. These re- sul ts are based upon f i v e years of observation: the experiment continues at the present t ime, but i t seems un l i ke l y that the conclusions presented here w i l l be s i g n i f i c a n t l y modified by a longer period of study.
2. PROCEDURES
The basic procedure used is a combination of those used in evaluat ing limestone solut ion rates by rock tab le ts (TRUDGILL 1975) and those used in estimating plant l i t t e r decomposition rates (WOOD 1970, WEBBER et a l . 1976). I t involves the ex- posure to natural weathering processes of samples of rock material in d i f f e ren t alp ine environments and the per iodic monitoring of each sample for changes in mass. This provides a simple measure of mass change for many d i f f e ren t s i tes even though i t does not have a high level of precision (at leas t , as applied in th is study). Nor does i t i d e n t i f y d i r e c t l y the processes involved in producing a measured change.
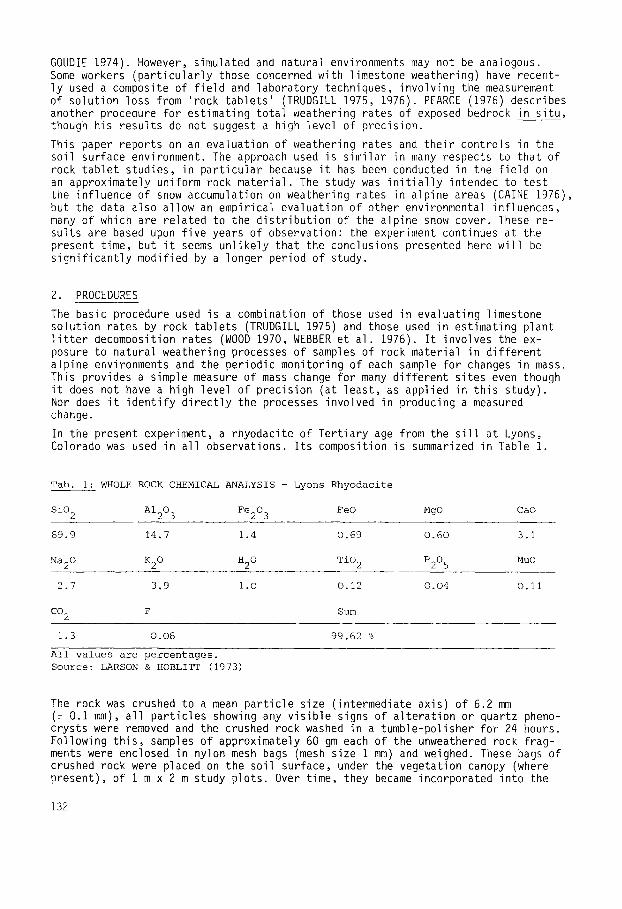
In the present experiment, a rhyodacite of Ter t ia ry age from the s i l l at Lyons, Colorado was used in a l l observations. I t s composition is summarized in Table I .
Tab. i: WHOLE ROCK CHEMICAL ANALYSIS - Lyons Rhyodacite
SiO 2 A1203 Fe203 FeO MgO CaO
69 .9 14 ,7 1.4 0 . 6 9 0 . 6 0 3.1
Na20 K20 H20 TiO 2 P205 MuO
2.7 3,9 i.O O.12 O.O4 O.i]
CO 2 F Sum
1.3 0.06 99.62 %
All values are percentages. Source: LARSON & HOBLITT (1973)
The rock was crushed to a mean pa r t i c l e size ( intermediate axis) of 6.2 mm (± 0.1 mm), a l l pa r t i c les showing any v i s i b l e signs of a l t e ra t i on or quartz pheno- crysts were removed and the crushed rock washed in a tumble-pol isher for 24 hours. Following t h i s , samples of approximately 60 gm each of the unweathered rock f rag- ments were enclosed in nylon mesh bags (mesh size 1 mm) and weighed. These bags of crushed rock were placed on the so i l surface, under the vegetation canopy (where present), of i m x 2 m study p lo ts . Over t ime, they became incorporated into the
132
uppermost 1 cm of the epipedon as vegetat ion growth and decay occurred around them but the disturbance due to annual measurement ensured that they remained v i s i b l e w i t h i n the surface l i t t e r . Because the bags were unprotected, many of them were damaged or l os t during the experimental period and th i s has had the e f fec t of re- ducing the number of samples in the experiment as i t progressed. I t was not thought reasonable to replace damaged samples by fresh ones because of an apparent time dependence in rates of mass change.
Changes in the mass of each sample have been monitored by weighing to + 0.0001 g at year ly i n te rva l s fo r f i ve years (1972 - 1977). Pr ior to weighing, a l l samples were dr ied at I05°C fo r 12 hours and any dust and plant debris removed by forced a i r d ra f t . In a few cases, washing in deionized water, fol lowed by rapid dry ing, was also necessary to remove mud from the samples. Because the samples were not p rec ise ly the same weight i n i t i a l l y , a l l changes in mass are expressed on a re la - t i ve scale (percent /year) .
2.1. Procedural Error
Two samples were o r i g i n a l l y placed approximately 2 m apart on each study p lo t to a l low er ror est imat ion. This r e p l i c a t i o n gives a w i t h i n - p l o t er ror estimate which includes both the natural v a r i a b i l i t y (due to environmental d i f ferences across the 2 m 2 p lo t ) and the er ro r due to the measurement procedure. This er ror estimate does not include a l l of the study p lots fo r the en t i re f i ve years of observat ion, because of damage and loss, but there is no reason to suppose a bias in the pattern of loss s u f f i c i e n t to in f luence a general e r ror estimate.
Eight-one rep l i ca tes are ava i lab le for d i f f e r e n t p lo t -years and these give an average standard dev ia t ion of 0.025 %/yr. This corresponds to a standard er ror of the mean 0.0177 %/yr and a 95 % confidence in te rva l on the p lo t -year mean values of ± 0.035 %/yr. There is no reason to suggest that the magnitude of t h i s er ror estimate has varied during the period of study (F = 0.889, wi th d . f . 3:77).
The er ror estimate of 0.035 %/yr is high r e l a t i v e to the observed rates of weather- ing loss (average c o e f f i c i e n t of v a r i a b i l i t y 44 %) and suggests that the procedures used in the study have only a low level of prec is ion. This derives from the two sources mentioned e a r l i e r and cannot be ascribed so le ly to measurement problems. The local environment of a 2 m 2 study p lo t is h igh ly var iab le in a lp ine areas: i nd i v idua l weathering bags on the same p lo t were often exposed to very d i f f e r e n t cond i t ions . This source of e r ro r remains in an evaluat ion of the contro ls of weath- er ing where i t is re f lec ted in a scale d i f fe rence of three orders of magnitude be- tween the study p lo t (to which environmental descr iptors apply) and the area of material exposed to weathering in the experiment. I t suggests that high s t a t i s t i c - al co r re la t i ons are un l i ke l y . The second source of w i t h i n p lo t -year er ror is due to measurement procedures and derives from two con t r ibu t ions that have not been separately evaluated. F i r s t , the use of samples of crushed rock, ra ther than rock t ab le t s , means that the i n i t i a l mass of material in each sample is var iab le and, wi th i t , the surface area of rock exposed to weathering. Second, there have been var ia t ions in the amount and type of sample preparat ion p r i o r to weighing: dust and debris removal is made d i f f i c u l t by the use of rock fragments and would not have been the same fo r a l l samples.
2.2. F ie ld Area
F i f t y p lots in the v i c i n i t y of Eldorado Lake (37 o 47'N; 107 ° 33'W) at about 4000 m e levat ion in the San Juan Mountains of southwestern Colorado (Figure i ) were used in an empir ical study of geomorphic a c t i v i t y (CAINE 1976), part of which is re- ported in t h i s paper. On 42 of these p lo ts , samples of crushed rhyodaci te were ex- posed in a va r i e t y of a lp ine environments. The p lots range from blocky ta lus and b lock f i e ld (where the vegetat ion cover is l im i ted to l i chen and moss) to a dense alpine turf of Kobresia myosurides, Deschampsia casepitosa or Geum rossii. It
133
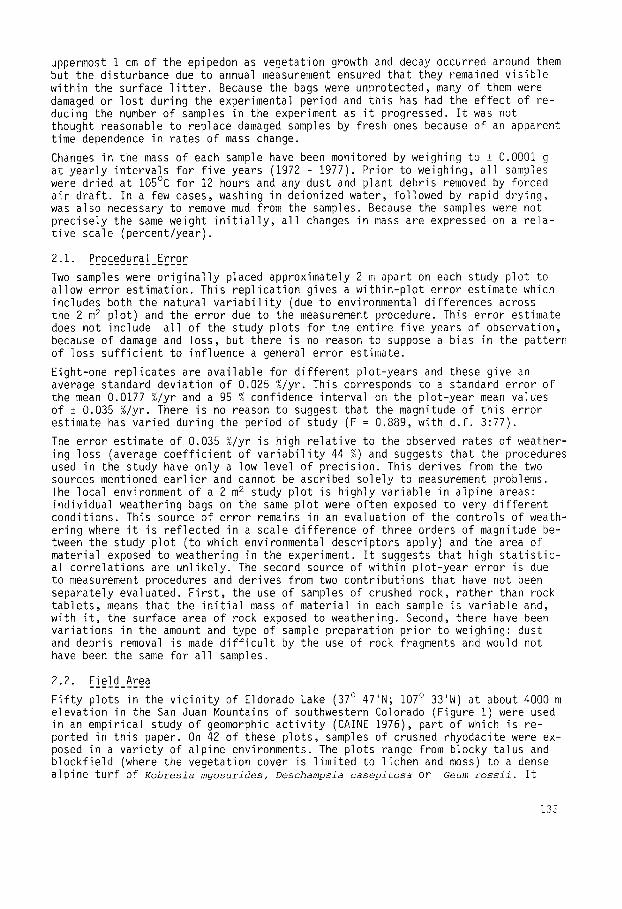
E 11o7o also includes a wide range of snow condi t ions: some
LOCATION ~AP ~ • of the study plots remain / , , ~ _ . s free of snow for almost the / u ~ k ~ 4~t en t i re year (because of
L 25 km I ]Fork ~S f \.@j wind d r i f t i n g ) ; about ten _ _ ~ , of them re ta in a year-round
} .~ i snow cover through one year 38o .ILAXE ~_~,~ 38 o_ out of tWO or three on
CITY average. This contrast is ~ / ) f f , ~ , - - / ~ ' , s " important in l i g h t of other
work which suggests that S~LVE~TON F -~'• . CRC~:Dt~ the local water budget is
• t a basic control of weather- I ing (e g THORN 1976).
ELDORADO • " " % ; , - . - , LAKE In add i t ion to the 42 plots ~ j ~ W~LL~S at Eldorado Lake, weather-
~ 6"O%-[ LAKES " . , ~ . . , . , ing rates were also es t i -
(i I mated by the same proce- dures on 29 plots near the
COLORADO 7" ) ~ ~.,~ UTA~ . ,,) Will iams Lake (370 37'N; l" 1070 9'W) (Figure I ) . The
. . . . fP/~AC~O k resul ts of th is experiment . . . . . . . . . . . . . . . . . . . . . . . . SA I s w i l l be used here as an
'~RIZONA NEW MEXICO ~/ SPRiNtS ~'~ independent test on conclu- ~/~o7 o ~ sions drawn from the Eldo-
~ ~ rado Lake study. The Wil- liams Lake study was con-
Fig . i : Loca t ion map. The s tudy areas a t E lodrado Lake ducted at lower a l t i t u d e and Williams Lakes are both close to the Con- (at about 3600 m e levat ion tinental Divide, in the headwaters of tributa- and close to treeline al- ries to the San Juan River. though s t i l l w i t h i n the
alpine zone) and for a shorter period (2 years) than that at Eldorado Lake. The difference in the duration of the experiments and in the general environments of the two field areas preclude pooling of the data from them.
3. WEATHERING RATES
3.1. ~g~grg!_99~g~_gf_~lg~9grJ~
For the 42 p lots at Eldorado Lake and the f i ve years of the study, the mean rate of mass loss due to weathering was 0.079 %/yr, with a standard dev ia t ion of 0.039 %/yr. Assuming an exponential model, th is corresponds to a ' h a l f - l i f e ' fo r rhyodacite fragments l i k e those used in the experiment of about 880 yrs in the so i l surface environment. These estimates are corroborated by the resul ts of the Will iams Lakes study. There, the mean rate of mass loss for the 21 p lo ts , fo r which a two-year record is ava i l ab le , is 0.086 %/yr with a standard dev ia t ion of 0.038 %/yr. Neither the mean rates nor the variances estimated from the two f i e l d areas are s i g n i f i c a n t l y d i f f e r e n t : for the means, t = 0.7, with 61 d . f . ; and fo r the variances F = 1.05 with 41:20 d . f . . However, the suggestion that more rapid loss occurs in the f i r s t two years of study than over a longer period is supported by fu r the r analysis (below). The high level of v a r i a b i l i t y shown by these resul ts (44 % < C.V. < 50 %) corroborates the observations of to ta l weathering made by PEARCE (1976) which defined even greater coe f f i c i en ts of va r i a t i on (83 % < C.V. < i11%) .
The comparison of these rates with those in the natural systems in which the expe-
l34
riments were conducted is not simple and can only be attempted for the Will iams Lakes case. The Wil l iams Lakes catchment is underlain by breccias and andesi t ic lavas of the Potosi Volcanic Series (Miocene age) and so involves a bedrock which is broadly s im i l a r to that used in the weathering rate estimates. For three years, including the two years of the study, solute removal from the 0.98 km 2 basin aver- aged 2425 kg/yr a f te r correct ion for solutes in the p rec ip i ta t ion (CAINE 1976). Ignoring the 0.28 km ~ of the basin that is bedrock or standing water, and assuming that the solute load is derived from 10 cm th ick debris cover on the remaining area of the basin, suggests that solute removal is from a mass of 133 x 105 kg of rock mater ia l . The removal of 2425 kg/yr would then correspond to 0.002 %/yr; that i s , only 1/50 of the rate estimated from f resh ly crushed rhyodacite. The d i spa r i t y is approximately equal to that estimated elsewhere as a Sediment Del ivery Ratio (e.g. TRIMBLE 1975). I t may be accounted for by the 'age' of the s u r f i c i a l mate- r i a l in the basin (by comparison to the fresh nature of the rock used in th is ex- periment); by the coarser texture of much of the catchment cover, or by t ransfers wi th in the catchment or so i l system that are not re f lec ted in the removal e s t i - mate. The f i r s t of these a l te rna t i ves seems the most a t t r ac t i ve and is fur ther supported by a decl ine in observed weathering rates with duration of exposure (below).
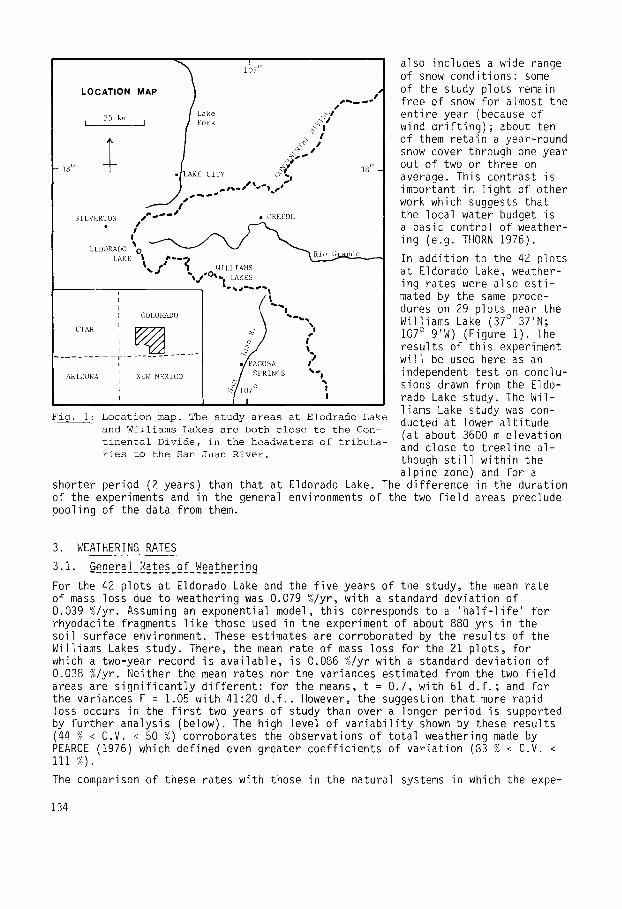
3.2. ! ~ m ~ e [ ~ ! _ ~ [ ~ _ i ~ _ ~ [ ! ~ _ ~ During the f i ve years of study at Eldorado Lake, the measured rate of mass loss from samples of crushed rock has not been constant (Figure 2). Samples on 11 of the 42 plots showed a net gain in mass during the f i r s t year of study but, fo l low-
ing t h i s , a net loss has been ge- neral . The i n i t i a l gain in mass was e a r l i e r interpreted as a re-
+ ,s f l ec t i on of hydration and oxida- t ion on the f resh ly fractured sur-
. . . . ~ faces of the samples used (CAINE
k ~ 1976, 170), although th is supposi-
t ion is not s t a t i s t i c a l l y suppor- ted. Af ter the f i r s t year, a l l
~ ~ Weathering Rates have shown net loss a l - plots a
-is \ \ \ ~ ~ though the rate of loss by weath- -o, ering seems to have declined pro-
~\ \ \ g ress iv ley with time. Extrapola- Change ~:) ~ \ ~ t ion of th is decline suggests \ ~ ~\ tha t , in a few decades at most,
the weathering rate of crushed an- "~\ ~ \ \ desite would approximate that e s t i -
-o2 ~\ ~ mated for the en t i re Will iams Lake ~ \ \ ~ ~'~, basin (0.002 %/yr).
The two years of observation from ~,~,\ k~ "~~.~~ the Will iams Lakes area show a pat- -, tern which is s im i l a r to that found
-o3 ~ "- in the equivalent period on the Elodrado Lake plots. In the f i r s t year, the mean rate of mass loss
~-~ is low (x = 0.036 %/yr with s = ~ 0.061%/yr) and four from 29 plots
. . . . . . show a net increase in mass. In 1972 1973 1974 1975 1976 1977
the second year, an accelerat ion F i g . 2 : R h y o d a c i t e w e a t h e r i n g r a t e s i n t h e San o f weathering rates occurred (x =
Juan Mountains, 1972 - 1977. Average 0.136 %/yr with s = 0.068). The rates of mass change (%) for all plots later slowing of this rate that at Eldorado Lake are shown, with a seems to have o c c u r r e d on the E l - s i n g l e s t a n d a r d d e v i a t i o n e n v e l o p e .
135
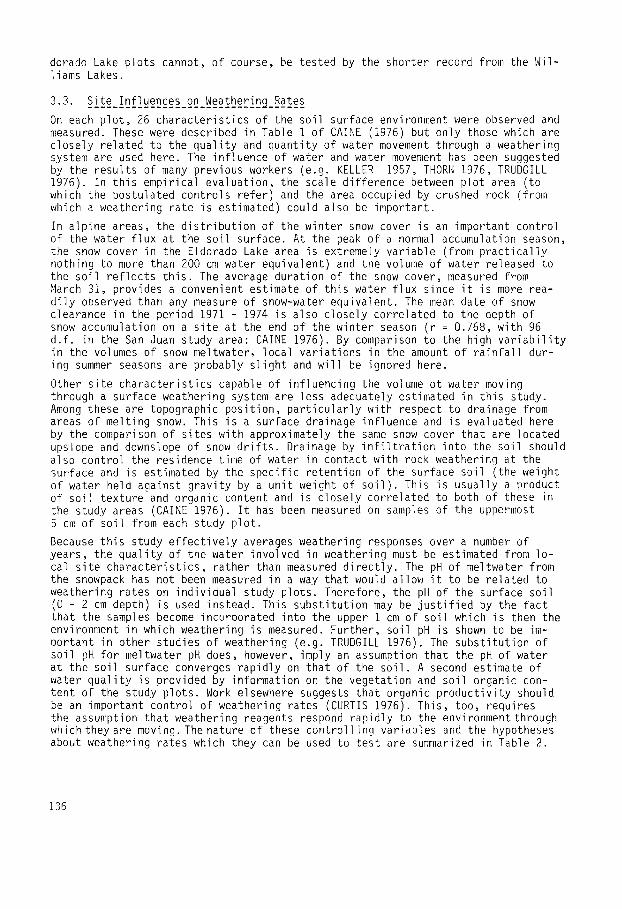
dorado Lake p lots cannot, of course, be tested by the shorter record from the Wil- liams Lakes.
3.3. ~i~_!~!~_~_~b~_~ On each p l o t , 26 cha rac te r i s t i cs of the so i l surface environment were observed and measured. These were described in Table 1 of CAINE (1976) but only those which are c lose ly re lated to the q u a l i t y and quan t i t y of water movement through a weathering system are used here. The in f luence of water and water movement has been suggested by the resu l ts of many previous workers (e.g. KELLER 1957, THORN 1976, TRUDGILL 1976). In t h i s empir ical eva lua t ion , the scale d i f fe rence between p lo t area (to which the postulated cont ro ls re fer ) and the area occupied by crushed rock (frown which a weathering rate is estimated) could also be important.
In a lp ine areas, the d i s t r i b u t i o n of the w in ter snow cover is an important control of the water f l u x at the so i l surface. At the peak of a normal accumulation season, the snow cover in the Eldorado Lake area is extremely var iab le (from p r a c t i c a l l y nothing to more than 200 cm water equ iva lent ) and the volume of water released to the so i l r e f l ec t s t h i s . The average durat ion of the snow cover, measured from March 31, provides a convenient estimate of t h i s water f l u x since i t is more rea- d i l y observed than any measure of snow-water equ iva lent . The mean date of snow clearance in the period 1971 - 1974 is also c lose ly corre lated to the depth of snow accumulation on a s i te at the end of the w in ter season (r = 0.768, wi th 96 d . f . in the San Juan study area: CAINE 1976). By comparison to the high v a r i a b i l i t y in the volumes of snow meltwater, local va r ia t ions in the amount of r a i n f a l l dur- ing summer seasons are probably s l i g h t and w i l l be ignored here.
Other s i t e cha rac te r i s t i cs capable of i n f l uenc ing the volume ot water moving through a surface weathering system are less adequately estimated in th is study. Among these are topographic pos i t i on , p a r t i c u l a r l y wi th respect to drainage from areas of melt ing snow. This is a surface drainage in f luence and is evaluated here by the comparison of s i tes wi th approximately the same snow cover that are located upslope and downslope of snow d r i f t s . Drainage by i n f i l t r a t i o n in to the so i l should also contro l the residence time of water in contact wi th rock weathering at the surface and is estimated by the spec i f i c re ten t ion of the surface so i l (the weight of water held against g rav i t y by a un i t weight of s o i l ) . This is usua l ly a product of so i l tex ture and organic content and is c lose ly corre lated to both of these in the study areas (CAINE 1976). I t has been measured on samples of the uppermost 5 cm of so i l from each study p lo t .
Because t h i s study e f f e c t i v e l y averages weathering responses over a number of years, the q u a l i t y of the water involved in weathering must be estimated from lo - cal s i t e c h a r a c t e r i s t i c s , rather than measured d i r e c t l y . The pH of meltwater from the snowpack has not been measured in a way that would a l low i t to be re lated to weathering rates on i nd i v idua l study p lo ts . Therefore, the pH of the surface so i l (0 - 2 cm depth) is used instead. This subs t i t u t i on may be j u s t i f i e d by the fac t that the samples become incorporated in to the upper 1 cm of so i l which is then the environment in which weathering is measured. Fur ther , so i l pH is shown to be im- portant in other studies of weathering (e.g. TRUDGILL 1976). The subs t i t u t i on of so i l pH fo r meltwater pH does, however, imply an assumption that the pH of water at the so i l surface converges rap id l y on tha t of the s o i l . A second estimate of water q u a l i t y is provided by informat ion on the vegetat ion and so i l organic con- ten t of the study p lo ts . Work elsewhere suggests that organic p roduc t i v i t y should be an important contro l of weathering rates (CURTIS 1976). This, too, requires the assumption tha t weathering reagents respond rap id l y to the environment through which they are moving. The nature of these c o n t r o l l i n g var iab les and the hypotheses about weathering rates which they can be used to tes t are summarized in Table 2.
136
Tab. 2: ENVIRONMENTAL FACTORS IN ROCK WEATHERING
Hypothesized In{}uence on Variable Dimensions Rock Weathering Test Procedure
i. Average Snow Days (after We : f(+S), approximately Corr./Regn.
Cover Duration (S) March 31) linear
2. Relative Topo- None We increases downslope Student t
graphic Position (classification)
3. Soil Specific % (wt/wt) We = f(SR), until a solu- Corr./Regn.
Retention (SR) tion equilibrium is
reached
4. Surface Soil pH Count, Log. We = f(-pH) Corr./Regn.
Scale
5. Vegetation % ground cover, We = f(+Cover) Student t
classification ANOVA
i) We = rate of weathering, mass loss (%/yr).
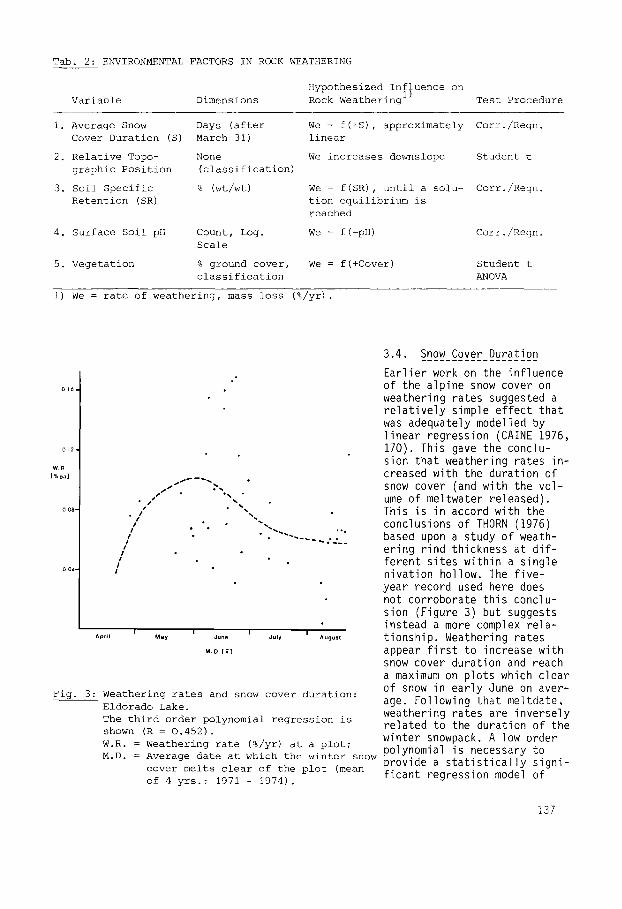
3 .4 . Snow Cover Duration
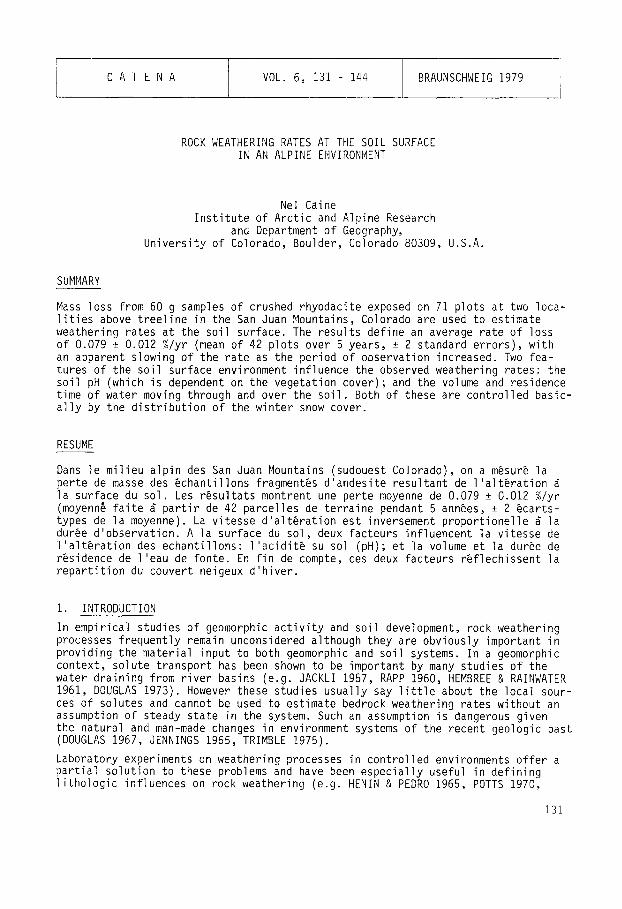
E a r l i e r work on the in f luence o,o- of the a lp ine snow cover on
weathering rates suggested a r e l a t i v e l y simple e f f e c t tha t was adequately modelled by l i n e a r regression (CAINE 1976,
o,2- 170). This gave the conclu- sion tha t weathering rates in -
W.R [~D~J creased with the durat ion of
" "- snow cover (and wi th the vo l - • / "" " ume of meltwater re leased) . '" "~'- This is in accord with the 008" . / " .
/ , " " . . conclusions of THORN (1976) / " . . •
" . ' " . . . . . . . : : _ _ based upon a study of weath- i I , er ing r ind thickness at d i f -
/ f e ren t s i tes w i th in a s ingle oo,. , n iva t ion hollow. The f i v e -
year record used here does not corroborate th is conclu- sion (Figure 3) but suggests instead a more complex r e l a -
I I I I Apri, May June Ju,y Augu,, t ionsh ip . Weathering rates
M oc~ appear f i r s t to increase wi th snow cover durat ion and reach a maximum on plots which c lear of snow in ear ly June on aver-
Fig. 3:Weathering rates and snow cover duration: age. Following that meltdate Eldorado Lake. The third order polynomial regression is weathering rates are inversely s h o w n ( m = 0 . 4 5 2 ) . re la ted to the durat ion of the
w in ter snowpack. A low order W.R. = Weathering rate (%/yr) at a plot; polynomial is necessary to M.D. = Average date at which the winter snow
cover melts clear of the plot (mean provide a stat ist ical ly signi- o f 4 y r s . : 1 9 7 1 - 1 9 7 4 ) . f i c a n t regression model of
137
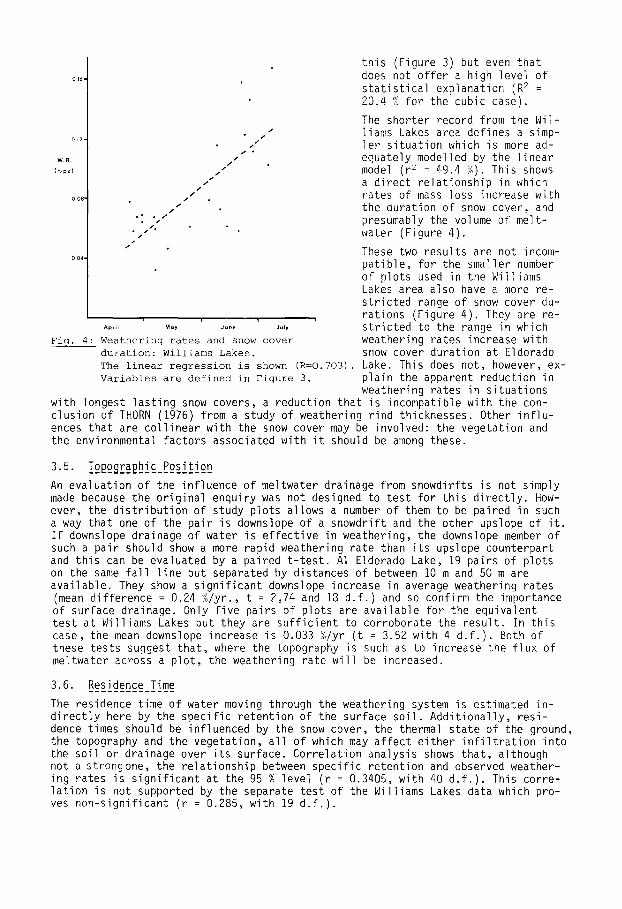
th is (Figure 3) but even that o,6- does not o f fe r a high level of
s t a t i s t i c a l explanat ion (R 2 = 20.4 % for the cubic case).
The shorter record from the Wil- • " l iams Lakes area defines a simp-
o .... , - l e r s i t ua t ion which is more ad- i •
. . . . " equately modelled by the l i nea r ~..~pa~ ." model (r 2 = 49.4 %). This shows
." a d i rec t re la t i onsh ip in which I
oo8- , " rates of mass loss increase with ." the durat ion of snow cover, and
"; "." presumably the volume of melt- " ." water (Figure 4).
" These two resul ts are not incom- oo4- pa t i b l e , for the smaller number
of plots used in the Williams Lakes area also have a more re- s t r i c ted range of snow cover du- rat ions (Figure 4). They are re- i
April Mm, June Ju,y s t r i c ted to the range in which F i g . 4 : W e a t h e r i n g r a t e s a n d s n o w c o v e r weathering rates increase with
duration: Williams Lakes. s n o w c o v e r durat ion at Eldorado The linear regression is shown (R=O.703). Lake. This does not, however, ex-
Variables are defined in Figure 3, plain the apparent reduction in weathering rates in s i tua t ions
with longest las t ing snow covers, a reduction that is incompatible with the con- c lusion of THORN (1976) from a study of weathering r ind thicknesses. Other i n f l u - ences that are c o l l i n e a r with the snow cover may be involved: the vegetat ion and the environmental factors associated with i t should be among these.
3.5. ! g ~ p b i ~ _ ~ ! ~ i e ~ An evaluat ion of the inf luence of meltwater drainage from snowdirfts is not simply made because the o r ig ina l enquiry was not designed to test for th is d i r e c t l y . How- ever, the d i s t r i b u t i o n of study plots allows a number of them to be paired in such a way that one of the pa i r is downslope of a snowdri f t and the other upslope of i t . I f downslope drainage of water is e f f ec t i ve in weathering, the downslope member of such a pa i r should show a more rapid weathering rate than i t s upslope counterpart and th is can be evaluated by a paired t - t e s t . A1 Eldorado Lake, 19 pairs of plots on the same f a l l l i ne but separated by distances of between I0 m and 50 m are ava i lab le . They show a s i g n i f i c a n t downslope increase in average weathering rates (mean d i f fe rence = 0.24 %/yr. , t = 2,74 and 18 d . f . ) and so confirm the importance of surface drainage. Only f i ve pairs of plots are ava i lab le for the equivalent tes t at Will iams Lakes but they are s u f f i c i e n t to corroborate the resu l t . In th is case, the mean downslope increase is 0.033 %/yr ( t = 3.52 with 4 d . f . ) . Both of these tests suggest tha t , where the topography is such as to increase the f l ux of meltwater across a p lo t , the weathering rate w i l l be increased.
3.6. Residence Time
The residence time of water moving through the weathering system is estimated in- d i r e c t l y here by the spec i f i c re tent ion of the surface so i l . A d d i t i o n a l l y , res i - dence times should be inf luenced by the snow cover, the thermal state of the ground, the topography and the vegetat ion, a l l o f which may a f fec t e i the r i n f i l t r a t i o n in to the so i l or drainage over i t s surface. Corre la t ion analysis shows tha t , although not a strongone, the re la t i onsh ip between spec i f i c re tent ion and observed weather- ing rates is s i g n i f i c a n t at the 95 % level (r = 0.3405, with 40 d . f . ) . This corre- l a t i o n is not supported by the separate test of the Will iams Lakes data which pro- ves non-s ign i f i can t (r = 0.285: with 19 d . f . ) .
3.7. ~ _ 9 ~ ! ! ~
Although the pH of snow meltwater has not been observed cons is tent ly throughout the study, i t is reasonable to assume that , at ground l eve l , i t rap id ly approxi- mates that of the surface s o i l . The pH of the surface soi l is correlated with mea- sured weathering rates, and in a way that suggests a con t ro l l i ng inf luence (r = -0.4363, with 40 d . f . ) : a reduction in the soi l pH from 7.0 to 4.0, i . e . , across the range observed on the Eldorado Lake p lo ts , produces a doubling of the weather- ing rate. This is confirmed by data from Will iams Lake where a s im i la r inverse cor re la t ion between soi l pH and weathering rates is found (r = -0.6702, with 19 d . f . ) . Here, however, i t is defined for a more res t r i c ted range of pH values than that fo r the Eldorado Lake area (observed pH var ies from 5.2 to 6.5 only at Wil- liams Lakes).
3.8. ~@g@~!9~_~gZgE
Estimates of the vegetative ground cover on study plots at both Eldorado Lake and Williams Lakes define a bimoda] distribution which reflects the subjective choice of study plots. The ground cover is usually either high or low and because of this bimoda]ity not we]] suited to correlation analysis. Therefore, the vegetation in- fluence has been evaluated by analysis of variance which has the further advantage of al lowing simple c l a s s i f i c a t i o n by vegetation type, as well as amount.
A two-way c l a s s i f i c a t i o n of the 42 plots at Eldorado Lake by ground cover alone shows the plots with a r e l a t i v e l y high cover (more than 65 %) to have more rapid weathering rates than those with less than 40 % cover. However, evaluat ion of the s igni f icance of th is d i f ference is not simple because the two sample variances are inhomogeneous (Table 3). Further tes t ing using the non-parametric Kruskal- Wall is tes t (SEIGAL 1956, 184) confirms that the d i f ference is s t a t i s t i c a l l y s ig- n i f i can t (H = 7.8 with 1 d . f . ) and so supports the contention that a vegetation cover is associated with more rapid weathering rates.
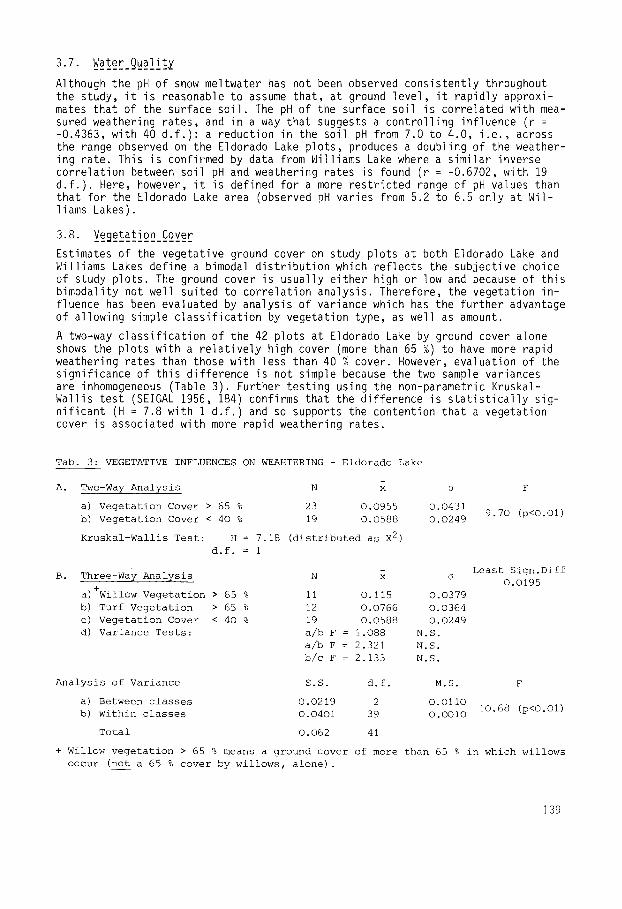
Tab. 3: VEGETATIVE INFLUENCES ON WEAHTERING - Eldorado Lake
A. Two-Way Analysis N x ~ F
a) Vegetation Cover > 65 % 23 0.0955 O.O431 9.70 (p<O.Ol)
h) Vegetation Cover < 40 % 19 0.0588 0.0249
Kruskal-Wallis Test: H = 7.18 (distributed as X 2)
d.f.=l
- Least Sign. Diff B. Three-way Analysis N x 0
O.O195
a)+Willow Vegetation > 65 % ii O.115 0.0379
b) Turf Vegetation > 65 % 12 0.0766 0.0364
c) Vegetation Cover < 40 % 19 0.0588 0.0249
d) Variance Tests: a/b F : 1.O88 N.S.
a/b F = 2.321 N.S.
b/c F = 2.133 N.S.
Analysis of Variance S.S. d.f. M.S. F
a) Between classes 0.O219 2 0.0110 10.68 (p<O.Ol)
b) Within classes O.O401 39 O.OO10
Total 0.062 41
+ Willow vegetation > 65 % means a ground cover of more than 65 % in which willows
occur (not a 65 % cover by willows, alone).
139
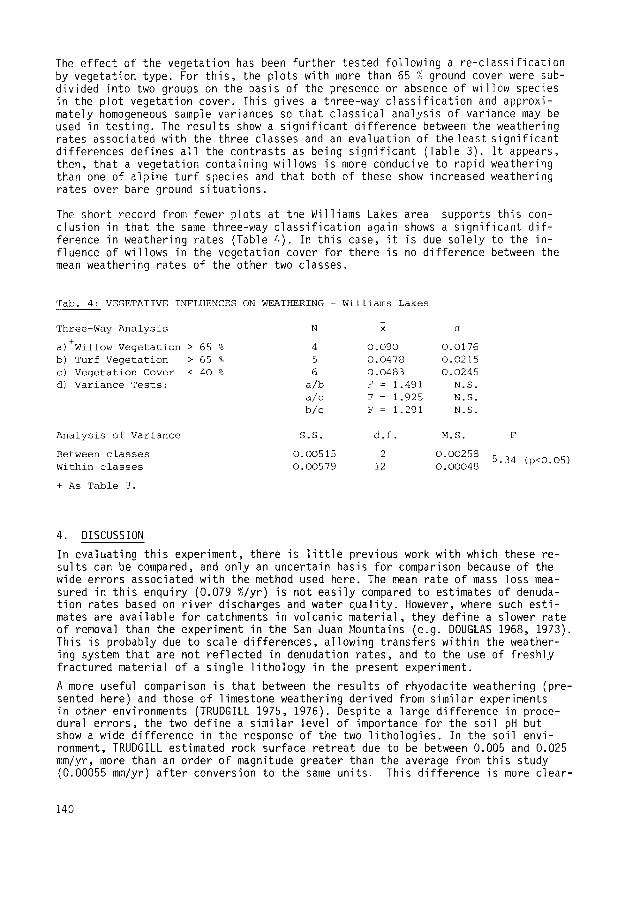
The e f fec t of the vegetat ion has been f u r t he r tested fo l low ing a r e - c l a s s i f i c a t i o n by vegetat ion type. For t h i s , the plots wi th more than 65 % ground cover were sub- d iv ided in to two groups on the basis of the presence or absence of w i l l ow species in the p lo t vegetat ion cover. This gives a three-way c l a s s i f i c a t i o n and approxi- mately homogeneous sample variances so tha t c lass ica l analys is of variance may be used in t es t i ng . The resu l t s show a s i g n i f i c a n t d i f fe rence between the weathering rates associated wi th the three classes and an evaluat ion of t he leas t s i g n i f i c a n t d i f ferences def ines a l l the contrasts as being s i g n i f i c a n t (Table 3). I t appears, then, that a vegetat ion conta in ing wi l lows is more conducive to rapid weathering than one of a lp ine t u r f species and that both of these show increased weathering rates over bare ground s i t ua t i ons .
The short record from fewer p lots at the Wil l iams Lakes area supports th i s con- c lus ion in that the same three-way c l a s s i f i c a t i o n again shows a s i g n i f i c a n t d i f - ference in weathering rates (Table 4). In t h i s case, i t is due so le ly to the in - f luence of w i l lows in the vegetat ion cover fo r there is no d i f fe rence between the mean weathering rates of the other two classes.
Tab. 4: VEGETATIVE INFLUENCES ON WEATHERING - Williams Lakes
Three-Way Analysis N x
a)+Willow Vegetation > 65 % 4 0.090 O.O176
b) Turf Vegetation > 65 % 5 0.0478 O.O215
c) Vegetation Cover < 40 % 6 0.0483 0.0245
d) Variance Tests: a/b F : 1.491 N.S.
a/c F : 1.925 N.S.
b/c F : 1.291 N.S.
Analysis of Variance S.S. d.f. M.S. F
Between classes 0.00515 2 0.00258 5.34 (p<O.OS)
Within classes 0.00579 12 0.00048
+ As Table 3.
4. DISCUSSION
In evaluat ing t h i s experiment, there is l i t t l e previous work wi th which these re- su l ts can be compared, and only an uncerta in basis fo r comparison because of the wide errors associated wi th the method used here. The mean rate of mass loss mea- sured in t h i s enquiry (0.079 %/yr) is not eas i l y compared to estimates of denuda- t i on rates based on r i v e r discharges and water q u a l i t y . However, where such e s t i - mates are ava i lab le fo r catchments in volcanic mate r ia l , they def ine a slower rate of removal than the experiment in the San Juan Mountains (e.g. DOUGLAS 1968, 1973). This is probably due to scale d i f fe rences , a l lowing t rans fers w i t h i n the weather- ing system that are not re f lec ted in denudation ra tes, and to the use of f r esh l y f ractured mater ial of a s ing le l i t h o l o g y in the present experiment.
A more useful comparison is tha t between the resu l ts of rhyodaci te weathering (pre- sented here) and those of l imestone weathering derived from s im i l a r experiments in other environments (TRUDGILL 1975, 1976). Despite a large d i f fe rence in proce- dural e r ro rs , the two def ine a s im i l a r level of importance for the so i l pH but show a wide d i f fe rence in the response of the two l i t h o l o g i e s . In the so i l envi - ronment, TRUDGILL estimated rock surface re t rea t due to be between 0.005 and 0.025 mm/yr, more than an order o f magnitude greater than the average from th i s study (0.00055 mm/yr) a f t e r conversion to the same uni ts . This d i f fe rence is more c lear -
140
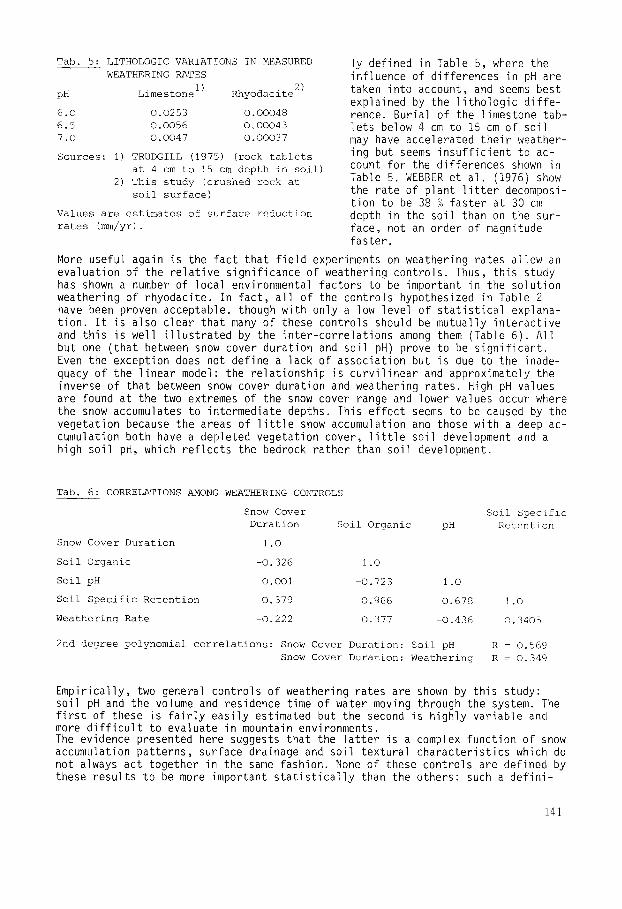
Tab. 5: LITHOLOGIC VARIATIONS IN MEASURED ly defined in Table 5, where the
WEATHERING RATES in f luence of d i f ferences in pH are pH Limestone !) Rhyodacite 2) taken into account, and seems best
explained by the lithologic diffe- 6.O O.O253 O.OOO48 rence. Bur ia l of the l imestone tab- 6.5 0.oo56 o~oo043 le ts below 4 cm to 15 cm of so i l 7.O O.OO47 O.OOO37 may have accelerated their weather-
Sources: i) TRUDGILL (1975) (rock tablets ing but seems insufficient to ac- at 4 cm to 15 cm depth in soil) count for the differences shown in
2) This study (crushed rock at Table 5. WEBBER et al. (1976) show soil surface) the rate of plant litter decomposi-
tion to be 38 % faster at 30 cm Values are estimates of surface reduction depth in the soil than on the sur-
rates (m_m/yr). face, not an order of magnitude faster.
More useful again is the fact that field experiments on weathering rates allow an evaluat ion of the r e l a t i v e s ign i f i cance of weathering cont ro ls . Thus, th i s study has shown a number of local environmental factors to be important in the so lu t ion weathering of rhyodaci te. In f ac t , a l l of the contro ls hypothesized in Table 2 have been proven acceptable, though wi th only a low level of s t a t i s t i c a l explana- t i on . I t is also c lear tha t many of these contro ls should be mutual ly i n t e rac t i ve and t h i s is wel l i l l u s t r a t e d by the i n t e r - c o r r e l a t i o n s among them (Table 6). A l l but one ( tha t between snow cover durat ion and so i l pH) prove to be s i g n i f i c a n t . Even the exception does not def ine a lack of associat ion but is due to the inade- quacy of the l i nea r model: the re la t i onsh ip is c u r v i l i n e a r and approximately the inverse of that between snow cover durat ion and weathering rates. High pH values are found at the two extremes of the snow cover range and lower values occur where the snow accumulates to intermediate depths. This e f fec t seems to be caused by the vegetat ion because the areas of l i t t l e snow accumulation and those wi th a deep ac- cumulation both have a depleted vegetat ion cover, l i t t l e so i l development and a high so i l pH, which re f l ec t s the bedrock ra ther than so i l development.
Tab. 6: CORRELATIONS AMONG WEATHERING CONTROLS
Snow Cover Soil Specific Duration Soil Organic pH Retention
Snow Cover Duration l.O
Soil Organic -0.326 l.O
Soil pH O.OO1 -0.723 i.O
Soil Specific Retention -0.379 0.966 -0.678 i.O
Weathering Rate -0.222 0.377 -0.436 0.3405
2nd degree polynomial correlations: Snow Cover Duration: Soil pH R - 0.569 Snow Cover Duration: Weathering R : 0.349
Empi r i ca l l y , two general cont ro ls of weathering rates are shown by th i s study: so i l pH and the volume and residence time of water moving through the system. The f i r s t of these is f a i r l y eas i l y estimated but the second is h igh ly var iab le and more d i f f i c u l t to evaluate in mountain environments. The evidence presented here suggests that the l a t t e r is a complex func t ion of snow accumulation pat terns, surface drainage and so i l t ex tu ra l cha rac te r i s t i cs which do not always act together in the same fashion. None of these cont ro ls are defined by these resu l t s to be more important s t a t i s t i c a l l y than the others: such a d e f i n i -
141
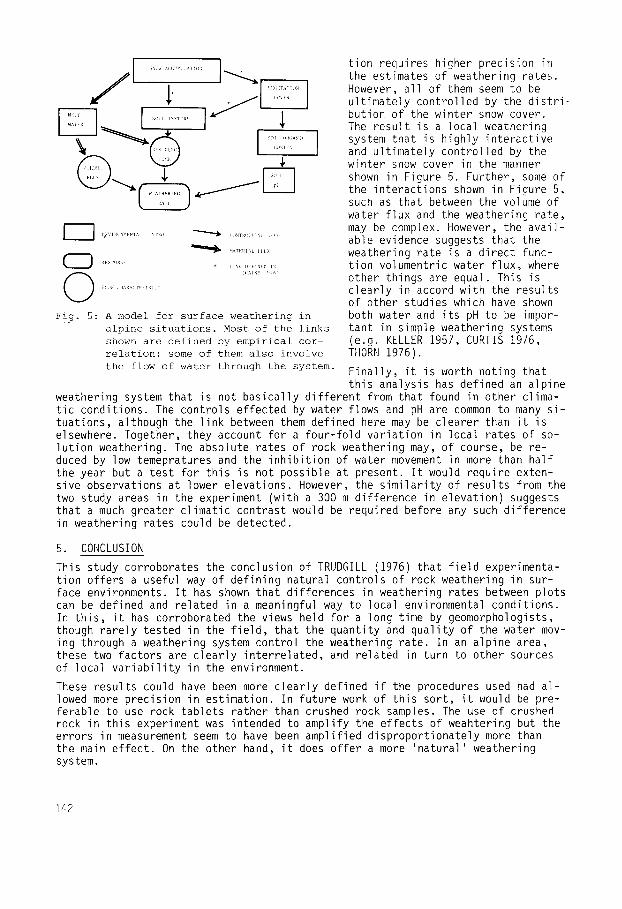
II .............. .......... . ~ ~ t ion requires higher prec is ion in ~ the estimates of weathering rates.
However, a l l of them seem to be u l t ima te l y con t ro l led by the d i s t r i -
........... ,~, I ~ ~ but ion of the w in ter snow cover.
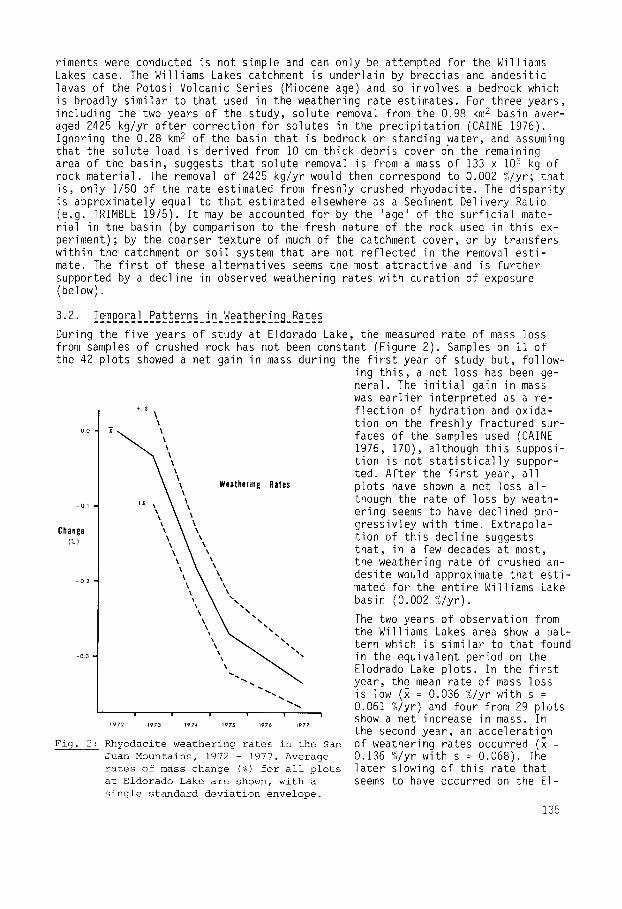
< U i . . . . . . . . . . . i ............... system that is h igh ly i n t e rac t i ve and u l t ima te l y con t ro l led by the
~ ~ ~ win ter snow cover in the manner shown in Figure 5. Fur ther , some of
~ . ~ / the in te rac t ions shown in Figure 5, such as that between the volume of water f l u x and the weathering ra te ,
I ~ i ' . . . . . . . . . . . . . . . . . . . . . ..... ~ . . . . ] . . . . . . . . . . . . . . . . . ~ may be complex. However, the ava i l - " able evidence suggests that the
• " ........... :< weathering rate is a d i rec t func- [ ~ ............ . ................. t i on volumentr ic water f l u x , where
............... other th ings are equal. This is " ....... ' ............... c l ea r l y in accord wi th the resu l ts
of other studies which have shown Fig. 5: A model for surface weathering in both water and i t s pH to be impor-
alpine situations. Most of the links tant in simple weathering systems shown are defined by empirical cor- (e.g. KELLER 1957, CURTIS 1976, relation; some of them also involve THORN 1976).
the flow of water through the system. Finally, it is worth noting that
this analysis has defined an alpine weathering system that is not basically different from that found in other clima- tic conditions. The controls effected by water flows and pH are common to many si- tuations, although the link between them defined here may be clearer than it is elsewhere. Together, they account for a four-fold variation in local rates of so- lution weathering. The absolute rates of rock weathering may, of course, be re- duced by low temepratures and the inhibition of water movement in more than half the year but a test for this is not possible at present. It would require exten- sive observations at lower elevations. However, the similarity of results from the two study areas in the experiment (with a 300 m difference in elevation) suggests that a much greater climatic contrast would be required before any such difference in weathering rates could be detected.
5. CONCLUSION
This study corroborates the conclusion of TRUDGILL (1976) that f i e l d experimenta- t i on o f fe rs a useful way of de f in ing natural cont ro ls of rock weathering in sur- face environments. I t has shown that d i f ferences in weathering rates between p lots can be defined and re lated in a meaningful way to local environmental cond i t ions . In t h i s , i t has corroborated the views held fo r a long time by geomorphologists, though ra re l y tested in the f i e l d , tha t the quan t i t y and q u a l i t y of the water mov- ing through a weathering system control the weathering rate. In an a lp ine area, these two factors are c l e a r l y i n t e r r e l a t e d , and re lated in turn to other sources of local v a r i a b i l i t y in the environment.
These resu l ts could have been more c l e a r l y defined i f the procedures used had a l - lowed more prec is ion in est imat ion. In fu tu re work of t h i s sor t , i t would be pre- ferable to use rock tab le ts rather than crushed rock samples. The use of crushed rock in t h i s experiment was intended to ampl i fy the e f fec ts of weahtering but the errors in measurement seem to have been ampl i f ied d i sp ropor t i ona te ly more than the main e f fec t . On the other hand, i t does o f f e r a more ' na tu ra l ' weathering system.
142
ACKNOWLEDGEMENTS
This work formed part of a study of erosion in the San Juan Mountians which was supported by the U.S. Department of the I n t e r i o r , Bureau of Reclamation, Div is ion of Atmospheric Water Resources Management under contract 14-06-D-7052. On many oc- casions, the study has benefited from the comments and c r i t i c i sms of my colleagues at INSTAAR, espec ia l l y from those of J.T. Andrews, R. Kihl and P.J. Webber. This paper has been great ly imporoved by the comments of J.T. Andrews and two anonymous referees who read e a r l i e r versions of i t . To a l l of these people, I o f fe r my thanks.
BIBLIOGRAPHY
CAINE, N. (1976): The inf luence of snow and increased snowfall on contemporary geo- morphic processes in alpine areas. In: Ecological impacts of snowpack aug- mentation in the San Juan Mountains, Colorado. (H.W. Steinhoff & J.D. Ives, Eds.) Final report San Juan Ecology Project, Colo. State Univ. ; p. 145-200.
CURTIS, C.D. (1976): Chemistry of rock weathering: fundamental reactions and con- t r o l s . In: Geomorphology and Climate. (E. Derbyshire, Ed.), John Wiley, London; p. 25 - 57.
DOUGLAS, I . (1967): Man, vegetation and the sediment y ie lds of r i ve rs . Nature v. 215; p. 925 - 928.
DOUGLAS, I . (1968): The e f fec ts of p rec ip i ta t ion chemistry and catchment area l i - thology on the qua l i t y of r i v e r water in selected catchments in eastern Aust ra l ia . Earth Sci. Jour. v. 2; p. 126 - 144.
DOUGLAS, I . (1973): Rates of denudation-in selected small catchments in eastern Aus t ra l ia . Un ivers i ty of Hul l , Occasional Papers in Geography No. 21; 127 pp.
GOUDIE, A. (1974): Further experimental invest iga t ion of rock weathering by sa l t and other mechanical processes. Zei tschr. f . Geomorph. Suppl.bd. 21; p. 1 - 12.
HEMBREE, C.H. & RAINWATER, F.H. (1961): Chemical degradation on opposite f lanks of the Wind River Range, Wyoming. U.S. Geol. Surv. Water Supply Pap. 1535-E; 9 pp.
HENIN, S. & PEDRO, G. (1965): The laboratory weathering of rocks. In: Experimental Pedology (E.G. HALLSWORTH & D.V. CRAWFORD, Eds.), Butterworths, London; p. 23 - 29.
JACKLI, H. (1957): Gegenwartsgeologie des bundnerischen Rheingebietes: ein Beitrag zur exogen Dynamik a lp iner Gebirgslandschaften. Beitrag z. geol. Karte der Schweiz, Geotech. Ser. No. 36; 136 pp.
JENNINGS, J.N. (1965): Man as a geg~gical agent. Austr. Jour. Science v. 28; p. 150 - 156.
KELLER, W.D. (1957): The pr inc ip les of chemical weathering. Lucas Bros., Columbia, Mo.; 111 pp.
LARSON, E. & HOBLITT, R. (1973): Nature of the ear ly Ter t ia ry in t rus ives between Golden and Lyons, Colorado, and t h e i r re la t ion to the s t ructura l develop- ment of the Front Range. Guide for f i e l d t r i p No. 4 26th annual meeting Rocky Nit. Section Geol. Soc. Amer. 5 pp.
PEARCE, A.J. (1976): Contemporary rates of bedrock weathering, Sudbury, Ontario. Canadian J. Earth Sci. v. 13; p. 188 - 193.
POTTS, A.S. (1970): Frost action in--rocks, some experimental data. Trans. Inst . B r i t . Geog. v. 49; p. 109 - 124.
RAPP, A. (1960): Recent~evelopment of mountain slopes in Karkevagge and surroun- dings. Geograf. Annaler v. 42; p. 71 - 200.
SIEGAL, S. (1956): Nonparametric s t a t i s t i c s for the behavioral sciences. McGraw- H i l l , New York, 312 pp.
143
THORN, C.E. (1976): Quant i ta t i ve evaluat ion of n i va t i on in the Colorado Front Range. Bu l l . Geol. Soc. Amer. v. 87; p. 1169 - 1178.
TRIMBLE, S.W. (1975): Denudation s tud ies :Van we assume stream steady state? Science v. 188; p. 1207 - 1208.
TRUDGILL, S.T. ( 1 9 7 ~ Measurement of erosional weight- loss of rock tab le ts . B r i t Geomorph. Res. Group Tech. Bu l l . No. 17; p. 13 - 19.
TRUDGILL, S.T. (1976): Rock weathering and c l ~ a t e : quan t i t a t i ve and experimental aspects. In: Geomorphology and Climate (E. DERBYSHIRE, Ed.), John Wiley, London; p. 59 - 99.
WEBBER, P.J . , EMERICK, J .C. , EBERT, D.C.~ KOMARKOVA, May & V. (1976): The impact of increased snowfal l on a lp ine vegetat ion. In: Ecological impacts of i n - creased snowfal l on a lp ine vegetat ion. In: Ecological impacts of snowpack augmentation in the San Juan Mountains, Colorado (H.W. STEINHOFF & J.D. IVES, Eds.), Final Report, San Juan Ecology Project , Colo. State Univ . ; p. 201 - 264.
WOOD, T.G. (1970): Decomposition of p lant l i t t e r in montane and a lp ine so i l s on Mt. Kosciusko, Aus t ra l i a . Nature v. 226; p. 561 - 562.
144