Embed Size (px)
Citation preview
West Virginia SPACE July 2016 RockSat-C 2016
RockSat-C 2016 Final Report
WV SPACE
Spaceflight through Teamwork and Collaboration
West Virginia SPACE July 2016 RockSat-C 2016
Team Abigail Ida1, Matt Gramlich1, Rae Stanley3, Matt Haldeman3, Nick Zarilla3, Angela
Meyer2, Olivia Rycroft2, Roger Targosky4, Conner Lacey4, Scott Browning4, Rachelle Huff5, Danford Smith7, Umer Rizwan7, Saira Rizwan7, Laura Miller7, Isaac Lambert6,
David Klug6, Jeff Reynolds6, Ronald Willis8, Walter Willis8, David Wells8, Hunter Demers8, Robert Hopkins8, Jonathan Stollings8, Greg Hawk8
Mentors
Steven Hard10, Greg Lusk1, Tracey Delaney2, Jon Saken3, Farshid Zabihian4, Ralph Wojtowicz5, Gale Hansen6, Marek Krasnansky7, David Teets8, Shahed Mustafa9, David
Hall9
Affiliations (1) West Virginia University
(2) West Virginia Wesleyan College (3) Marshall University
(4) West Virginia University Institute of Technology (5) Shepherd University
(6) Fairmont State University (7) West Virginia State University
(8) Blue Ridge Community & Technical College (9) Bridge Valley Community & Technical College
(10) NASA Independent Verification & Validation Facility
July 2016
West Virginia SPACE July 2016 RockSat-C 2016
1.0 Mission Statement
The mission was to embark on a collaborative effort with academic institutions across the state of West Virginia for development of knowledge and practical experience in designing, building, launching, and operating space payloads. This mission is supported by the NASA IV&V Space Flight Design Challenge (SFDC) outreach initiative.
The goal of the RockSat-C 2016 (RSC-16) project is to provide an opportunity for students from nine colleges/universities in West Virginia to design and build experiments to operate in space while measuring properties of the space environment and flight variables of the launch vehicle. West Virginia University (WVU), Marshall University (MU), West Virginia Institute of Technology (WVUTech), West Virginia Wesleyan College (WVWC), Fairmont State University (FSU), West Virginia State University (WVSU), Blue Ridge Community & Technical College (BRCTC), and Bridge Valley Community & Technical College (BVCTC) were all participants of the RSC-16 project. The experiments will be launched on a two-stage Terrier-Improved Orion sounding rocket from NASA’s Wallops Flight Facility. The target altitude is ~120km, but any altitude above 100km should be sufficient (Appendices - Fig. 1).
The first objective was to measure flight dynamics from several different Inertial Measurement Units (IMUs) to gain a redundant set of flight dynamics data for comparison and reliability analysis. Each school participating in the WV Collaboration has incorporated an IMU in their SPACE [1] experiment. In some cases, two types of IMUs are incorporated in a single experiment to analyze the feasibility of using an inexpensive COTS IMU versus a higher resolution COTS IMU. This is beneficial for the CubeSat community through the development of a low-cost attitude estimation solution. Additionally, barometric pressure sensors were also included to provide more data to recreate the trajectory of the rocket.
An important physical property of the space environment is the Earth’s magnetic field. The magnitude of the B-field decreases approximately as a power law with distance from the Earth’s center. The magnetic field is important in shaping the trajectories of charged particles such as ions and electrons. Models of the magnetic field are available from the National Oceanic and Atmospheric Administration (NOAA) and other sources (Appendices - Fig. 2).
The second objective of this mission is to measure the magnetic field in the xyz axes during flight. Multiple experiments in the WV Collaboration will measure the Earth’s field as a function of height and compare with the current NOAA model in future research efforts. Understanding the Earth’s magnetic field is important for many industries including communication, GPS satellites, navigation, and customer electronic devices.
A third objective was set to measure radiation of charged particles in the ionosphere as a function of altitude. Energetic electrons coming into the ionosphere from higher atmospheric layers can be measured using Geiger counters and similar detectors. While plasma electrons have energies of several electron-volts, energetic electrons have energies of several kilo-electron-volts or higher. A schematic of higher energy particles is shown in Appendices - Fig. 3.
West Virginia SPACE July 2016 RockSat-C 2016
The fourth objective for the RSC2016 mission is to develop a Normalized Difference Vegetation Index (NDVI) [2] of the Northern Virginia coastline and to gather visual telemetry of the payload experiments using on-board cameras located in strategic positions. A NDVI mapping of an image can be performed using the following equation [2]:
where the NIR image pixel is taken from a special camera outfitted with a filter to collect near-infrared (NIR) light only and the RED pixel is taken from the RGB value of the image pixel taken from a standard camera lens. The concept is that greenery reflects more NIR light than shrubbery, tree bark, and rocks (Appendices – Fig. 4). By creating an NDVI map, the higher areas of NIR reflection intensity can be seen (Appendices – Fig. 5). The fifth objective was to measure plasma density in the upper atmosphere using a Langmuir probe. As the voltage on the probe is biased negatively or positively, the I-V characteristics of the plasma can be measured and in theory be related to plasma parameters such as electron temperature and density (Appendices – Figure 5). From the floating potential, the electron temperature, Te, can be calculated since:
where k is Boltzmann's constant, me is the mass of an electron and mi is the 'average' ion mass. This is not always an obvious number, particularly in mixed gas plasmas. Also, using the measured value of Iis we can get the electron density and temperature. A sixth objective was initially set to measure the yield characteristics of ABS plastic material after a launch into space using strain gauges. This was later descoped to testing the strain of a fixed test specimen during flight. Eventually this was off-ramped altogether to focus on high priority objectives. The final objective of the mission was to determine the attitude of the canister in space relative to the sun using solar cells. By offsetting four solar cells equal distances from one another and tilting adjacent cells by 14 degrees toward the center of the solar cell arrangement, the relative position of the sun can in principle be estimated to within 3 degrees. This could also be beneficial for the CubeSat community as a low cost solution for determining attitude and orientation in space. In summary, the mission of the RockSat-C 2016 project is to understand several properties of the space and terrestrial environment and by building experiments to measure and illustrate these properties. Specifically, we expect to learn about the physical environment, how low-cost flight components withstand this harsh environment, and about the techniques and challenges associated with Earth-viewing from space.
2.0 Mission Requirements and Description
West Virginia SPACE July 2016 RockSat-C 2016
In order to reach the mission goals presented in the previous section, several
requirements for the rocket and the payload must be met. First we present the requirements for the overall mission and payload: a. The mission trajectory should cover a part of the upper atmosphere above
60 km. The mission should spend at least 2 minutes above 60 km. b. The payload should fit in the provided volume. We have chosen to use
half a canister (9” in diameter and approximately 4.5” height). c. Power is not provided by the rocket so we must use batteries to power the
payload. In accordance with the RockSat-C User’s Guide, no rechargeable lithium-ion cells may be used on site so the power is supplied by disposable lithium batteries. Also, no high-voltage sources will be used in this payload other than that contained within the Geiger counter device.
d. The payload must be electrically isolated from the canister. e. An optical port is required for the cameras.
The following are requirements specifically for individual experiments and other
subsystems: a. All data-acquiring experiments: the acquisition rate should be 10 Hz or
higher. b. All data-acquiring experiments: a data collection system is required to
store the measurements (in-flight). c. Imagine experiment: Camera must be able to view earth’s surface and
configurable to take video at 30 fps or higher. d. Imaging experiment: the cameras need to be small enough to fit in the
required canister and access to a 1.5” diameter optical port centered along the canister body.
e. Imaging experiment: additional camera must be positioned to view necessary telemetry information and provided adequate lighting.
f. Imagine experiment: cameras must mount to a solid structure to provide adequate support of the lenses in-flight.
g. SPACE experiments: flight dynamics data must be collected throughout entire flight.
h. SPACE experiments: magnetic field data must be collected throughout entire flight.
i. SPACE experiments: payloads should fit within a 4”x4”x1.5” volume to comply with CubeSat design constraints.
j. SPACE experiments: payloads shall be provided 3.7V – 4.2V input voltage.
k. Magnetic field: the field should be measured at an accuracy of 100 nanoTesla.
l. Geiger counter: energized particle (cosmic ray) detection must occur from 60km to apogee.
m. Redundancy should be built into the payload for flight dynamics.
West Virginia SPACE July 2016 RockSat-C 2016
These requirements were important in developing and revising the payload design to provided added assurance that the mission objectives had the highest probability of being realized.
The RSC2016 payload system is built on 13 subsystems (Figure 1 and Figure 2).
11 of these are experiments: 1. WVU-CI. This West Virginia University Camera Imaging experiment
captures near-infrared and standard images of the earth during flight through the optics port with the NDVI subsystem. It also captures visual telemetry of payload devices in the form of LED responses with the Video Indication Display (VID) subsystem using two standard USB webcams and a Pi camera.
2. WVU-LP. This West Virginia University Langmuir Probe experiment sweeps the voltage bias on a conductive probe mounted on the exterior of the rocket in order to determine characteristics of plasma in the upper atmosphere.
3. WVWC-SPACE. This West Virginia Wesleyan College Student Partnership for Advancement of Cosmic Exploration (SPACE) experiment focuses on measuring flight dynamics, specifically the spin rate to recreate a ground experiment that spins a motor in the opposite direction of the rocket at the rate measured in flight.
4. Marshall-SPACE. This Marshall University SPACE experiment is using a Raspberry Pi to process solar cell currents. A 3D printed solar panel has been custom designed to incorporate pedestals that are spaced at equal distances from the center and tilted at identical angles in order to use the measurements to calculate the relative orientation of the panel relative to the sun.
5. Shepherd-SPACE. This Shepherd University SPACE experiment measures flight dynamics variables using two different IMU devices with different communication protocols and resolution for feasibility study.
6. WVUTech-SPACE. This West Virginia University Institute of Technology SPACE experiment focuses on flight dynamics comparison and magnetic field readings. A strain gauge was also initially intended to fly, but was eventually descoped to focus on the main objectives of the experiment and stay on schedule.
7. WVSU-SPACE. This West Virginia State University SPACE experiment focused on measuring ionized particles using a Geiger counter and also included basic flight dynamics measurements.
8. FSU-SPACE. This Fairmont State University SPACE experiment focused on flight dynamics comparison.
9. BRCTC-SPACE. This Blue Ridge Community & Technical College SPACE experiment included flight dynamics comparison, magnetic field readings, and barometric pressure sensor to recreate the flight trajectory. A 3D printed enclosure was designed to isolate this experiment from the rest of the payload.
10. BVCTC-SPACE. This Bridge Valley Community & Technical College SPACE experiment focused on basic flight dynamics and magnetic field readings. A 3D printed enclosure was also designed to isolate this experiment.
Three additional subsystems are: 11. Power distribution system (PDS). The unregulated 7.4V LiPo battery
power supply is controlled and regulated on a dedicated board to 5V and 4V. Power is
West Virginia SPACE July 2016 RockSat-C 2016
distributed to each experimental subsystem as required with individual circuit breakers in case of a power surge or short circuit.
12. Multipurpose Port System (MPS). The circuit board mounted inside the multipurpose port housing for exterior sensors.
13. Structural Integration System (SIS). The main mounting plates, mounting hardware, camera mounts, and ballasts all comprise this subsystem.
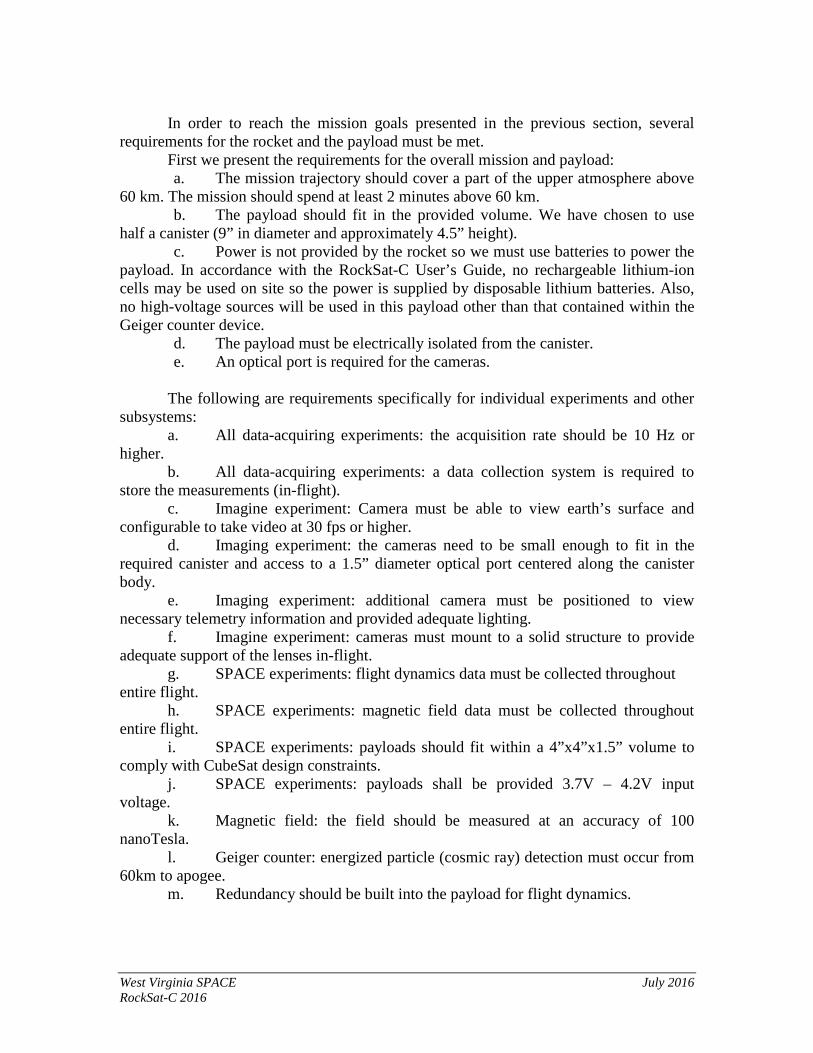
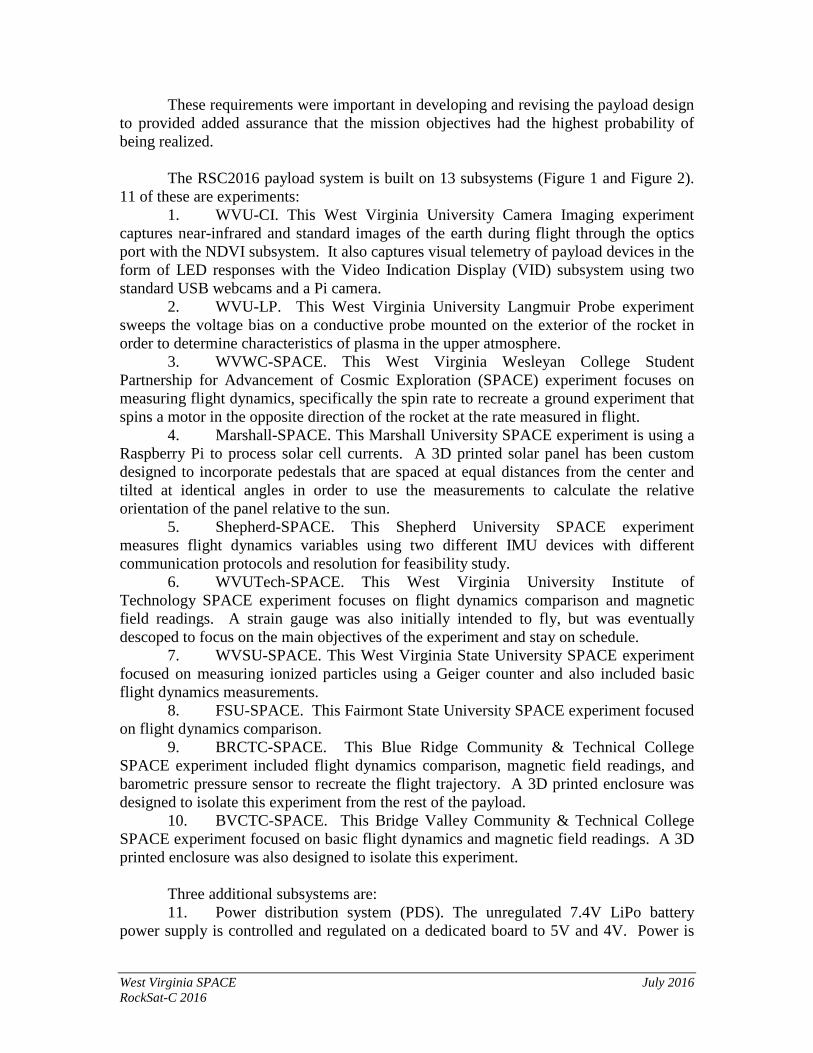
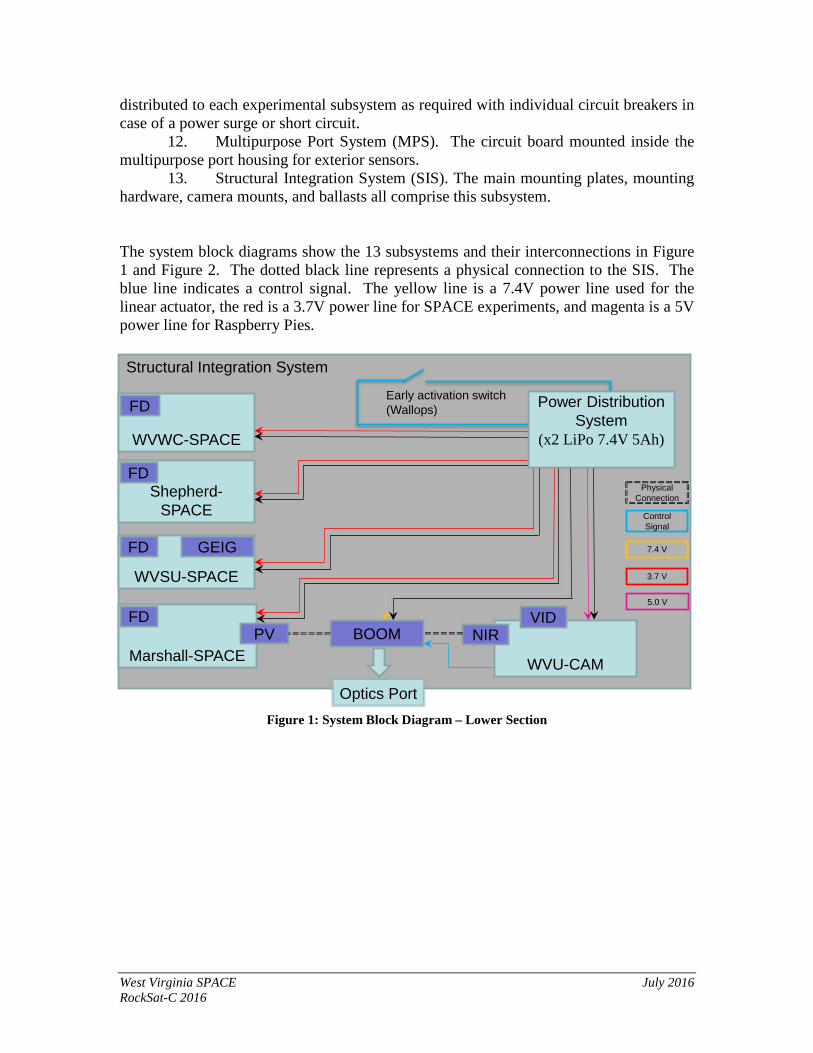
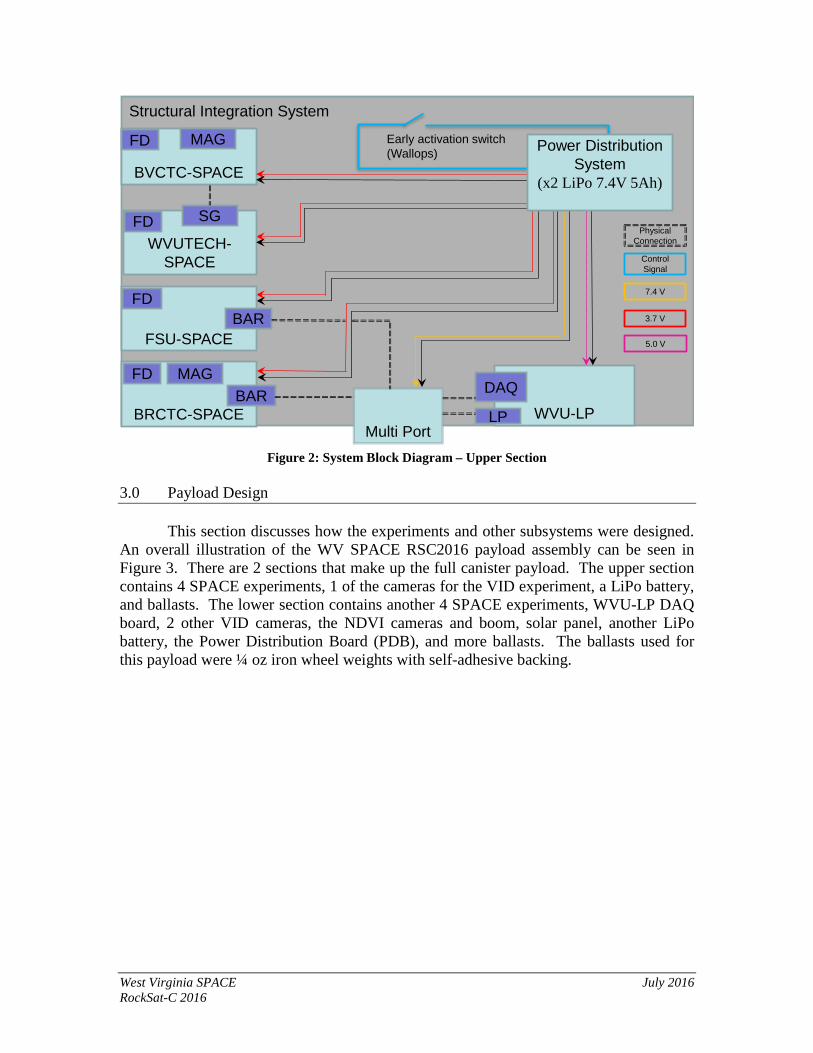
The system block diagrams show the 13 subsystems and their interconnections in Figure 1 and Figure 2. The dotted black line represents a physical connection to the SIS. The blue line indicates a control signal. The yellow line is a 7.4V power line used for the linear actuator, the red is a 3.7V power line for SPACE experiments, and magenta is a 5V power line for Raspberry Pies.
WVU-CAM
WVWC-SPACE
Shepherd-SPACE
WVSU-SPACE
BOOMMarshall-SPACE
Structural Integration System
Early activation switch (Wallops)FD
FD
FD
PVFD
NIRVID
Power Distribution System
(x2 LiPo 7.4V 5Ah)
GEIG 7.4 V
ControlSignal
3.7 V
5.0 V
Physical Connection
Optics Port
Figure 1: System Block Diagram – Lower Section
West Virginia SPACE July 2016 RockSat-C 2016
WVU-LP
BVCTC-SPACE
WVUTECH-SPACE
7.4 V
ControlSignal
Early activation switch (Wallops)
3.7 V
5.0 V
FD
FD
DAQ
Power Distribution System
(x2 LiPo 7.4V 5Ah)
MAG
SGPhysical
Connection
FSU-SPACE
BRCTC-SPACE
FD
FD MAG
Multi Port
BAR
BAR
LP
Structural Integration System
Figure 2: System Block Diagram – Upper Section
3.0 Payload Design
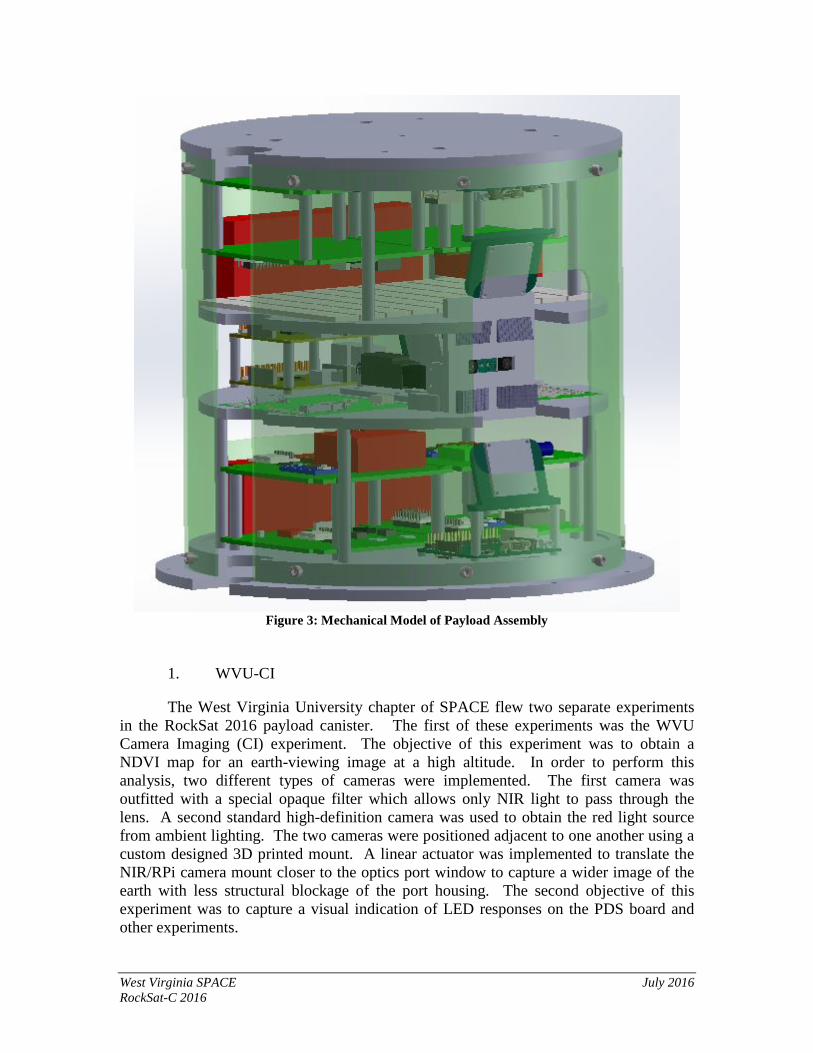
This section discusses how the experiments and other subsystems were designed. An overall illustration of the WV SPACE RSC2016 payload assembly can be seen in Figure 3. There are 2 sections that make up the full canister payload. The upper section contains 4 SPACE experiments, 1 of the cameras for the VID experiment, a LiPo battery, and ballasts. The lower section contains another 4 SPACE experiments, WVU-LP DAQ board, 2 other VID cameras, the NDVI cameras and boom, solar panel, another LiPo battery, the Power Distribution Board (PDB), and more ballasts. The ballasts used for this payload were ¼ oz iron wheel weights with self-adhesive backing.
West Virginia SPACE July 2016 RockSat-C 2016
Figure 3: Mechanical Model of Payload Assembly
1. WVU-CI
The West Virginia University chapter of SPACE flew two separate experiments
in the RockSat 2016 payload canister. The first of these experiments was the WVU Camera Imaging (CI) experiment. The objective of this experiment was to obtain a NDVI map for an earth-viewing image at a high altitude. In order to perform this analysis, two different types of cameras were implemented. The first camera was outfitted with a special opaque filter which allows only NIR light to pass through the lens. A second standard high-definition camera was used to obtain the red light source from ambient lighting. The two cameras were positioned adjacent to one another using a custom designed 3D printed mount. A linear actuator was implemented to translate the NIR/RPi camera mount closer to the optics port window to capture a wider image of the earth with less structural blockage of the port housing. The second objective of this experiment was to capture a visual indication of LED responses on the PDS board and other experiments.
West Virginia SPACE July 2016 RockSat-C 2016
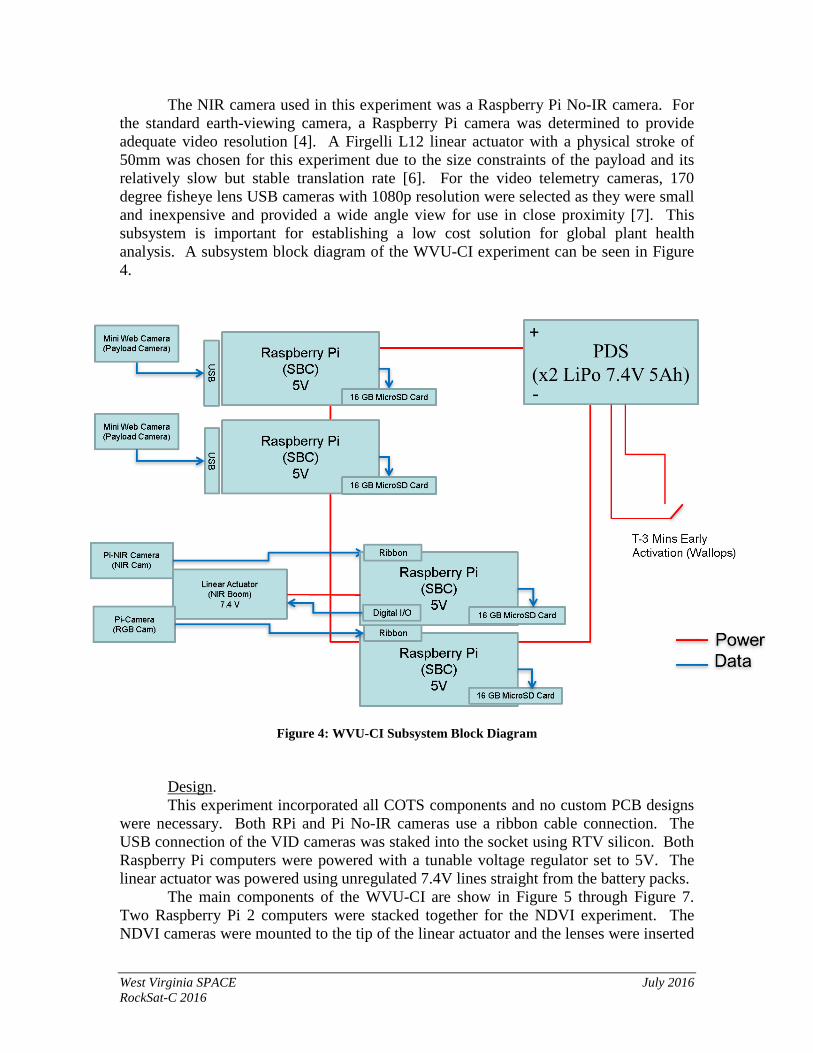
The NIR camera used in this experiment was a Raspberry Pi No-IR camera. For the standard earth-viewing camera, a Raspberry Pi camera was determined to provide adequate video resolution [4]. A Firgelli L12 linear actuator with a physical stroke of 50mm was chosen for this experiment due to the size constraints of the payload and its relatively slow but stable translation rate [6]. For the video telemetry cameras, 170 degree fisheye lens USB cameras with 1080p resolution were selected as they were small and inexpensive and provided a wide angle view for use in close proximity [7]. This subsystem is important for establishing a low cost solution for global plant health analysis. A subsystem block diagram of the WVU-CI experiment can be seen in Figure 4.
Figure 4: WVU-CI Subsystem Block Diagram
Design. This experiment incorporated all COTS components and no custom PCB designs
were necessary. Both RPi and Pi No-IR cameras use a ribbon cable connection. The USB connection of the VID cameras was staked into the socket using RTV silicon. Both Raspberry Pi computers were powered with a tunable voltage regulator set to 5V. The linear actuator was powered using unregulated 7.4V lines straight from the battery packs.
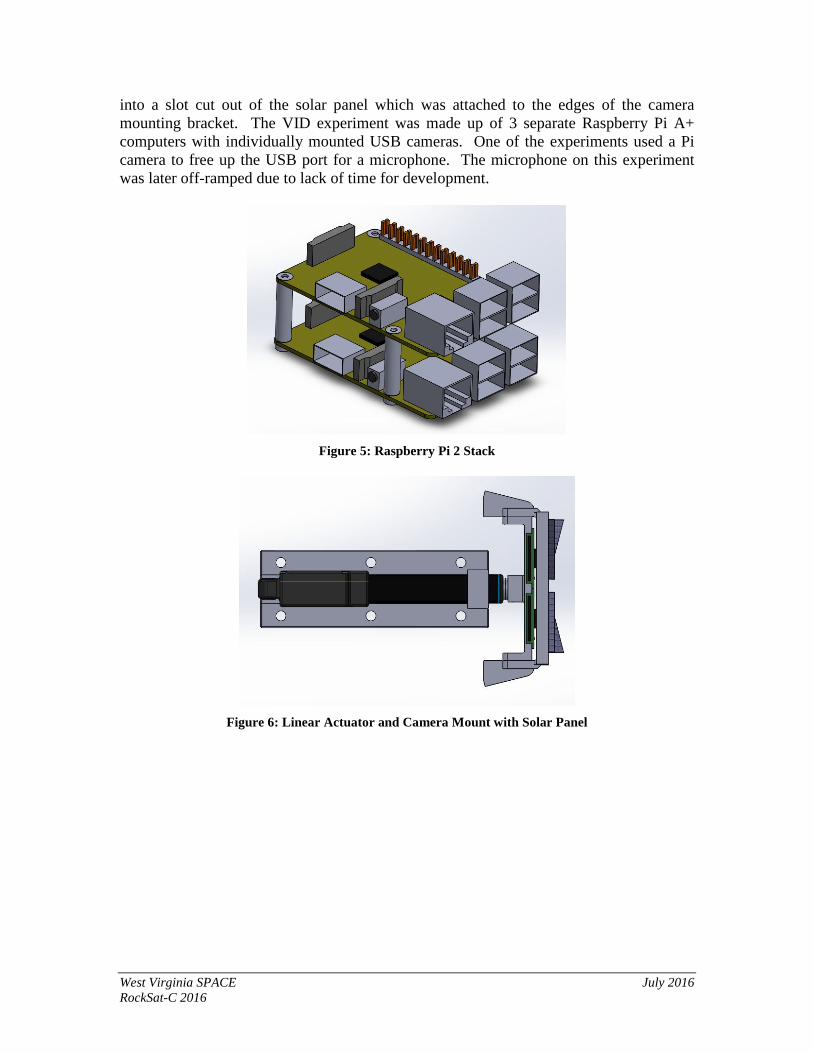
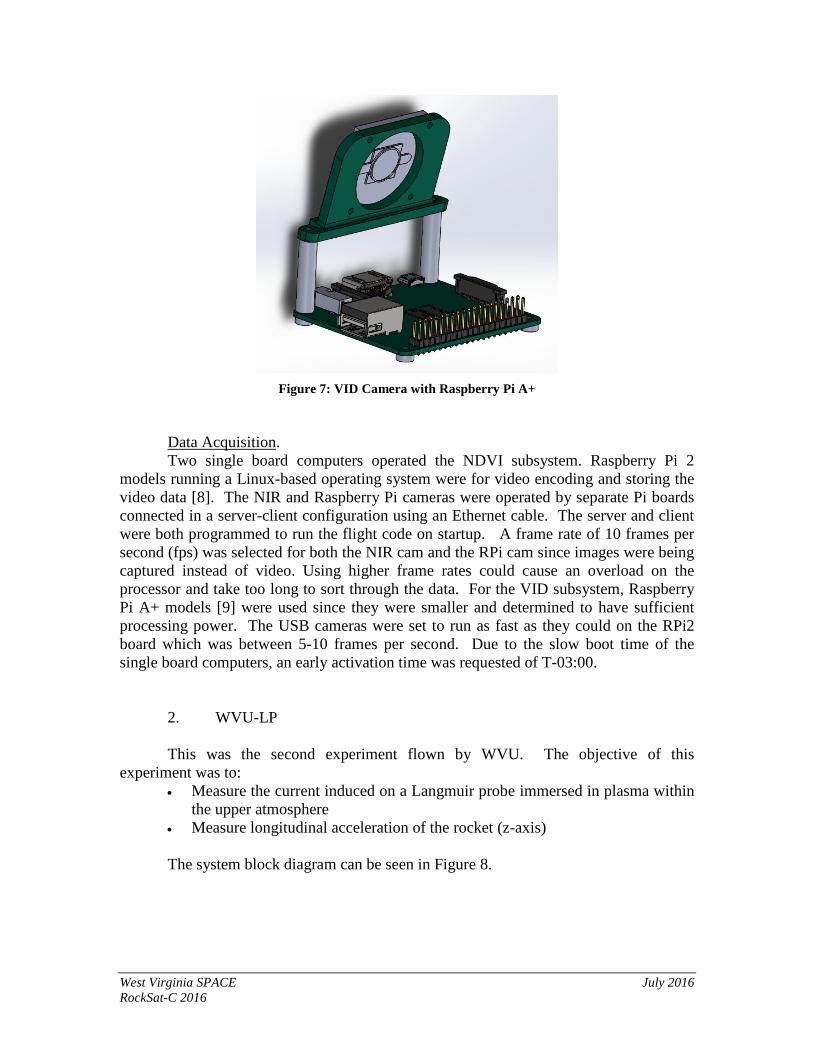
The main components of the WVU-CI are show in Figure 5 through Figure 7. Two Raspberry Pi 2 computers were stacked together for the NDVI experiment. The NDVI cameras were mounted to the tip of the linear actuator and the lenses were inserted
West Virginia SPACE July 2016 RockSat-C 2016
into a slot cut out of the solar panel which was attached to the edges of the camera mounting bracket. The VID experiment was made up of 3 separate Raspberry Pi A+ computers with individually mounted USB cameras. One of the experiments used a Pi camera to free up the USB port for a microphone. The microphone on this experiment was later off-ramped due to lack of time for development.
Figure 5: Raspberry Pi 2 Stack
Figure 6: Linear Actuator and Camera Mount with Solar Panel
West Virginia SPACE July 2016 RockSat-C 2016
Figure 7: VID Camera with Raspberry Pi A+
Data Acquisition. Two single board computers operated the NDVI subsystem. Raspberry Pi 2
models running a Linux-based operating system were for video encoding and storing the video data [8]. The NIR and Raspberry Pi cameras were operated by separate Pi boards connected in a server-client configuration using an Ethernet cable. The server and client were both programmed to run the flight code on startup. A frame rate of 10 frames per second (fps) was selected for both the NIR cam and the RPi cam since images were being captured instead of video. Using higher frame rates could cause an overload on the processor and take too long to sort through the data. For the VID subsystem, Raspberry Pi A+ models [9] were used since they were smaller and determined to have sufficient processing power. The USB cameras were set to run as fast as they could on the RPi2 board which was between 5-10 frames per second. Due to the slow boot time of the single board computers, an early activation time was requested of T-03:00.
2. WVU-LP This was the second experiment flown by WVU. The objective of this
experiment was to: • Measure the current induced on a Langmuir probe immersed in plasma within
the upper atmosphere • Measure longitudinal acceleration of the rocket (z-axis)
The system block diagram can be seen in Figure 8.
West Virginia SPACE July 2016 RockSat-C 2016
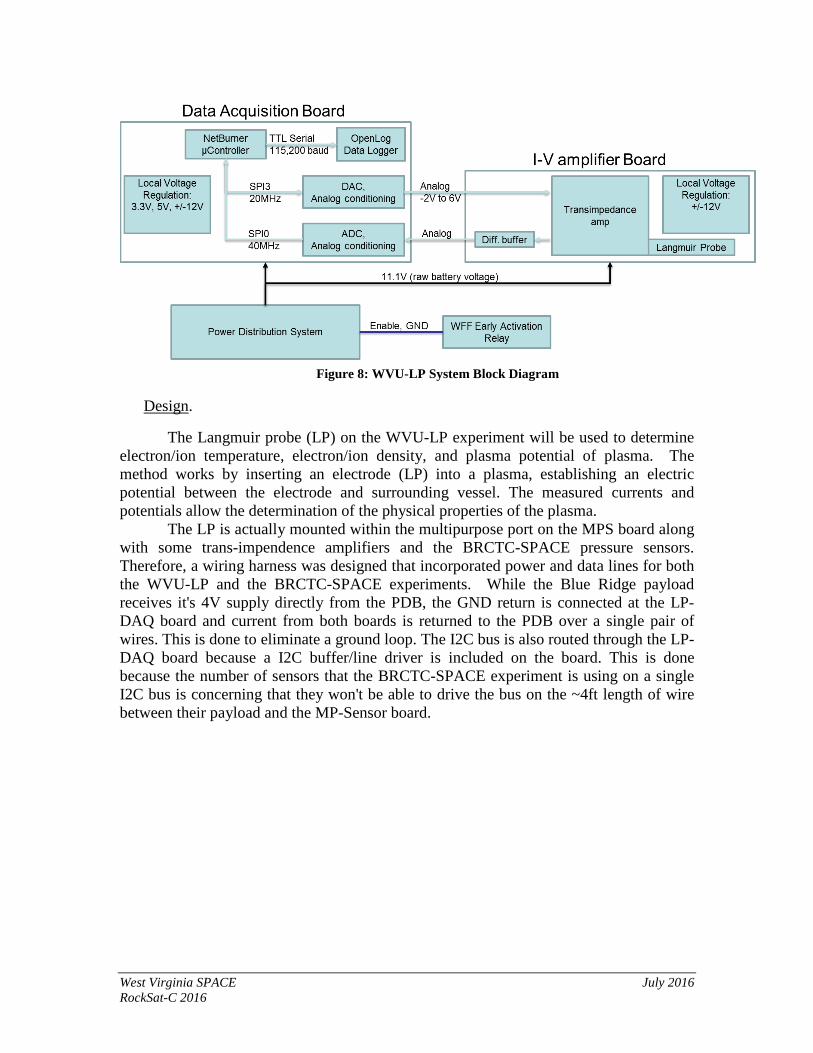
Design.
The Langmuir probe (LP) on the WVU-LP experiment will be used to determine electron/ion temperature, electron/ion density, and plasma potential of plasma. The method works by inserting an electrode (LP) into a plasma, establishing an electric potential between the electrode and surrounding vessel. The measured currents and potentials allow the determination of the physical properties of the plasma. The LP is actually mounted within the multipurpose port on the MPS board along with some trans-impendence amplifiers and the BRCTC-SPACE pressure sensors. Therefore, a wiring harness was designed that incorporated power and data lines for both the WVU-LP and the BRCTC-SPACE experiments. While the Blue Ridge payload receives it's 4V supply directly from the PDB, the GND return is connected at the LP-DAQ board and current from both boards is returned to the PDB over a single pair of wires. This is done to eliminate a ground loop. The I2C bus is also routed through the LP-DAQ board because a I2C buffer/line driver is included on the board. This is done because the number of sensors that the BRCTC-SPACE experiment is using on a single I2C bus is concerning that they won't be able to drive the bus on the ~4ft length of wire between their payload and the MP-Sensor board.
Figure 8: WVU-LP System Block Diagram
West Virginia SPACE July 2016 RockSat-C 2016
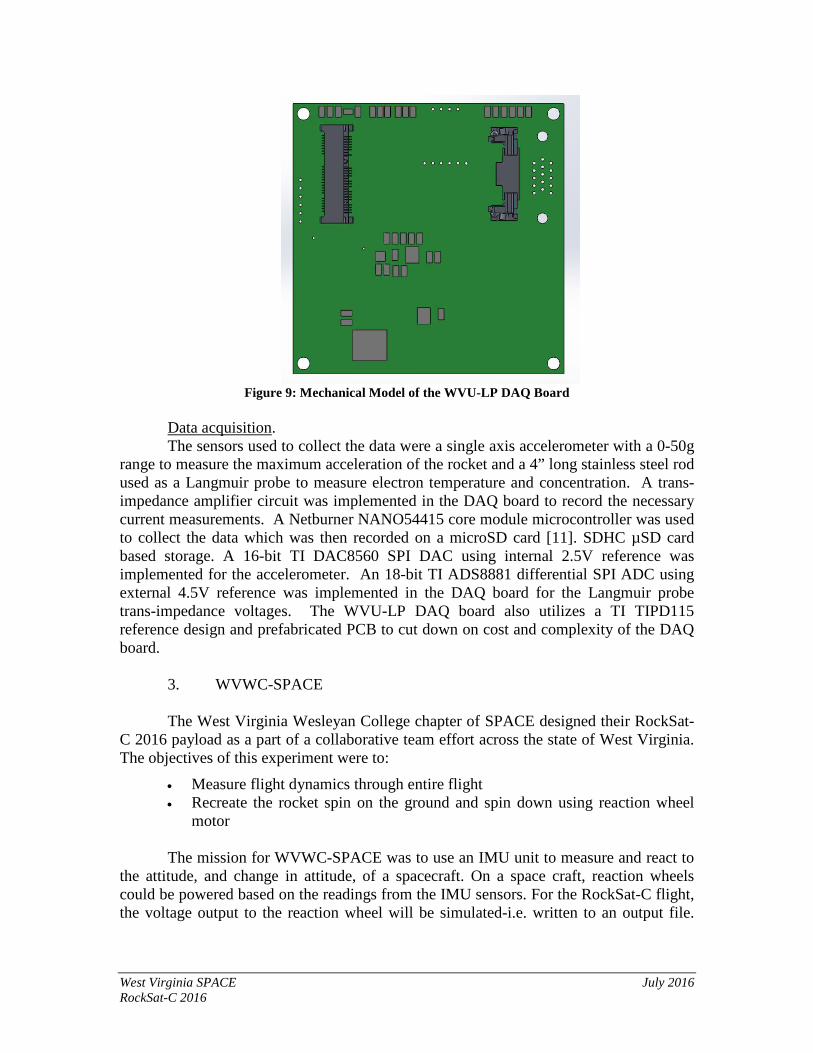
Figure 9: Mechanical Model of the WVU-LP DAQ Board
Data acquisition. The sensors used to collect the data were a single axis accelerometer with a 0-50g
range to measure the maximum acceleration of the rocket and a 4” long stainless steel rod used as a Langmuir probe to measure electron temperature and concentration. A trans-impedance amplifier circuit was implemented in the DAQ board to record the necessary current measurements. A Netburner NANO54415 core module microcontroller was used to collect the data which was then recorded on a microSD card [11]. SDHC µSD card based storage. A 16-bit TI DAC8560 SPI DAC using internal 2.5V reference was implemented for the accelerometer. An 18-bit TI ADS8881 differential SPI ADC using external 4.5V reference was implemented in the DAQ board for the Langmuir probe trans-impedance voltages. The WVU-LP DAQ board also utilizes a TI TIPD115 reference design and prefabricated PCB to cut down on cost and complexity of the DAQ board.
3. WVWC-SPACE The West Virginia Wesleyan College chapter of SPACE designed their RockSat-
C 2016 payload as a part of a collaborative team effort across the state of West Virginia. The objectives of this experiment were to:
• Measure flight dynamics through entire flight • Recreate the rocket spin on the ground and spin down using reaction wheel
motor
The mission for WVWC-SPACE was to use an IMU unit to measure and react to the attitude, and change in attitude, of a spacecraft. On a space craft, reaction wheels could be powered based on the readings from the IMU sensors. For the RockSat-C flight, the voltage output to the reaction wheel will be simulated-i.e. written to an output file.
West Virginia SPACE July 2016 RockSat-C 2016
After the flight, the WVWC-SPACE team will take their flight data and feed it to the reaction wheel.
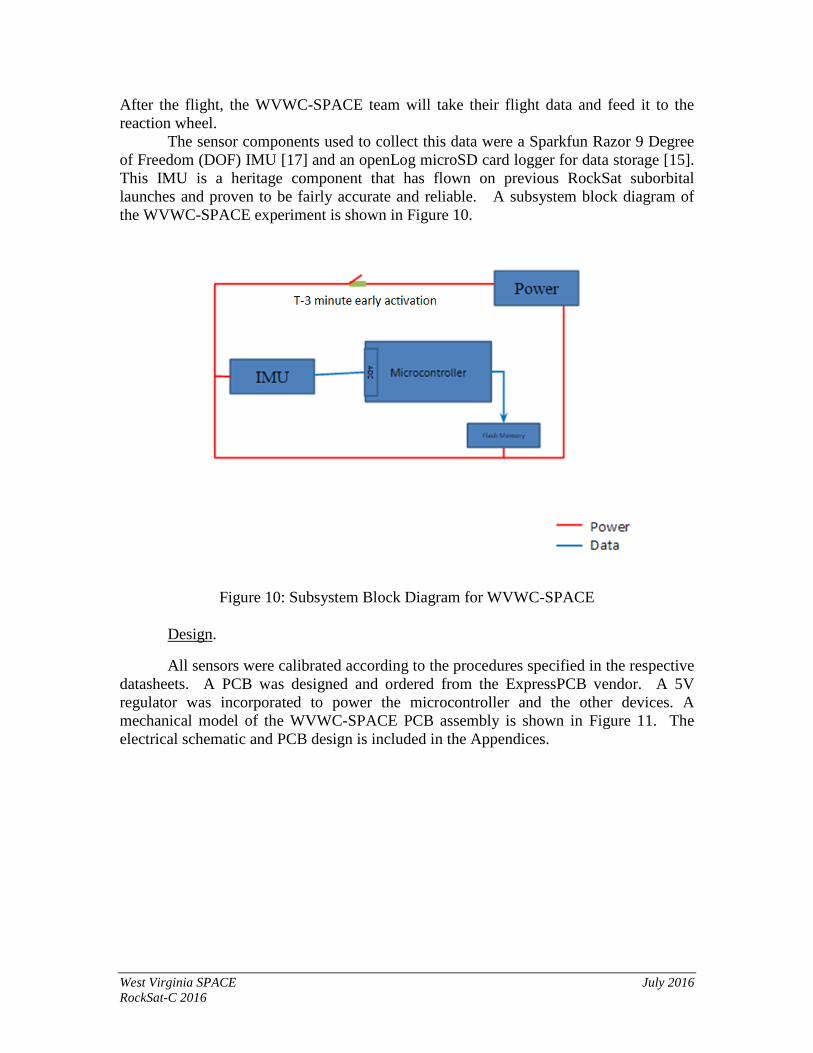
The sensor components used to collect this data were a Sparkfun Razor 9 Degree of Freedom (DOF) IMU [17] and an openLog microSD card logger for data storage [15]. This IMU is a heritage component that has flown on previous RockSat suborbital launches and proven to be fairly accurate and reliable. A subsystem block diagram of the WVWC-SPACE experiment is shown in Figure 10.
Figure 10: Subsystem Block Diagram for WVWC-SPACE
Design.
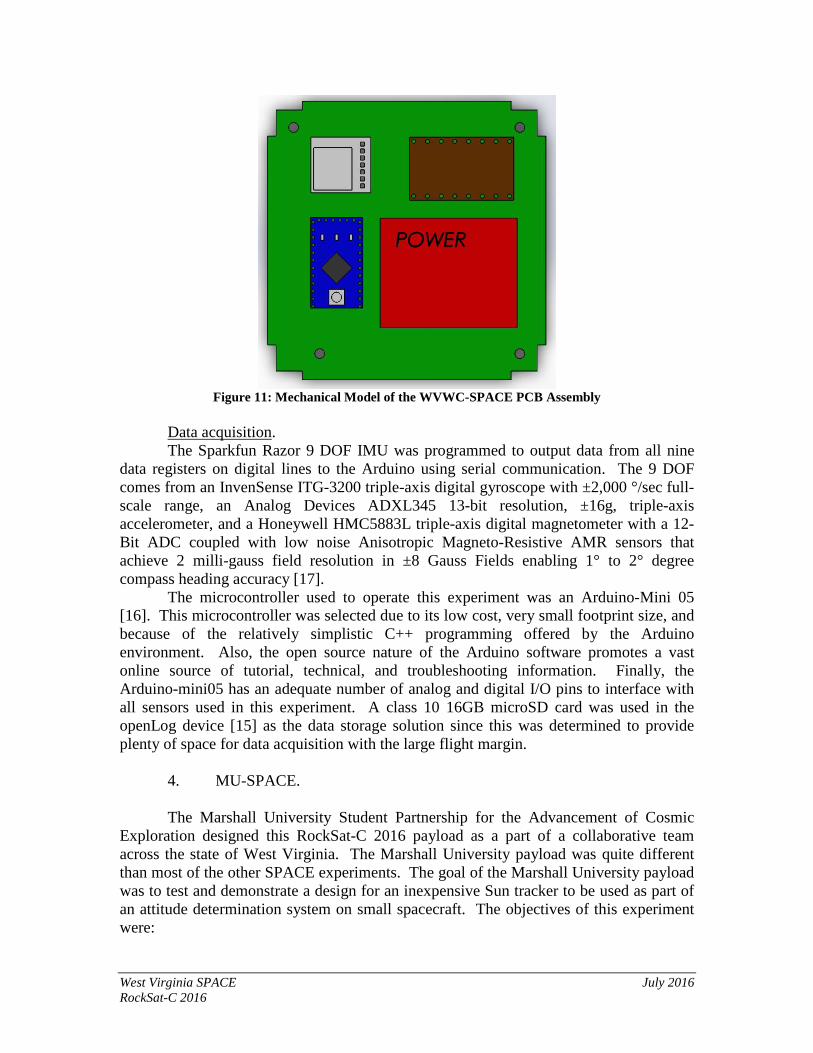
All sensors were calibrated according to the procedures specified in the respective datasheets. A PCB was designed and ordered from the ExpressPCB vendor. A 5V regulator was incorporated to power the microcontroller and the other devices. A mechanical model of the WVWC-SPACE PCB assembly is shown in Figure 11. The electrical schematic and PCB design is included in the Appendices.
West Virginia SPACE July 2016 RockSat-C 2016
Figure 11: Mechanical Model of the WVWC-SPACE PCB Assembly
Data acquisition. The Sparkfun Razor 9 DOF IMU was programmed to output data from all nine
data registers on digital lines to the Arduino using serial communication. The 9 DOF comes from an InvenSense ITG-3200 triple-axis digital gyroscope with ±2,000 °/sec full-scale range, an Analog Devices ADXL345 13-bit resolution, ±16g, triple-axis accelerometer, and a Honeywell HMC5883L triple-axis digital magnetometer with a 12-Bit ADC coupled with low noise Anisotropic Magneto-Resistive AMR sensors that achieve 2 milli-gauss field resolution in ±8 Gauss Fields enabling 1° to 2° degree compass heading accuracy [17].
The microcontroller used to operate this experiment was an Arduino-Mini 05 [16]. This microcontroller was selected due to its low cost, very small footprint size, and because of the relatively simplistic C++ programming offered by the Arduino environment. Also, the open source nature of the Arduino software promotes a vast online source of tutorial, technical, and troubleshooting information. Finally, the Arduino-mini05 has an adequate number of analog and digital I/O pins to interface with all sensors used in this experiment. A class 10 16GB microSD card was used in the openLog device [15] as the data storage solution since this was determined to provide plenty of space for data acquisition with the large flight margin.
4. MU-SPACE. The Marshall University Student Partnership for the Advancement of Cosmic
Exploration designed this RockSat-C 2016 payload as a part of a collaborative team across the state of West Virginia. The Marshall University payload was quite different than most of the other SPACE experiments. The goal of the Marshall University payload was to test and demonstrate a design for an inexpensive Sun tracker to be used as part of an attitude determination system on small spacecraft. The objectives of this experiment were:
West Virginia SPACE July 2016 RockSat-C 2016
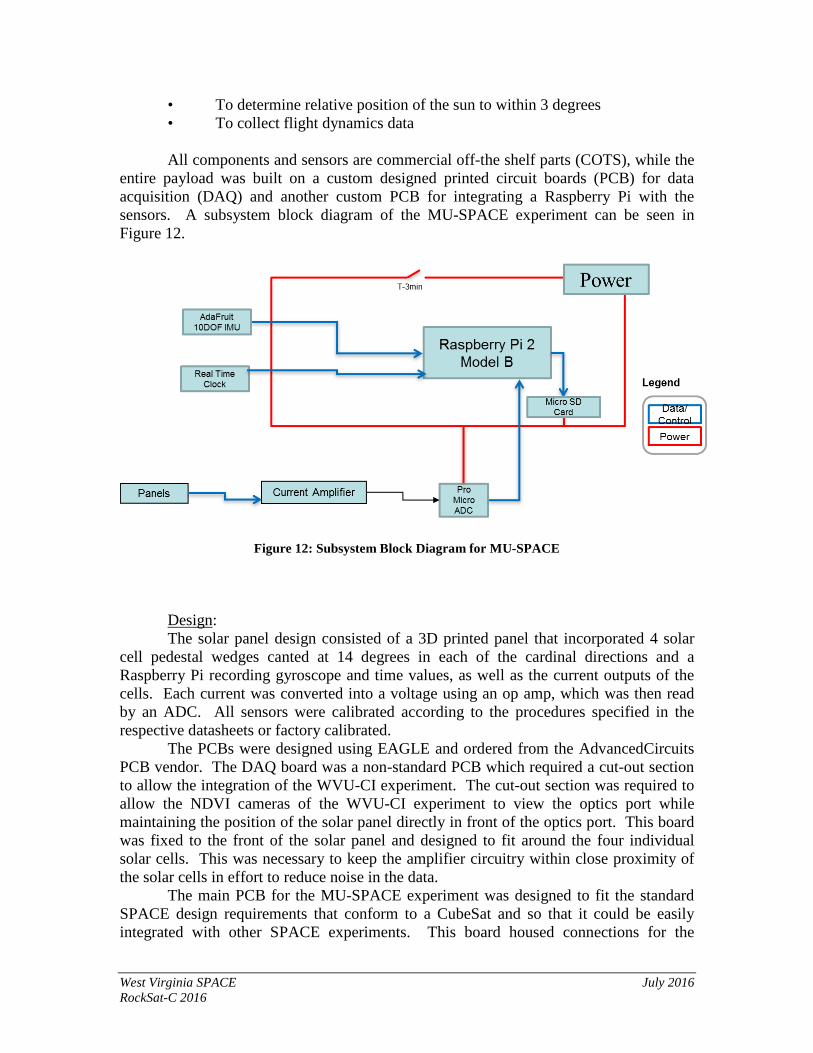
• To determine relative position of the sun to within 3 degrees • To collect flight dynamics data All components and sensors are commercial off-the shelf parts (COTS), while the
entire payload was built on a custom designed printed circuit boards (PCB) for data acquisition (DAQ) and another custom PCB for integrating a Raspberry Pi with the sensors. A subsystem block diagram of the MU-SPACE experiment can be seen in Figure 12.
Figure 12: Subsystem Block Diagram for MU-SPACE
Design: The solar panel design consisted of a 3D printed panel that incorporated 4 solar
cell pedestal wedges canted at 14 degrees in each of the cardinal directions and a Raspberry Pi recording gyroscope and time values, as well as the current outputs of the cells. Each current was converted into a voltage using an op amp, which was then read by an ADC. All sensors were calibrated according to the procedures specified in the respective datasheets or factory calibrated.
The PCBs were designed using EAGLE and ordered from the AdvancedCircuits PCB vendor. The DAQ board was a non-standard PCB which required a cut-out section to allow the integration of the WVU-CI experiment. The cut-out section was required to allow the NDVI cameras of the WVU-CI experiment to view the optics port while maintaining the position of the solar panel directly in front of the optics port. This board was fixed to the front of the solar panel and designed to fit around the four individual solar cells. This was necessary to keep the amplifier circuitry within close proximity of the solar cells in effort to reduce noise in the data.
The main PCB for the MU-SPACE experiment was designed to fit the standard SPACE design requirements that conform to a CubeSat and so that it could be easily integrated with other SPACE experiments. This board housed connections for the
West Virginia SPACE July 2016 RockSat-C 2016
Raspberry Pi and the Adafruit 10 DOF IMU. It also provided an interface for the DAQ board to connect to the Raspberry Pi.
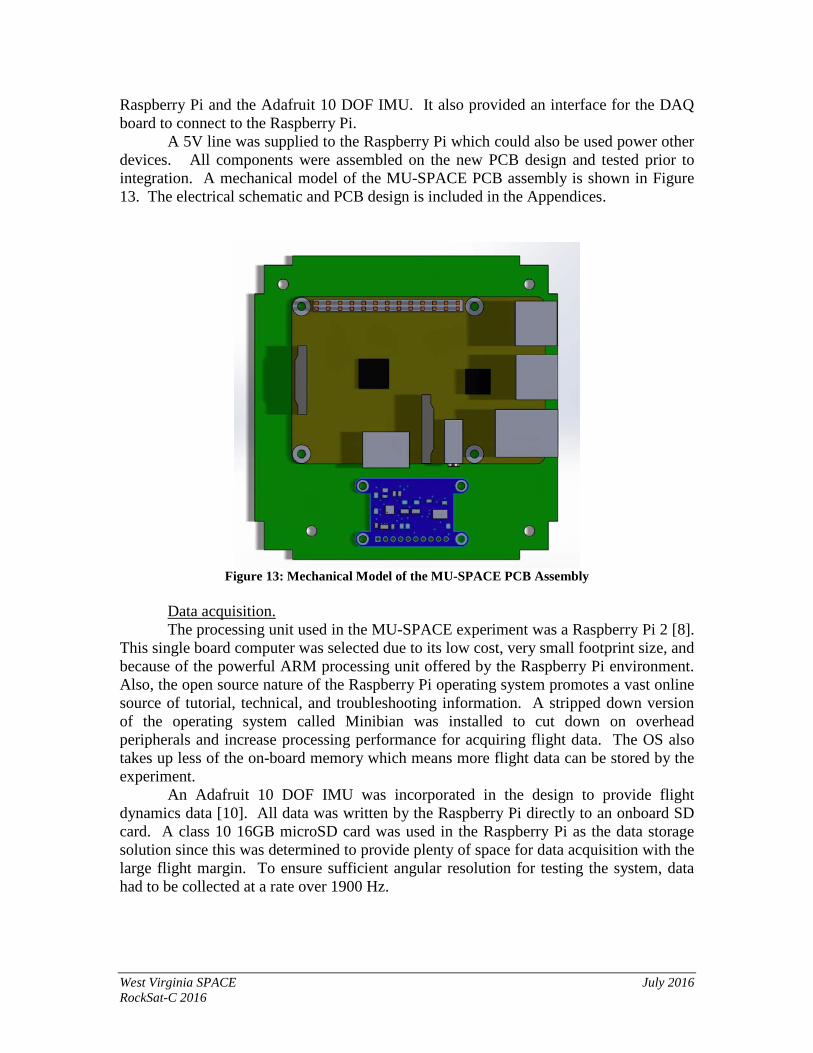
A 5V line was supplied to the Raspberry Pi which could also be used power other devices. All components were assembled on the new PCB design and tested prior to integration. A mechanical model of the MU-SPACE PCB assembly is shown in Figure 13. The electrical schematic and PCB design is included in the Appendices.
Figure 13: Mechanical Model of the MU-SPACE PCB Assembly
Data acquisition. The processing unit used in the MU-SPACE experiment was a Raspberry Pi 2 [8].
This single board computer was selected due to its low cost, very small footprint size, and because of the powerful ARM processing unit offered by the Raspberry Pi environment. Also, the open source nature of the Raspberry Pi operating system promotes a vast online source of tutorial, technical, and troubleshooting information. A stripped down version of the operating system called Minibian was installed to cut down on overhead peripherals and increase processing performance for acquiring flight data. The OS also takes up less of the on-board memory which means more flight data can be stored by the experiment.
An Adafruit 10 DOF IMU was incorporated in the design to provide flight dynamics data [10]. All data was written by the Raspberry Pi directly to an onboard SD card. A class 10 16GB microSD card was used in the Raspberry Pi as the data storage solution since this was determined to provide plenty of space for data acquisition with the large flight margin. To ensure sufficient angular resolution for testing the system, data had to be collected at a rate over 1900 Hz.
West Virginia SPACE July 2016 RockSat-C 2016
5. SU-SPACE. The Shepherd University chapter of SPACE designed this RockSat-C 2016
payload as a part of a collaborative team effort across the state of West Virginia. Several of the schools involved in this collaboration created very similar payloads with very similar objectives to establish a baseline of domain knowledge. The objectives for the SU-SPACE experiment include:
• To collect redundant flight dynamics data • To assess the feasibility of using a low-cost IMU
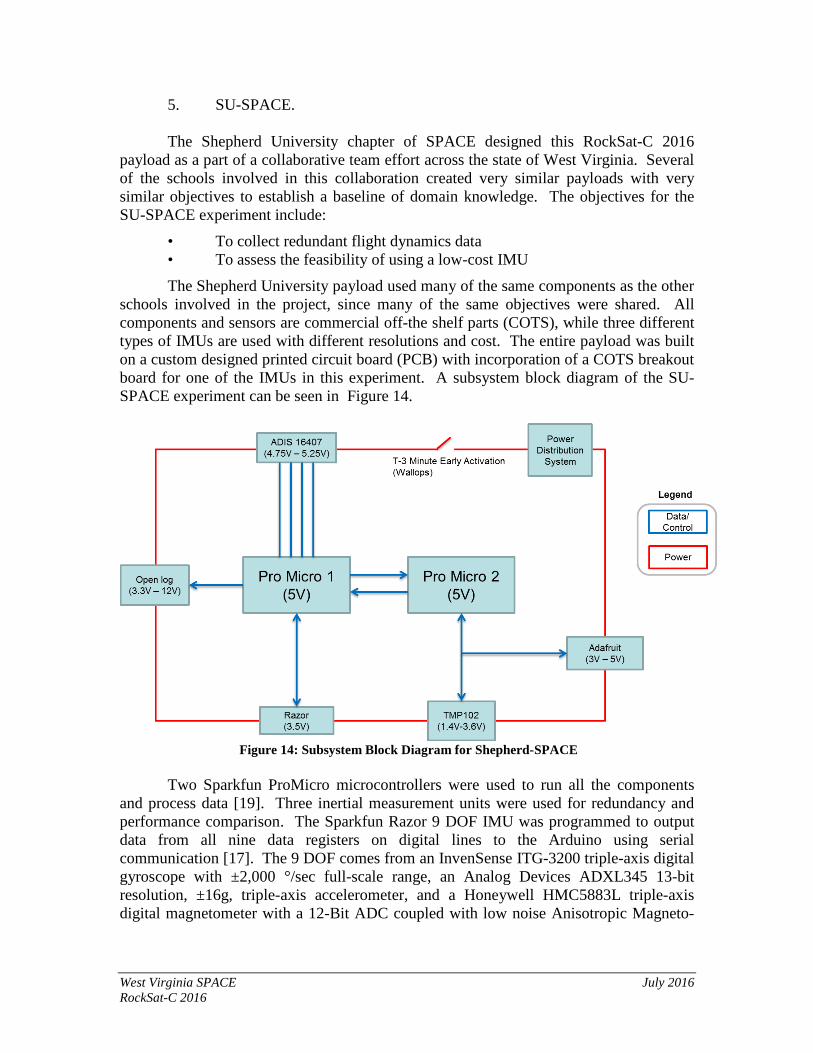
The Shepherd University payload used many of the same components as the other schools involved in the project, since many of the same objectives were shared. All components and sensors are commercial off-the shelf parts (COTS), while three different types of IMUs are used with different resolutions and cost. The entire payload was built on a custom designed printed circuit board (PCB) with incorporation of a COTS breakout board for one of the IMUs in this experiment. A subsystem block diagram of the SU-SPACE experiment can be seen in Figure 14.
Figure 14: Subsystem Block Diagram for Shepherd-SPACE
Two Sparkfun ProMicro microcontrollers were used to run all the components
and process data [19]. Three inertial measurement units were used for redundancy and performance comparison. The Sparkfun Razor 9 DOF IMU was programmed to output data from all nine data registers on digital lines to the Arduino using serial communication [17]. The 9 DOF comes from an InvenSense ITG-3200 triple-axis digital gyroscope with ±2,000 °/sec full-scale range, an Analog Devices ADXL345 13-bit resolution, ±16g, triple-axis accelerometer, and a Honeywell HMC5883L triple-axis digital magnetometer with a 12-Bit ADC coupled with low noise Anisotropic Magneto-
West Virginia SPACE July 2016 RockSat-C 2016
Resistive AMR sensors that achieve 2 milli-gauss field resolution in ±8 Gauss Fields enabling 1° to 2° degree compass heading accuracy.
The second IMU is the Analog Devices ADIS16400 [12], a 10 degree of freedom IMU (three axis accelerometer, 3 axis gyro, 3 axis compass, and temperature) that outputs digital data through SPI communication to the Arduino. It features a 14-bit digital gyroscope with digital range scaling (±75°/sec, ±150°/sec, ±300°/sec settings), a tri-axis 14-bit digital accelerometer with ±3 g measurement range, 13-bit pitch and roll incline calculations, 330 Hz bandwidth, SPI-compatible serial interface, single-supply operation range from 4.75 V to 5.25 V, 2000-g shock survivability, and an operating temperature range between −40°C to +85°C. The third IMU used in the SU-SPACE experiment was the Adafruit 10 DOF [10]. This IMU has not yet been flown on a suborbital flight by the WV SPACE team.
In order for any of these sensors to output reasonable data, they should be calibrated. The Razor IMU comes with a default firmware that includes a calibration program; this program involves rotating the device around to obtain several thousand measurements and recording maximums, minimums, and average values. These values are then placed in the setup program that the board runs on in order to normalize data. The Analog Devices IMU is shipped factory calibrated, and testing seemed to indicate that it was very accurate, so it was not re-calibrated for this experiment. A simple program was obtained by Marshall University for the Honeywell magnetometer in order to record maximums and minimums and normalize data, and it was very successful in getting highly accurate magnetic field readings during testing. All sensors were calibrated according to the procedures specified in the respective datasheets or factory calibrated.
Design: A PCB was designed using EAGLE and ordered from the AdvancedCircuits PCB
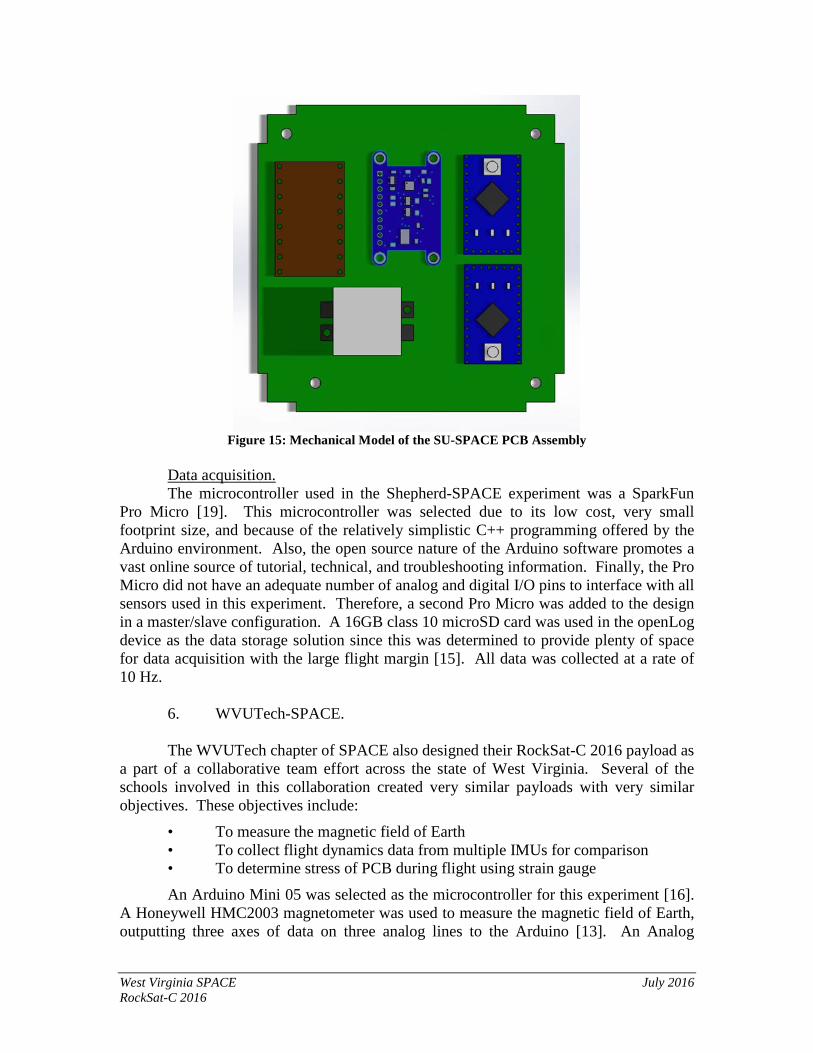
vendor. A 5V regulator breakout was incorporated in the mechanical design to be fixed on the PCB. The master microcontroller (Pro Micro 1) is connected to the Analog Devices and Razor IMUs and communicates with the slave using Arduino software serial lines. The slave microcontroller (Pro Micro 2) is connected to the Adafruit IMU and an external temperature sensor [20], and sends its data to the master microcontroller to be recorded by the openLog device. A mechanical model of the SU-SPACE payload can be seen in Figure 15
West Virginia SPACE July 2016 RockSat-C 2016
Figure 15: Mechanical Model of the SU-SPACE PCB Assembly
Data acquisition. The microcontroller used in the Shepherd-SPACE experiment was a SparkFun
Pro Micro [19]. This microcontroller was selected due to its low cost, very small footprint size, and because of the relatively simplistic C++ programming offered by the Arduino environment. Also, the open source nature of the Arduino software promotes a vast online source of tutorial, technical, and troubleshooting information. Finally, the Pro Micro did not have an adequate number of analog and digital I/O pins to interface with all sensors used in this experiment. Therefore, a second Pro Micro was added to the design in a master/slave configuration. A 16GB class 10 microSD card was used in the openLog device as the data storage solution since this was determined to provide plenty of space for data acquisition with the large flight margin [15]. All data was collected at a rate of 10 Hz.
6. WVUTech-SPACE. The WVUTech chapter of SPACE also designed their RockSat-C 2016 payload as
a part of a collaborative team effort across the state of West Virginia. Several of the schools involved in this collaboration created very similar payloads with very similar objectives. These objectives include:
• To measure the magnetic field of Earth • To collect flight dynamics data from multiple IMUs for comparison • To determine stress of PCB during flight using strain gauge
An Arduino Mini 05 was selected as the microcontroller for this experiment [16]. A Honeywell HMC2003 magnetometer was used to measure the magnetic field of Earth, outputting three axes of data on three analog lines to the Arduino [13]. An Analog
West Virginia SPACE July 2016 RockSat-C 2016
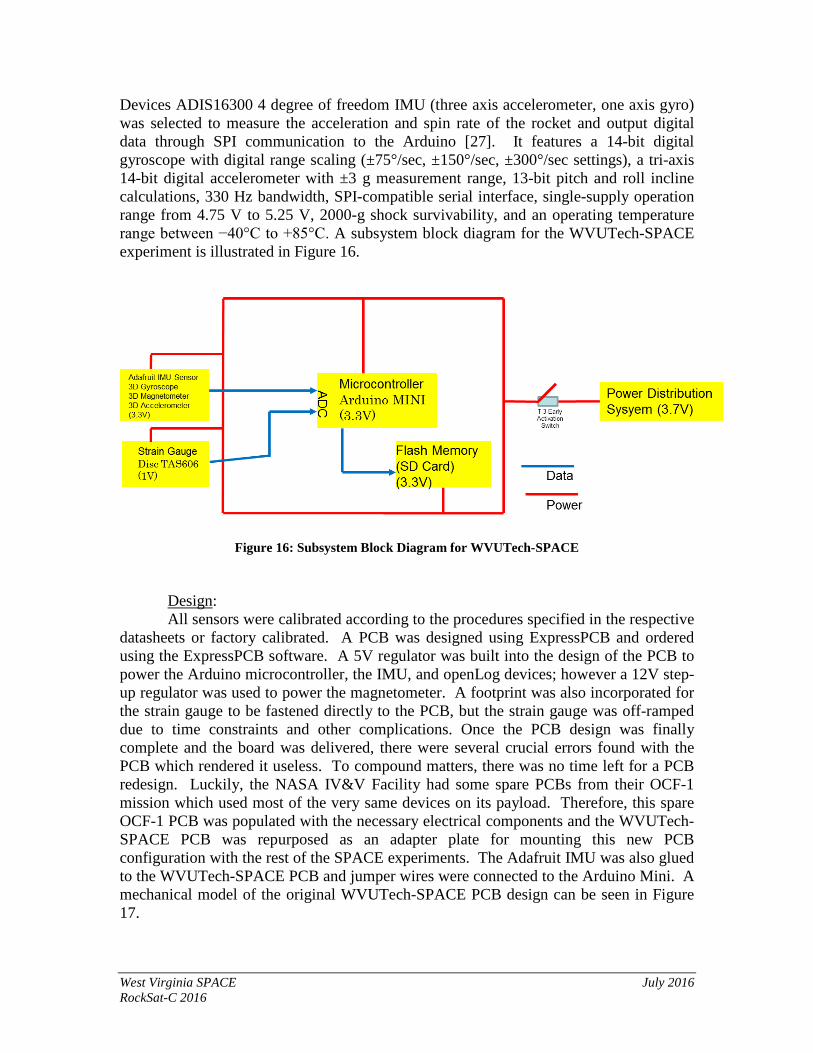
Devices ADIS16300 4 degree of freedom IMU (three axis accelerometer, one axis gyro) was selected to measure the acceleration and spin rate of the rocket and output digital data through SPI communication to the Arduino [27]. It features a 14-bit digital gyroscope with digital range scaling (±75°/sec, ±150°/sec, ±300°/sec settings), a tri-axis 14-bit digital accelerometer with ±3 g measurement range, 13-bit pitch and roll incline calculations, 330 Hz bandwidth, SPI-compatible serial interface, single-supply operation range from 4.75 V to 5.25 V, 2000-g shock survivability, and an operating temperature range between −40°C to +85°C. A subsystem block diagram for the WVUTech-SPACE experiment is illustrated in Figure 16.
Figure 16: Subsystem Block Diagram for WVUTech-SPACE Design: All sensors were calibrated according to the procedures specified in the respective
datasheets or factory calibrated. A PCB was designed using ExpressPCB and ordered using the ExpressPCB software. A 5V regulator was built into the design of the PCB to power the Arduino microcontroller, the IMU, and openLog devices; however a 12V step-up regulator was used to power the magnetometer. A footprint was also incorporated for the strain gauge to be fastened directly to the PCB, but the strain gauge was off-ramped due to time constraints and other complications. Once the PCB design was finally complete and the board was delivered, there were several crucial errors found with the PCB which rendered it useless. To compound matters, there was no time left for a PCB redesign. Luckily, the NASA IV&V Facility had some spare PCBs from their OCF-1 mission which used most of the very same devices on its payload. Therefore, this spare OCF-1 PCB was populated with the necessary electrical components and the WVUTech-SPACE PCB was repurposed as an adapter plate for mounting this new PCB configuration with the rest of the SPACE experiments. The Adafruit IMU was also glued to the WVUTech-SPACE PCB and jumper wires were connected to the Arduino Mini. A mechanical model of the original WVUTech-SPACE PCB design can be seen in Figure 17.
West Virginia SPACE July 2016 RockSat-C 2016
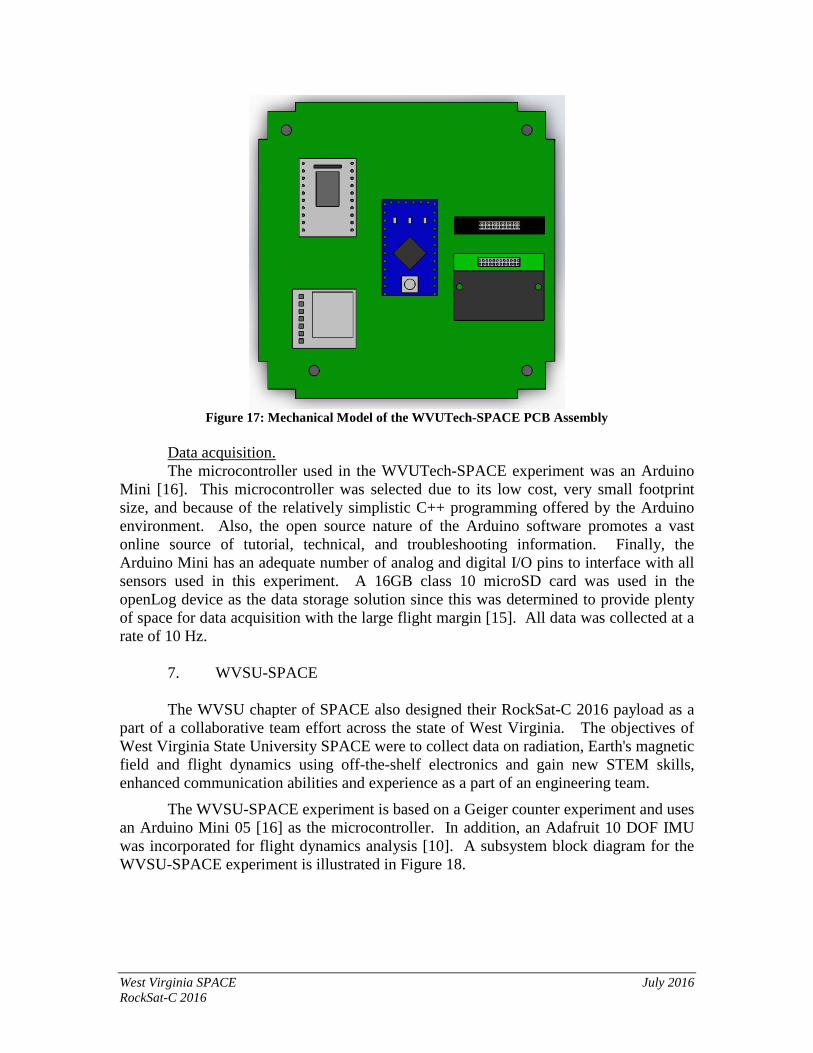
Figure 17: Mechanical Model of the WVUTech-SPACE PCB Assembly
Data acquisition. The microcontroller used in the WVUTech-SPACE experiment was an Arduino
Mini [16]. This microcontroller was selected due to its low cost, very small footprint size, and because of the relatively simplistic C++ programming offered by the Arduino environment. Also, the open source nature of the Arduino software promotes a vast online source of tutorial, technical, and troubleshooting information. Finally, the Arduino Mini has an adequate number of analog and digital I/O pins to interface with all sensors used in this experiment. A 16GB class 10 microSD card was used in the openLog device as the data storage solution since this was determined to provide plenty of space for data acquisition with the large flight margin [15]. All data was collected at a rate of 10 Hz.
7. WVSU-SPACE The WVSU chapter of SPACE also designed their RockSat-C 2016 payload as a
part of a collaborative team effort across the state of West Virginia. The objectives of West Virginia State University SPACE were to collect data on radiation, Earth's magnetic field and flight dynamics using off-the-shelf electronics and gain new STEM skills, enhanced communication abilities and experience as a part of an engineering team.
The WVSU-SPACE experiment is based on a Geiger counter experiment and uses an Arduino Mini 05 [16] as the microcontroller. In addition, an Adafruit 10 DOF IMU was incorporated for flight dynamics analysis [10]. A subsystem block diagram for the WVSU-SPACE experiment is illustrated in Figure 18.
West Virginia SPACE July 2016 RockSat-C 2016
Design: Important design considerations were: small size, weight, power draw and reliable
functionality. The components were lightweight and small in size, used little current and ran at 5 or 9 volts. The final design was the result of 3 stages of iteration. The initial concept was implemented with component breadboard prototypes, followed by an integrated breadboard prototype before the final version on PCB.
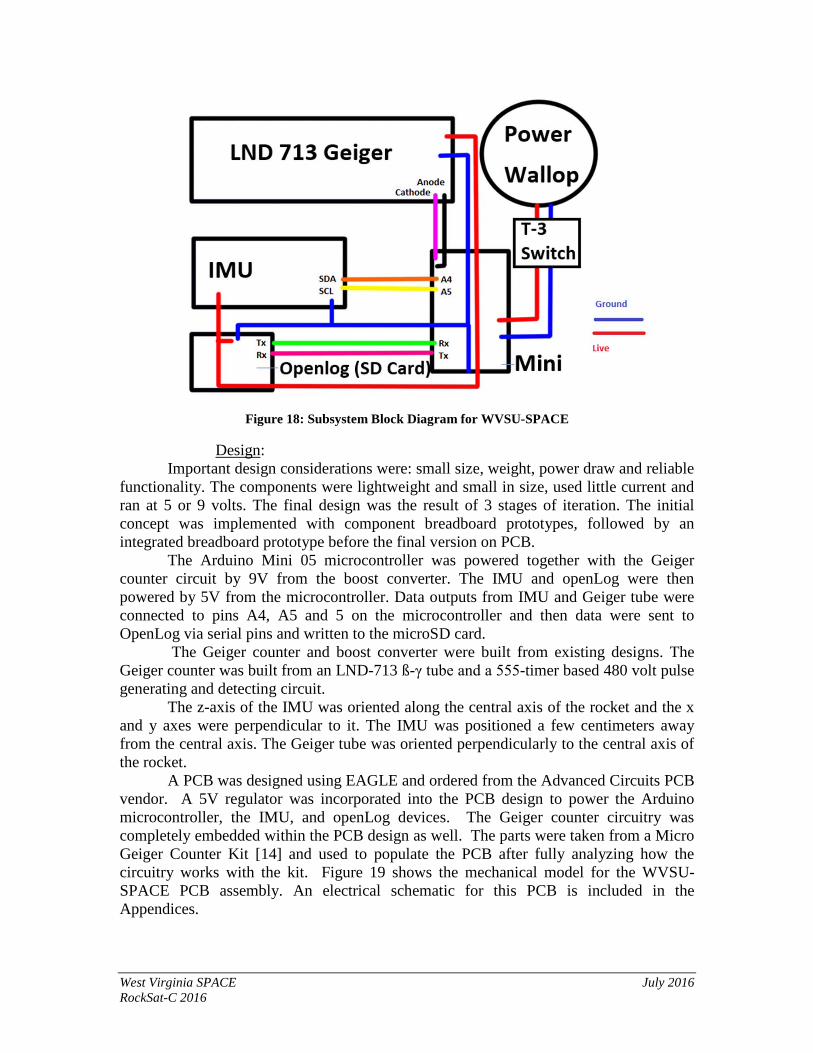
The Arduino Mini 05 microcontroller was powered together with the Geiger counter circuit by 9V from the boost converter. The IMU and openLog were then powered by 5V from the microcontroller. Data outputs from IMU and Geiger tube were connected to pins A4, A5 and 5 on the microcontroller and then data were sent to OpenLog via serial pins and written to the microSD card.
The Geiger counter and boost converter were built from existing designs. The Geiger counter was built from an LND-713 ß-γ tube and a 555-timer based 480 volt pulse generating and detecting circuit.
The z-axis of the IMU was oriented along the central axis of the rocket and the x and y axes were perpendicular to it. The IMU was positioned a few centimeters away from the central axis. The Geiger tube was oriented perpendicularly to the central axis of the rocket.
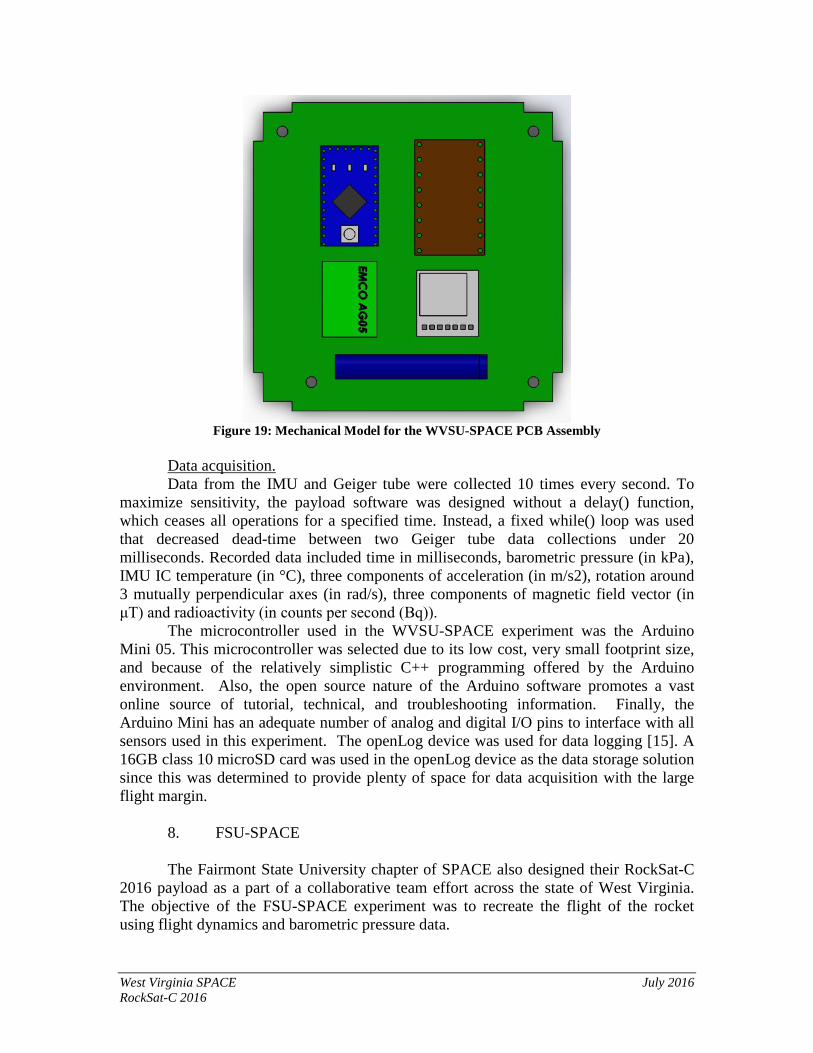
A PCB was designed using EAGLE and ordered from the Advanced Circuits PCB vendor. A 5V regulator was incorporated into the PCB design to power the Arduino microcontroller, the IMU, and openLog devices. The Geiger counter circuitry was completely embedded within the PCB design as well. The parts were taken from a Micro Geiger Counter Kit [14] and used to populate the PCB after fully analyzing how the circuitry works with the kit. Figure 19 shows the mechanical model for the WVSU-SPACE PCB assembly. An electrical schematic for this PCB is included in the Appendices.
Figure 18: Subsystem Block Diagram for WVSU-SPACE
West Virginia SPACE July 2016 RockSat-C 2016
Figure 19: Mechanical Model for the WVSU-SPACE PCB Assembly
Data acquisition. Data from the IMU and Geiger tube were collected 10 times every second. To
maximize sensitivity, the payload software was designed without a delay() function, which ceases all operations for a specified time. Instead, a fixed while() loop was used that decreased dead-time between two Geiger tube data collections under 20 milliseconds. Recorded data included time in milliseconds, barometric pressure (in kPa), IMU IC temperature (in °C), three components of acceleration (in m/s2), rotation around 3 mutually perpendicular axes (in rad/s), three components of magnetic field vector (in μT) and radioactivity (in counts per second (Bq)).
The microcontroller used in the WVSU-SPACE experiment was the Arduino Mini 05. This microcontroller was selected due to its low cost, very small footprint size, and because of the relatively simplistic C++ programming offered by the Arduino environment. Also, the open source nature of the Arduino software promotes a vast online source of tutorial, technical, and troubleshooting information. Finally, the Arduino Mini has an adequate number of analog and digital I/O pins to interface with all sensors used in this experiment. The openLog device was used for data logging [15]. A 16GB class 10 microSD card was used in the openLog device as the data storage solution since this was determined to provide plenty of space for data acquisition with the large flight margin.
8. FSU-SPACE
The Fairmont State University chapter of SPACE also designed their RockSat-C 2016 payload as a part of a collaborative team effort across the state of West Virginia. The objective of the FSU-SPACE experiment was to recreate the flight of the rocket using flight dynamics and barometric pressure data.
West Virginia SPACE July 2016 RockSat-C 2016
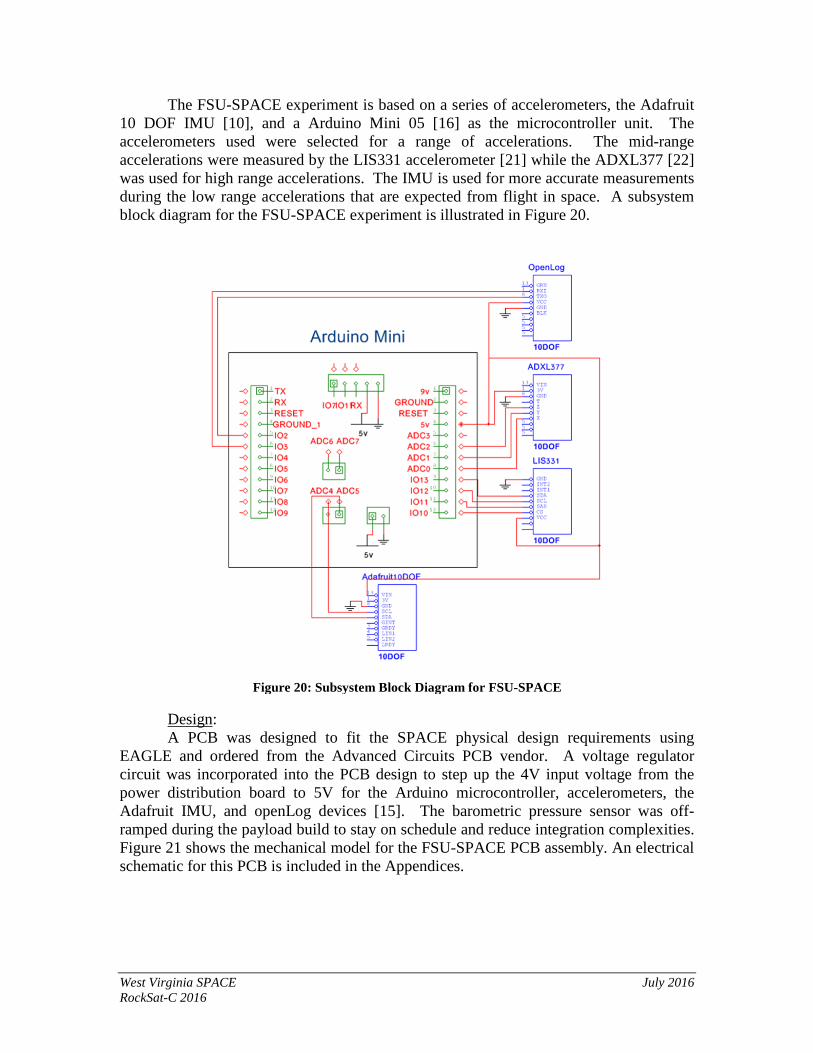
The FSU-SPACE experiment is based on a series of accelerometers, the Adafruit 10 DOF IMU [10], and a Arduino Mini 05 [16] as the microcontroller unit. The accelerometers used were selected for a range of accelerations. The mid-range accelerations were measured by the LIS331 accelerometer [21] while the ADXL377 [22] was used for high range accelerations. The IMU is used for more accurate measurements during the low range accelerations that are expected from flight in space. A subsystem block diagram for the FSU-SPACE experiment is illustrated in Figure 20.
Design: A PCB was designed to fit the SPACE physical design requirements using
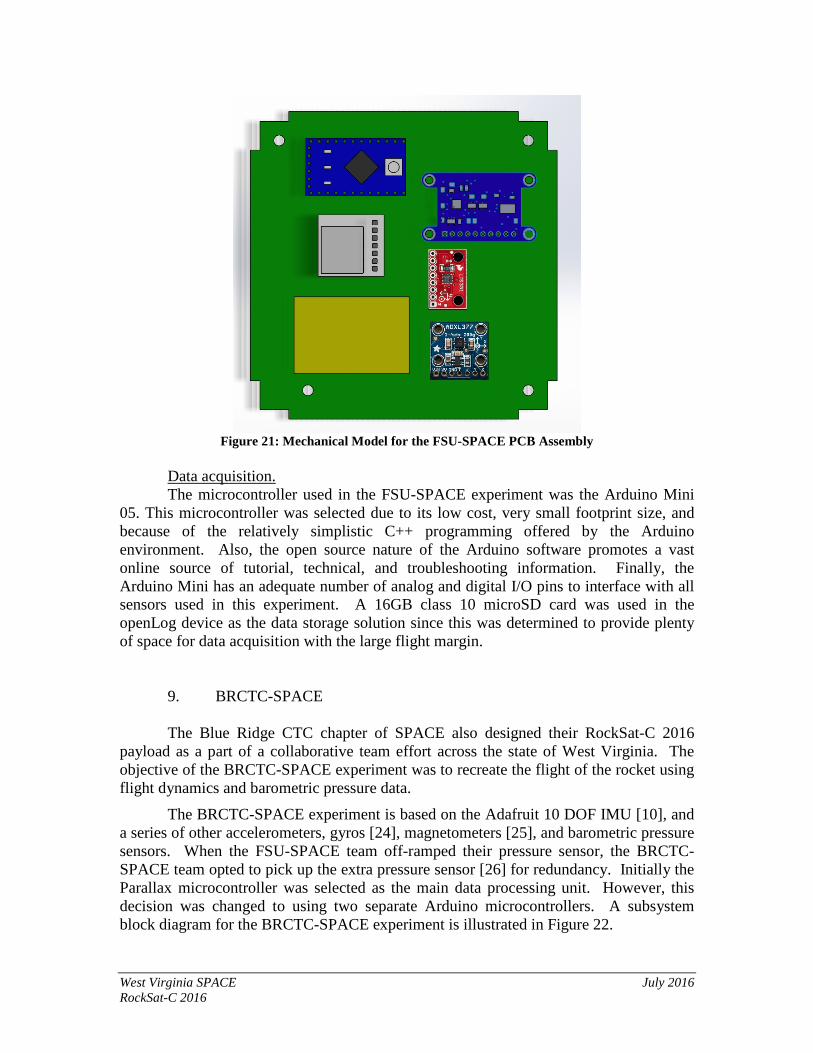
EAGLE and ordered from the Advanced Circuits PCB vendor. A voltage regulator circuit was incorporated into the PCB design to step up the 4V input voltage from the power distribution board to 5V for the Arduino microcontroller, accelerometers, the Adafruit IMU, and openLog devices [15]. The barometric pressure sensor was off-ramped during the payload build to stay on schedule and reduce integration complexities. Figure 21 shows the mechanical model for the FSU-SPACE PCB assembly. An electrical schematic for this PCB is included in the Appendices.
Figure 20: Subsystem Block Diagram for FSU-SPACE
West Virginia SPACE July 2016 RockSat-C 2016
Figure 21: Mechanical Model for the FSU-SPACE PCB Assembly
Data acquisition. The microcontroller used in the FSU-SPACE experiment was the Arduino Mini
05. This microcontroller was selected due to its low cost, very small footprint size, and because of the relatively simplistic C++ programming offered by the Arduino environment. Also, the open source nature of the Arduino software promotes a vast online source of tutorial, technical, and troubleshooting information. Finally, the Arduino Mini has an adequate number of analog and digital I/O pins to interface with all sensors used in this experiment. A 16GB class 10 microSD card was used in the openLog device as the data storage solution since this was determined to provide plenty of space for data acquisition with the large flight margin.
9. BRCTC-SPACE
The Blue Ridge CTC chapter of SPACE also designed their RockSat-C 2016 payload as a part of a collaborative team effort across the state of West Virginia. The objective of the BRCTC-SPACE experiment was to recreate the flight of the rocket using flight dynamics and barometric pressure data.
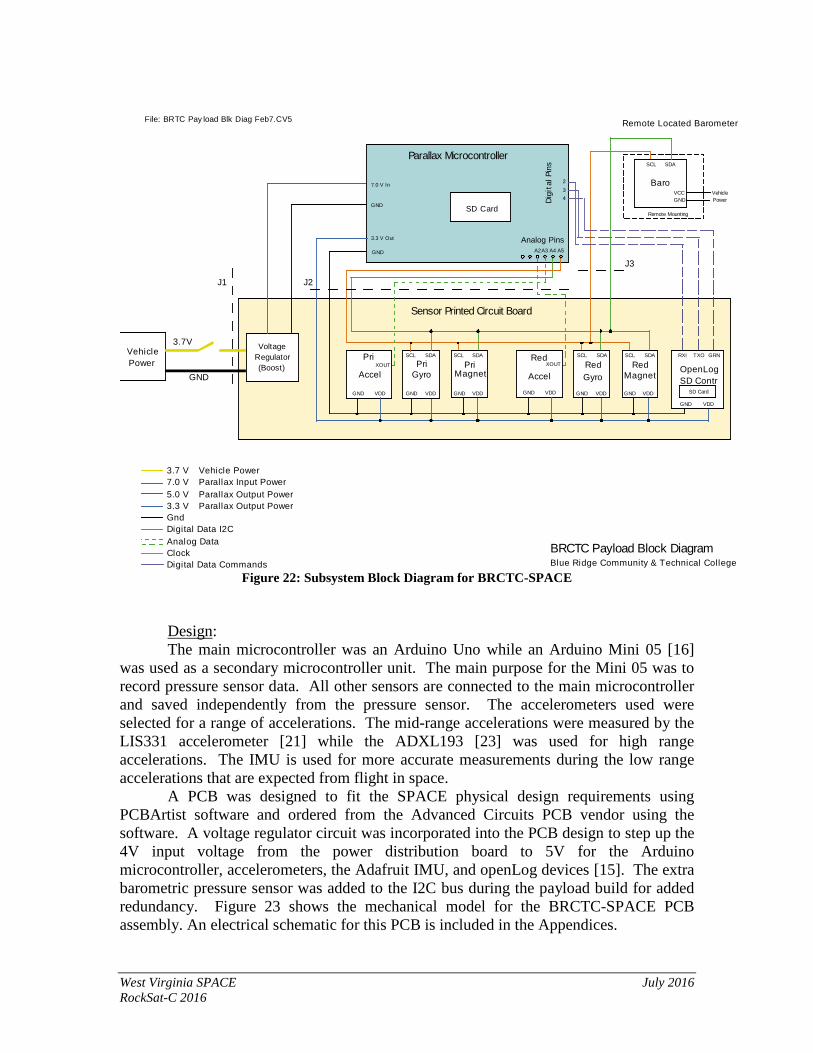
The BRCTC-SPACE experiment is based on the Adafruit 10 DOF IMU [10], and a series of other accelerometers, gyros [24], magnetometers [25], and barometric pressure sensors. When the FSU-SPACE team off-ramped their pressure sensor, the BRCTC-SPACE team opted to pick up the extra pressure sensor [26] for redundancy. Initially the Parallax microcontroller was selected as the main data processing unit. However, this decision was changed to using two separate Arduino microcontrollers. A subsystem block diagram for the BRCTC-SPACE experiment is illustrated in Figure 22.
West Virginia SPACE July 2016 RockSat-C 2016
Parallax Microcontroller
3.7V
GND
BRCTC Payload Block Diagram Blue Ridge Community & Technical College
A4 A5GND
Gyro Magnet
Baro
VDD VDD
SDASCL SDASCL
SDASCL
GND GND
3.7 V Vehicle Power 7.0 V Parallax Input Power 5.0 V Parallax Output Power 3.3 V Parallax Output Power Gnd Digital Data I2C Analog Data Clock Digital Data Commands
File: BRTC Pay load Blk Diag Feb7.CV5
Sensor Printed Circuit Board
Vehicle Power
3.3 V Out
GND
7.0 V In
Voltage Regulator (Boost)
Remote Located Barometer
Accel
VDDGND
J1 J2
J3
XOUT
Gyro Magnet
VDD VDD
SDASCL SDASCL
GND GND
Accel
VDDGND
XOUTPri Red
Pri Pri Red Red
A2A3
SD Card
OpenLog SD Contr
TXORXI
SD Card
GRN
GND VDD
2
34D
igit
al P
ins
Analog Pins
VCCGND
Vehicle Power
Remote Mounting
Figure 22: Subsystem Block Diagram for BRCTC-SPACE
Design: The main microcontroller was an Arduino Uno while an Arduino Mini 05 [16] was used as a secondary microcontroller unit. The main purpose for the Mini 05 was to record pressure sensor data. All other sensors are connected to the main microcontroller and saved independently from the pressure sensor. The accelerometers used were selected for a range of accelerations. The mid-range accelerations were measured by the LIS331 accelerometer [21] while the ADXL193 [23] was used for high range accelerations. The IMU is used for more accurate measurements during the low range accelerations that are expected from flight in space.
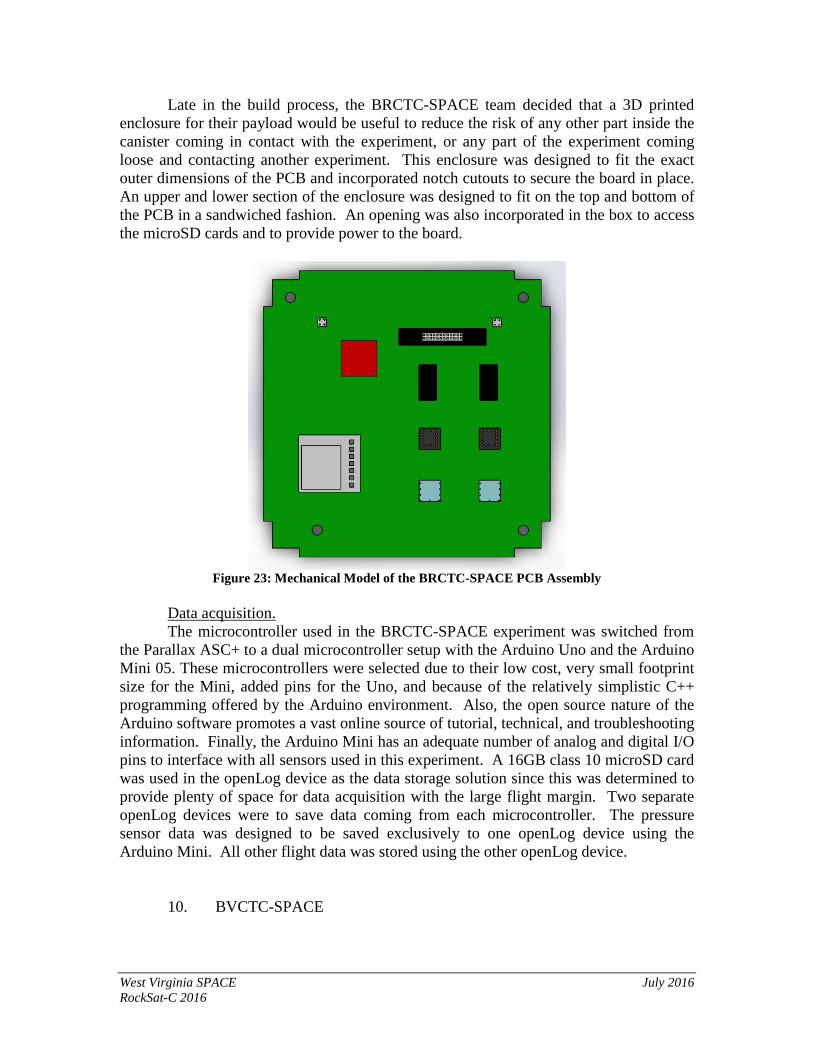
A PCB was designed to fit the SPACE physical design requirements using PCBArtist software and ordered from the Advanced Circuits PCB vendor using the software. A voltage regulator circuit was incorporated into the PCB design to step up the 4V input voltage from the power distribution board to 5V for the Arduino microcontroller, accelerometers, the Adafruit IMU, and openLog devices [15]. The extra barometric pressure sensor was added to the I2C bus during the payload build for added redundancy. Figure 23 shows the mechanical model for the BRCTC-SPACE PCB assembly. An electrical schematic for this PCB is included in the Appendices.
West Virginia SPACE July 2016 RockSat-C 2016
Late in the build process, the BRCTC-SPACE team decided that a 3D printed enclosure for their payload would be useful to reduce the risk of any other part inside the canister coming in contact with the experiment, or any part of the experiment coming loose and contacting another experiment. This enclosure was designed to fit the exact outer dimensions of the PCB and incorporated notch cutouts to secure the board in place. An upper and lower section of the enclosure was designed to fit on the top and bottom of the PCB in a sandwiched fashion. An opening was also incorporated in the box to access the microSD cards and to provide power to the board.
Figure 23: Mechanical Model of the BRCTC-SPACE PCB Assembly
Data acquisition. The microcontroller used in the BRCTC-SPACE experiment was switched from
the Parallax ASC+ to a dual microcontroller setup with the Arduino Uno and the Arduino Mini 05. These microcontrollers were selected due to their low cost, very small footprint size for the Mini, added pins for the Uno, and because of the relatively simplistic C++ programming offered by the Arduino environment. Also, the open source nature of the Arduino software promotes a vast online source of tutorial, technical, and troubleshooting information. Finally, the Arduino Mini has an adequate number of analog and digital I/O pins to interface with all sensors used in this experiment. A 16GB class 10 microSD card was used in the openLog device as the data storage solution since this was determined to provide plenty of space for data acquisition with the large flight margin. Two separate openLog devices were to save data coming from each microcontroller. The pressure sensor data was designed to be saved exclusively to one openLog device using the Arduino Mini. All other flight data was stored using the other openLog device.
10. BVCTC-SPACE
West Virginia SPACE July 2016 RockSat-C 2016
The Bridge Valley CTC chapter of SPACE also designed their RockSat-C 2016 payload as a part of a collaborative team effort across the state of West Virginia. The objective of the BVCTC-SPACE experiment was:
• To measure the flight dynamics of the rocket using two separate IMUs
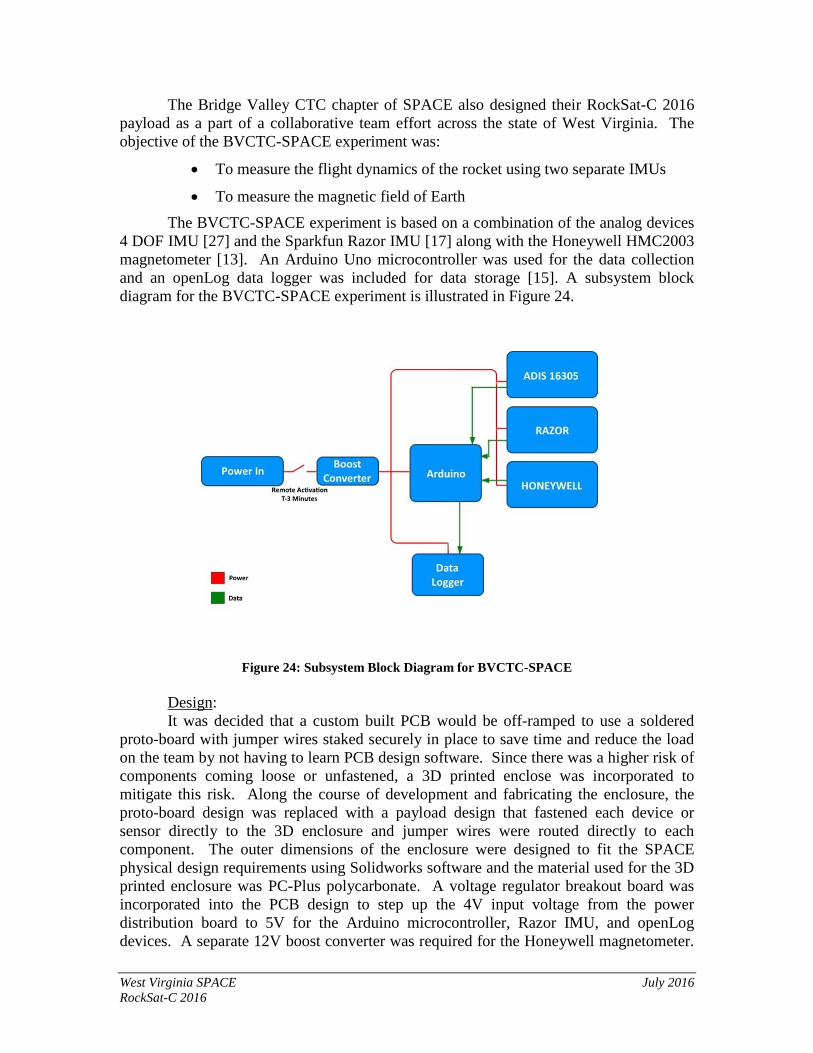
• To measure the magnetic field of Earth The BVCTC-SPACE experiment is based on a combination of the analog devices
4 DOF IMU [27] and the Sparkfun Razor IMU [17] along with the Honeywell HMC2003 magnetometer [13]. An Arduino Uno microcontroller was used for the data collection and an openLog data logger was included for data storage [15]. A subsystem block diagram for the BVCTC-SPACE experiment is illustrated in Figure 24.
Figure 24: Subsystem Block Diagram for BVCTC-SPACE
Design: It was decided that a custom built PCB would be off-ramped to use a soldered
proto-board with jumper wires staked securely in place to save time and reduce the load on the team by not having to learn PCB design software. Since there was a higher risk of components coming loose or unfastened, a 3D printed enclose was incorporated to mitigate this risk. Along the course of development and fabricating the enclosure, the proto-board design was replaced with a payload design that fastened each device or sensor directly to the 3D enclosure and jumper wires were routed directly to each component. The outer dimensions of the enclosure were designed to fit the SPACE physical design requirements using Solidworks software and the material used for the 3D printed enclosure was PC-Plus polycarbonate. A voltage regulator breakout board was incorporated into the PCB design to step up the 4V input voltage from the power distribution board to 5V for the Arduino microcontroller, Razor IMU, and openLog devices. A separate 12V boost converter was required for the Honeywell magnetometer.
West Virginia SPACE July 2016 RockSat-C 2016
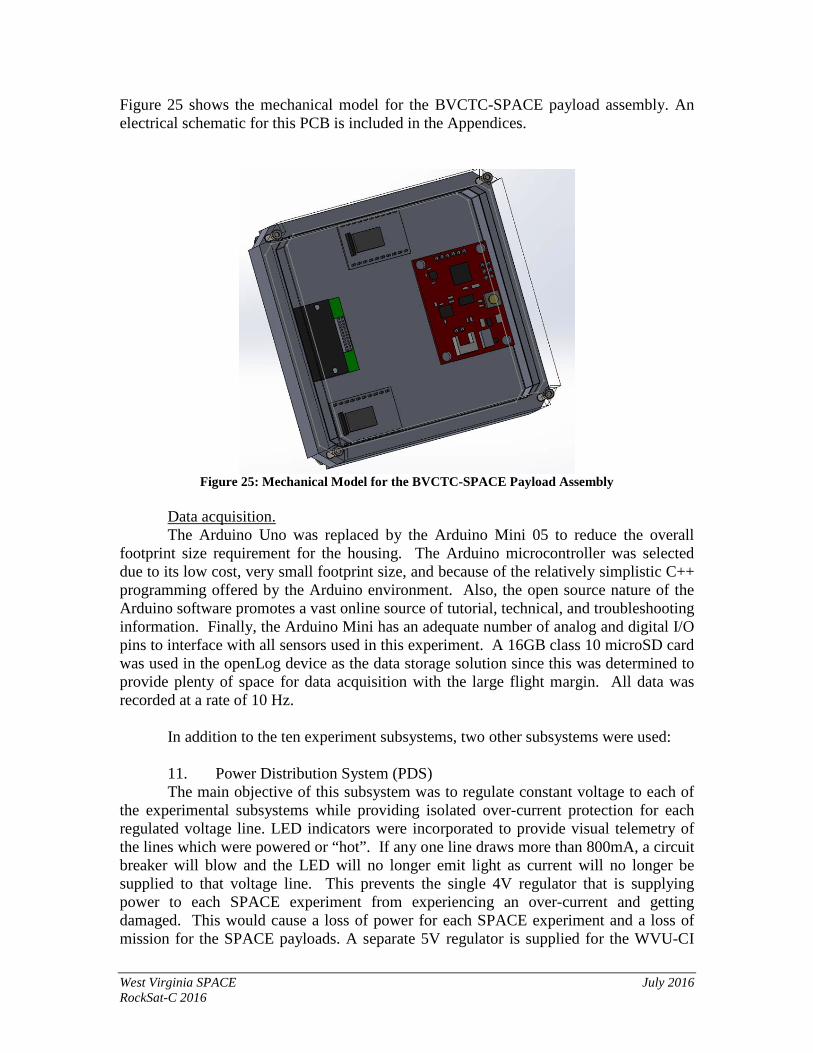
Figure 25 shows the mechanical model for the BVCTC-SPACE payload assembly. An electrical schematic for this PCB is included in the Appendices.
Figure 25: Mechanical Model for the BVCTC-SPACE Payload Assembly
Data acquisition. The Arduino Uno was replaced by the Arduino Mini 05 to reduce the overall
footprint size requirement for the housing. The Arduino microcontroller was selected due to its low cost, very small footprint size, and because of the relatively simplistic C++ programming offered by the Arduino environment. Also, the open source nature of the Arduino software promotes a vast online source of tutorial, technical, and troubleshooting information. Finally, the Arduino Mini has an adequate number of analog and digital I/O pins to interface with all sensors used in this experiment. A 16GB class 10 microSD card was used in the openLog device as the data storage solution since this was determined to provide plenty of space for data acquisition with the large flight margin. All data was recorded at a rate of 10 Hz.
In addition to the ten experiment subsystems, two other subsystems were used: 11. Power Distribution System (PDS) The main objective of this subsystem was to regulate constant voltage to each of
the experimental subsystems while providing isolated over-current protection for each regulated voltage line. LED indicators were incorporated to provide visual telemetry of the lines which were powered or “hot”. If any one line draws more than 800mA, a circuit breaker will blow and the LED will no longer emit light as current will no longer be supplied to that voltage line. This prevents the single 4V regulator that is supplying power to each SPACE experiment from experiencing an over-current and getting damaged. This would cause a loss of power for each SPACE experiment and a loss of mission for the SPACE payloads. A separate 5V regulator is supplied for the WVU-CI
West Virginia SPACE July 2016 RockSat-C 2016
experiment and for the part of the MU-SPACE experiment due to a voltage regulator issue. Instead of having to incorporate a PCB design fix, an off-ramp was given to the Marshall University team to allow them this extra 5V line. Luckily, there were extra 5V power channels built into the PDS. These 5V regulators are also current protected with a circuit breaker to prevent damage to electrical components.
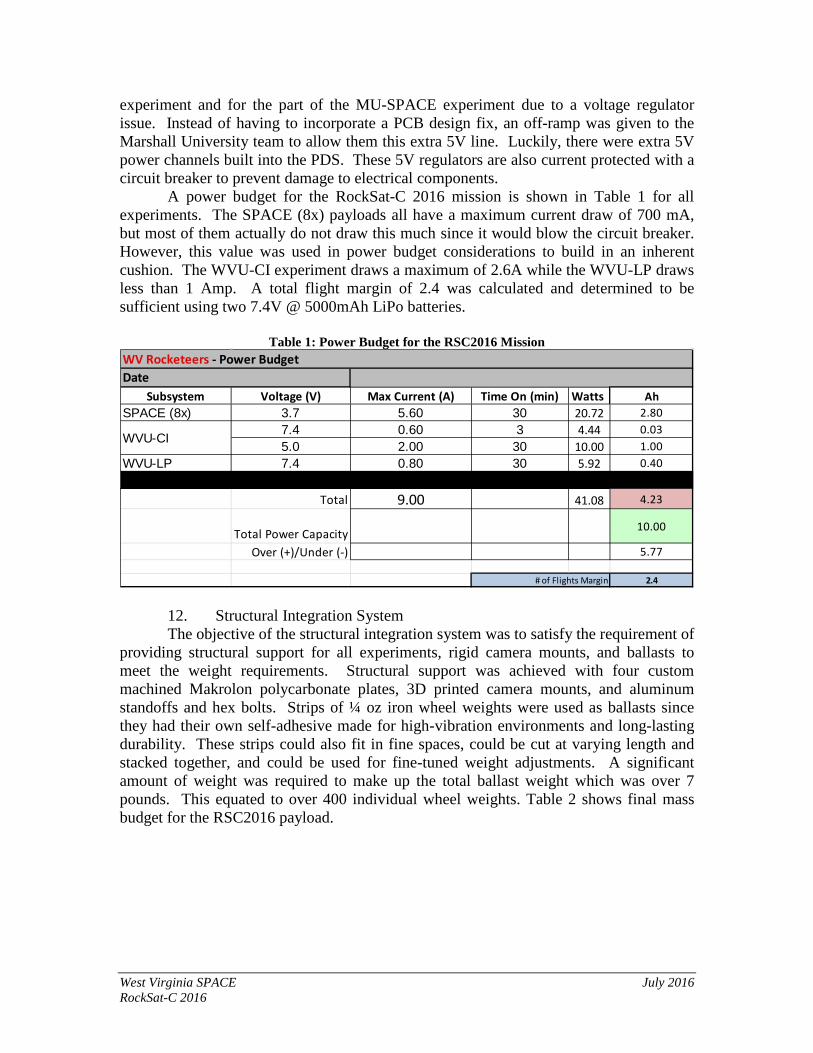
A power budget for the RockSat-C 2016 mission is shown in Table 1 for all experiments. The SPACE (8x) payloads all have a maximum current draw of 700 mA, but most of them actually do not draw this much since it would blow the circuit breaker. However, this value was used in power budget considerations to build in an inherent cushion. The WVU-CI experiment draws a maximum of 2.6A while the WVU-LP draws less than 1 Amp. A total flight margin of 2.4 was calculated and determined to be sufficient using two 7.4V @ 5000mAh LiPo batteries.
Table 1: Power Budget for the RSC2016 Mission
DateSubsystem Voltage (V) Max Current (A) Time On (min) Watts Ah
SPACE (8x) 3.7 5.60 30 20.72 2.807.4 0.60 3 4.44 0.035.0 2.00 30 10.00 1.00
WVU-LP 7.4 0.80 30 5.92 0.40
Total 9.00 41.08 4.23
Total Power Capacity 10.00
Over (+)/Under (-) 5.77
2.4
WV Rocketeers - Power .udget
# of Clights Margin
WVU-CI
12. Structural Integration System The objective of the structural integration system was to satisfy the requirement of
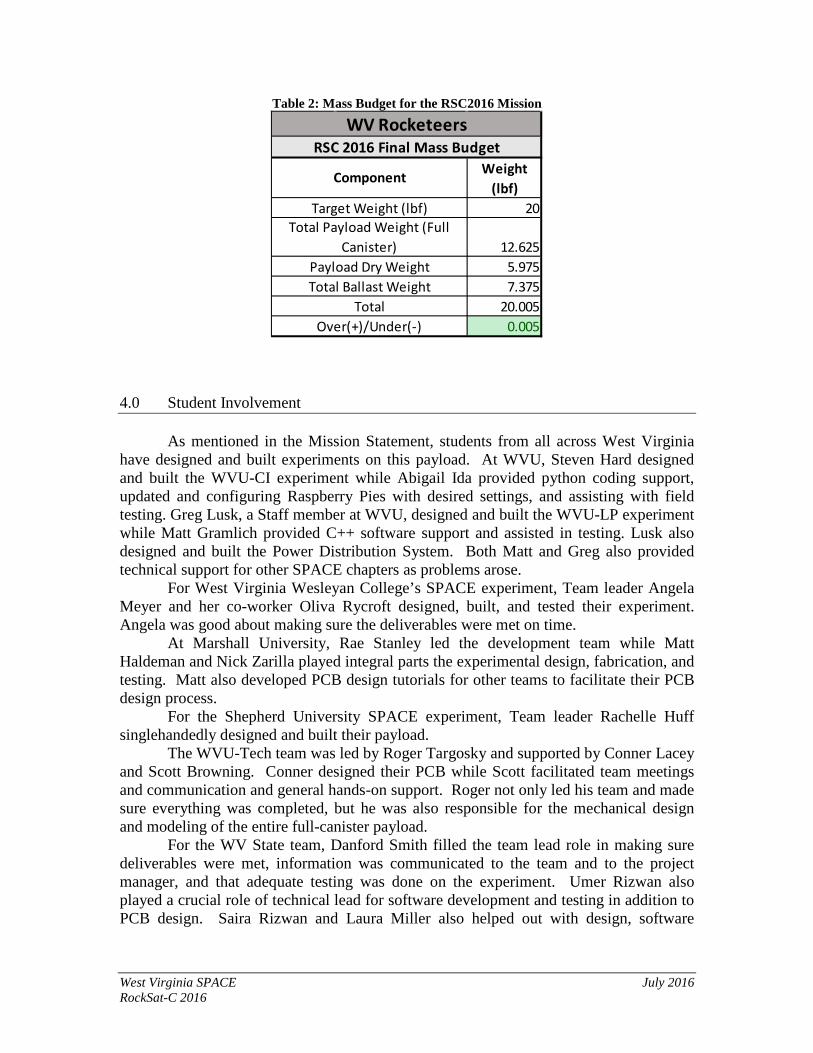
providing structural support for all experiments, rigid camera mounts, and ballasts to meet the weight requirements. Structural support was achieved with four custom machined Makrolon polycarbonate plates, 3D printed camera mounts, and aluminum standoffs and hex bolts. Strips of ¼ oz iron wheel weights were used as ballasts since they had their own self-adhesive made for high-vibration environments and long-lasting durability. These strips could also fit in fine spaces, could be cut at varying length and stacked together, and could be used for fine-tuned weight adjustments. A significant amount of weight was required to make up the total ballast weight which was over 7 pounds. This equated to over 400 individual wheel weights. Table 2 shows final mass budget for the RSC2016 payload.
West Virginia SPACE July 2016 RockSat-C 2016
Table 2: Mass Budget for the RSC2016 Mission
Weight (lbf)
20
12.6255.9757.375
20.0050.005
WV RocketeersRSC 2016 Final Mass .udget
Payload Dry WeightTotal Ballast Weight
Component
Over(+)/Under(-)Total
Total Payload Weight (Cull Canister)
Target Weight (lbf)
4.0 Student Involvement
As mentioned in the Mission Statement, students from all across West Virginia have designed and built experiments on this payload. At WVU, Steven Hard designed and built the WVU-CI experiment while Abigail Ida provided python coding support, updated and configuring Raspberry Pies with desired settings, and assisting with field testing. Greg Lusk, a Staff member at WVU, designed and built the WVU-LP experiment while Matt Gramlich provided C++ software support and assisted in testing. Lusk also designed and built the Power Distribution System. Both Matt and Greg also provided technical support for other SPACE chapters as problems arose.
For West Virginia Wesleyan College’s SPACE experiment, Team leader Angela Meyer and her co-worker Oliva Rycroft designed, built, and tested their experiment. Angela was good about making sure the deliverables were met on time.
At Marshall University, Rae Stanley led the development team while Matt Haldeman and Nick Zarilla played integral parts the experimental design, fabrication, and testing. Matt also developed PCB design tutorials for other teams to facilitate their PCB design process.
For the Shepherd University SPACE experiment, Team leader Rachelle Huff singlehandedly designed and built their payload.
The WVU-Tech team was led by Roger Targosky and supported by Conner Lacey and Scott Browning. Conner designed their PCB while Scott facilitated team meetings and communication and general hands-on support. Roger not only led his team and made sure everything was completed, but he was also responsible for the mechanical design and modeling of the entire full-canister payload.
For the WV State team, Danford Smith filled the team lead role in making sure deliverables were met, information was communicated to the team and to the project manager, and that adequate testing was done on the experiment. Umer Rizwan also played a crucial role of technical lead for software development and testing in addition to PCB design. Saira Rizwan and Laura Miller also helped out with design, software
West Virginia SPACE July 2016 RockSat-C 2016
development and testing, and shared the load for documenting test results and developing mission artifacts.
For the Fairmont State team, Isaac Lambert was the team lead that made sure all project deliverables were met and that the necessary areas of development were being covered. David Klugg provided software support and PCB design and testing while Jeff Reynolds also helped with testing and communication.
There were a total of 9 students on the Blue Ridge CTC team. Initially, there were 10, but one student ended up dropping out to focus on class and other obligations. Ronald Willis was the team lead. He did an excellent job at organizing his team and ensuring project deliverables were submitted before the deadline. Ronald also did not hesitate to ask questions when clarification was needed. He also went above and beyond his own team lead responsibilities to offer assistance to other teams that were struggling with similar issues his team had encountered. Walter Willis provided software support; David Wells served as a mechanical lead, and Hunter Demers helped out with testing. Robert Hopkins also help out with testing and provided general support.
Lastly, the Bridge Valley CTC team started out with 9 student participants. However, by second semester the team had dropped to just 4 members. Team lead Jonathan Stollings was a major contributor to the team and was the only team member to stick it out to the end. He did a good job in making sure his project deliverables were met and that payload continued through full lifecycle development. Greg Hawk was responsible for the initial design of the 3D printed box and helped with coordinating his team’s design with the canister design engineer.
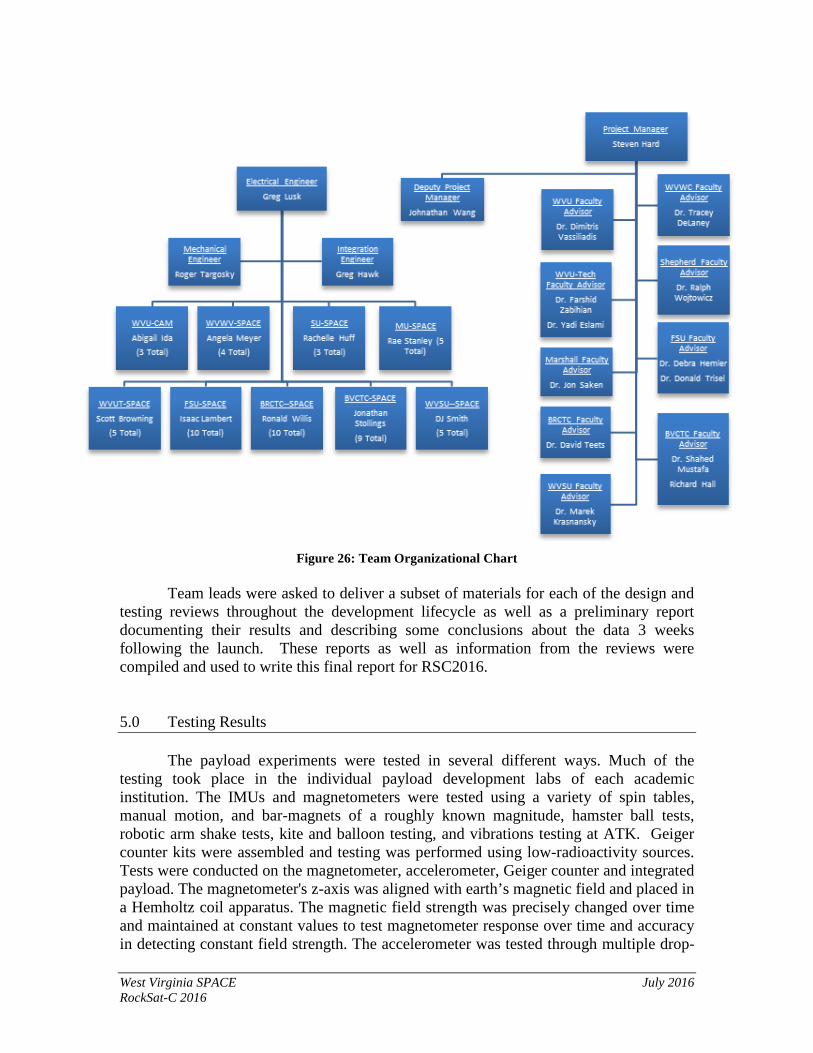
An organizational team breakdown chart can be seen in Figure 26.
West Virginia SPACE July 2016 RockSat-C 2016
Figure 26: Team Organizational Chart
Team leads were asked to deliver a subset of materials for each of the design and
testing reviews throughout the development lifecycle as well as a preliminary report documenting their results and describing some conclusions about the data 3 weeks following the launch. These reports as well as information from the reviews were compiled and used to write this final report for RSC2016.
5.0 Testing Results
The payload experiments were tested in several different ways. Much of the testing took place in the individual payload development labs of each academic institution. The IMUs and magnetometers were tested using a variety of spin tables, manual motion, and bar-magnets of a roughly known magnitude, hamster ball tests, robotic arm shake tests, kite and balloon testing, and vibrations testing at ATK. Geiger counter kits were assembled and testing was performed using low-radioactivity sources. Tests were conducted on the magnetometer, accelerometer, Geiger counter and integrated payload. The magnetometer's z-axis was aligned with earth’s magnetic field and placed in a Hemholtz coil apparatus. The magnetic field strength was precisely changed over time and maintained at constant values to test magnetometer response over time and accuracy in detecting constant field strength. The accelerometer was tested through multiple drop-
West Virginia SPACE July 2016 RockSat-C 2016
tests and constant acceleration experiments. The Geiger Counter was tested by exposing it to standard radioactive sources (36Cl, 90Sr) at different distances and by approximating all sources with the detection tube to assess its sensitivity limit. Geiger counter readings were compared with readings from a calibrated industrial Geiger counter under identical conditions. Results of these tests can be found in the testing review presentations.
On June 3rd 2016 the payload underwent initial vibe testing (3-axis vibration & electronics inspection) in ATK’s Allegany Ballistics Laboratory facilities (see Appendices). The electronic inspections occurred first. There were no major issues found by the profession inspection performed on the payload, in fact a complement was given on the solder joints. There were some areas that were pointed out that would not pass their military specifications and standards (e.g. like grounding to via test points or using solder blobs as 0 ohm resistors. It should be pointed out that there were 3 payloads NOT included in the inspection and vibe testing because they were behind schedule and the boards were not ready for payload integration. The ATK inspection staff provided useful feedback for general electronic circuits and assembly practices. Next was the 3-axis vibration testing on their two shaker-tables. Both a sine wave sweep through a range of 1-2000 Hz and a random sweep were performed. Power was applied to all payloads integrated into the canister for testing.
During testing, there some issues that occurred which were not overly surprising. The tiny screws securing the Analog Devices IMU to the WVUTech-SPACE payload came unfastened allowing the IMU to flop on the ribbon cable connection during the remainder of the vibration test. Also, the SD card on the FSU-SPACE payload came out of the socket. Based on these results, it was decided that locktite would certainly be used on those screws for the IMU and other crucial fasteners. Also, all microSD cards will be staked into the sockets using a small dab of silicon. The BVCTC-SPACE team had issues collecting data on both microSD cards. This indicated their openLog connections were not secure. Other than those issues, all other experiments collected data successfully throughout the vibration test. Vibration profiles of each test can be found in the Appendices.
Finally, spin and vibration testing was performed during the integration week at Wallops. All experiments were powered on for these tests. After testing, the microSD cards were checked on each of the experiments except BVCTC-SPACE since the data logger on that experiment was enclosed in a 3D printed box. No major problems were found during these tests. All microSD cards were cleared, reinstalled, and staked once again with a small dab of silicon.
6.0 Mission Results
The Terrier-Improved Orion launched at approximately 06:06 am on June 24, 2016. Although the overall goal and most of the main objectives of the mission were met, there were a few incidences which caused a loss of data for some components or in some cases the entire experiment. Minimum mission success was achieved in that the students learned a tremendous amount of hands-on and technical knowledge during the
West Virginia SPACE July 2016 RockSat-C 2016
entire design, fabrication, and integration process. However, only 7 out of 10 experiments returned useful data.
There were several Raspberry Pi computers used in multiple experiments which have a rather lengthy boot time that must occur before the flight code can be run. Therefore, the activation was modified from launch-time (T+00:00) to 3 minutes early (T-03:00). Because of the cpu startup process, data and image acquisition started at approximately T-02:20.
1. WVU-CI:
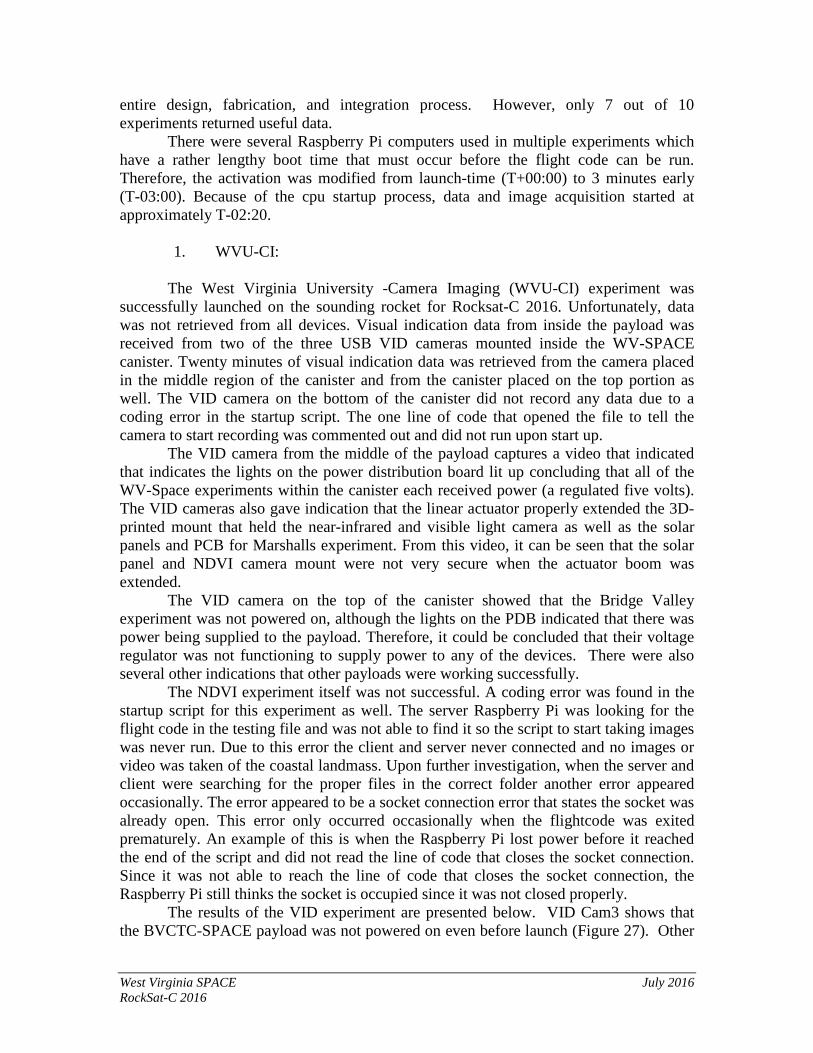
The West Virginia University -Camera Imaging (WVU-CI) experiment was successfully launched on the sounding rocket for Rocksat-C 2016. Unfortunately, data was not retrieved from all devices. Visual indication data from inside the payload was received from two of the three USB VID cameras mounted inside the WV-SPACE canister. Twenty minutes of visual indication data was retrieved from the camera placed in the middle region of the canister and from the canister placed on the top portion as well. The VID camera on the bottom of the canister did not record any data due to a coding error in the startup script. The one line of code that opened the file to tell the camera to start recording was commented out and did not run upon start up. The VID camera from the middle of the payload captures a video that indicated that indicates the lights on the power distribution board lit up concluding that all of the WV-Space experiments within the canister each received power (a regulated five volts). The VID cameras also gave indication that the linear actuator properly extended the 3D-printed mount that held the near-infrared and visible light camera as well as the solar panels and PCB for Marshalls experiment. From this video, it can be seen that the solar panel and NDVI camera mount were not very secure when the actuator boom was extended. The VID camera on the top of the canister showed that the Bridge Valley experiment was not powered on, although the lights on the PDB indicated that there was power being supplied to the payload. Therefore, it could be concluded that their voltage regulator was not functioning to supply power to any of the devices. There were also several other indications that other payloads were working successfully. The NDVI experiment itself was not successful. A coding error was found in the startup script for this experiment as well. The server Raspberry Pi was looking for the flight code in the testing file and was not able to find it so the script to start taking images was never run. Due to this error the client and server never connected and no images or video was taken of the coastal landmass. Upon further investigation, when the server and client were searching for the proper files in the correct folder another error appeared occasionally. The error appeared to be a socket connection error that states the socket was already open. This error only occurred occasionally when the flightcode was exited prematurely. An example of this is when the Raspberry Pi lost power before it reached the end of the script and did not read the line of code that closes the socket connection. Since it was not able to reach the line of code that closes the socket connection, the Raspberry Pi still thinks the socket is occupied since it was not closed properly. The results of the VID experiment are presented below. VID Cam3 shows that the BVCTC-SPACE payload was not powered on even before launch (Figure 27). Other
West Virginia SPACE July 2016 RockSat-C 2016
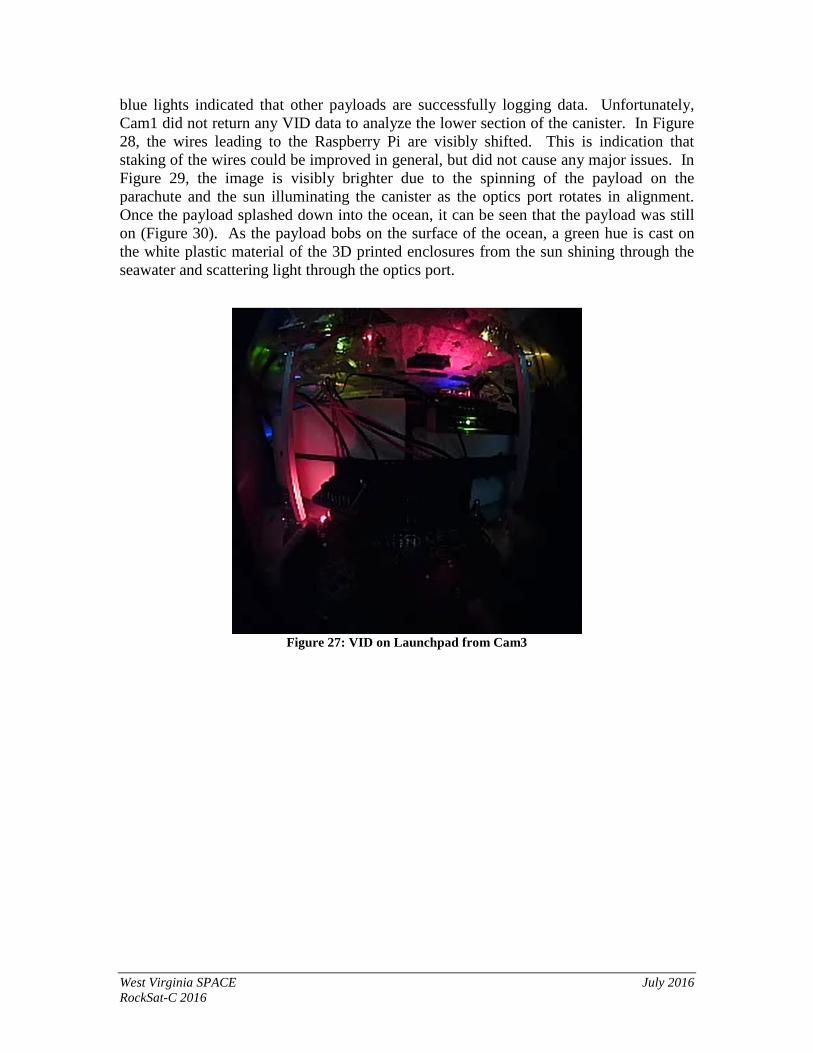
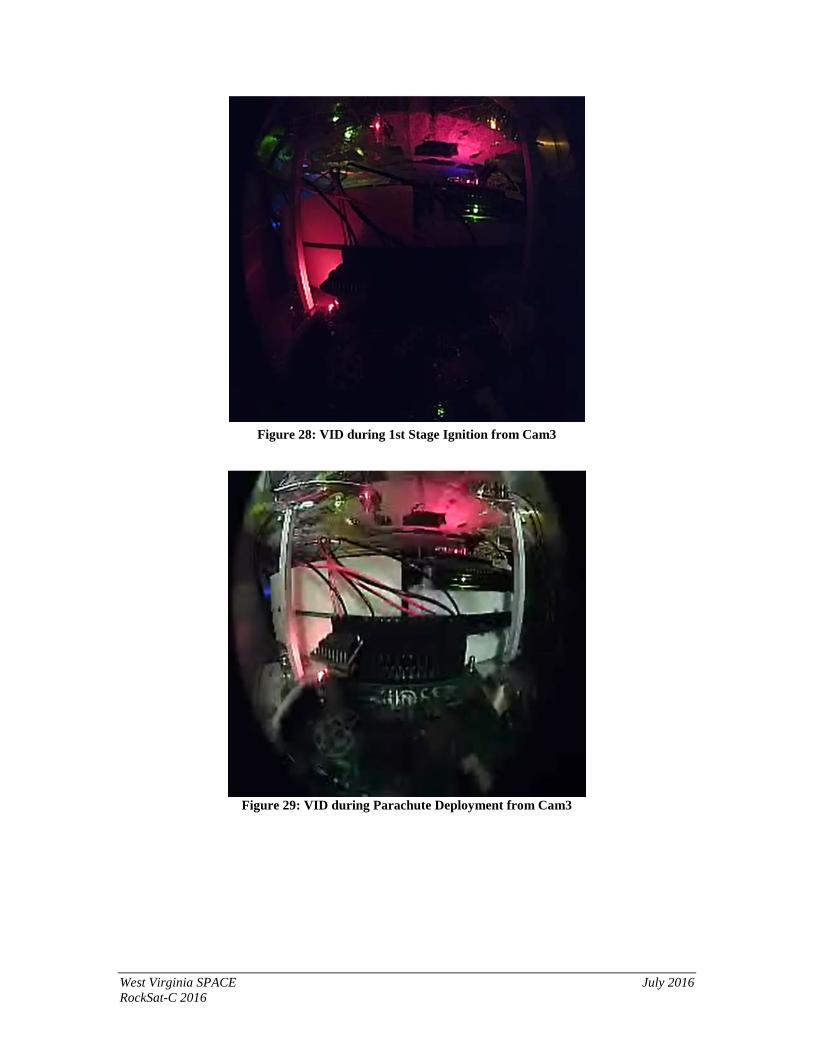
blue lights indicated that other payloads are successfully logging data. Unfortunately, Cam1 did not return any VID data to analyze the lower section of the canister. In Figure 28, the wires leading to the Raspberry Pi are visibly shifted. This is indication that staking of the wires could be improved in general, but did not cause any major issues. In Figure 29, the image is visibly brighter due to the spinning of the payload on the parachute and the sun illuminating the canister as the optics port rotates in alignment. Once the payload splashed down into the ocean, it can be seen that the payload was still on (Figure 30). As the payload bobs on the surface of the ocean, a green hue is cast on the white plastic material of the 3D printed enclosures from the sun shining through the seawater and scattering light through the optics port.
Figure 27: VID on Launchpad from Cam3
West Virginia SPACE July 2016 RockSat-C 2016
Figure 28: VID during 1st Stage Ignition from Cam3
Figure 29: VID during Parachute Deployment from Cam3

West Virginia SPACE July 2016 RockSat-C 2016
Figure 30: VID during Float from Cam3
VID data from Cam2 while still on the Launchpad can be seen in Figure 31. This image shows that all the LED lights were lit up indicating that all payloads were receiving power. Positioning of the camera could be improved somewhat so that all lights are clearly visible. Though it may be blurry, this image still shows evidence that all experiments at least received power. After launch, it can be seen that all lights continued to shine indicating that the experiments did not lose power during launch (Figure 32).
Figure 31: VID on Launchpad from Cam2
West Virginia SPACE July 2016 RockSat-C 2016
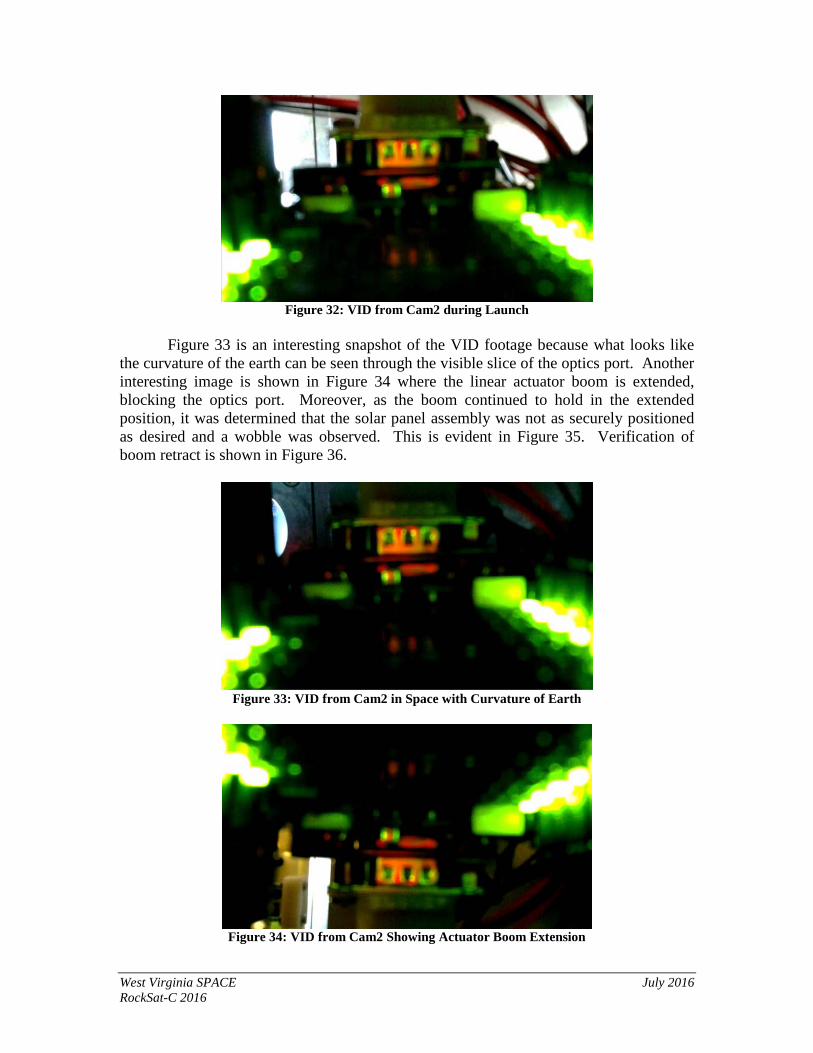
Figure 32: VID from Cam2 during Launch
Figure 33 is an interesting snapshot of the VID footage because what looks like the curvature of the earth can be seen through the visible slice of the optics port. Another interesting image is shown in Figure 34 where the linear actuator boom is extended, blocking the optics port. Moreover, as the boom continued to hold in the extended position, it was determined that the solar panel assembly was not as securely positioned as desired and a wobble was observed. This is evident in Figure 35. Verification of boom retract is shown in Figure 36.
Figure 33: VID from Cam2 in Space with Curvature of Earth
Figure 34: VID from Cam2 Showing Actuator Boom Extension
West Virginia SPACE July 2016 RockSat-C 2016
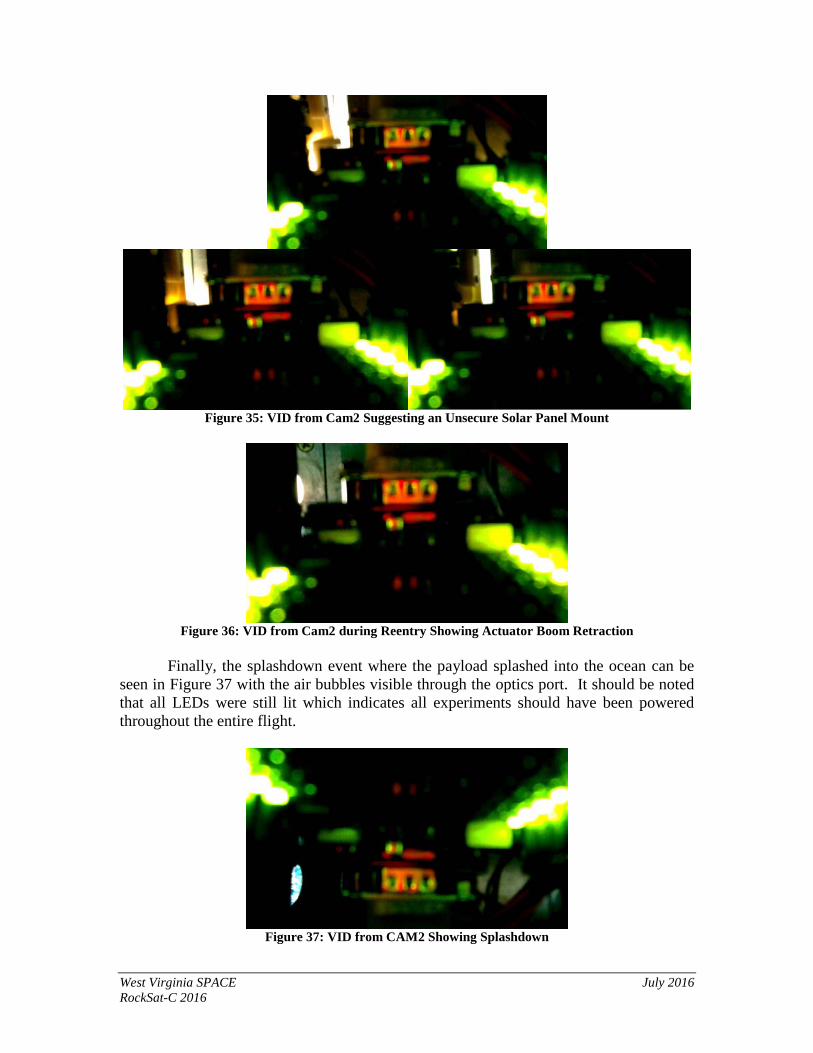
Figure 35: VID from Cam2 Suggesting an Unsecure Solar Panel Mount
Figure 36: VID from Cam2 during Reentry Showing Actuator Boom Retraction
Finally, the splashdown event where the payload splashed into the ocean can be seen in Figure 37 with the air bubbles visible through the optics port. It should be noted that all LEDs were still lit which indicates all experiments should have been powered throughout the entire flight.
Figure 37: VID from CAM2 Showing Splashdown
West Virginia SPACE July 2016 RockSat-C 2016
2. WVU-LP The West Virginia University Langmuir Probe (LP) experiment did not return any useful data. Initial data analysis indicates that the Langmuir probe was somehow grounded out during flight which caused the measured voltage to follow the excitation voltage. Therefore, the data measured was just the input source voltages to run the experiment. These oscillations indicate that the trans-impedance amplifier was working properly, but there was an issue with the physical circuitry. There also seemed to be a coding issue with the accelerometer register. It is possible that the sensor was bad or that the Netburner microcontroller was not configured properly. This could have been confirmed if day-in-the-life test data had been thoroughly analyzed.
3. WVWC-SPACE
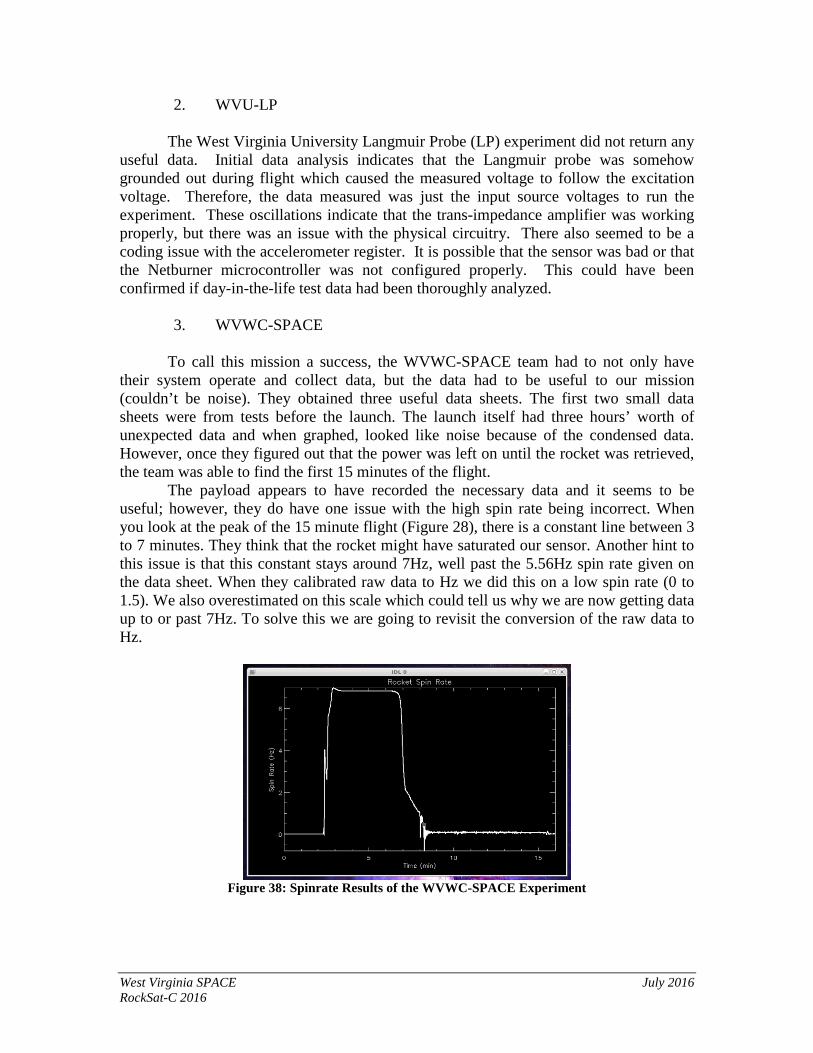
To call this mission a success, the WVWC-SPACE team had to not only have their system operate and collect data, but the data had to be useful to our mission (couldn’t be noise). They obtained three useful data sheets. The first two small data sheets were from tests before the launch. The launch itself had three hours’ worth of unexpected data and when graphed, looked like noise because of the condensed data. However, once they figured out that the power was left on until the rocket was retrieved, the team was able to find the first 15 minutes of the flight. The payload appears to have recorded the necessary data and it seems to be useful; however, they do have one issue with the high spin rate being incorrect. When you look at the peak of the 15 minute flight (Figure 28), there is a constant line between 3 to 7 minutes. They think that the rocket might have saturated our sensor. Another hint to this issue is that this constant stays around 7Hz, well past the 5.56Hz spin rate given on the data sheet. When they calibrated raw data to Hz we did this on a low spin rate (0 to 1.5). We also overestimated on this scale which could tell us why we are now getting data up to or past 7Hz. To solve this we are going to revisit the conversion of the raw data to Hz.
Figure 38: Spinrate Results of the WVWC-SPACE Experiment
West Virginia SPACE July 2016 RockSat-C 2016
4. MU-SPACE
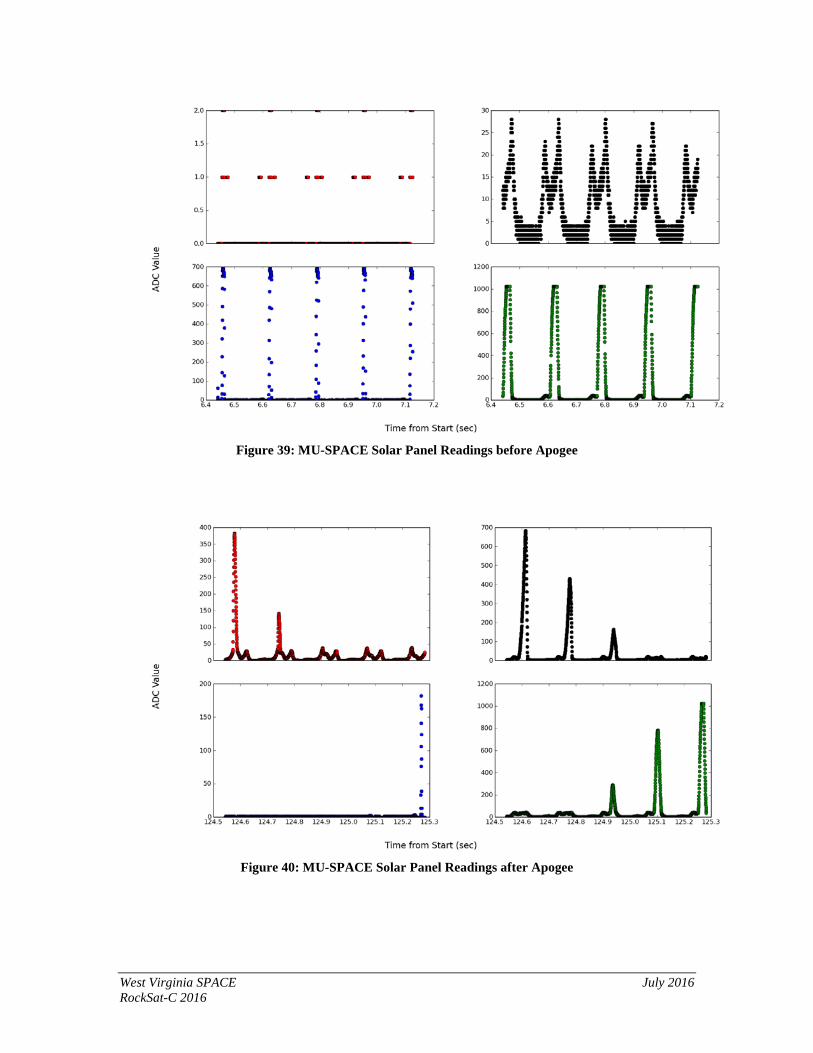
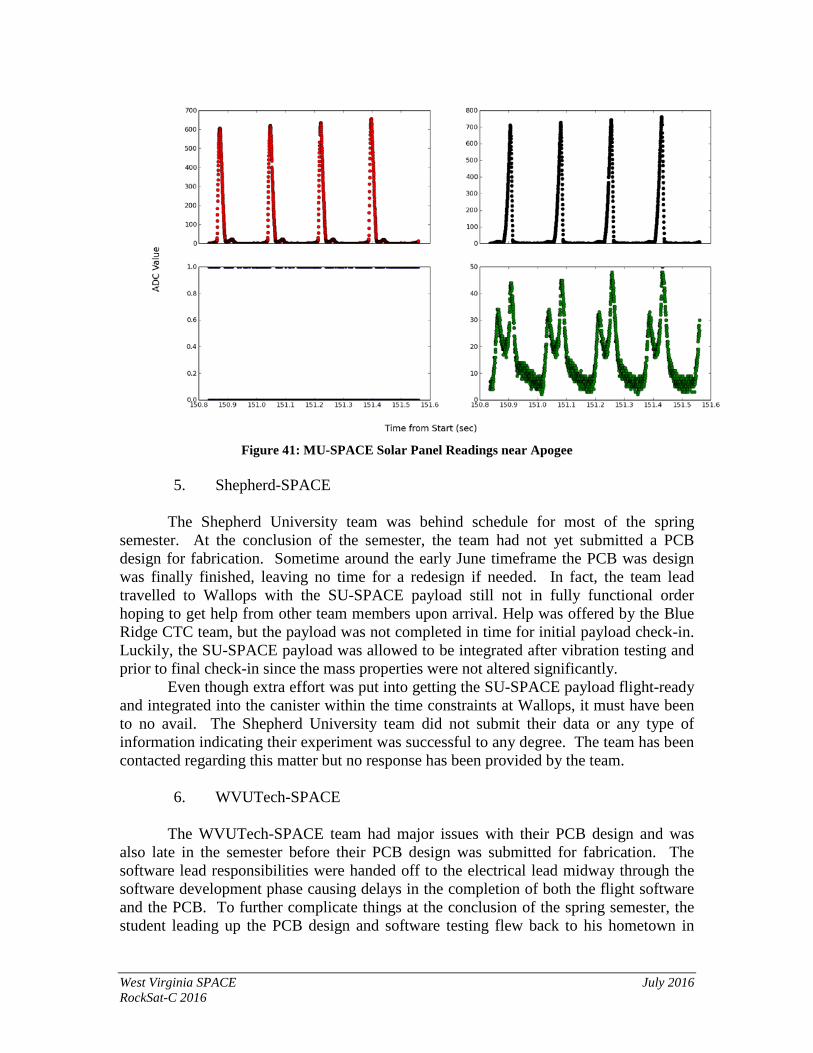
The payload was powered up at T-3 minutes, at which point the Raspberry Pi booted and began operations. After a 4 minute delay the Pi started monitoring gyroscope outputs to determine when the Z-axis (vertical) rotation rate exceeded a pre-programmed threshold indicating that the rocket has begun the spin-up of the second stage booster. At this point the Pi entered a data collection loop. It recorded 10000 data samples onto its SD card, consisting of 4 ADC channels corresponding to the 4 solar cells and 3 axes of gyroscope data, along with a time stamp. The Pi then paused for a few seconds before recording another 10,000 data samples. This loop continued for a total of 5 minutes before the Pi closed the data file and shut down to protect the data and SD card from any possible corruption during reentry and landing. The payload performed as expected, achieving a data rate of about 3000 Hz and returning 460,000 individual measurements. Examples of the raw data are shown in Figure 40 and Figure 42, with the "left" facing panel illustrated in red, the "right" facing panel in black, the "upward" facing panel in blue, and the "downward" facing panel in green. Figure 29 represents data from the beginning of the observations. The approx. 5 Hz rotation of the spacecraft can be clearly seen in this data. It appears that at this Sun angle, only two of the panels (blue and green) where illuminated by the Sun. One panel is apparently not illuminated at all (red) and the last one (black) is probably picking up only reflected light from the Earth. Although not originally a target of these observations, the detection of "Earthshine" may also be useful for attitude determinations. Figure 30 is similar to Figure 29, however different cells are illuminated. This is clearly a change in the attitude of the spacecraft, probably after apogee. Note the transition in attitude captured in Figure 31, which may be near apogee. The consistency of the illumination profiles of the cells and low noise evident in the data indicates that the device met its measurement performance goals. The overall quality of the data is excellent. However, whether or not the design is capable of achieving an accurate attitude determination will have to await further analysis. A careful post-flight calibration of the solar cell output needs to be performed to scale the data values between cells. It is the differences in the measurements that provide attitude information. Fitting all 460,000 data values is computationally prohibitive. Algorithms to eliminate redundant data are being developed. After the fits the Sun angle determinations can be checked against attitude data from the other payloads to verify the results. Finally, the type of data shown in the black panel of Figure 29, and possibly the smaller peaks seen in the other Figures, warrants further investigation to verify it is indeed reflected light from the Earth. If it is, it needs to be eliminated from the fits to the Sun angle. On the other hand it may provide additional attitude information that can improve the performance of the device.
West Virginia SPACE July 2016 RockSat-C 2016
Figure 39: MU-SPACE Solar Panel Readings before Apogee
Figure 40: MU-SPACE Solar Panel Readings after Apogee
West Virginia SPACE July 2016 RockSat-C 2016
Figure 41: MU-SPACE Solar Panel Readings near Apogee
5. Shepherd-SPACE
The Shepherd University team was behind schedule for most of the spring semester. At the conclusion of the semester, the team had not yet submitted a PCB design for fabrication. Sometime around the early June timeframe the PCB was design was finally finished, leaving no time for a redesign if needed. In fact, the team lead travelled to Wallops with the SU-SPACE payload still not in fully functional order hoping to get help from other team members upon arrival. Help was offered by the Blue Ridge CTC team, but the payload was not completed in time for initial payload check-in. Luckily, the SU-SPACE payload was allowed to be integrated after vibration testing and prior to final check-in since the mass properties were not altered significantly. Even though extra effort was put into getting the SU-SPACE payload flight-ready and integrated into the canister within the time constraints at Wallops, it must have been to no avail. The Shepherd University team did not submit their data or any type of information indicating their experiment was successful to any degree. The team has been contacted regarding this matter but no response has been provided by the team.
6. WVUTech-SPACE The WVUTech-SPACE team had major issues with their PCB design and was also late in the semester before their PCB design was submitted for fabrication. The software lead responsibilities were handed off to the electrical lead midway through the software development phase causing delays in the completion of both the flight software and the PCB. To further complicate things at the conclusion of the spring semester, the student leading up the PCB design and software testing flew back to his hometown in
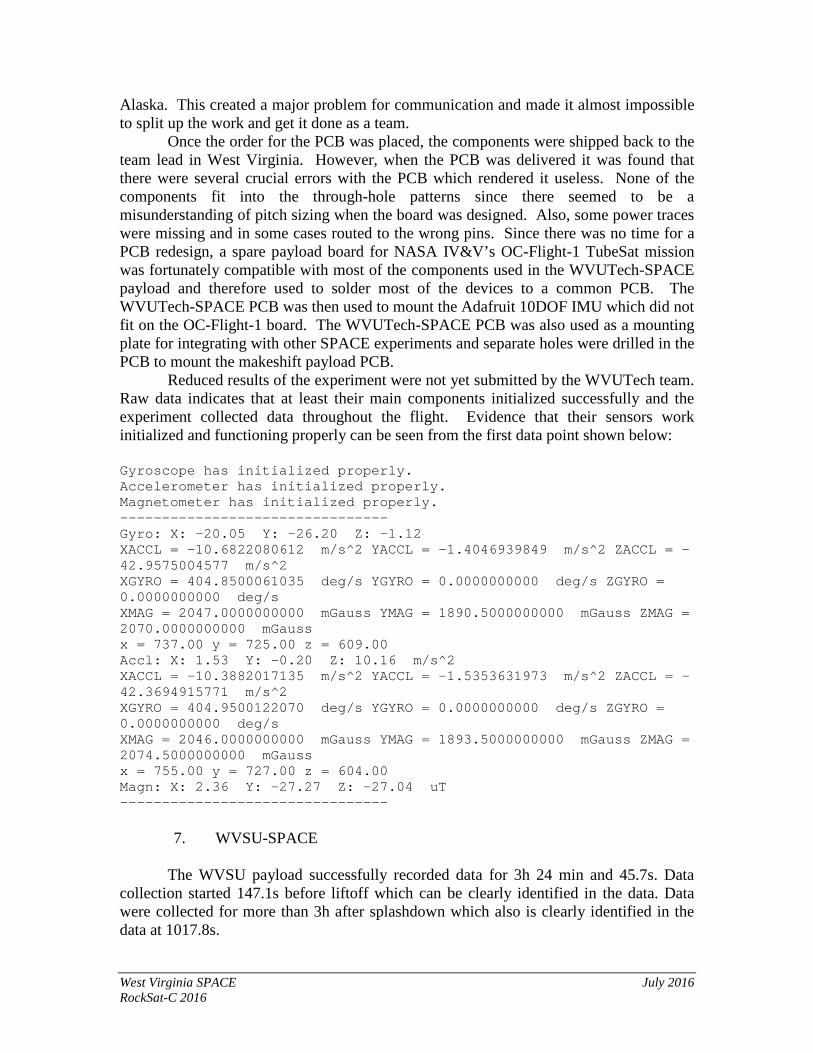
West Virginia SPACE July 2016 RockSat-C 2016
Alaska. This created a major problem for communication and made it almost impossible to split up the work and get it done as a team. Once the order for the PCB was placed, the components were shipped back to the team lead in West Virginia. However, when the PCB was delivered it was found that there were several crucial errors with the PCB which rendered it useless. None of the components fit into the through-hole patterns since there seemed to be a misunderstanding of pitch sizing when the board was designed. Also, some power traces were missing and in some cases routed to the wrong pins. Since there was no time for a PCB redesign, a spare payload board for NASA IV&V’s OC-Flight-1 TubeSat mission was fortunately compatible with most of the components used in the WVUTech-SPACE payload and therefore used to solder most of the devices to a common PCB. The WVUTech-SPACE PCB was then used to mount the Adafruit 10DOF IMU which did not fit on the OC-Flight-1 board. The WVUTech-SPACE PCB was also used as a mounting plate for integrating with other SPACE experiments and separate holes were drilled in the PCB to mount the makeshift payload PCB. Reduced results of the experiment were not yet submitted by the WVUTech team. Raw data indicates that at least their main components initialized successfully and the experiment collected data throughout the flight. Evidence that their sensors work initialized and functioning properly can be seen from the first data point shown below: Gyroscope has initialized properly. Accelerometer has initialized properly. Magnetometer has initialized properly. -------------------------------- Gyro: X: -20.05 Y: -26.20 Z: -1.12 XACCL = -10.6822080612 m/s^2 YACCL = -1.4046939849 m/s^2 ZACCL = -42.9575004577 m/s^2 XGYRO = 404.8500061035 deg/s YGYRO = 0.0000000000 deg/s ZGYRO = 0.0000000000 deg/s XMAG = 2047.0000000000 mGauss YMAG = 1890.5000000000 mGauss ZMAG = 2070.0000000000 mGauss x = 737.00 y = 725.00 z = 609.00 Accl: X: 1.53 Y: -0.20 Z: 10.16 m/s^2 XACCL = -10.3882017135 m/s^2 YACCL = -1.5353631973 m/s^2 ZACCL = -42.3694915771 m/s^2 XGYRO = 404.9500122070 deg/s YGYRO = 0.0000000000 deg/s ZGYRO = 0.0000000000 deg/s XMAG = 2046.0000000000 mGauss YMAG = 1893.5000000000 mGauss ZMAG = 2074.5000000000 mGauss x = 755.00 y = 727.00 z = 604.00 Magn: X: 2.36 Y: -27.27 Z: -27.04 uT --------------------------------
7. WVSU-SPACE The WVSU payload successfully recorded data for 3h 24 min and 45.7s. Data collection started 147.1s before liftoff which can be clearly identified in the data. Data were collected for more than 3h after splashdown which also is clearly identified in the data at 1017.8s.
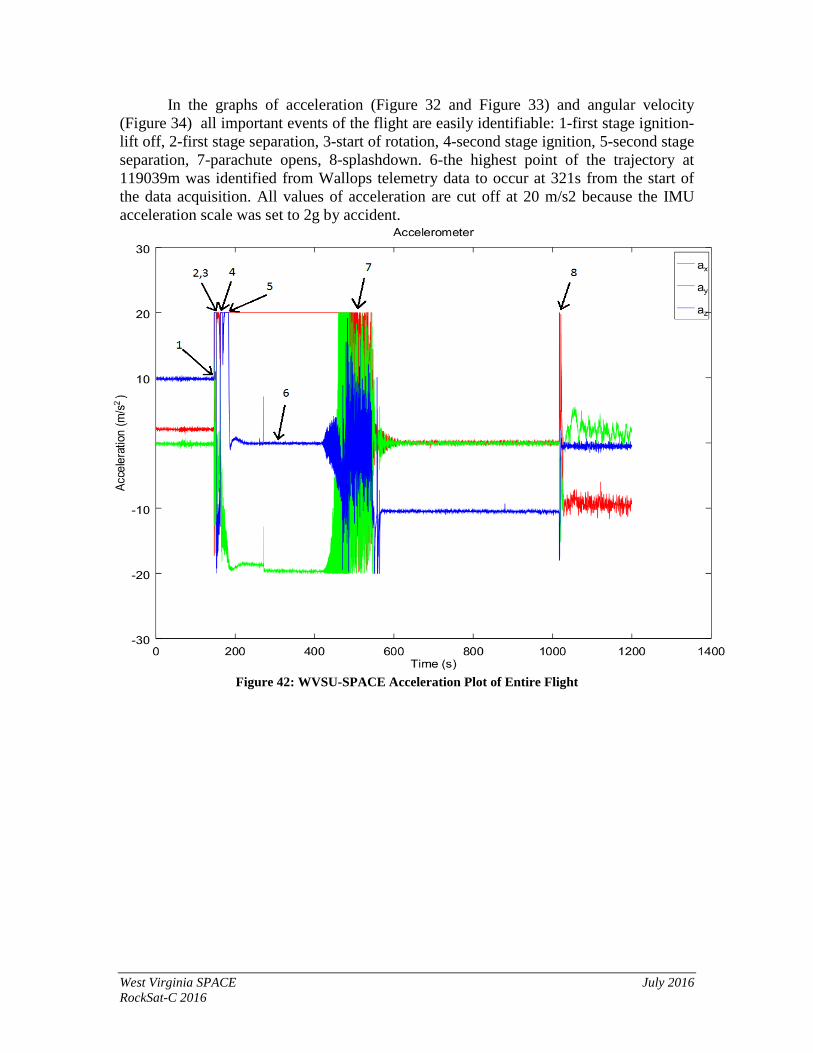
West Virginia SPACE July 2016 RockSat-C 2016
In the graphs of acceleration (Figure 32 and Figure 33) and angular velocity (Figure 34) all important events of the flight are easily identifiable: 1-first stage ignition-lift off, 2-first stage separation, 3-start of rotation, 4-second stage ignition, 5-second stage separation, 7-parachute opens, 8-splashdown. 6-the highest point of the trajectory at 119039m was identified from Wallops telemetry data to occur at 321s from the start of the data acquisition. All values of acceleration are cut off at 20 m/s2 because the IMU acceleration scale was set to 2g by accident.
Figure 42: WVSU-SPACE Acceleration Plot of Entire Flight
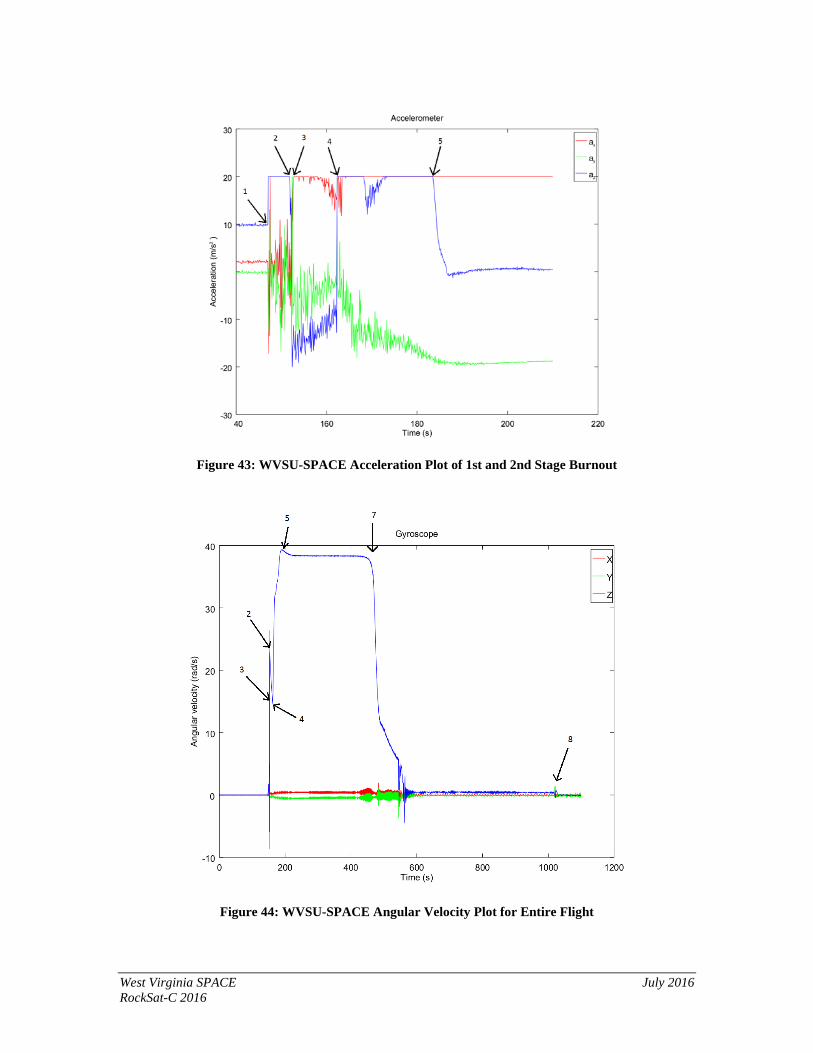
West Virginia SPACE July 2016 RockSat-C 2016
Figure 43: WVSU-SPACE Acceleration Plot of 1st and 2nd Stage Burnout
Figure 44: WVSU-SPACE Angular Velocity Plot for Entire Flight
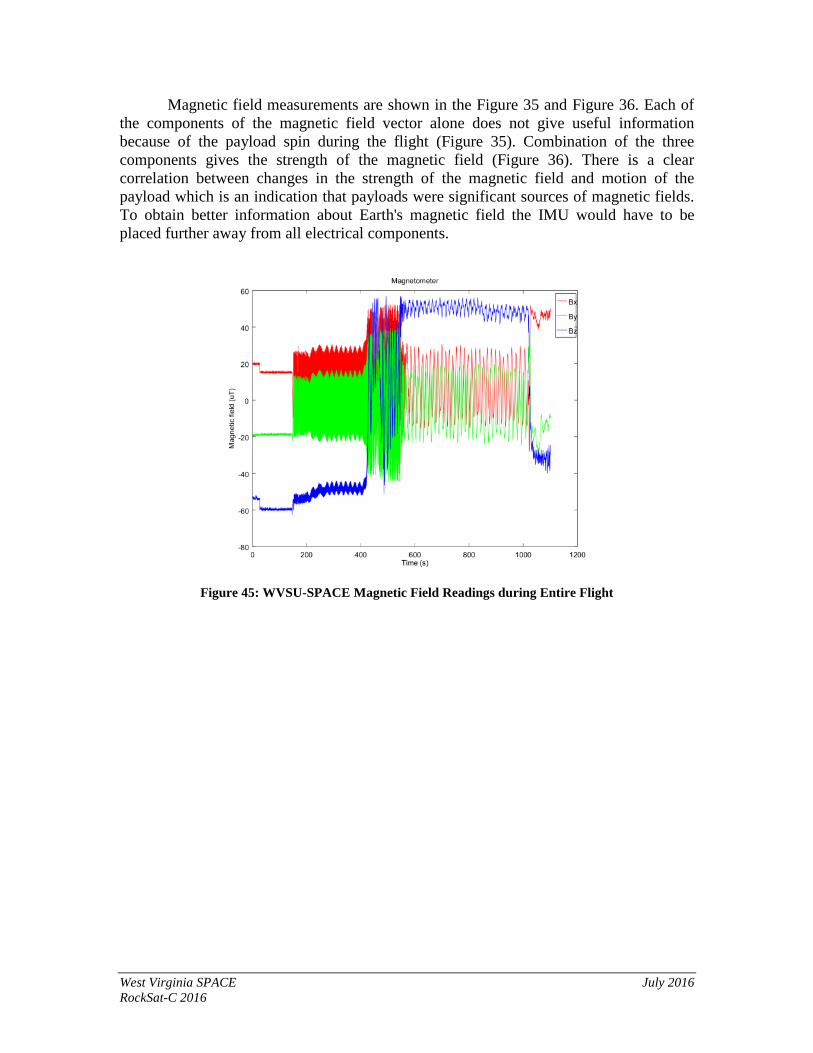
West Virginia SPACE July 2016 RockSat-C 2016
Magnetic field measurements are shown in the Figure 35 and Figure 36. Each of the components of the magnetic field vector alone does not give useful information because of the payload spin during the flight (Figure 35). Combination of the three components gives the strength of the magnetic field (Figure 36). There is a clear correlation between changes in the strength of the magnetic field and motion of the payload which is an indication that payloads were significant sources of magnetic fields. To obtain better information about Earth's magnetic field the IMU would have to be placed further away from all electrical components.
Figure 45: WVSU-SPACE Magnetic Field Readings during Entire Flight
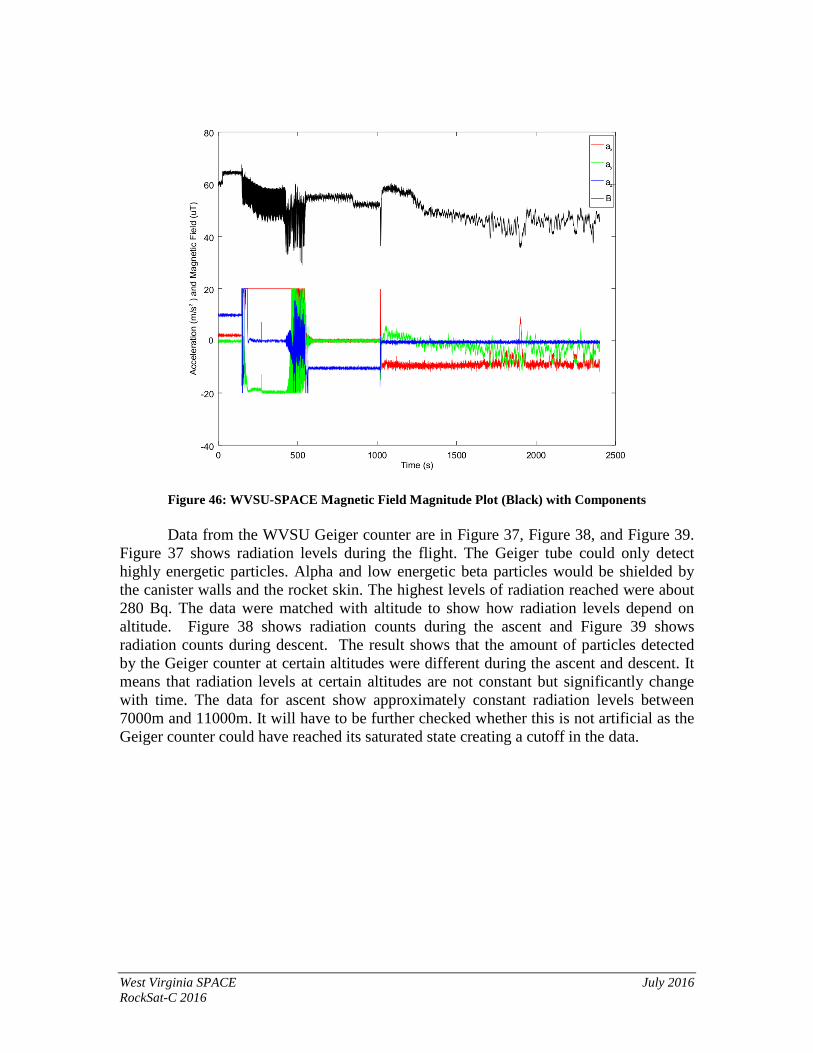
West Virginia SPACE July 2016 RockSat-C 2016
Figure 46: WVSU-SPACE Magnetic Field Magnitude Plot (Black) with Components
Data from the WVSU Geiger counter are in Figure 37, Figure 38, and Figure 39. Figure 37 shows radiation levels during the flight. The Geiger tube could only detect highly energetic particles. Alpha and low energetic beta particles would be shielded by the canister walls and the rocket skin. The highest levels of radiation reached were about 280 Bq. The data were matched with altitude to show how radiation levels depend on altitude. Figure 38 shows radiation counts during the ascent and Figure 39 shows radiation counts during descent. The result shows that the amount of particles detected by the Geiger counter at certain altitudes were different during the ascent and descent. It means that radiation levels at certain altitudes are not constant but significantly change with time. The data for ascent show approximately constant radiation levels between 7000m and 11000m. It will have to be further checked whether this is not artificial as the Geiger counter could have reached its saturated state creating a cutoff in the data.
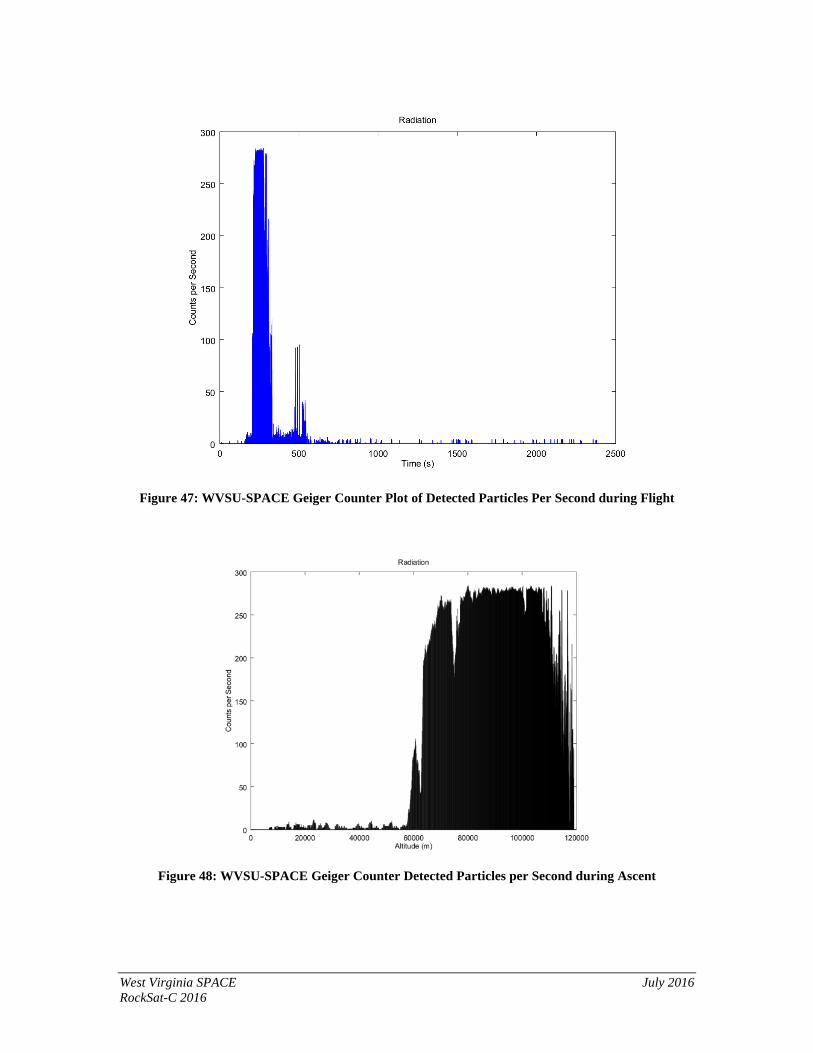
West Virginia SPACE July 2016 RockSat-C 2016
Figure 47: WVSU-SPACE Geiger Counter Plot of Detected Particles Per Second during Flight
Figure 48: WVSU-SPACE Geiger Counter Detected Particles per Second during Ascent
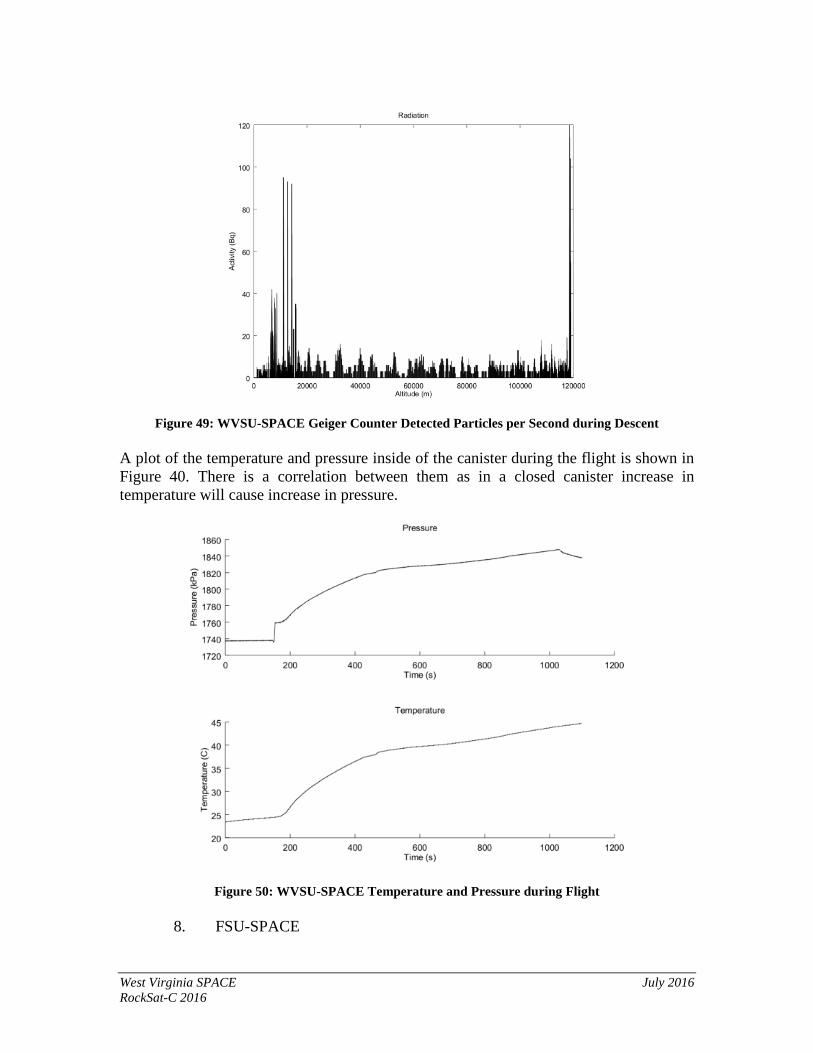
West Virginia SPACE July 2016 RockSat-C 2016
Figure 49: WVSU-SPACE Geiger Counter Detected Particles per Second during Descent
A plot of the temperature and pressure inside of the canister during the flight is shown in Figure 40. There is a correlation between them as in a closed canister increase in temperature will cause increase in pressure.
Figure 50: WVSU-SPACE Temperature and Pressure during Flight
8. FSU-SPACE
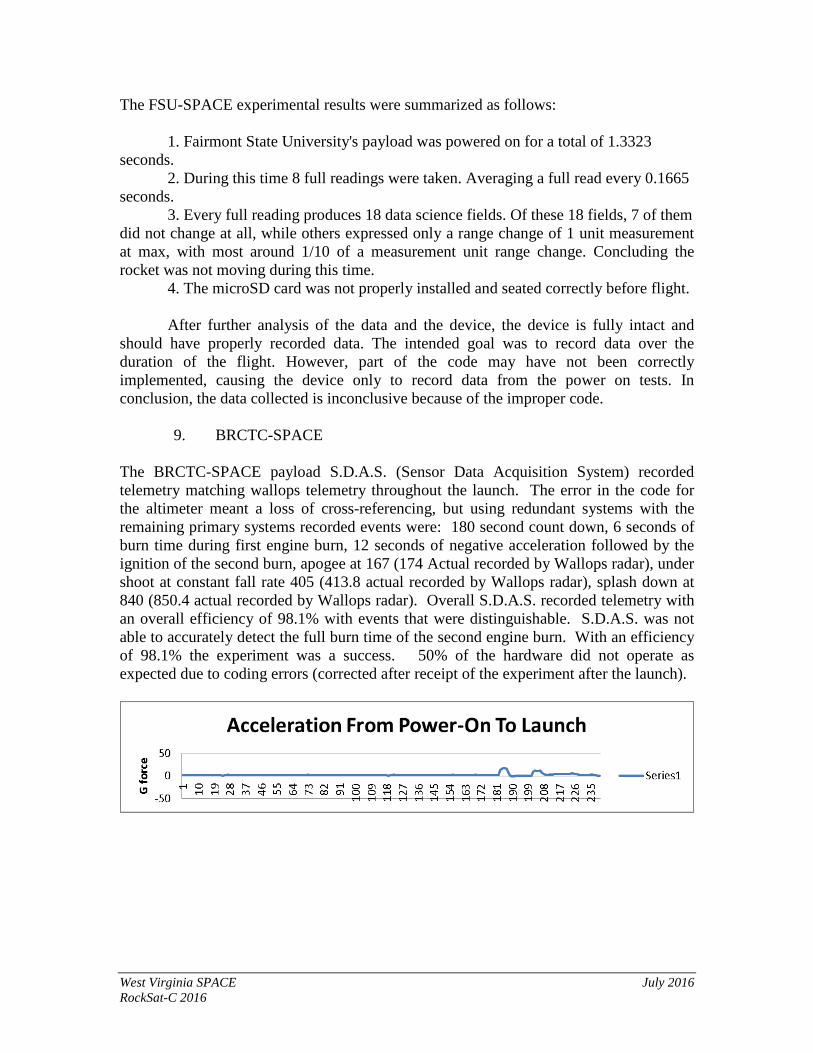
West Virginia SPACE July 2016 RockSat-C 2016
The FSU-SPACE experimental results were summarized as follows: 1. Fairmont State University's payload was powered on for a total of 1.3323 seconds. 2. During this time 8 full readings were taken. Averaging a full read every 0.1665 seconds. 3. Every full reading produces 18 data science fields. Of these 18 fields, 7 of them did not change at all, while others expressed only a range change of 1 unit measurement at max, with most around 1/10 of a measurement unit range change. Concluding the rocket was not moving during this time. 4. The microSD card was not properly installed and seated correctly before flight. After further analysis of the data and the device, the device is fully intact and should have properly recorded data. The intended goal was to record data over the duration of the flight. However, part of the code may have not been correctly implemented, causing the device only to record data from the power on tests. In conclusion, the data collected is inconclusive because of the improper code.
9. BRCTC-SPACE The BRCTC-SPACE payload S.D.A.S. (Sensor Data Acquisition System) recorded telemetry matching wallops telemetry throughout the launch. The error in the code for the altimeter meant a loss of cross-referencing, but using redundant systems with the remaining primary systems recorded events were: 180 second count down, 6 seconds of burn time during first engine burn, 12 seconds of negative acceleration followed by the ignition of the second burn, apogee at 167 (174 Actual recorded by Wallops radar), under shoot at constant fall rate 405 (413.8 actual recorded by Wallops radar), splash down at 840 (850.4 actual recorded by Wallops radar). Overall S.D.A.S. recorded telemetry with an overall efficiency of 98.1% with events that were distinguishable. S.D.A.S. was not able to accurately detect the full burn time of the second engine burn. With an efficiency of 98.1% the experiment was a success. 50% of the hardware did not operate as expected due to coding errors (corrected after receipt of the experiment after the launch).
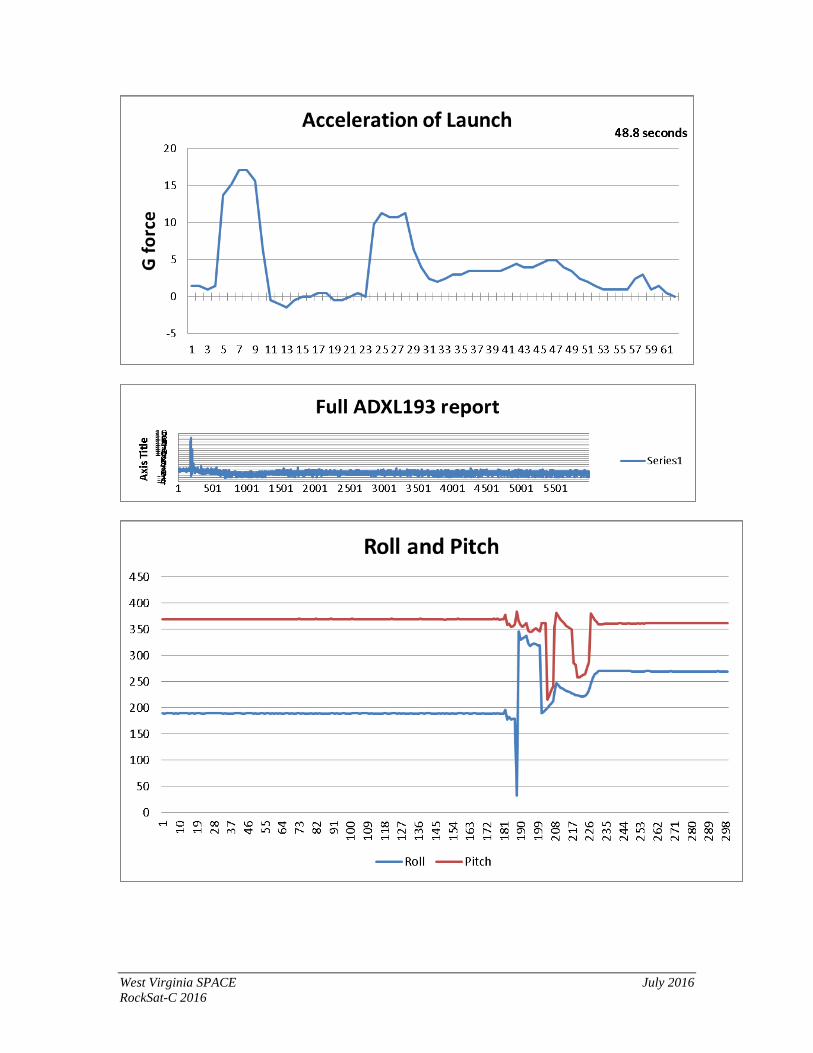
West Virginia SPACE July 2016 RockSat-C 2016
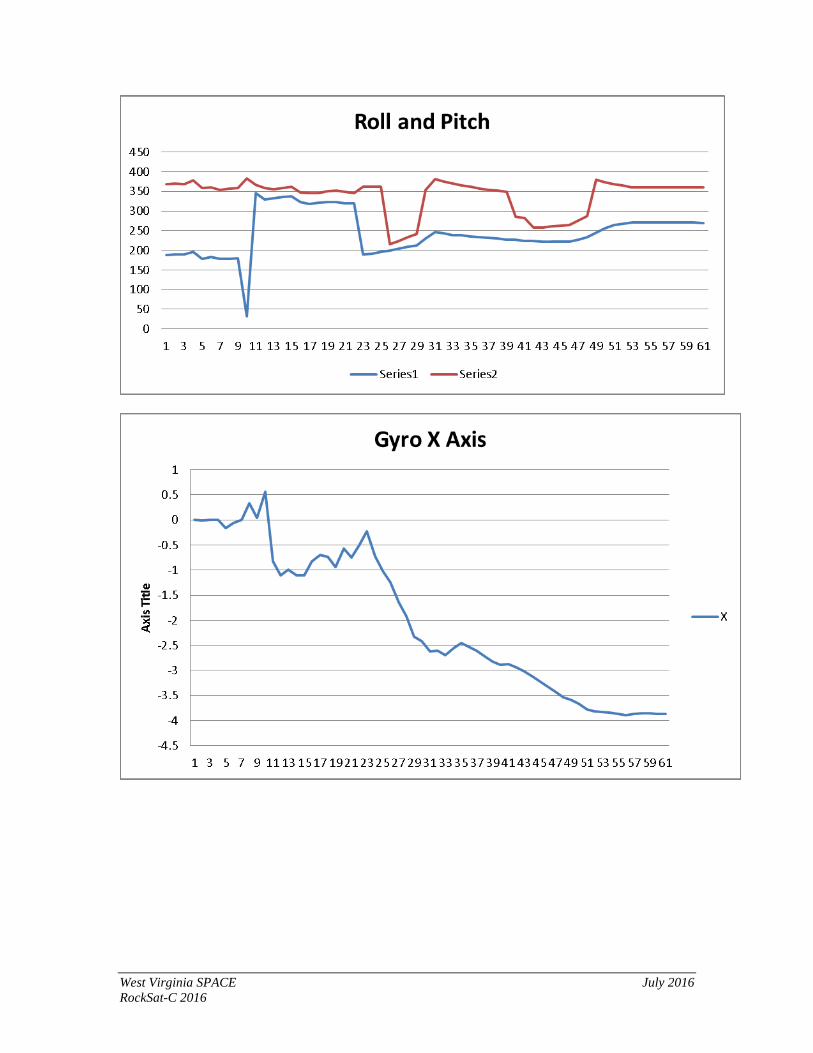
West Virginia SPACE July 2016 RockSat-C 2016
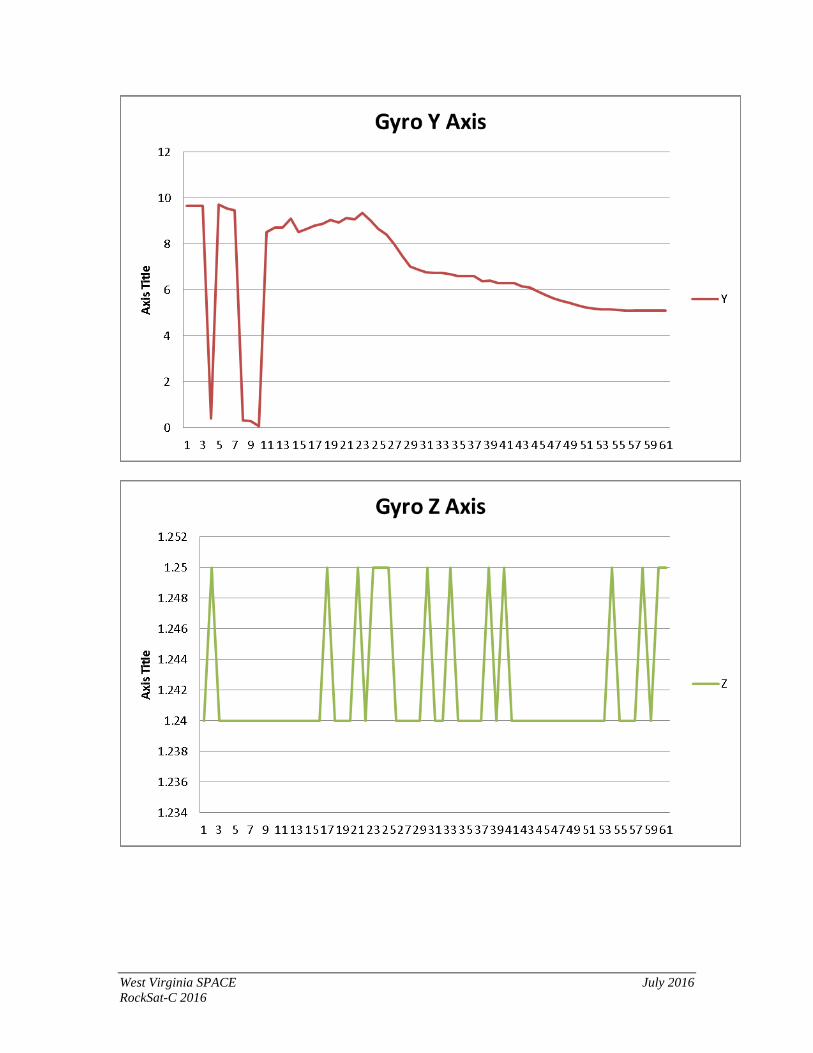
West Virginia SPACE July 2016 RockSat-C 2016
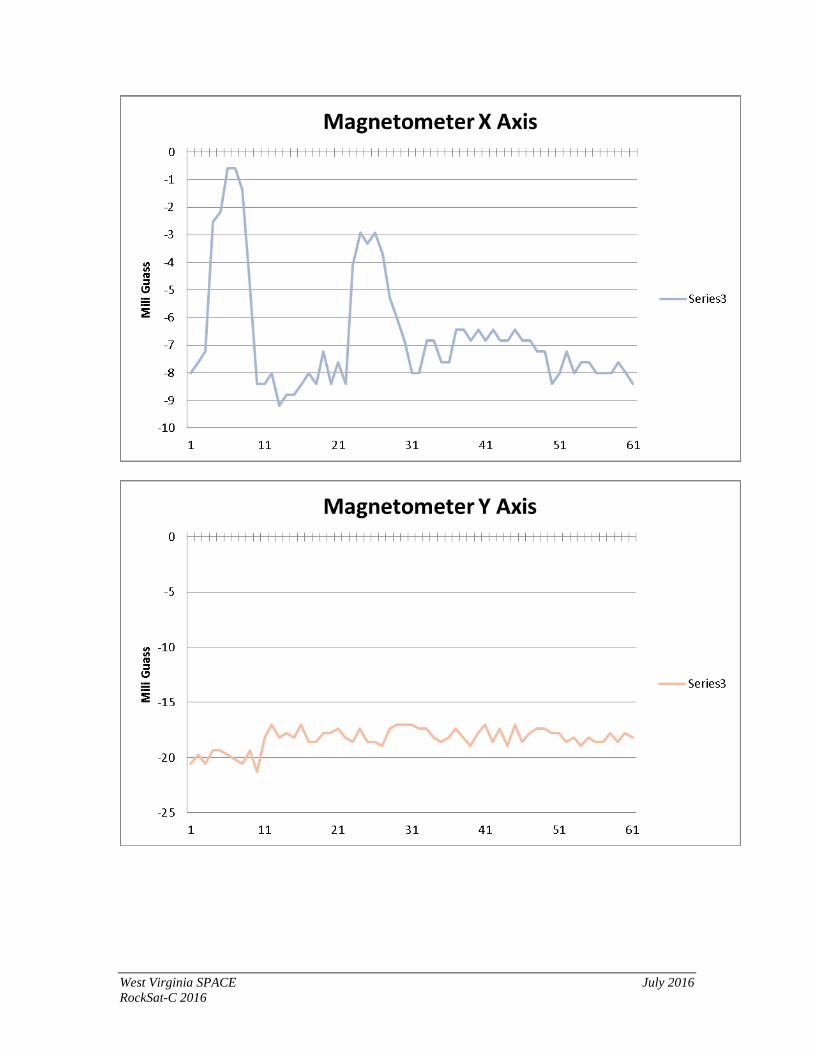
West Virginia SPACE July 2016 RockSat-C 2016
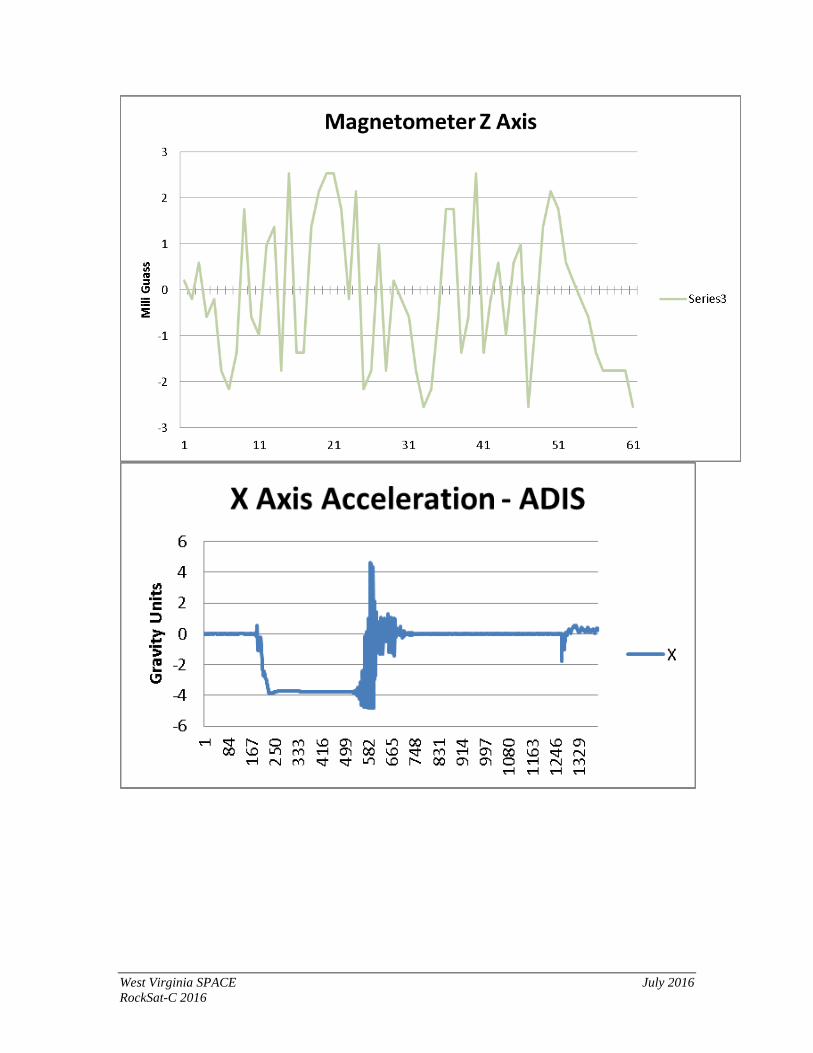
West Virginia SPACE July 2016 RockSat-C 2016
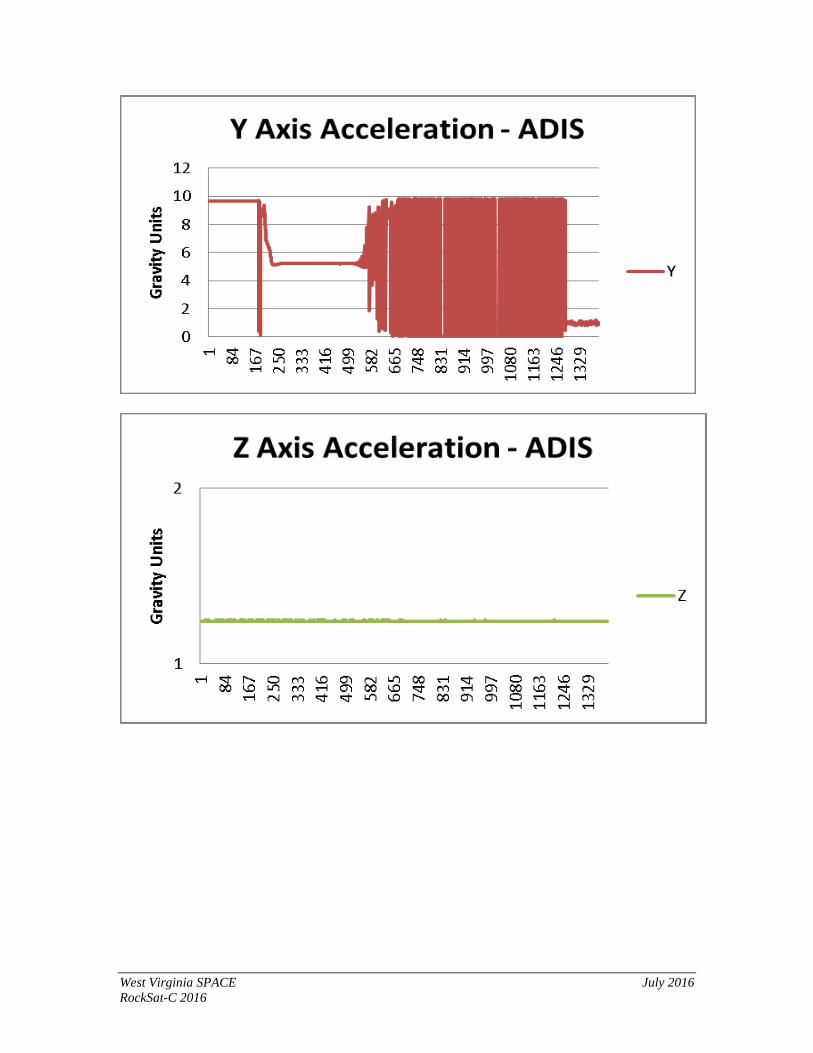
West Virginia SPACE July 2016 RockSat-C 2016
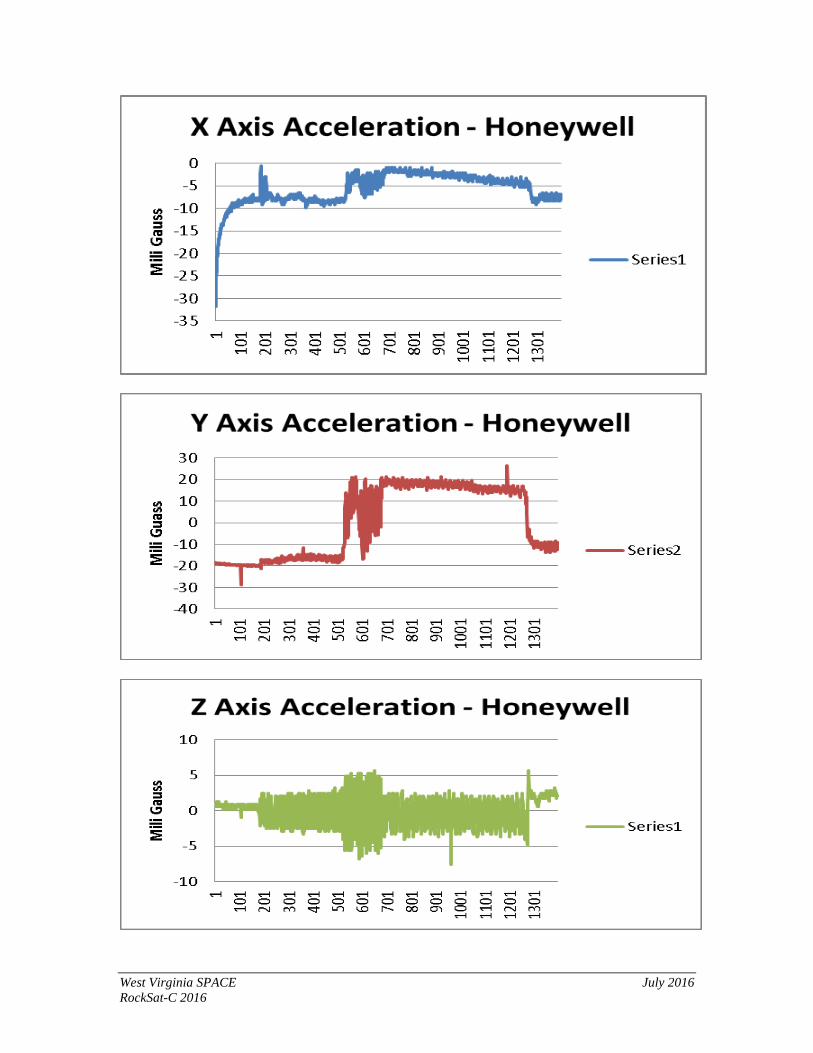
West Virginia SPACE July 2016 RockSat-C 2016
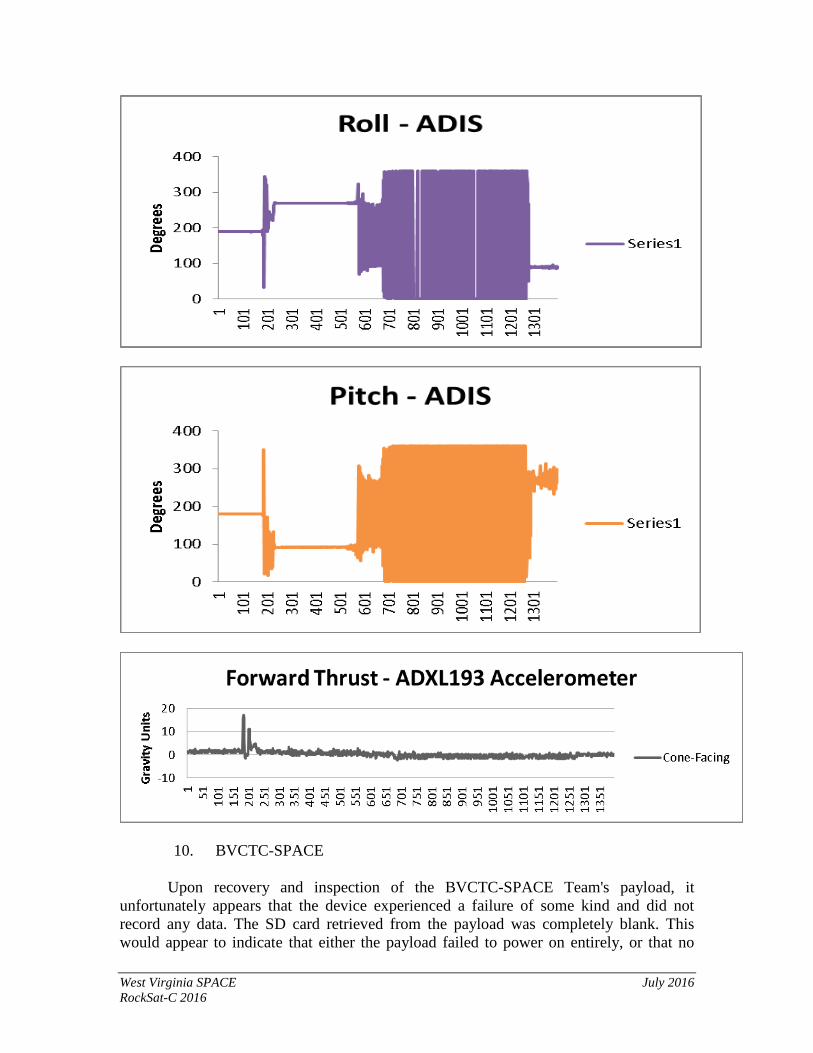
West Virginia SPACE July 2016 RockSat-C 2016
10. BVCTC-SPACE Upon recovery and inspection of the BVCTC-SPACE Team's payload, it unfortunately appears that the device experienced a failure of some kind and did not record any data. The SD card retrieved from the payload was completely blank. This would appear to indicate that either the payload failed to power on entirely, or that no
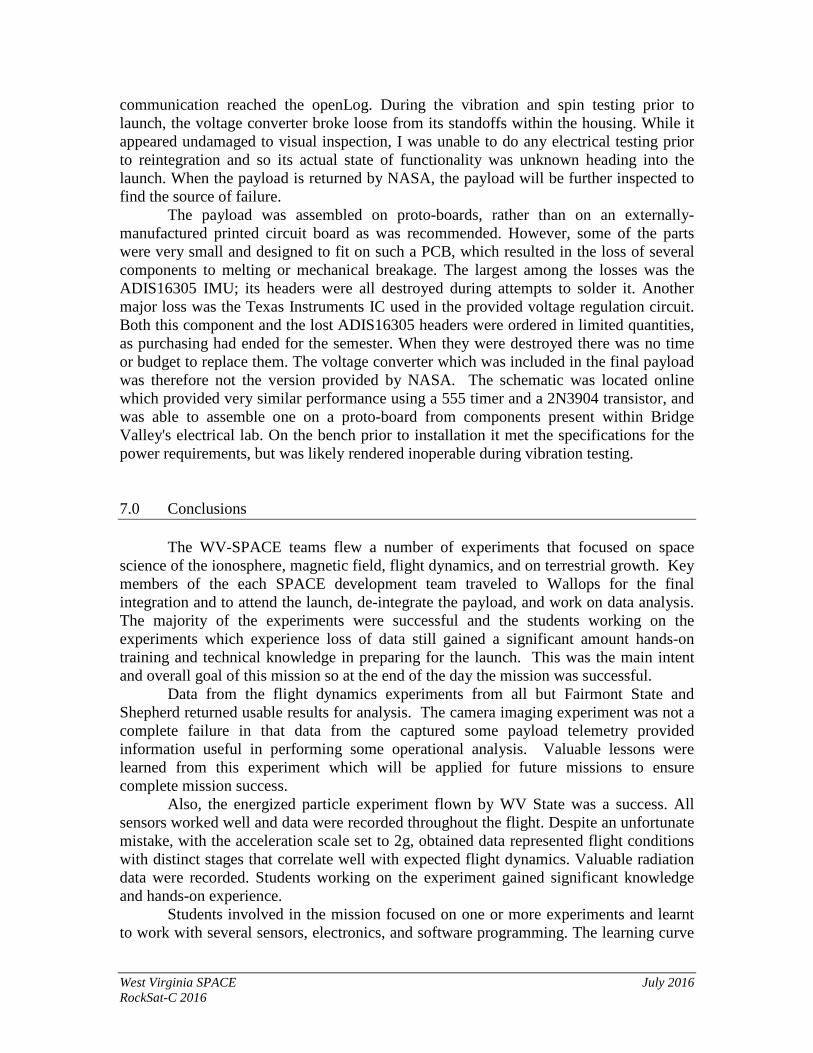
West Virginia SPACE July 2016 RockSat-C 2016
communication reached the openLog. During the vibration and spin testing prior to launch, the voltage converter broke loose from its standoffs within the housing. While it appeared undamaged to visual inspection, I was unable to do any electrical testing prior to reintegration and so its actual state of functionality was unknown heading into the launch. When the payload is returned by NASA, the payload will be further inspected to find the source of failure. The payload was assembled on proto-boards, rather than on an externally-manufactured printed circuit board as was recommended. However, some of the parts were very small and designed to fit on such a PCB, which resulted in the loss of several components to melting or mechanical breakage. The largest among the losses was the ADIS16305 IMU; its headers were all destroyed during attempts to solder it. Another major loss was the Texas Instruments IC used in the provided voltage regulation circuit. Both this component and the lost ADIS16305 headers were ordered in limited quantities, as purchasing had ended for the semester. When they were destroyed there was no time or budget to replace them. The voltage converter which was included in the final payload was therefore not the version provided by NASA. The schematic was located online which provided very similar performance using a 555 timer and a 2N3904 transistor, and was able to assemble one on a proto-board from components present within Bridge Valley's electrical lab. On the bench prior to installation it met the specifications for the power requirements, but was likely rendered inoperable during vibration testing. 7.0 Conclusions
The WV-SPACE teams flew a number of experiments that focused on space science of the ionosphere, magnetic field, flight dynamics, and on terrestrial growth. Key members of the each SPACE development team traveled to Wallops for the final integration and to attend the launch, de-integrate the payload, and work on data analysis. The majority of the experiments were successful and the students working on the experiments which experience loss of data still gained a significant amount hands-on training and technical knowledge in preparing for the launch. This was the main intent and overall goal of this mission so at the end of the day the mission was successful.
Data from the flight dynamics experiments from all but Fairmont State and Shepherd returned usable results for analysis. The camera imaging experiment was not a complete failure in that data from the captured some payload telemetry provided information useful in performing some operational analysis. Valuable lessons were learned from this experiment which will be applied for future missions to ensure complete mission success.
Also, the energized particle experiment flown by WV State was a success. All sensors worked well and data were recorded throughout the flight. Despite an unfortunate mistake, with the acceleration scale set to 2g, obtained data represented flight conditions with distinct stages that correlate well with expected flight dynamics. Valuable radiation data were recorded. Students working on the experiment gained significant knowledge and hands-on experience.
Students involved in the mission focused on one or more experiments and learnt to work with several sensors, electronics, and software programming. The learning curve
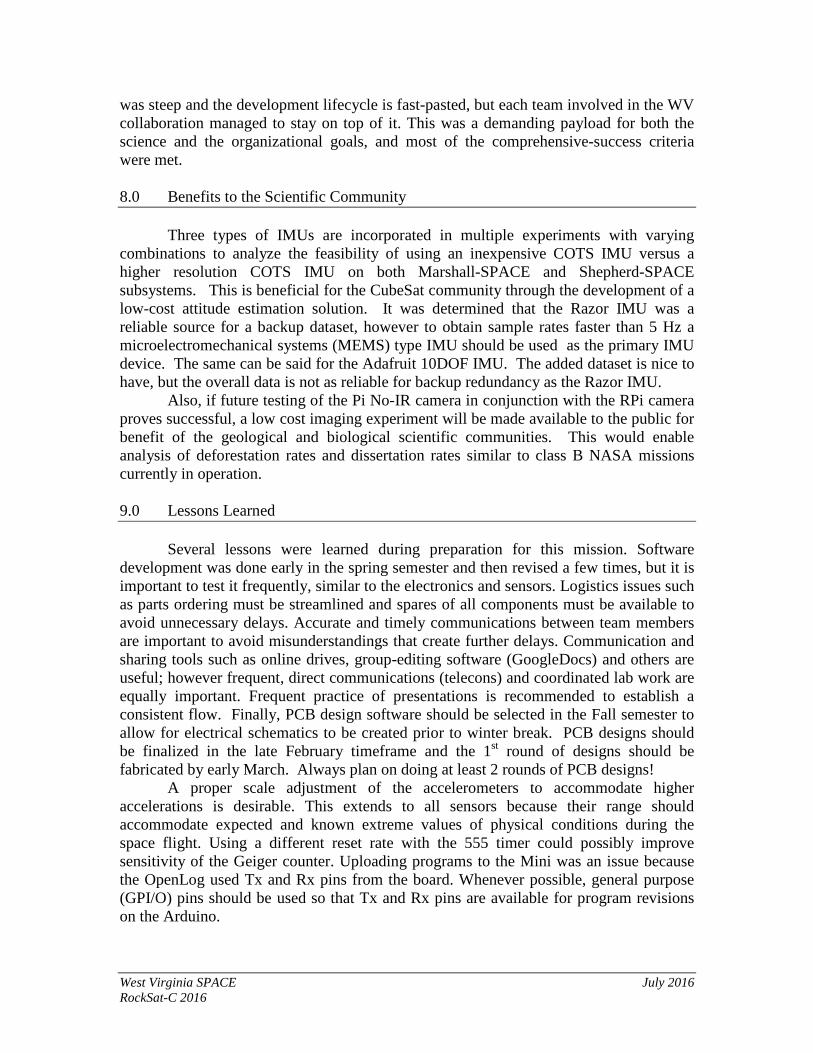
West Virginia SPACE July 2016 RockSat-C 2016
was steep and the development lifecycle is fast-pasted, but each team involved in the WV collaboration managed to stay on top of it. This was a demanding payload for both the science and the organizational goals, and most of the comprehensive-success criteria were met.
8.0 Benefits to the Scientific Community
Three types of IMUs are incorporated in multiple experiments with varying combinations to analyze the feasibility of using an inexpensive COTS IMU versus a higher resolution COTS IMU on both Marshall-SPACE and Shepherd-SPACE subsystems. This is beneficial for the CubeSat community through the development of a low-cost attitude estimation solution. It was determined that the Razor IMU was a reliable source for a backup dataset, however to obtain sample rates faster than 5 Hz a microelectromechanical systems (MEMS) type IMU should be used as the primary IMU device. The same can be said for the Adafruit 10DOF IMU. The added dataset is nice to have, but the overall data is not as reliable for backup redundancy as the Razor IMU.
Also, if future testing of the Pi No-IR camera in conjunction with the RPi camera proves successful, a low cost imaging experiment will be made available to the public for benefit of the geological and biological scientific communities. This would enable analysis of deforestation rates and dissertation rates similar to class B NASA missions currently in operation.
9.0 Lessons Learned
Several lessons were learned during preparation for this mission. Software development was done early in the spring semester and then revised a few times, but it is important to test it frequently, similar to the electronics and sensors. Logistics issues such as parts ordering must be streamlined and spares of all components must be available to avoid unnecessary delays. Accurate and timely communications between team members are important to avoid misunderstandings that create further delays. Communication and sharing tools such as online drives, group-editing software (GoogleDocs) and others are useful; however frequent, direct communications (telecons) and coordinated lab work are equally important. Frequent practice of presentations is recommended to establish a consistent flow. Finally, PCB design software should be selected in the Fall semester to allow for electrical schematics to be created prior to winter break. PCB designs should be finalized in the late February timeframe and the 1st round of designs should be fabricated by early March. Always plan on doing at least 2 rounds of PCB designs!
A proper scale adjustment of the accelerometers to accommodate higher accelerations is desirable. This extends to all sensors because their range should accommodate expected and known extreme values of physical conditions during the space flight. Using a different reset rate with the 555 timer could possibly improve sensitivity of the Geiger counter. Uploading programs to the Mini was an issue because the OpenLog used Tx and Rx pins from the board. Whenever possible, general purpose (GPI/O) pins should be used so that Tx and Rx pins are available for program revisions on the Arduino.
West Virginia SPACE July 2016 RockSat-C 2016
In addition to these lessons learned throughout the preparation for launch, some other key lessons were learned after integration and launch. Including fasteners (e.g. nuts/bolts, and standoffs) in the mechanical model to avoid clearance issues during canister integration. Although fasteners were considered in the overall payload canister design and SIS, they were not physically included as parts which still created issues during integration. These issues were workable, but could have been worse and definitely could have been avoided if fastener lengths and sizes were included in the model. Also, the subsystem design requirements did not clearly specify where to place the power connector or microSD cards on the physical board layout. This made it difficult in some cases to connect the power plug or remove microSD cards for data checking. This lesson learned emphasizes the importance of establishing complete and detailed design requirements and levying them on the design team.
Another lesson learned from integration was from the 3D printed enclosures. It was determined that these were unnecessary and only further complicated the integration process. The concept of using the box was clear, but there really should not be any loose components expected in the canister unless a catastrophic failure occurs and this should not be designed for given our class of mission. Furthermore, custom PCBs should really be used instead of proto-board solutions on a rocket launch.
After preliminary data reduction analysis, it was found that the early activation not only provided adequate time for the computers to boot up and start executing the flight software, but it also allowed for a steady-state to be reached for all other experiments prior to the launch making data analysis and fault assessment less complicated. Finally, it was learned that all microSD cards should be either non-permanently glued or taped in place before flight. Staking USB connections into the socket was proven to reliably prevent loss of connection during high vibrations. It is recommended that all removable connections are permanently fixed (solder or epoxy) to the PCB prior to launch unless the need to have a removable connection is justified.
10.0 Potential Follow-on Work
Now that each of the participating schools of the RockSat-C 2016 launch has the experience of putting together a basic payload for suborbital flight, there is a high probability that each team will either design new payload for 2017, or modify their existing payload and fly again in 2017. Since the imaging experiment did not meet the comprehensive success criteria for this mission, this will be flown on a high altitude balloon flight this fall. Hopefully this flight will allow the collection of Earth-viewing images necessary to perform the NDVI analysis along the flight path of the balloon. Furthermore, a more detailed comparison is ongoing between the data collected from the Sparkfun Razor IMU, Adafruit IMU, and the Analog Devices IMU to provide a better assessment of the feasibility of using a cheaper IMU in a low-cost attitude estimation system for CubeSats.
Also, there will be 2 new participants in the WV Collaboration in 2017, Glenville State College and Bluefield State College. In order to bring these new students up to speed on the payload design and software development, early communication and teamwork will be crucial. It is also conceivable that due to the size of the WV-SPACE
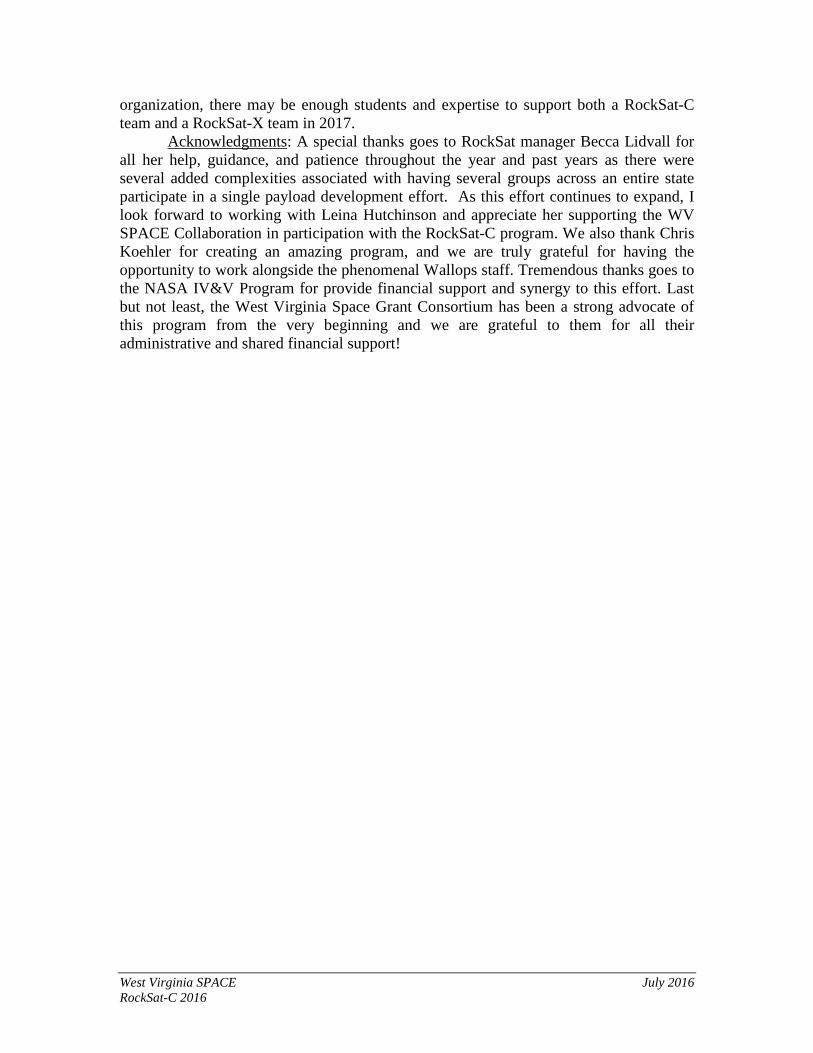
West Virginia SPACE July 2016 RockSat-C 2016
organization, there may be enough students and expertise to support both a RockSat-C team and a RockSat-X team in 2017.
Acknowledgments: A special thanks goes to RockSat manager Becca Lidvall for all her help, guidance, and patience throughout the year and past years as there were several added complexities associated with having several groups across an entire state participate in a single payload development effort. As this effort continues to expand, I look forward to working with Leina Hutchinson and appreciate her supporting the WV SPACE Collaboration in participation with the RockSat-C program. We also thank Chris Koehler for creating an amazing program, and we are truly grateful for having the opportunity to work alongside the phenomenal Wallops staff. Tremendous thanks goes to the NASA IV&V Program for provide financial support and synergy to this effort. Last but not least, the West Virginia Space Grant Consortium has been a strong advocate of this program from the very beginning and we are grateful to them for all their administrative and shared financial support!
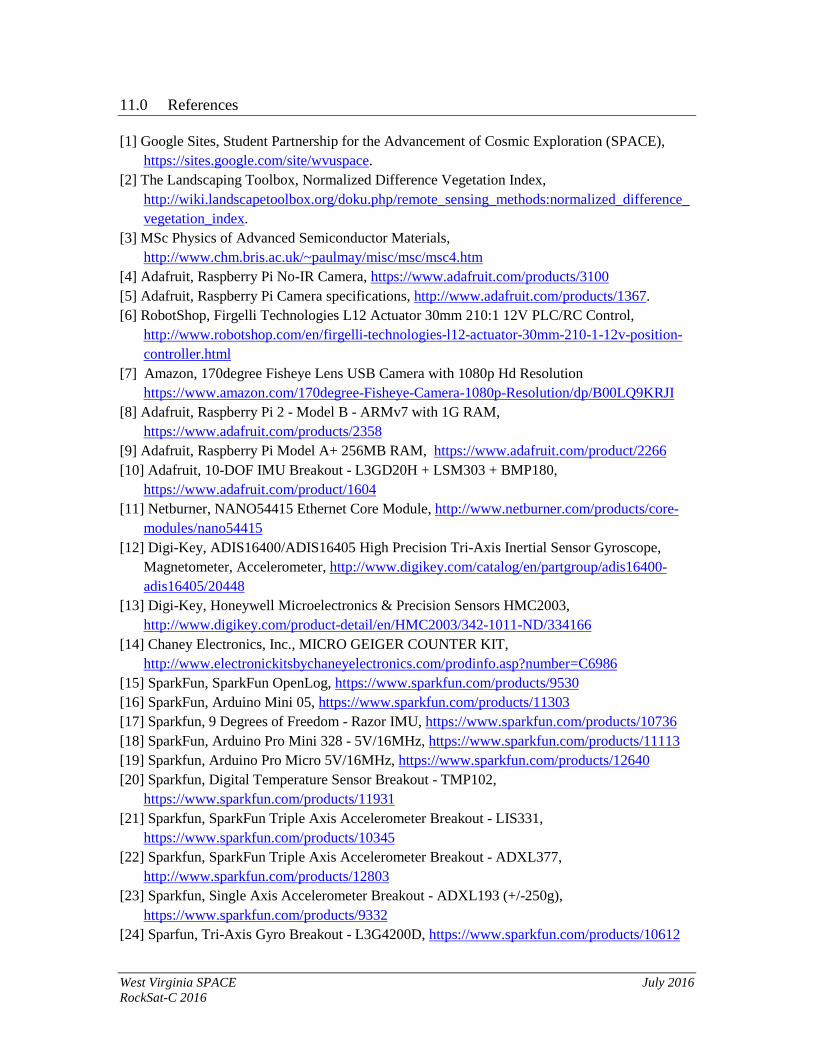
West Virginia SPACE July 2016 RockSat-C 2016
11.0 References [1] Google Sites, Student Partnership for the Advancement of Cosmic Exploration (SPACE),
https://sites.google.com/site/wvuspace. [2] The Landscaping Toolbox, Normalized Difference Vegetation Index,
http://wiki.landscapetoolbox.org/doku.php/remote_sensing_methods:normalized_difference_vegetation_index.
[3] MSc Physics of Advanced Semiconductor Materials, http://www.chm.bris.ac.uk/~paulmay/misc/msc/msc4.htm
[4] Adafruit, Raspberry Pi No-IR Camera, https://www.adafruit.com/products/3100 [5] Adafruit, Raspberry Pi Camera specifications, http://www.adafruit.com/products/1367. [6] RobotShop, Firgelli Technologies L12 Actuator 30mm 210:1 12V PLC/RC Control,
http://www.robotshop.com/en/firgelli-technologies-l12-actuator-30mm-210-1-12v-position-controller.html
[7] Amazon, 170degree Fisheye Lens USB Camera with 1080p Hd Resolution https://www.amazon.com/170degree-Fisheye-Camera-1080p-Resolution/dp/B00LQ9KRJI
[8] Adafruit, Raspberry Pi 2 - Model B - ARMv7 with 1G RAM, https://www.adafruit.com/products/2358
[9] Adafruit, Raspberry Pi Model A+ 256MB RAM, https://www.adafruit.com/product/2266 [10] Adafruit, 10-DOF IMU Breakout - L3GD20H + LSM303 + BMP180,
https://www.adafruit.com/product/1604 [11] Netburner, NANO54415 Ethernet Core Module, http://www.netburner.com/products/core-
modules/nano54415 [12] Digi-Key, ADIS16400/ADIS16405 High Precision Tri-Axis Inertial Sensor Gyroscope,
Magnetometer, Accelerometer, http://www.digikey.com/catalog/en/partgroup/adis16400-adis16405/20448
[13] Digi-Key, Honeywell Microelectronics & Precision Sensors HMC2003, http://www.digikey.com/product-detail/en/HMC2003/342-1011-ND/334166
[14] Chaney Electronics, Inc., MICRO GEIGER COUNTER KIT, http://www.electronickitsbychaneyelectronics.com/prodinfo.asp?number=C6986
[15] SparkFun, SparkFun OpenLog, https://www.sparkfun.com/products/9530 [16] SparkFun, Arduino Mini 05, https://www.sparkfun.com/products/11303 [17] Sparkfun, 9 Degrees of Freedom - Razor IMU, https://www.sparkfun.com/products/10736 [18] SparkFun, Arduino Pro Mini 328 - 5V/16MHz, https://www.sparkfun.com/products/11113 [19] Sparkfun, Arduino Pro Micro 5V/16MHz, https://www.sparkfun.com/products/12640 [20] Sparkfun, Digital Temperature Sensor Breakout - TMP102,
https://www.sparkfun.com/products/11931 [21] Sparkfun, SparkFun Triple Axis Accelerometer Breakout - LIS331,
https://www.sparkfun.com/products/10345 [22] Sparkfun, SparkFun Triple Axis Accelerometer Breakout - ADXL377,
http://www.sparkfun.com/products/12803 [23] Sparkfun, Single Axis Accelerometer Breakout - ADXL193 (+/-250g),
https://www.sparkfun.com/products/9332 [24] Sparfun, Tri-Axis Gyro Breakout - L3G4200D, https://www.sparkfun.com/products/10612

West Virginia SPACE July 2016 RockSat-C 2016
[25]Sparkfun, Triple Axis Magnetometer Breakout - MAG3110, https://www.sparkfun.com/products/12670
[26] Sparkfun, Pressure Sensor Breakout - MS5803-14BA, https://www.sparkfun.com/products/12909
[27] DigiKey, Analog Devices Inc ADIS16300AMLZ, http://www.digikey.com/product-search/en?keywords=adis16300
[28] NASA, Sounding Rocket Program Handbook, Goddard Space Flight Center, Wallops Flight Facility, June 2005.
[29] Plane, J.M.C., A reference atmosphere for the atomic sodium layer, 2009. [30] Wikipedia, Ionosphere, http://en.wikipedia.org/wiki/Ionosphere, retrieved May 1, 2014. [31] NOAA Nation Centers for Environmental Information, The World Magnetic Model,
https://www.ngdc.noaa.gov/geomag/WMM/DoDWMM.shtml
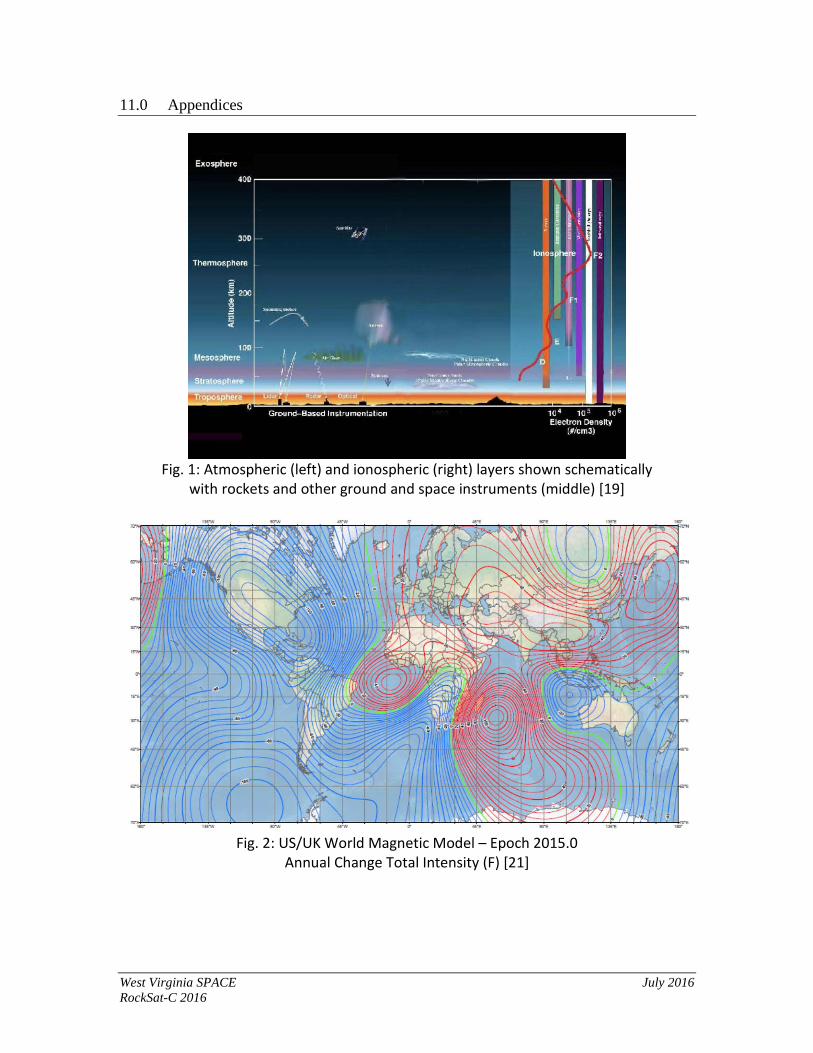
West Virginia SPACE July 2016 RockSat-C 2016
11.0 Appendices
Cig. 1: Atmospheric (left) and ionospheric (right) layers shown schematically
with rockets and other ground and space instruments (middle) [19]
Cig. 2: US/UK World Magnetic Model – Epoch 2015.0
Annual Change Total Intensity (C) [21]
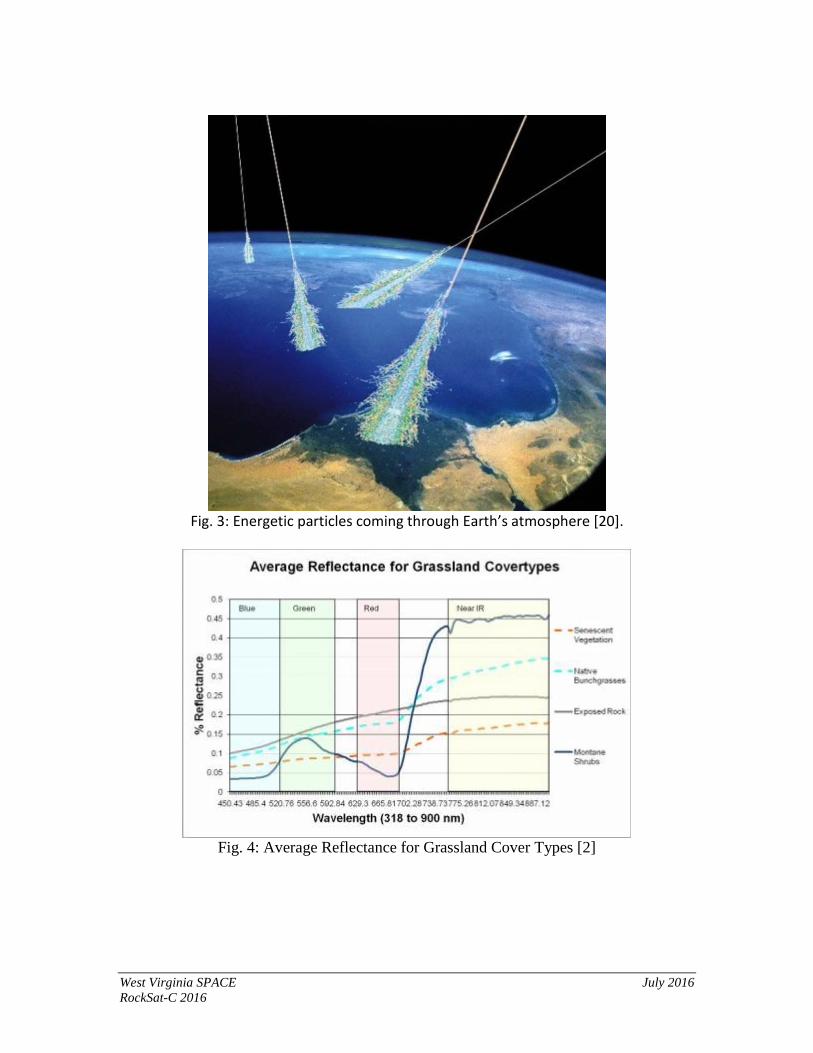
West Virginia SPACE July 2016 RockSat-C 2016
Cig. 3: Energetic particles coming through Earth’s atmosphere [20].
Fig. 4: Average Reflectance for Grassland Cover Types [2]
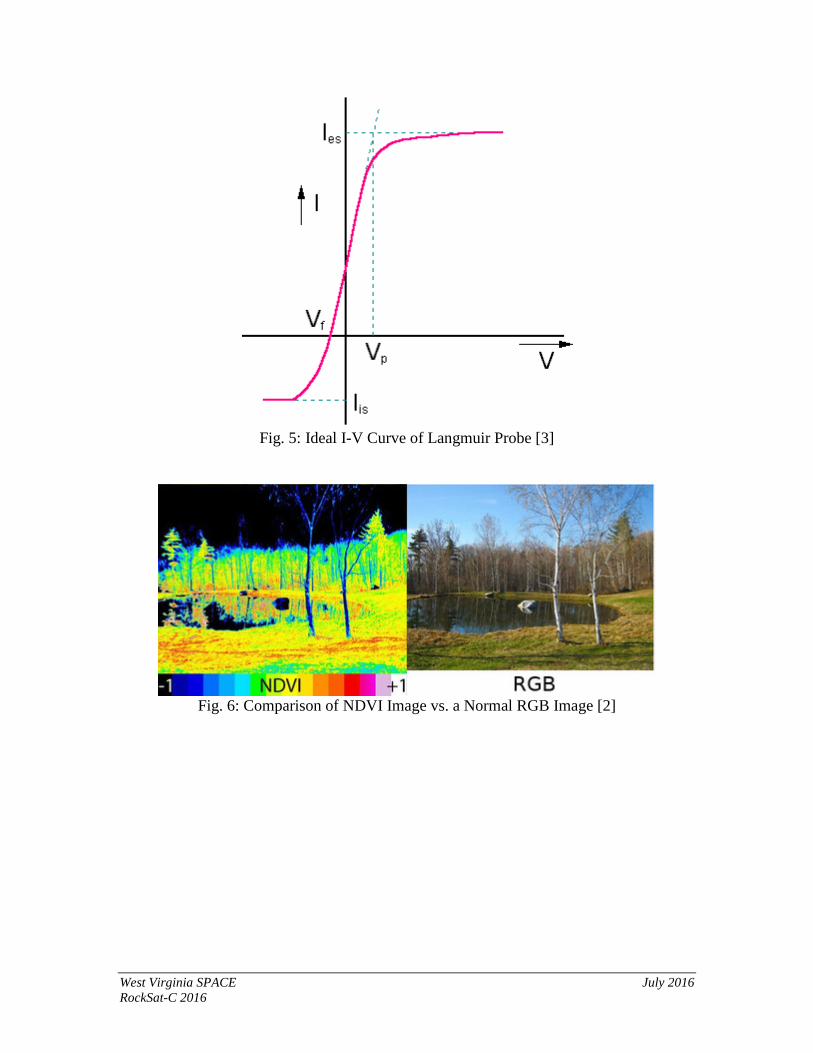
West Virginia SPACE July 2016 RockSat-C 2016
Fig. 5: Ideal I-V Curve of Langmuir Probe [3]
Fig. 6: Comparison of NDVI Image vs. a Normal RGB Image [2]
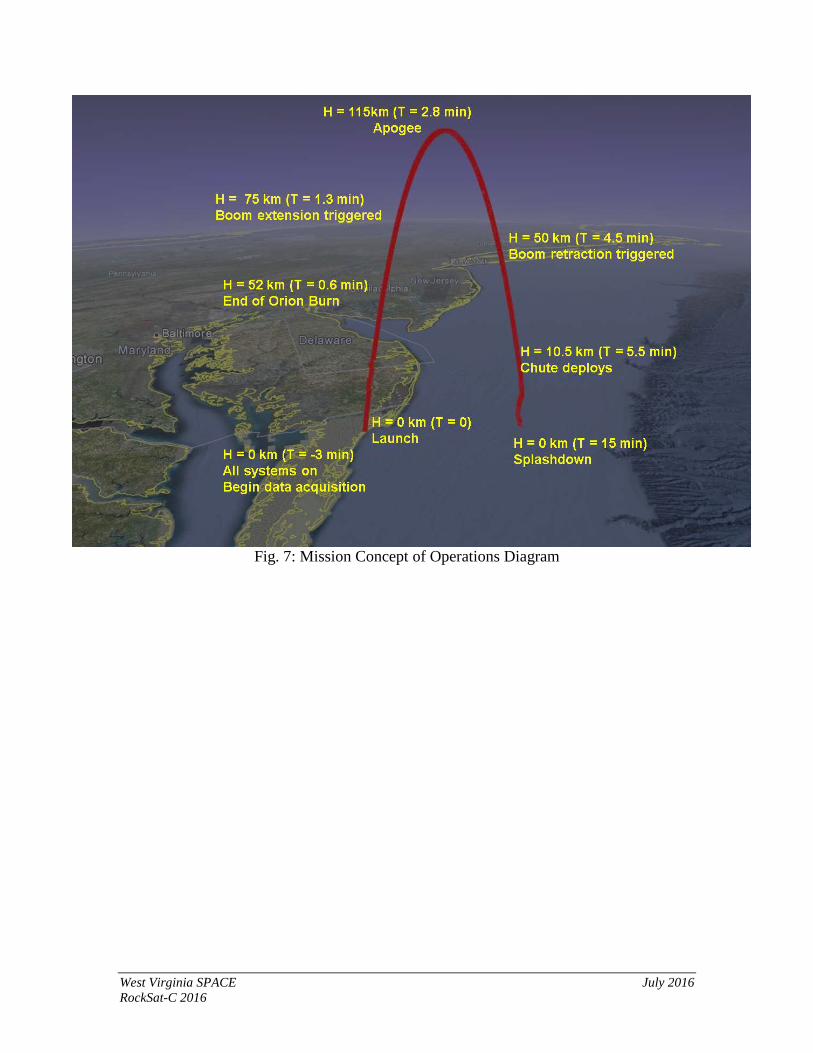
West Virginia SPACE July 2016 RockSat-C 2016
Fig. 7: Mission Concept of Operations Diagram
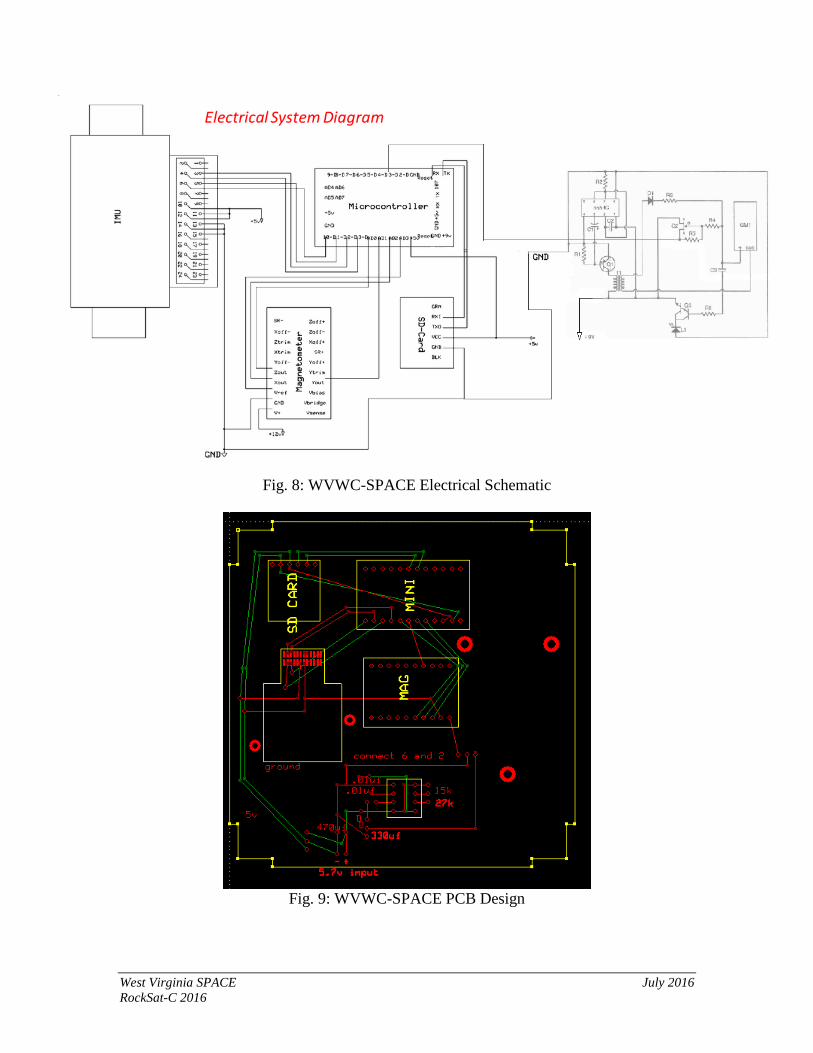
West Virginia SPACE July 2016 RockSat-C 2016
Fig. 8: WVWC-SPACE Electrical Schematic
Fig. 9: WVWC-SPACE PCB Design
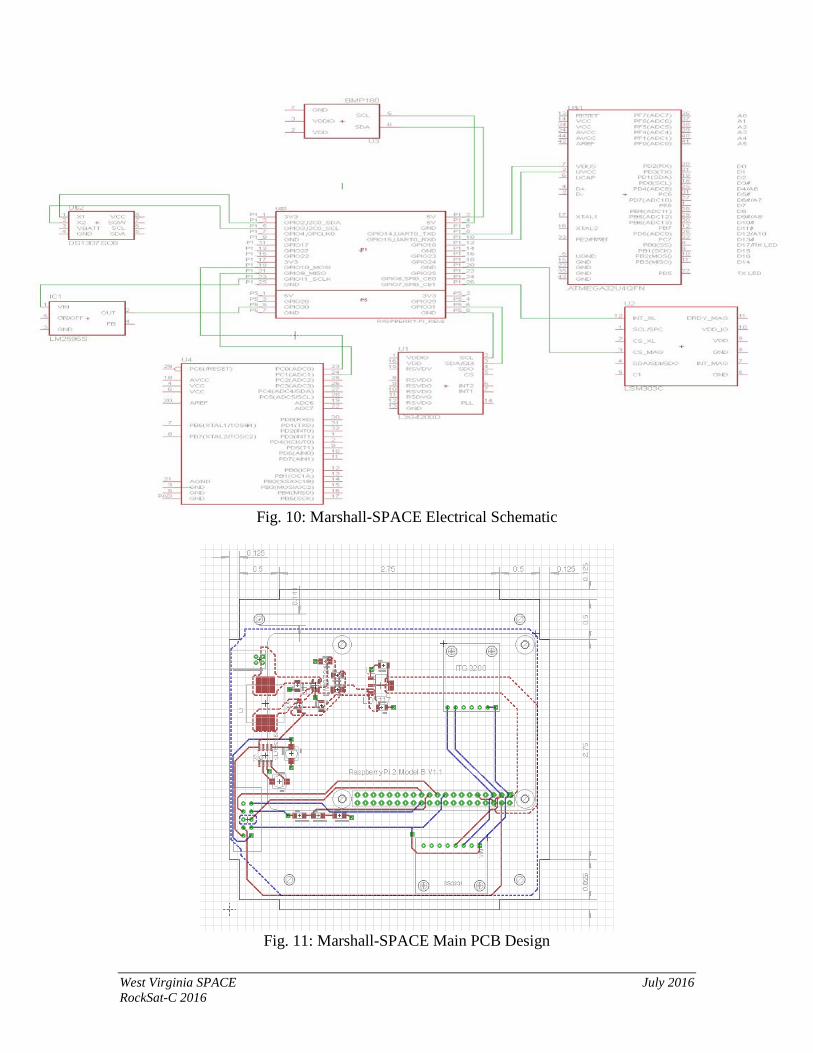
West Virginia SPACE July 2016 RockSat-C 2016
Fig. 10: Marshall-SPACE Electrical Schematic
Fig. 11: Marshall-SPACE Main PCB Design
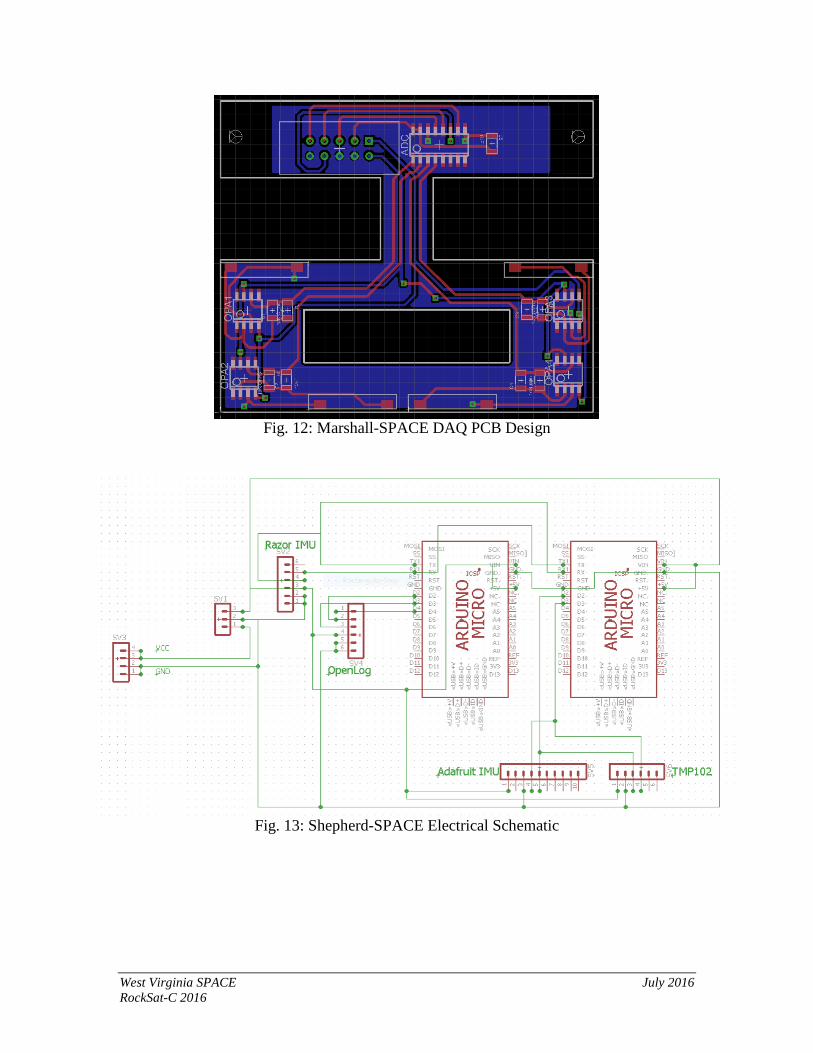
West Virginia SPACE July 2016 RockSat-C 2016
Fig. 12: Marshall-SPACE DAQ PCB Design
Fig. 13: Shepherd-SPACE Electrical Schematic
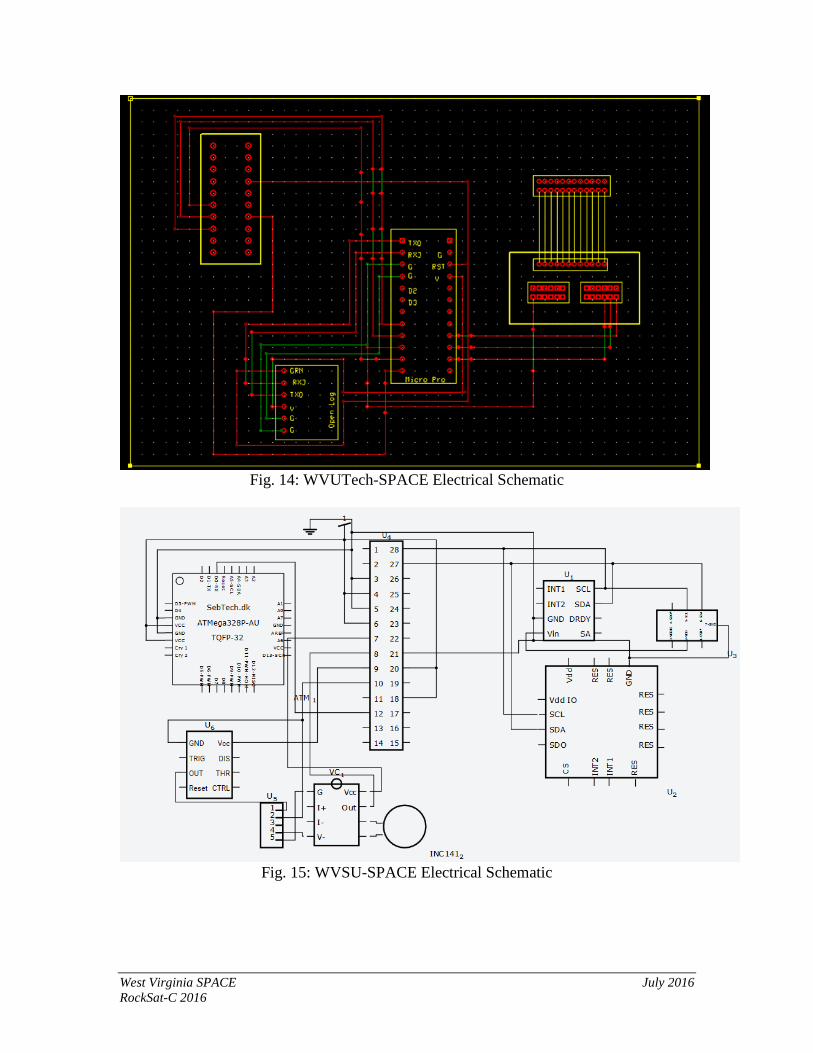
West Virginia SPACE July 2016 RockSat-C 2016
Fig. 14: WVUTech-SPACE Electrical Schematic
Fig. 15: WVSU-SPACE Electrical Schematic
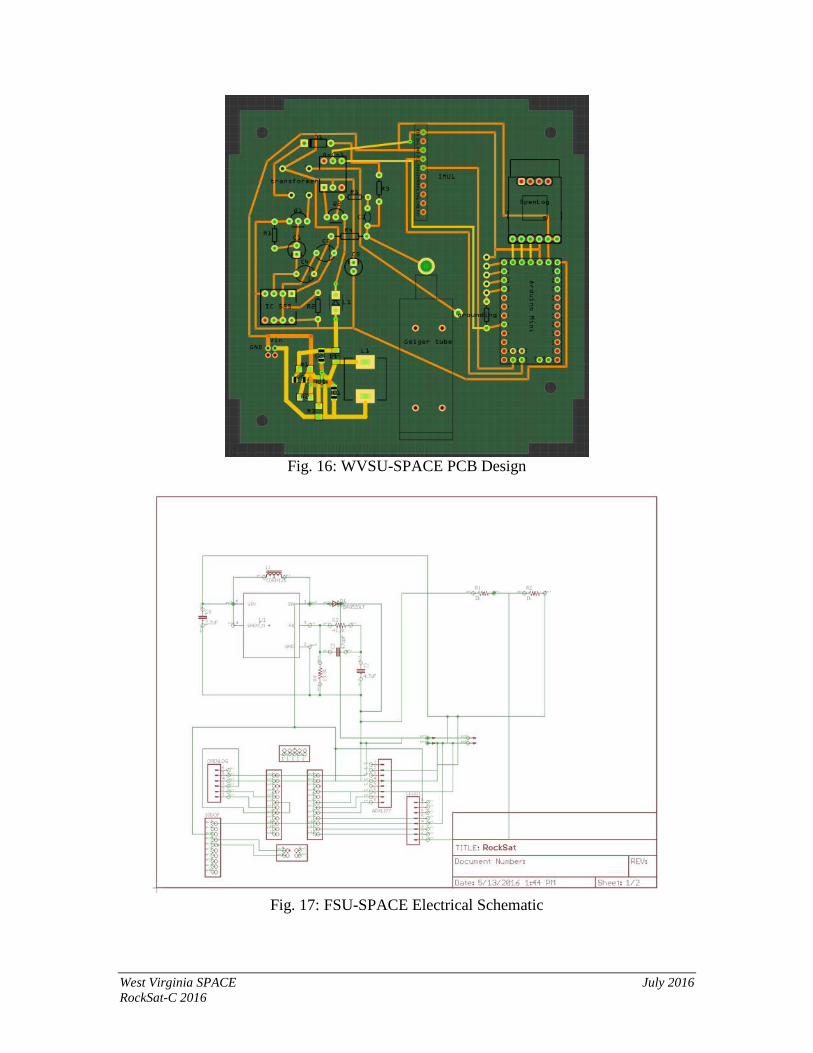
West Virginia SPACE July 2016 RockSat-C 2016
Fig. 16: WVSU-SPACE PCB Design
Fig. 17: FSU-SPACE Electrical Schematic
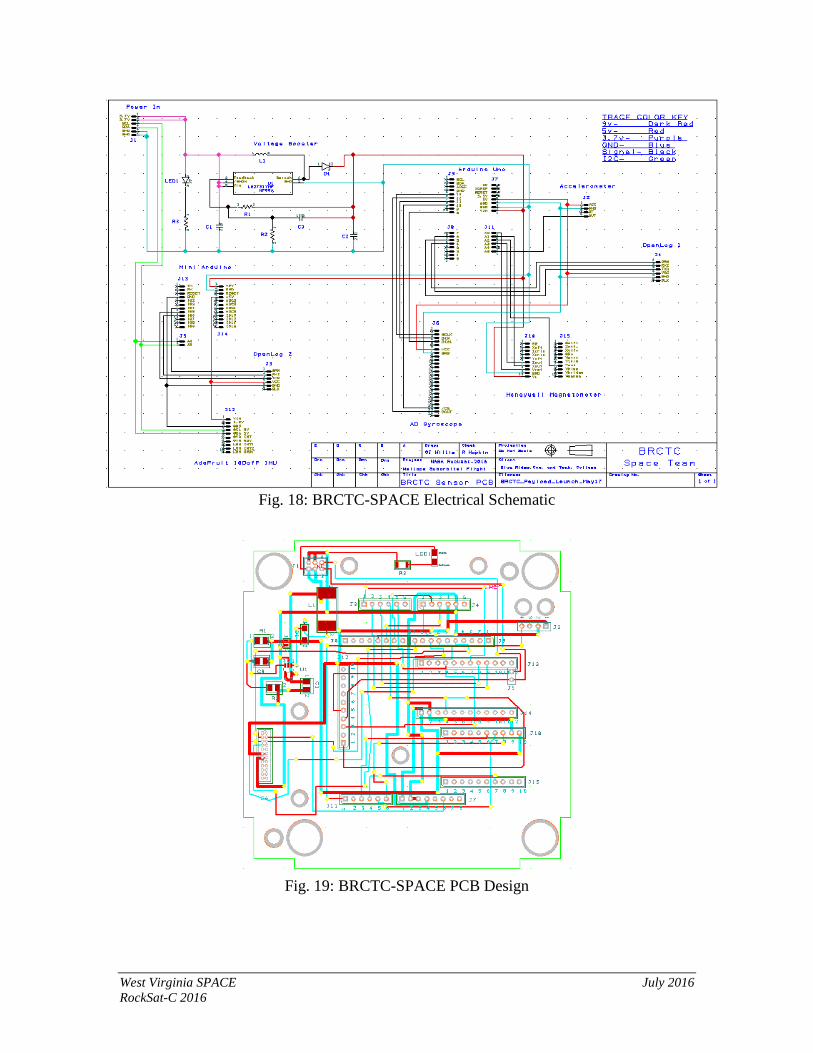
West Virginia SPACE July 2016 RockSat-C 2016
Fig. 18: BRCTC-SPACE Electrical Schematic
Fig. 19: BRCTC-SPACE PCB Design
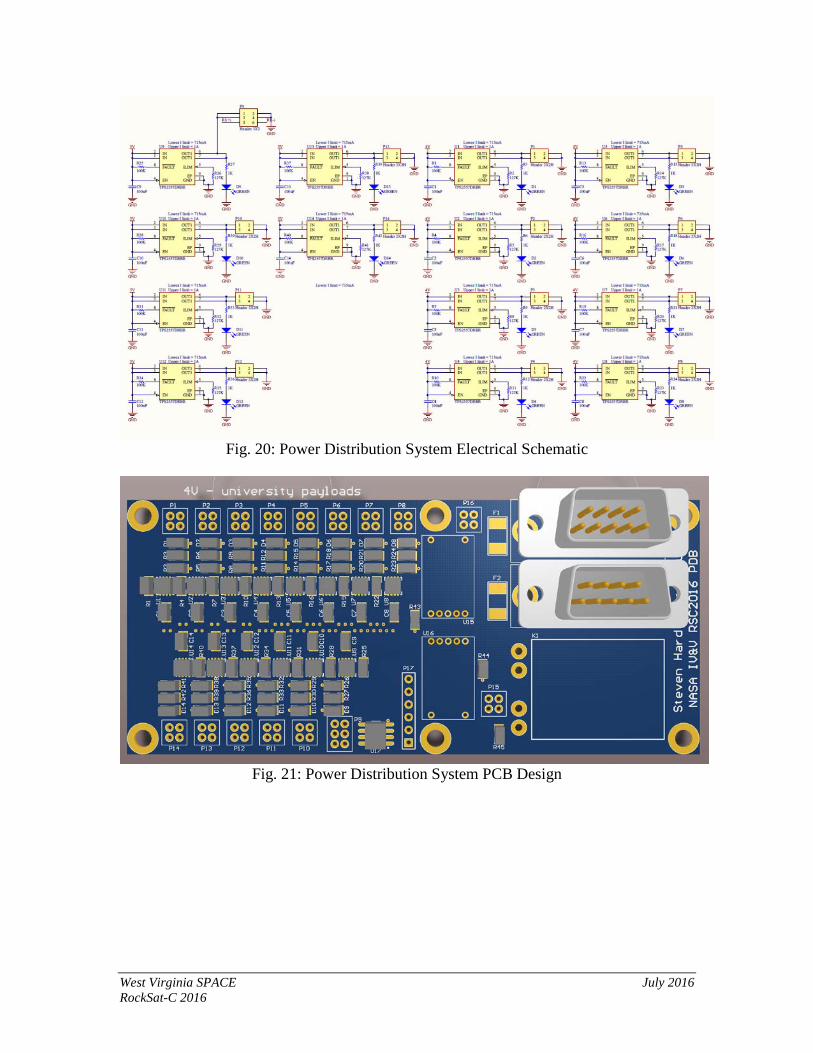
West Virginia SPACE July 2016 RockSat-C 2016
Fig. 20: Power Distribution System Electrical Schematic
Fig. 21: Power Distribution System PCB Design
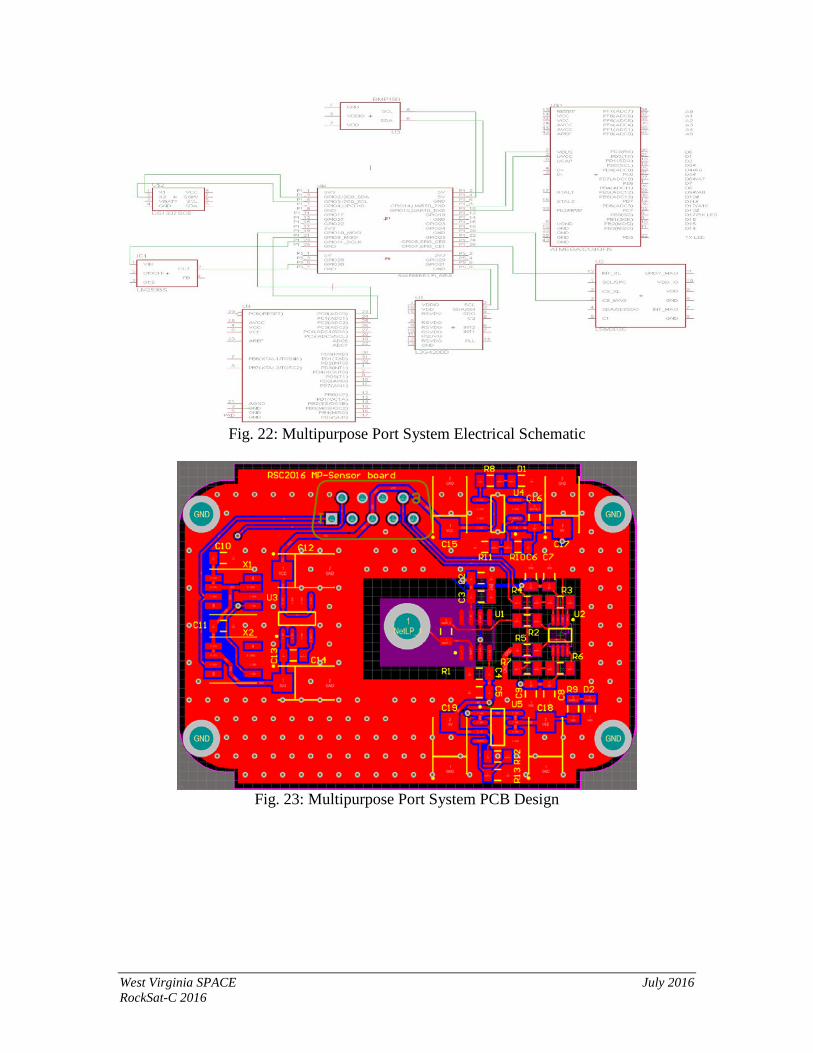
West Virginia SPACE July 2016 RockSat-C 2016
Fig. 22: Multipurpose Port System Electrical Schematic
Fig. 23: Multipurpose Port System PCB Design
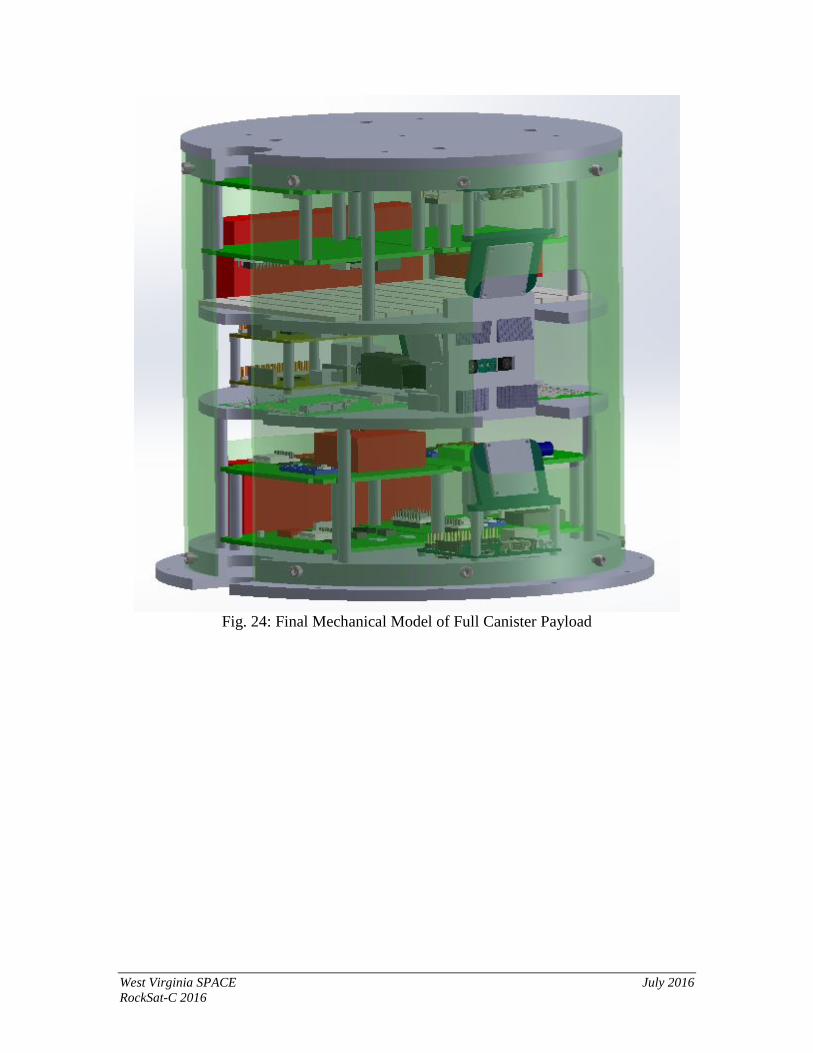
West Virginia SPACE July 2016 RockSat-C 2016
Fig. 24: Final Mechanical Model of Full Canister Payload
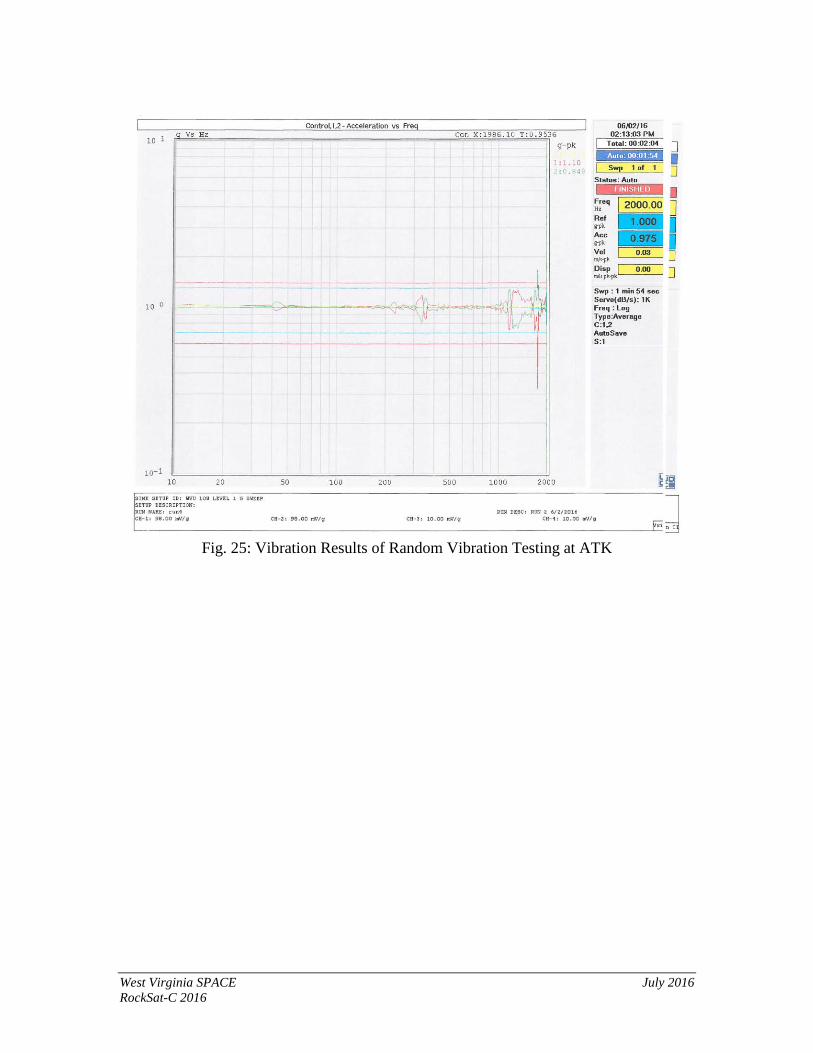
West Virginia SPACE July 2016 RockSat-C 2016
Fig. 25: Vibration Results of Random Vibration Testing at ATK
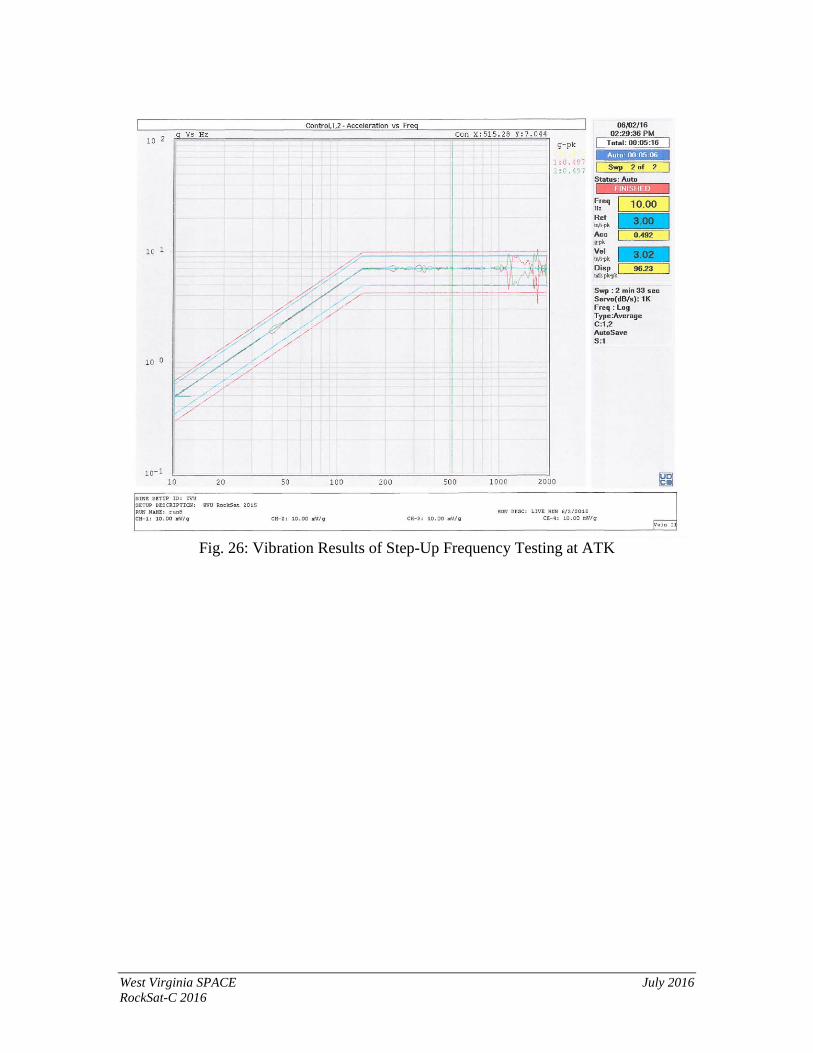
West Virginia SPACE July 2016 RockSat-C 2016
Fig. 26: Vibration Results of Step-Up Frequency Testing at ATK
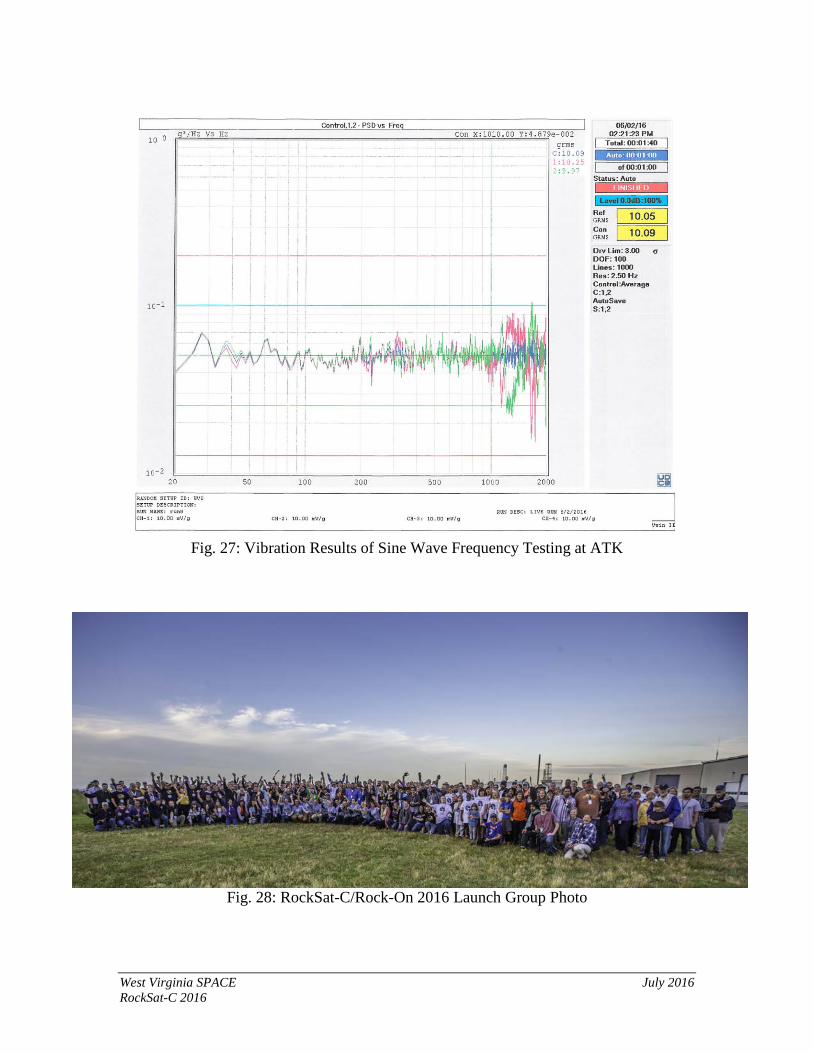
West Virginia SPACE July 2016 RockSat-C 2016
Fig. 27: Vibration Results of Sine Wave Frequency Testing at ATK
Fig. 28: RockSat-C/Rock-On 2016 Launch Group Photo