Embed Size (px)
Citation preview

THE INCLUSION OF HOMEMAKERS AND HOUSEHOLD LABOR IN THE
ECUADORIAN SOCIAL SECURITY SYSTEM
Rodrigo Ibarra - Jarrín Certified actuary of the
‘Institut des Actuaires’ France March, 2015
Av. Orellana E9-195 y Av. 6 de Diciembre
Edif. Alisal de Orellana, Of. 804
Quito- Ecuador
2
ABSTRACT
This paper intends to examine the feasibility of the inclusion of homemakers and household labor in the Ecuadorian social security system and analyze the sustainability of said project in the short and long terms. The topic focuses on the importance of securing financial support for the benefits of 1.5 million women in Ecuador, one of the most vulnerable groups in society. They are currently unable to receive retirement pensions, disability, welfare or death benefits. In order to conduct the appropriate analysis, we utilize relevant quantitative data of existing actuarial projections of the Ecuadorian Social Security system. We evaluate the current and projected population data, including life expectancy, birth rate, number of retirees, number of women in the work force and immigration data. The results we have been able to gather indicate that the proposed contributions to justify the addition of homemakers to the system will be insufficient and the present actuarial deficit in the Pension Fund will increase.
KEYWORDS
Ecuadorian Institute of Social Security (IESS), Social Security benefits
for homemakers, Household labor benefits, Contributions,
Universalization of social security, Pension benefits
BRIEF PRESENTATION OF THE AUTHOR
Rodrigo Ibarra-Jarrín is a Professor at the Universidad San Francisco de Quito in Ecuador and the President & CEO of Actuaria Consultores Ltd.
His work is centered on the design, evaluation and implementation of pension plans for health and employee benefits, as well as actuarial modelling for insurance companies, and has 28 years of experience in the Ecuadorian actuarial market.
Rodrigo has a Bachelors diploma with honors in Pure Mathematics from the Politécnica, Quito, Ecuador, a DEA in Actuarial Statistics from the Institute of Statistics (ISUP), University Pierre and Marie Curie, France, and a MBA from the Universidad San Francisco de Quito. He is a member of the committee of the PBSS and the Latin America subcommittee of the IAA.
Contact
Av. Orellana E9-195 y Av. 6 de Diciembre Ed. Alisal de Orellana
Quito, Ecuador - 170107

3
TABLE OF CONTENTS
1. INTRODUCTION 4 2. ECUADOR´S OVERVIEW 4
2.1. ECUADOR’S ECONOMIC AND DEMOGRAPHIC OVERVIEW ...................................... 4 2.2. POLITICAL CIRCUMSTANCES ............................................................................... 5
3. THE ECUADORIAN SOCIAL SECURITY SYSTEM 5 3.1 BRIEF HISTORY OF THE ECUADORIAN SOCIAL SECURITY SYSTEM........................ 6 3.2 CHARACTERISTICS OF THE ECUADORIAN SOCIAL SECURITY SYSTEM .................. 6
4. REFORM TO THE LAW OF SOCIAL SECURITY 9 4.1 REFORM BACKGROUND .................................................................................... 10 4.2 GENERAL CLAUSES .......................................................................................... 10 4.3 BENEFITS ......................................................................................................... 10 4.4 CONTRIBUTION RATES ..................................................................................... 11 4.5 REQUIREMENTS ............................................................................................... 12 4.6 PROCESS OF INCORPORATION ......................................................................... 12 4.7 SUBSIDY FUNDING ........................................................................................... 12
5. ACTUARIAL ANALISIS AND PROJECTIONS 12 6. CONCLUSIONS AND RECOMMENDATIONS 16 7. REFERENCES 18 8. APPENDICES 19
8.1. APPENDIX 1 ..................................................................................................... 19 8.2. APPENDIX 2 ..................................................................................................... 22 8.3. APPENDIX 3 ..................................................................................................... 25

4
1. INTRODUCTION
At present, the Ecuadorian Congress is discussing reforms to include homemakers in the national social security system. This paper examines the sustainability of said project in the short and long terms. Since its foundation, one of the main goals of the Ecuadorian Institute of Social Security (IESS) has been to expand its coverage and to increase and improve its benefits. In this sense, the attempt of remunerating unpaid household work, in order to increase the inclusion of marginalized groups in the social security system, appeals to the Institute´s long-term goal of universalizing the nation´s social security services. But, the addition of homemakers to the social security is not a one-sided issue; therefore, this paper will assess the risks of implementing this reform, as well as the benefits that it could provide to thousands of homemakers who at the moment have no financial support from any governmental institution. In Ecuador, around 10% of the country´s population is made up of homemakers. Even though they represent an important portion of the population, they don´t receive any kind of monetary compensation, and their labor is often ignored by economic and financial policies. This reality is the main reason for the government´s initiative to recognize household labor, and allow it to be part of the nation´s social security system. We will analyze the current financial statements of the IESS, the sources of financing and funding, and costs vs. benefits of the reform to determine its feasibility. Assessing the financial future of the IESS with the inclusion of homemakers requires extensive actuarial valuations. In order to consider the long-term consequences, we conduct projections under three different scenarios.
After analyzing the proposed changes, we present a series of conclusions regarding the sustainability of the project, and the future stability of the IESS. We then provide recommendations for its financial and structural feasibility.
2. ECUADOR´S OVERVIEW
2.1. ECUADOR’S ECONOMIC AND DEMOGRAPHIC OVERVIEW
Ecuador is a democratic country located on the northwest coast of South America. It is a relatively small country covering 283,000 square kilometers. It contains various geographic regions, as well as a collection of culturally rich and varied ethnic groups. Its population is approximately 16 million, with an average age of 28, and a population growth rate that shows a decelerating trend, from 2.99% growth in 1990, to 2.05% in 2001, and 1.95% in 2010. Moreover, the National Institute of Statistics and Census (INEC) projects a decrease in birth rates, shifting from 2.79% in 2010, to 2.12% in 2020 and falling to 1.2% in 2050.

5
Regarding the composition of the population, those within working age total 11.1 million, while the Economically Active Population (PEA) is only 7.1 million, (as of December, 2014). This equates to an inactive population (PEI) of 3.9 million individuals. As stated by its Central Bank, Ecuador´s GDP growth rate was 4.5% in 2013, reaching approximately $100 billion USD in that year. This significant growth rate places Ecuador as one of the most rapidly growing economies in South America. Its main export is crude oil, reaching $20.6 billion USD in 2013, followed by bananas at $5.5 billion USD. Other exports include shrimp, tuna, fish products, palm oil, gold and processed coffee. In terms of social indicators, Ecuador has witnessed improvements in many economic and social aspects since the start of Rafael Correa´s presidency. Inequality levels have dropped from a Gini Coefficient of 0.50 in 2006 to 0.44 in 2010. Regarding unemployment, there has been a decline from 7.1% in 2007, to 4.6% in 2012, and to 3.9% in 2014. Poverty levels have also decreased in the last 8 years. In 2008, the national poverty rate was 25.16%, which fell to 21.46% in 2011, and later reached 16.75% in 2014.
2.2. POLITICAL CIRCUMSTANCES
Rafael Correa took office in January 2007, as leader of the leftist National Alliance political party. Since then, he has transformed many aspects of the Ecuadorian social, economic and political spheres. His socialist ideals have triggered innovative reforms at the micro and macro levels, which have led to high public expenditure in education, infrastructure, health and social programs. Among the main social reforms witnessed in his presidency is the increase in education spending, in what he calls “The Education Revolution.” In the period from 2006 to 2013, the education budget increased from 2.5% to 6% of GDP. Another main aspect of Correa´s mandate is the increased budget for health services. The health budget went from $561 million USD in 2006 to $1.77 billion USD in 2012. Many social programs have been established under the current administration, such as the eradication of child malnutrition, housing, gender equality, microcredit and water provision programs. In terms of social security, Correa´s government has changed the administration of the IESS, its policies, benefits, financial methods and its coverage. The following section presents an overview of the IESS, as well as its current financial situation.
3. THE ECUADORIAN SOCIAL SECURITY SYSTEM
The IESS is a pillar of economic and social development in the country. Its mission is to “Administer the provisional resources of the insured in an efficient manner; to generate financial operations with adequate social and economic return and to guarantee new sources of employment.” The management of the IESS has always been a challenge and has witnessed various reforms thorough

6
the years. In order to understand the new reform plans, this section presents a brief history of the Ecuadorian social security system and its current status, as well as a projection of its actuarial future.
3.1 BRIEF HISTORY OF THE ECUADORIAN SOCIAL SECURITY SYSTEM
The Ecuadorian social security system began at the start of the 20th century, when the government implemented a system that exclusively sought to enhance the wellbeing of its citizens. In 1928, Executive Order No. 018 launched the first Pension Fund in the country. This Fund began as an independent insurance entity, separate from the government, in order to provide the private sector, public sector and military personnel with retirement pensions, funerary aid and widow’s pension benefits. In 1935, the Social Security Law was passed, which established the General Obligatory Social Security. Soon after, the government funded the Provision National Institute, in order to conduct the operations of the new established social security system. 2 years later, the Private Labor Insurance Fund and the Medical Department of the Social Security Fund began. In 1937, the government created the Insurance Fund of private employees. In that same year, there was a turn in the social security system, with the incorporation of Insurance for illnesses. From this moment on, it gradually expanded its coverage, and has added more benefits and assistance programs. These include Labor Risk Insurance, Secular Clergy Insurance, Rural Farmer Insurance, Artisan Insurance, and Professional Insurance. In September of 1963, the Pension Fund and the Insurance Fund merged to form the National Social Security Fund, and 7 years later, the Provision National Institute closed its doors. The Ecuadorian Institute of Social Security (IESS), which is still operating today, replaced the Provision National Institute in 1970, and has remained the administrator of the nation´s social security system until today.
3.2 CHARACTERISTICS OF THE ECUADORIAN SOCIAL SECURITY SYSTEM
The IESS offers a variety of assistance services to its affiliates, and it is divided into the following four Funds: General Pension Insurance Fund, Health Care Insurance Fund, General Insurance of Labor Risks Fund, and the Rural Social Insurance Fund. According to the Annual Labor Report, presented by the board of the IESS, 55.3% of the Ecuadorian population is covered by the social security system. There are 16.03 million people in the country, as of June 2014, of which 8.88 million are affiliated. The following table indicates the number of people that receive coverage from each of the Insurance branches.

7
National Coverage
Ecuadorian Institute of Social Security (IESS) June 2014
No. of People (millions)
General Mandatory Insurance 2.71
Rural Social Insurance – Contributors 0.36
General Insurance – Pensioners 0.41
Rural Social Insurance – Retired Pensioners 0.05
Rural Social Insurance – Eligible Population 1.18
General Insurance Affiliated Children (0-18 yrs.) 4.15
Total 8.88
*Source: Board of Directors of the IESS - Labor Report
The following graph presents the evolution of the coverage of the IESS.
*Source: Board of Directors of the IESS - Labor Report
We can observe that in less than 6 years, the population affiliated to the IESS has almost triplicated. In fact, in 2010 2.32 million people were added, and in June 2014, the total increased to 8.88 million. As observed, the government has witnessed radical coverage growth, getting closer to their goal of universalizing social security.
2,87 3,89
6,21 6,92 7,38
8,39 8,88
0
2
4
6
8
10
2008 2009 2010 2011 2012 2013 Jun. 2014
Nu
mb
er
of
Aff
iliat
es
Years
Evolution of National Coverage Ecuadorian Institute of Social Security
(millions)
8
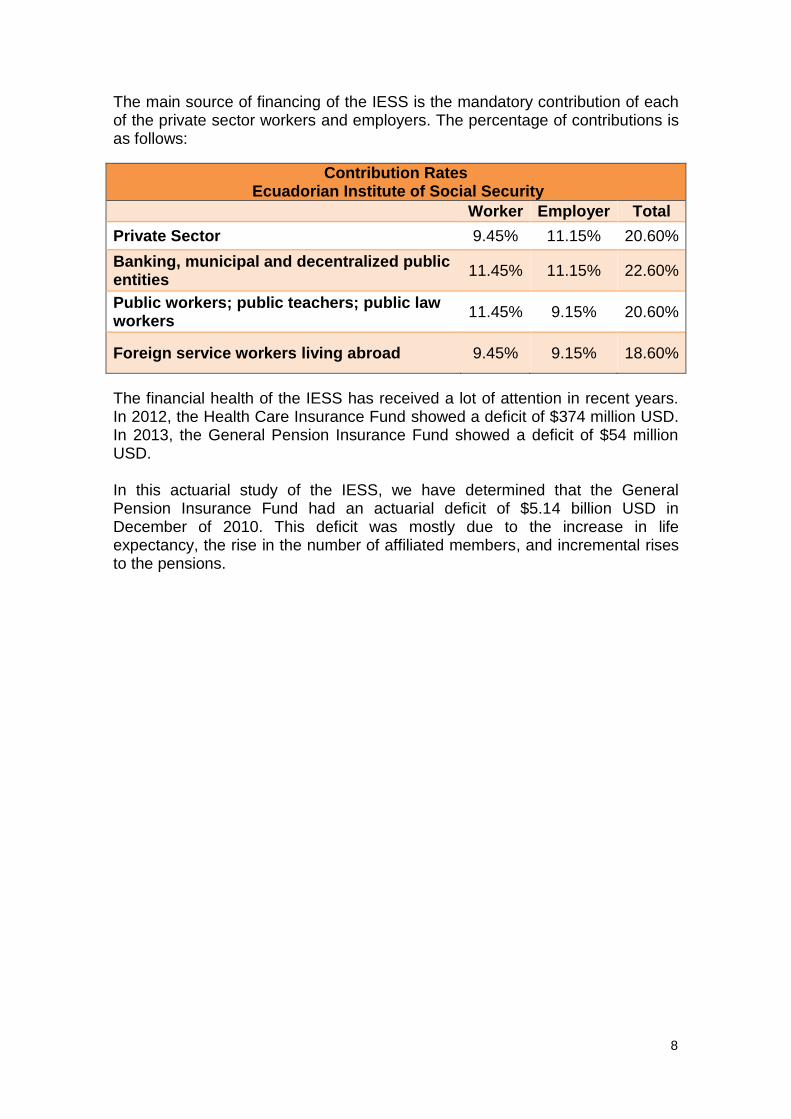
The main source of financing of the IESS is the mandatory contribution of each of the private sector workers and employers. The percentage of contributions is as follows:
Contribution Rates Ecuadorian Institute of Social Security
Worker Employer Total
Private Sector 9.45% 11.15% 20.60%
Banking, municipal and decentralized public entities
11.45% 11.15% 22.60%
Public workers; public teachers; public law workers
11.45% 9.15% 20.60%
Foreign service workers living abroad 9.45% 9.15% 18.60%
The financial health of the IESS has received a lot of attention in recent years. In 2012, the Health Care Insurance Fund showed a deficit of $374 million USD. In 2013, the General Pension Insurance Fund showed a deficit of $54 million USD. In this actuarial study of the IESS, we have determined that the General Pension Insurance Fund had an actuarial deficit of $5.14 billion USD in December of 2010. This deficit was mostly due to the increase in life expectancy, the rise in the number of affiliated members, and incremental rises to the pensions.

9
The following actuarial balance presents the state of the General Pension Fund, as of December 2010.
ACTUARIAL BALANCE OF THE GENERAL PENSION FUND OF INVALIDITY, RETIREMENT AND DEATH
DECEMBER 2010 (in billions USD)
ASSETS 162.95
Central Government´s Debt (40% of paid pensions) 1.23
Equity (Capitalized Fund) 3.55
Central Government´s contribution to the 40% payment of pensions in progress (2011) 0.60
Central Government´s contribution to the 40% payment of pensions in progress (2012-2050)
65.27
Future contributions of beneficiaries (2011) 1.60
Future contributions of beneficiaries (2011-50) 89.07
Future contributions of Pensioners(2012-2050) 1.63
LIABILITIES 162.95
Expenditure on retirement pensions (PV) 127.45
Expenditure on invalidity pensions (PV) 4.76
Expenditure on widowhood pensions (PV) 26.36
Expenditure on orphanage pensions (PV) 6.10
Expenditure fon funeral assistance (PV) 1.04
Administrative Expenditure (PV) 2.39
Actuarial Deficit (5.14)
As observed in the actuarial balance above, the value of the Fund´s total assets is $162.95 billion USD, and shows an actuarial deficit of $5.14 billion USD. The calculated value from the contributions of affiliates is just $90.67 billion USD, and the contributions from the state total $65.86 billion USD. In terms of liabilities, the single largest expense for the Fund is the payout of retirement pensions. The total actuarial value of this account was $127.45 billion USD, as of December 2010.
4. REFORM TO THE LAW OF SOCIAL SECURITY
In most developed and developing countries, household labor is often regarded as an invisible force of the economy. It is not accounted for as part of the GDP. It doesn´t receive any remuneration, and homemakers are not considered part of the Labor force. This disregard is changing in Ecuador, where homemakers are increasingly being considered as an important part of the country´s economic organization. As the country’s economy has continued to grow over the last eight years under Rafael Correa´s presidency, Ecuador has witnessed radical reforms in international affairs, fiscal policy, and labor laws. Correa´s Social Security Law Reform was presented to the Legislative power in November 2014 and will become effective in 2015. It goes beyond

10
acknowledging the contributions of homemakers and household labor to the economy, as it seeks to include homemakers into the IESS, so that they too can receive retirement pensions, disability, welfare and death benefits in recognition of their household labor.
4.1 REFORM BACKGROUND
The drive behind this reform arises from the political ideal that declares that the social security system should be public and universalized, and should attend to the needs of the whole urban and rural populations. Article No. 34 of the Ecuadorian Constitution states that “the right to have social security is an irrevocable right of all people, and should be the state´s primary responsibility.” In the macro view, the idea of universalizing social security appeals to the socialist political agenda of the current government, which seeks equality, inclusion and extended protection for all its citizens.
4.2 GENERAL CLAUSES
This section presents an overview of the proposed reforms to the Social Security Law that deal with the voluntary affiliation of homemakers to the Social Security System, as well as the financing plan of said project. Item 1 of Article 42 of the Social Security Law states that the portion of the population that performs household labor with no remuneration will become eligible to be added to the General Mandatory Insurance. According to item 5 of Article 42, homemakers are “those who perform household work without any kind of remuneration or economic compensation, and are not involved in any occupation that requires the obligatory affiliation under another intended mode in the Law and don´t receive any social security benefit.”
4.3 BENEFITS
In terms of the benefits that homeworkers will receive, item 6 of Article 42, states that the individuals who perform household labor will receive assistance for retirement, invalidity, and death contingencies. More specifically, they will receive the following benefits: retirement pensions, total and absolute permanent disability assistance, death of the pensioner or affiliate compensation, widowhood, orphanage benefits, and funerary subsidy. However, homemakers will not receive any health, severance or other benefits.

11
The pensions granted by the General Pension Insurance Fund will vary according to the following table, depending on household income.
Household Income
Monthly Retirement Pensions
Monthly Pensions for
total invalidity
Monthly Pensions for
absolute invalidity
Monthly Pensions for
death Contingencies
Less than 50% of minimum wage
$ 77 $ 68 $ 77 $ 68
More than 50% and less than 100% of minimum wage
$ 111 $ 102 $ 111 $ 102
More than 100% and less than 150% of minimum wage
$ 159 $ 140 $ 159 $ 140
Over 150% of minimum wage
$ 213 $ 187 $ 213 $ 187
*Source: Labor Reform Chapter I: General dispositions
4.4 CONTRIBUTION RATES
Contributions to the IESS will be paid by the immediate family of the insured homemakers, as well as by the state, and will depend on the family´s monthly income. In this sense, there will be four groups of homemakers, divided by family income and contributions. The following table presents the different personal and governmental contribution rates for the insurance of homemakers.
Household Income State´s
Subsidy Affiliate´s
Contribution
Less than 50% of minimum wage $ 9.20 $ 2.00
More than 50% and less than 100% of minimum wage
$ 13.50 $ 9.00
More than 100% and less than 150% of minimum
$ 15.20 $ 18.60
Over 150% of minimum wage $ 0.00 $ 45.00
*Source: Labor Reform Chapter I: General dispositions
The current minimum wage in Ecuador is $354 USD per month. As observed in the table above, monthly family contributions start from as low as $2 USD a month and go up to $45 USD for higher income households. The government funds (subsidizes) part of the contributions for the insurance of homemakers, starting from $9.20 USD a month for lower income families, and reaching $15.20 USD for families whose income is between 1 and 1.5 times the minimum wage.

12
4.5 REQUIREMENTS
According to the new reforms, homemakers will receive retirement benefits after 240 monthly contributions, (20 years), and only after they have turned 65 years of age. These settlements applying only to women who work in the household and do not receive any other kind of monetary remuneration. This means that if the Reform Project of the Social Security Law is approved in 2015, the first generation of pensioners will emerge in 2035. In the case of permanent disability, and in order to receive the benefits, the affiliate must have made 6 monthly contributions if between the ages of 15 and 25, 36 if the affiliate is between 26 and 45 years of age, and 60 contributions for the affiliates that are older than 46 years of age.
4.6 PROCESS OF INCORPORATION
The affiliation of homemakers into the IESS will be voluntary and in stages. The objective for the first stage of the project is to incorporate the 400,000 homemakers that currently receive the Human Development Welfare Benefits. In future years, more homemakers will be progressively added until all 1.5 million homemakers are covered.
4.7 SUBSIDY FUNDING
The IESS reforms will be financed by the monthly contributions of the families of the insured, as well as by capital granted by the government for the project. The state´s subsidy will be funded by the excess of profit sharing from private companies, which is also part of the current reforms. Article 9 of the Reformatory Law states that the profit sharing distributed to the private sector workers “shall not exceed 24 times the minimum wage. In the case that exceeds the indicated amount, the excess will be transferred to the solidary services of the Social Security…” According to the Minister of Labor, the excess of profit sharing is expected to be around $100 million USD per year. The inclusion of homemakers in the social security system is an innovative concept in the history of insurance and pension systems worldwide, and the project already has a financing plan in place. But it is important to analyze the long term impact that this reform will have on the IESS and on the lives of millions of people. In the next section we will conduct projections of the financial effect that the incorporation of homemakers will have on the social security system, in order to determine the actuarial future of this project.
5. ACTUARIAL ANALISIS AND PROJECTIONS
In this section we present the actuarial projections of the Ecuadorian Institute of Social Security, with the incorporation of homemakers to the system. The parameters and assumptions used in this analysis, as well as the resulting projections are detailed below:

13
Since the new Social Security Law Reform makes the affiliation of female homemakers optional, there isn´t an exact prediction of the number of new affiliates that will join the social security system as part of this program. Therefore, we have established three scenarios: optimistic, moderate, and pessimistic, where we approximate the distribution of domestic workers according to household income, as follows:
Group Household Income Domestic Workers´
Distribution
1 Less than 50% of minimum wage 26.67%
2 More than 50% and less than 100% of minimum wage
30.08%
3 More than 100% and less than 150% of minimum wage
32.50%
4 Over 150% of minimum wage 10.75%
This means that we have approximated group number 3 to constitute 32.50% of the total homemaker´s population, whose household income is between 1 and 1.5 times the minimum wage. The parameters used in this analysis, for each one of the proposed scenarios, are the following:
Parameters Optimistic Scenario
Moderate Scenario
Pessimistic Scenario
Affiliated domestic workers proportion of total domestic workers
25% 50% 75%
Number of domestic workers in the first group
100,000 200,000 300,000
Number of domestic workers in the second group
112,818 225,636 338,453
Number of domestic workers in the third group
121,875 243,750 365,625
Number of domestic workers in the fourth group
40,307 80,615 120,922
As shown in the table above, the optimistic, moderate, and pessimistic scenarios consider a 25%, 50% and 75% incorporation of the total homemakers´ population, respectively. The number of domestic workers in the different groups gives the total amount of the new affiliates for each scenario.

14
The subsequent parameters were set based on historic information and held constant for the three scenarios with the objective of having differences in the results among the scenarios based solely on the number of new affiliates:
Parameters Optimistic Scenario
Moderate Scenario
Pessimistic Scenario
Domestic workers proportion of total population
9.36% 9.36% 9.36%.
Pensions annual growth
4.93% 4.93% 4.93%
Inflation Rate 3% 3% 3%
Contributions annual growth
3% 3% 3%
Discount rate 4% 4% 4%
Excess Profits US$ 100 million US$ 100 million US$ 100 million
Excess Profit growth 4.30% 4.30% 4.30%
The actuarial analysis was performed by calculating all the income received from the contributions made by the beneficiaries and the central government for each of the scenarios (Appendix 1). The contributions made by the central government are set to be financed by the excess profit from private companies according to the Social Security Law Reform. Nevertheless, as observed in Appendix 2, the central government runs out of funding in 2019 for the moderate scenario, and in 2017 for the pessimistic scenario and will be unable to meet the desired contributions.
15
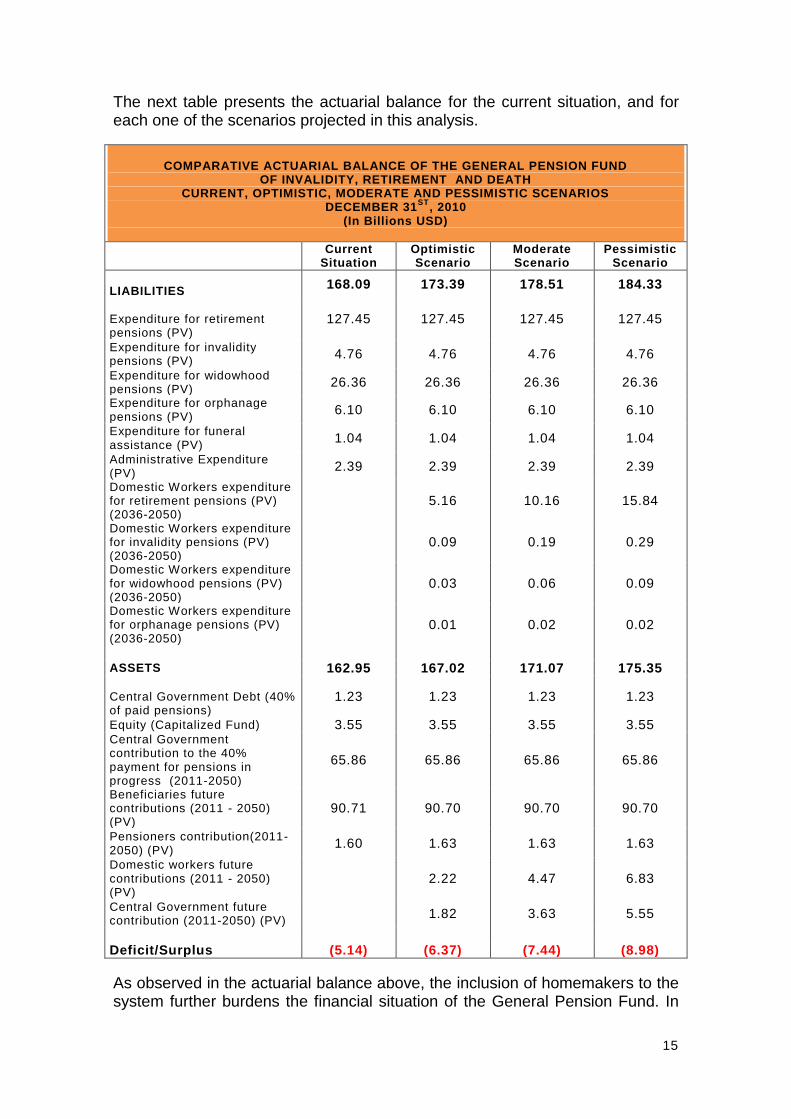
The next table presents the actuarial balance for the current situation, and for each one of the scenarios projected in this analysis.
COMPARATIVE ACTUARIAL BALANCE OF THE GENERAL PENSION FUND
OF INVALIDITY, RETIREMENT AND DEATH CURRENT, OPTIMISTIC, MODERATE AND PESSIMISTIC SCENARIOS
DECEMBER 31ST
, 2010 (In Billions USD)
Current
Situation Optimistic Scenario
Moderate Scenario
Pessimistic Scenario
LIABILITIES
168.09 173.39 178.51 184.33
Expenditure for retirement pensions (PV)
127.45 127.45 127.45 127.45
Expenditure for invalidity pensions (PV)
4.76 4.76 4.76 4.76
Expenditure for widowhood pensions (PV)
26.36 26.36 26.36 26.36
Expenditure for orphanage pensions (PV)
6.10 6.10 6.10 6.10
Expenditure for funeral assistance (PV)
1.04 1.04 1.04 1.04
Administrative Expenditure (PV)
2.39 2.39 2.39 2.39
Domestic Workers expenditure for retirement pensions (PV) (2036-2050)
5.16 10.16 15.84
Domestic Workers expenditure for invalidity pensions (PV) (2036-2050)
0.09 0.19 0.29
Domestic Workers expenditure for widowhood pensions (PV) (2036-2050)
0.03 0.06 0.09
Domestic Workers expenditure for orphanage pensions (PV) (2036-2050)
0.01 0.02 0.02
ASSETS 162.95 167.02 171.07 175.35 Central Government Debt (40% of paid pensions)
1.23 1.23 1.23 1.23
Equity (Capitalized Fund) 3.55 3.55 3.55 3.55 Central Government contribution to the 40% payment for pensions in progress (2011-2050)
65.86 65.86 65.86 65.86
Beneficiaries future contributions (2011 - 2050) (PV)
90.71 90.70 90.70 90.70
Pensioners contribution(2011-2050) (PV)
1.60 1.63 1.63 1.63
Domestic workers future contributions (2011 - 2050) (PV)
2.22 4.47 6.83
Central Government future contribution (2011-2050) (PV)
1.82 3.63 5.55
Deficit/Surplus (5.14) (6.37) (7.44) (8.98)
As observed in the actuarial balance above, the inclusion of homemakers to the system further burdens the financial situation of the General Pension Fund. In

16
the current situation, there is a $5.14 billion USD actuarial deficit in the General Pension Fund, as of December 2010. This number, compared to the entire country´s production, is of approximately 5% of the total GDP. With the incorporation of homemakers to the system, in the best case scenario, the General Pension Fund´s deficit will increase to $6.37 billion USD, and in the worst case, the deficit will increase to $8.98 billion USD.
6. CONCLUSIONS AND RECOMMENDATIONS
Social security systems worldwide have constantly evolved and expanded, each time offering more assistance programs and better coverage. The case is not different in Ecuador, where the social security system has grown at accelerated rates, and has witnessed fundamental improvements in recent years. The inclusion of homemakers into the IESS is one of the most innovative projects in the history of Ecuadorian insurance, and in pension systems worldwide. With the voluntary contribution of the affiliate´s family, homemakers from around the country will be able to receive well-needed invalidity, retirement, and death benefits. However, there is a concern for the long-term financial health of the IESS. Even though the government is subsidizing the contributions of lower income families with the excess of utilities from the private sector, the unstable situation of the General Pension Fund indicates an urgent need for monetary funds. The future of the IESS is endangered by the decreasing growth rate of the population, which will cause the proportion of active contributors to pensioners to decrease. In this way, a lower number of active affiliates will have to support a higher number of pensioners. Another reason that the IESS may suffer in the future is the increase in life expectancy. As people live longer, the system will have to pay pensions for longer periods of time. Moreover, the financial situation could be affected by the increase in pensions being paid, especially if it surpasses the increase in contributions. There is a $5.14 billion USD actuarial deficit in the General Pension Fund, as of December 2010, and the incorporation of homemakers to the system will increase this deficit to $6.37 billion USD in the best case scenario. In the worst case, the deficit will increase to $8.98 billion USD. The situation is worse when we don´t consider the 40% governmental subsidy, where the actuarial deficit in the current situation reaches $70.98 billion USD. With the incorporation of homemakers to the system, this deficit will increase to $72.24 billion USD in the best scenario, and to $74.84 billion USD in the worst case scenario. There is no doubt about the innovative and well-intended nature of this Social Security Law Reform. On the other hand, the government must find better financing sources for this program´s subsistence, since the inclusion of homemakers to the General Pension Fund increases the actuarial deficit and endangers the financial future of the Institution. After analyzing the financial

17
situation of the IESS, we conclude that if this institution can´t find better sources of funding, another governmental institution that is more financially capable should assume the affiliation of the 1.5 million homemakers nationwide, such as the Ministry of Social Inclusion. If the inclusion of homemakers to the IESS is successful, then there will be continued needs to expand and improve the coverage of the system, in order to build a more complete and universalized social security system.
18
7. REFERENCES
Actuaria Consultores (2012): Consultoría Actuarial para la Revisión y Aprobación de los Balances Actuariales del Instituto Ecuatoriano de Seguridad Social. Arroyo, M. (2015): Amas de Casa Esperanzadas. Vistazo. Asamblea Constituyente (2008): Constitución de La República del Ecuador. Congreso Nacional (2014): Ley de Seguridad Social. Lexis S.A. Correa, R. (2014): Ley Para la Justicia Laboral y Reconocimiento del Trabajo en el Hogar. Presidencia de la República. Dirección Nacional de Estudios (2014): Balances Sistema Nacional de Seguridad Social. Superintendencia de Bancos y Seguros. Durán, F. (2008): Diagnóstico del Sistema de Seguridad Social del Ecuador. Oficina Internacional del Trabajo. "Ecuador: Panorama General." Ecuador. Banco Mundial, 14 Nov. 2014. Web. 12 Mar. 2015. <http://www.bancomundial.org/es/country/ecuador/overview>.
IESS (2014): Tasas de aportación. IESS. "Intitución." Ecuador. IESS, 15 Sept. 2014. Web. 13 Mar. 2015. <http://www.iess.gob.ec/es/inst-quienes-somos>.
“Misión Y Visión”. BIESS. Banco Del IESS, 1 Jan. 2012. Web. 30 Mar. 2015. <https://www.biess.fin.ec/nuestra-institucion/mision-y-visi-n>.
Pezo, F. (2014): Informe de Labores. IESS. "Población Y Demografía." Instituto Nacional De Estadística Y Censos. INEC, 1 Jan. 2015. Web. 12 Mar. 2015. <http://www.ecuadorencifras.gob.ec/poblacion-y-demografia/>.
Proaño, P. (2015): Dirección del Sistema de Pensiones. IESS.

19
8. APPENDICES
8.1. APPENDIX 1
Projection of Domestic Workers´ Contributions Moderate Scenario (In Millions of USD)
Year
Total Affiliates
Beneficiary´s Total
Contribution
Total State’s Contribution
Total Income from Contributions
Beneficiary´s Total
Contribution (Present Value)
Total Income from
Contributions (Present Value)
2016 0.08 1.98 9.11 11.09 1.98 9.11
2017 0.31 54.82 44.46 99.28 52.71 42.75
2018 0.48 85.94 69.70 155.64 79.45 64.44
2019 0.65 119.72 97.09 216.81 106.43 86.32
2020 0.82 156.30 126.77 283.07 133.61 108.36
2021 0.83 163.24 132.40 295.64 134.17 108.82
2022 0.84 170.44 138.24 308.68 134.70 109.25
2023 0.85 177.91 144.29 322.20 135.20 109.65
2024 0.86 185.65 150.57 336.21 135.65 110.02
2025 0.88 193.66 157.07 350.73 136.07 110.36
2026 0.89 201.97 163.80 365.77 136.44 110.66
2027 0.90 210.56 170.78 381.34 136.78 110.93
2028 0.91 219.46 177.99 397.46 137.08 111.17
2029 0.92 228.67 185.46 414.13 137.33 111.38
2030 0.93 238.26 193.24 431.50 137.59 111.59
2031 0.94 248.11 201.23 449.33 137.77 111.73
2032 0.95 258.29 209.48 467.77 137.90 111.84
2033 0.96 268.80 218.01 486.81 138.00 111.92
2034 0.97 279.66 226.82 506.48 138.05 111.96
2035 0.98 290.87 235.91 526.78 138.06 111.97
2036 0.99 302.45 245.30 547.74 138.03 111.95
2037 1.00 314.39 254.98 569.37 137.96 111.89
2038 1.01 326.70 264.97 591.67 137.85 111.80
2039 1.01 339.39 275.26 614.66 137.70 111.68
2040 1.02 352.48 285.87 638.35 137.51 111.53
2041 1.03 365.96 296.81 662.76 137.28 111.34
2042 1.04 379.84 308.06 687.90 137.00 111.12
2043 1.05 394.13 319.65 713.78 136.69 110.86
2044 1.05 408.83 331.58 740.41 136.34 110.57
2045 1.06 423.96 343.85 767.81 135.94 110.26
2046 1.07 439.52 356.47 795.99 135.51 109.91
2047 1.08 455.51 369.44 824.95 135.04 109.52
2048 1.08 471.94 382.77 854.71 134.53 109.11
2049 1.09 488.83 396.46 885.28 133.98 108.67
2050 1.09 506.16 410.52 916.67 133.40 108.19

20
Projection of Domestic Workers´ Contributions Optimistic Scenario (In Millions of USD)
Year Total
Affiliates
Beneficiary’s Total
Contribution
Total State’s Contribution
Total Income from
Contributions
Beneficiary’s Total
Contribution (Present Value)
Total Income from
Contributions (Present Value)
2016 0.04 0.99 4.55 5.54 0.99 4.55
2017 0.16 28.93 29.34 58.27 27.82 28.21
2018 0.24 43.99 39.77 83.76 40.67 36.77
2019 0.32 60.32 51.06 111.38 53.63 45.39
2020 0.41 78.00 63.26 141.25 66.67 54.07
2021 0.41 81.46 66.06 147.52 66.95 54.30
2022 0.42 85.02 68.96 153.98 67.20 54.50
2023 0.43 88.72 71.96 160.68 67.42 54.68
2024 0.43 92.55 75.06 167.62 67.63 54.85
2025 0.44 96.52 78.28 174.80 67.81 55.00
2026 0.44 100.63 81.61 182.24 67.98 55.13
2027 0.45 104.88 85.06 189.94 68.13 55.25
2028 0.45 109.28 88.63 197.91 68.25 55.36
2029 0.46 113.83 92.32 206.15 68.36 55.44
2030 0.46 118.60 96.19 214.79 68.49 55.55
2031 0.47 123.43 100.11 223.54 68.54 55.59
2032 0.47 128.45 104.18 232.64 68.58 55.62
2033 0.48 133.64 108.39 242.03 68.61 55.65
2034 0.48 139.00 112.74 251.74 68.62 55.65
2035 0.49 144.53 117.22 261.75 68.60 55.64
2036 0.49 150.24 121.85 272.08 68.57 55.61
2037 0.50 156.12 126.62 282.74 68.51 55.56
2038 0.50 162.19 131.54 293.72 68.43 55.50
2039 0.50 168.44 136.61 305.05 68.34 55.43
2040 0.51 174.88 141.83 316.71 68.22 55.33
2041 0.51 181.51 147.21 328.72 68.09 55.22
2042 0.52 188.34 152.75 341.09 67.93 55.10
2043 0.52 195.36 158.45 353.81 67.76 54.95
2044 0.52 202.59 164.31 366.90 67.56 54.79
2045 0.53 210.02 170.34 380.36 67.34 54.62
2046 0.53 217.67 176.54 394.20 67.11 54.43
2047 0.53 225.52 182.90 408.42 66.86 54.22
2048 0.54 233.58 189.45 423.03 66.58 54.00
2049 0.54 241.86 196.16 438.03 66.29 53.77
2050 0.54 250.36 203.06 453.42 65.98 53.52

21
Projection of Domestic Workers´ Contributions Pessimistic Scenario (In Millions of USD)
Year Total
Affiliates
Beneficiary’s Total
Contribution
Total State’s Contribution
Total Income from
Contributions
Beneficiary’s Total
Contribution (Present Value)
Total Income from
Contributions (Present Value)
2016 185,778 4.46 20.51 24.97 4.46 20.51
2017 707,278 123.46 100.13 223.60 118.71 96.28
2018 877,438 157.76 127.95 285.71 145.86 118.30
2019 1,052,209 194.86 158.04 352.90 173.23 140.50
2020 1,231,535 234.91 190.52 425.44 200.80 162.86
2021 1,248,842 245.36 199.00 444.36 201.67 163.56
2022 1,266,330 256.26 207.84 464.10 202.53 164.26
2023 1,283,683 267.57 217.01 484.57 203.33 164.91
2024 1,300,888 279.29 226.51 505.80 204.07 165.51
2025 1,317,933 291.43 236.37 527.80 204.76 166.07
2026 1,334,807 304.02 246.57 550.59 205.38 166.58
2027 1,351,495 317.06 257.15 574.20 205.95 167.04
2028 1,367,987 330.55 268.09 598.64 206.46 167.45
2029 1,384,269 344.52 279.42 623.94 206.91 167.81
2030 1,400,326 358.97 291.14 650.12 207.30 168.13
2031 1,416,576 374.03 303.36 677.39 207.69 168.44
2032 1,432,160 389.49 315.89 705.39 207.95 168.66
2033 1,447,487 405.47 328.85 734.32 208.16 168.82
2034 1,462,542 421.98 342.24 764.22 208.30 168.94
2035 1,477,316 439.03 356.07 795.10 208.38 169.01
2036 1,491,795 456.63 370.35 826.98 208.40 169.02
2037 1,505,968 474.80 385.08 859.88 208.36 168.99
2038 1,519,824 493.54 400.28 893.82 208.25 168.90
2039 1,533,351 512.87 415.96 928.83 208.09 168.77
2040 1,546,538 532.80 432.12 964.93 207.86 168.58
2041 1,559,375 553.34 448.78 1,002.12 207.57 168.35
2042 1,571,850 574.50 465.94 1,040.44 207.22 168.06
2043 1,583,952 596.29 483.62 1,079.91 206.80 167.73
2044 1,595,673 618.72 501.81 1,120.54 206.33 167.34
2045 1,607,001 641.81 520.54 1,162.35 205.80 166.91
2046 1,617,927 665.56 539.80 1,205.36 205.20 166.43
2047 1,628,442 689.98 559.60 1,249.59 204.55 165.90
2048 1,638,537 715.09 579.97 1,295.05 203.84 165.32
2049 1,648,202 740.88 600.89 1,341.77 203.07 164.70
2050 1,657,429 767.38 622.38 1,389.76 202.25 164.03

22
8.2. APPENDIX 2
State´s Contribution Financing Moderate Scenario
(In Millions of Dollars)
Year Total State’s Contribution
Excess Profit Deficit/Surplus Deficit/Surplus Present Value
2016 9.11 80.00 70.89 70.89
2017 44.46 83.44 38.98 37.48
2018 69.70 87.03 17.33 16.02
2019 97.09 90.77 -6.32 -5.62
2020 126.77 94.67 -32.09 -27.43
2021 132.40 98.74 -33.65 -27.66
2022 138.24 102.99 -35.25 -27.86
2023 144.29 107.42 -36.87 -28.02
2024 150.57 112.04 -38.53 -28.15
2025 157.07 116.86 -40.21 -28.25
2026 163.80 121.88 -41.92 -28.32
2027 170.78 127.12 -43.66 -28.36
2028 177.99 132.59 -45.41 -28.36
2029 185.46 138.29 -47.17 -28.33
2030 193.24 144.23 -49.00 -28.30
2031 201.23 150.44 -50.79 -28.20
2032 209.48 156.91 -52.57 -28.07
2033 218.01 163.65 -54.36 -27.90
2034 226.82 170.69 -56.13 -27.71
2035 235.91 178.03 -57.88 -27.47
2036 245.30 185.68 -59.61 -27.21
2037 254.98 193.67 -61.31 -26.91
2038 264.97 202.00 -62.97 -26.57
2039 275.26 210.68 -64.58 -26.20
2040 285.87 219.74 -66.13 -25.80
2041 296.81 229.19 -67.61 -25.36
2042 308.06 239.05 -69.02 -24.89
2043 319.65 249.33 -70.33 -24.39
2044 331.58 260.05 -71.54 -23.86
2045 343.85 271.23 -72.62 -23.29
2046 356.47 282.89 -73.58 -22.69
2047 369.44 295.06 -74.38 -22.05
2048 382.77 307.74 -75.02 -21.39
2049 396.46 320.98 -75.48 -20.69
2050 410.52 334.78 -75.74 -19.96
23
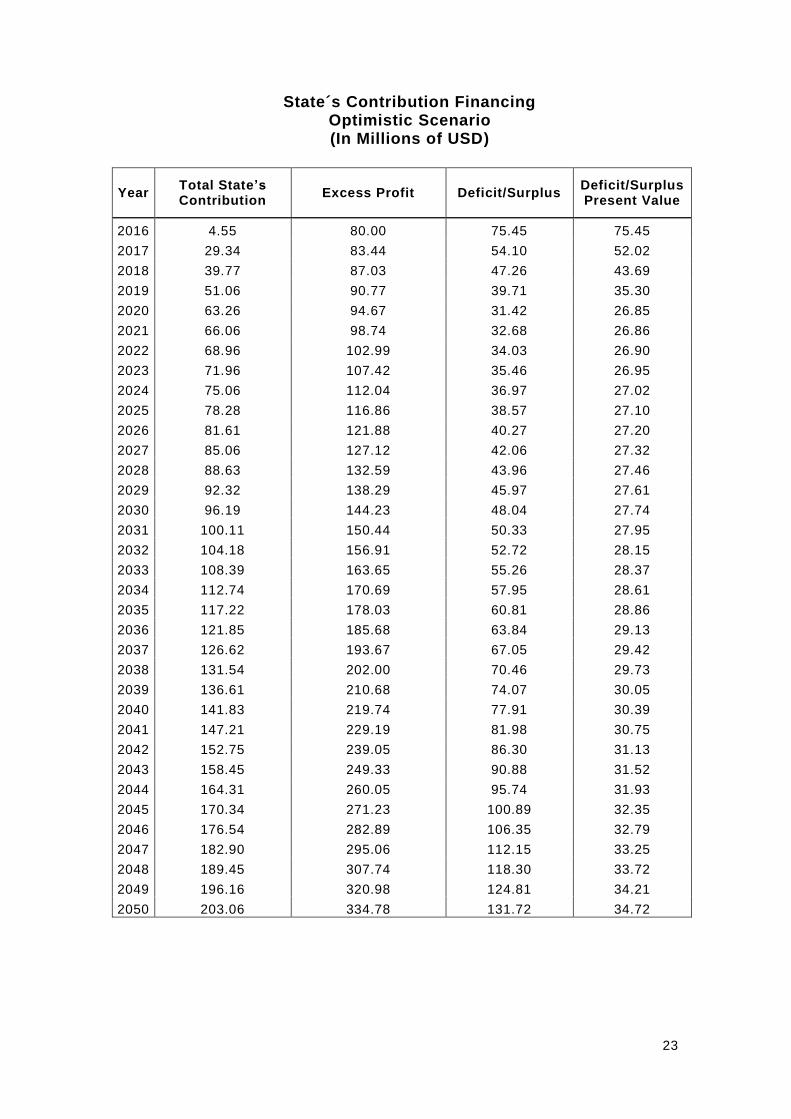
State´s Contribution Financing Optimistic Scenario (In Millions of USD)
Year Total State’s Contribution
Excess Profit Deficit/Surplus Deficit/Surplus Present Value
2016 4.55 80.00 75.45 75.45
2017 29.34 83.44 54.10 52.02
2018 39.77 87.03 47.26 43.69
2019 51.06 90.77 39.71 35.30
2020 63.26 94.67 31.42 26.85
2021 66.06 98.74 32.68 26.86
2022 68.96 102.99 34.03 26.90
2023 71.96 107.42 35.46 26.95
2024 75.06 112.04 36.97 27.02
2025 78.28 116.86 38.57 27.10
2026 81.61 121.88 40.27 27.20
2027 85.06 127.12 42.06 27.32
2028 88.63 132.59 43.96 27.46
2029 92.32 138.29 45.97 27.61
2030 96.19 144.23 48.04 27.74
2031 100.11 150.44 50.33 27.95
2032 104.18 156.91 52.72 28.15
2033 108.39 163.65 55.26 28.37
2034 112.74 170.69 57.95 28.61
2035 117.22 178.03 60.81 28.86
2036 121.85 185.68 63.84 29.13
2037 126.62 193.67 67.05 29.42
2038 131.54 202.00 70.46 29.73
2039 136.61 210.68 74.07 30.05
2040 141.83 219.74 77.91 30.39
2041 147.21 229.19 81.98 30.75
2042 152.75 239.05 86.30 31.13
2043 158.45 249.33 90.88 31.52
2044 164.31 260.05 95.74 31.93
2045 170.34 271.23 100.89 32.35
2046 176.54 282.89 106.35 32.79
2047 182.90 295.06 112.15 33.25
2048 189.45 307.74 118.30 33.72
2049 196.16 320.98 124.81 34.21
2050 203.06 334.78 131.72 34.72

24
State´s Contribution Financing Pessimistic Scenario (In Millions of USD)
Year Total State’s Contribution
Excess Profit Deficit/Surplus Deficit/Surplus Present Value
2016 20.51 80.00 59.49 59.49
2017 100.13 82.56 -17.57 -16.90
2018 127.95 85.20 -42.75 -39.52
2019 158.04 87.93 -70.11 -62.33
2020 190.52 90.74 -99.78 -85.29
2021 199.00 93.65 -105.35 -86.59
2022 207.84 96.64 -111.20 -87.88
2023 217.01 99.74 -117.27 -89.12
2024 226.51 102.93 -123.59 -90.30
2025 236.37 106.22 -130.15 -91.44
2026 246.57 109.62 -136.95 -92.52
2027 257.15 113.13 -144.02 -93.55
2028 268.09 116.75 -151.34 -94.53
2029 279.42 120.48 -158.94 -95.45
2030 291.14 124.34 -166.80 -96.33
2031 303.36 128.32 -175.04 -97.19
2032 315.89 132.42 -183.47 -97.96
2033 328.85 136.66 -192.19 -98.67
2034 342.24 141.03 -201.21 -99.32
2035 356.07 145.55 -210.52 -99.92
2036 370.35 150.20 -220.14 -100.47
2037 385.08 155.01 -230.07 -100.96
2038 400.28 159.97 -240.31 -101.40
2039 415.96 165.09 -250.87 -101.78
2040 432.12 170.37 -261.75 -102.11
2041 448.78 175.83 -272.96 -102.39
2042 465.94 181.45 -284.49 -102.61
2043 483.62 187.26 -296.36 -102.78
2044 501.81 193.25 -308.56 -102.90
2045 520.54 199.43 -321.10 -102.96
2046 539.80 205.82 -333.98 -102.97
2047 559.60 212.40 -347.20 -102.93
2048 579.97 219.20 -360.77 -102.84
2049 600.89 226.21 -374.67 -102.70
2050 622.38 233.45 -388.93 -102.50

25
8.3. APPENDIX 3
Benefit Expenses Moderate Scenario (In Millions of USD)
Year Retirement
Total
Retirement Total
Present Value
Disability Total
Disability Total
Present Value
Widowhood Total
Widowhood Total
Present Value
Orphanage Total
Orphanage Total
Present Value
Total Outflow
Total Outflow Present Value
2016 0.00 0.00 0.00 0.00 0.00 0.00 0.00 0.00 0.00 0.00
2017 0.00 0.00 0.00 0.00 0.00 0.00 0.00 0.00 0.00 0.00
2018 0.00 0.00 0.00 0.00 0.00 0.00 0.00 0.00 0.00 0.00
2019 0.00 0.00 6.29 5.59 0.00 0.00 0.00 0.00 6.29 5.59
2020 0.00 0.00 8.12 6.94 0.00 0.00 0.00 0.00 8.12 6.94
2021 0.00 0.00 8.40 6.90 0.00 0.00 0.00 0.00 8.40 6.90
2022 0.00 0.00 8.68 6.86 0.00 0.00 0.00 0.00 8.68 6.86
2023 0.00 0.00 8.96 6.81 0.00 0.00 0.00 0.00 8.96 6.81
2024 0.00 0.00 9.24 6.75 0.00 0.00 0.00 0.00 9.24 6.75
2025 0.00 0.00 9.52 6.69 0.00 0.00 0.00 0.00 9.52 6.69
2026 0.00 0.00 9.83 6.64 0.00 0.00 0.00 0.00 9.83 6.64
2027 0.00 0.00 10.13 6.58 0.00 0.00 0.00 0.00 10.13 6.58
2028 0.00 0.00 10.43 6.51 0.00 0.00 0.00 0.00 10.43 6.51
2029 0.00 0.00 10.73 6.44 0.00 0.00 0.00 0.00 10.73 6.44
2030 0.00 0.00 11.03 6.37 0.00 0.00 0.00 0.00 11.03 6.37
2031 0.00 0.00 11.35 6.30 0.00 0.00 0.00 0.00 11.35 6.30
2032 0.00 0.00 11.67 6.23 0.00 0.00 0.00 0.00 11.67 6.23
2033 0.00 0.00 11.99 6.15 0.00 0.00 0.00 0.00 11.99 6.15
2034 0.00 0.00 12.30 6.07 0.00 0.00 0.00 0.00 12.30 6.07
2035 0.00 0.00 12.62 5.99 0.00 0.00 0.00 0.00 12.62 5.99
2036 146.60 66.90 12.96 5.91 0.73 0.33 0.22 0.10 160.50 73.25
2037 777.90 341.37 13.29 5.83 2.97 1.30 0.87 0.38 795.03 348.89
2038 1,199.41 506.10 13.63 5.75 4.85 2.05 1.40 0.59 1,219.29 514.49
2039 1,643.88 666.96 13.96 5.67 7.03 2.85 2.01 0.82 1,666.88 676.30
2040 2,112.32 824.06 14.30 5.58 9.53 3.72 2.71 1.06 2,138.86 834.41
2041 2,172.05 814.77 14.65 5.50 10.35 3.88 2.91 1.09 2,199.96 825.24
2042 2,233.60 805.64 15.00 5.41 11.23 4.05 3.13 1.13 2,262.96 816.22
2043 2,297.04 796.65 15.35 5.32 12.17 4.22 3.36 1.17 2,327.92 807.36
2044 2,362.44 787.82 15.70 5.24 13.18 4.39 3.61 1.20 2,394.92 798.65
2045 2,429.87 779.14 16.05 5.15 14.26 4.57 3.87 1.24 2,464.04 790.10
2046 2,499.40 770.61 16.41 5.06 15.42 4.75 4.15 1.28 2,535.38 781.70
2047 2,571.11 762.23 16.77 4.97 16.67 4.94 4.44 1.32 2,608.99 773.46
2048 2,645.09 754.00 17.13 4.88 18.00 5.13 4.76 1.36 2,684.98 765.37
2049 2,721.41 745.92 17.49 4.79 19.42 5.32 5.09 1.40 2,763.42 757.44
2050 2,801.00 738.21 17.85 4.70 20.95 5.52 5.45 1.44 2,845.24 749.87

26
Benefit Expenses Optimistic Scenario (In Millions of USD)
Year Retirement
Total
Retirement Total
Present Value
Disability Total
Disability Total
Present Value
Widowhood Total
Widowhood Total
Present Value
Orphanage Total
Orphanage Total
Present Value
Total Outflow
Total Outflow Present Value
2016 0.00 0.00 0.00 0.00 0.00 0.00 0.00 0.00 0.00 0.00
2017 0.00 0.00 0.00 0.00 0.00 0.00 0.00 0.00 0.00 0.00
2018 0.00 0.00 0.00 0.00 0.00 0.00 0.00 0.00 0.00 0.00
2019 0.00 0.00 3.35 2.98 0.00 0.00 0.00 0.00 3.35 2.98
2020 0.00 0.00 4.05 3.46 0.00 0.00 0.00 0.00 4.05 3.46
2021 0.00 0.00 4.19 3.45 0.00 0.00 0.00 0.00 4.19 3.45
2022 0.00 0.00 4.33 3.42 0.00 0.00 0.00 0.00 4.33 3.42
2023 0.00 0.00 4.47 3.40 0.00 0.00 0.00 0.00 4.47 3.40
2024 0.00 0.00 4.61 3.37 0.00 0.00 0.00 0.00 4.61 3.37
2025 0.00 0.00 4.75 3.33 0.00 0.00 0.00 0.00 4.75 3.33
2026 0.00 0.00 4.90 3.31 0.00 0.00 0.00 0.00 4.90 3.31
2027 0.00 0.00 5.04 3.28 0.00 0.00 0.00 0.00 5.04 3.28
2028 0.00 0.00 5.19 3.24 0.00 0.00 0.00 0.00 5.19 3.24
2029 0.00 0.00 5.34 3.21 0.00 0.00 0.00 0.00 5.34 3.21
2030 0.00 0.00 5.49 3.17 0.00 0.00 0.00 0.00 5.49 3.17
2031 0.00 0.00 5.65 3.14 0.00 0.00 0.00 0.00 5.65 3.14
2032 0.00 0.00 5.80 3.10 0.00 0.00 0.00 0.00 5.80 3.10
2033 0.00 0.00 5.96 3.06 0.00 0.00 0.00 0.00 5.96 3.06
2034 0.00 0.00 6.11 3.02 0.00 0.00 0.00 0.00 6.11 3.02
2035 0.00 0.00 6.27 2.98 0.00 0.00 0.00 0.00 6.27 2.98
2036 73.25 33.43 6.44 2.94 0.36 0.17 0.11 0.05 80.16 36.58
2037 501.99 220.29 6.60 2.90 2.08 0.91 0.61 0.27 511.28 224.37
2038 676.98 285.65 6.77 2.85 2.85 1.20 0.83 0.35 687.42 290.06
2039 860.88 349.28 6.93 2.81 3.74 1.52 1.07 0.44 872.63 354.05
2040 1,054.07 411.22 7.09 2.77 4.76 1.86 1.35 0.53 1,067.28 416.37
2041 1,083.82 406.56 7.27 2.73 5.16 1.94 1.45 0.55 1,097.71 411.77
2042 1,114.20 401.88 7.44 2.68 5.60 2.02 1.56 0.56 1,128.80 407.15
2043 1,145.50 397.28 7.61 2.64 6.07 2.10 1.68 0.58 1,160.86 402.60
2044 1,177.76 392.76 7.78 2.59 6.57 2.19 1.80 0.60 1,193.91 398.14
2045 1,211.01 388.31 7.95 2.55 7.10 2.28 1.93 0.62 1,228.00 393.76
2046 1,245.29 383.95 8.13 2.51 7.68 2.37 2.07 0.64 1,263.17 389.46
2047 1,280.64 379.66 8.30 2.46 8.30 2.46 2.21 0.66 1,299.45 385.24
2048 1,317.09 375.45 8.48 2.42 8.96 2.55 2.37 0.68 1,336.90 381.09
2049 1,354.68 371.31 8.65 2.37 9.67 2.65 2.54 0.70 1,375.54 377.03
2050 1,394.30 367.47 8.83 2.33 10.43 2.75 2.71 0.72 1,416.27 373.26

27
Benefit Expenses Pessimistic Scenario (In Millions of USD)
Year Retirement
Total
Retirement Total
Present Value
Disability Total
Disability Total
Present Value
Widowhood Total
Widowhood Total
Present Value
Orphanage Total
Orphanage Total
Present Value
Total Outflow
Total Outflow Present Value
2016 0.00 0.00 0.00 0.00 0.00 0.00 0.00 0.00 0.00 0.00
2017 0.00 0.00 0.00 0.00 0.00 0.00 0.00 0.00 0.00 0.00
2018 0.00 0.00 0.00 0.00 0.00 0.00 0.00 0.00 0.00 0.00
2019 0.00 0.00 10.24 9.10 0.00 0.00 0.00 0.00 10.24 9.10
2020 0.00 0.00 12.20 10.43 0.00 0.00 0.00 0.00 12.20 10.43
2021 0.00 0.00 12.63 10.38 0.00 0.00 0.00 0.00 12.63 10.38
2022 0.00 0.00 13.05 10.32 0.00 0.00 0.00 0.00 13.05 10.32
2023 0.00 0.00 13.48 10.24 0.00 0.00 0.00 0.00 13.48 10.24
2024 0.00 0.00 13.90 10.16 0.00 0.00 0.00 0.00 13.90 10.16
2025 0.00 0.00 14.33 10.07 0.00 0.00 0.00 0.00 14.33 10.07
2026 0.00 0.00 14.79 9.99 0.00 0.00 0.00 0.00 14.79 9.99
2027 0.00 0.00 15.25 9.91 0.00 0.00 0.00 0.00 15.25 9.91
2028 0.00 0.00 15.71 9.81 0.00 0.00 0.00 0.00 15.71 9.81
2029 0.00 0.00 16.16 9.71 0.00 0.00 0.00 0.00 16.16 9.71
2030 0.00 0.00 16.62 9.60 0.00 0.00 0.00 0.00 16.62 9.60
2031 0.00 0.00 17.11 9.50 0.00 0.00 0.00 0.00 17.11 9.50
2032 0.00 0.00 17.60 9.39 0.00 0.00 0.00 0.00 17.60 9.39
2033 0.00 0.00 18.08 9.28 0.00 0.00 0.00 0.00 18.08 9.28
2034 0.00 0.00 18.56 9.16 0.00 0.00 0.00 0.00 18.56 9.16
2035 0.00 0.00 19.05 9.04 0.00 0.00 0.00 0.00 19.05 9.04
2036 330.06 150.64 19.56 8.93 1.64 0.75 0.48 0.22 351.75 160.53
2037 1,752.03 768.85 20.07 8.81 6.70 2.94 1.96 0.86 1,780.76 781.46
2038 2,201.86 929.09 20.59 8.69 8.90 3.76 2.58 1.09 2,233.93 942.62
2039 2,675.74 1,085.62 21.10 8.56 11.43 4.64 3.28 1.33 2,711.55 1,100.15
2040 3,174.74 1,238.53 21.62 8.43 14.32 5.59 4.07 1.59 3,214.75 1,254.14
2041 3,264.68 1,224.64 22.15 8.31 15.56 5.84 4.38 1.64 3,306.77 1,240.42
2042 3,358.20 1,211.27 22.69 8.18 16.88 6.09 4.70 1.70 3,402.47 1,227.24
2043 3,454.62 1,198.12 23.22 8.05 18.30 6.35 5.05 1.75 3,501.19 1,214.27
2044 3,554.03 1,185.19 23.76 7.92 19.82 6.61 5.43 1.81 3,603.04 1,201.53
2045 3,656.56 1,172.48 24.30 7.79 21.45 6.88 5.82 1.87 3,708.14 1,189.02
2046 3,762.32 1,159.99 24.85 7.66 23.21 7.16 6.24 1.93 3,816.63 1,176.74
2047 3,871.43 1,147.72 25.40 7.53 25.10 7.44 6.69 1.98 3,928.62 1,164.68
2048 3,984.01 1,135.67 25.95 7.40 27.11 7.73 7.17 2.04 4,044.24 1,152.84
2049 4,100.19 1,123.84 26.51 7.27 29.26 8.02 7.68 2.10 4,163.63 1,141.23
2050 4,220.10 1,112.22 27.06 7.13 31.56 8.32 8.21 2.16 4,286.93 1,129.83