Embed Size (px)
Citation preview


Role and regulation of miR-483 in cancer Index
1
INDEX
INDEX 1
Abstract 2
Significance 2
Introduction 3
Materials and Methods 8
Results 15
miR-483-3p is over-expressed in Wilms’ tumor and common adult human cancers in
concert with IGF2 15
miR-483-3p protects cells from apoptosis 18
PUMA is targets of miR-483-3p 19
AMO-miR-483-3p but not IGF2 siRNA can inhibit in vivo tumorigenicity 23
miR-483-3p expression correlates with the mutational status of Wnt/β-catenin genes in
hepatocarcinoma (HCC) 24
The miR-483 locus is regulated by β-catenin 26
The zinc finger CCCTC-binding factor CTCF represses the genomic region upstream of
the miR-483 locus 28
The transcription factor USF1 serves as a mediator between β-catenin and the miR-483 30
miR-483-3p reveals a negative regulative loop by targeting β-catenin 34
The mutated form of β-catenin can evade the miR-483-3p regulative loop 36
Discussion 39
Conclusion and future perspectives 42
References 45

Role and regulation of miR-483 in cancer Abstract
2
Abstract
The hsa-mir-483 locus is located at chromosome 11p15.5 within intron 2 of the IGF2 locus.
Because of its location, de-regulated in Wilms’ tumor and other neoplasia, I hypothesized
that this microRNA had a potential role in tumors. By analyzing 19 Wilms’ tumors, I proved
that miR-483-3p is indeed over-expressed in 100% of the cases and a co-regulation with the
over-expression of IGF2 was found.
However, several other types of common adult cancers exhibit high or even extremely high
levels of miR-483-3p expression without IGF2 over-expression. Indeed, independently from
IGF2, the expression of the miR-483-3p could also be induced by the oncoprotein -catenin
through a novel interaction with the basic Helix-Loop-Helix protein upstream stimulatory
transcription factor 1 (USF1).
I also show that -catenin itself is a target of miR-483-3p, triggering a negative regulative
loop that becomes ineffective in cells harbouring activating mutations of -catenin pathway.
The potential oncogenic role of miR-483-3p was supported by the findings that its ectopic
expression protects cells from apoptosis and, conversely, its inhibition increase the level of
apoptosis. To understand the mechanisms of its action, I investigated potential gene targets.
Among these, an important pro-apoptotic protein, Puma, were inhibited by miR-483-3p. My
results indicate that miR-483-3p functions as an anti-apoptotic oncogene, coordinately over-
expressed with IGF2 in Wilms’ tumors or induced by -catenin activation in other tumor
types.
Significance
IGF2 is a fetal growth factor where abnormally high expression has been associated with the
Beckhwith-Wiedeman syndrome that predisposes to the development of nephroblastoma,
hepatoblastoma and rhabdomyosarcoma. Here I show that miR-483-3p, located within intron
2 of IGF2 gene, is overexpressed in all the Wilms’ tumors I studied. I also show this
microRNA target a proapoptotic protein, Puma, and behave as an antiapoptotic oncogene.
Moreover I demonstrate that dysregulation of miR-483-3p can also occur independently of
IGF2 dysregulation. In this case miR-483-3p is regulated by -catenin oncogene and may
contribute to its antiapoptotic activity.

Role and regulation of miR-483 in cancer Introduction
3
Introduction
Genetic and epigenetic abnormalities at chromosomal region 11p15.5 have been associated
with various human neoplasms and with the cancer-predisposing Beckwith-Wiedeman
syndrome (BWS). In particular, loss of alleles and gene duplication at 11p15 are typically
detected in more than 80% of Wilms’ tumors 1-5
and, albeit less frequently, in more common
adult neoplasms 6-9
.
Two close imprinted loci, that harbor at least eight mono-allelically expressed genes, are
present at chromosome region 11p15.5. The aberrant regulation of genomic imprinting at
11p15.5 was involved in human cancer 10-12
. Aberrant methylation at the H19 maternal locus
leads to the reactivation of the silent IGF2 allele 10,13-16
and the loss of maternal allele
methylation at the KvDMR1 locus was linked to reduced expression of the cyclin-dependent
kinase inhibitor CDKN1C/p57 gene and other imprinted genes 11,12,17-19
. These studies point
to the existence of oncogenic, IGF2, as well as tumor suppressive, CDKN1C/p57, functions
within the 11p15.5 chromosomal imprinted region.
IGF2 is a fetal growth factor, whose abnormal expression has been involved in the Beckwith-
Wiedemann syndrome, which predisposes to the development of nephroblastoma,
hepatoblastoma, and rhabdomyosarcoma. Biallelic expression of IGF2 gene, consequent the
loss-of-imprinting (LOI) at the IGF2 locus, occur in 40-50% of Wilms’ tumor 5,20
and it is
thought to be an early event in carcinogenesis. So it has been suggested that increased IGF2
could lead to an enhanced cellular proliferation, differentiation failure and tumor
development. However, a transgenic mouse model for IGF2 over-expression exhibited many
of the features associated with the Beckwith-Wiedemann syndrome, including prenatal
overgrowth, polyhydramnios, fetal and neonatal lethality, disproportionate organ overgrowth
including tongue enlargement, and skeletal abnormalities, but did not develop tumors 21
.
These results suggest that additional cofactors cooperate with IGF2 in promoting human
cancer. Recently, the IGF2 locus was shown to harbor a miRNA, the mir-483 locus, within
its second intron 22
.

Role and regulation of miR-483 in cancer Introduction
4
Fig.1 Genomic structure of the 11p15.5 chromosome region and its imprinted genes.(A) Location of the
genes mapping in the 11p15.5 chromosome region and their imprinted status. Red arrows, on the top of the
panel, indicate the maternal allele expression, blue arrows the paternal allele expression whereas black arrows
indicate the biallelic expression. (B) Simplified model of the imprinted status of the
CDKN1C/KCNQ10T/KvLQT1 and IGF2/H19 genes imprinted locus (from J Clin Invest. 2000;105(3):247–
252). (C) Schematic representation of the tridimensional structure obtained by the interaction between CTCF-
Cohesin, other proteins to permit the monoallelic expression of the IGF2 and H19 genes. DNA elements are
indicated as follows: CTCF AD (red bar); ICR (purple bar), and CTCF DS (Cerise bar), Enhancer is yellow
oval. Pink and pale blue ovals represent the CTCF/cohesin complexes. CpG methylation is depicted as filled
lollipops. On the paternal allele, co localisation of CTCF and cohesin at CTCF AD, and CTCF DS brings these
regions together. The methylated ICR does not bind CTCF and is thus excluded from CTCF/cohesin interacting
regions. The exclusion of the ICR may enable the IGF2 gene promoters and H19 enhancer region to interact,
(shown by yellow oval close to IGF2 arrow) even though they are on different looping domains. (The H19
domain is shaded.) On the maternal allele, CTCF/cohesin can bind to the unmethylated ICR which can then
interact with other CTCF/cohesin sites.

Role and regulation of miR-483 in cancer Introduction
5
Fig.2 Wnt/β-catenin signaling (from Cell signaling technology, http://www.cellsignal.com). The figure show
how β-catenin (blue oval) could be part of the membrane E-Cadherin/α-catenin complex, compounded to the
APC/Axin/GSK3β/WTX complex for its degradation or be in the nucleus to act as a transcription factor. Every
step of this pathway could be regulated by numerous protein/enzyme where the most important is by the Wnt-
Frizzled molecules able to block the β-catenin degradation by the APC/Axin/GSK3β complex.
β-catenin is a multifunctional protein involved in cell-cell adhesion when it is localized to the
cellular membrane 23
, and in transcriptional regulation by translocation into the nucleus
through the Wnt pathway 24
. Wnt signaling is an important molecular pathway required for
cellular differentiation, tissue homeostasis, and tissue morphogenesis. Wnt/β-catenin
signaling is one of the most commonly activated pathways in cancer and several Wnt
signaling related gene mutations have been described: adenomatous polyposis coli (APC)
WTX

Role and regulation of miR-483 in cancer Introduction
6
and protein phosphatase 2 regulatory subunit A (PPP2R1B) mutations in colorectal cancer 25
,
axin1 mutation in hepatocarcinoma 26
, WTX gene mutations in Wilms’ tumor 27
and β-
catenin gene (CTNNB1) itself was shown to be mutated 28-30
in the amino terminal region
employed for degradation by the GSK3β -APC-Axin-WTX complex 27,31
. These mutations
prevent β-catenin degradation and result in its accumulation in the nucleus where it acts as a
specific transcriptional co-activator of the DNA binding T cell factor/lymphoid enhancer
factor protein family (TCF/LEF). Among the targets of this family are important genes
involved in tumorigenesis such as MYC, CCND1, CJUN and FRA1. 32,33
(Fig.2).
Fig.3 Biogenesis of miRNAs and assembly into protein complexes. miRNA precursor molecules (pri-
miRNAs) fold into hairpin structures that contain imperfect base-paired stems in a two-step process catalyzed by
two different RNase III-type endonucleases. Drosha first cleaves pri-miRNAs,forming _70 nucleotide hairpins
(pre-miRNAs) in the nucleus. Subsequently, pre-miRNAs are transported to the cytoplasm by Exportin 5, where
they are cleaved by Dicer to yield _20-bp miRNA duplexes. After processing, miRNAs are assembled into RNP
(ribonucleic protein) complexes, called miRNPs, with proteins of the AGO family. miRNPs tether to the 3_UTR
of a mRNA target to repress protein synthesis. In the case of perfect bp alignment, the miRNP complex cleaves
the duplex miRNAmRNA; however, multiple mechanisms 34 are used on duplex miRNA:mRNA with imperfect
complementary.
MicroRNAs (miRNAs) are small non-coding RNAs that modulate gene expression by base
pairing to the target messenger RNAs (mRNAs) and by inhibiting their translation and/or
promoting their degradation 35
(Fig.3). MicroRNAs play a critical role in the normal
maintenance of fundamental cellular processes and their deregulation in human neoplasm has
been proven to affect a large number of molecular pathways related to cancer 36-38
. Indeed

Role and regulation of miR-483 in cancer Introduction
7
microRNA aberrant expression of miRNAs has been detected in any human neoplasm and
miRNAs were found to play a central role in all molecular pathways affecting cancer traits
36,38,39. Since the miR-483 locus is dysregulated in tumors involving the β-catenin pathway
40-
42 I investigated also their possible connection. Here I demonstrate that expression of miR-
483 can be induced independently of its host gene IGF2 by the oncoprotein -catenin through
a novel interaction with the basic Helix-Loop-Helix protein upstream stimulatory
transcription factor 1 (USF1) . I also show that -catenin itself is a target of miR-483-3p,
triggering a negative regulative loop that becomes ineffective in cells harbouring activating
mutations of -catenin pathway.
Therefore, I illustrate the potential oncogenic activity of miR-483-3p, one of the mature
products of the hsa-mir-483 locus, which is located within the IGF2 locus at chromosome
11p15.5. My results provide evidences for a role of this miRNA as an anti-apoptotic
oncogene, which may cooperate with IGF2 in tumorigenesis.

Role and regulation of miR-483 in cancer Material and methods
8
Materials and Methods
Primary tumors. Primary tumor RNAs were obtained from 19 Wilms’ tumor, 3 adjacent
patient normal tissues, 2 adult kidneys; 27 hepatocarcinoma (HCC), 7 cirrhotic and 2 normal
liver tissues; 23 colorectal cancers (CRC) and 5 normal colon mucosa; 19 breast cancers
(BrCa) and 4 normal breast tissues. All tissue samples were collected at surgery, immediately
snap frozen in liquid nitrogen, and stored at -80°C until RNA extraction. Total RNA was
isolated using Trizol (Invitrogen) according to manufacturer’s instructions.
Cell lines and transfection. HEK293 (ATCC number CRL-1573), HepG2 (ATCC number
HB-8065), HCT116 (ATCC n. CCL-247) cell lines were cultured with Iscove’s modified
Dulbecco’s medium with 10% fetal bovine serum. hsa-miR-483-3p precursor (Sanger
accession MI0002467) and Negative control 2 ribo-oligonucleotide were from Applied
Biosystems/Ambion. Anti-microRNA oligonucleotides (AMOs) against miR-483-3p and
against the GFP gene (AMO Negative Control) were from Fidelity Systems (Gaithersburg
MD, USA). RNA interfering for BBC3/PUMA and scramble control were from Santa Cruz
(Santa Cruz, CA). . siRNA for MYC (cat. L-003282-00-0005), CTNNB1 (cat. L-003482-00)
and scramble negative control (cat. D-001810-10-20) were from Dharmacon. Transfection of
miRNAs, AMOs and expression vectors was carried out with lipofectamine 2000 (Invitrogen,
cat. 116688-019) in accordance with manufacturer’s procedure.
Luciferase assays and vectors. The human 3’UTRs of BBC3/PUMA and CTNNB1 were
amplified by PCR using the primers indicated in Table 1 and cloned downstream of the
firefly luciferase gene in the pGL3-Control vector (Promega). Substitutions into the miR-483-
3p binding sites of the 3’UTR genes were introduced by using Quick-Change Site direct
Mutagenesis Kit (Stratagene, CA, USA) following the manufacturer’s instructions using the
primers indicated in Table 1. As a reference, the pRLTK vector (Promega), which expresses
the renilla luciferase, was used. Transfection was conducted in HEK293, HCT116 and
HepG2 cells cultured in 24-well plates, each well was cotransfected with 400 ng of pGL3-
control vectors together with 40 ng of pRLTK reference vector (Promega) and 30 pmol of
miR-483-3p or Negative control 2 or AMOs or methylated control oligonucleotide. Twenty-
four hours after transfection, firefly and renilla luciferase activities were measured using the
Dual-Luciferase Report Assay (Promega). β-catenin and USF1 expression vectors were
generated cloning β-catenin cDNA and USF1 cDNA into the pIRES-Neo2 (Clontech), and
pCMV-Tag (Agilent Technologies) vectors see Table 2 for primers sequences. To test the β-
catenin nuclear activity, the pGL3-OT and pGL3-OF luciferase responsive vectors were used

Role and regulation of miR-483 in cancer Material and methods
9
43. pGL3-OT is a TCF-LEF responsive reporter, pGL3-OF is a negative control with a
mutated TCF-LEF binding site. Each transfection was repeated at least twice in triplicate. To
analyze the promoter of the miR-483 I used the pGL4 luc2 .1 (Promega) where I cloned the
SV40 enhancer downstream the luciferase gene.
Western blots analysis. HEK293, HepG2 and SW480 cell lines were transfected with 30
pmol of miR-483-3p, AMOs and controls sequences in 24-well plates. After 48 hours cells
were collected, lysed in Laemmli 2X buffer and analyzed by western blot to assess the
expression of PUMA using monoclonal antibodies (Cell Signaling, anti-PUMA antibody
#4976). Primary antibody was incubated 2 hours at room temperature and then peroxidase
conjugated anti-mouse or anti-rabbit antibodies were incubated 30 minutes at room
temperature. Detection was conducted by chemiluminescent enhanced assay (WesternBreeze
Chemiluminiscent Kit cat. WB7104, Invitrogen). β-actin antibody (Cell Signaling, β-Actin
Antibody #4967) or Ponceau staining were used to normalize protein loading. To quantify
western blot signals, digital images of autoradiographies were acquired with Fluor-S
MultiImager, and band signals were quantified in the linear range of the scanner using
specific densitometric software (Quantity One).
RNA isolation and Quantitative Real time RT-PCR (qRT-PCR). Purification of total
RNA using TRIzol reagent (Invitrogen, Carlsband, CA, USA) was carried out following the
manufacturer’s instructions. Mature microRNA expression was assayed by Taqman
MicroRNA assay (Applied Biosystem) specific for miR-483-3p (P/N: 4378094) and
normalized on RNU6B (P/N: 4373381). Five ng of total RNA was reverse transcribed using
the specific looped primer and real time quantitative PCR was conducted using the standard
Taqman MicroRNA assay protocol on a Biorad-Chromo4 thermal cycler. The 20 μL PCR
included 1.33 μL reverse transcription product, 1X Taqman Universal PCR Master Mix, No
AmpErase UNG (P/N 4324018 (Applied Biosystem), 0.2 μmol/L Taqman probe, 1.5 μmol/L
forward primer, 0.7 μmol/L reverse primer. The reaction was carried out in a 96-well PCR
plate at 95°C for 10 min followed by 40 cycle of 95° C for 15 sec and 60°C for 1 min. Each
sample was analyzed in triplicate. qRT-PCR for mRNAs was performed using 500 ng of total
RNA for each sample according to the manufacturers’ instruction (High capacity cDNA
Reverse Transcription Kit, Applied Biosystems) and the real time reaction using SYBR green
technologies (Power SYBR green PCR Master Mix, Applied Biosystems) on the Biorad-
Chromo4 instrument. The 20 μL PCR included 1 μL reverse transcription product, 1X Power
SYBR green PCR Master Mix, (P/N 4368577, Applied Biosystem), 0.4 μmol/L forward

Role and regulation of miR-483 in cancer Material and methods
10
primer, 0.4 μmol/L reverse primer. The reactions were incubated in a 96-well PCR plate at
95° C for 10 min followed by 40 cycle of 95° C for 15 sec and 60° C for 1 min. Each sample
was analyzed in triplicate. TaqMan gene expression assays was performed for IGF2,
BBC3/PUMA and CDKN1A/P21, primiR-483 genes using primers and probes
(Hs01005963_m1, Hs00248075_m1, Hs99999142_m1) obtained from Applied Biosystems
(Applied Biosystems, Foster City, CA). The expression of 18S RNA was used as endogenous
reference control. ). To avoid genomic contamination in the quantification of the IGF2 intron
2 and primiRNA-483 RNA samples were previously treated with DNAse (TURBO DNA-
free™ Kit, cat. AM1907, Ambion). The list of primers that I used herein is shown in Table 2.
The level of miRNA and mRNA were measured using Ct (threshold cycle). The amount of
target, normalized to an endogenous reference and relative to a calibrator, is given by: 2-∆∆Ct
(Comparative Ct method, Applied Biosystem User Bulletin #2).
Northern blot analysis. RNA samples (10 µg each) were electrophoresed on 15%
acrylamide and 7 mol/L urea Criterion precasted gels (Bio-Rad) and transferred onto Hybond
N+ membrane (Amersham Biosciences). Membranes were hybridized as previously describes
44 with oligonucleotide probes corresponding to the complementary sequences of the mature
miRNAs: miR-483-3p 5’-UCACUCCUCUCCUCCCGUCUU-3’ and the reference U6 RNA
5’-GCAGGGGCCATGCTAATCTTCTCTGTATCG-3’.
Cell death and cell viability assays. MTT assay was carried out on HEK293 cell line.
HEK293 was cultured in 24-well plates the day before miR-483-3p or AMOs transfection.
After 24 hours from transfection, cells were treated with doxorubicin (0.4 μg/ml) for
additional 24 hours. The assay was performed in accordance with manufacturer’s protocol
(Sigma, TOX-1). Each experiment was performed in triplicate. Nuclear fluorescein staining
based on labeling of DNA strand breaks by Terminal deoxynucleotidyl transferase (TUNEL-
reaction) was performed on HepG2 cell line according to the manufacturer’s instructions (In
situ cell death detection kit, Cat. No.11684795910, Roche). The experiment was performed in
triplicate and analyzed on microscope Zeiss Axiovert 200 at 100X magnification, images was
acquire with the CCD Cascade Photometrics 512b. Quantification of positive nuclei was
calculated by counting fluorescent spots in 10 images (10X10 magnifications) for each
experiment. Caspase 3/7 activity assay was performed on HCT116 cell line. HCT116 was
cultured in 96-well plates the day before miR-483-3p, AMOs and controls transfection. After
24 hours from transfection, cells were treated with Nutlin-3 (5 μM) or 5-Fluoruracil (from 0
Role and regulation of miR-483 in cancer Material and methods
11
to 50 μM) for additional 6/24 hours then the assay was performed in accordance with
manufacturer’s protocol (Promega, Caspase-Glo 3/7 assay, G8090).
Generation of stable cell lines over-expressing miR-483-3p and antimiR-483-3p.
HCT116 cells were infected with the PMIRH483 expression plasmid containing the full-
length miR-483-3p and the GFP gene under the control of two different promoters
(PMIRH483PA-1, System Biosciences, Mountain View, CA). HCT116 and HepG2 cells
were infected with the pSIH vector (System Biosciences, Mountain View, CA) containing the
antisense sequence for miR-483-3p (Table 1) using the Lentivector-based Anti-MicroRNAs
technology (miRZIPTM
, System Biosciences, Mountain View, CA). An empty vector was
used as control. Pre-miR-483-3p, antimiR-483-3p expression and control constructs were
packaged with pPACKH1 Lentivector Packaging Plasmid mix (System Biosciences) in 293-
TN packaging cell line. Viruses were concentrated using PEG-it™ Virus Precipitation
Solution and titers analyzed using UltraRapid Lentiviral Titer Kit (System Biosciences).
Infected cells were selected by FACS analysis (FACS Calibur, Becton Dickinson
Immunocytometry Systems). Infection efficiency >90% was verified by fluorescent
microscopy.
In vivo studies. Animal studies were approved by institutional ethical committee. HepG2
cells were transfected in vitro with 2’-O-methyl RNA oligonucleotide complemenmtary to
miR-483-3p (anti-miR oligonucleotide: AMO-483-3p), AMO-Negative control from Fidelity
Systems (Gaithersburg MD, USA) and siRNA against IGF2 gene from Thermo-Scientific
Dharmacon (Lafayette, CO, USA). At 24 h after the transfection, 107 viable cells per mouse
were injected intraperitoneally into ten Nod-Scid mice (Charles River Breeding
Laboratories). After 35 days, the mice were sacrificed, necropsies were performed, and all
tumors per mouse were weighed. For athymic “nude” mice experiments, HepG2 cells (10 ×
106 cells/200 ul) were injected subcutaneously into the flanks of nude mice 24 h after
transfection with AMO-483-3p (4 injection), AMO Negative Control (4 injection) or siRNA
IGF2 (6 injection). Tumors were counted after 20 days.
Protein isolation, immunoblot analisis and immunoprecipitation. Cells were collected
from 6-well plates using trypsin-ethylenediaminetetraacetic acid (EDTA) (Sigma) and
dissolved in lysis buffer (M-PER Mammalina Protein Extraction reagent, cat. 78501, Thermo
Scientific) freshly supplemented with a complete protease inhibitor and phosphatase inhibitor
cocktails 1 and 2 (Roche, Indianapolis, IN, USA) in accordance with manufacturer’s

Role and regulation of miR-483 in cancer Material and methods
12
procedure. Nuclear extracts were prepared dissolving cells in nuclear and cytoplasmic
extraction reagents (cat. 7833, Thermo Scientific) and following the manufacturer’s
procedure. After electrophoresis and blotting primary antibodies (Cell Signaling, anti-
CTNNB1 #9562, anti-MYC #5605; Santa Cruz, anti-USF1 sc-229) were incubated over night
at +4°C temperature and then peroxidase conjugated anti-mouse or anti-rabbit antibodies
were incubated 1 hour at room temperature. Detection was conducted by chemiluminescent
(Pierce ECL Western Blotting Substrate cat. 32106, Thermo Scientific). β-actin antibody
(Cell Signaling, β-Actin Antibody #4967) or Vinculin antibody (Millipore, cat. MAB3574)
were used to normalize protein loading. To quantify western blot signals, digital images of
autoradiographies were acquired with Fluor-S MultiImager, and band signals were quantified
in the linear range of the scanner using specific densitometric software (Quantity One).
Immunoprecipitation was carried out with 100 µg of nuclear extracts in 500µl of binding
buffer (10mM Tris, 50mM KCl, 1mM DTT; pH 7.5) with 2 µg of USF1 (Santa Cruz, sc-229)
or CTNNB1 antibody (Cell Signaling, #9562) 2 hours at +4°C with gentle rotation. The
immunoprecipitated was recovered by 25 µl of Protein A/G PLUS-Agarose (Santa Cruz, sc-
2003) over night at +4°C with gentle rotation. Then the immunoprecipitated was washed in
0.1% NP40 three times and analyzed by western blot.
Electrophoretic mobility shift assay (EMSA). Protein/DNA binding was determined by
electrophoretic mobility shift assay (EMSA) according to the manufacturer’s procedure with
biotinylated probes (Pierce, LightShift Chemiluminescent EMSA kit cat. 20148), see Table 1
for oligo sequences. Samples were incubated with Ebox wt probe or the mutant form and
with 100X Ebox wt unlabeled probe, and with specific polyclonal USF1 antibody (C-20, sc-
229, Santa Cruz), before the addition of the probe. The DNA-protein complexes were
resolved on 5% (w/v) nondenaturing acrylamide gels and visualized by exposure to
autoradiographic films.
Pull down experiment. Pull-down assay was performed by using 10nmol of recombinant
proteins GST (# ab85244, Abcam), GST-bcatenin (#ab63175, Abcam) and His-USF1
(#ab82069 Abcam). Reactions were carried out in binding buffer (150mM NaCl, 20mM Tris-
HCl pH8, 1% NP40, 1mM EDTA), 1 mM PMSF and protease inhibitors at 4°C for 1 h of
gentle rocking. The protein-protein complexes formed on the resin (Glutathione Sepharose 4
Fast Flow, Amersham or Ni-NTA Agarose, Qiagen) were brought down by centrifugation.
The resin was washed five times for 5’ at 4°C with 1 ml of cold wash buffer (250mM NaCl,
20mM Tris-HCl pH8, 1% NP40, 1mM EDTA). The protein complexes were resolved on
Role and regulation of miR-483 in cancer Material and methods
13
SDS-PAGE, immunoblotted and detection was conducted by chemiluminescent metti l’ECL
(Pierce ECL Western Blotting Substrate cat. 32106, Thermo Scientific).
DNA purification and Methylation analysis. Genomic DNA was isolated from cell lines
and tissue by standard treatment with sodium dodecyl sulfate and EDTA in the presence of
200 μg/ml of proteinase K, followed by phenol / chloroform extraction and ethanol
precipitation. The methylation status of miR promoters was determined by Bisulfite
Sequencing PCR (BSP) 45
. One microgram of genomic DNA was subjected to treatment with
the EpiTect Bisulfite Kit (Qiagen) according to the manufacturer's instructions. Specific
primers for PCR and sequencing were designed through the Methyl Primer Express v1.0
software (Applied Biosystems) (Table 1).

Role and regulation of miR-483 in cancer Material and methods
14
Table 1. Oligonucleotide sequences used for cloning, qRT-PCR, mutational analysis, site direct mutagenesis, bisulfate
sequencing and EMSA assay.
Gene Name Sequence
Gene Cloning
CTNNB1 CTNNB1_215F ATGGCTACTCAAGCTGATTTGATGG
CTNNB1 CTNNB1_2560R ACAGGTCAGTATCAAACCAGGC CTNNB1_3’UTR bCAT_2677F_Xba GttctagaTGCCACAAAAACAGGTAT CTNNB1_3’UTR bCAT_3193R_Xba GttctagaTTCAAAGCAAGCAAAGTC USF1 USF1_BamHI_F caaggatccCCCCCTCACAGAGAGATGAA USF1 USF1_EcoRI_R caagaattcGGATTAGGCTGTTGCTCCTG
BBC3/PUMA PUMA_3’UTR_F GTGGACGTCAGGGACTCG
BBC3/PUMA
miR-483
miR-483
PUMA_3’UTR_R
MIRZIP_AS_miR-483-3p_U
MIRZIP_AS_miR-483-3p_L
TTGAAAAGGAAACATACAAAAATCA
CCGAGCTCGGGATCCTCACTCCTCTCCTCCCGTCTTCTTCCTGTCAGAAAGACGGGAGGAGAGGAGTGATTTTTGAATTCGCGGCCGC
GGCGGCCGCGAATTCAAAAATCACTCCTCTCCTCCCGTCTTTCTGACAGGAAGAAGACGGGAGGAGAGGAGTGAGGATCCCGAGCTC
qRT-PCRs (SYBR green)
IGF2 IGF2_3044F TCCTCCCTGGACAATCAGAC
IGF2 IGF2_5965R AGAAGCACCAGCATCGACTT IGF2 IGF2_5965F AAGTCGATGCTGGTGCTTCT IGF2 IGF2_7866R CGGAAACAGCACTCCTCAA IGF2 IGF2_6907F GTGAAATGGGCTCACAGGAT IGF2 IGF2_7252R AGCAATGCTCAGCTGGAAG IGF2 IGF2_7846F CGTTGAGGAGTGCTGTTTCC IGF2 IGF2_8307R GGACTGCTTCCAGGTGTCAT IGF2_3’UTR IGF2-3 CTTGGACTTTGAGTCAAATTGG IGF2_3’UTR IGF2-2 CGGGGATGCATAAAGTATGAG 18S 18s_F CTGCCCTATCAACTTTCGATGGTAG 18S 18s_R CCGTTTCTCAGGCTCCCTCTC qRT-PCRs ( Applied Taqman probe)
IGF2-INS Hs01005963_m1
CTNNB1 Hs00355045_m1
MYC Hs00153408_m1
b-actin Hs00357333_g1
Pri-MiRNA hsa-mir-483 Hs03293803_pri
hsa-miR-483-5p Assay ID 002338
hsa-miR-483-3p Assay ID 002339
RNU6B Assay ID 001093
Mutational analysis
CTNNB1 BCAT3 AAAATCCAGCGTGGACAATGG
CTNNB1 BCAT2 TGTTCTTGAGTGAAGGACTGA APC APC_3361F TTTTGGACAGCAGGAATGTG APC APC_4091R TGCTGGATTTGGTTCTAGGG APC APC_4072F CCCTAGAACCAAATCCAGCA APC APC_4840R TGTTGGCATGGCAGAAATAA Axin1 Axin1_745F CAGGCCACTATGGAGGAAAA Axin1 Axin1_1583R CTCTCAGGGTTCTCCTCGTG Axin1 Axin1_1429F ATGGAGGAGGAAGGTGAGGA Axin1 Axin1_2186R AGGGACAAGGGTCTGGAGTT Site direct mutagenesis
miR-483 (promoter)_Ebox site
483_Ebox-mut_F CACCTGACACTCTTAGGTCTGGATCTTTACCACC
miR-483 (promoter)_Ebox site
483_Ebox-mut_R GGTGGTAAAGATCCAGACCTAAGAGTGTCAGGTG
CTNNB1 CTNNB1_483mut_F AACAATACAAATGGATTTTGTCGCCTCCTCAAGAAGTGAAGAATG CTNNB1 CTNNB1_483mut_R CATTCTTCACTTCTTGAGGAGGCGACAAAATCCATTTGTATTGTT
miR-483 (promoter)_CTCF_BS1
CTCF_mut1F CTCCTGCTcactggCTGATaGCAtCTGCCCTTTGGC
miR-483 (promoter)_CTCF_BS1
CTCF_mut1R cAGaTGCtATCAGccagtgAGCAGGAGCCCCATCAC
miR-483 (promoter)_CTCF_BS2
CTCF_mut2F CCTTTGGCAAGGTGGAGCCCCCAGCGACCTTCCC
miR-483 (promoter)_CTCF_BS2
CTCF_mut2R CCACCTTGCCAAAGGGCAGGTGCCATCAGCCGGA
BBC3/PUMA BBC3_mutF AGGAGTCTGAATTAGGGGAGGGATGGCCCAG
BBC3/PUMA BBC3_mutR CTCCCCTAATTCAGACTCCTCCCTCTTCCGAG
Bisulfite
Sequencing
PCR
miR-483 (promoter) 483MetF2 GGTAGGAAGTGGTATTGTAGGG
miR-483 (promoter) 483MetR2 ACCCCCACAAAAAAAACTACT
EMSA probes
miR-483 (promoter) 483_Ebox wt ACCTGACACTCACCACGTGACATCTTTACCACC
miR-483 (promoter) 483_Ebox mut ACCTGACACTCTTAGGTCTGGATCTTTACCACC
Role and regulation of miR-483 in cancer Results
15
Results
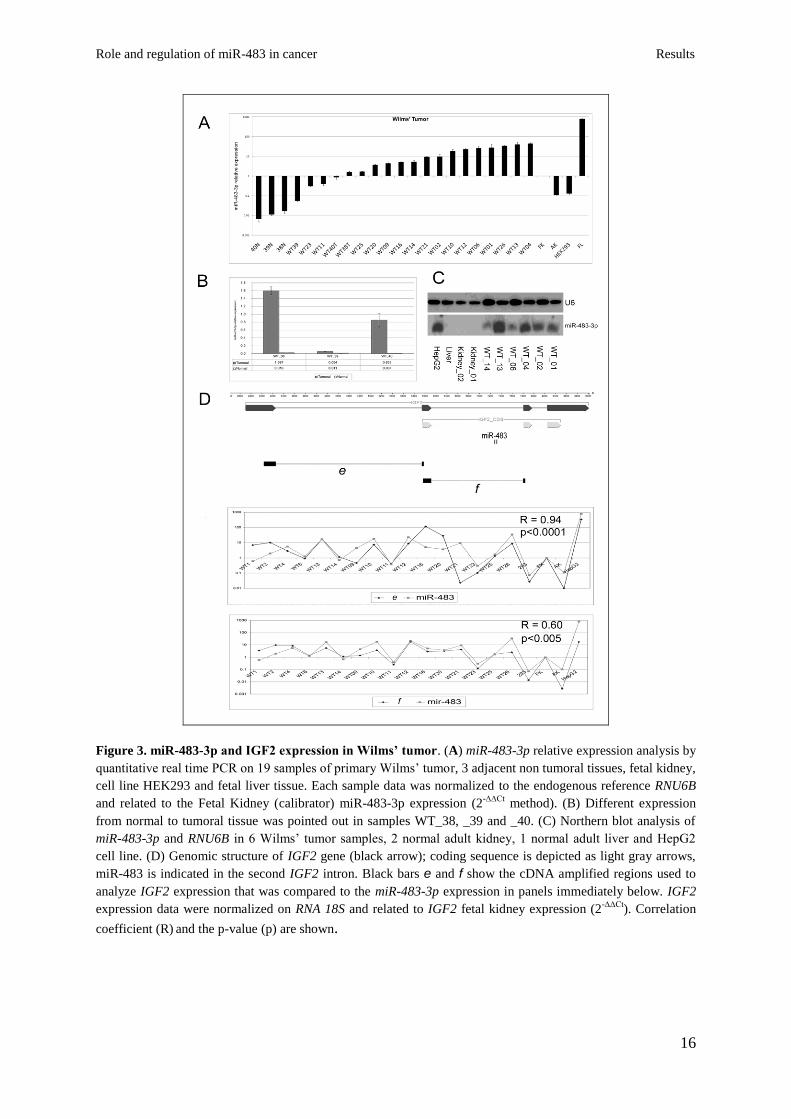
miR-483-3p is over-expressed in Wilms’ tumor and common adult human cancers in
concert with IGF2. Because of its location within the IGF2 locus, I evaluated miR-483-3p
expression in Wilms’ tumor. Biopsies from 19 Wilms’ tumors, four normal kidney tissues
(three of which matched with Wilms’ tumor samples), one fetal kidney and one fetal liver as
positive control were analyzed. Up-regulation (from 4 to 40-fold) of miRNA expression was
found in 73% of Wilms’ tumors when compared with fetal kidney and in 100% of the cases
when compared to non-tumoral kidney tissues (Fig. 3A-B). Northern blot analysis confirmed
the qRT-PCR data (Fig. 3C).
Since mir-483-3p is located within the IGF2 gene, I compared their levels of expression: a
positive correlation between IGF2 messenger RNA and miR-483-3p expression was found.
By using two sets of primers spanning the junctions between exons 1-2 or 2-3 of the IGF2
cDNA sequence I found strong positive coefficients of correlation with miR-483-3p in both
cases (R=0.94, p<0.0001 for product E, and R=0.60, p=0.004 for product F) (Fig. 3D). These
results indicate that the joint over-expression of at least two functional elements from the
IGF2 locus, the IGF2 protein and miR-483-3p, may act in Wilms’ tumors to promote
tumorigenesis.
I investigated the potential involvement of miR-483-3p in common human neoplasms. I
analyzed the expression of miR-483-3p in breast, colon and liver human cancers and I found
that over-expression of miR-483-3p was indeed present, suggesting a wider involvement of
this miRNA in human tumorigenesis. In primary colon, breast and liver carcinomas (Fig. 4A-
C), I compared the expression of miR-483-3p of tumors with the average expression of non-
tumor histological normal tissues. Considering the variability of miR-483-3p expression in
non-tumor counterparts, only tumors exhibiting a fold-change > 10 in comparison with the
average expression of non-tumor normal tissues were scored as over-expressed: 33% of
HCCs, 31% of breast and 27% of colorectal cancers exhibited significant up-regulation.
Interestingly, cirrhotic liver tissues, a condition that predisposes to HCC, already exhibited an
increased miR-483-3p expression (from 3 to 14-fold) when compared to normal liver tissues
(p-value < 0.05) (Fig. 4A).
I observed that, as in Wilms’ tumors, the up-regulation of miR-483-3p was linked with IGF2
expression: a positive Spearman coefficient of correlation of 0.69 for HCCs (p-value
<0.0001) and 0.86 for CRCs (p-value <0.0001) (Fig. 4A-B).
Role and regulation of miR-483 in cancer Results
16
Figure 3. miR-483-3p and IGF2 expression in Wilms’ tumor. (A) miR-483-3p relative expression analysis by
quantitative real time PCR on 19 samples of primary Wilms’ tumor, 3 adjacent non tumoral tissues, fetal kidney,
cell line HEK293 and fetal liver tissue. Each sample data was normalized to the endogenous reference RNU6B
and related to the Fetal Kidney (calibrator) miR-483-3p expression (2-∆∆Ct
method). (B) Different expression
from normal to tumoral tissue was pointed out in samples WT_38, _39 and _40. (C) Northern blot analysis of
miR-483-3p and RNU6B in 6 Wilms’ tumor samples, 2 normal adult kidney, 1 normal adult liver and HepG2
cell line. (D) Genomic structure of IGF2 gene (black arrow); coding sequence is depicted as light gray arrows,
miR-483 is indicated in the second IGF2 intron. Black bars e and f show the cDNA amplified regions used to
analyze IGF2 expression that was compared to the miR-483-3p expression in panels immediately below. IGF2
expression data were normalized on RNA 18S and related to IGF2 fetal kidney expression (2-∆∆Ct
). Correlation
coefficient (R) and the p-value (p) are shown.

Role and regulation of miR-483 in cancer Results
17
In spite of these significant positive correlations, some tumor samples (HCC_02, HCC_04,
HCC_10, HCC_13, HCC_16, HCC_21, HCC_26, HCC_29, CRC_188, CRC_130,
CRC_148) exhibited a divergent expression of IGF2 and miR-483-3p, suggesting the
existence of multiple mechanisms of miR-483-3p regulation.
Figure 4. miR-483-3p and IGF2 expression in adult human cancers. miR-483-3p relative expression by
quantitative real time RT-PCR. The expression of miR-483-3p was normalized to the endogenous gene RNU6B
(black bars) while the expression of IGF2 was normalized in 18S RNA (gray bars). Expression data were related
to the average expression of normal samples of each tissue (2-∆∆Ct
method). Expression of the locus IGF2/miR-
483-3p was investigated in (A) 27 HCCs and 7 non tumoral cirrhotic livers (CE), which were related to 2
normal liver tissue samples, the positive correlation between IGF2 and miR-483-3p is indicated (R= 0.69,
p<0.0001); (B) 22 colorectal cancer samples were related to 5 normal colon mucosa tissues, the positive
correlation between IGF2 and miR-483-3p is indicated (R= 0.86, p<0.0001); (C) 19 breast cancer and 4 normal
breast tissues samples were tested for the expression of miR-483-3p.

Role and regulation of miR-483 in cancer Results
18
miR-483-3p protects cells from apoptosis. To start unravelling the molecular basis of the
potential oncogenic role of miR-483-3p, I focused on the apoptosis pathway because
important pro-apoptotic human genes are predicted target by miRanda and TargetScan
algorithms (BBC3/PUMA, AMID, BAX, BIK, SMAC/DIABLO, PDCD1, PDCD7). Thus, I
evaluated apoptosis and cell viability in response to modulation of miR-483-3p in HEK293,
HCT116 and HepG2 cells.
After treatment of HEK293 cells with doxorubicin to induce apoptotic cell death, transfection
of miR-483-3p induced a low (10%) but significant increase in cell viability (p-value = 0.05),
whereas transfection of anti-miR-483-3p AMOs induced a further 15% decrease in cell
viability (p-value = 0.02) (Fig. 5A). These results indicate that miR-483-3p could promote
cell survival.
HepG2 cells express very high level of miR-483-3p. Therefore, I evaluated only the effect of
anti-miR-483-3p AMO in this cell line. Cell growth was 30 to 40% inhibited by transfection
of anti-miR-483-3p AMO (Fig. 5B). Simultaneously, cells exhibited a 2.6 fold increase in the
level of cell death than control cells transfected with a negative control AMO (p-value =
0.016) (Fig. 5C), as detected by in situ cell death using fluorescent labelling of DNA strand
breaks with TdT (Terminal deoxynucleotidyl transferase).
To confirm that the mechanism was indeed apoptosis, caspase 3/7 activity was measured in
HCT116 cells transfected with miR-483-3p or anti-miR-483-3p and treated with the apoptotic
inducing factor Nutlin-3A. Compared to the controls, caspase activity exhibited an 80%
increase in antimiR treated cells and a 60% decrease in miR-483-3p treated cells (Fig. 5D);
moreover, I detected an inverse correlation between the amount of transfected miR-483-3p
and caspase 3/7 activity, whereas a proportional increase was detected between AMO-483-3p
and caspase 3/7 activity.

Role and regulation of miR-483 in cancer Results
19
Figure 5. AMO-483-3p induces cell death. (A) Cell
viability measured by the MTT assay in HEK293 cells.
Each value represents the average absorbance ± standard
deviation from three different experiments. The differences
between miR-483-3p versus Negative Control 2 (p=0.002),
and AMO_miR-483-3p versus AMO Negative Control
(p=0.03) were both statistically significant. (B) Cell
viability of HepG2 cells at 48 hours following transfection
of AMO-miR-483-3p or AMO Negative Control. Each
value represents average ± standard deviation from three
different experiments (p=0.02 on AMO_miR-483-3p
versus AMO Negative Control) and related to control data.
(C) TUNEL staining of HepG2 cells after transfection of
AMO-Negative Control or AMO miR-483-3p. Cells were
stained 24 hours after transfection. Underneath the images,
the average number of fluorescent spots is shown: data in
each column represent the average ± standard deviation of
fluorescent spots from three independent fields
(p=0.0162). (D) Caspase 3/7 activity in HCT116 cells
transfected with miR-483-3p, anti-miR-483-3p AMO or
Negative controls; after 24 hours, cells were treated with
Nutlin-3 (5µM) for additional 6 hours.
PUMA is targets of miR-483-3p. In the list of potential pro-apoptotic target genes,
BBC3/PUMA (BCL2 binding component 3 / p53 upregulated modulator of apoptosis) gene
was chosen for further analysis because of its known pivotal role in induced cell death 46
.
To test the direct interaction of miR-483-3p with 3’UTRs, the predicted wild type and mutant
miR-483-3p target sites of PUMA mRNA gene was cloned downstream of the luciferase
reporter gene of pGL3-Control vector. The HEK293 cells were used as biological system
because they exhibit a low expression of miR-483-3p, HCT116 cells have a medium
expression whereas the HepG2 cells exhibit a high expression of miR-483-3p (Fig. 6).

Role and regulation of miR-483 in cancer Results
20
Figure 6. miR-483-3p relative expression analysis by quantitative real time PCR on 14 cell lines. Each sample
data was normalized on the RNU6B (∆Ct method) and related to the HEK293 miR-483-3p expression (∆∆Ct
method).
Dependently the miR-483-3p expression the miR-483-3p responsive vector was co-
transfected with miR-483-3p into HEK293, either miR-483-3p or antimiR-483-3p
oligonucleotide (anti-483-3p AMO) into HCT116 cells and only antimiR-483-3p into HepG2
cells (Fig. 7A). In comparison with control vector, miR-483-3p induced a decrease in
luciferase activity of about 38% (HEK293) and 45% (HCT116) of the pGL3 vector carrying
the PUMA-3’UTR, whereas in the mutated 3’UTR clone the luciferase activity was not
significantly down-regulated by miR-483-3p. Conversely, the use of anti-miR-483-3p AMOs
induced an increase in luciferase activity of about 70% and 39% for HCT116 and HepG2
cells, respectively (Fig. 7B).
To further confirm PUMA as target of miR-483-3p, its protein level was assessed by western
blot analysis on HEK293 and HepG2 cells transfected with miR-483-3p or antimiR-483-3p
respectively. Protein expression was reduced (70%) in HEK293 and induced (40%) in HepG2
cells when compared to the controls (Fig. 7C).
The analysis of two matched Wilms’ tumors / normal kidney samples for the expression of
PUMA protein revealed that, as predicted by the molecular function of miR-483-3p, the level
of expression of these two pro-apoptotic proteins was significantly lower in tumors, where
miR-483-3p is expressed at higher level (Fig. 7D).
To further support these data I generated stable cell lines over-expressing the miR-483-3p or
the antimiR-483-3p to evaluate the expression of BBC3/PUMA after treatment with 5-
Fluorouracil (5FU) as an apoptosis inductor factor that involve the P53 pathway. The
HCT116

Role and regulation of miR-483 in cancer Results
21
Figure 7. BBC3/PUMA is target
of miR-483-3p. (A) Putative
binding site of miR-483-3p in
PUMA 3’UTRs (miRBase Target
Database). Asterisks show
nucleotides substituted in miR-
483-3p predicted target site to
perform luciferase assay
(GGAGT>AATTA). (B) PUMA
3’UTRs regulates luciferase
activity dependent on miR-483-3p
in HEK293, HCT116 and HepG2
cell lines (WT, wild type; MUT,
mutant; p, p-value). Firefly
luciferase activity was normalized
on Renilla luciferase activity of
the cotransfected pRL-TK vector.
(C) Western blot analysis of
PUMA after miR-483-3p
transfection in HEK293 and
HepG2 cell line, the (23 KDa)
and (18 KDa) isoforms are
indicated. Cells were collected
after 48 hours after miRNA
transfection. (D) Western blot
analysis of PUMA in Wilms’
tumor samples (T) and matched
normal tissues (N).
cells were infected with lentiviral vectors over-expressing miR-483-3p (LV-483) or antimiR-
483-3p (LV-AS483), whereas the HepG2 cell line was infected with LV-AS483. An empty
vector as control was used (LV-CTRL). The increased concentrations of 5FU match with the
increased PUMA protein levels only in the HCT116 and HepG2 cells over-expressing the
antimiR-483-3p (Fig. 8A), in spite of a homogeneous increment of BBC3/PUMA mRNA
levels (Fig. 9A) in all stable cell lines. The induction of both BBC3/PUMA and
CDKN1A/p21 mRNA levels by 5FU treatment suggest the activation of P53 pathway (Fig.
9A-B).
To assess the physiologic role of this finding, the caspase 3/7 activity of these stable cell lines
was measured after 5FU treatment. Compared to controls the HCT116-LV-483 cells showed
a reduced caspase 3/7 activity (24- 40%, p<0.0001) (Fig. 8B) whereas the HCT116-LV-
AS483 exhibited an increased activity (4 to 28%, p: 0.03). As expected also in HepG2-LV-
AS483 cells the caspase activity was increased (21 to 70%, p<0.0001) (Fig. 8B). To further
prove the connection between miR-483-3p, PUMA and apoptosis, I proved that by knocking

Role and regulation of miR-483 in cancer Results
22
down PUMA by siRNA transfection, I could prevent the AS483-3p effect in HepG2-LV-
AS483 cells (Fig. 8C). I used the HepG2 stable cell lines because the efficacy of the anti-
miR-483-3p is more evident than the HCT116 model (Fig.8B).
Figure 8. Stable cell lines over-expressing antimiR-483-3p are more sensitive to apoptosis stimuli.
HCT116 cells over-expressing the miR-483-3p (LV-483) or the antimiR-483-3p (LV-AS483) and HepG2 cells
over-expressing the antimiR-483-3p were treated with different concentration of 5-Fluorouracil. LV-CTRL
indicates stable cell line with the empty vector. (A) Western blot analysis reveals an increment of PUMA
protein levels only in the cells LV-AS483. (B) Caspase 3/7 activity was decreased in LV-483 cells and increased
in LV-AS483 when compared with LV-CTRL cells. Data were normalized on LV-CTRL cells. (C) Relative
caspase 3/7 activity in HepG2-LV-CTRL and LV-AS483 after treatment with 5FU and siPUMA (+) or siRNA
scramble (-).Data were normalized on average of caspase activity of HepG2-LV-CTRL cells.

Role and regulation of miR-483 in cancer Results
23
Figure 9 CDKN1A/P21 RNA
induction in stable cell lines
after 5-Fluorouracil
treatment. qRT-PCR analysis
of CDKN1A/P21 expression
was normalized on 18S RNA.
AMO-miR-483-3p but not IGF2 siRNA can inhibit in vivo tumorigenicity. The potential
oncogenic role of miR-483-3p was directly tested through tumorigenicity modulation of the
human HepG2 cells, which over-expresses miR-483-3p. Twenty-four hours after transfection
of AMO-483-3p or siRNA anti-IGF2 into HepG2 cells, a qRT-PCR confirmed the specific
reduction of miR-483-3p or IGF2 mRNA, respectively (Fig. 10A). Then, 10×106 cells (cell
viability greater than 97%) were intra-peritoneally injected into Nod-Scid mice. Mice were
sacrificed on day 35 and all tumors for each mouse weighed. AMO-483-3p mouse group
showed a significant reduction of number and weight of induced tumors compared to controls
(p-value <0.05). On the contrary, repression of the IGF2 gene did not show any difference
from controls (p-value >0.5) (Fig. 10B-C). The three groups of data (CTRL, AMO-483-3p,
siIGF2) are comparable because of the same nature of the molecules used to silence the miR-
483-3p and IGF2 gene (2’-O-methyl RNA oligonucleotide).

Role and regulation of miR-483 in cancer Results
24
Figure 10. AMO-483-3p reduces tumors induced by HepG2 cells in vivo. (A) A qRT-PCR analysis to verify
reduction of miR-483-3p and IGF2 mRNA after transfection of AMO-483-3p or siRNA anti-IGF2 in HepG2
cells. (B) Tumors of each mouse were weighed: a significant difference (p<0.05) in tumor weights was found
between AMO-483-3p and AMO Negative control transfected (CTRL) cells, between siRNA IGF2 and AMO-
483-3p (p<0.02) but not between siRNA IGF2 and AMO-CTRL transfected HepG2 cells (p>0.5). (C)
Appearance of intraperitoneal HepG2 induced tumors in Nod-Scid mice: the white arrows indicate tumor
formations.
miR-483-3p expression correlates with the mutational status of Wnt/-catenin genes in
hepatocarcinoma (HCC). The Wnt/-catenin pathway is one of the most important
pathways dysregulated in hepatocarcinoma (HCC), colorectal cancer (CRC) and Wilms’
tumor 47-49
. Since I previously found that miR-483-3p is up regulated in these cancers as well,
I investigated the possible involvement of Wnt/-catenin in miR-483-3p dysregulation. Since
miR-483-3p is located within intron 2 of the IGF2 gene I previously found a positive
correlation between IGF2 and miR-483-3p expression in HCC (R=0.69, p<0.0001), CRC
tumor samples from HCC that have a low coefficient of correlation, exhibited a divergent
expression of IGF2 and

Role and regulation of miR-483 in cancer Results
25
Table 2. Mutational status of Wnt/β-catenin genes is associated to miR-483-3p expression. 24 HCC samples
analyzed for IGF2, miR-483-3p expression and for the mutational status of CTNNB1 exon 3, APC and Axin genes.
Sample miR-483-3p relative
expression
IGF2 relative expression
Ratio 483/IGF2 CTNNB1 ex 3 status APC status (NM000038 from nt 3361 to 4840)
Axin 1 status (NM003502 from nt 745 to
2186)
HCC_01 0.02 0.03 0.9 0 0 0
HCC_02 0.09 1.55 0.1 GAC->TAC_Asp32->Tyr 0 NC
HCC_03 0.15 0.04 3.8 0 0 0
HCC_04 0.16 12.47 0.0 0 0 0
HCC_05 0.21 0.17 1.3 0 NC NC
HCC_10 1.12 0.14 7.7** 0 0 NC
HCC_12 1.32 0.67 2.0 NC 0 NC
HCC_13 1.44 0.12 11.7** 0 0 0
HCC_14 2.20 17.90 0.1 0 0 0
HCC_16 2.92 0.22 13.3* 0 0 NC
HCC_17 3.47 3.58 1.0 0 0 0
HCC_18 3.54 3.18 1.1 0 0 0
HCC_20 4.47 18.02 0.2 NC NC NC
HCC_21 6.63 0.94 7.0** 0 del 3719-3740 0
HCC_22 9.55 4.15 2.3 0 0 0
HCC_23 11.63* 10.89 1.1 TCT->CCT_Ser37->Pro 0 0
HCC_25 15.73* 3.01 5.2** TCT->TAT_Ser37->Tyr 0 0
HCC_26 24.98* 0.32 77.1** CAT->CCT_His36->Pro 0 0
HCC_28 55.52* 17.62 3.2 0 0 0
HCC_29 66.03* 1.26 52.3** 0 0 del 1024-1027nt
HCC_30 69.23* 12.29 5.6** GAC->GGC_Asp32->Gly 0 0
HCC_31 116.16* 11.78 9.9** 0 0 0
HCC_33 374.10* 1050.30 0.4 0 0 NC
HCC_34 388.40* 63.37 6.1** 0 NC CCT->ACT_Pro486->Thr
NC; not classified
0; not mutated
* miR-483-3p expression values greater than the considered cut-off (10)
**miR-483-3p/IGF2 expression ratio values greater than the considered cut-off (5)

Role and regulation of miR-483 in cancer Results
26
miR-483-3p suggesting alternative mechanisms regulating these two genes. I analyzed the
mutational status of APC, CTNNB1 and Axin1 in 24 HCC samples in which miR-483-3p and
IGF2 expression had already been assessed 40
. Mutations in these three genes were previously
proposed as a major cause of activation of the Wnt/-catenin pathway in cancer 50
51
28
. With
a miR-483-3p expression cut-off level of 10-fold over the average expression of the controls,
I detected an association between miR-483-3p up regulation and mutational status of these
genes (p=0.053; Fisher's Exact Test) (Tab. 2), whereas no association between IGF2
expression and the Wnt/-catenin mutational status was found (expression cut off = 10, p >
0.5; Fisher's Exact Test). These data suggest that -catenin may be involved in the regulation
of miR-483-3p separately from IGF2. To prove this point I calculated the ratio between miR-
483-3p and IGF2 expression levels (median value =1.3) to identify samples in which they
were divergent (Tab. 2). A strong association between the miR-483-3p/IGF2 ratio and the
mutational status of the Wnt/-catenin genes was observed when the ratio is greater than 5
(p=0.015; Fisher's Exact Test). Overall these data strongly suggest that expression of miR-
483-3p, but not that of IGF2, is associated with the mutational status of the Wnt/-catenin
pathway.
The miR-483 locus is regulated by -catenin. Since -catenin is the principal
transcriptional mediator of the Wnt/-catenin pathway, I investigated its involvement in the
regulation of the IGF2/miR-483 locus. I cloned the coding sequence of the -catenin gene
into the expression vector pIRES-Neo2, and tested its expression (Fig 11A top panel) and
ability to activate the luciferase reporter vector pGL3-OT containing the -catenin/TCF
responsive element (Fig.S1) 52
. pGL3-OF, which carries a mutated -catenin/TCF binding
site, was used as a negative control. Then I assessed the expression level of miR-483-3p in
response to -catenin over-expression in HEK 293 cells. A significant increase in miR-483-
3p expression was detected in cells transfected with pIRES-Neo2-catenin vector compared
to cells transfected with the empty vector pIRES-Neo2 (Fig. 11A). To confirm these results, I
transiently knocked-down -catenin by using short interfering RNA technology (siRNA) in
HCT116 cells that exhibits a higher catenin nuclear activity, and miR-483-3p expression,
compared to HEK293 cells. qRT-PCR verified the decrease of -catenin mRNA after siRNA
treatment (Fig.S1B), and a significant reduction of miR-483-3p expression was detected only
in cells transfected with -catenin siRNA (Fig.12B).
Role and regulation of miR-483 in cancer Results
27
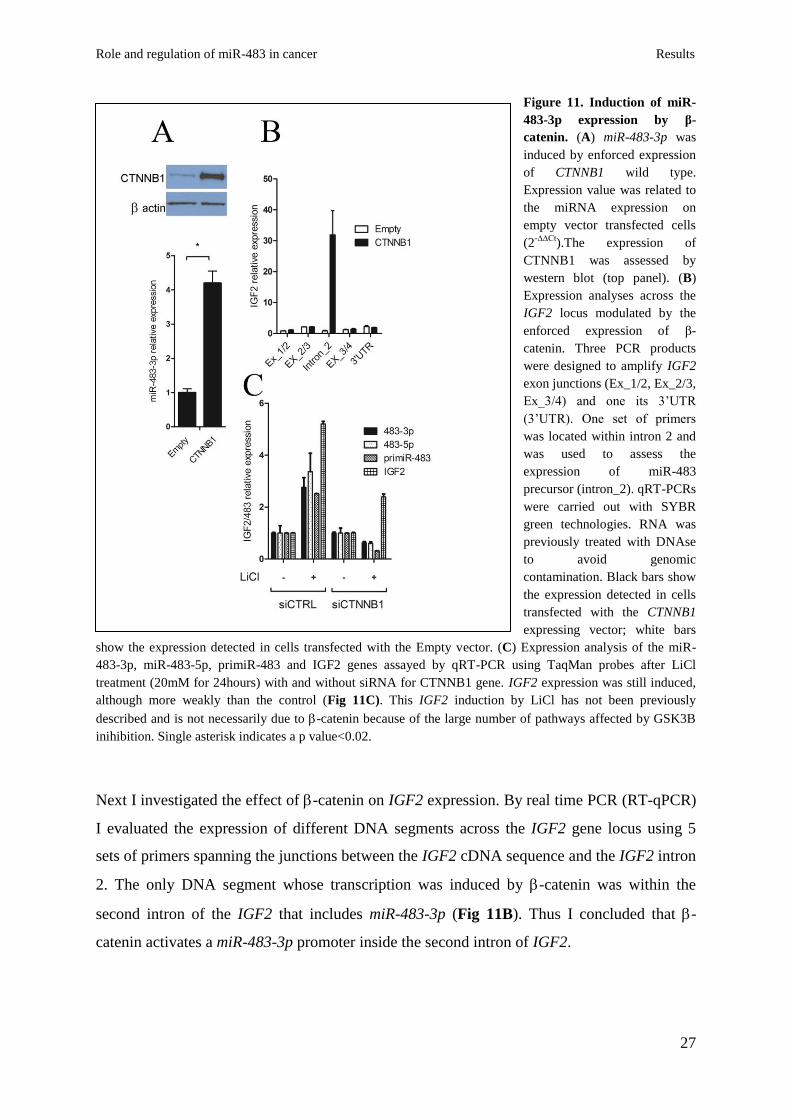
Figure 11. Induction of miR-
483-3p expression by β-
catenin. (A) miR-483-3p was
induced by enforced expression
of CTNNB1 wild type.
Expression value was related to
the miRNA expression on
empty vector transfected cells
(2-∆∆Ct
).The expression of
CTNNB1 was assessed by
western blot (top panel). (B)
Expression analyses across the
IGF2 locus modulated by the
enforced expression of β-
catenin. Three PCR products
were designed to amplify IGF2
exon junctions (Ex_1/2, Ex_2/3,
Ex_3/4) and one its 3’UTR
(3’UTR). One set of primers
was located within intron 2 and
was used to assess the
expression of miR-483
precursor (intron_2). qRT-PCRs
were carried out with SYBR
green technologies. RNA was
previously treated with DNAse
to avoid genomic
contamination. Black bars show
the expression detected in cells
transfected with the CTNNB1
expressing vector; white bars
show the expression detected in cells transfected with the Empty vector. (C) Expression analysis of the miR-
483-3p, miR-483-5p, primiR-483 and IGF2 genes assayed by qRT-PCR using TaqMan probes after LiCl
treatment (20mM for 24hours) with and without siRNA for CTNNB1 gene. IGF2 expression was still induced,
although more weakly than the control (Fig 11C). This IGF2 induction by LiCl has not been previously
described and is not necessarily due to -catenin because of the large number of pathways affected by GSK3B
inihibition. Single asterisk indicates a p value<0.02.
Next I investigated the effect of -catenin on IGF2 expression. By real time PCR (RT-qPCR)
I evaluated the expression of different DNA segments across the IGF2 gene locus using 5
sets of primers spanning the junctions between the IGF2 cDNA sequence and the IGF2 intron
2. The only DNA segment whose transcription was induced by -catenin was within the
second intron of the IGF2 that includes miR-483-3p (Fig 11B). Thus I concluded that -
catenin activates a miR-483-3p promoter inside the second intron of IGF2.
Role and regulation of miR-483 in cancer Results
28
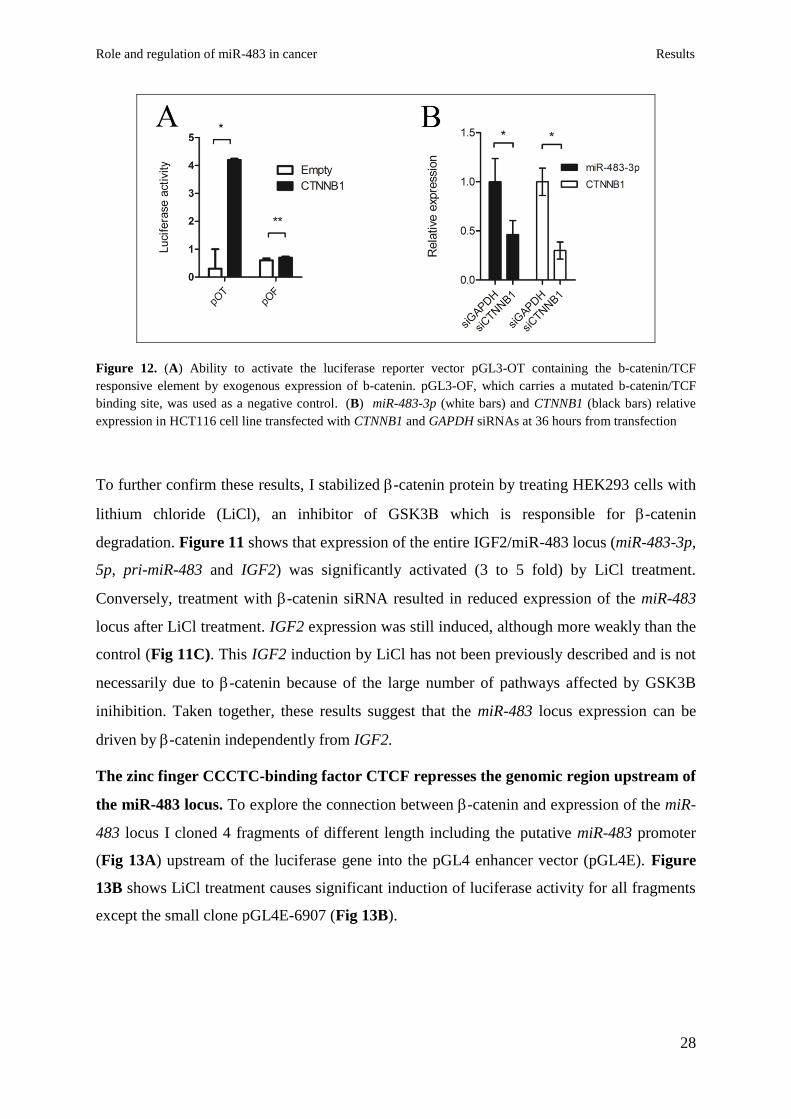
Figure 12. (A) Ability to activate the luciferase reporter vector pGL3-OT containing the b-catenin/TCF
responsive element by exogenous expression of b-catenin. pGL3-OF, which carries a mutated b-catenin/TCF
binding site, was used as a negative control. (B) miR-483-3p (white bars) and CTNNB1 (black bars) relative
expression in HCT116 cell line transfected with CTNNB1 and GAPDH siRNAs at 36 hours from transfection
To further confirm these results, I stabilized -catenin protein by treating HEK293 cells with
lithium chloride (LiCl), an inhibitor of GSK3 which is responsible for -catenin
degradation. Figure 11 shows that expression of the entire IGF2/miR-483 locus (miR-483-3p,
5p, pri-miR-483 and IGF2) was significantly activated (3 to 5 fold) by LiCl treatment.
Conversely, treatment with -catenin siRNA resulted in reduced expression of the miR-483
locus after LiCl treatment. IGF2 expression was still induced, although more weakly than the
control (Fig 11C). This IGF2 induction by LiCl has not been previously described and is not
necessarily due to -catenin because of the large number of pathways affected by GSK3B
inihibition. Taken together, these results suggest that the miR-483 locus expression can be
driven by -catenin independently from IGF2.
The zinc finger CCCTC-binding factor CTCF represses the genomic region upstream of
the miR-483 locus. To explore the connection between -catenin and expression of the miR-
483 locus I cloned 4 fragments of different length including the putative miR-483 promoter
(Fig 13A) upstream of the luciferase gene into the pGL4 enhancer vector (pGL4E). Figure
13B shows LiCl treatment causes significant induction of luciferase activity for all fragments
except the small clone pGL4E-6907 (Fig 13B).
Role and regulation of miR-483 in cancer Results
29
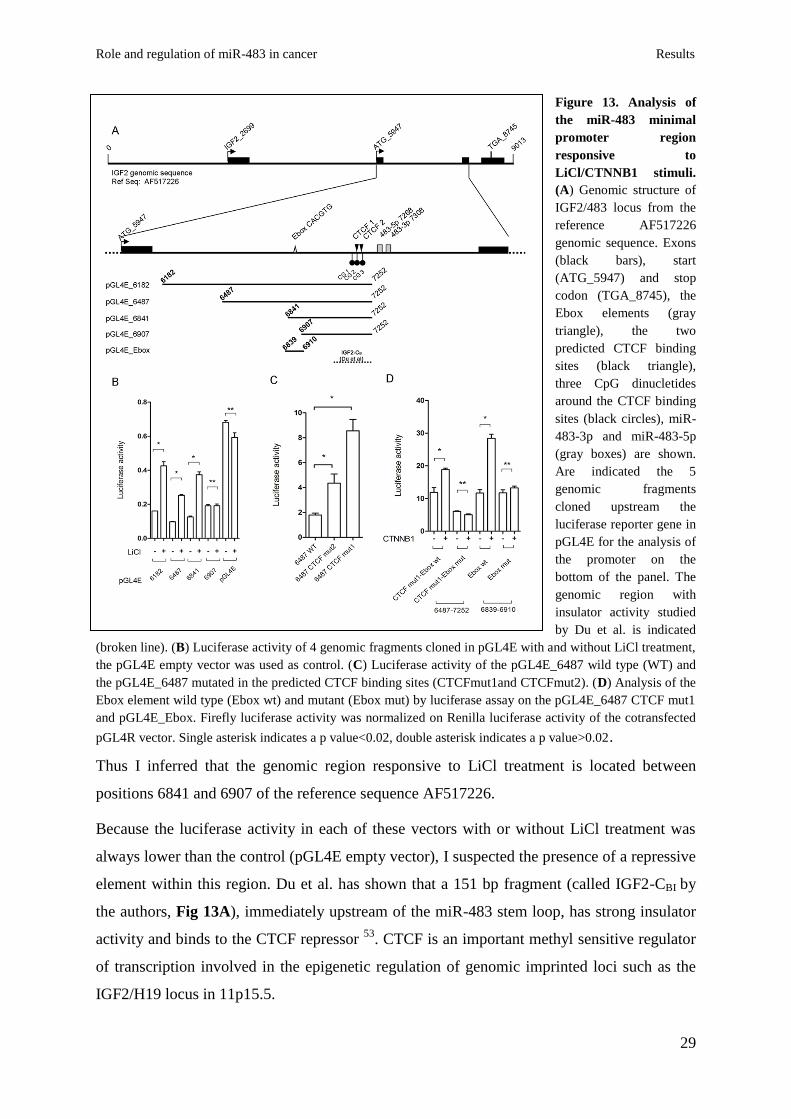
Figure 13. Analysis of
the miR-483 minimal
promoter region
responsive to
LiCl/CTNNB1 stimuli.
(A) Genomic structure of
IGF2/483 locus from the
reference AF517226
genomic sequence. Exons
(black bars), start
(ATG_5947) and stop
codon (TGA_8745), the
Ebox elements (gray
triangle), the two
predicted CTCF binding
sites (black triangle),
three CpG dinucletides
around the CTCF binding
sites (black circles), miR-
483-3p and miR-483-5p
(gray boxes) are shown.
Are indicated the 5
genomic fragments
cloned upstream the
luciferase reporter gene in
pGL4E for the analysis of
the promoter on the
bottom of the panel. The
genomic region with
insulator activity studied
by Du et al. is indicated
(broken line). (B) Luciferase activity of 4 genomic fragments cloned in pGL4E with and without LiCl treatment,
the pGL4E empty vector was used as control. (C) Luciferase activity of the pGL4E_6487 wild type (WT) and
the pGL4E_6487 mutated in the predicted CTCF binding sites (CTCFmut1and CTCFmut2). (D) Analysis of the
Ebox element wild type (Ebox wt) and mutant (Ebox mut) by luciferase assay on the pGL4E_6487 CTCF mut1
and pGL4E_Ebox. Firefly luciferase activity was normalized on Renilla luciferase activity of the cotransfected
pGL4R vector. Single asterisk indicates a p value<0.02, double asterisk indicates a p value>0.02.
Thus I inferred that the genomic region responsive to LiCl treatment is located between
positions 6841 and 6907 of the reference sequence AF517226.
Because the luciferase activity in each of these vectors with or without LiCl treatment was
always lower than the control (pGL4E empty vector), I suspected the presence of a repressive
element within this region. Du et al. has shown that a 151 bp fragment (called IGF2-CBI by
the authors, Fig 13A), immediately upstream of the miR-483 stem loop, has strong insulator
activity and binds to the CTCF repressor 53
. CTCF is an important methyl sensitive regulator
of transcription involved in the epigenetic regulation of genomic imprinted loci such as the
IGF2/H19 locus in 11p15.5.

Role and regulation of miR-483 in cancer Results
30
Table 3. Methylation status of the 3 CpG dinucleotides close to the CTCF binding site
Cell line miR-483-3p relative
expression
Methylation status CpG 1
(%)
Methylation status CpG 2
(%)
Methylation status CpG
3 (%)
H460 0.015 0 50 0
SNU 423 0.022 0 50 0
PLC/PRF/5 0.029 0 0 0
SNU 449 0.042 0 50 50
MDA MB231 0.23 75 100 50
K562 0.639 25 50 nc
SW 480 0.697 0 0 nc
SNU 387 0.759 25 50 nc
SKHEP 1 0.789 0 0 0
HEK293 1 50 100 100
MCF7 3.543 75 100 100
HEPG2 23.87 100 100 100
HUH 7 44.985 100 100 100
HEPG2-C3A 51.464 75 100 100
CTCF binds DNA elements called insulators which set limits on the action of enhancer or
silencer elements permitting to the genome to be organized in functional regulatory domains
54. It is involved in Wilms’ tumor
16 55
56
, breast cancer 57
58
and prostate cancer 59
. I decided
to determine if CTCF is also involved in the repression of the IGF2/mir-483 genomic regions
I cloned. Using bioinformatics tools (http://insulatordb.uthsc.edu) I identified two possible
CTCF binding sites (CTCF BS_1, CTCF BS_2) (Fig 13A). By transfecting the pGL4 vectors
with mutated versions of either CTCF BS_2 or CTCF BS_1 to prevent CTCF binding, I
observed a 2 or 4 fold increase of the luciferase activity compared to the wild type control
(Fig 13C). Since the CTCF repressor only binds demethylated DNA, I analyzed the
methylation status of 3 CpG dinucleotides close to the CTCF binding sites in a set of 14 cell
lines. I found a significant positive correlation between the methylation level of the first CpG
(CG_1, Fig 13A) and miR-483-3p expression (R=0.682, p=0.007), whereas the correlation
with each of the other 2 CpGs was less significant (Tab 3). These data indicate that CTCF is
an important regulator of the miR-483 locus and this regulation is likely affected by DNA
methylation.
The transcription factor USF1 serves as a mediator between -catenin and the miR-483
locus. The minimal genomic region responsive to LiCl treatment (between nucleotides 6841
and 6907) contains an E-box motif (CACGTG) that could bind the basic Helix-Loop-Helix
(bHLH) protein family. One of these bHLH proteins is the MYC transcription factor, a well
known target of the Wnt/-catenin pathway, therefore it is reasonable to speculate that MYC
Role and regulation of miR-483 in cancer Results
31
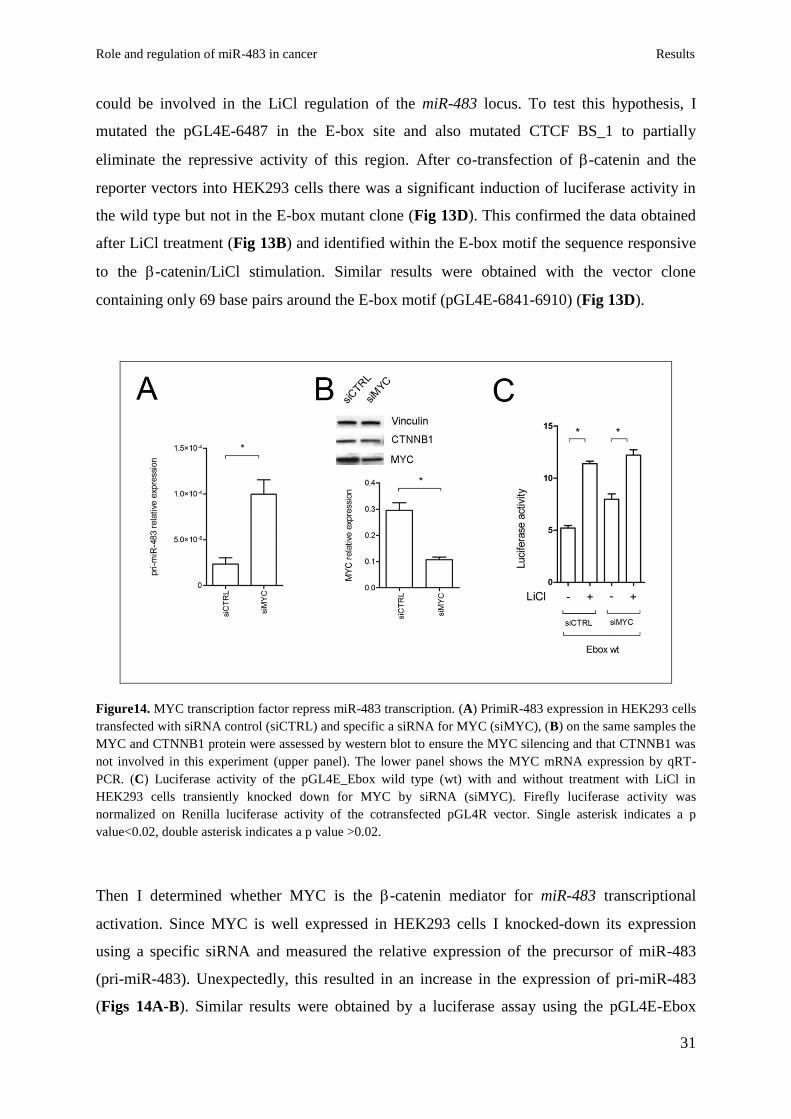
could be involved in the LiCl regulation of the miR-483 locus. To test this hypothesis, I
mutated the pGL4E-6487 in the E-box site and also mutated CTCF BS_1 to partially
eliminate the repressive activity of this region. After co-transfection of -catenin and the
reporter vectors into HEK293 cells there was a significant induction of luciferase activity in
the wild type but not in the E-box mutant clone (Fig 13D). This confirmed the data obtained
after LiCl treatment (Fig 13B) and identified within the E-box motif the sequence responsive
to the -catenin/LiCl stimulation. Similar results were obtained with the vector clone
containing only 69 base pairs around the E-box motif (pGL4E-6841-6910) (Fig 13D).
Figure14. MYC transcription factor repress miR-483 transcription. (A) PrimiR-483 expression in HEK293 cells
transfected with siRNA control (siCTRL) and specific a siRNA for MYC (siMYC), (B) on the same samples the
MYC and CTNNB1 protein were assessed by western blot to ensure the MYC silencing and that CTNNB1 was
not involved in this experiment (upper panel). The lower panel shows the MYC mRNA expression by qRT-
PCR. (C) Luciferase activity of the pGL4E_Ebox wild type (wt) with and without treatment with LiCl in
HEK293 cells transiently knocked down for MYC by siRNA (siMYC). Firefly luciferase activity was
normalized on Renilla luciferase activity of the cotransfected pGL4R vector. Single asterisk indicates a p
value<0.02, double asterisk indicates a p value >0.02.
Then I determined whether MYC is the -catenin mediator for miR-483 transcriptional
activation. Since MYC is well expressed in HEK293 cells I knocked-down its expression
using a specific siRNA and measured the relative expression of the precursor of miR-483
(pri-miR-483). Unexpectedly, this resulted in an increase in the expression of pri-miR-483
(Figs 14A-B). Similar results were obtained by a luciferase assay using the pGL4E-Ebox

Role and regulation of miR-483 in cancer Results
32
reporter vector in cells cotransfected with siRNA for MYC. These data indicate that MYC is
not the responsible for the activation of the miR-483 locus after -catenin activation because
of its suggested repressive role on miR-483 transcription.
Figure 15. USF1
serves a mediator
between β-catenin
and the miR-483
locus. (A) EMSA of
nuclear extract from
HEK293 cells using
the miR-483 Ebox
probe. (lane 1-3, 5-
7) or the mutant
form (lane 4). The
specific complexes
are indicated by
black arrows (b,c,d
and e). Lane 7
shows the supershift
generated by USF1
antibody (complex
a). (B) Luciferase
assay of
pGL4E_Ebox wild
type after enforced
expression of USF1
and CTNNB1 using
the pGL4E empty
vector as control
(left panel). The
middle and right
panels show the
expression of miR-
483-3p and IGF2
gene, respectively,
after enforced expression of USF1 and CTNNB1. The miR-483-3p and IGF2 expression value of the empty
vector were the controls. The exogenous expression of USF1 was assessed by western blot (upper panel). (C)
Nuclear extract from HEK293 were immunoprecipitated with either USF1 (lanes 1-3) and CTNNB1 antibodies
(lanes 4-6). After being washed, samples were run on SDS-PAGE gel and transferred to nitrocellulose. The blots
were probed with USF1 and CTNNB1 antibody. (D) Nuclear extract from HEK293 with (lanes 1, 2) and
without (lanes 3, 4) treatment with LiCl (20 mM for 24h) were imunoprecipitated with USF1 antibody and the
blot probed for CTNNB1 protein. The Input shows an incremented quantity of CTNNB1 after LiCl treatment
(lanes 5, 6). Vinculin protein expression was used as loading protein control. (E) GST-CTNNB1 and HIS-USF1
fusion proteins were subjected to GST (lanes 1,2) and HIS (lanes 3-5) pull-down analysis. Binding reaction
products were washed, and proteins were separated by SDS-PAGE. The membrane was probed with both anti-
CTNNB1, anti-USF1 and and GST antibodies. Single asterisk indicates a p value<0.02, double asterisk indicates
a p value >0.02.

Role and regulation of miR-483 in cancer Results
33
Since the Ebox element can also bind to the Upstream Stimulating Transcription Factor 1
(USF1) I tested this interaction by Electrophoretic Mobility Shift (EMSA) and Super Shift
assays, although no previous connection between USF1 and -catenin has been shown. USF1
is an evolutionary well conserved and ubiquitously expressed transcription factor involved in
a wide number of cellular activities such as immune response, cell cycle and proliferation,
and lipid and glucose metabolism 60
. As shown in Figure 15A the EMSA assay generates a
specific band shift pattern (complex b to e, lane 2, Fig 15A) that disappears in the mutant
form of the Ebox element oligonucleotide (lane 4, Fig 15A). Moreover, by using the anti-
USF1 antibody, a super-shift complex was generated (complex a, lane 7, Fig 15A) suggesting
that USF1 recognizes the Ebox element upstream of the miR-483 locus.
Figure 16. (A) Western blot
analysis of catenin and USF1 in
HEK293 cells transfected with the
catenin expression vector.
Vinculin was used as protein load
control .(B) Western blot analysis
of USF1 protein in HepG2 cells
transfected with USF1 siRNA at 72
hours from transfection (upper
panel) and the corresponding miR-
483-3p relative expression (lower
panel). Single asterisk indicates a p
value<0.02, double asterisk
indicates a p value >0.02.
To confirm this result I cloned the coding sequence of the USF1 gene into pCMV-Tag vector
and co-transfected it into HEK293 cells along with pIRES-Neo -catenin and the reporter
vector pGL4E-6841-6910 with a wild type or mutant E-box (Fig 15B left panel). USF1 over
expression was able to induce luciferase activity (2 fold) that was further increased in the
presence of exogenous -catenin (about 3 fold) compared to the control. Similar results
obtained by RT-qPCR for miR-483-3p showed that miR-483-3p was weakly induced by
exogenous USF1 (p=0.05) but increased about 3 times with co-expression of USF1 and

Role and regulation of miR-483 in cancer Results
34
CTNNB1 (p<0.02) (Fig 15B middle panel). Note that IGF2 expression was unchanged (Fig
15B right panel). To exclude a transcriptional regulation of USF1 by -catenin, Ialso tested
that the USF1 protein level after -catenin enforced expression was not changed (Fig.16A).
These data suggest USF1 is an important mediator of the regulation of miR-483 locus driven
by the -catenin. To further confirm these results, Itransiently knocked-down USF1 by
siRNA in HepG2 cells that show a very high -catenin activity and miR-483-3p expression.
qRT-PCR verified a significant reduction of miR-483-3p expression, compared to the control,
after 72 hours from siRNA transfection (Fig.16B). These data suggest USF1 is an important
mediator of the regulation of miR-483 locus driven by the -catenin.
-catenin and USF1 directly interact. To understand the interplay between -catenin and
USF1 I tested the possibility of interaction between these two proteins. I co-
immunoprecipitated from HEK293 nuclear extract lysate with either an anti-USF1 antibody
or an anti--catenin antibody then immunoblotted with either anti--catenin or anti-USF1,
respectively and found the two proteins co-immunoprecipitated (Fig 15C). Since LiCl
treatment is able to induce miR-483 locus expression I tested the ability of -catenin to co-
immunoprecipitate with USF1 with and without LiCl treatment. Western blot analysis
revealed an increased quantity of -catenin immunoprecipitated with anti-USF1 (22%)
compared to the non-treated control (Fig 15D) where the induction of -catenin protein level
after LiCl treatment was increased about 60%.
Then I tested whether these two proteins have the ability to directly interact by using the
purified proteins CTNNB1-GST and USF1-HIS in pull-down assays. Both the pull-down
assays revealed direct interaction between the two proteins (Fig 15E).
miR-483-3p reveals a negative regulative loop by targeting -catenin. Since regulative
feed-back loops between microRNAs and their targets have been shown in numerous cases 61
62 63
I investigated the possibility that -catenin and/or USF1 are targets of miR-483-3p or 5p.
By in-silico analysis (http://targetscan.org/) I found that CTNNB1 is a predicted target of the
miR-483-3p (Fig 17A).
To test the direct interaction of miR-483-3p with the CTNNB1 3’UTR, either the predicted
miR-483-3p target site of the CTNNB1 mRNA, or a mutated target site used as a negative
control was cloned downstream of the luciferase reporter gene in the pGL3-Control vector.
These miR-483-3p responsive vectors were co-transfected into HEK293 and HCT116 cells

Role and regulation of miR-483 in cancer Results
35
with either an RNA oligonucleotide miR-483-3p mimic or a scrambled sequence. A renilla
luciferase vector (pGL4R) was used as a reference normalization control. In comparison with
the control vector, the miR-483-3p caused a decrease in luciferase activity of about 30% and
50% in HEK293 and HCT116 respectively, whereas in the mutated 3’UTR clones luciferase
activities were not perturbed by miR-483-3p (Fig 17B).
Figure 17. β-catenin is a
target of miR-483-3p. (A)
Putative binding site of miR-
483-3p in CTNNB1 3’UTRs
(TargetScan Database).
Asterisks show nucleotides
substituted in 3’UTR miR-
483-3p predicted target site to
perform luciferase assay. (B)
CTNNB1 3’UTRs regulates
luciferase activity dependent
on miR-483-3p in HEK293
and HCT116 cell lines (WT,
wild type; MUT, mutant). (C)
Western blot analysis of
CTNNB1 after miR-483-3p
transfection in HEK293 and
HCT116 cell line. Cells were
collected after 48 hours after
miRNA transfection. (D)
Luciferase activity of the
reporter vectors pOT and pOF
in HCT116 co-transfected
with miR-483-3p and
scramble oligo (NC2) with and without LiCl treatment. Single asterisk indicates a p value<0.02, double asterisk
indicates a p value >0.02.
To further confirm -catenin as target of miR-483-3p, the protein level was assessed by
western blot of HEK293 and HCT116 cells transfected with miR-483-3p. Protein expression
was reduced about 20% and 50% when compared to negative control (Fig 17C). Moreover,
in HCT116 cells that harbour a mutated -catenin, the co-transfection of miR-483-3p and the
reporter vector pGL3-OT revealed a functional reduction of nuclear -catenin of

Role and regulation of miR-483 in cancer Results
36
approximately 60% compared to the controls, with or without LiCl (Fig 17D). These data
prove that miR-483-3p can inhibit -catenin transcriptional activity.
The mutated form of-catenin can evade the miR-483-3p regulative loop. Our findings
suggest a negative regulatory loop between miR-483-3p and -catenin exists. However both
genes are over-expressed or have higher activity in tumors, suggesting that -catenin could
escape miR-483-3p regulation. Since it has been described that a single nucleotide
polymorphism (SNP) within the 3’UTR of the -catenin mRNA target could affect the
binding of the miRNA 64
65
66
I analyzed the mutational status of the -catenin 3’UTR in 8
cell lines (RD, MCF7, RKO, SK-NEP1, G401, A204, U2OS, HEK293) and 30 Wilms’ tumor
samples. I found 2 SNPs, rs2953 and rs4135387 that I cloned into pGL3-control and tested
for their susceptibility to miR-483-3p regulation by a luciferase assay. No significant
differences were found (Fig.18).I also determined that miR-483-3p was not mutated in these
samples. This result led us to speculate that mutations in the coding sequence of -catenin
may be affecting this process.
Figure 18. CTNNB1 3’UTRs regulates luciferase activity dependent on miR-483-3p in HEK293 independently
of the SNPs rs2953 and rs 4135387 when compare to the
reference sequence wild type. Firefly luciferase activity was
normalized on Renilla luciferase activity of the cotransfected
pRL-TK vector. Single asterisk indicates a p value<0.02,
double asterisk indicates a p value >0.02.
Role and regulation of miR-483 in cancer Results
37
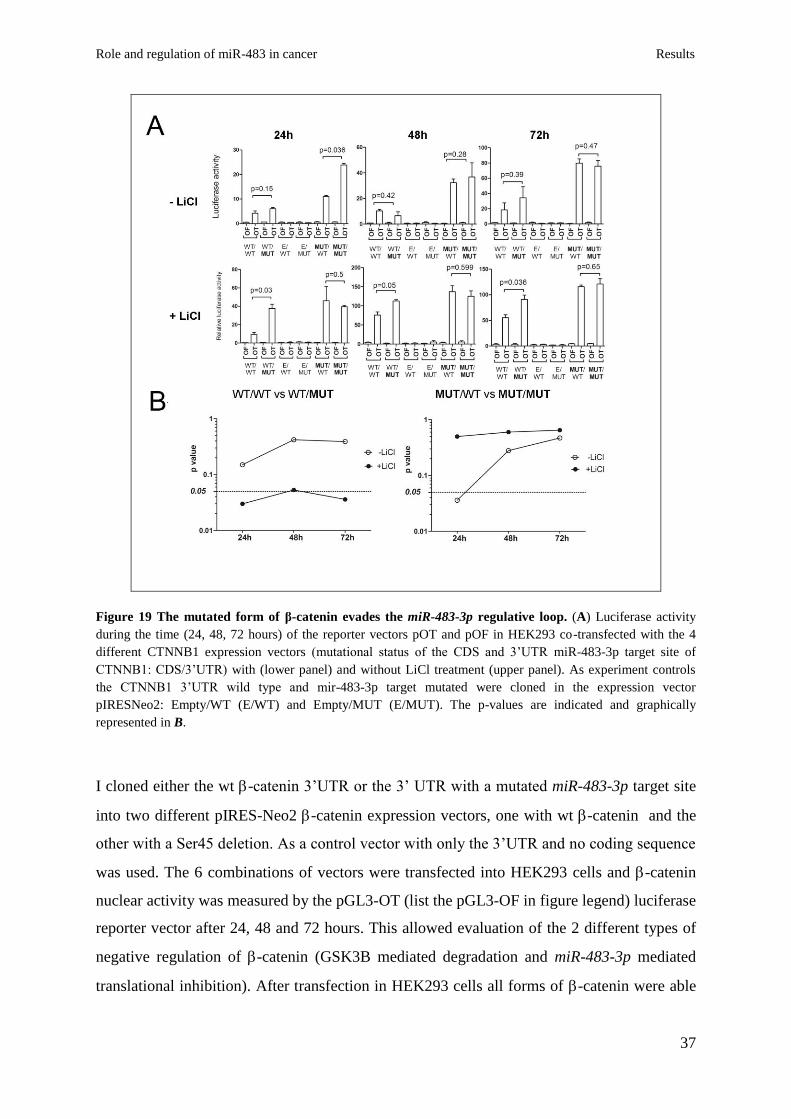
Figure 19 The mutated form of β-catenin evades the miR-483-3p regulative loop. (A) Luciferase activity
during the time (24, 48, 72 hours) of the reporter vectors pOT and pOF in HEK293 co-transfected with the 4
different CTNNB1 expression vectors (mutational status of the CDS and 3’UTR miR-483-3p target site of
CTNNB1: CDS/3’UTR) with (lower panel) and without LiCl treatment (upper panel). As experiment controls
the CTNNB1 3’UTR wild type and mir-483-3p target mutated were cloned in the expression vector
pIRESNeo2: Empty/WT (E/WT) and Empty/MUT (E/MUT). The p-values are indicated and graphically
represented in B.
I cloned either the wt -catenin 3’UTR or the 3’ UTR with a mutated miR-483-3p target site
into two different pIRES-Neo2 -catenin expression vectors, one with wt -catenin and the
other with a Ser45 deletion. As a control vector with only the 3’UTR and no coding sequence
was used. The 6 combinations of vectors were transfected into HEK293 cells and -catenin
nuclear activity was measured by the pGL3-OT (list the pGL3-OF in figure legend) luciferase
reporter vector after 24, 48 and 72 hours. This allowed evaluation of the 2 different types of
negative regulation of -catenin (GSK3B mediated degradation and miR-483-3p mediated
translational inhibition). After transfection in HEK293 cells all forms of -catenin were able

Role and regulation of miR-483 in cancer Results
38
to increase the luciferase activity of the pGL3-OT at 24, 48 and 72 hours compared to the
controls (Fig 19A) however I did not seen any significant difference between the WT/WT
and WT/MUT forms (CDS/3’UTR). This could be due to the high rate of GSK3B-mediated
-catenin degradation which is strong in HEK293 cells and could hide the effect of miR-483-
3p. To overcome this problem the experiment was conducted in the presence of LiCl which
resulted in a significant increase of activity in the presence of the WT/MUT but not the
WT/WT form suggesting that the wt 3’ UTR is controlled by miR-483-3p, but the mutant
form is not (Fig 19A and Fig 19B, left panel). On the other hand the Ser45 mutant form of -
catenin showed a significant difference in regulation by miR-483-3p at the 3’UTR (MUT/WT
vs MUT/MUT) only at 24 hours without LiCl (p=0.036). Since the mutant form is not
degraded and thus accumulates in the cells, it is reasonable that at an early time point -
catenin protein levels are still controlled by miR-483-3p but this regulation is lost over time
(Fig 19B, right panel). Taken together these data support that the activating mutation of -
catenin results in loss of regulation by miR-483-3p.
Role and regulation of miR-483 in cancer Discussion
39
Discussion
I established a link between miR-483-3p, a miRNA located within the IGF2 locus at
chromosome 11p15.5, and human tumorigenesis. Various evidences support this conclusion.
First, tumorigenicity of HepG2, a cell line that over-expresses miR-483-3p, is suppressed by
AMO anti-miR-483-3p; second, the miRNA is up-regulated and over-expressed in Wilms’
tumors, as well as in common human neoplasms; third, miR-483-3p supports cell survival by
protecting cells from apoptosis; fourth, an important regulator of apoptosis, Puma, is
inhibited by the expression of miR-483-3p.
To demonstrate the oncogenic properties of miR-483-3p, I proved that silencing of miR-483-
3p by AMO could reduce tumorigenicity of HepG2 cells, a cell line that exhibits high
expression of the IGF2/miR-483 locus and functional activity of IGF2 ligand 67
68
.
Importantly, the reduction in tumor formation by the specific silencing of miR-483-3p was
achieved without changing IGF2 gene expression. Moreover, the silencing of the IGF2 gene
by siRNA technologies did not cause a significative changing in tumors formation by HepG2
cells. These results clearly indicate that a crucial oncogenic function associated with the
miR-483-3p miRNA within the IGF2 locus. This conclusion may explain why transgenic
animal models for Igf2 over-expression did not develop tumors 21
. In fact, these animal
models were developed by using an Igf2 cDNA, which lacked the mir-483 locus. It could be
speculated that, by protecting cells from apoptosis, miR-483-3p provides the additional
element required for supporting malignant transformation promoted by the growth factor
IGF2. Indeed, in Wilms’ tumor, HCC and CRC studied the expression of the IGF2/miR-483
locus is co-regulated in almost all the samples analyzed. Interestingly, some cases present a
divergent expressions of miR-483-3p and IGF2, suggesting a possible IGF2 independent
mechanisms of miR-483-3p regulation.
By proving that ectopic expression of miR-483-3p can protect cells from apoptosis, while
inhibition of endogenous miR-483-3p increases basal or induced apoptosis, I demonstrate that
the up-regulation of miR-483-3p can protect cells from apoptosis. This is in line with the
finding that miR-483-3p can target and repress the expression of the pro-apoptotic protein
PUMA, a BH3-only protein, whose induction is mediated by p53 46,69
. Like other BH3-only
proteins, it promotes apoptosis by interacting and inhibiting the anti-apoptotic factors BCL2
and BCLXL 69-71
. Hence, an over-expressed miR-483-3p may favor cell survival by reducing
the level of Puma after P53 activation during apoptosis stimuli, and therefore acting as an
anti-apoptotic oncogene. These results support this conclusion.

Role and regulation of miR-483 in cancer Discussion
40
The involvement of miR-483-3p in cancer is supported by the observation that is over-
expressed in about 30% of common human cancers and in 100% of Wilms’ tumors. In
addition, Guled et al. reported the up-regulation of miR-483-3p in malignant mesothelioma 41
.
In human cancers the over-expression of miR-483-3p could be linked to its co-regulation with
IGF2 expression. Interestingly, through this mechanism, both growth, IGF2, and survival
stimuli, miR-483-3p, are simultaneously activated.
However some tumor samples displayed a divergent expression between IGF2 and miR-483-
3p, thus revealing the existence of mechanisms where IGF2 and hsa-mir-483 are not co-
regulated. Therefore I investigated also this aspect of the research. I identified a new
molecular mechanism of auto-regulation of -catenin activity through miR-483-3p, and a
novel interaction between the transcription factors USF1 and -catenin. After genetic analysis
of HCC samples, I identified an association between the activation of the -catenin pathway
and the over-expression of miR-483-3p, an association that was stronger in a subset of
samples that exhibited a divergent expression between IGF2 and miR-483-3p. This
observation was supported by the finding that the miR-483 locus could be up-regulated
independently from its host gene IGF2 by enforced over-expression of -catenin.
These findings indicate the existence of at least two mechanisms responsible for the
expression of miR-483-3p: co-regulation with IGF2 and transcriptional induction by β-
catenin. The first mechanism appears to be significantly represented in Wilms’ tumors and
possibly other pediatric tumors. In these tumors, the well-known over-expression and loss of
imprinting of IGF2 may be responsible for most of the miR-483 up-regulation. Through this
mechanism, both cell growth and survival can be simultaneously stimulated by IGF2 and
miR-483-3p, respectively. The second mechanism may explain the over-expression of miR-
483-3p in adult human cancers, where its up-regulation may occur independently from IGF2
expression.
The mediator of miR-483 stimulation by -catenin was identified as the basic Helix-Loop-
Helix Upstream Stimulating factor USF1. Here, I prove that it can directly interact with -
catenin and recognize the E-box CACGTG element located 400 nucleotides upstream of the
miR-483 locus. The interaction between -catenin and another bHLH protein, MyoD, was
previously described 72
, but this is the first demonstration of the direct interaction between -
catenin and USF1. USF1 is a widely expressed transcription factor that plays a crucial role in
the regulation of cell cycle and proliferation 73,74
and gluco-lipidic metabolism. 75,76
.

Role and regulation of miR-483 in cancer Discussion
41
Moreover has been shown USF1 plays also an important role for the maintenance of a
chromatin barrier at the insulator elements of the chicken -globin gene 77
.
The recent demonstration of the safe and effective use of anti-miRNAs in animal models,
including African green monkeys, suggest the potential application of AMOs also in anti-
cancer therapy 78,79
. Our findings indicate the miR-483-3p as a potential target for anti-
neoplastic intervention in Wilms’ and possibly many other tumors. Thus, these results not
only improve our understanding on the molecular mechanisms involved in tumor
development, but they also provide indication for a novel potential therapeutic target.
My discovery of a negative regulative loop between miR-483-3p and -catenin generates an
apparent paradox. To explain this discrepancy, I found that the mutated form of -catenin is
able to evade miR-483-3p regulation and the mutated protein can still accumulate in the cell.
In addition to the -catenin-USF1 / miR-483 mechanism, in this study I found that CTCF can
also participate in the regulation of miR-483 expression. Indeed, I confirmed data published
by Du et al. 53
, who found that the region immediately upstream of the miR-483 locus binds
the multifunctional protein CTCF. I found evidence that CTCF could play an important role
in the regulation of miR-483 locus as a transcriptional repressor and that repression is
indirectly correlated to the methylation status of a CpG dinucletide in the CTCF binding site.
CTCF is a well known regulator of imprinted regions of the genome such as the IGF2/H19
locus where it permits the monoallelic expression of these two genes 80,81
by modulating the
conformation of this region, which 82
affects transcriptional activity. It is also important to
note that the chromosomal region where CTCF is located (16q21) is often deleted in Wilms’
tumor 83,84
. Our finding highlights the role of the miR-483 locus as point of junction among
the most important players in Wilms’ tumor (IGF2 locus, Wnt/-catenin pathway and
CTCF).
By unraveling the complex regulation of the miR-483 locus, the present study provides new
insight into the Wnt/-catenin pathway and indicates new targets for anticancer therapy.

Role and regulation of miR-483 in cancer Conclusion and future perspectives
42
Conclusion and future perspectives
Hsa-miR-483 is located within intron 2 of the IGF2 locus. IGF2 is a fetal growth factor
whose abnormally high expression has been associated with the development of
nephroblastoma, hepatoblastoma and rhabdomyosarcoma. I found that miR-483-3p is
overexpressed in all the Wilms’ tumors I studied. In addition, colon, breast, and liver cancers
exhibit high or even extremely levels of miR-483-3p in ~30% of the cases. Functionally I
found that the miR-483-3p acts as an oncomiR by targeting the pro-apoptotic gene p53 up-
regulated modulator of apoptosis (BBC3/PUMA) 40,85
.
The significance of these finding is related to the genomic position of this miRNA that maps
at the second intron of IGF2 gene on the 11p15.5 chromosomal region called WT2 region
(Wilms’ tumor region 2) and/or MTACR1 (Multiple Tumor-Associated Chromosomes
Region1) because of its involvement in several tumors. IGF2 gene has been studied for many
years in connection to Wilms’ tumor 86
and Beckwith-Wiedemann syndrome (BWS) and it
was found upregulated. Nevertheless IGF2 murine transgenic models have highlighted
features close to the Beckwith-Wiedemann syndrome 21
without tumor predisposition.
Recently Hu et al. published a Wilms’ tumor mouse model caused by somatic ablation of
Wt1 and constitutional up-regulation of Igf2 locus 87
. Taken together these results suggest an
important cooperation between IGF2 and miR-483, their co-presence stimulate both cell
growth and survival in cancer cells.
Generally a co-regulation of IGF2 and miR-483 was registered even though I identified a
second regulatory mechanism of miR-483 independently of IGF2 expression. MiR-483 locus
could be regulated by a novel transcription complex that involves the onco-protein β-catenin
and the upstream transcription factor 1 (USF1). The β-catenin\Wnt pathway is one of the
most important pathway dysregulated in cancer and USF1 is an evolutionary well conserved
and ubiquitous transcription factor (TF) involved in a wide number of cellular activities such
as cell cycle and proliferation, and lipid and glucose metabolism 60
.
I identify the TF CMYC as repressor of the miR-483 locus. This finding could explain the
pro-apoptotic character of this oncogene 88,89
and the interesting result obtained by Okuyama
et al. They show that c-MYC protein levels cancer cells in vivo are strikingly reduced in the
area distant from the blood vessels enhancing cell survival 90
.
Description of preliminary data
1. MYC transcription factor represses miR-483 expression. I recently published an auto-
regulative loop between miR-483 and β-catenin transcription factor by the novel interaction
β-catenin/USF1. During this study I found that CMYC repress the transcription of miR-483.

Role and regulation of miR-483 in cancer Conclusion and future perspectives
43
HEK293 cells knocked down for CMYC by short interfering RNA show an incremented
expression of the pri-miR-483 (Fig.14A-B). These data suggest that CMYC is involved at the
transcription step of the locus and not during the maturation of the miRs considered.
Luciferase assay to evaluate the promoter region of the miR-483 locus highlight that the
CMYC repression is independent from the USF1 binding site (same recognition sequence of
CMYC) (Fig.14C).
By Chromatin immunoprecipitation analysis I found that CMYC bounds the miR-483
promoter (Fig.20B). Has been published that the CMYC repressive function is exerted by the
mediator myc-interacting zinc finger protein 1 (MIZ-1) 91
, since I found 4 MIZ-1’s predicted
binding in the 500 bp up-stream the miR-483 locus (Fig.20A) I suppose an involvement of
this protein in the regulation of miR-483.
Fig.20 (A) Genomic structure of IGF2/483 locus from the reference AF517226 genomic sequence. IGF2’s
Exons (gray bars), the four predicted MIZ1 binding sites (black bars), miR-483-3p and miR-483-5p (dark gray
boxes) are shown. Are indicated the 2 genomic fragments amplified for the ChIP analysis. (B) ChIP analysis
using CMYC and NMYC antibibodies in HepG2 and HCT116 cell lines (B indicates the blank of the PCR).
2. Glucose influences miR-483-3p expression. Since I found USF1 regulates miR-483
expression 85
and that USF1 is regulated by glucose 92,93
I evaluated miR-483-3p expression
in HepG2 cells deprived of glucose. As shown in figure 21 the expression of miR-483-3p is
gradually down-regulated during the time in cells deprived of glucose. On the other hand in
presence of glucose the expression of miR-483-3p seems increased over time. The down-

Role and regulation of miR-483 in cancer Conclusion and future perspectives
44
regulation of miR-483-3p coincides with a down-regulation in the protein level of β-catenin
but USF1 seems not influenced (data not shown).
Fig. 21 Time course of miR-483-3p relative expression on HepG2cells
cultured with and without glucose (0mM and 10mM). The miR-483-3p
expression was normalized to the endogenous reference RNU6B
I support the hypothesis that the glucose metabolism could be an important factor in the
regulation of the anti-apoptotic miR-483-3p, given the 1) location of miR-483 in the INS-
IGF2 gene in the 11p15.5 chromosome region, 2) the involvement of USF1 that seems to be
necessary to the glucose response 92
, 3) the β-catenin/Wnt pathway that is regulated by the
glycogen synthase kinase 3 beta (GSK3B), 4) the inhibition of glucose metabolism is
described to be an apoptotic stimulus 94,95
and 4) our preliminary data that show a down-
regulation of miR-483 in HepG2 cells cultured in absence of glucose.
My future aim is to draw the complex scenario of the regulation of miR-483 locus to identify
new possible approaches in the treatment of cancers that exhibit miR-483 up-regulation. Our
preliminary data suggest the involvement of glucose metabolism in the miR-483 regulation,
moreover I published the involvement of the transcriptional factors USF1 and CMYC in the
miR-483 regulation that are described implicated in glucose metabolism 96
97
. Since the anti-
apoptotic role of miR-483-3p I suppose that inhibiting the pathway glucose metabolism I
could improve the drug susceptibility of tumorigenic cells with elevated miR-483 expression.

Role and regulation of miR-483 in cancer Conclusion and future perspectives
45
References
1 Fearon, E. R., Vogelstein, B. & Feinberg, A. P. Somatic deletion and duplication of genes on chromosome 11 in Wilms' tumours. Nature 309, 176-178 (1984).
2 Koufos, A. et al. Loss of alleles at loci on human chromosome 11 during genesis of Wilms' tumour. Nature 309, 170-172 (1984).
3 Orkin, S. H., Goldman, D. S. & Sallan, S. E. Development of homozygosity for chromosome 11p markers in Wilms' tumour. Nature 309, 172-174 (1984).
4 Reeve, A. E. et al. Loss of a Harvey ras allele in sporadic Wilms' tumour. Nature 309, 174-176 (1984).
5 Satoh, Y. et al. Genetic and epigenetic alterations on the short arm of chromosome 11 are involved in a majority of sporadic Wilms' tumours. Br J Cancer 95, 541-547 (2006).
6 Ali, I. U., Lidereau, R., Theillet, C. & Callahan, R. Reduction to homozygosity of genes on chromosome 11 in human breast neoplasia. Science 238, 185-188 (1987).
7 Fearon, E. R., Feinberg, A. P., Hamilton, S. H. & Vogelstein, B. Loss of genes on the short arm of chromosome 11 in bladder cancer. Nature 318, 377-380 (1985).
8 Weston, A. et al. Differential DNA sequence deletions from chromosomes 3, 11, 13, and 17 in squamous-cell carcinoma, large-cell carcinoma, and adenocarcinoma of the human lung. Proc Natl Acad Sci U S A 86, 5099-5103 (1989).
9 Lee, J. H., Kavanagh, J. J., Wharton, J. T., Wildrick, D. M. & Blick, M. Allele loss at the c-Ha-ras1 locus in human ovarian cancer. Cancer Res 49, 1220-1222 (1989).
10 Rainier, S. et al. Relaxation of imprinted genes in human cancer. Nature 362, 747-749 (1993).
11 Schwienbacher, C. et al. Abnormal RNA expression of 11p15 imprinted genes and kidney developmental genes in Wilms' tumor. Cancer Res 60, 1521-1525 (2000).
12 Scelfo, R. A. et al. Loss of methylation at chromosome 11p15.5 is common in human adult tumors. Oncogene 21, 2564-2572 (2002).
13 Poirier, K. et al. Loss of parental-specific methylation at the IGF2 locus in human hepatocellular carcinoma. J Pathol 201, 473-479 (2003).
14 Haruta, M. et al. Duplication of paternal IGF2 or loss of maternal IGF2 imprinting occurs in half of Wilms tumors with various structural WT1 abnormalities. Genes Chromosomes Cancer 47, 712-727 (2008).
15 Vu, T. H., Chuyen, N. V., Li, T. & Hoffman, A. R. Loss of imprinting of IGF2 sense and antisense transcripts in Wilms' tumor. Cancer Res 63, 1900-1905 (2003).
16 Sparago, A. et al. Mechanisms causing imprinting defects in familial Beckwith-Wiedemann syndrome with Wilms' tumour. Hum Mol Genet 16, 254-264 (2007).
17 Diaz-Meyer, N. et al. Silencing of CDKN1C (p57KIP2) is associated with hypomethylation at KvDMR1 in Beckwith-Wiedemann syndrome. J Med Genet 40, 797-801 (2003).
18 Satoh, A. et al. Epigenetic inactivation of class II transactivator (CIITA) is associated with the absence of interferon-gamma-induced HLA-DR expression in colorectal and gastric cancer cells. Oncogene 23, 8876-8886 (2004).
19 Gallagher, E. et al. Gain of imprinting of SLC22A18 sense and antisense transcripts in human breast cancer. Genomics 88, 12-17 (2006).

Role and regulation of miR-483 in cancer Conclusion and future perspectives
46
20 Bjornsson, H. T. et al. Epigenetic specificity of loss of imprinting of the IGF2 gene in Wilms tumors. J Natl Cancer Inst 99, 1270-1273 (2007).
21 Sun, F. L., Dean, W. L., Kelsey, G., Allen, N. D. & Reik, W. Transactivation of Igf2 in a mouse model of Beckwith-Wiedemann syndrome. Nature 389, 809-815 (1997).
22 Fu, H. et al. Identification of human fetal liver miRNAs by a novel method. FEBS Lett 579, 3849-3854 (2005).
23 Perez-Moreno, M., Jamora, C. & Fuchs, E. Sticky business: orchestrating cellular signals at adherens junctions. Cell 112, 535-548, doi:S0092867403001089 [pii] (2003).
24 Clevers, H. Wnt/beta-catenin signaling in development and disease. Cell 127, 469-480, doi:S0092-8674(06)01344-4 [pii] 10.1016/j.cell.2006.10.018 (2006).
25 Wang, S. S. et al. Alterations of the PPP2R1B gene in human lung and colon cancer. Science 282, 284-287 (1998).
26 Satoh, S. et al. AXIN1 mutations in hepatocellular carcinomas, and growth suppression in cancer cells by virus-mediated transfer of AXIN1. Nat Genet 24, 245-250 (2000).
27 Major, M. B. et al. Wilms tumor suppressor WTX negatively regulates WNT/beta-catenin signaling. Science 316, 1043-1046 (2007).
28 Morin, P. J. et al. Activation of beta-catenin-Tcf signaling in colon cancer by mutations in beta-catenin or APC. Science 275, 1787-1790 (1997).
29 Devereux, T. R. et al. CTNNB1 mutations and beta-catenin protein accumulation in human hepatocellular carcinomas associated with high exposure to aflatoxin B1. Mol Carcinog 31, 68-73 (2001).
30 Kusafuka, T., Miao, J., Kuroda, S., Udatsu, Y. & Yoneda, A. Codon 45 of the beta-catenin gene, a specific mutational target site of Wilms' tumor. Int J Mol Med 10, 395-399 (2002).
31 Rubinfeld, B. et al. Binding of GSK3beta to the APC-beta-catenin complex and regulation of complex assembly. Science 272, 1023-1026 (1996).
32 Mann, B. et al. Target genes of beta-catenin-T cell-factor/lymphoid-enhancer-factor signaling in human colorectal carcinomas. Proc Natl Acad Sci U S A 96, 1603-1608 (1999).
33 Tetsu, O. & McCormick, F. Beta-catenin regulates expression of cyclin D1 in colon carcinoma cells. Nature 398, 422-426, doi:10.1038/18884 (1999).
34 Eulalio, A., Huntzinger, E. & Izaurralde, E. Getting to the root of miRNA-mediated gene silencing. Cell 132, 9-14 (2008).
35 Ambros, V. The functions of animal microRNAs. Nature 431, 350-355, doi:10.1038/nature02871 nature02871 [pii] (2004).
36 Calin, G. A. & Croce, C. M. MicroRNA signatures in human cancers. Nat Rev Cancer 6, 857-866 (2006).
37 Iorio, M. V. & Croce, C. M. MicroRNAs in cancer: small molecules with a huge impact. J Clin Oncol 27, 5848-5856, doi:JCO.2009.24.0317 [pii] 10.1200/JCO.2009.24.0317 (2009).
38 Negrini, M., Ferracin, M., Sabbioni, S. & Croce, C. M. MicroRNAs in human cancer: from research to therapy. J Cell Sci 120, 1833-1840 (2007).

Role and regulation of miR-483 in cancer Conclusion and future perspectives
47
39 Esquela-Kerscher, A. & Slack, F. J. Oncomirs - microRNAs with a role in cancer. Nat Rev Cancer 6, 259-269 (2006).
40 Veronese, A. et al. Oncogenic role of miR-483-3p at the IGF2/483 locus. Cancer Res 70, 3140-3149, doi:0008-5472.CAN-09-4456 [pii] 10.1158/0008-5472.CAN-09-4456 (2010).
41 Guled, M. et al. CDKN2A, NF2, and JUN are dysregulated among other genes by miRNAs in malignant mesothelioma -A miRNA microarray analysis. Genes Chromosomes Cancer 48, 615-623 (2009).
42 Soon, P. S. et al. miR-195 and miR-483-5p Identified as Predictors of Poor Prognosis in Adrenocortical Cancer. Clin Cancer Res 15, 7684-7692, doi:1078-0432.CCR-09-1587 [pii] 10.1158/1078-0432.CCR-09-1587 (2009).
43 Suzuki, H. et al. Epigenetic inactivation of SFRP genes allows constitutive WNT signaling in colorectal cancer. Nat Genet 36, 417-422 (2004).
44 Fornari, F. et al. MiR-221 controls CDKN1C/p57 and CDKN1B/p27 expression in human hepatocellular carcinoma. Oncogene (2008).
45 Olek, A., Oswald, J. & Walter, J. A modified and improved method for bisulphite based cytosine methylation analysis. Nucleic Acids Res 24, 5064-5066, doi:l60209 [pii] (1996).
46 Jeffers, J. R. et al. Puma is an essential mediator of p53-dependent and -independent apoptotic pathways. Cancer Cell 4, 321-328 (2003).
47 Nusse, R. Cancer. Converging on beta-catenin in Wilms tumor. Science 316, 988-989 (2007).
48 Reya, T. & Clevers, H. Wnt signalling in stem cells and cancer. Nature 434, 843-850 (2005).
49 de La Coste, A. et al. Somatic mutations of the beta-catenin gene are frequent in mouse and human hepatocellular carcinomas. Proc Natl Acad Sci U S A 95, 8847-8851 (1998).
50 Taniguchi, K. et al. Mutational spectrum of beta-catenin, AXIN1, and AXIN2 in hepatocellular carcinomas and hepatoblastomas. Oncogene 21, 4863-4871 (2002).
51 Katoh, H. et al. Genetic inactivation of the APC gene contributes to the malignant progression of sporadic hepatocellular carcinoma: a case report. Genes Chromosomes Cancer 45, 1050-1057 (2006).
52 Korinek, V. et al. Constitutive transcriptional activation by a beta-catenin-Tcf complex in APC-/- colon carcinoma. Science 275, 1784-1787 (1997).
53 Du, M. et al. Insulator and silencer sequences in the imprinted region of human chromosome 11p15.5. Hum Mol Genet 12, 1927-1939 (2003).
54 Kuhn, E. J. & Geyer, P. K. Genomic insulators: connecting properties to mechanism. Curr Opin Cell Biol 15, 259-265, doi:S0955067403000395 [pii] (2003).
55 Jelinic, P. & Shaw, P. Loss of imprinting and cancer. J Pathol 211, 261-268, doi:10.1002/path.2116 (2007).
56 Prawitt, D. et al. Microdeletion of target sites for insulator protein CTCF in a chromosome 11p15 imprinting center in Beckwith-Wiedemann syndrome and Wilms' tumor. Proc Natl Acad Sci U S A 102, 4085-4090, doi:0500037102 [pii] 10.1073/pnas.0500037102 (2005).
57 Chan, C. S. & Song, J. S. CCCTC-binding factor confines the distal action of estrogen receptor. Cancer Res 68, 9041-9049, doi:68/21/9041 [pii]
Role and regulation of miR-483 in cancer Conclusion and future perspectives
48
10.1158/0008-5472.CAN-08-2632 (2008). 58 Butcher, D. T. & Rodenhiser, D. I. Epigenetic inactivation of BRCA1 is associated with
aberrant expression of CTCF and DNA methyltransferase (DNMT3B) in some sporadic breast tumours. Eur J Cancer 43, 210-219, doi:S0959-8049(06)00800-8 [pii] 10.1016/j.ejca.2006.09.002 (2007).
59 Paradowska, A. et al. Aberrant epigenetic modifications in the CTCF binding domain of the IGF2/H19 gene in prostate cancer compared with benign prostate hyperplasia. Int J Oncol 35, 87-96 (2009).
60 Corre, S. & Galibert, M. D. Upstream stimulating factors: highly versatile stress-responsive transcription factors. Pigment Cell Res 18, 337-348, doi:PCR262 [pii] 10.1111/j.1600-0749.2005.00262.x (2005).
61 Petrocca, F. et al. E2F1-regulated microRNAs impair TGFbeta-dependent cell-cycle arrest and apoptosis in gastric cancer. Cancer Cell 13, 272-286, doi:S1535-6108(08)00049-4 [pii] 10.1016/j.ccr.2008.02.013 (2008).
62 Yang, X. et al. miR-449a and miR-449b are direct transcriptional targets of E2F1 and negatively regulate pRb-E2F1 activity through a feedback loop by targeting CDK6 and CDC25A. Genes Dev 23, 2388-2393, doi:23/20/2388 [pii] 10.1101/gad.1819009 (2009).
63 Xu, N., Papagiannakopoulos, T., Pan, G., Thomson, J. A. & Kosik, K. S. MicroRNA-145 regulates OCT4, SOX2, and KLF4 and represses pluripotency in human embryonic stem cells. Cell 137, 647-658, doi:S0092-8674(09)00252-9 [pii] 10.1016/j.cell.2009.02.038 (2009).
64 Nicoloso, M. S. et al. Single-nucleotide polymorphisms inside microRNA target sites influence tumor susceptibility. Cancer Res 70, 2789-2798, doi:0008-5472.CAN-09-3541 [pii] 10.1158/0008-5472.CAN-09-3541 (2010).
65 Saetrom, P. et al. A risk variant in an miR-125b binding site in BMPR1B is associated with breast cancer pathogenesis. Cancer Res 69, 7459-7465, doi:0008-5472.CAN-09-1201 [pii] 10.1158/0008-5472.CAN-09-1201 (2009).
66 Chin, L. J. et al. A SNP in a let-7 microRNA complementary site in the KRAS 3' untranslated region increases non-small cell lung cancer risk. Cancer Res 68, 8535-8540, doi:68/20/8535 [pii] 10.1158/0008-5472.CAN-08-2129 (2008).
67 Shimizu, M. et al. EGCG inhibits activation of the insulin-like growth factor (IGF)/IGF-1 receptor axis in human hepatocellular carcinoma cells. Cancer Lett (2007).
68 Lin, S. B. et al. Antisense oligodeoxynucleotides of IGF-II selectively inhibit growth of human hepatoma cells overproducing IGF-II. J Biochem 122, 717-722 (1997).
69 Nakano, K. & Vousden, K. H. PUMA, a novel proapoptotic gene, is induced by p53. Mol Cell 7, 683-694 (2001).
70 Yu, J., Zhang, L., Hwang, P. M., Kinzler, K. W. & Vogelstein, B. PUMA induces the rapid apoptosis of colorectal cancer cells. Mol Cell 7, 673-682 (2001).
71 Bouillet, P. & Strasser, A. BH3-only proteins - evolutionarily conserved proapoptotic Bcl-2 family members essential for initiating programmed cell death. J Cell Sci 115, 1567-1574 (2002).

Role and regulation of miR-483 in cancer Conclusion and future perspectives
49
72 Kim, C. H., Neiswender, H., Baik, E. J., Xiong, W. C. & Mei, L. Beta-catenin interacts with MyoD and regulates its transcription activity. Mol Cell Biol 28, 2941-2951, doi:MCB.01682-07 [pii] 10.1128/MCB.01682-07 (2008).
73 North, S. et al. Regulation of cdc2 gene expression by the upstream stimulatory factors (USFs). Oncogene 18, 1945-1955, doi:10.1038/sj.onc.1202506 (1999).
74 Cogswell, J. P., Godlevski, M. M., Bonham, M., Bisi, J. & Babiss, L. Upstream stimulatory factor regulates expression of the cell cycle-dependent cyclin B1 gene promoter. Mol Cell Biol 15, 2782-2790 (1995).
75 Read, M. L., Clark, A. R. & Docherty, K. The helix-loop-helix transcription factor USF (upstream stimulating factor) binds to a regulatory sequence of the human insulin gene enhancer. Biochem J 295 ( Pt 1), 233-237 (1993).
76 Iynedjian, P. B. Identification of upstream stimulatory factor as transcriptional activator of the liver promoter of the glucokinase gene. Biochem J 333 ( Pt 3), 705-712 (1998).
77 Huang, S., Li, X., Yusufzai, T. M., Qiu, Y. & Felsenfeld, G. USF1 recruits histone modification complexes and is critical for maintenance of a chromatin barrier. Mol Cell Biol 27, 7991-8002, doi:MCB.01326-07 [pii] 10.1128/MCB.01326-07 (2007).
78 Elmen, J. et al. LNA-mediated microRNA silencing in non-human primates. Nature 452, 896-899 (2008).
79 Krutzfeldt, J. et al. Silencing of microRNAs in vivo with 'antagomirs'. Nature 438, 685-689 (2005).
80 Murrell, A., Heeson, S. & Reik, W. Interaction between differentially methylated regions partitions the imprinted genes Igf2 and H19 into parent-specific chromatin loops. Nat Genet 36, 889-893, doi:10.1038/ng1402 ng1402 [pii] (2004).
81 Hark, A. T. et al. CTCF mediates methylation-sensitive enhancer-blocking activity at the H19/Igf2 locus. Nature 405, 486-489, doi:10.1038/35013106 (2000).
82 Kurukuti, S. et al. CTCF binding at the H19 imprinting control region mediates maternally inherited higher-order chromatin conformation to restrict enhancer access to Igf2. Proc Natl Acad Sci U S A 103, 10684-10689, doi:0600326103 [pii] 10.1073/pnas.0600326103 (2006).
83 Maw, M. A. et al. A third Wilms' tumor locus on chromosome 16q. Cancer Res 52, 3094-3098 (1992).
84 Yeh, A. et al. Chromosome arm 16q in Wilms tumors: unbalanced chromosomal translocations, loss of heterozygosity, and assessment of the CTCF gene. Genes Chromosomes Cancer 35, 156-163, doi:10.1002/gcc.10110 (2002).
85 Veronese, R. V., Jessica Consiglio, Mario Acunzo, Laura Lupini, Taewan Kim, Manuela Ferracin,, Francesca Lovat, E. M., Veronica Balatti, Lucilla D’Abundo, Laura Gramantieri, Luigi Bolondi, & Yuri Pekarsky, D. P., Massimo Negrini and Carlo M. Croce. Mutated β-catenin evades a microRNA-dependent regulatory loop. PNAS in press (2011).
86 Reeve, A. E., Eccles, M. R., Wilkins, R. J., Bell, G. I. & Millow, L. J. Expression of insulin-like growth factor-II transcripts in Wilms' tumour. Nature 317, 258-260 (1985).
87 Hu, Q. et al. Wt1 ablation and Igf2 upregulation in mice result in Wilms tumors with elevated ERK1/2 phosphorylation. J Clin Invest 121, 174-183, doi:10.1172/JCI43772
Role and regulation of miR-483 in cancer Conclusion and future perspectives
50
43772 [pii] (2011). 88 Hoffman, B. & Liebermann, D. A. Apoptotic signaling by c-MYC. Oncogene 27, 6462-
6472, doi:onc2008312 [pii] 10.1038/onc.2008.312 (2008).
89 Sumi, T., Tsuneyoshi, N., Nakatsuji, N. & Suemori, H. Apoptosis and differentiation of human embryonic stem cells induced by sustained activation of c-Myc. Oncogene 26, 5564-5576, doi:1210353 [pii] 10.1038/sj.onc.1210353 (2007).
90 Okuyama, H., Endo, H., Akashika, T., Kato, K. & Inoue, M. Downregulation of c-MYC protein levels contributes to cancer cell survival under dual deficiency of oxygen and glucose. Cancer Res 70, 10213-10223, doi:0008-5472.CAN-10-2720 [pii] 10.1158/0008-5472.CAN-10-2720 (2010).
91 Wanzel, M., Herold, S. & Eilers, M. Transcriptional repression by Myc. Trends Cell Biol 13, 146-150, doi:S0962892403000035 [pii] (2003).
92 Kahn, A. Transcriptional regulation by glucose in the liver. Biochimie 79, 113-118, doi:S0300-9084(97)81501-5 [pii] (1997).
93 van Deursen, D., Jansen, H. & Verhoeven, A. J. Glucose increases hepatic lipase expression in HepG2 liver cells through upregulation of upstream stimulatory factors 1 and 2. Diabetologia 51, 2078-2087, doi:10.1007/s00125-008-1125-6 (2008).
94 Kang, H. T. & Hwang, E. S. 2-Deoxyglucose: an anticancer and antiviral therapeutic, but not any more a low glucose mimetic. Life Sci 78, 1392-1399, doi:S0024-3205(05)00698-3 [pii] 10.1016/j.lfs.2005.07.001 (2006).
95 Ralser, M. et al. A catabolic block does not sufficiently explain how 2-deoxy-D-glucose inhibits cell growth. Proc Natl Acad Sci U S A 105, 17807-17811, doi:0803090105 [pii] 10.1073/pnas.0803090105 (2008).
96 Sanchez, A. P. & Sharma, K. Transcription factors in the pathogenesis of diabetic nephropathy. Expert Rev Mol Med 11, e13, doi:S1462399409001057 [pii] 10.1017/S1462399409001057 (2009).
97 Dang, C. V. Rethinking the Warburg effect with Myc micromanaging glutamine metabolism. Cancer Res 70, 859-862, doi:0008-5472.CAN-09-3556 [pii] 10.1158/0008-5472.CAN-09-3556 (2010).