Embed Size (px)
Citation preview
ROLE OF CLAY IN WELL-LOG INTERPRETATION
BY M. R . J. WTLLIE '
IntroducHon. I t is the intention of the wri ter to diseuss pr imar i ly the eleetroeheniieal properties of charged membranes and part icular ly shales as na tu ra l embodiments of such membranes. Attent ion will be given to the factors involved in the practical utilization of the properties of shale membranes as tools in the interpretation of electrical well logs. Conversely, it will be pointed out that the propert ies of electrical Mell logs appear to give information bearing on the properties of the clays in na tura l shales.
Attent ion will be given to the role that clays play in the interpretat ion of electrical-resistivity logs. AVhereas in the in terpreta t ion of the S.P. (spontaneous or self potential) log the presence of clay in shales appears to give rise to a na tu ra l phenomenon of great practical utility, the pi'esence of clay or shale in permeable rocks such as sandstones or limestones constitutes a major bane.
Although the title induces no such limitation upon it, the scope of this paper will not include the effect of clay.s on the in terpreta t ion of well logs other than electrical well logs. This omission implies no derogation of the importance of radioactivity and other logs, but merely the recognition tha t the interpretat ion of electrical logs, being presently of greater economic importance, has received more attention. The clay problems in electrical-log interpreta t ion are certainly g rea t ; analogous problems involved in radioactivity logging may well be prodigious.
The Self-Potential Log. Electrical well logging, or, as it was initially called, electrical coring, was invented by the brothers Conrad and Marcel Schlumberger in 1927, and the first electrical log run was made in the Pechelbronn field of Alsace. The initial logs consisted only of electrical resistivity logs; that is, a plot of the resistivitv of formations as a function of their depth bel o\v ground level. However, Marcel Schlumberger noted evidence of a na tu ra l electrical phenomenon occurr ing in the borehole, and in ]98 ] , while surveying a well in the Caucasus, Schlumberger engineers confirmed the existence of this phenomenon, which they called the self potential or S.P. F rom the beginning the S.P. curve proved very useful because it enabled a simple distinction to be made between permeable rocks and shales. I t provided also a more precise method than any previously existing for determining the thicknesses of sandt and shale sequences. Also, the characteristic shape of the S.P. curve made it possible to correlate well logs over large areas with a much greater precision than had been po,ssible when only electrical resistivity logs of the crude original type were available.
The method of runn ing a self potential log is extraordinari ly simple. The basic equipment consists of a length of insulated wire to which are attached two electrodes. Generally these electrodes consist of lead wire bound on an insulating mandrel , although non-polarizing elec-
* Gulf Research and Development Company, Pittsburgh, Pennsylvania.
t "Sand" is used throug^hout this paper in the petroleum technology sen.?e of permeable rock.
trodes are to be preferred. In practice, one electrode is anchored at the surface in the m u d pit or a pi t art ificially dug adjacent to the well-head and filled with fiuid. The other electrode is lowered down the borehole and the potential difference between the two electrodes is measured and recorded automatically as a function of the depth of the borehole electrode below surface level. Since the contact potential difference between the electrodes and the fluids in which they are immersed may not be identical, it is customary to insert in the circuit between the two electrodes a means by which this potential may be controlled. This control or bucking potential has no other role than to serve as a convenient method of ar ranging for the potential between the electrodes at any par t icu lar da tum level to be such that it can be plotted on the recording paper . Dur ing the logging run it is essential that this bucking potential remain constant, and, as a consequence, what is recorded on the paper is the na tu ra l difference of potential between the borehole electrode and the surface or reference electrode as a function of the depth of the borehole electrode below surface level. The general scheme is shown in figure 1. I t was found by the Schlumberger engineers to be an empirical fact tha t as the borehole
RECORDING V
F 1 F 5ll=
F
• ' . V * •
.
. V
llr * •
llr
N UD
FIGURE 1. Schematic drawing of basic S.P. losging circuit.
electrode was lowered into the hole its potential changed systematically with depth. I n general, when the borehole electrode passed a permeable bed its potential deflected in a negative direct ion; but when it passed into a non-permeable or shale bed its potential changed in the opposite direction. The most remarkable feature of this phenomenon was the fact tha t when the potential changed at the interface between a shale and a sand bed in a negative direction and at the interface between the sand bed and the shale below it in a positive direction, in practically all cases the magni tude of the negative change at the top of the bed was equal to the
(282 )

P a r t V I I ] CIJAY TECHNOLOGY IX THE PETKOLEI;.\[ INDUSTRY 283
:S3^:
m, -'T,
OHM- I OHM- I aOm.v. ^ 0 METERS 20 METERS
0 20
FIGURE 2. A typical shale baseline.
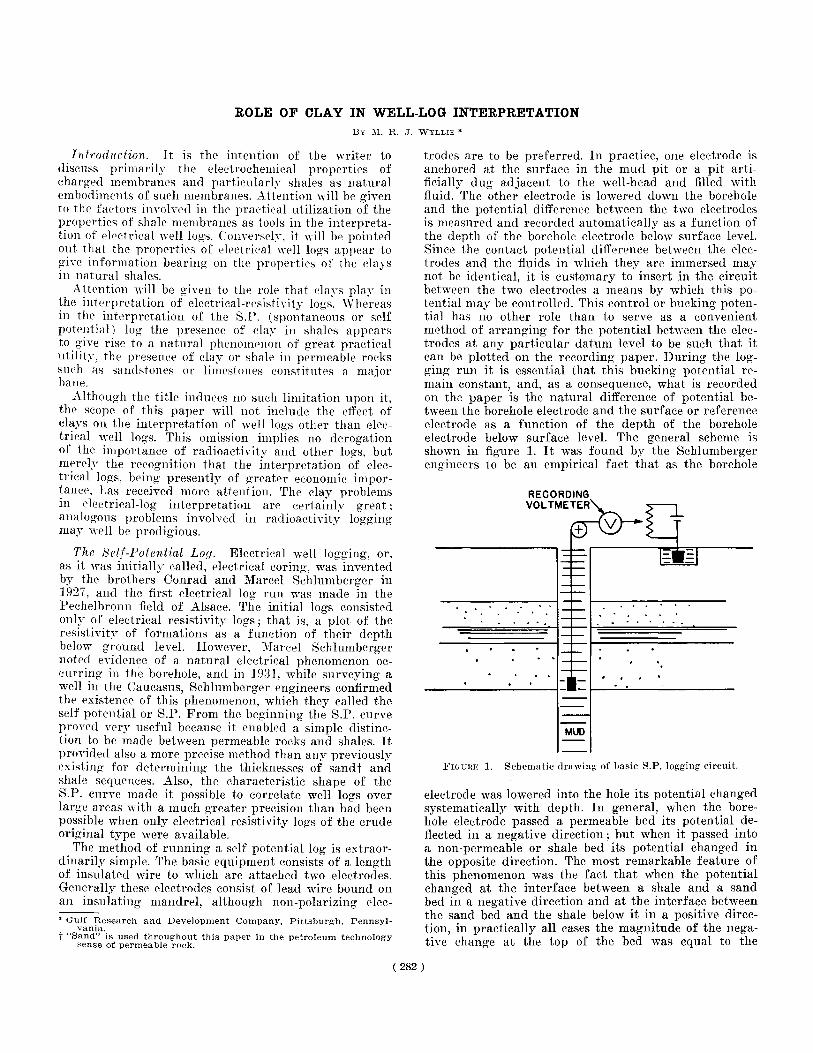
magiiitnde of the positive cliaiip'e at the bottom. If in th in beds, for example, this did not occur, it was usual to find tha t fur ther down the borehole the ])otential opposite shales had again achieved a definite value. This definite shale potential, which is called the shale baseline, is in the view of the writer a phenomenon of tremendous theoretical significance. A typical shale baseline is shown in figure 2.
I t may be shown that baseline shifts occur. Some of these will be discussed below. Xevertheless, the most s tr iking feature of the S.P. log, and a feature which must be reconciled iu any theory of the S.P., is the existence on almost all S.P. logs of a str ikingly constant shale baseline. The dominating significance of this fact should never be overlooked iu the consideration of S.P. phenomena.
Investigation of the natiTre of the S.P. curve, and par t icular ly the na tura l potentials which gave rise to its existence, was first made by the Schlumberger organization ; and two early papers on the subject appeared, wri t ten by the Schlumberger brothers and E. G. Leonar-don (1984, 1934a). The first paper ascribed the S.P. wholly to electrokinetic eflfects, tha t is, a s treaming potential occurring as a result of the flow of mud fluid from the borehole into a permeable formation. I t may be noted here t ha t in modern ro tary dri l l ing the hydrostat ic head of the column of mud contained in the borehole always exceeds the hydrostat ic pressure of the fluids in permeable formations through which the borehole passes. However, i t was soon realized by the Schlumberg'ers and Leonardon tha t electrokinetic phenomena, although they might constitute a pa r t of the S.P., could not be responsible for the entire effect. These workers then investigated in the laboratory the potential which was set up a t the interface between a mass of plastic graj^ clay and a saline solution, and were able to show tha t a potential existed a t this interface. This they recognized as an electrochemical potential and they ascribed the S.P. to a combination of electrokinetic and electrochemical effects. This early view is now generally accepted as correct.
Although there is reason to believe tha t work was carried out within oil companies on the phenomenon of the S.P., it was not unt i l some 10 years had elapsed t ha t another paper appeared on the same subject. This paper, by Mounce and Rust (1945), in essence duplicated the early work of the Schlumbergers and Leonardon, but showed more clearly and emphasized more definitely tha t an electromotive force was set up when a shale separated two saline solutions. I t was shown tha t a chain consisting of a shale barr ier separat ing two solutions differing in ionic strength and with the two solutions in t u rn brought in contact to form a liquid junct ion was capable of giving rise to the passage of an electric current . Unfortunately, Mounce and Rust made no a t tempt to assess the reasons for the setting up of this cur ren t and more specifically made no at tempt to measure the potentials quant i ta t ively as a function of the compositions of the solutions separated bj ' their shale membrane. Later II . G. Doll (1949) discussed in considerable detail the potential distr ibution which existed in a borehole if the shale was able to act as a bat tery and cause the flow of electrical current . Doll showed that , since an electrical cur ren t flowed a t the junct ion between sands and shales
284 CLAYS AND CLAY TECHNOLOGY [Bull. 169
in a borehole, the action of the circulating electrical currents at these interfaces would involve ohmic changes in potential along the axis of the borehole. He showed that it was these ohmic changes in potential which were recorded by the borehole electrode. Uoll emphasized that the relative electrical resistances of the shale, sand, and borehole components in the path of the circulating currents had a dominant effect on the magnitude of the S.P. recorded and on the shape of the S.P. curve. In essence he was able to demonstrate that if sands and shales had effective resistances in the path of the circulatory currents which were small by comparison with the resistance constituted by the mud in the borehole, the changes in potential between the shale baseline and the maximum deflections in the centers of permeable beds were substantially equal to the total electromotive forces giving rise to the circulation of electrical currents. Since the effective resistances of the three legs of the circuit, i.e., a shale bed, a sand bed, and a column of borehole mud, were controlled both by their electrical resistivities and by their physical dimensions, Doll demonstrated that only if a bed were thick by comparison with the diameter of the borehole or if, for any given diameter of borehole, the resistance of the mud was exceptionally high by comparison with the ett'eotive resistances of the shale and sand beds, would the total S.P. recorded be substantiall.v the same as the electromotive force of the cell giving rise to the circulation of current. Thus the maximum S.P., as normally recorded, can never be exactly equal to the emf of the cell which is generating current, although in many cases it may be asymptotic to this value. These complications arise because the shale cell which gives rise to the potential is being measured in ordinary S.P. practice on a closed electrical circuit; whereas for an exact measurement, as it would be made in a laboratory, the measurement should be made poten-tiometrically, i.e., on open circuit. This state of affairs has been partially rectified by an ingenious device which records the so-called static S.P. log (Doll 1950). This device in effect makes in the borehole a potentiometric measurement of the S.P.
I t is not the intention of the writer to discuss in this paper the geometrical effects of the formations on the magnitude of the recorded S.P. These effects, though serious in electric log interpretation, are purely physical. They may be very largely overcome at the present time by the application of static S.P. logging techniques or even by the art of intelligent guess-work. For instance, in figure 2 the S.P. of the formation at 6450-6472' is probably cut back because of the high resistance effect of laminated thin beds. In an interpretation it would be unwise to take the recorded S.P. at the level of this bed as the true S.P. The maximum S.P. above and below the bed is the same and probably is also the Static S.P. of the laminated bed.
There is every hope that in the future the position may be further improved. What seems to the writer to be of critical importance is the nature of the mechanism whereby the emf is set up, and particularly any quantitative relationship which may exist between this emf and the nature and composition of the fluids in permeable beds and in the borehole. I t is imperative for the proper interpretation of electrical well logs that the
electrical resistivity of the fluids within porous formations be obtained. Thus any information concerning these resistivities which can be derived from the S.P. log is of major practical importance.
Practical Utilization of S.P. Log Data. It was pointed out by the writer (Wyllie 1948) that if a portion of a natural shale were interposed between two sodium chloride solutions, the potential which developed across the shale appeared to be related by the Nernst equation to the activity of the sodium ions in the solutions separated.
BT ai E = /w —
F a-2
where
(1)
E = potential BT
:= thermodynamic temperature dependent param-F eter
0], (7o = single ion activities of the sodium ions in the two solutions
It may be noted that the more dilute solution is positive, whereas when an ordinary liquid-junction potential is set up between the same solutions it is negative.
Table 1 shows some of the data obtained. In accordance with the more recent findings of both Kressman (1952) and the writer, the single ion activities which are theoretically required by equation (1) have been replaced by activities based on mean activity coefficients. These coefBcients are taken from Harned and Owen (1950). While the use of mean activity coefficient may involve a constant potential error, the magnitude of this error, if it exists, is not believed to be large. De Witte (1950) seems to confirm the findings of the writer regarding the applicability of the Nernst equation to shales. However, the unorthodox method used by de Witte to find the activity ratio of the sodium chloride solutions he used and the uncertainty regarding the absolute concentrations he employed (apparently these were 0.01 N to 1.0 N) precludes the writer from giving detailed consideration to his data.
Tahle ].
Shale type Ci molai C2 molal a i aa Nernst poten
tial (mv)
Observed poten
tial (mv)
Conemangh 0.048 0.048 0.557 0.557 1.000 1.000 2.000 4.000 2.000 4.000
0.0112 0.0112 0.125 0.125 0.400 0.400 0.500 1.000 0.600 1.000
0.0396 0.0396 0.,370 0.370 0.654 0.654 1.330 3.132 1.330 3.132
0.010 0.010 0.096 0.096 0.270 0.270 0.340 0.654 0.340 0.654
34.7 34.7 34.1 34.1 22.3 22.3 31.0 39.6 31.0 39.6
32.7 32.7
Conemaiigh Woodford _ _ -Conemaugh,,
0.048 0.048 0.557 0.557 1.000 1.000 2.000 4.000 2.000 4.000
0.0112 0.0112 0.125 0.125 0.400 0.400 0.500 1.000 0.600 1.000
0.0396 0.0396 0.,370 0.370 0.654 0.654 1.330 3.132 1.330 3.132
0.010 0.010 0.096 0.096 0.270 0.270 0.340 0.654 0.340 0.654
34.7 34.7 34.1 34.1 22.3 22.3 31.0 39.6 31.0 39.6
32.2 32.2 23.0 23.0
Conemangh Conemangh _. ^ Woodford
0.048 0.048 0.557 0.557 1.000 1.000 2.000 4.000 2.000 4.000
0.0112 0.0112 0.125 0.125 0.400 0.400 0.500 1.000 0.600 1.000
0.0396 0.0396 0.,370 0.370 0.654 0.654 1.330 3.132 1.330 3.132
0.010 0.010 0.096 0.096 0.270 0.270 0.340 0.654 0.340 0.654
34.7 34.7 34.1 34.1 22.3 22.3 31.0 39.6 31.0 39.6
14.3 9.9
34.2 28.9
0.048 0.048 0.557 0.557 1.000 1.000 2.000 4.000 2.000 4.000
0.0112 0.0112 0.125 0.125 0.400 0.400 0.500 1.000 0.600 1.000
0.0396 0.0396 0.,370 0.370 0.654 0.654 1.330 3.132 1.330 3.132
0.010 0.010 0.096 0.096 0.270 0.270 0.340 0.654 0.340 0.654
34.7 34.7 34.1 34.1 22.3 22.3 31.0 39.6 31.0 39.6
The data in table 1, which refer to a carbonaceous Devonian shale (Woodford) cored at a depth of 6808 feet and a Pennsylvanian shale (Conemangh) cored at a depth of less than 100 feet, are typical of the labo-

Part y i l ] CLAY TECHNOLOGY IX THE PETROLEUM INDUSTRY 285
ratory data that are obtained with natural shale specimens. Two features of the data are particularly stressed. The first is that at low ionic strengths both shales give the same potential and this potential is close to the Nernst potential. At high ionic strengths the difference between the potential observed and that calculated from the Nernst equation increases, and this difference is not the same for the two shale specimens. As will be shown below, a failure to give potentials conforming to the Nernst equation at high ionic strengths of the solutions used is typical of an imperfect membrane electrode.
The observation that shales separating sodium chloride solutions differing in activity give potentials which tend to follow the Nernst potential suggests that the S.P. log may be used to calculate the salinity, and hence the resistivity, of subsurface waters in permeable rocks penetrated by a borehole (Wyllie 1949). The method has been further discussed and some of its limitations outlined by the author in several publications (Wyllie 1949a, 1951, 1951a; Wyllie and Morgan 1951).
A cell in the earth which gives rise to an S.P. deflection may be resolved into the following components. A shale barrier that separates two solutions of different ionic activities and which gives rise to a potential of the kind previously discussed. The two solutions are respectively the mud fluid in the borehole and the interstitial water in a permeable and porous rock. These two solutions make contact in the interstices of the porous rock thereby closing the electrical circuit and giving rise also, in ideal cases, to a normal liquid junction potential. Current circulates from the shale into the borehole, from the borehole into the permeable rock and from the rock back into the shale. This is shown in figure 3. If the activity of the fluid in the borehole is less than the interstitial water activity, and this is commonly the case, cations move from the shale into the borehole while anions simultaneously move across the liquid junction formed in the permeable rock so as to maintain an over-all electrical neutrality. The net effect is the transfer of salt from the more concentrated solu-
SHALE
ARROWS IN DIRECTION OF POSITIVE CURRENT FLOW
-f
S.R CURVE FiGXJKE 3. Schematic view of the potentials, current flow, ion
movement and S.P. curve for a permeable bed containing a solution of activity ac, separating two shale beds and penetrated by a borehole containing mud of activity am. ac>am.
tion in the permeable formation to the more dilute solution in the borehole. The current flow is not large; in typical instances, it is of the order of milliamperes. The current density in the shale is very small.
The shale cell written in conventional fashion is Mud//Interstitial water
Shale/Mud in the permeable rock/
If the mud and interstitial M-ater are both assumed to be sodium chloride solutions differing only in ionic strength, and if the shale potential is considered to follow the Nernst equation irrespective of the ionic strength of the solutions separated, the cell may be formally written
NaCl/'/NaCl/Na^electrode/NaCl (2) a i a-i
The expression for the potential of a cell of this nature involving as it does both the equivalent of a sodiitm electrode potential and a liquid junction potential is
BT ai E = 2t. In —
F a2 (3)
whore t. is the transference number of the chloride ion and a, and «£ the mean ionic activities of the two sodium chloride solutions.
For practical use equation (3) may be readily cast in a form in which the potential E is related to the activity ratio (ai/a2) and temperature T. For this purpose it is only necessary to assume some reasonable average sodium chloride concentration for which the value of the transference number as a function of temperature can be found. If E is now identified with the maximum or static S.P. on a log and the activity of the mud, ao, is measured, it is possible to arrive at a value of «], the activity of the interstitial water. Knowing this activity the salinity and hence resistivity of the interstitial water is easily found. Simple charts to accomplish these steps have been published (Wyllie 1951).
Equation (3) thus forms the basis of a method of computing interstitial water resistivity. The method has been used with success by the author (Wyllie 1949a) and is now standard practice in Gulf operations. A similar method was evolved independently by Tixier (1949) from a consideration of the S.P. phenomena and interstitial water resistivities observed by him in the Rocky Mountain area of the United States. Tixier's method, based purely on log data, so closely approximates the results of the writer's theoretical analysis that it may be construed as lending support to the analysis made.
While the method is used with success within the Gulf organization, others have not found it equally useful.* A major difficulty is certainly that of obtaining a fully developed S.P. deflection when geometrical effects, e.g., thin beds or excessive filtrate invasion, are conspiring to reduce the maximum S.P. deflection. The formulae evolved by Doll (1949) for correcting the S.P. for .such geometrical effects are apparently too idealized to be invariably successful in practice. However, static S.P. logging will do much to overcome these difficulties, * Dunlap, H. P., Personal communication, 1952.
286 CLAYS AND CLAY TECHNOLOGY fBiill. 169
while the in terpreta t ion of conventional S.P. logs may be greatly improved if the maximum consistent S.P. deflection above and below (for preference) or in the vicinity of the bed of interest, is selected. However, some judgment is recpiired in the use of this technique, for in some areas the salinity of intersti t ial waters may change abrupt ly from bed to bed while in others the change is gradual . Thus on the Gulf Coast the technique may be reliable, but in California it is hazardous.
I t is the experience of the wri ter and his associates that in the United States the method may be used to calculate a water resistivity sufficiently reliable for a log interpretat ion in about 70 percent of eases. In an effort to improve this sitiiation and to determine to what extent the results obtained have been fortuitous, attention has been given to the basic assumptions made in the formulatioh of equation (3) and the degree to which these assumptions may be relied upon in practical instances. This program is still continuing, but has devolved into two basic lines of inquiry. These are an investigation of the existence and magni tude of potentials other than electrochemical potentials which are recorded on the S.P. log, and the mechanism of the eleetrochemieal potential. The la t ter problem has involved both the theory of charged membrane electrodes and par t icular ly the problem of the bi-ionic potential .
Electrokinetic Potentials. In dril l ing operations using rotarjr rigs, the borehole contains mud fluid. This fluid is designed to remove cutt ings produced at the drill-bit and to seal off permeable beds while dri l l ing proceeds. The density of the mud is maintained at a figure which is sufficient to ensure that the hydrostatic pressure in the mud column opposite any permeable bed exceeds the pressure of the fluids in the bed. While this pressure difference ensures tha t no bed yields its fluids into the borehole dur ing dri l l ing, it inevitably leads to the steady infiltration of dri l l ing mud into all permeable beds. To minimize this infiltration muds are designed to build on the faces of permeable beds a filter cake having a permeability as low as the ingenuity of the mud engineer can devise. Nevertheless, no filter cake is impermeable and in all wells there is a steady flow of mud filtrate from the borehole through the filter cake into permeable beds.
The pressure differential causing the flow of filtrate is a function of the mud density, the formation pressure and the location of the bed in the borehole. While all three factors vary, it may be said tha t in the depth ranges now of interest in petroleum product ion the pressure differential is always of the order of hundreds of pounds per square inch and in deep wells it may be several thousand pounds per square inch.
There is also a range in resistivity of modern dril l ing muds, but the present tendency seems to be for them to be progressively lowered. Resistivities of the order of 0.5 ohm-meters to 1.5 ohm-meters at a tempera ture of about 70° F are now common, although figures both above and below these limits are frequently encountered. These resistivities imply ionic strengths of the order of 0.05 to 0.20 molal.
Such ionic s trengths would not normally be considered as liable to give rise to electrokinetic potentials of any magnitude, but experiments have shown (Wyllie, 1951) tha t this assumption is not justified in well-logging.
Although the high ionic s trengths of the filtrates which are forced through the filter cakes sheathing permeable beds are not themselves conducive to high streaming potentials, they are more than outweighed in total effect by the high zeta potentials of the filter-cake materials and the very large pressure differentials causing fluid flow. The filter cakes are largely composed of montmoril-lonite clay, the exchangeable ions generally being sod ium; but probably some calcium also is present, part icularly in the case of modern lime-base muds (Bergman, 1952). The cakes also contain weighting material in the form of barytes, along with silica and other solids arising from the dril l ing operations. Oil in the filter cake is characteristic when oil-emulsion dril l ing muds are eni-ploj'ed.
I t has been found that since it is deformable the permeability of a filter cake is itself a function of the pressure differential across i t ; thus the streaming potential across a filter cake is not the usual l inear function of the pressure diff'erential inducing fluid flow. The streaming potential appears to follow a relationship of the form
E,, = A-P" (4)
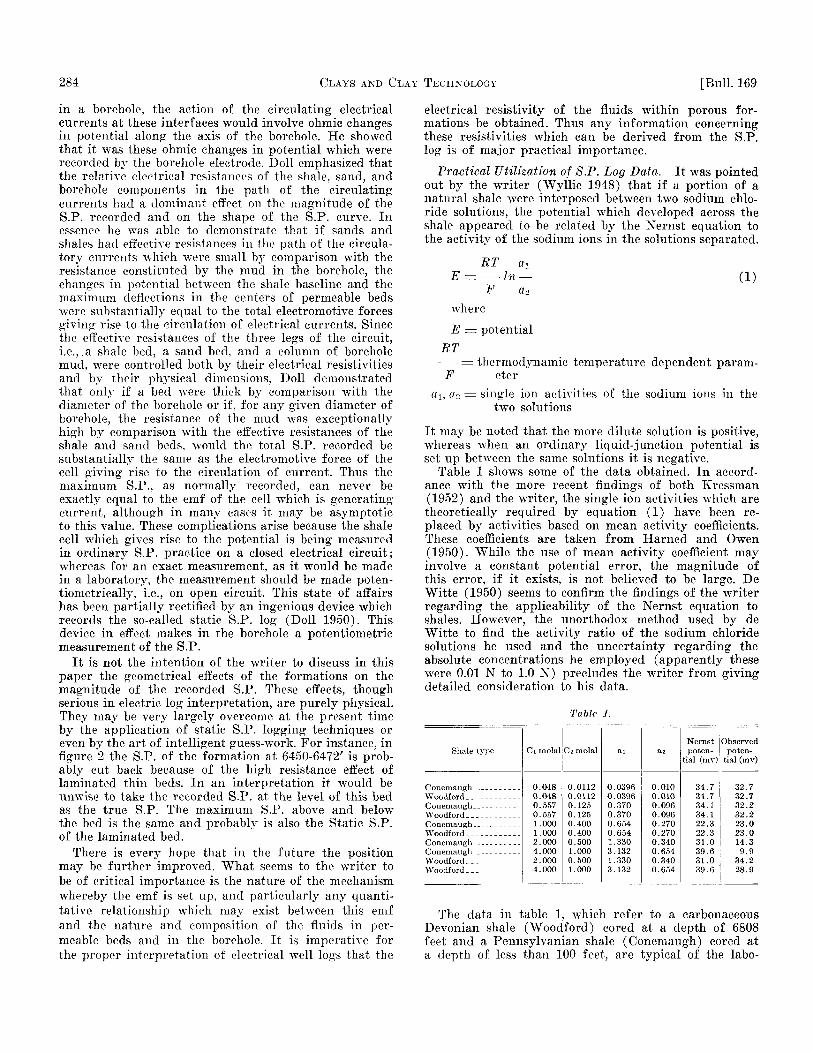
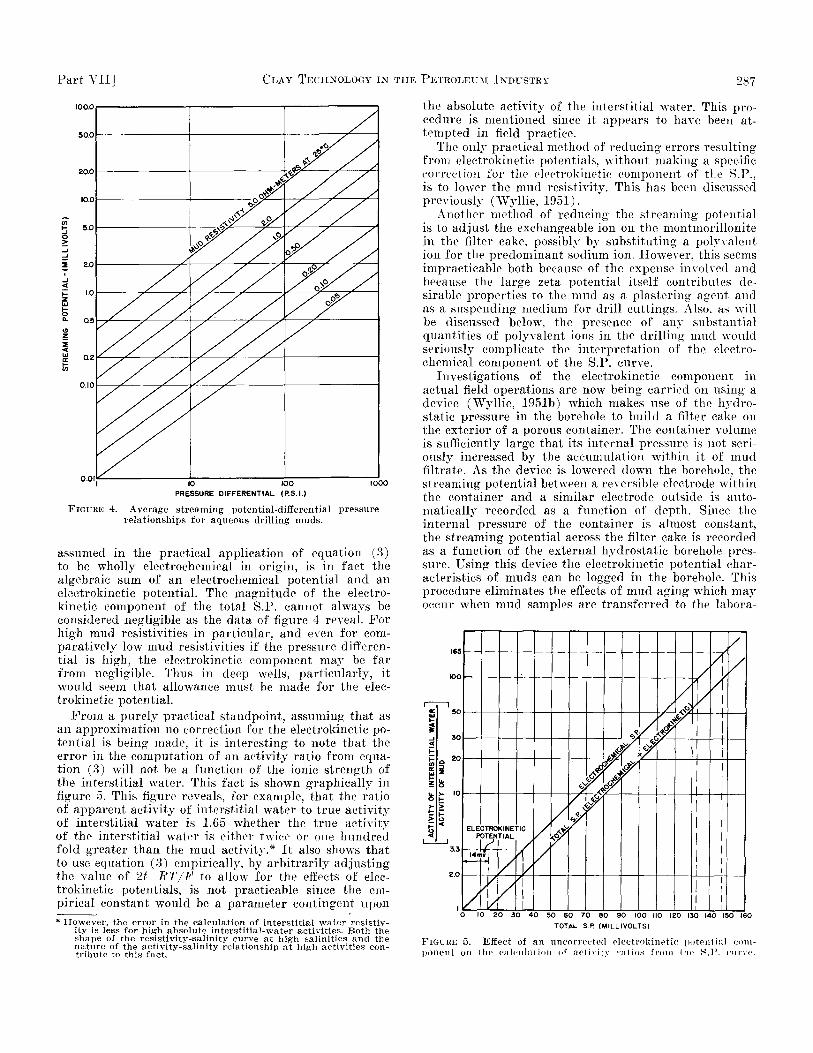
Here Eg is s t reaming potential in mv, k a constant which depends pr imar i ly on the mud resistivity (and thus on the mud filter-cake resistivity since these are interdependent) and J/ is a constant for any par t icular mud at a par t icular temperature . The value of y seems to depend upon the deformation ability of the filter cake; an average value is about 0.75. In figure 4 are shown some average values for the s treaming potential-pressure relationships of dri l l ing muds of different resistivities. The resistivities are expressed at a tempera ture of 25° C.
The fact tha t the constant k in equation (4) is approximately proport ional to the resistivity of the mud from which a filter cake is derived is explicable if it is considered that the total non-conductive solid content of a filter cake is largely independent of resistivity. The solid content is probably related to the mud weight. Hence k would be expected to be proportional to the mud-filtrate resistivity if the surface density of the charge on the filter-cake particles were either constant or filtrate-resistivity dependent. Data quoted by Marshall (1949) seem to show tha t the surface-charge density of kaolinite is practically concentration independent when the clay is in the sodium form, and the same may be t rue of montmorillonite. Thus in the range of ionic s trengths characteristic of dril l ing muds the surface-charge density of the montmorillonite (bentonite) which is invariably used may well be considered constant. If this is so, the comparatively systematic variation with resistivity of the electrokinetic-potential characteristics of muds of widely differing types becomes explicable. Nevertheless, the effect of temperature on the charge density is not clear (AVyllie, 1951) and remains to be investigated further.
The charge on the filter cake is such tha t the filtrate which penetrates a filter cake is positive with respect to the mud from which it is filtered. This means tha t when the electrochemical S.P. is negative, the S.P. deflection is numerically increased by the streaming potential . The maximum S.P. or Static S.P., which is
P a r t VI I ] CLAY TECHNOLOGY IN THE PETROLEUII INDUSTRY 287
100.0
2 0 0
y •^y y ^v y y
Y y y y y^ y
y yy yl ^y^X \y.y y
y Xy X y Xy y^y^x
5 ^ I 10 100 lOO
PRESSURE DIFFERENTIAL (P.S.I.)
FIGURE 4. Average streaming potential-differential pressure relationships for aqueous drilling muds.
assumed in the practical application of equation (3) to be wholly electrochemical in origin, is in fact the algebraic sum of an electrochemical potential and an electrokinetic potential. The magnitude of the electro-kinetic component of the total S.P. cannot always be considered negligible as the data of figure 4 reveal. For high mud resistivities in part icular , and even for comparatively low mud resistivities if the pressure differential is high, the electrokinetic component may be far from negligible. Thus in deep wells, par t icular ly, it would seem that allowance must be made for the electrokinetic potential .
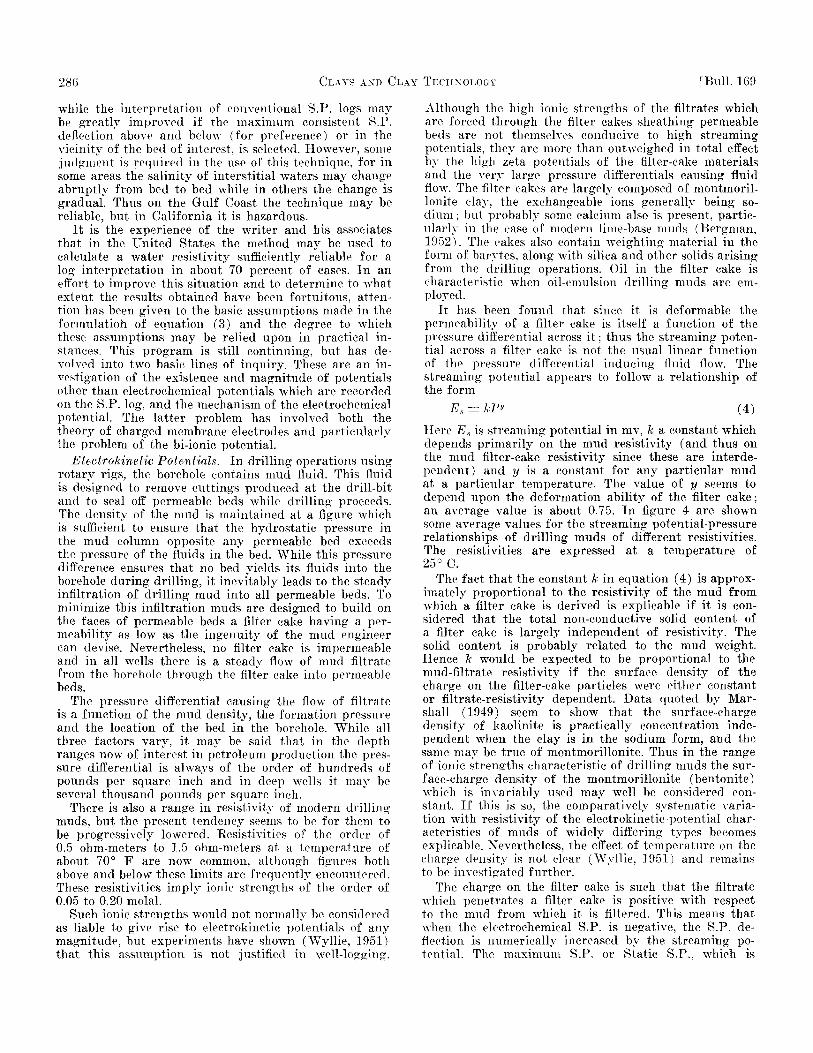
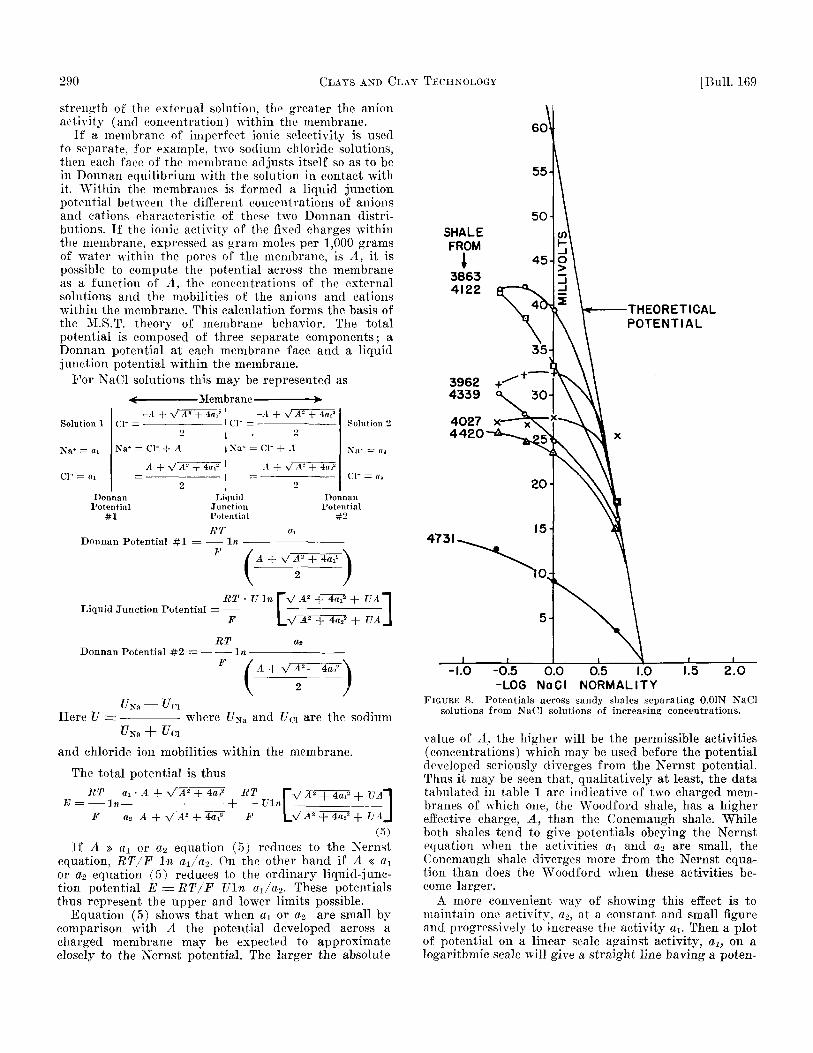
F r o m a purely practical standpoint, assuming that as an approximation no correction for the electrokinetic potential is being made, it is interest ing to note that the er ror in the computation of an activity ratio from equation (3) will not be a function of the ionic s t rength of the intersti t ial water. This fact is shown graphically in figure 5. This figure reveals, for example, tha t the ratio of apparent activity of intersti t ial water to t rue activity of interst i t ial water is 1.65 whether the t rue activity of the intersti t ial water is either twice or one hundred fold greater than the mud activity.* I t also shows tha t to use equation (3) empirically, by arb i t ra r i l j ' adjust ing the value of 2f- RT/F to allow for the effects of electrokinetic potentials, is not practicable since the empirical constant would be a parameter contingent upon
* However, the error in the calculation of interstitial water resistivity is less for high absolute interstitial-water activities. Both the shape of the resistivity-salinity curve at hish salinities and the nature of the activity-salinity relationship at hig-h activities contribute to this fact.
the absolute activity of the interst i t ial water. This procedure is mentioned since it appears to have been attempted in field practice.
The only practical method of reducing errors result ing from electrokinetic potentials, without making a specific correction for the electrokinetic component of the S.P., is to lower the mud resistivity. This has been discussed previously (Wyllie, 1951).
Another method of reducing the s treaming potential is to adjust the exchangeable ion on the montmorillonite in the filter cake, possibly bj ' svibstituting a polyvalent ion for the predominant sodium ion. However, this seems impracticable both because of the expense involved and because the large zeta potential itself contributes desirable propert ies to the mud as a plastering agent and as a suspending medium for drill cutt ings. Also, as will be discussed below, the presence of any substantial quanti t ies of polyvalent ions in the dri l l ing mud would seriously complicate the in terpreta t ion of the electrochemical component of the S.P. curve.
Investigations of the electrokinetic component in actual field operations are now being carried on using a device (Wyllie, 1951b) which makes use of tlie hydrostatic pressure in the borehole to build a filter cake on the exterior of a porous container. The container volume is sufficiently large that its in ternal pressure is not seriously increased by the accumulation within it of mud filtrate. As the device is lowered down the borehole, the s treaming potential between a reversible electrode within the container and a similar electrode outside is automatically recorded as a function of depth. Since the in ternal pressure of the container is almost constant, the streaming potential across the filter cake is recorded as a function of the external hj-drostatic borehole pressure. Using this device the electrokinetic potential characteristics of muds can be logged in the borehole. This procedure eliminates the effects of mud aging which may occur when mud samples are t ransferred to the labora-
1
< » _ l
^ z Li .
O
! >-> t
P < <
,*)
L
1 1
c? t f \ 1
1
1
S W
$/ 1 1 1
^ 4
y S W f
1
1
1
1
ELE P
-I4n
;TRO OTEN
KINE r i A L
IC
1 1 1 1 1 1
1 1 1 1 1 1
1 1
KINE r i A L
IC
1 1 1 1 1 1
1 1 1 1 1 1
1
M 1 1 1
1 1 1
1 1 1 1
0 10 2 0 3 0 4 0 50 60 7 0 80 90 100 110 120 P30 140 150 160
TOTAL S.P (MILLIVOLTS)
FIGURE 5. Effect of an uncorrected electrokinetic potential coni-lK>nent on the calculation of acti\it\ ratios from the S.IV cui\c.

288 CLAYS AND CLAY TECHXOLOGY [Bull. 169
tory for testing. Also it is possible to attain readily differential pressures of the order of thousands of pounds per square inch. For technical reasons such pressure differentials are not readily obtained in the laboratory. Tests of this device appear to confirm the accuracy of equation (4). They may also lead to further knowledge concerning the range of pressure differential over which the exponent y in the relationship E^ = fcP" may be considered constant (AVjdlie, 1951).
In exceptional cases where pressure differentials are very high and the interstitial water activity is lower than that of the mud, it appears that the streaming potential may be sufficiently large to effect an entire reversal of the S.P. curve. Thus in figure 6 the S.P. of the sand at 10,215 to 10,155 feet is —38 mv. Water was actually produced from this formation and had a salinity of 2,083 mg/1 of which 622 mg/1 were sodium ions, 5.8 mg/1, magnesium and 23.2 mg/1, calcium. The measured pressure differential across the filter cake was 1950 psi. For the mud resistivity used, 1.55 ohm-meters at 25° C (mud filtrate resistivity 0.66 ohm-meters), figure 4 indicates a streaming potential of about —60 mv. This implies an electrochemical potential of -[-22 mv, which for a formation temperature of 194° F leads to a salinity, based on equation (3) and the curves given in Wyllie *(1951), of about 3,000 gm/1. The agreement here is satisfactory, but it may be noted that no allowance has been made for the possible effect of temperature on the electrokinetic characteristics of the drilling mud filter cake. While preliminary experiments appear to indicate that such a temperature effect is not large, it is not yet possible to state whether or not this is generally true.
In fine, however, it appears that streaming potentials cannot be neglected if equation (3) is to be used for the purposes of practical computation. Thus methods of logging the streaming potential in the borehole or of otherwise allowing for it should be further investigated. This is particularly true for regions such as Venezuela and parts of California where the low natural salinity of interstitial waters contributes to the use of relatively high resistivity natural drilling muds. Where drilling mud resisitivities at 25° C are 0.50 ohm-meters or less,
FiGUKE 6. A reversal of electrochemical S.P. which results fi-om high electrokinetic S.P. (electrochemical S.P. at 1012.5-10155' is positive).
it is probably permissible to forego any streaming potential correction unless pressure differentials are known to exceed about 1,000 psi.
Nevertheless, the practical use of equation (3), assuming that a true electrochemical potential can be obtained, is contingent upon its validity. The question of the validity of equation (3) is discussed below.
Shale as a Membrane Electrode. Wyllie and Patnode (1950) suggested that the electrochemical properties of natural shales could be rationalized if it were considered that these materials represented natural embodiments of charged membranes. They also presented a brief discussion of what they believed was the essential electrochemical structure of shale membranes, drawing an analogy between the structure of shales and the structure of heterogenous membranes prepared by bonding artificial cation-exchange materials with inert and insulating plastics. I t is proposed here to amplify these concepts. It may be noted that there has been no alternative to the structure tentatively proposed other than one by Williams (Wyllie, 1949), who in a discussion of an early paper by the writer, appeared to suggest that the electrochemical energy of the shale cell was less a function of the properties of the solutions separated by the membrane than a property of the membrane itself. In Williams' view the shale is in equilibrium with the saline water contained in its interstices. He suggested that the chloride ion is more strongly adsorbed than the sodium ion, so that the former is constrained by adsorbtive forces while the sodium constitutes the counter ion. When in contact with a dilute salt solution, the sodium ions are conceived as diffusing away from the clay particles in the shale before the corresponding chloride ions are desorbed. He suggested that the "leading" of the counter ions gave rise to the potential effects observed. This view accorded with his belief that the shale potential was relatively transient. It also served to explain his observations that the potential was in large measure dependent on the nature of the shale membrane used.
While certain aspects of Williams' theory are in broad accord with prevailing concepts of the action of membrane electrodes, the statement that the potential is transient is not in accordance with other experimental observations. Provided no physical leaks or cracks in a shale occur, the observed potential is maintained if the activities of the solutions separated by a shale membrane are maintained constant. If, of course, the potential is measured on closed circuit, the flow of current itself tends to equalize the concentrations of the two solutions and hence diminish the observed potential. Nor did AVilliams appear to take cognizance of the quantitative agreement between the potentials observed and those demanded by the Nernst equation. This agreement, the potentials observed using sandy shale specimens, and the behavior of shale membranes when in contact with solutions containing cations other than sodium, all suggest that a shale barrier behaves as a typical cliarged-mem-brane electrode.
The Electrochemical Properties of Charged Mem-hrancs. In any discussion of the properties of charged membranes or, as they are sometimes termed, membranes of high ionic selectivity, it would be invidious to neglect

P a r t V I I ] CLAY TECHNOLOGY IN THE PETROLEUII INDUSTRY 289
to mention the pioneer work of Leonor Miehaelis. Fortunately, a recent review by Sollner (1950), who has himself made a great eontribntion to the subject, gives adeq\iate referenees to work carried out prior to the last two years.
Although imperfect in several respects, the best theory now extant covering the properties of charged membranes is the so-called Meyer-Sicvers-Teorell thcorj ' (M.S.T.) suggested independentlv bv Meyer and Sievers (1936) and Teorell (1935).
The membranes to be considered may be conceived as being porous, the size of the pores being of the order of a few Aniistriim units. In their internal s t ructure the pores may be visualized as being geometrically similar, for example, except in their size, to the pores in any unconsolidated or consolidated porous medium. However, along the pore walls are i r regular ly ar ranged fixed charges. These charges may be either positive or negative and are electrically neutralized by appropr ia te anion or cation counter ions. Thus a charged membrane may be expected to exhibit cation exchange, although the magni tude of this exchange capacity need not necessarily be large. AVhether the charge on the membrane is positive or negative does not affect its fundamental behavior. Fo r convenience of presentation, since shale membranes appear to be negatively charged, at tention will here be given to membranes of this tj 'pe.
e 0 e »—s ®^.-^®
e
® e e
0
FlGUKE 7. Cross-section through pores of a negatively charged membrane of high cationie selectivity.
In figure 7 is shown schematically a cross-section of two pores in a membrane of high ionic selectivity immersed in an aqueous solution containing positive and negative ions. The fixed negative charges shown may be a residual electrostatic charge (analagous to the charges on clays) or maj^ be a negative group such as a sulphonic acid group. The lat ter is characteristic of many synthetic cation-exchange materials. Bach negative group is balanced by an adjacent positive ion, although these ions may be conceived as possessing reasonable mobility. The charge balancing is dynamic and statistical ra ther than static and exact. Around each fixed negative charge a zone may be conceived into which, due to electrostatic repulsion effects, an anion cannot effect entry. If this
10—91001
zone of repulsion effectively fills a pore (i.e., fills it to an extent which does not permit a par t icu lar size of anion to find unrestr ic ted passage between the periphery of the repulsion zone and the pore wal l ) , t ha t pore will be effectively blocked to anions. Clearly then, three factors affect this s i tuat ion; the magnitude of the negative charge, the effective size of the anion and the manner in which the negative charge is disposed in relation to the in ternal s t ructure of the pore. These are the so-called steric-geometrical effects discussed by SoUner (1945). If complete pore blocking is achieved, the membrane becomes impervious to anions and it will conduct only by the passage of cations. This means tha t the cation-transference number is uni ty, the anion-transference number zero. Such a membrane will give potentials which obey the Nernst equation exactly when separat ing two solutions having different activities bu t with a cation in common. Such a potential will also be stable since no continuous passage of cations through the membrane can take place. This follows because the separation of charge which would be involved would be too prodigious to be permissible.*
A similarlj^ perfect membrane separ t ing two solutions in which the cations are not the same would also give rise to a potential , the so-called bi-ionic potential (B . I .P . ) . Although reproducible B. I .P . ' s are easily determined, this type of potential is inherently unstable, since the two cations will tend to diffuse through the membrane unt i l their mixed concentrations are identical on both sides. There is no electrostatic barr ier to this mutua l diffusion. The reproducible B. I .P . which is init ial ly measured (when no difftision has occurred) appears to be a function of the activities of the cations separated by the membrane and their transference numbers and activity coefficients within the membrane.
Membranes have been made in the laboratory by the process of compacting a powdered artificial or na tu ra l cation-exchange material (clay) under high pressure and bonding the compacted particles by filling the interstices between them Avith an insulat ing jjlastic. The best of these membranes appear to be almost perfect. Such membranes have a cation-transference ninnber which is very close to unity, i.e., they have only a very small anion " l e a k . " In general, however, most membranes are not perfect and in such cases the passage of anions into the membrane pores becomes possible. The distr ibution of anions and cations within and without the membrane is then controlled by a Donnan distr ibution. In such a distr ibution the product of the cation and anion activities inside the membrane is equal to the same product in the solution in which the membrane is immersed. Owing to the presence of fixed negative charges wi thin the pores, it follows that the cation activity within the membrane is higher and the anion activity lower than in the external solution. The ionic strength is now also a factor of considerable importance. The higher the ionic
* It is also of interest to note that if such a membrane has a finite hydraulic permeability, water forced through the membrane will not contain salt. This has been experimentally verified. Thus a perfectly ion-selective membrane would be a perfect sieve to remove salt from water or to concentrate salt on one side. It may be noted that if natural shale membranes are substantially impervious to anions (as their electrochemical performance indicates) they would affect the saturation of salts in water expressed from them during- compaction. This would serve to explain thermodynamically a property of shales that was postulated as a necessity by de Sitter (19 47) in his theory of the diagenesis of oil-field hrines.
290 CLAYS AND CLAY TI^CHNOLOGY I Bull. 169
strength of the external solution, the greater the anion activity (and concentration) within the membrane.
If a membrane of imperfect ionic selectivity is used to separate, for example, two sodium chloride solutions, then each face of the membrane adjusts itself so as to be in Donnan equilibrium with the solution in contact with it. "Within the membranes is formed a liquid junction potential between the different concentrations of anions and cations characteristic of these two Donnan distributions. Tf the ionic activity of the fixed charges within the membrane, expressed as gram moles per 1,000 grams of water within the pores of the membrane, is A, it is possible to compute the potential across the membrane as a function of A, the concentrations of the external solutions and the mobilities of the anions and cations within the membrane. This calculation forms the basis of the M.S.T. theory of membrane behavior. The total potential is composed of three separate components; a Donnan potential at each membrane face and a liquid junction potential within the membrane.
For NaCl solutions this may be represented as
-Membrane
Solution 1
Na* = Oi
CI- = rti
-A + V A' + 4a,' CI- = ' Cl-
2 1
Na* = CI- + 4 1 Xa<
A + V A- + 4ar
— > •
-A + VA- + 403-
2
= CI- + .1
A + V A- + 402=
Solution 2
Nil* = oa
Cr = (I.
Donnan Potential
#1
Liquid .Junction I'otential
RT
Donnan Potential
#2
Donnan Potential # 1 = In F
V ' ) Liquid Junction Potential
RT -V-in T V A= + 4ai'> + VA~\
RT Donnan Potential #2 = In -
^ / A + VA^ — 4 a / \
V 2 )
Here V =z where Z/NH and Z7ci are the sodium
and chloride ion mobilities within the membrane.
The total potential is thus RT ai- A + -^ A^ + iai
B = ]»— •
F 02 A + V A" + iax^
^T p v A^ + 4ai= + VA~\ Ulnl I
F \j^'A^+ 4:02^ + VAJ • + VA_
(5)
If A » «! or a2 eqiiation (5) reduces to the Nernst equation, BT/F In a^/d'l- On the other hand if A « a-^ or a2 equation (5) reduces to the ordinary liquid-junction potential E == BT/F TJln ai/a-y- These potentials thus represent the upper and lower limits possible.
Equation (5) shows that when a\ or a2 are small by comparison with A the potential developed across a charged membrane may be expected to approximate closelj^ to the Nernst potential. The larger the absolute
THEORETICAL POTENTIAL
4731
-0.5 0.0 0.5 1.0 -LOG NaCI NORMALITY
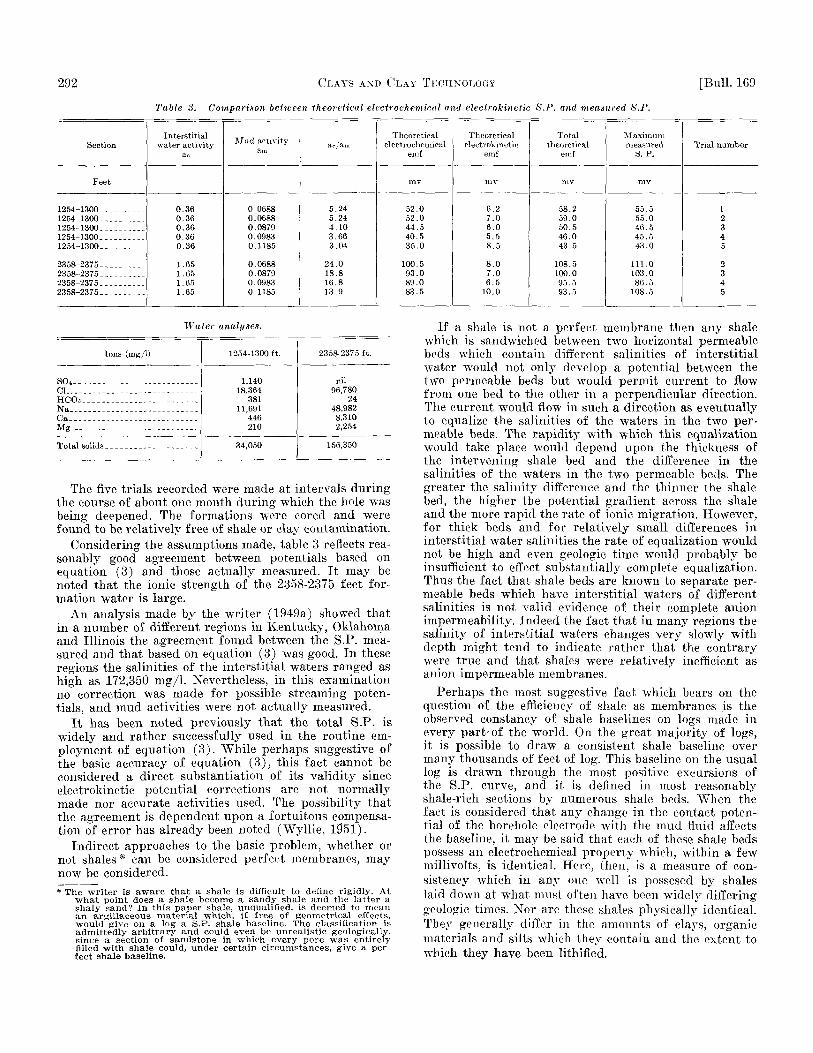
FIGURE 8. Potentials across sandy shales separating O.OIN NaCl solutions from NaCl solutions of increasing concentrations.
value of A, the higher will be the permissible activities (concentrations) which may be used before the potential developed seriously diverges from the Nernst potential. Thus it may be seen that, qualitatively at least, the data tabulated in table 1 are indicative of two charged membranes of which one, the Woodford shale, has a higher effective charge, A, than the Conemaugh shale. While both shales tend to give potentials obeying the Nernst equation when the activities tt] and a2 are small, the Conemaugh shale diverges more from the Nernst equation than does the Woodford when these activities become larger.
A more convenient way of showing this effect is to maintain one activity, a2, at a constant and small figure and progressively to increase the activity ai. Then a plot of potential on a linear scale against activity, ai, on a logarithmic scale will give a straight line having a poten-

P a r t V I I ] CLAY TECHNOLOGY IX THE PETROLEU^F IXDT'STRY 291
t ial cliang-e equal to (RT/F) or 59.17 mv at 25° C for each tenfold increase in «i if the Nernst equation is obeyed. F igure 8 shows some typical results obtained on a series of somewhat sandy shales taken from different depths in the same well. All but one of these shales give potentials which follow the Nernst equation when the activities are small. The potentials diverge progressively fr(mi the Nernst equation as the activity of the one solution is progressively' increased. The potentials at high activities are always lower than the Nernst potential as would be expected if an increasing proportion of current were being carried by anions.
Clearly the shales which gave rise to the data in figure 8 are very far from being ideal membrane electrodes. Although superior to these in their behavior, the Woodford and the Conemaugh shales used to obtain the data of table 1 are likewise not ideal. The writer and his associates have now tested the electrochemical performance of large numbers of shale samples obtained from wells in all par t s of the world, and it can be said tha t only a few of these specimens were superior to the Woodford shale specimen used to obtain the data of table 1. The great majori ty of shale specimens gave potentials, when separat ing solutions of high ionic strength, which were considerably below the theoretical Nernst potential.
The data obtained indicate that when measured in the laboratorj ' most shale specimens do not act as ideal membranes through which electric cur ren t is effectively carried only by cations. The data and the previous discussion also serve to explain the observation of Williams noted above. Unless a systematic investigation is made, the potentials given by different shale specimens when separat ing identical pai rs of solutions appear quite unpredictable and entirely a function of the na ture of the shales employed. And indeed these potentials are a function of the shales, or at least of their s t ructure , since the shale composition probably controls the extent of anion leak. Alternatively, the physical and chemical na ture of the shales, following the lines of the M.S.T. theory, may be said to control the magnitude of the charge, A, and the eat ion/anion int ramembrane mobility ratio.
I t follows then, if all shale specimens examined in the laboratory are found to deviate to greater or lesser extents from the ideal behavior quant i ta t ively expressed by the Nernst equation, tha t equation (3) , which is based on ideal behavior, is not generally applicable. Specifically, apa r t from any other disabilities from which it might suffer, such as the assumption tha t the critical ions affecting the shale are sodium ions only, equation (3) would be expected to hold fairly generally only if intersti t ial waters were of low ionic strength. F r o m a practical s tandpoint equation (3) would then be worthless.
Clearly the question of the ideality of shales as membrane electrodes when in situ in the ear th represents, from a practical standpoint , the crux of the entire problem.
The Ideality of Shale Beds in Situ as Membrane Electrodes. To settle the question whether shale beds in situ can be considered as substantially perfect negatively charged membranes is not easy. Several approaches are possible. Certain of these are direct, others involve
purely deductive reasoning. None are entirely satisfactory.
The direct approach is clearly to check equation (3) by actual measurement. That is, to compare salinities computed using equation (3) with those actually measured. To achieve this sat isfactorih' and with the degree of accuracy required for a t ru ly valid test is not easy. I t is imperative tha t the total S.P. be accurately measured opposite a ver j ' thick clean formation if a s tandard S.P. log is used, or preferably by using a static S.P. log. The total S.P. must then be corrected for an electrokinetic potential component if one exists. The activity of the mud must be measured. This may be done using a synthetic membrane electrode of very high ionic selectivity (Wjdlie and Patnode, 1950). While there are indications that a ra ther good activity may be derived from the resistivity of the mud filtrate by considering the filtrate as a pure solution of sodium chloride, sufficient experience has not yet been accumulated to suggest tha t this is invariably t rue . Some of the data obtained to date are given in table 2. Theoretically, however, unless the filtrate is composed onlj^ of soluble sodium salts, the propert ies of the membrane must influence somewhat the activity measured. That is, the activity with respect to the measuring electrode is theoretically not exactly its activity with respect to shales unless the filtrate solution is monocationic. The reason for this will be shown below. However, unless there is a considerable percentage of ions other than sodium dissolved in the mud the error is likely to be negligible by comparison with other errors.
Tahle 2. Relationship Itetween mud activity directly measured using an Amherlite IH-100/pohjstyrene electrode (mud against standard SaCl solution) and the activity computed from the mud filtrate resistivity assuming the filtrate to he a sodium chloride solution.
Nature of mud Mud resistivity and
temperature ohm-meters
Mud filtrate resistivity and temperature ohm-meters
Measured activity molality
.Activity from filtrate resistivity molality
Caustic-quebracho 1.7 at ,50°F 1.8 at 70°F 0.9 at 70°r 1.5 at 60°F 7.9 at 76"^ 2.0 at 76°r
0.93 at SOT 0.97 at 70°F 0.56 at 70°F 0.98 at 60°r 5.9 at 76''r 2 . 0 a t 76°F
0.1045 0.088 0.14S 0.099 0.0137 0.053
0.105 1.7 at ,50°F 1.8 at 70°F 0.9 at 70°r 1.5 at 60°F 7.9 at 76"^ 2.0 at 76°r
0.93 at SOT 0.97 at 70°F 0.56 at 70°F 0.98 at 60°r 5.9 at 76''r 2 . 0 a t 76°F
0.1045 0.088 0.14S 0.099 0.0137 0.053
0.081 Bentonite Bentonite Natural - . .. Natural ^ ,
1.7 at ,50°F 1.8 at 70°F 0.9 at 70°r 1.5 at 60°F 7.9 at 76"^ 2.0 at 76°r
0.93 at SOT 0.97 at 70°F 0.56 at 70°F 0.98 at 60°r 5.9 at 76''r 2 . 0 a t 76°F
0.1045 0.088 0.14S 0.099 0.0137 0.053
0.135 0.092 0.0105 0.038
Trials fulfilling these rigid conditions have been few. The data from one, held in a well in Oklahoma, are given in table 3. In table 3 the calculations of the electrochemical S.P. were based on sodium chloride solutions of concentrations equal to the total dissolved solid contents of the waters produced. The streaming potentials were derived from laboratory measurements made on mud samples taken at the time of logging. These samples were heated dur ing the measurements to the temperatures Avhich obtained in the hole opposite the formations. Mud activities were measured with Amherli te IR-lOO/Poly-styrene electrodes. Pressure differentials across the filter cakes were determined by direct measurement of the formation pressures and the hj 'drostatic pressure of the mud column.
292 CLAYS AND CLAY TKCIINOLOGY
Tuhte 3. Comparixon ietween theoretical electrochemicul and electrokinetic S.P. and measured S.P.
[Bull. 169
Section Interstitial
water activity ac
Mud activity am
ae/ani Tlieoretical
clectroclieniical emf
Theoretical electrokinetic
emf
Total theoretical
emf
Maximum measured
S. P. Trial number
Feet m v m v m v m v
1254-1300 1254-1300
0.36 0.36 0.36 0.36 0.36
1.65 1.65 1.65 1.65
0.0688 0.0688 0.0879 0.0983 0.1185
0.0688 0.0879 0.0983 0.1185
5.24 5.24 4.10 3.66 3.04
24.0 18.8 16.8 13.9
52.0 52.0 44.5 40.5 35.0
100.5 93.0 89.0 83.5
6.2 7.0 6.0 5.5 8.5
8.0 7.0 6.5
10.0
58.2 59.0 50.5 46.0 43.5
108.5 100.0 95.5 93.5
55.5 55.0 46.5 45.5 43.0
111.0 103.0 86.5
108.5
1 2
1254-1300 1254-1300 1254-1300
2358-2375 _
0.36 0.36 0.36 0.36 0.36
1.65 1.65 1.65 1.65
0.0688 0.0688 0.0879 0.0983 0.1185
0.0688 0.0879 0.0983 0.1185
5.24 5.24 4.10 3.66 3.04
24.0 18.8 16.8 13.9
52.0 52.0 44.5 40.5 35.0
100.5 93.0 89.0 83.5
6.2 7.0 6.0 5.5 8.5
8.0 7.0 6.5
10.0
58.2 59.0 50.5 46.0 43.5
108.5 100.0 95.5 93.5
55.5 55.0 46.5 45.5 43.0
111.0 103.0 86.5
108.5
3 4 5
2 2358-2375--
0.36 0.36 0.36 0.36 0.36
1.65 1.65 1.65 1.65
0.0688 0.0688 0.0879 0.0983 0.1185
0.0688 0.0879 0.0983 0.1185
5.24 5.24 4.10 3.66 3.04
24.0 18.8 16.8 13.9
52.0 52.0 44.5 40.5 35.0
100.5 93.0 89.0 83.5
6.2 7.0 6.0 5.5 8.5
8.0 7.0 6.5
10.0
58.2 59.0 50.5 46.0 43.5
108.5 100.0 95.5 93.5
55.5 55.0 46.5 45.5 43.0
111.0 103.0 86.5
108.5
3 2358-2375__ _._
0.36 0.36 0.36 0.36 0.36
1.65 1.65 1.65 1.65
0.0688 0.0688 0.0879 0.0983 0.1185
0.0688 0.0879 0.0983 0.1185
5.24 5.24 4.10 3.66 3.04
24.0 18.8 16.8 13.9
52.0 52.0 44.5 40.5 35.0
100.5 93.0 89.0 83.5
6.2 7.0 6.0 5.5 8.5
8.0 7.0 6.5
10.0
58.2 59.0 50.5 46.0 43.5
108.5 100.0 95.5 93.5
55.5 55.0 46.5 45.5 43.0
111.0 103.0 86.5
108.5 4
2358-2375 ^.
0.36 0.36 0.36 0.36 0.36
1.65 1.65 1.65 1.65
0.0688 0.0688 0.0879 0.0983 0.1185
0.0688 0.0879 0.0983 0.1185
5.24 5.24 4.10 3.66 3.04
24.0 18.8 16.8 13.9
52.0 52.0 44.5 40.5 35.0
100.5 93.0 89.0 83.5
6.2 7.0 6.0 5.5 8.5
8.0 7.0 6.5
10.0
58.2 59.0 50.5 46.0 43.5
108.5 100.0 95.5 93.5
55.5 55.0 46.5 45.5 43.0
111.0 103.0 86.5
108.5 5
0.36 0.36 0.36 0.36 0.36
1.65 1.65 1.65 1.65
0.0688 0.0688 0.0879 0.0983 0.1185
0.0688 0.0879 0.0983 0.1185
5.24 5.24 4.10 3.66 3.04
24.0 18.8 16.8 13.9
52.0 52.0 44.5 40.5 35.0
100.5 93.0 89.0 83.5
6.2 7.0 6.0 5.5 8.5
8.0 7.0 6.5
10.0
58.2 59.0 50.5 46.0 43.5
108.5 100.0 95.5 93.5
55.5 55.0 46.5 45.5 43.0
111.0 103.0 86.5
108.5
Water analyses.
Ions (mg/1) 1254-1300 ft. 2358-2376 ft.
SO4 CI HCO3 Na - . -- ---
1,140 18,364
381 11,691
446 210
nil 96,780
24 48,982
Ca Mg
1,140 18,364
381 11,691
446 210
8.310 2,254
34,050 156,350 34,050
The five trials recorded were made at intervals during the course of about one month during which the hole was being deepened. The formations were cored and were found to be relatively free of shale or clay contamination.
Considering the assumptions made, table 3 reflects reasonably good agreement between potentials based on equation (3) and those actually measured. It may be noted that the ionic strength of the 2358-2375 feet formation water is large.
An analysis made by the writer (1949a) showed that in a number of different regions in Kentucky, Oklahoma and Illinois the agreement found between the S.P. measured and that based on equation (3) was good. In these regions the salinities of the interstitial waters ranged as high as 172,350 mg/1. Nevertheless, in this examination no correction was made for possible streaming potentials, and mud activities were not actually measured.
I t has been noted previously that the total S.P. is widely and rather successfully used in the routine employment of equation (3). While perhaps suggestive of the basic accuracy of equation (3), this fact cannot be considered a direct substantiation of its validity since electrokinetic potential corrections are not normally made nor accurate activities used. The possibility that the agreement is dependent upon a fortuitous compensation of error has already been noted (Wyllie, 1951).
Indirect approaches to the basic problem, whether or not shales * can be considered perfect membranes, may now be considered. * The writer is aware that a shale Is difficult to define rigidly. At
what point does a shale become a sandy shale and the latter a shaly sand? In this paper shale, unqualified, is deemed to mean an argillaceous material which, if free of geometrical effects, would give on a log a S.P. shale baseline. The classification is admittedly arbitrary and could even be unrealistic geologically, since a section of sandstone in which every pore was entirely filled with shale could, under certain circumstances, give a perfect shale baseline.
If a shale is not a perfect membrane then any shale which is sandwiched between two horizontal permeable beds which contain different salinities of interstitial water would not only develop a potential between the two permeable beds but would permit current to flow from one bed to the other in a perpendicular direction. The current would flow in such a direction as eventually to equalize the salinities of the waters in the two permeable beds. The rapidity with which this equalization would take place would depend upon the thickness of the intervening shale bed and the difference in the salinities of the waters in the two permeable beds. The greater the salinity difference and the thinner the shale bed, the higher the potential gradient across the shale and the more rapid the rate of ionic migration. However, for thick beds and for relatively small differences in interstitial water salinities the rate of equalization would not be high and even geologic time would probably be insufficient to effect substantially complete equalization. Thus the fact that shale beds are known to separate permeable beds which have interstitial waters of different salinities is not valid evidence of their complete anion impermeability. Indeed the fact that in many regions the salinity of interstitial waters changes very slowly with depth might tend to indicate rather that the contrary were true and that shales were relatively inefficient as anion impermeable membranes.
Perhaps the most suggestive fact which bears on the question of the efficiency of shale as membranes is the observed constancy of shale baselines on logs made in every part-of the world. On the great majority of logs, it is possible to draw a consistent shale baseline over many thousands of feet of log. This baseline on the usual log is drawn through the most positive excursions of the S.P. curve, and it is defined in most reasonably shale-rich sections by numerous shale beds. When the fact is considered that any change in the contact potential of the borehole electrode with the mud fluid affects the baseline, it may be said that eac h of these shale beds possess an electrochemical property which, within a few millivolts, is identical. Here, then, is a measure of consistency which in any one well is possesed by shales laid down at what must often have been widely differing geologic times. Nor arc these shales physically identical. They generally differ in the amounts of clays, organic materials and silts which they contain and the extent to which they have been lithified.

Part VII] CLAY TECHNOLOGY IX THE PETROLETTM INDUSTEY 293
For simplicity a clean, shale-free permeable bed separating two shale beds may be considered. It will be assumed, as seems generally to be the case, that within the permeable bed the salinity of the interstitial water is uniform. Then the S.P. deflection at the top of the permeable bed results from a chemical interaction between the mud and interstitial water with the shale lying above the permeable bed. This interaction leads to the production of an emf which in turn causes the S.P. curve to deflect a definite amount. If the permeable bed is sufficiently thick, the ohmic potential changes in the borehole which affect the borehole electrode potential do not persist over the entire bed thickness. The S.P. deflection climbs to a plateau and the borehole potential does not alter until the electrode is subjected to the etfeets of current circulation which result from the electrochemical interaction of the lower shale bed with the interstitial water and mud. The potential change is now in a sense opposite to that experienced by the electrode at the top of the bed and the S.P. deflects from its plateau opposite the permeable bed, finally attaining a fresh value opposite the lower shale bed. If the potential opposite the lower shale bed is identical with that opposite the upper, that is, if there is a constant shale baseline, it follows that the potential given by the electrochemical interaction of the lower shale bed is identical with that given by the upper. By the same token, if the shale baseline is maintained over thousands of feet, it follows that each shale which separates a permeable bed behaves in an identical fashion* electrochemically.
This point may be further clarified if it is noted, as pointed out by Doll (1949), that the S.P. curve is symmetrical. A constant "sand line," that is a line drawn through the maximum negative excursions of a conventional log, is 7101 obtained unless all interstitial waters in permeable beds are identical. Such sand lines are obtained (fig. 2) but generally over small distances compared with shale baselines. Thus, as noted above, the existence of a constant shale baseline extending over an entire S.P. log implies remarkable electrochemical homogeneity amongst all the shales in the borehole.
Now the electrochemical potential developed by each shale above and below a permeable bed is controlled by the same two fluids, the mud and the same interstitial water. If the two shales are imperfect, this implies that each shale possesses an identical anionic leak. On the basis of the M.S.T. theory each possesses the same charge, A, and the same ratio of cation and anion mobilities. Figure 8 shows that leaky membranes do not show the same electrochemical potentials when separating identical solutions except in the range of concentration in which they follow the Nernst equation. Figure 8 may be considered typical of results obtained with imperfect membranes. Even when membranes are made from identical percentages of identical cation exchange material and plastic and are moulded in an identical manner, it is extremely rare for two membranees to give identical potentials in the concentration range in which the Nernst potential is not followed. It is, however, pertinent to note that in the range where the Nernst equation is obeyed
* The fact that certain thin shale beds do not return to the baseline obtained In conventional S.P. logging- is purely a geometrical effect and does not affect the argument developed. Doll (1949) has adequately treated this point.
CONNATE WATER
^zzzzzzzza)
HYDROUS MICA
<@ KAOLIN
o SILICA
FiGL'RE 0. Electrochemical structure of sliale.
the physical nature of a non-homogeneous electrode, or the amount or tj'pe of cation exchange material it contains are of no importance. This is to be expected theoretically and has been demonstrated experimentally (Wyllie and Patrode, 1950).
The weight of existing evidence seems to indicate that shales in situ in the earth do act as perfect membrane electrodes. In this event equations of the type of equation (3) may be expected to be applicable to the electrochemical potentials developed when all conditions for their application are fulfilled. Nevertheless, it must be pointed out that if further research on the nature of shales and on the structure of charged membranes should disclose that the value of A and the cation/anion mobility ratio in all shales could reasonably be identical, this conclusion could no longer be sustained. In this paper the fact that shales in situ do obey the Nernst equation will be assumed and the consequences of that assumption will be examined.
A Tentative Electrochemical Structure for Shales. In figure 9 is given a tentative two-dimensional physical picture of the essential structure of shales from the electrochemical standpoint. For this purpose the principal con.stituents of shale are assumed to be silica, hydrous mica, and kaolin. These components, for the marine shales which are of patrieular importance in petroleum exploration, have been found by the writer's colleagues to be typical. These components appear also to be in essential agreement with the results reported by others (Millot, 1952). In most shales, the silica particles vary in size, many being similar in size to the clay particles. The plate-like structure of the clays makes them tend to orientate themselves parallel to the bedding planes of the shale. In figure 9 the particles of hydrous mica are drawn surrounded by a water sheath in which are located the exchangeable ions. In this same sheath there will, therefore, exist a considerable negative electrostatic charge, a force repelling anions. Between the particles of clay and silica there is water containing dissolved salts. In the figure the line of demarcation between the water sheaths surrounding the clay particles and the inter-particle water has been drawn for convenience of presentation. Actually this is artificial and a swarm of ions gradually changing in composition is to be expected.
Under the enormous pressure of compaction resulting from the weight of overlying strata, the particles of all kinds are forced tightly together. If the pressure is such that all continuous paths for ions through the shale involve at some point passage through tlie water sheatli surrounding a clay particle, it will mean that within the .shale will exist a surface across which electric current

294 CLAYS AND C L A T TECHNOLOOY [Bull. 169
SPONTANEOUS-POTENTIAL millivolts
m -p RESISTIVITY
-ohms. mVm RESISTIVITY -ohms. mVm
|20| ^
-m + 9
2
16",
Ah
6 4 " NORMALS ? 10
20' 8 " LATERAL
UL |20| ^
-m + 9
2
16",
Ah PI 1 KIORM 2
|20| ^
-m + Q
5
SO u irsu p <r f l i C iftO p HiAH ^9 ^r .a ie 100.
i 1* i >
Q
5 • - « ^
1 T^ L 3
Q
5 ^^ -=» ^ 1 5 o
- ( *^ • - 1 ' 3
o - ( *^
^ o
^ _x
o
^ — -
o
^ — -
3>
( ^ f
- -
^ i -S
3> ^
>
^ ^ - - -.'
'•—. :P»
i ^
3> ^
>
^ ^ - - -.' i
3> ^
>
^ ^ - - -.'
I C^ 3> ^
>
^ ^ - - -.'
I o
—^
i "
^ y
o
—^
i "
-- > ^ » - •
o
—^
i "
-- <c y
o
—^
i "
--
^ <i^
o
—^
i "
--
. J •
N
-I — ,
.
£.
" 1 ^
E
i
N
-I — ,
.
£.
" 1 , / > i i
N
^ .
£.
" 1 <
1 r N
. \ \ ,
t N ' l « 1" J
J^ o < • ^ - • ~
—
^ ^ ^
o
' • • • \ • ^ - • ~
— —
>• •
; : >
o
/ •
_r ^ ' • ^ - • ~
— —
^
1 ./
• ^ - • ~
— r
J 2 _2 >
• ^ - • ~
—
s 1 i r - i -— — , r f - t- -— — / f -5 - — f"
~ » -5 - — « ^
i /» o /
L 1
f ^ \ ^ 4 1 ^ T i ^ 5 4 ^ B- T
• -^ r < k 1 5 ^ az_ 60 4 -t ^ ^
> 3 o — o :k r -
| : 1 < > 5: _J i ^ T > • H K X
FIGURE 10. Shale baseline shift of 60 mv apparently resulUng from a gradation of interstitial water salinity.

Part VII] CLAY TECHNOLOGY IX THE PETROLEUJI INDUSTRY 295
can only be carried by cations; i.e., the anion transference will be zero. Prom a thermodynamic standpoint, if there is such a surface in the shale, the shale will function as a perfect negativelj' charged membrane.
It is, perhaps, not immediately obvious that the concentration of the connate water in the shale, which largely controls its electrical resistivity, does not affect the potential developed. Thus, marine shales frequently show a lower resistivity than non-marine shales (Clan-det, 1950) although electrochemically both shale types may behave similarly. This fact may be demonstrated if a system is considered composed of a niimber of perfect membranes separated by solutions of different concentration. For convenience all the solutions will be considered to consist of NaCl, but the result can be readih-generalized. Consider:
NaCl
Then the potential is
NaCI
Membranes -
RT a, RT «2 RT a-^ RT a^ E = In 1 In \ In 1 In —
F tto F ao, F tti F a.-,
RT oi In —
F a. (6)
That is, only the exterior solutions affect the over-all potential developed. The electrical resistivity of the system is a function of the resistivities of the membranes and the solutions. If the conducting paths in the membranes are small by comparison with the paths through the solutions, the latter will be dominant. This appears to be the physical situation in shales.
If overburden pressure is removed from a shale, a certain degree of elastic expansion is to be anticipated. This alone will tend to give rise to leak paths available to anions, for the general effect will be to decrease the effective charge, A, of the membrane. For while the charges on the clays are not altered, the effective volume in which they are disposed will be increased, leading to a diminution in the molal activity, A. In laboratory practice this effect is frequently reinforced by unavoidable drj'ing and cracking of the shale which gives rise to even larger leak paths. Hence it is not surprising that the electrochemical performances of shale samples when tested in the laboratory are often inferior to their apparent performances in situ.
Experimental verification has been found of the postulated effect of pressure. Thus membranes formed by moulding powdered shale in lucite under a pressure of 5,000 psi have been found to possess an electrochemical performance superior to that of the shale samples before powdering (Wyllie and Patnode, 1950). An analogous effect appears to be obtained when using synthetic sul-phonated phenol formaldehyde cation exchange resins (Wyllie, 1952).
Shale Baseline Shifts. An abrupt shift of the shale baseline is sometimes observed. Although the phenomenon is comparatively rare it unquestionably exists. AVhen considering such shifts, it is wise to concentrate on those
which are characteristic of a particular environment and which are reproduced on all logs run in a particular field. Isolated shale baseline shifts on logs are more often the consequence of an instrumental fault in the logging equipment than the manifestation of a genuine phenomenon.
In figure 10 is reproduced a log which shoAVS a well-defined shale baseline shift. This shift is characteristic of all logs in the area. Prom figure 10 it maj^ be seen to amount to +60 mv.
On the log there is a good shale baseline down to 1760 feet and another below 1875 feet. The maximum S.P. deflection of the permeable beds above 1760 feet is rather constant and amounts to —37 mv. The maximum deflection of the beds at 1835-1860 feet with reference to the lower shale baseline is —97 mv. The mud activity is 0.033 g moles/1000 g water. Application of equation (3) gives an interstitial water activity of about 0.064 corresponding to —37 mv and 0.74 corresponding to —97 mv. These activities in turn correspond to NaCl solutions with salinities of about 5,000 mg/1 and 66,000 mg/1 respectively. At the formation temperature of 86° F , solutions with these salinities would have resistivities of about 1.0 ohm-meter and 0.09 ohm-meters.
It has been established that in the section 1680-1780 feet the formation factor (1942) of the permeable sections is rather constant. Thus the slope of the resistivity curves between these depths appears to reflect a rather steady change in interstitial water resistivity. The resistivity charge is from about 1 ohm-meter to 10 ohm-meters, a ratio of about 10 to 1. This ratio agrees closely with the ratio of the calculated water resistivities, 1 ohm-meter and 0.09 ohm-meters. Figure 10 appears to be an excellent example of a shale baseline shift which results because the salinity of the water in a series of rather shaly permeable beds changes, so that the water in contact with the shale which constitutes a part of the upper shale baseline is very different from the water in contact with shale which constitutes a part of the lower shale baseline. However, both the upper and lower shales apparently have electrochemically identical properties.
The change in salinity which is shown in figure 10 may readily be discerned on the log. Hence the conclusions drawn from the S.P. curve can be easily checked against the data of the resistivity curves. Were this change to have taken place within a very thin permeable bed, as may be possible under suitable conditions of flushing from an outcrop, conclusions based on the form of the S.P. curve would be almost impossible to check on the resistivity curves and the shift would be correspondingly more inexplicable. It is difficult to say how many baseline shifts are the result of salinity changes in permeable beds and how many result from genuine differences in shale nature. It does not seem unreasonable to expect a shale baseline shift at a facies change, particularly from marine to nonmarine, and it is believed that these have been observed. Such ett'ects appear to be bound up with the theory of the bi-ionic potential.
It has been assumed in the foregoing discussion and calcidations that interstitial waters and mud fluids can be treated as sodium chloride solutions. This is an oversimplification and must introduce errors. The errors introduced may be divided into two parts. Those arising from the effect of cations other than sodium on the

296 CLAYS AND CLAY TECHNOLOGY [Bull. 169
potential across the shale and those arising from the effect of both cations and anions, other than sodium and chloride, on the liquid-junction potential which is formed between the intersti t ial water and the mud. \Yhen a formation is shale-free the la t ter may easily be assessed if l iquid-junction potentials between solutions having- compositions akin to those actually encountered in the field are computed. These potentials may be compared with the l iquid-junction potentials computed for sodium chloride solutions of similar ionic strength. The la t ter is the assumption generally made as a practical convenience to permit the solution of equation (3 ) . The error involved is generally minor.
If the formation is not substantiall.y shale-free, the error becomes more difficult to assess. Theoretically, however, a shaly permeable bed is merely a shale with large anion leak paths. This concept is given formal t rea tment below.
The problem of formulat ing equations to define the B.I .P. has been considered hy both Marshall (1948) and Sollner (1949). The work of Sollner is perhaps the more extensive. Sollner considers tha t in a membrane in which cation transference is un i ty the sign and magnitude of the B.I .P . are controlled by the rat io of the adsorbabilities of the two ions within the membrane and by the ratio of their in t ramembrane diffusion velocities. Steric hindrance effects within the membrane may also play a par t . F o r example, if certain pores in a membrane are so small tha t they will admit only one of the two ions being considered, the adsorbability of the smaller ions in such pores will be miich greater than their adsorbabili ty elsewhere in the membrane. Basically, however, Sollner appears to consider tha t the distr ibution of the two ions within the membrane is everj'where the same. Marshall has formally t reated bi-ionic potentials as a liquid junct ion potential to which the Henderson equation may be applied. Anion mobilities are considered to be zero. This t rea tment is quite permissible thermodynamically and its validity is not dependent upon any details of the electrode mechanisms except for the implicit assumption tha t the distr ibution of the ions to which the membrane is selective is identical on the membrane faces in contact with the solutions and in the solutions themselves. This assumption does not seem to involve anjr numerical errors when monovalent ion mixtures are considered. However, the concept does not seem to be theoretically sound when mixtures of monovalent and divalent ions are considered, for in such cases it is well known tha t the divalent ion is preferentially adsorbed by an ion-exchange mater ia l when the ionic s t rength of the mixture of monovalent and divalent ions is small. In general the distr ibution of ions on the ion-exchange mater ia l is not identical with the distr ibution of the same ions in a solution in contact with the ion-exchange material but is a function of the ratio of concentrations of the two ions in the solution and its ionic s t rength.
The potential across a perfectlj^ cation selective membrane which separates two monovalent ion solutions, for example NaCl and KCl, may then be considered as the sum of two Donnan potentials at the faces of the membrane in contact with the solutions and a l iquid junct ion potential formed inside the membrane. This l iquid junc
tion potent ia l is a function of the relative mobilities of the ions Na+ and K* within the membrane. This concept differs from tha t of Sollner, since the distr ibution of ions in a membrane when a B. I .P . is measured is not considered to be uniform. In fact it is considered that the membrane grades from a condition in which all its exchange positions are filled by K " ions at its interface with the KCl solution to a condition where all its exchange positions are occupied by Na+ ions. The lat ter condition exists at the interface of the membrane with the NaCl solution. More generally for mixed solutions of two ions of whatever valencj^, the distr ibution of ions on each membrane face is calculable if the distribution coefficients of the cation exchange material of the membrane is known for the ions considered. The liquid junct ion potential is formed within the membrane between the ions on each face of the membrane.
These considerations give rise to equations analagous to those of the M.S.T. theory if the membrane is not considered to be perfectly selective to one type of ion, e.g., cations. However, for ideally cation selective membranes the equations simplify, since the anions then play no pa r t except for their effect on the activities of the cations in the solutions. The following equations may be derived (see Wvllie, 1954, and Wvllie and Kanaan, 1954).
I. Monovalent — Monovalent e.g. NaCl versus KCl
RT ttK VK
E = In • F aifa TJ-Ka
Here ttK, ff.va are the ionic activities of the sodium and potassium ions separated by the membrane, UK/TISG is their ionic mobility rat io within the membrane (equal to the ratio of their transference numbers ) .
I I . Monovalent — Monovalent - j - Monovalent
e.g. NaCl versus NaCl + KCl
BT a'na+aKiUK/UNa) E = In
F a"-sa
Here aVo is the activity of the sodium ion in the mixed sodium and potassium solution, a"ya is the sodium ion activity in the pure sodium chloride solution.
III. Monovalent — Divalent
e.g. NaCl versus CaCla
RT a;\^^ V^JVca E In
2 F flea
BT
Asa +
2 P A^.alh^a—'iAcaUca
In-2Ac
if Ar
BT a'^sa = 1 n
2P aca
BT
2F
+ V.
In-Vc

P a r t V I I ] CLAY TECHNOLOGY IN THE PETKOLEUM INDUSTRY 297
Here the symbols are as before with the addit ion tha t Aca is the activity of calcium ions within the membrane when the membrane is wholly in the calcium form, and ^A'a the corresponding sodium activity when the membrane is whollj ' in the sodium form. The assumption that Aca = 2'-'i-Va implies that the activity coefficients of the calcium ions in the calcium form of the membrane is identical with the activity coefficient of sodium ions in the sodium form of the membrane. While quanti ta t ive information concerning such activity coefficients is lacking, this assumption may be in considerable error. Nevertheless the activity ratio, A^a/Aca, is constant and the approximate relationship given above based on a rat io of uni ty maj- be useful for certain qualitative applications of the relationship. The ratio Aya''2Aca is probably greater than uni ty .
IV. Monovalent -\- Divalent — Monovalent
e.g. NaCl + CaCla versus NaCl
RT aVa AKa BT E = I n • \
F a"^a aysji
ajiji [ t/.v«
If c
F
- 4 A - .
t Sa
(l-NaR
UNa
[TJca]
(2(axaB)--aca^
I
(Ui, -•i.Va
a.r,B • TJsa 2(a.vaB)2 • aca.
Uc OJ ^a
In-
Aua Vca
Here the symbols are as before. In addit ion a\-aR is the activity of the sodium ions on the membrane when it is in contact with a mixed solution of NaCl and CaCl2 which has a sodium ion activity in the mixed solution of aVa and a calcium ion activity of aca-
This complex equation may also be wri t ten in terms of the exchange coefficient of the sodium-calcium exchange. A similar but not identical equation per ta ins to the system monovalent -f- divalent versus monovalent.
V. Monovalent + Bivalent — Monovalent -{- Divalent
e.g. NaCl + CaCla versus NaCl + CaClo
This may conveniently be wri t ten as
BT a'iia RT x"yaB RT E = In \ Iw 1
F a"Na F x\aB F
Vca
yca
y.Va
2YCa
y.Va,
x'Ka
In
L' Xa
Vca
2yca
jKa.
2yca
+ • yA'a
Vca
yca
y.Va
2YCa
y.Va,
3:"Ka Vsa
Vca
2yc-(i
y.vii_
2y(7a
+ — yNa
Here a'sa and a".Ya are the activities of the sodium ions in the mixed sodium and calcium chloride solutions separa ted by the membrane; x'^aR is the fraction of the exchange sites occupied by sodium ions on the membrane face in contact with the solution i-ontaining sodium ions of activity a-i, and x'\iji is the corresponding fraction on the other membrane face. The rat io yca ' V-Va is the rat io of the activity coefficients of the calcium and sodium ions when the membrane is in the calcium or sodium form respectively.
Although still a simplification, the only cations in interst i t ial waters in permeable formations may be considered to be sodium and calcium. In general this is t rue, but occasionally the magnesium ion content is not negligible. As a divalent ion, however, magnesium can probably be lumped with calcium without the introduction of any serious error. In most, but not all, interst i t ial waters, the number of equivalents of sodium ion greatly exceeds the member of equivalents of calcium ion.
In the mud fluid the principal soluble cations are also sodium and calcium, with again the sodium ion predominat ing. Nevertheless, in modern lime-base muds the amount of soluble calcium can be appreciable. This has been shown by Bergman (1952).
A shale in situ may tlms be considered to separate two solutions which differ in ionic strength but both of which contain sodium and calcium ions. The equation derived as case V above should then be applicable.
Before the equation may be used it is necessary to consider what values x'^aR, X/'NOR are likely to have in na tu r a l shales. Should these be identical it is clear t ha t the equation of case V reduces to
BT a Na
E = In F a"y„
Thus if the fraction of exchange sites occupied by sodium ions on the shales in the borehole is identical with the fraction of exchange sites occupied by sodium on the shale face in contact with the interst i t ia l water in the permeable formation, the shale will obey the Nernst equation for the sodium ions in the interst i t ial water and the mud. I n this case the only effect of the divalent calcium ion will be to increase the ionic strengths of the solutions and otherwise to affect the sodium ion activities.
Now the magni tude of x'^aR, fl^e fraction of exchange sites occupied by sodium on the shale face in equilibrium with the interst i t ia l water, undoubtedly varies both Avith the ratio of sodium to calcium ions in the interst i t ial water and with the absolute concentrations of these ions in the water. Work by Case (1933) and Taylor (1929), shown in tables 4 and 5. suggest tha t although this fraction is variable it has an average of something over 0.7 in mar ine shales. Limited da ta obtained by the wr i te r ' s colleagues tend to confirm this figure. By and large the rat io will tend to be highest, for any Na/Ca rat io in an interst i t ial water, if the interst i t ial water is highly saline, and lowest in waters which are comparatively fresh. I n the extreme case of shales in the zone of surface waters, i t appears from table V tha t x'x„B approximates zero.
I n the borehole the situation is more difficult to assess. Although the usual Na/Ca rat io in the mud will be
11—91001

298 CLAYS AND CLAY TECHNOLOGY
Table J,. Data of E. il. Taylor (1929).
[Bull. 169
Company Location Depth in feet Horizon Na
Percent Na
Percent Ca
Gypsy Gypsy Gypsy Gypsy-Marland-Marland Amerada Amerada Atlantic W . G . O W. G.O W. G. O W. G.O W. G. O W . G . O Gulf Std. of Calif Std. of Calif.?---
Average-
Hughes, Olila Lincoln, Olcla Tulsa, Okla Osage, Oltla Grant, Okla Smith, Okla Smith, Okla Navarro, Tex Kern, Calif Kern, Calif Kern, Calif Kern, Calif Kern, Calif Kern, Calif Caddo, La Kettleman
3,300 3,303 2,048 2,584
5,317 5,112 2,985 2,590 3,612 3,613 3,595 3,597 3,.598 2,393 6,386
Top Cromwell-Top Prue Chattanooga— Simpson
Over Woodbine-Over Woodbine-Eagleford Miocene Miocene Miocene Miocene Miocene Miocene . Tokio 7
12.4 7.2 5.7 7.7
16.8 19.0 13.8 11.2
6.3 6.3 8.7 7.3 5.8
17.6 27.7 29.6
5.6 0.8 4.0 4.2
2.3 6.6 6.5 4.1 4.2 4.4 1.8 3.4 2.2 6.6 9.9 7.1
69 90 59 65
74 68 73 60 59 83 68 83 73 74 81
31 10 41 35
12 26 32 27 40 41 17 32 17 27 26 19
( N a and C a as me./ lOO g.)
much higher than in the interstitial water, the equilibrium calcium fraction of the clays on the faces of shale formations in the borehole may not greatly differ from the fraction on the faces of the same shales in contact with interstitial water. This would be the case because the low ionic strength of the usual drilling mud would lead to preferential divalent ion absorbtion. Hence in most cases the difference between x\^aR and x"}faR may be extremely small. The ratio of x't^aB to a;",voi? would then approximate unity.
For a baseline shift to occur in crossing a permeable bed in which the interstitial water is uniform, the ratio
X SaR
of for the upper shale bed would have to be X Satl
different from that for the lower shale bed. If the type of clay in these beds is similar, as seems to be the case, it seems possible that the exchange constants of the two
X iVd '^
beds are similar and therefore the ratio for the
X Ha^
two beds are virtually identical. Thus no baseline shift
Uifa JCa
would occur unless the ratios and differed Uca jNa
greatly. This would fit observations on logs. If, however, two shales dift'ered in their exchange
X Nati
constants thev could give rise to different ratios X"N,B
when separating tlie same two solutions containing Vxa
sodium and calcium ions. Probably in such eases Uca
JCa
and would also differ. Such an effect may be pos-
sible. Further work on the properties of clays in shales and their variation from shale bed to shale bed in a geologic column is necessary before the probability can be assessed. If, however, as stated by Millot (1952) kaolinitic minerals are characteristic of fluviolacustrine continental facies and illite of saline lagoonal and basic continental facies, it is not unreasonable to expect a baseline shift when a borehole passes from a non-marine to a marine sequence. Within each facies the baseline should be essentially constant.
As previously noted, if BT (I Na
x'xaB = x'\aB, E = In . F a"ya
In this event, the potential across the shale and therefore the entire S.P. measured will be less than that given by equation (3), which assumes that the total salt content of the interstitial water behaves as NaCl, not merely the actual NaCl content of the interstitial water. If, however, x"NaR is not equal to x'l/aR the potential is given by the equation of case V.
Assuming x'^aR = 0.7 and that when using high sodium/calcium ion ratio drilling muds the clays of the shale face in the borehole will be enriched with respect to sodium ions, the potential change may be calculated if certain assumptions are made. It will be assumed that x"saB = 1-0, i.e. all divalent ions on the shale in the borehole are replaced by sodium, the worst possible case.
Experiments with shales indicate that may be about Uca
5, although other experiments with synthetic membranes now in progress indicate that pressure may increase this
yca ratio considerably. The ratio is difficult to estimate
and for convenience will be considered to be unity.

P a r t VII1 CLAY TECHNOLOGY m THE PETROLEUM INDUSTRY
TaMe 5. Data of L. C. Case (1933).
299
Well
Koxana No. 1 Gypsy core drill Blacfcwell No. U _ _ Gypsy Petros No. 4 Gypsy Toge No. 4_ Pine Tiger No. 1___ Gypsy Toge No. 3 . Sinclair No. 2
Depth in feet
.3,635 646
2,923 2,,510 2,810 3,890 2,837 2,677
Horizon—remarks
Tonkawa series Lower Permian red shale Lower part of shale 20' above Gilcrease sand Above shaly sand—^ Woodford, just above Hunton limestone In contact with oil sand Between two streaks of Cromwell sand
Tulsa outcrop, 6' below base of Checkerboard limestone Tulsa outcrop sample, 25' below Checkerboard limestone-. Tulsa outcrop, underclay of coal 12' below Checkerboard
2-6" below coal ^ Tulsa outcrop, as above but 0-2" below coal Other Tulsa outcrop samples-
N a
15.6
0.0005 0.0013
0.0064 0.0059 0.0046 0.0079
.\verage
5.6 8.1
12.3 10.8 6.8 5.12
( \ ; i uiul Ca in nif . / lOO «.)
Percent Na
54 72 73 76 79 72 74 81
73
<0.1 <0.1
<0 .1 < 0 . 1 < 0 . 1 <0 .1
Percent Ca
46 28 27 24 21 28 26 19
>99.9 >99.»
>99.9 >99.9 >99.9 >99.9
BT x'\Jt Then In = -|-9.2 luv and the expression,
F x'i,aB
RT r VyJUca year yxa
F Uhui/Vca — 2yca/yA'o_
I' Xii yca yCa 2 H2
.f'xiiR V Ca JNa y.Va l!( =: —6.8 mv.
x"siiR '-Vi/ yca yca
Vca yNa yNa
The increase in the S.P. (actually an increase in the neg-ative S.P. recorded) would be 2.4 mv over that obtaining? if only the sodium ion activities in the two solutions were affecting the shale potential. F o r x'xaB = 0.5 a similar calculation gives the increase in negative S.P. as 5.6 mv. I t is seen that these effects are not large unless ;r'yaS is very small by comparison with x"f,,iR. I n muds which decrease x'\aB below x'saB (as may occur with some lime-base muds) the negative S.P. will be somewhat
• BT a'i,a reduced below the 1M figure. I t ma.y be noted
F a"i,a
tha t these potentials are not dependent upon the actual interst i t ial water salinity except inasmuch as this salinity affects the value of X'N^B. Thus their effects are greater
percentagewise when the ratio d Na
is small than when tt Na
it is large, and may be expected to be at a maximum in the case of relatively fresh intersti t ial waters.
I n general this analysis indicates tha t the electrochemical S.P. is likely to be more a function of the sodium ion content of the dril l ing mud and interst i t ial water than of the total saline contents. Thus equation (3) may be expected to give values for connate water
salinity which are somewhat too small. I t will serve best when applied to waters having a high p r imary salinity.*
The Electrochemistry of Shaly Sands. The effects of a laminated sequence of thin shale and clean sand beds on the shape and magnitude of a S.P. curve have been adequately discussed by Doll (1950a). I n the t r ea tment used by Doll it is assumed that the th in shale laminations are electrochemically perfect, i.e. are perfectly cation selective. Since these shales are subject to the full pressure of their overburden the wri ter believes this assumption to be justified. An experimental verification of Doll 's equations using log da ta from the Corpus Christi area of Texas has recently been made by Poupoii (1951). The agreement calculations based on log data and on Doll 's equations was good and lead to the con-
2t BT elusion that the value of
F in equation (3) was
about 80 mv. This value seems to indicate that the th in shale laminae were cation selective. Whethe r Poupon ' s isolated data are indicative of the general t r u t h of Dol l ' s assumptions is not certain.
The influence of interst i t ial shale or clay in a permeable bed is more difficult to assess quanti tat ively. On the assumption tha t each individual shale or clay par t ic le acts as an individual shale cell when it separates mud fluid from interst i t ia l water, Doll made approximate calculations to show that the S.P. opposite a shaly sand would be less than the value it would have opposite a clean sand containing identical inters t i t ia l water. Doll
I t ha.s recent ly been found (Wyll ie , 1952) t h a t wi th many art i f i cial m e m b r a n e s Ca++ ion appear.? to behave a s a monovalent ion, possibly a s Ca (OH)+. The da t a of McLean, B a r b e r and M a r shall (1951) g-iven in Table I of the i r pape r for po ta s s ium ag-ainst mixed solut ions of po tass ium and calc ium ions a r e a l so expl icable if the ca lc ium ion behaves a s a monova len t ion wi th a cons tan t m'obility wi th respect to po tass ium of abou t 1.9(). T h e m e m b r a n e used by these worke r s w a s a 600" C P u t n a m c lay membrane . However , sha le specimens so fa r tes ted give a nor mal d iva lent reac t ion wi th calcium ions. W^ere calc ium to behave a s a monova len t ion in the ea r th , the arg-uments g-iven above for basel ine shif ts would r ema in subs tan t i a l ly s imilar . However the potent ia l ac ross the shale would then tend to exceed t h a t g-iven by eaua t ion (,*?) pa r t i cu la r ly for in ters t i t ia l w a t e r rich in ca l c ium ion. The equa t ions of case TI a r e appl icable .
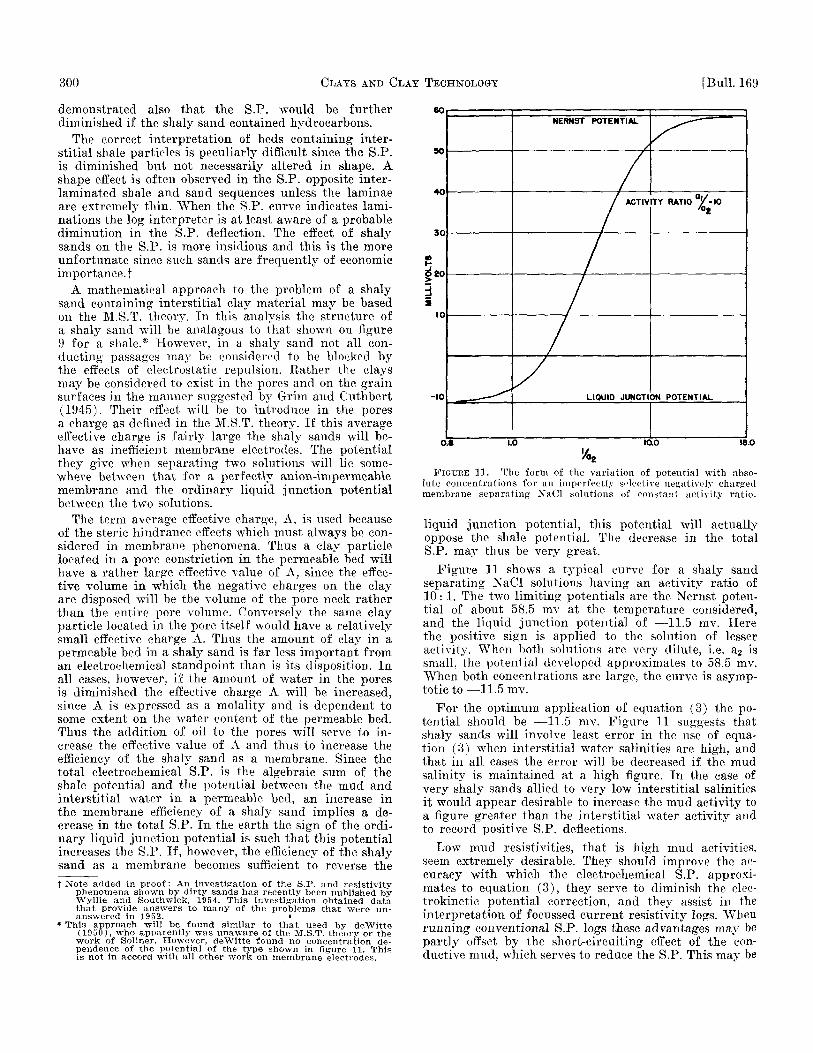
300 CLAYS AND CLAY TECHNOLOGY [Bull. 169
demonstrated also that the S.P. would be further diminished if the shaly sand contained hydrocarbons.
The correct interpretation of beds containing interstitial shale particles is peculiarly difficult since the S.P. is diminished but not necessarily altered in shape. A shape effect is often observed in the S.P. opposite inter-laminated shale and sand sequences unless the laminae are extremely thin. "When the S.P. curve indicates laminations the log interpreter is at least aware of a probable diminution in the S.P. deflection. The effect of shaly sands on the S.P. is more insidious and this is the more unfortunate since such sands are frequently of economic importance.!
A mathematical approach to the problem of a shaly sand containing interstitial clay material may be based on the M.S.T. theory. In this analysis the structure of a shaly sand will be analagous to that shown on figure 9 for a shale.* However, in a shaly sand not all conducting passages may be considered to be blocked by the effects of electrostatic repulsion. Rather the clays may be considered to exist in the pores and on the grain surfaces in the manner suggested by Grim and Cuthbert (1945). Their effect will be to introduce in the pores a charge as defined in the M.S.T. theory. If this average effective charge is fairly large the shaly sands will behave as inefficient membrane electrodes. The potential they give when separating two solutions will lie somewhere between that for a perfectly anion-impermeable membrane and the ordinary liquid junction potential between the two solutions.
The term average effective charge, A, is used because of the steric hindrance effects which must always be considered in membrane phenomena. Thus a clay particle located in a pore constriction in the permeable bed will have a rather large effective value of A, since the effective volume in which the negative charges on the clay are disposed will be the volume of the pore neck rather than the entire pore volume. Conversely the same clay particle located in the pore itself would have a relatively small effective charge A. Thus the amount of clay in a permeable bed in a shaly sand is far less important from an electrochemical standpoint than is its disposition. In all cases, however, if the amount of water in the pores is diminished the effective charge A will be increased, since A is expressed as a molality and is dependent to some extent on the water content of the permeable bed. Thus the addition of oil to the pores will serve to increase the effective value of A and thus to increase the efficiency of the shaly sand as a membrane. Since the total electrochemical S.P. is the algebraic sum of the shale potential and the potential between the mud and interstitial water in a permeable bed, an increase in the membrane efficiency of a shaly sand implies a decrease in the total S.P. In the earth the sign of the ordinary liquid junction potential is such that this potential increases the S.P. If, however, the efficiency of the shaly sand as a membrane becomes sufficient to reverse the
t Note added in proof: An investisation of the S.P. and resistivity phenomena sliown by dirty sands has recently been published by Wyllie and Southwick, 1954. This investigation obtained data that provide answers to many of the problems that were unanswered in 1952. •
* This approach will be found similar to that used bv deWitte (1950), who apparently was unaware of the M.S.T. theory or the work of Sollner. However, deWitte found no concentration dependence of the potential of the type shown in figure 11. This is not in accord with all other work on membrane electrodes.
ou
90
40
30
•>
^ e o
d
NERNST POTENTIAL
90
40
30
•>
^ e o
d
90
40
30
•>
^ e o
d
/ ACTIVITY RATIO " / - K )
90
40
30
•>
^ e o
d
90
40
30
•>
^ e o
d
-10 LIQUID JUNCTION POTENTIAL
0.8 lao 18.0
02
FiGUKE 1 1 . T h e form of the v a r i a t i o n of po ten t i a l w i t h absolute concen t r a t i ons for an imperfeetl.y selective negat ively charged m e m b r a n e s e p a r a t i n g X a C l so lu t ions of c o n s t a n t ac t iv i ty r a t i o .
liquid junction potential, this potential will actually oppose the shale potential. The decrease in the total S.P. maj' thus be very great.
Figure 11 shows a tj-pical curve for a shaly sand separating XaCl solutions having an activity ratio of 10: 1. The two limiting potentials are the Nernst potential of about 58.5 mv at the temperature considered, and the liquid junction potential of —11.5 mv. Here the positive sign is applied to the solution of lesser activitJ^ When both solutions are very dilute, i.e. a2 is small, the potential developed approximates to 58.5 mv. When both concentrations are large, the curve is asymptotic to —11.5 mv.
For the optimum application of equation (3) the potential should be —11.5 mv. Figure 11 suggests that shaly sands will involve least error in the use of equation (3) when interstitial water salinities are high, and that in all cases the error will be decreased if the mud salinity is maintained at a high figure. In the case of very shaly sands allied to very low interstitial salinities it would appear desirable to increase the mud activity to a figure greater than the interstitial water activity and to record positive S.P. deflections.
Low mud resistivities, that is high mud activities, seem extremely desirable. They should improve the accuracy with which the electrochemical S.P. approximates to equation (3), they serve to diminish the elec-trokinetie potential correction, and they assist in the interpretation of focussed current resistivity logs. When running conventional S.P. logs these advantages may be partly offset by the short-circuiting effect of the conductive mud, which serves to reduce the S.P. This may be

Part VII] CLAY TECHNOLOGY IN THE PETROLEUM INDUSTRY 301
overcome by using a Static S.P. log, and the ease for the •wider use of this device seems strong.
If nearly all permeable formation contain some interstitial clay and have in consequence an appreciable charge A, as is suggested by deWitte (1950), a previous suggestion by the writer (1951) that the electrokinetic potential in many cases now serves to counterbalance the reduced S.P. receives support. Against deWitte's view is the fact that on many logs a consistent maximum S.P. extending over many formations may be drawn. This implies that all such formations contain clay dispersed so as to give rise to identical electrochemical properties. This seems improbable. I t seems more probable that a consistent S.P. of this type, corrected for electrokinetic effects, will yield on calculation a salinity which closely approximates that of the NaCl content of the interstitial waters in the formations.
The Effect of Clays on the Resistivity of Permeable Rocks. The formation factor concept, introduced by Archie (1942), is now an essential part of any system of electrical log interpretation. Its validity is implicitly dependent upon the assumption that within a porous rock the conduction processes are all electrolytic and furthermore that electrolytic conduction occurs only through the network of saline solution filling the pores. It is also implied that the properties of the saline solution tilling the pores are uniform; that there are no surface conductivity eifects. Provided the salinity is maintained greater than about 0.1 molar this assumption is justitied.
Patnode and Wyllie (1950) pointed out that in practice it appeared that these conditions were not always fulfilled, and that in certain instances the matrix structure of porous rocks had an appreciable conductivity. This conductivity appeared to result from the presence of clays in the rock. The clays could be disposed as thin shale laminae or as interstitial clay.
It was suggested that the resistivity of a saturated rock containing clays (the so-called "conductive solids") was given by the expression
where C, + C„ = C, + CJF (6)
apparent conductivity of the rock saturated with fluid of conductivity Cc
Cf = conductivity of the conductive solids as distributed in the rock
(7„ = conductivity of the saline tluid as distributed in the rock
F = formation factor applicable to all the solids both conductive and non-conductive.
I t may be noted that in equation (6) Cs/F' may be substituted for C/. Here Cs is the actual conductivity of the conductive solids and F' their formation factor, i.e. F' = Gs/Cwa when C„ is zero. (This expression assumes that in a dry rock Gf could be measured. Physically this would probably be impossible.)
Equation (6) implies that the conductivity of the conductive solids as distributed in the core is a constant, independent of the magnitude of Co, and that these solids may be treated as if they constituted a constant
resistance in parallel with the resistance offered by the liquid tilled pores. Typical data to test the validity of equation (6) are plotted in figure 12. In this figure core conductivity is plotted as a function of the conductivity of the saline water used to saturate the cores. If equation (6) is followed, the data should plot as a straight line with slope equal to 1/F and intersect with the core conductivity axis at zero if there are no conductive solids present in the core and at Cf if conductive solids are present. Figure 12 shows that these conditions are only partially fulfilled. If the saturating water conductivity exceeds about 0.5 mho-meters (50 mho-cms) a reasonably straight-line plot results, but for conductivities lower than this the points curve towards the water conductivity axis. A satisfactory solids conductivity may be obtained from the Cf derived by extrapolating the straight line to cut the core conductivity axis.
The reason for the observed curvature is not yet clear.* It may represent experimental error, but the regularity with which the phenomenon has been observed seems to preclude this as a sole explanation. The observed data indicate that the conductivity of the conductive solids appears to decrease when the saturating water conductivity becomes less than about 0.5 mho-meters.
Now the data shown in figure 12 were obtained at room temperature using solutions of sodium chloride as the saturating fluids. Tables 4 and 5 indicate that the clays in a core, which probably constitute the conductive solids, are almost certainly not in equilibrium with a pure sodium chloride solution. AVhen the core is removed from the ground the mere act of saturating the core must alter -the ions on the clay from a mixture of calcium and sodium to wholly sodium if flushing of the original fluids is prolonged and complete. Thus no value of Cf obtained in laboratory experiments can be correct since the conductivity of a clay in the calcium form is less than its conductivity in sodium form. By and large then, any value of Cf found in conventional experiments will be too large.
It is customary to saturate clay-containing cores first with concentrated sodium chloride solutions. The formation factor of the core containing the highly saline fluid is then determined. Later measurements are made with solutions whose ionic strength is progressively reduced. The object of this procedure is to maintain sufficient permeability to permit the core to be flushed with different solutions. Were the operation commenced with the most highly dilute sodium chloride solution used the core would be plugged and rendered impermeable.
These physical difficulties show that the solutions used alter the physical form in which the clays are disposed within the cores. The clays swell and disperse, particularly in dilute solutions, thus leading to plugging of the pores of the core. If clays change in volume in dilute saline solutions and if the clays move from their initial positions, then the assumption that C; = Cs/F' is constant and independent of the salinity of the saturating fluid is untenable. If the clays expand Cs, since it is a conduction per unit volume, will decrease. Similarly F', which reflects the initial configuration of the clay in the rock, will alter if this configuration alters. Whether F' will increase or decrease is less easy to predict, but the • The explanation is given hy Wyllie and Southwick, 1954.

302 CLAYS AND CLAY TECHNOLOGY [Bull. 169
111
t :
X o
ir l U
UJ
z z X o
111
t :
X o
ir l U
UJ
z z X o
111
t :
X o
ir l U
UJ
z z X o
\ / o
UJ B-0 . UJ
3S tOJiJ
zS
1 "^ 1 ""
\ / o
UJ B-0 . UJ
3S tOJiJ
zS
1 "^ 1 ""
\ / o
UJ B-0 . UJ
3S tOJiJ
zS
1 "^ 1 "" (0 cc u 1 -UJ
\ / o
UJ B-0 . UJ
3S tOJiJ
zS
1 "^ 1 "" (0 cc u 1 -UJ
2 X o
L 2 X o \
® o CJ CJ II H
a: —
o a:
\ ® o CJ CJ II H
a: —
o a:
\ \
® o CJ CJ II H
a: —
o a:
\
® o CJ CJ II H
a: —
o a:
^
s
<o o
© 1 * 1 =
2 &£
8>
?
o
2 "3
8 g 9 I
(9
lo r
to
< o
1- .-s < >
lO
in
o o
o (O to
8 lO
o CD CJ
o o
8 o (O s o
CO
o t
(g-OIX y3i3W-0HW) AilAllOnONOO 3a00

Part VII] CLAY TECHNOLOGY IN THE PETROLEUM INDUSTRY 303
probability that Cg/F' will alter as the clays swell and disperse certainly seems great. That Cg/F' should show an overall decrease along the lines indicated on tigure 12 is quite possible. Clearly these considerations require more detailed investigation.
It may be noted that the determination of C; without altering the ions on the clays is a matter of considerable practical difficulty unless the Ca/Na exchange constant for the clay present is known. Possibly this constant is the one applicable to illite, but this is, of course, pure speculation. If the exchange constant were known it would be theoretically possible to adjust the Na/Ca ion ratio in the saturating solutions at values appropriate to their ionic strengths. From the standpoint of utilizing the method of Figure 12 in routine operations such a procedure appears inherently undesirable. The writer would recommend that the magnitude of the error resulting from ion-exchange effects be investigated. Conceivably this error will be found too small to be of practical signiflcance. I t may be noted that if the error is not negligible it will effect also the accuracy of calculations which are based on the resistivity of the mud-filtrate invaded zone surrounding the borehole. In this zone cation exchange may take place as previously discussed for the case of the S.P. curve.
Equation (6) applies to formations containing only conductive solids and saline water. If it may be considered reasonably valid when the ionic balance on the shales is not upset and the clays are not dispersed, it implies that if the net water conductivity were altered Cf would not alter. Thus
C„.a=-Cj + Sw''-Cc/F (7)
In Equation (7) Sw represents the fraction of void volume between the solids, both conductive and non-conductive, occupied by water, the fraction (l-Sw) being occupied by oil or gas. The exponent, n, is the resistivity index exponent having a value dependent upon rock texture but averaging about 2.0. Equation (7) implies that a plot of F (C„a-Cf)/Co against Sw on double logarithmic paper would have a slope n. Data reported (14) have verified this in some cases.
DeWitte (1950a), however, disagrees with the form of equations (6) and (7), at least as general equations, and presents data to show that equation (7) can give rise to impossible results. In essence deWitte maintains that when oil is introduced into a core Cj is no longer a constant, but is a function of the water saturation, Sw. The experimental evidence presented by deWitte is in good accord with this view. Certainly the evidence does not support equation (7).
The fact that equation (7) has been confirmed by the use of other data implies, since deWitte's data appear convincing, that there are cases to which it applies. Tentatively at least it may be said that equations (6) and (7) will apply to shaly sands in which the shale is definitely laminated and the sands between laminations are shale-free, while deWitt's equations will apply better to cases where the shale or clay is truly interstitial. In such cases deWitte's basic approach, that of considering the conductive solids to constitute a part of the conducting water system in the pores rather than a distinct and separate conducting solid network, may be the more
rewarding. This approach, which considers that the conductive solids and conducting water together constitute a conductive slurry, gives rise to a formation factor for a rock containing conductive solids which is the quotient of the rock resistivity and the computed slurry resistivity. To the writer, however, this approach seems undesirable, since such a formation factor seems to be related only to the texture of the non-conductive solids in the rock. From the point of view of fluid flow it is the texture of the entire solid matrix, both conducting and nonconducting, which must be determined.
In fine the problem of shaly sands is far from being solved. This is the more true since both the equations of Wyllie and Patnode and deWitte are not well adapted to practical computations based on log data only. From a practical standpoint the final solution may be in the appropriate combination of electrical and radioactivity well-logging data (Wyllie, 1952a).
The Radioactivity Log. The detailed study of radioactivity logs is still in its infancy, but the writer would pose at least two problems which urgently need elucidation. Is the generally higher gamma-ray activity of shales vis-a-vis sands contingent upon the cation-exchange capacity of the clays in shales, or is the difference merely an indirect measure of shale compaction? That is, was the initial deposition of radioactive material per unit volume of mud and sand sensibly constant and are the present differences in radioactivity between shales and sandstones merely a reflection of the greater compaction that shales have undergone by comparison with sandstones? What are the neutron interaction properties of clays and shales? Such knowledge would greatly assist in the interpretation of so-called " d i r t y " sands, since in these it will be necessary to distinguish water held in true rock pores from water constituting a part of hydrat-able clay minerals.
Summary. The electrochemistry of the shale cell in the earth has been examined in the light of modern theories of charged membranes. The fundamental importance of a constant shale baseline has been stressed. It has been shown that the constancy of the shale baseline appears to indicate that shales, when subjected to pressure, tend to behave as anion-impermeable membranes. A tentative electrochemical shale structure has been presented.
The problem of the bi-ionie potential has been considered and new equations given for the bi-ionic potentials which may be involved in S.P. log data indicate that the exchange constants of clays in shales are either all very similar or only change slowly with depth in a particular geological column. The problem of the shale baseline shift has been examined.
If the calcium ion behaves in situ as a divalent ion then the formula previously proposed by the writer to compute interstitial water salinity from the electrochemical S.P. curve is likely to give a salinitj' more closely related to the monovalent ion salt content of the interstitial water than to the total solids. Thus the method should probably be applied only to waters which have a high primary salinity.
The problem of shaly sands has been considered from the standpoint of the Meyer-Sievers-Teorell equation. For optimum practical results in log interpretation the
304 CLAYS AND CLAY TECHNOLOGY [Bull. 169
advantages of using saline muds when logging has been stressed.
The effect of sliale content on the resistivity of rocks has been briefly examined. Equations that have been proposed to account for such shale effects have been discussed. It has been pointed out that the effects of cation exchange and clay dispersion have been ignored and that the entire problem of shaly sands and their resistivity effects deserves further study.
Acknowledgment. The writer's thanks are due to Dr. Paul D. Poote, Executive Vice-President, Gulf Ke-search & Development Company, for permission to publish this paper. He would like to acknowledge also the assistance afforded by Miss Shirley L. Kanaan in carrying out the basic experimental work on which certain of the theoretical results have been based.
D I S C U S S I O N W . E. Bergman:
Wyllie has made reference to the theory of membrane electrodes to well-logging problems and he states that he has made measurements of ion activities in colloidal solutions. Since there is considerable doubt as to the significance of such measurements in colloidal systems, I would like to know his interpretation of the significance of the pH, Na±ion activity, and similar activities of drilling fluids.
M. R . J . Wyl l ie : We have measured the activities of muds and of the filtrate from
them and have found no appreciable difference between the two activities unless the tip of the calomel electrode becomes contaminated with clay. Indeed, this result might have been anticipated. Consider a case where a mud has overlying it a layer of filtrate. Assume that the membrane electrode is in the mud and the calomel electrode in the filtrate. Then the potential across the membrane is R T / F In aMua/aHefemnec, while the phase boundary potential between the mud and filtrate is K T / F In aFiitratc/aiiod. If the calomel/filtrate junction potential is zero, what is measured is
R T / F In aMud a p i l t r a t e
: RT/F In a F l l t r a f e
If the calomel electrode is actually pushed into the mud, exactly the same potential as in the case above may be measured. This occurs if the liquid junction between the saturated KCl and the mud takes place in the electrode tip in the absence of clay particles. If the KCl leaking from the calomel electrode forms a junction in the clay suspension itself, an indeterminate phase boundary potential is added to the membrane potential. In this case the overall potential measured may be appreciably different from the previous case. If this potential is interpreted as a mud activity, the answer may be quite erroneous.
W . J . Weiss : Wyllie stated that the resistivity of the drilling fluid should not
be more than two times the resistivity of the water in the formation for electric logging purposes. Since this is contrary to commonly accepted practices today, I would like to have Wyllie expand upon this point.
M. R. J. Wyl l ie : In the past, conductive muds have not been considered desirable
for two reasons. First, if the activity of the conductive mud is the same or nearly the same as the activity of the connate water, little or no S.P. curve is recorded. Second, extremely low apparent resistivities are recorded for low resistivity beds and the curve of resistivity is hardly distinguishable from the zero line on the resistivity log. This latter situation may be improved by the use of amplified resistivity scales.
Reference was made primarily to the use of conductive muds in conjunction with guard or focusing logging systems. In using this type of logging system true resistivity is obtained directly, with a reasonable degree of accuracy, if there is either no invasion of a formation or if the invading fluid is of nearly identical resistivity
to the fluid already in the formation. I t may be argued that, by the use of resistivity departure curves for such devices, reasonably accurate true resistivity may be obtained even when the mud resistivity is four or five times the resistivity of the interstitial water. A reference to the appropriate departure curves will show that while this is theoretically true if all the parameters are known, in practice a ratio of filtrate to interstitial water resistivity of two is necessary if true resistivity is to be found accurately and simply.
If formation factor is to be determined from devices with short depths of investigation, the more conductive the fluid in the invaded zone, the less is the lowering effect of conducting solids on the formation factor calculated. In the case of the S.P. log, it is extremely desirable to minimize the influence of conductive solids by the use of conductive muds.
M. P. T ix ier : Twenty years ago fresh mud was considered necessary to obtain
good definition on both S.P. and resistivity curves for correlation purposes. In recent years the use of salty muds has become desirable where logs are to be used to deduce reservoir characteristics. Thus it is generally necessary to achieve a compromise and although a value of two is desirable, a value as high as five times may be used except where a large amount of clay is known to exist in the formation. The Wilcox formation in the Gulf Coast region is an example where the use of salty muds (or preferably termed brackish muds) have overcome the difliculties of colloidal material in the formation. Salty muds have not been used extensively in California because of the fresh waters encountered in many formations.
W . C. Goins, Jr.: Maintaining mud at resistivities desired by Wyllie for well
logging is not easy. Changing salinity of connate water with depth makes it difficult to maintain resistivity ratios between 2 and 5 over long drilling intervals. In deep wells several logs would have to be run with different resistivity drilling fluids in each case. Instead of trying to control mud resistivities within the desired limits, has any consideration been given to the use of saturated salt water mud? This would give a very low resistivity fluid which would not be confused with high resistivity hydrocarbons and, although the S.P. curve would be reversed, it should still be subject to interpretation.
M.J . R. Wyllie: I t is diificult to foresee the problems which might be encoun
tered in the interpretation of resistivity curves when the ratio of interstitial water to mud resistivity is, say, ten to one. The measured resistivity will then undoubtedly be too low in the case of both oil and water sands, but the error will be greater in the case of oil sands. A positive S.P. kick will be obtained but it will be necessary to resort to the "static" S.P. logging method to obtain a good curve because the shortcircuiting effect of the mud column will be considerable in a saturated salt water mud.
M. P. Tixier: Extensive use of saturated salt water mud would probably not
be desirable at the present time because the change would be too drastic for those using present day logs. The reversed S.P. curve obtained would be of very low magnitude, the kicks seriously rounded and the definition very poor. I t has been found throughout the country that connate water salinity does not continually increase with depth but that it reaches a maximum at about 9000 feet. Below this depth, the salinity actually decreases in many cases. Thus the use of extremely salty mt:ds is not necessary and the range of connate water resistivities is not so great as to present undue difficulties in mud resistivity control. The use of brackish muds should also be considered from the standpoint of well completion. Overcoming or minimizing the swelling of clays in reservoir sands by the use of brackish muds, may greatly improve well performance.
E. S. Mardock: Wyllie posed two questions regarding the influence of clays on
radioactivity logs. The first question concerns the mechanism by which clastic sediments acquire radioactive properties, and the second question concerns the mechanism of the effect of these sediments on the neutron log. The correct answers to these questions should be of great value in the interpretation of radioactivity logs, but neither question can be answered at the present time.
P a r t V I I ] CLAY TECHNOLOGY IN THE PETROLEUM INDUSTRY 305
It is my opinion that the distribution of radioactive material in shales cannot be accounted for exclusively by either of the two hypotheses suggested by Wyllie, i.e. (1) a hypothesis based on a primary deposition by which radioactive material is first uniformly distributed in the sediment and a subsequent compaction period which apparently induces a degree of non-uniformity with respect to the distribution of the radioactive component; (2) a hypothesis of a primary deposition process based on a cation-exchange which accomplishes the deposition of radioactive material in a manner dependent on the cation-e.xchange abilit.v of the clay minerals.
Each of these mechanisms may sometimes account for the differences observed in the ganima-ra.v activities of a particular shale. In addition, however, a third factor, the chemical composition of the minerals present, is thought to play an important role in determining the gamma-ray activity of shale.
With regard to the effect of clay minerals on the neutron curve, it is our t)elief that this effect combines effects of the hydrogen contained in chemically bound liquids, e.g., oil and water, plus the "chemical effects" of certain of the elements mailing up the clay mineral itself, such as iron and possibly some of the rare earths which have relativel.y large capture or scattering cross-sections for neutrons. These "chemical effects" sometimes intiuenee the log in a much more decisive manner than a hydrogen-containing liquid.
An application of the work done on these problems is discussed by Bush & Mardock (1951).
SELECTED REFERENCES
Archie, G. E., 1942, The electrical resistivity log as an aid in determining some reservoir characteristics: Am. Inst. Min. Met, Eng. Trans., v. 146, pp. 54-62,
Bergman, W. E., 1952, Effect of calcium sulfate on properties of a bontonite suspension. Parts I and I I : World Oil, v. 134, no. 5, pp. 170-178 . . . . V. 134, No. 6, pp. 122-1,33.
Bush, R. E., and Mardock, E. S., 1951, The quantitative application of radioactivity logs : Am. Inst. Min. Met. Eng. Trans., v. 192, pp. 194-198.
Case, L. C , 1933, Base replacement studies of Oklahoma shales •—critique of Taylor hypothesis: Am. Assoc. Petroleum Geologists Bull., V. 17, pp. 66-79.
Claudet, A. P., 1950, New methods of correlation by resistivity value of electrical logs; Am. Assoc, Petroleum Geologists Bull., V. 34, pp. 2027-2060.
de Sitter, L. U., 1947, Diagenesis of oil-field brines : Am. Assoc. Petroleum Geologists Bull., v. 31, pp. 20,30-2046.
de Witte, L., 1950, Experimental studies of the characteristics of the electrochemical potentials encountered in drill holes: Am. Inst. Min. Met. Eng., Paper 12G, Oct. 13, 19,50 meeting, Los Angeles, California [unpublished].
de Witte, L., 1950a, Relations l)etween resistivities and fluid contents of porous rocks: Oil and Gas .Tour., v. 49, no. 16, pp. 120-132.
Doll, H. G., 1949, The S.P. log—theoretical analysis and principles of interpretations : Am. Inst. Min. Met. Eng. Trans., v. 179, pp. 146-185.
Doll, H. G., 1950, Selective S.P. logging: Am. Inst. Min. Met. Eng. Trans., v. 189, pp. 129-142.
Doll, H. G., 1950a, The S.P. log in shaly sands : Am. Inst. Min. Met. Eng. Trans., v. 189, pp. 205-214.
Grim, R. E., and Cuthbert, F . L., 1945, The bonding action of clays. Par t 1—Clays in green molding sands : Illinois Geol., Survey Rept. Inv. 102, 55 pp.
Harned, H. S., and Owen, B. B., 1950, The physical chemistry of electrolytic solutions. New York, Reinhold Publishing Corp.
Kressman, T. R. E., 1952, in Duncan, J . P., Theory and practice of ion exchange : Nature, v. 169, pp. 22-24.
Marshall, C. E., 1948, The electro-chemical properties of mineral membranes. VI I I . The theorv of selective membrane behavior: Jour. Phys. Colloid Chemistry, v. 52, pp. 1284-3295.
Marshall, C. E., 1949, The colloid chemistry of the silicate minerals, 195 pp.. New York, Academic Press, Inc.
McLean, E. O., Barber, S. A., and Marshall, C. E., 1951, Ionization of soils and soil colloids. I. Methods for simultaneous determination of two cationie activities : Soil Sci., v. 72, p. 815
Meyer, K. H., and Sicvers, .T.-F., 1936, La permeability des membranes. I. Theorie de la permeal)iIitS ionique: Helvetica Chi-mica Acta, v. 19, pp. 649-664 . . . . I I . Essais avec des membranes seleclives artifieielles : Helvetica Chimica Acta, v. 19, pp. 665-667
. . . . I I I . La permeability ionique de couches liquides non-aqueuses: Helvetica Chimica Acta, v. 19, pp. 948-962.
Millot, G., 1952, in Mackenzie, R. C , Geological aspects of clay mineralogy: Nature, v. 169, p. 656.
Mounce, W. D., and Rust, W. M., 1945, Natural potentials in well logging: Am. Inst. Min. Met. Eng. Trans., v. 164, pp. 288-294.
Patnode, H. W., and Wyllie, M. R. J., 1950, The presence of conductive solids in reservoir rocks as a factor in electric log interpretation: Am. Inst. Min. Met. Eng. Trans., v. 189. pp. 47-52.
Schlumberger, C , Schlumberger, M., and Leonardon, E. G., 1934, Electrical coring, a method of determining bottom-hole data by electrical measurements: Am. Inst. Min. Jlet . Eng. Trans., v. 130, pp. 237-272.
Schlumberger, C , Schlumberger, M., and Leonardon, E. G., 1934a, A new contribution to subsurface studies by means of electrical measurements in drill holes: Am. Inst. Min. Met. Eng. Trans., v. 110, pp. 273-289.
SoUner, Karl, 1945, The physical chemistry of membranes with particular reference to the electrical behavior of membranes of porous character: Jour. Phys. Colloid Chemistry, v. 49, pp. 171-191.
Sollner, Karl, 1949, The origin of bi-ionic potentials across porous membranes of high ionic selectivity: .Tour. Phvs. Colloid Chemistry, v. 53, pp. 1211-1239.
Sollner, Karl, 1950, Recent advances in the electrochemistry of membranes of high ionic selectivity: Elcctrochem. Soc. Jour., v. 97, pp. 139C-151C.
Taylor, E. McK., 1929, The replaceable ba.ses in the clays and shales overlying petroliferous strata : Inst. Petroleum Technology Jour.. V. 15, pp. 207-210.
Tajlor, E. McK., 1930, An examination of clays associated with oil-bearing strata in the United States : Inst. Petroleum Technology Jour., V. 16, pp. 681-683.
Teorell, T., 1935, An attempt to formulate a quantitative theory of membrane permeability: Soc. Exper. Biol. Medicine Proc , v. 33, pp. 282-285.
Teorell, T., 1935a, Studies of the diffusion effect upon ionic distribution. I. Some theoretical considerations : Nat. Acad. Sci. P roc , v. 21, pp. 152-162.
Tixier, M. P., 1949, Electric-log analvsis: Oil and Gas Jour., V. 48, no. 7, pp. 143-148, 217-219.
Wvllie, M. R. .T., 1948, Some electrochemical properties of shales: Science, v. 108, pp. 684-686.
Wyllie, M. R. J., 1949, A quantitative anal.vsis of the electrochemical component of the S.P. curve : Am. Inst. Min. Met. Eng. Trans., v. 186, pp. 17-26.
Wyllie, M. R. J., 1949a, Statistical study of accuracy of some connate-water resistivity determinations made from self-potential log data : Am. Assoc. Petroleum Geologists Bull., v. 33, pp. 1892-1900.
W.vllie, M. R. J., 1953, An investigation of the electrokinetic component of the self potential curve: Am. Inst. Min. Met. Eng. Trans., v. 192, pp. 1-18.
Wyllie, M. R. J., 1953a, Theoretical considerations involved in the determination of petroleum reservoir parameters from electric log da ta : 3d World Petroleum Cong. P roc , sec. I I , pp. 378-393, Leiden, the Netherlands, E. ,T. Brill.
Wyllie, M. R. J., 1951b, U. S. Patent No. 2,569,625, October 2, 1951.
Wyllie, M. R. J., 19.52, Gordon research conference on ion exchange : Am. Assoc. Advancement of Sci., .Inly 1952.
Wyllie, M. R. .L, 1952a, Procedures for the direct employment of neutron log data in electric log interpretation : Geophysics, v. 17, p. 790.
Wyllie, M. R. J., and Morgan, F., 1951, Comparison of electric log and core analysis data for Gulf's Prank No. 1, Velma pool, Stephens County, Oklahoma, in Pifteenth technical conference on petroleum production: Pennsylvania State College, Mineral Industries Exper. Sta., Bull. 59, pp. 111-127.
Wyllie, M. R. J., and Patnode, H. W., 19.50, The development of membranes prepared from artificial cation-exchange materials with particular reference to the determination of sodium-ion activities : Jour. Phys. Colloid Chemistry, v. 54, pp. 204-227.
Wyllie, M. R. .1., 19.54, Ion exchange membranes. I : Jour. Phvs. Chem., V. 58, pp. 67-73.
Wyllie, M. R. J., and Kanaan, S. L., 1954, Ion exchange membranes. I I : .Tour. Pliys. Chem., v. 58, pp. 73-80.
Wyllie, M. R. J., and Southwick, P. P., 19.54, An experimental investigation of the S.P. and resistivity phenomena in dirty sands : •Tour. Petroleum Tech., v. 6, No. 2, pp. 44-57.