Embed Size (px)
Citation preview
Role of CT in Acute Stroke
Dr. PG SridharSr. Consultant
Epidemiology
• Third most common cause of death world wide
• Age adjusted prevalence rate of stroke in India 250-350/100,000*
• Age adjusted prevalence rate of stroke in Bangalore 262/100,000**
• Estimated stroke related death 1.2 % of the total deaths*
*Neurology Asia 2006; 11 : 1 – 4**Neuroepidemiology 2004;23:261–268
Stroke
• Infarction 85%– Cerebral atherothrombosis 30-40%– Cardiogenic embolism 20-25%– Penetrating artery disease (lacune) 20%– Other unusual causes 5%
• Hemorrhage 15%
• In India, ratio of cerebral infarct to hemorrhage is estimated to be 2.21*
*Neurology Asia 2006; 11 : 1 – 4

“Time is Brain”
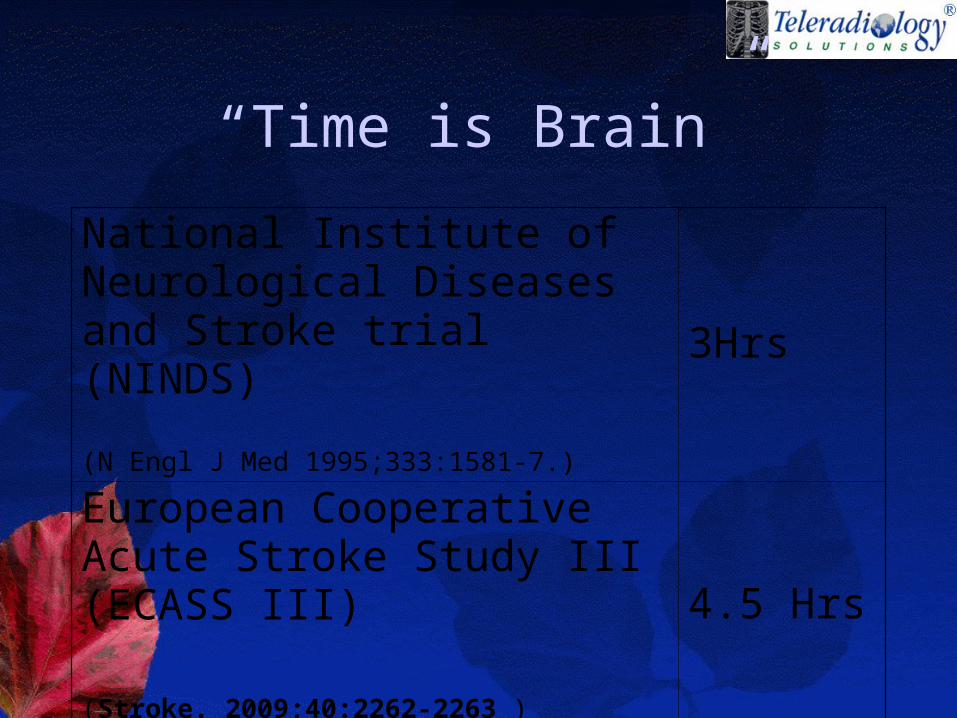
“Time is Brain”
National Institute of Neurological Diseases and Stroke trial (NINDS)
(N Engl J Med 1995;333:1581-7.)
3Hrs
European Cooperative Acute Stroke Study III (ECASS III)
(Stroke. 2009;40:2262-2263 )
4.5 Hrs
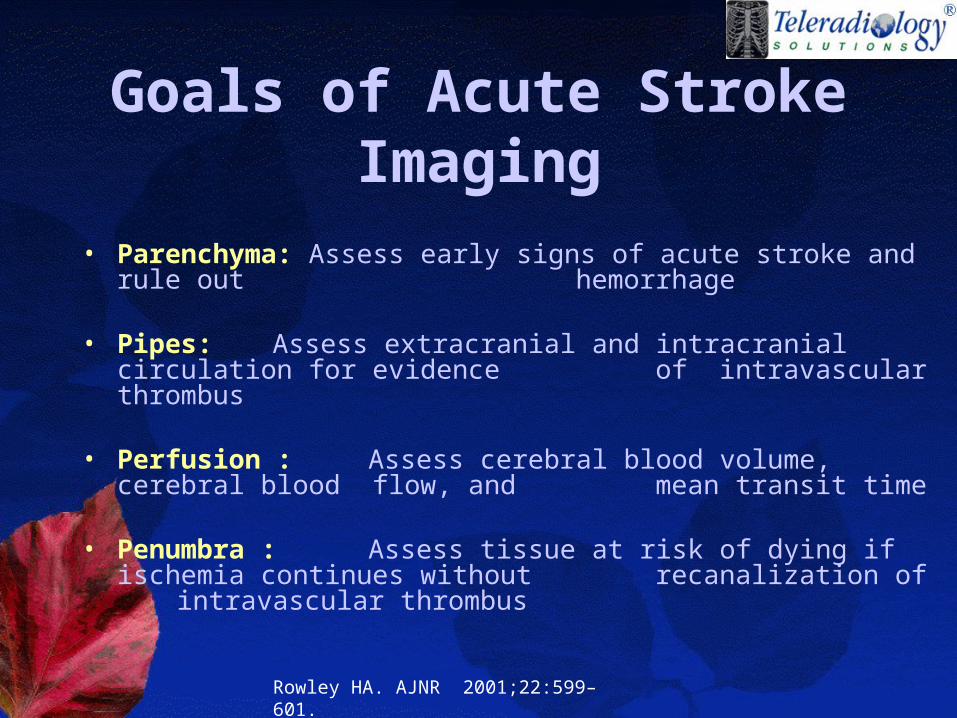
Goals of Acute Stroke Imaging
• Parenchyma: Assess early signs of acute stroke and rule out hemorrhage
• Pipes: Assess extracranial and intracranial circulation for evidence of intravascular thrombus
• Perfusion : Assess cerebral blood volume, cerebral blood flow, and mean transit time
• Penumbra : Assess tissue at risk of dying if ischemia continues without recanalization of intravascular thrombus
Rowley HA. AJNR 2001;22:599–601.
• Non contrast CT• CT perfusion• CT angiogram• Other emerging imaging
techniques
Unenhanced CT
• R/o hemorrhage.• Insular ribbon sign• obscuration of the lentiform
nucleus• Cerebral swelling• Dense vessel sign (MCA or MCA dot
sign)
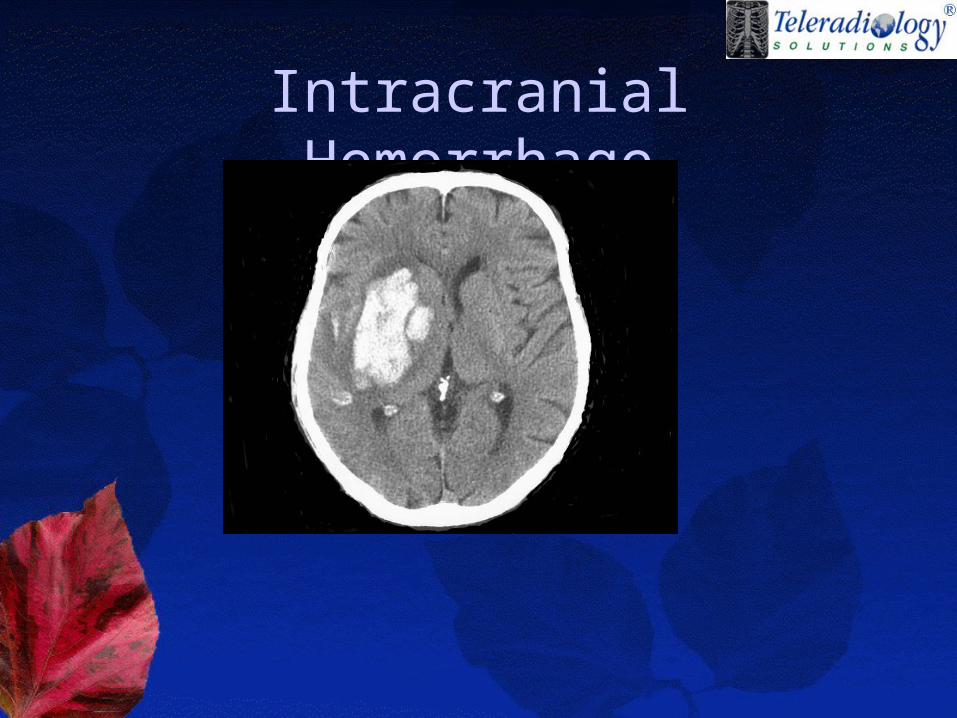
Intracranial Hemorrhage
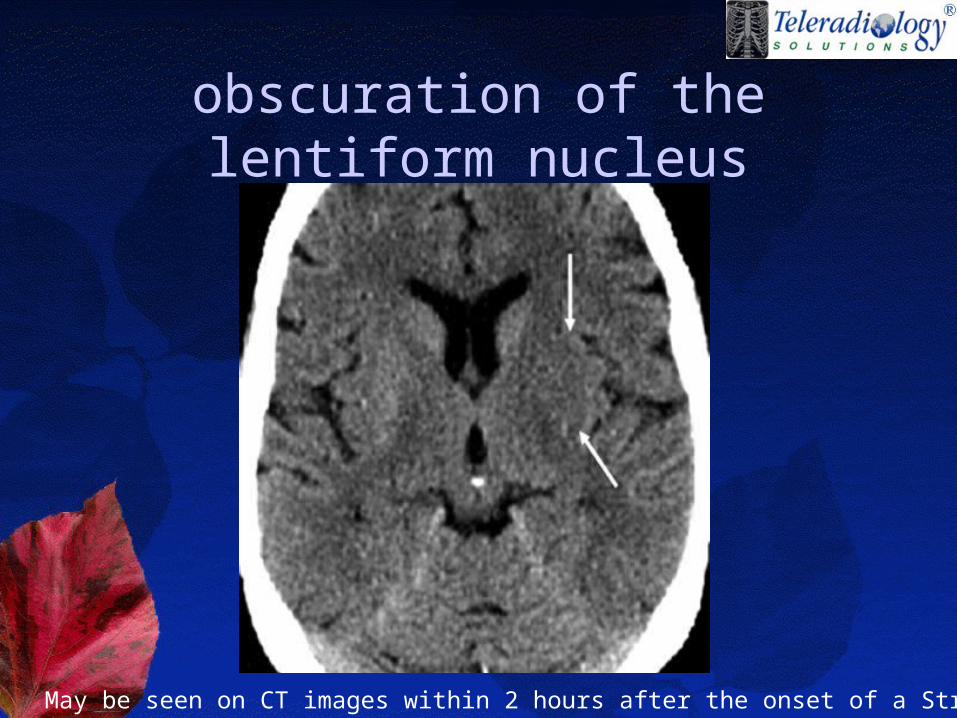
obscuration of the lentiform nucleus
May be seen on CT images within 2 hours after the onset of a Stroke
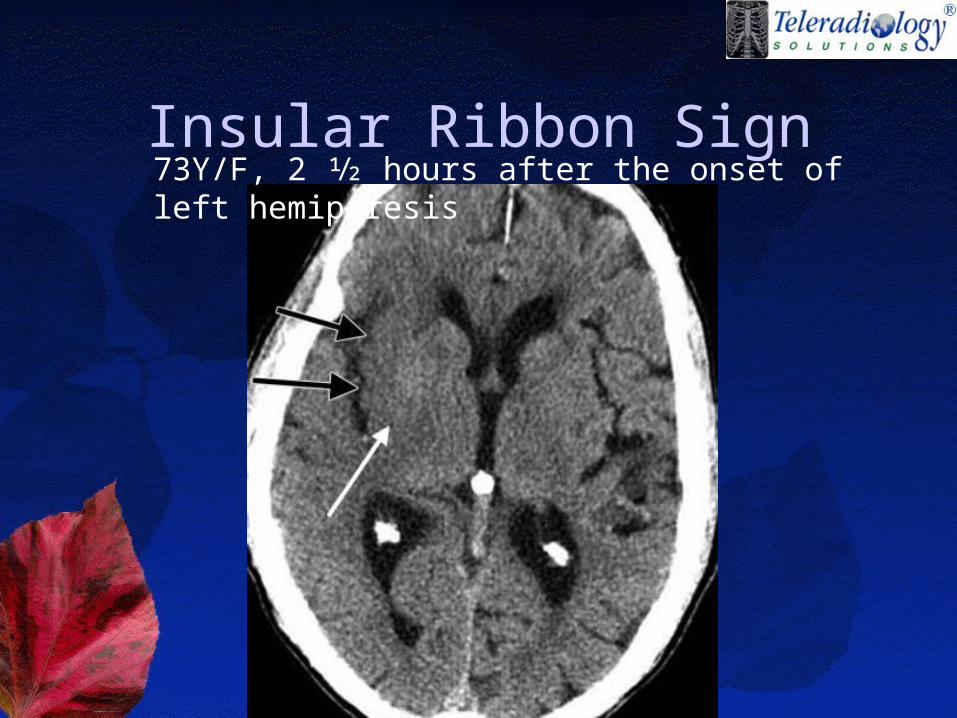
Insular Ribbon Sign73Y/F, 2 1⁄2 hours after the onset of left hemiparesis
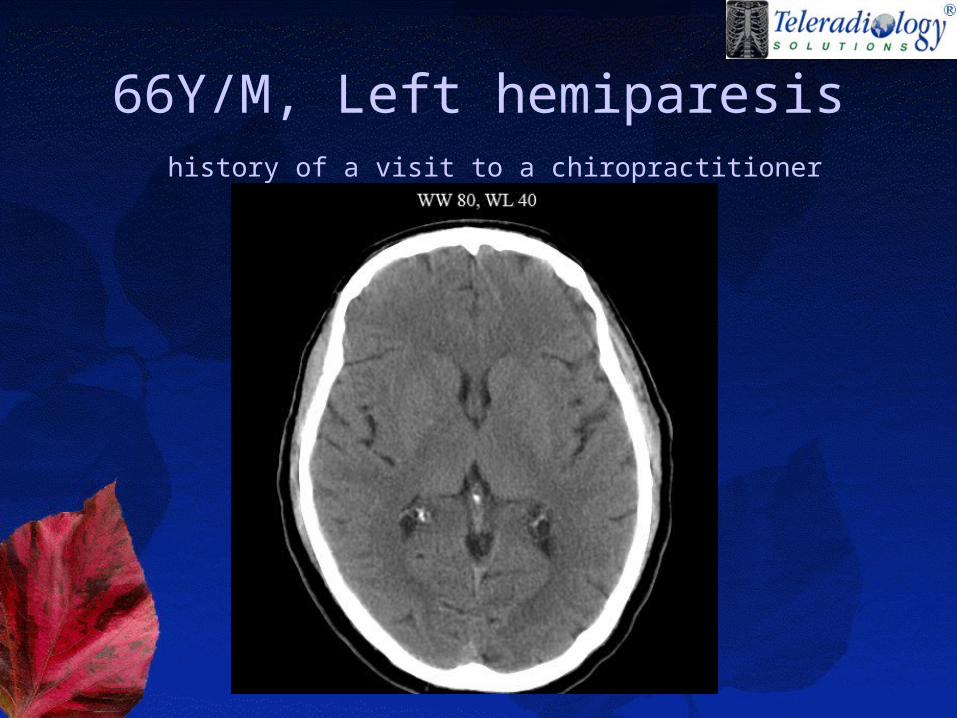
66Y/M, Left hemiparesis history of a visit to a chiropractitioner
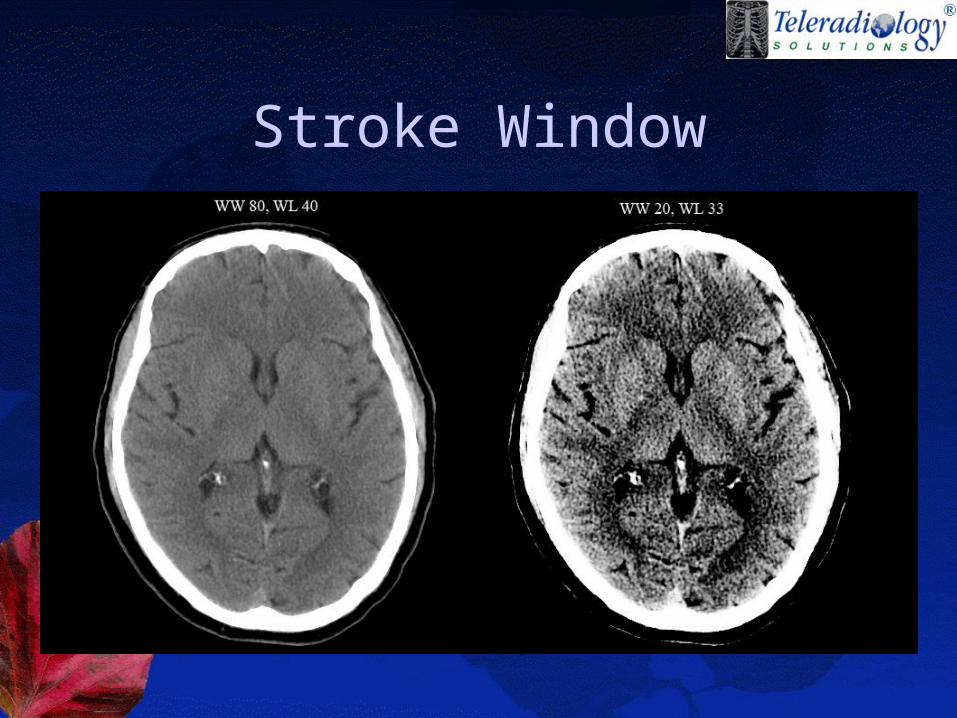
Stroke Window
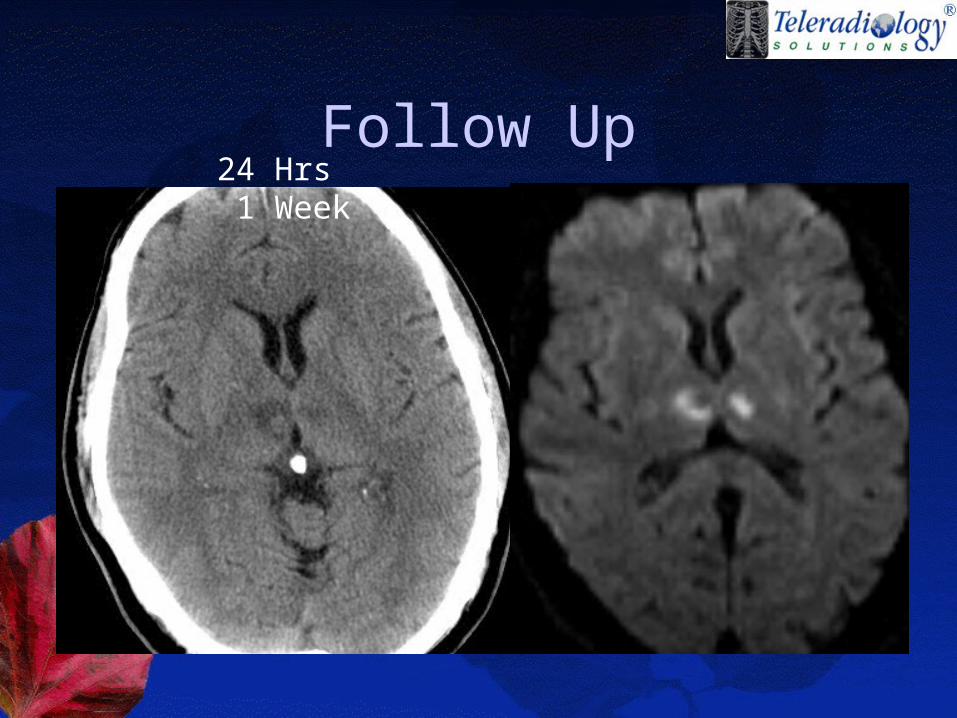
Follow Up24 Hrs 1 Week
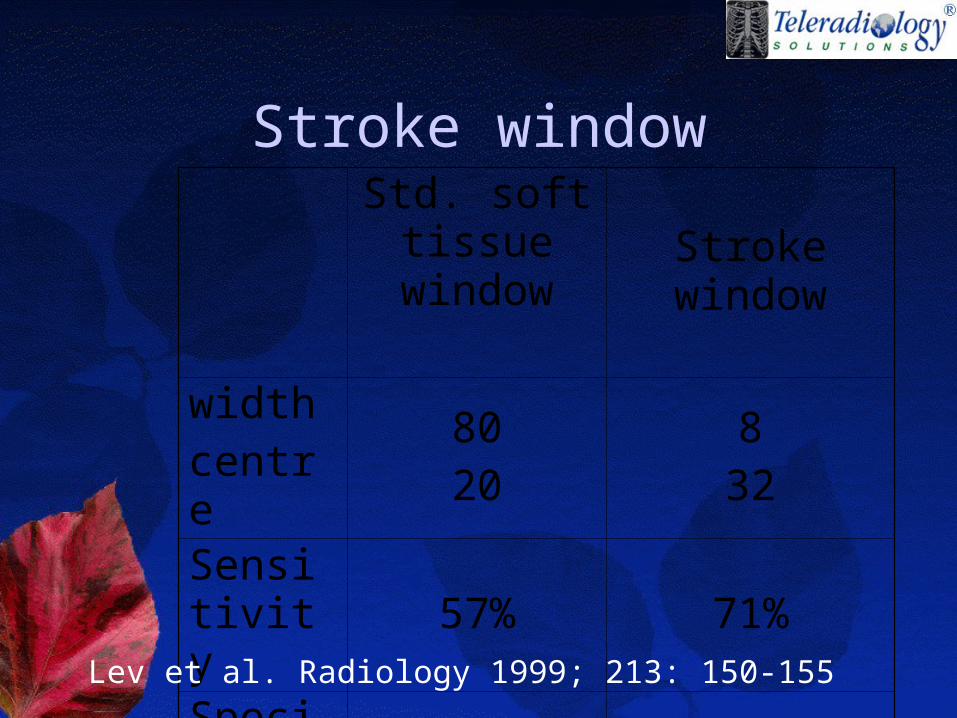
Stroke windowStd. soft
tissue window Stroke window
width centre
8020
832
Sensitivity
57% 71%
Specificity
100% 100%Lev et al. Radiology 1999; 213: 150-155
small attenuation difference between normal and acutely edematous brain tissue can be accentuated by using variable, nonstandard window width and center level settings.
Lev et al. Radiology 1999; 213: 150-155
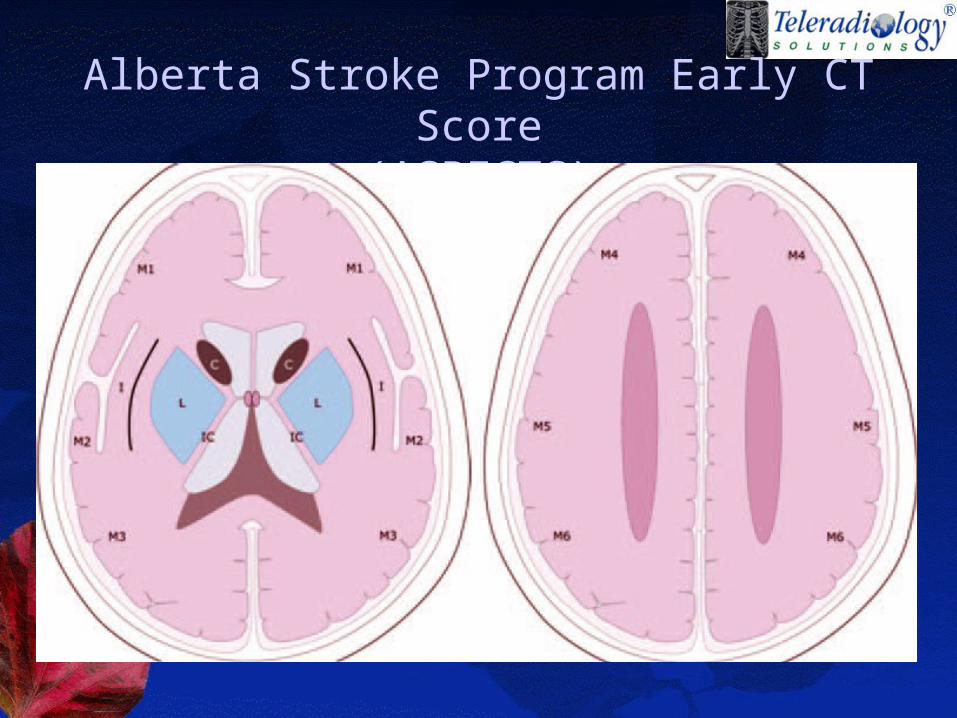
Alberta Stroke Program Early CT Score
(ASPECTS)

ASPECT SCORE
An ASPECTS score less than or equal to 7 predicts worse functional outcome at 3 months as well as symptomatic haemorrhage.
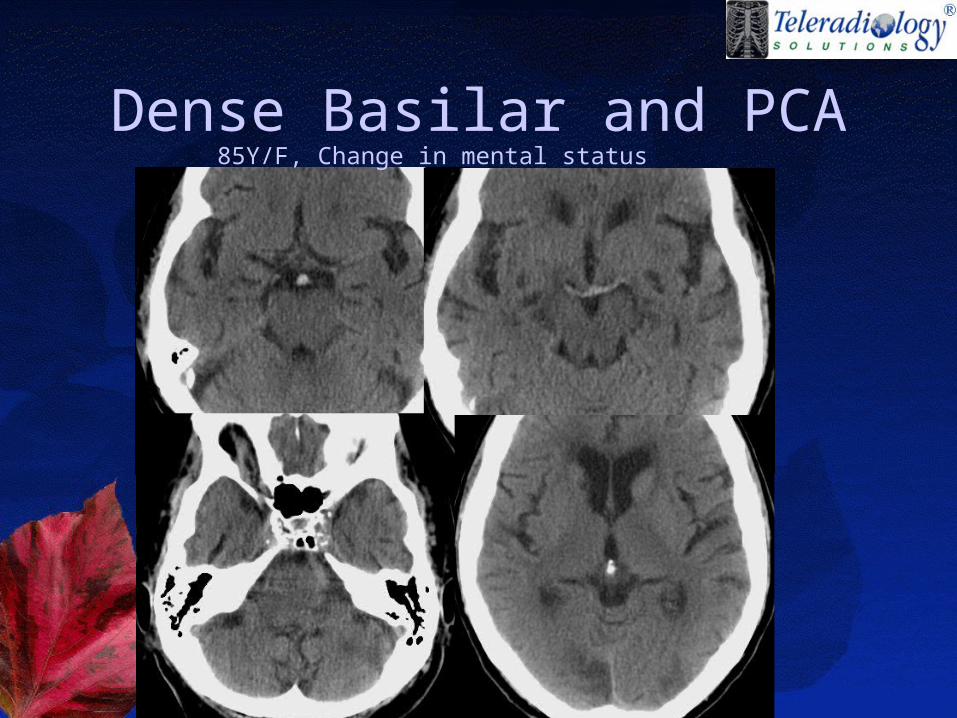
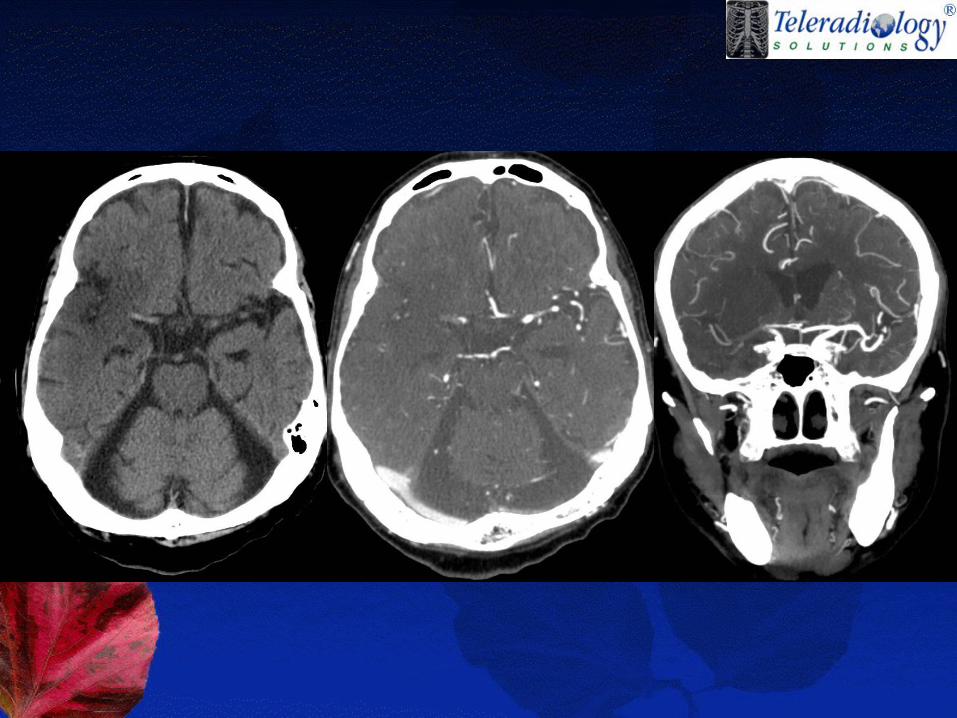
Dense Basilar and PCA85Y/F, Change in mental status
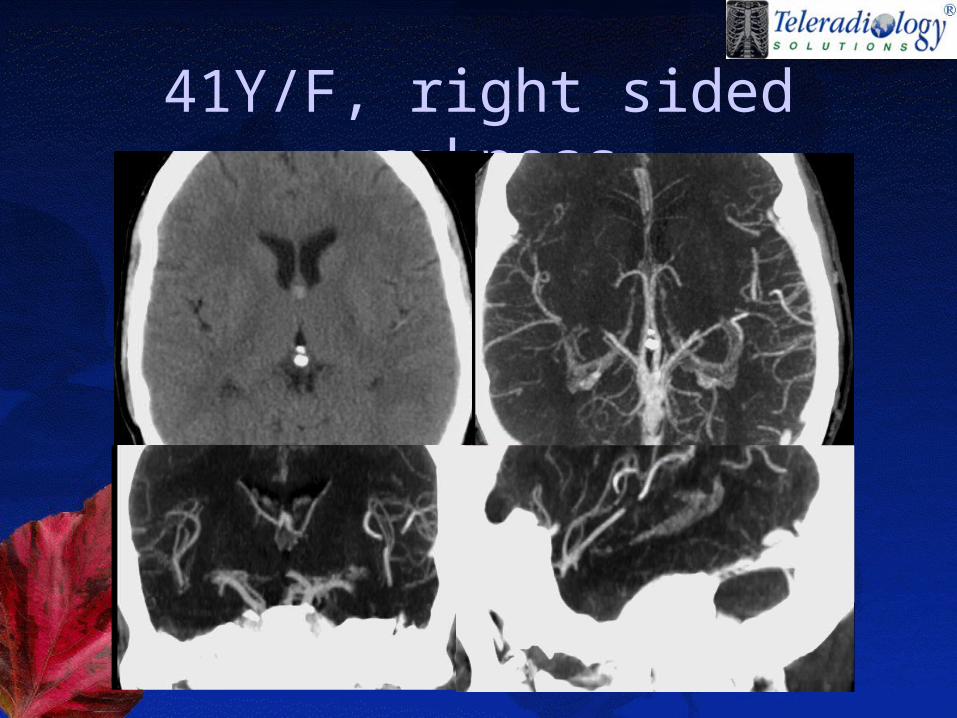
41Y/F, right sided weakness
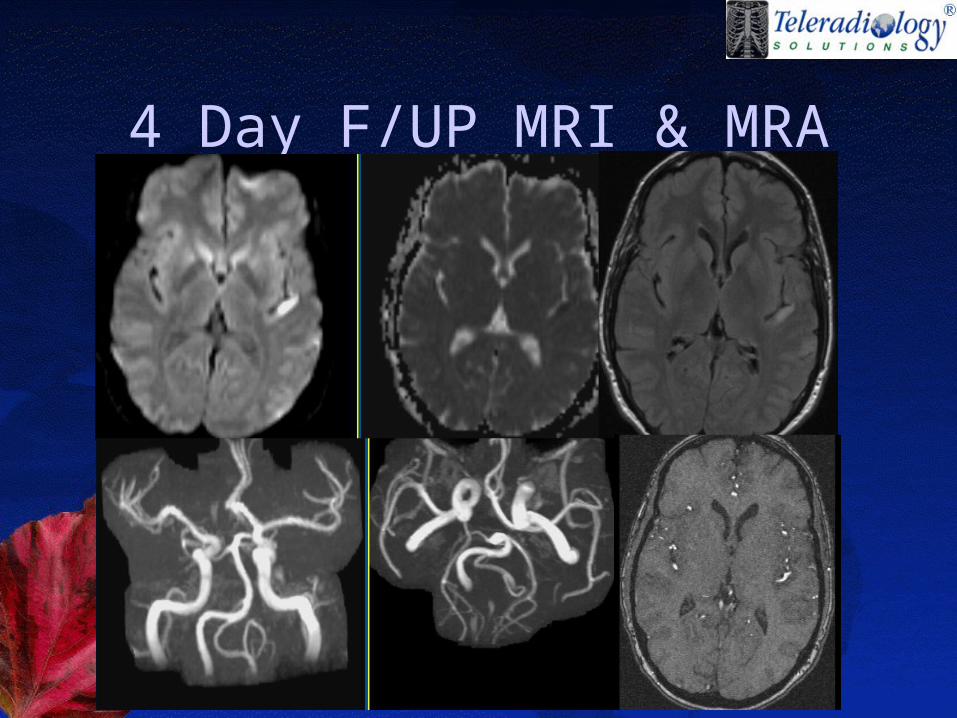
4 Day F/UP MRI & MRA
False Positive Dense vessel sign
• increased hematocrit• wall calcifications• Polycythemia• arterial dolichoectasia
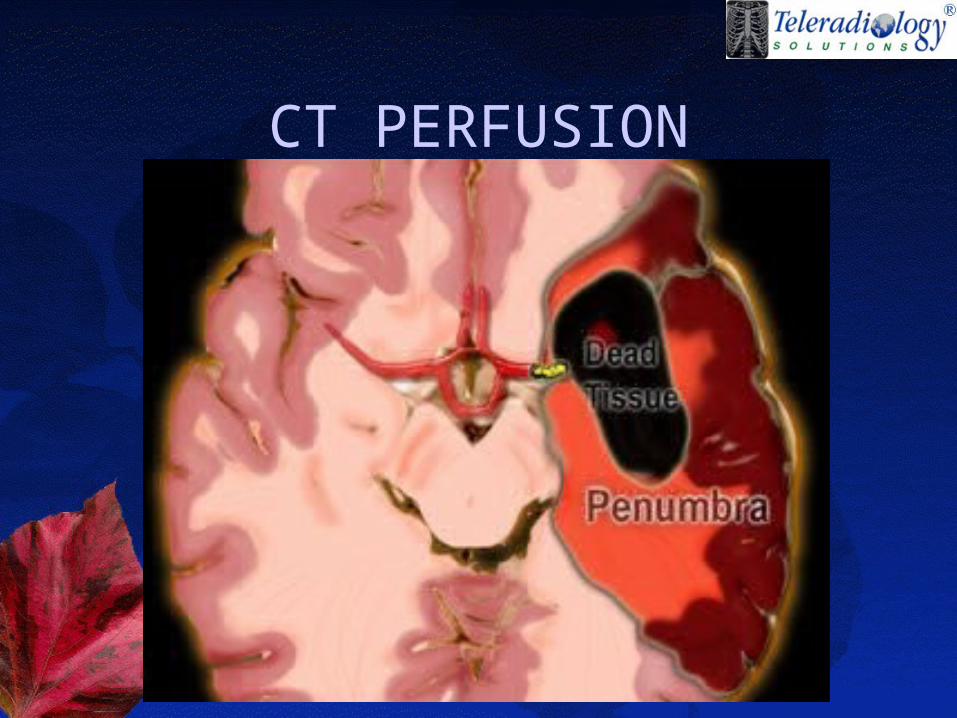
CT PERFUSION
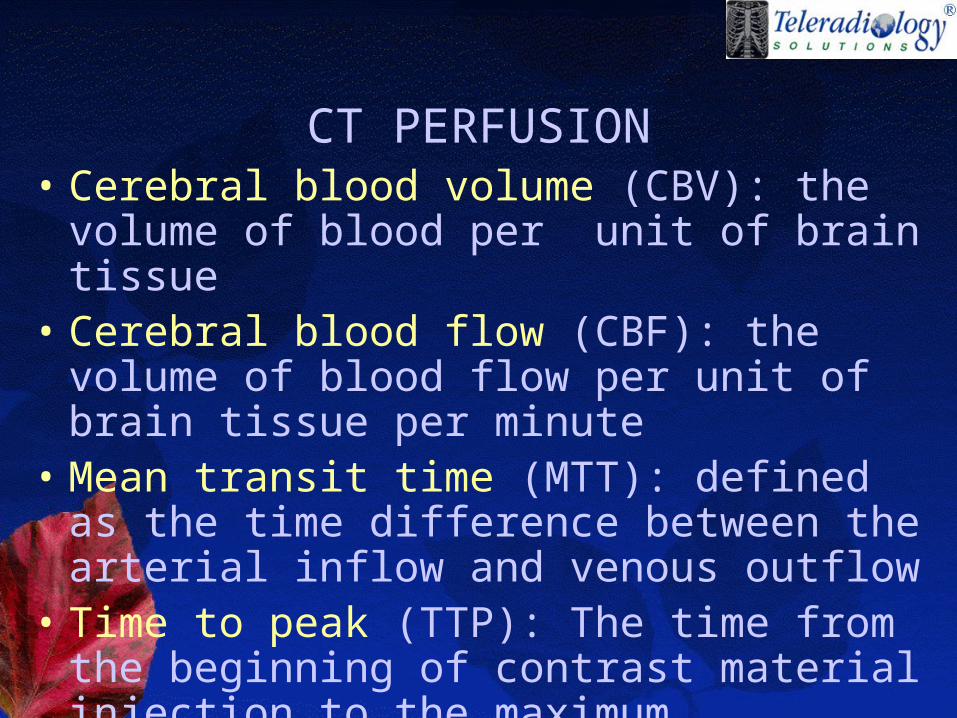
CT PERFUSION• Cerebral blood volume (CBV): the
volume of blood per unit of brain tissue• Cerebral blood flow (CBF): the volume
of blood flow per unit of brain tissue per minute
• Mean transit time (MTT): defined as the time difference between the arterial inflow and venous outflow
• Time to peak (TTP): The time from the beginning of contrast material injection to the maximum concentration of contrast material within a region of interest
Techniques
• Dynamic contrast material–enhanced perfusion imaging (First pass technique)
• Perfused-blood-volume mapping .
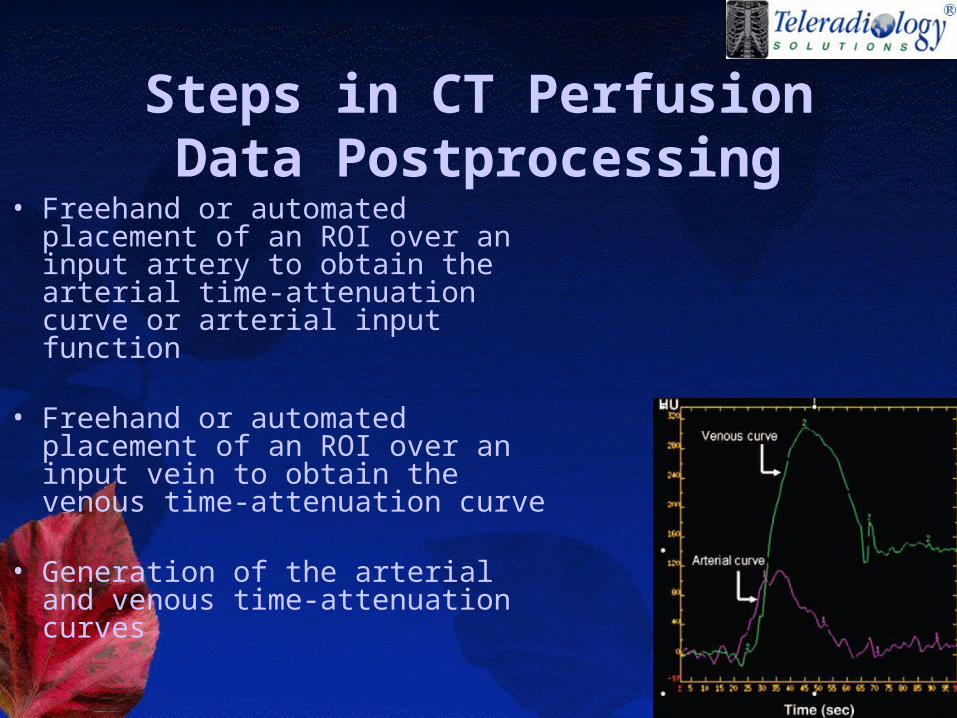
Steps in CT Perfusion Data Postprocessing
• Freehand or automated placement of an ROI over an input artery to obtain the arterial time-attenuation curve or arterial input function
• Freehand or automated placement of an ROI over an input vein to obtain the venous time-attenuation curve
• Generation of the arterial and venous time-attenuation curves
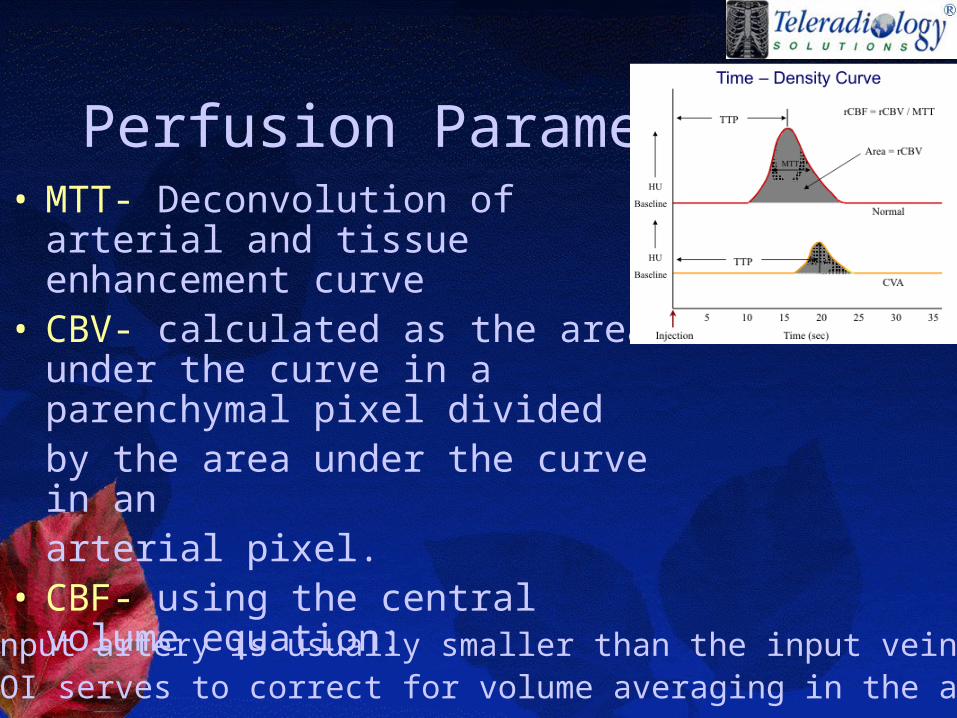
Perfusion Parameters• MTT- Deconvolution of arterial
and tissue enhancement curve• CBV- calculated as the area
under the curve in a parenchymal pixel dividedby the area under the curve in an arterial pixel.
• CBF- using the central volume equation:
CBF= CBV/MTT
•Since the input artery is usually smaller than the input vein, the venous ROI serves to correct for volume averaging in the arterial ROI.
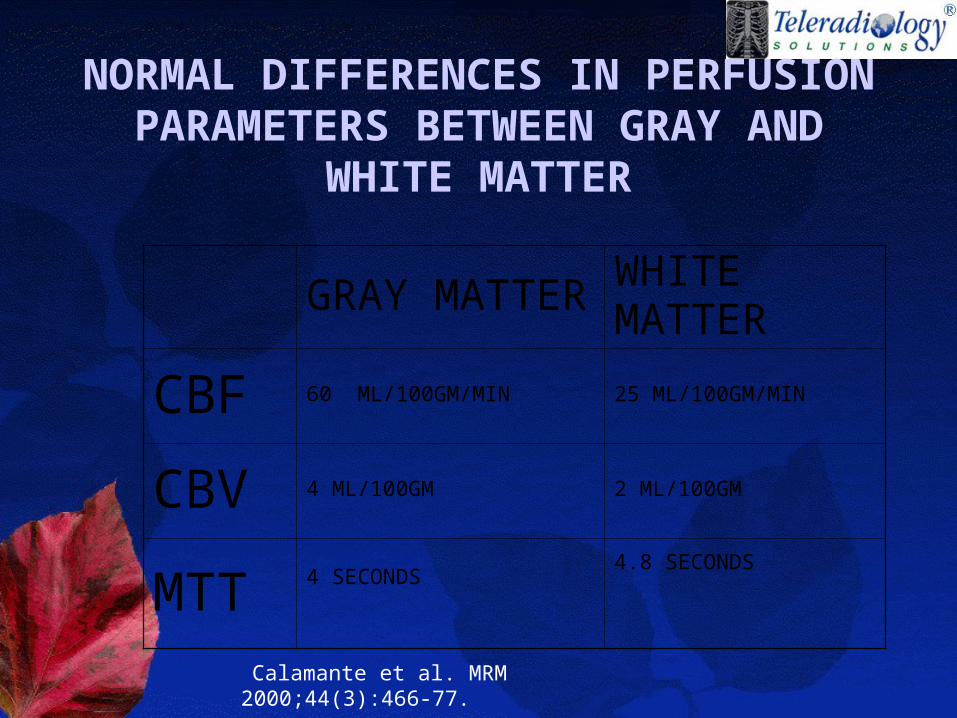
NORMAL DIFFERENCES IN PERFUSION PARAMETERS
BETWEEN GRAY AND WHITE MATTER
GRAY MATTER
WHITE MATTER
CBF 60 ML/100GM/MIN 25 ML/100GM/MIN
CBV 4 ML/100GM 2 ML/100GM
MTT 4 SECONDS4.8 SECONDS
Calamante et al. MRM 2000;44(3):466-77.
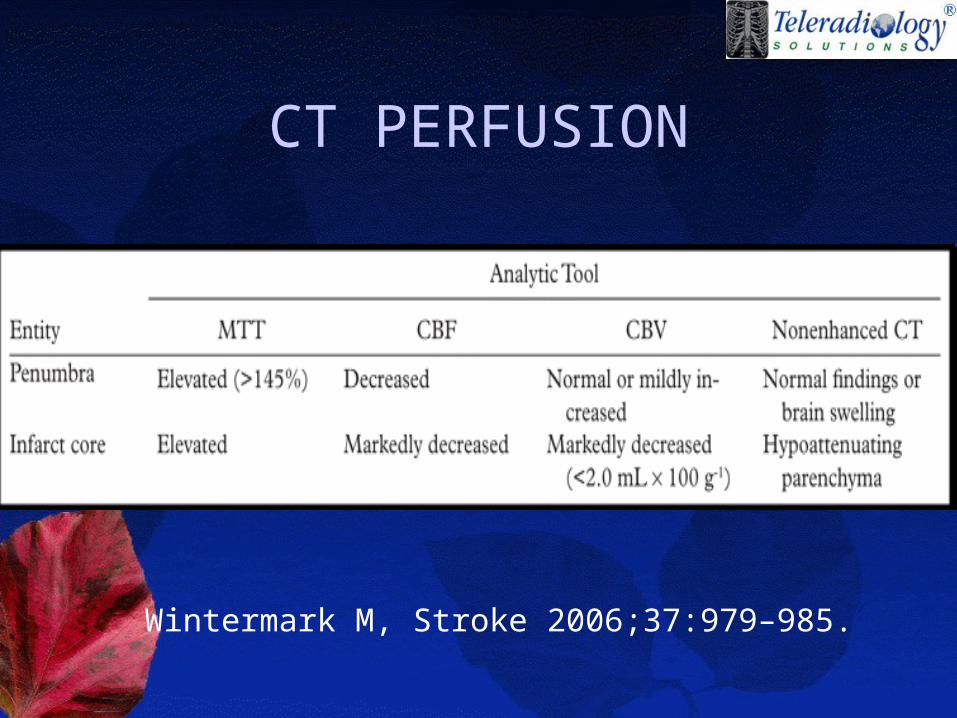
CT PERFUSION
Wintermark M, Stroke 2006;37:979–985.
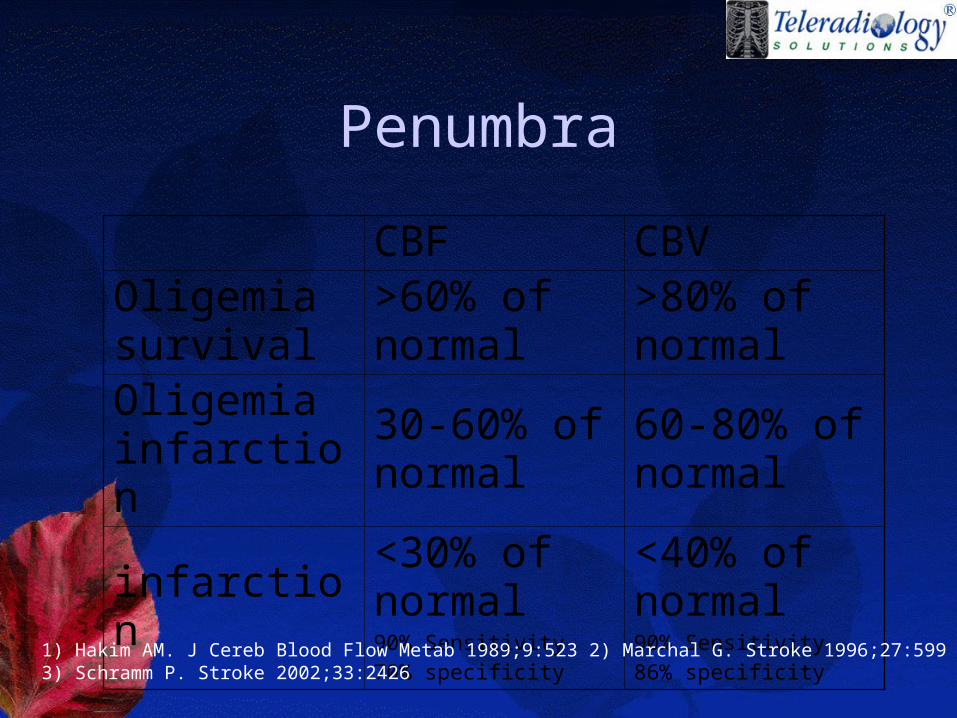
Penumbra
CBF CBVOligemia survival
>60% of normal
>80% of normal
Oligemia infarction
30-60% of normal
60-80% of normal
infarction<30% of normal90% Sensitivity
70% specificity
<40% of normal90% Sensitivity
86% specificity1) Hakim AM. J Cereb Blood Flow Metab 1989;9:523 2) Marchal G. Stroke 1996;27:599 3) Schramm P. Stroke 2002;33:2426
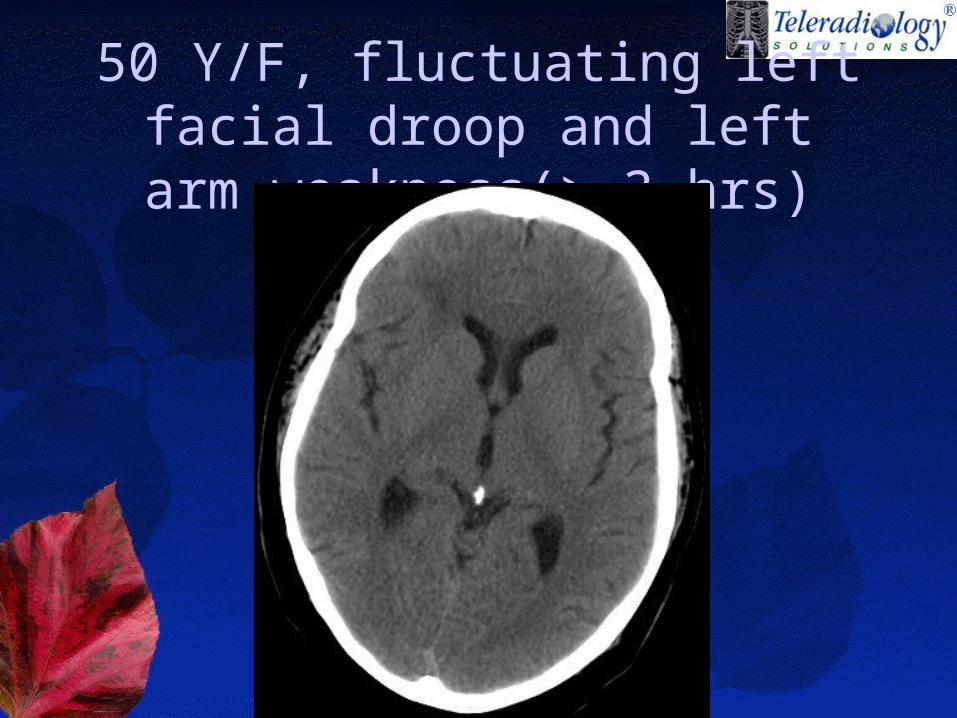
50 Y/F, fluctuating left facial droop and left arm weakness(> 3 hrs)
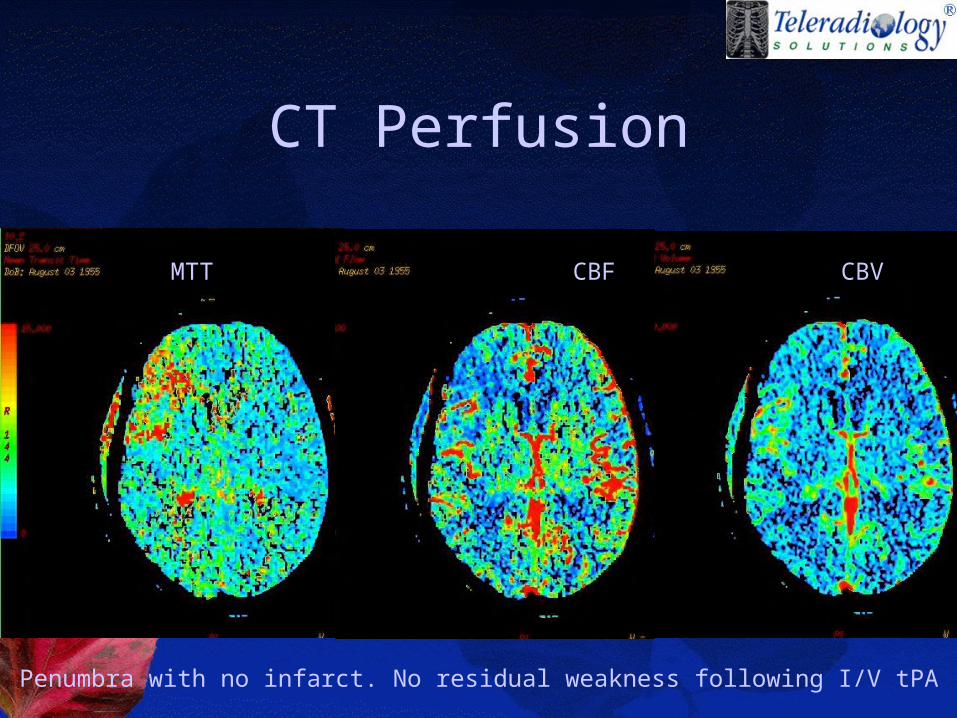
CT Perfusion
Penumbra with no infarct. No residual weakness following I/V tPA
MTT CBF CBV
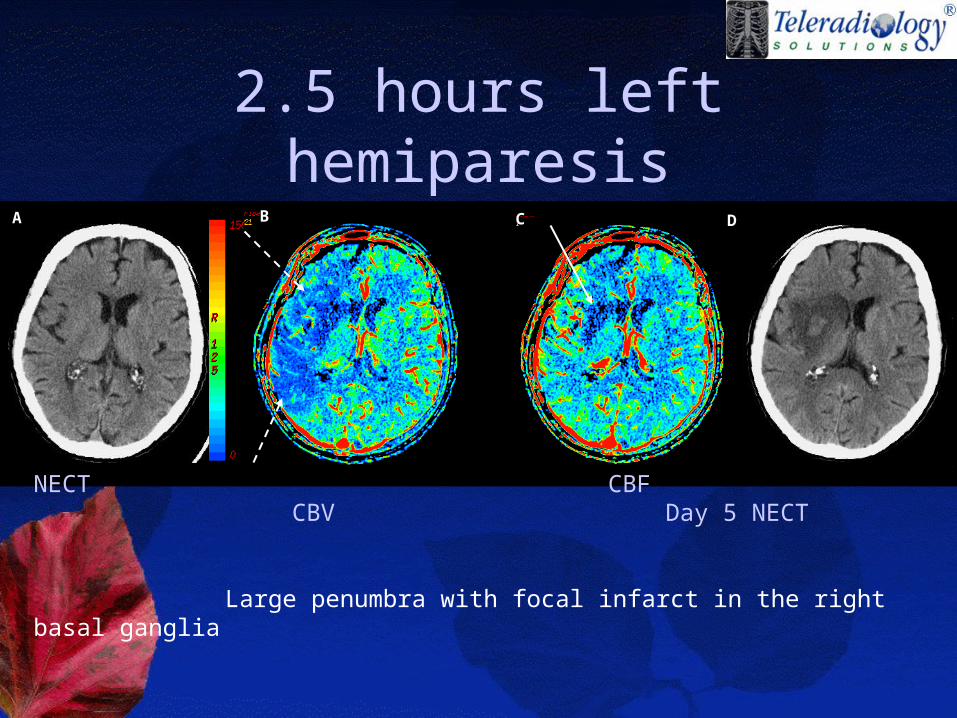
2.5 hours left hemiparesisB C DA
NECT CBF CBV Day 5 NECT
Large penumbra with focal infarct in the right basal ganglia
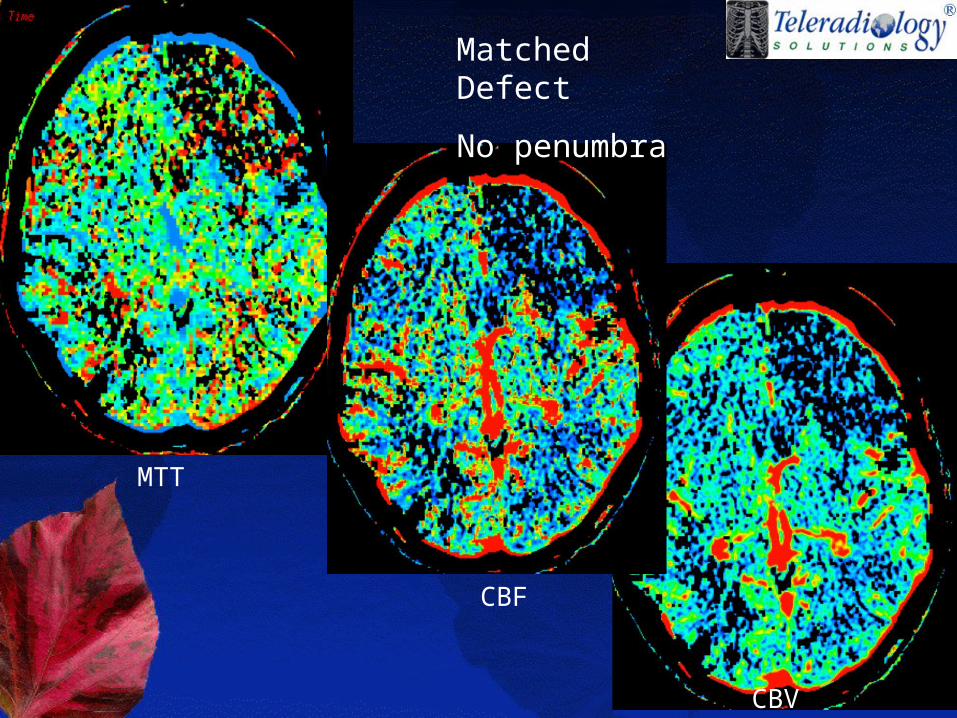
CBF
MTT
CBV
Matched Defect
No penumbra
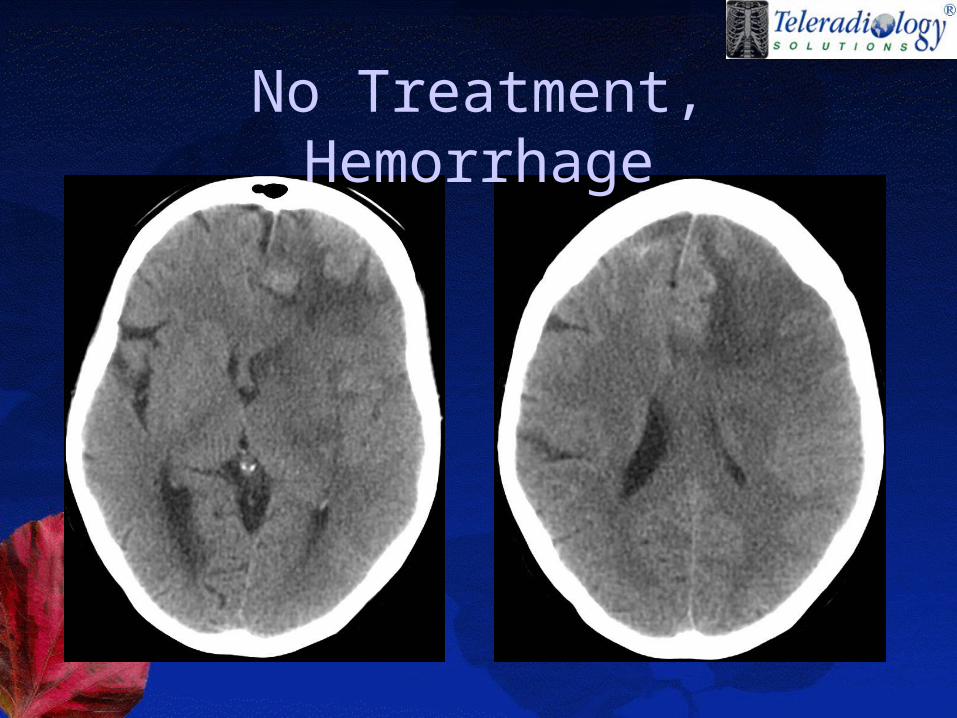
No Treatment, Hemorrhage
Perfused-blood-volume mapping.
(slow infusion technique)• Quantitative cerebral blood volume
values are obtained by subtracting the unenhanced CT image data from the CT angiographic source image data.
• Advantage: ability to depict the whole brain
• Disadvantage: cannot be used to evaluate cerebral blood flow and mean transit time (hence, the penumbra)
CT Angiogram
• to enable more accurate determination of prognosis
• To guide therapy
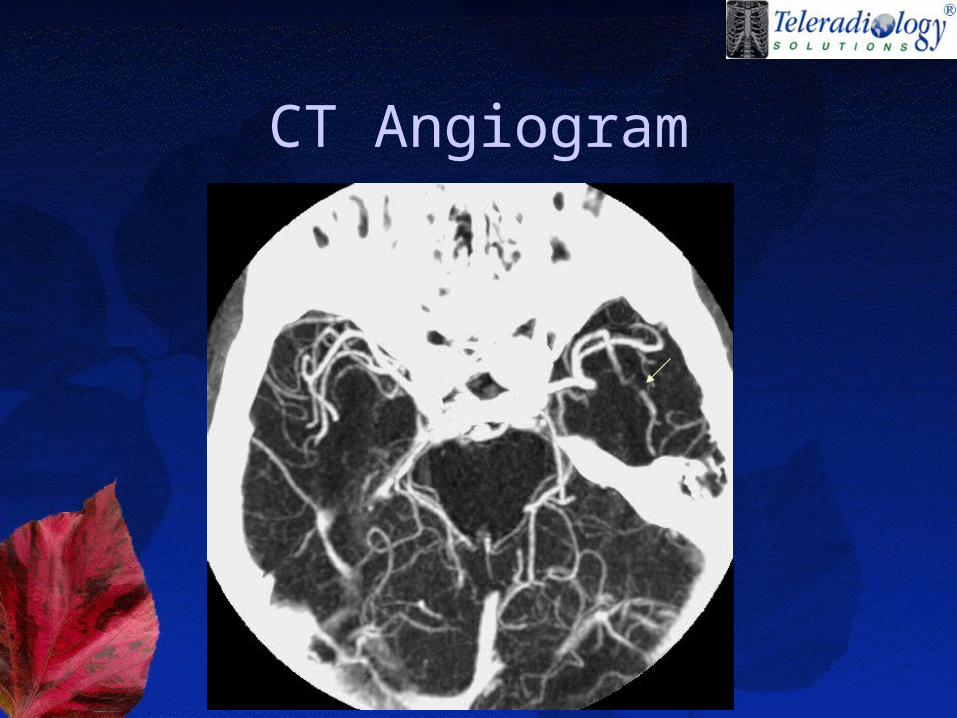
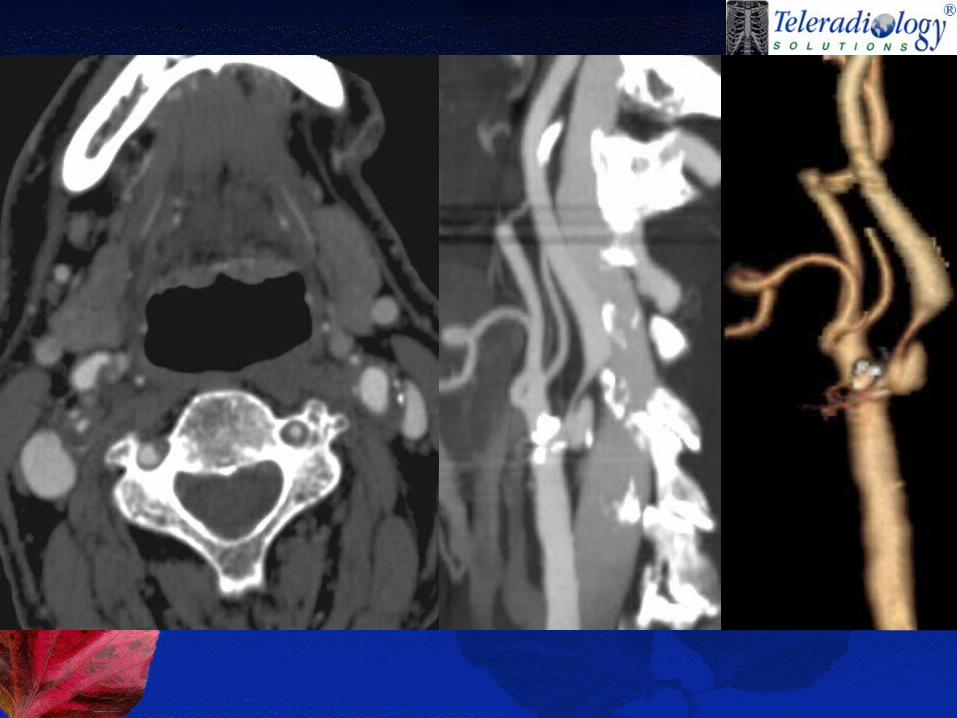
CT Angiogram
• Site of occlusion• R/o arterial dissection• grade collateral blood flow• characterize atherosclerotic
disease. • whole-brain "perfused blood
volume map
CT Angiogram
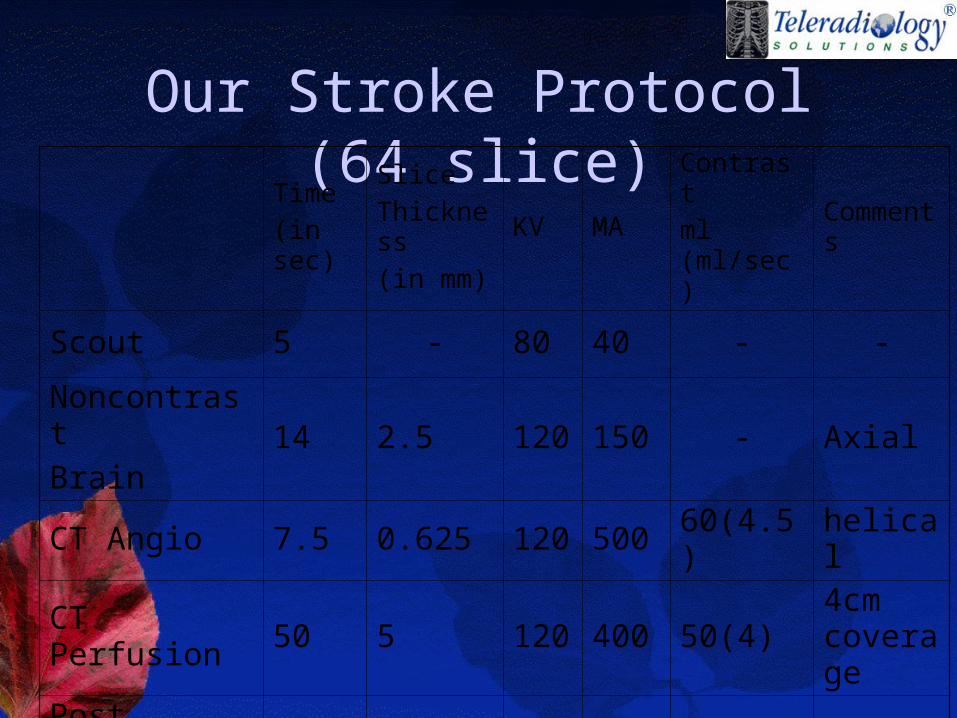
Our Stroke Protocol (64 slice)Time
(in sec)
Slice
Thickness
(in mm)
KV MAContrast
ml (ml/sec)Comments
Scout 5 - 80 40 - -
Noncontrast
Brain14 2.5 120 150 - Axial
CT Angio 7.5 0.625 120 500 60(4.5) helical
CT Perfusion 50 5 120 400 50(4)4cm coverage
Post contrast
Brain7.5 2.5 120 150 - Axial
Other Emerging CT Imaging Techniques In
Acute Stroke• Single Photon Emission Computed
Tomography (SPECT)
• Xenon Enhanced CT
• Positron Emission Tomography