Embed Size (px)
Citation preview
Accepted Manuscript
Role of Double Oxide Film Defects in the Formation of Gas Porosity in CommercialPurity and Sr-containing Al Alloys
Batool Farhoodi, Ramin Raiszadeh, Mohammad-Hasan Ghanaatian
PII: S1005-0302(13)00200-4
DOI: 10.1016/j.jmst.2013.09.001
Reference: JMST 195
To appear in: Journal of Materials Science & Technology
Received Date: 2 February 2012
Revised Date: 13 May 2012
Please cite this article as: B. Farhoodi, R. Raiszadeh, M.-H. Ghanaatian, Role of Double Oxide FilmDefects in the Formation of Gas Porosity in Commercial Purity and Sr-containing Al Alloys, Journal ofMaterials Science & Technology (2013), doi: 10.1016/j.jmst.2013.09.001.
This is a PDF file of an unedited manuscript that has been accepted for publication. As a service toour customers we are providing this early version of the manuscript. The manuscript will undergocopyediting, typesetting, and review of the resulting proof before it is published in its final form. Pleasenote that during the production process errors may be discovered which could affect the content, and alllegal disclaimers that apply to the journal pertain.

MANUSCRIP
T
ACCEPTED
ACCEPTED MANUSCRIPT
Role of Double Oxide Film Defects in the Formation of Gas Porosity in Commercial Purity and Sr-containing Al Alloys
Batool Farhoodi, Ramin Raiszadeh*, Mohammad-Hasan Ghanaatian
Department of Metallurgy and Materials Science and Mineral Industries Research Centre, Shahid Bahonar University of Kerman, Jomhoori Eslami Blvd., Kerman, Iran
[Manuscript received 2 February 2012, in revised form 13 May 2012]
* Corresponding author. Assoc. Prof., Ph.D.; Tel./Fax: +98 341 2132641; E-mail address: [email protected], [email protected] (R. Raiszadeh).
The role of double oxide film (bifilm) defects in the formation of gas porosity in commercial purity and Sr-containing Al alloys was investigated by means of a reduced pressure test (RPT) technique. The liquid metal was poured from a height into a crucible to introduce oxide defects into the melt. The melt was then subjected to different “hydrogen addition” and “holding in liquid state” regimes before RPT samples were taken. The RPT samples were then characterized by determining their porosity parameters and examining the internal surfaces of the pores formed in them by scanning electron microscopy. The results indicated oxide defects as the initiation sites for the growth of gas porosity, both in commercial purity and Sr-containing Al alloys. The results also rejected reduction of the surface tension of the melt, increase in the volumetric shrinkage and reduction in interdendritic feeding as the possible causes of an increase in the porosity content of the Al castings modified with strontium. The change in the composition of the oxide layers of double oxide film defects was suggested to be responsible for this behaviour.
KEY WORDS: Double oxide film defects; Bifilm; Strontium; Modification; Porosity; Aluminum casting
1. Introduction
Porosity is considered to be one of the major factors responsible for the failure of cast aluminium alloy products[1]. Two major effects are well recognized as contributing to the formation of porosity in solidifying metals, and they are: 1) shrinkage of metal during solidification, and 2) gas evolution resulted from a decrease in solubility in the solid metal compared to the liquid[2]. These phenomena can occur simultaneously and act synergistically to develop porosity in solidifying metal. A pore, however, as a new separate phase in the liquid metal, principally needs to nucleate before it can grow.
Campbell[3] calculated the pressure required for the homogeneous nucleation of a H bubble in liquid aluminum melt; it is extremely high (i.e., about 31000 atm (3.14×10⁹ Pa)), and certainly not attainable. For heterogeneous nucleation, this pressure was estimated to be about 360 atm (36.5×10⁶ Pa), which is a pressure highly unlikely to be attained in liquid Al alloys.
Campbell[3] suggested that the existence of crack-like double oxide film (bifilm) defects in the liquid Al would eliminate the need for the nucleation stage to occur during the formation of a H bubble, and hence, greatly facilitate its formation. This defect, which consists of two oxide layers and a volume of gas (presumably predominantly air) trapped between them, can be produced when the surface of the metal folds upon itself and becomes submerged in the bulk liquid. The defect, therefore, necessarily resembles and acts as a crack in the liquid metal. More information about double oxide film defects can be found in literature[3–9].

MANUSCRIP
T
ACCEPTED
ACCEPTED MANUSCRIPT
2
Raiszadeh and Griffiths[4,5] showed that H atoms can penetrate into the trap atmosphere within a double oxide film defect through the cracks that form on the oxide layers when the defect is subjected to deformations in the liquid flow, and expand the defect to a gas bubble. Dispinar and Campbell[1] provided some evidence that porosity cannot form in reduced pressure test (RPT) samples of a clean melt (presumably double oxide film free), even when the H level of the melt is increased to the saturation point (i.e., about 0.6 mL/100 g Al).
The formation of bonding between the two layers of a double oxide film defect and the elimination of its deleterious effect as a porosity initiator was first suggested by Nyahumwa et al.[10,11], and was recently confirmed by this research team[6–8,12]. The two criteria for the formation of bonding between the two layers of an oxide film defect were determined in these studies to be: 1) complete consumption of O and N within the defect through the reaction with the surrounding melt, and 2) the occurrence of a transformation involving the rearrangement of atoms on the internal surfaces of the oxide layers. The two layers of an oxide film defect were observed to begin bonding to each other after being held in commercial purity Al melt for 5 h[8]. This was attributed to the transformation of γ– to α–Al2O3. The bonding also occurred between the layers of the defect during holding in Al–0.3 wt% Mg melt[6]. This time, the bonding was suggested to occur as a result of the transformation of Al2O3 to spinel (MgAl2O4) and spinel to MgO in short and long holding time, respectively.
Campbell’s hypothesis about the role of double oxide film defects as initiators of the growth of gas porosity, however, requires more systematic investigation for support. This was the aim of the work reported here. In this research, the role of double oxide film defects in the formation of gas porosity in commercial purity and Al–0.05 wt% Sr alloys has been investigated by means of a reduced pressure test (RPT) technique. This technique is widely known and already used throughout the industry, usually to assess H content of the melt. The test has been used recently for the evaluation of double oxide film content of liquid Al melts. The test consists of solidification under reduced pressure that serves to expand the entrapped gas between the halves of the oxide defects, rendering the defects more visible[1,13–15].
Sr-containing Al alloy has also been selected for investigation besides commercial purity Al melt, since this element is known to increase the porosity content of hypoeutectic Al–Si alloys when it is added to these alloys as a Si eutectic modifying agent. A tremendous amount of work has been carried out to study this effect[16], with no agreement achieved among the researchers. The main causes of an increase in porosity in Sr treated Al–Si alloys reported in literature include: - an increase in both the inclusion content of the melt and the amount of H absorbed into the oxides; - an increase in the H content of the melt; - a reduction of the surface tension of the liquid; - an increase in the volumetric shrinkage; - a reduction in interdendritic feeding; - an increase in the time for H diffusion and porosity growth due to an increase in the freezing range by depressing the eutectic solidification temperature.
The influence of adding 0.05 wt% Sr to commercial purity Al melt on the behaviour of double oxide film defects was investigated recently by Nateghian et al[12]. Their results showed that in the presence of Sr, the A12O3 layers of a newly formed oxide defect started to transform to SrO gradually from the moment that the layers submerged into the melt, through the replacement of Al atoms by Sr. The rate of transformation in the oxide layers was relatively high during the first minutes after the entrainment of the defect such that 20% of the transformation took about 12 min, while the whole transformation took about 50 h to complete. It was suggested that since the composition of the oxide layers of a double oxide film defect submerged in Sr-treated melt is different from that of pure Al, the mechanical properties and the behaviour of the defect in these two melts would also be significantly different.
2. Experimental
Commercial purity Al melt of 3.5 kg, with the composition shown in Table 1, was prepared in an electric furnace and then poured at a temperature of 750 °C from a height of 500 mm into a second crucible with a
MANUSCRIP
T
ACCEPTED
ACCEPTED MANUSCRIPT
3
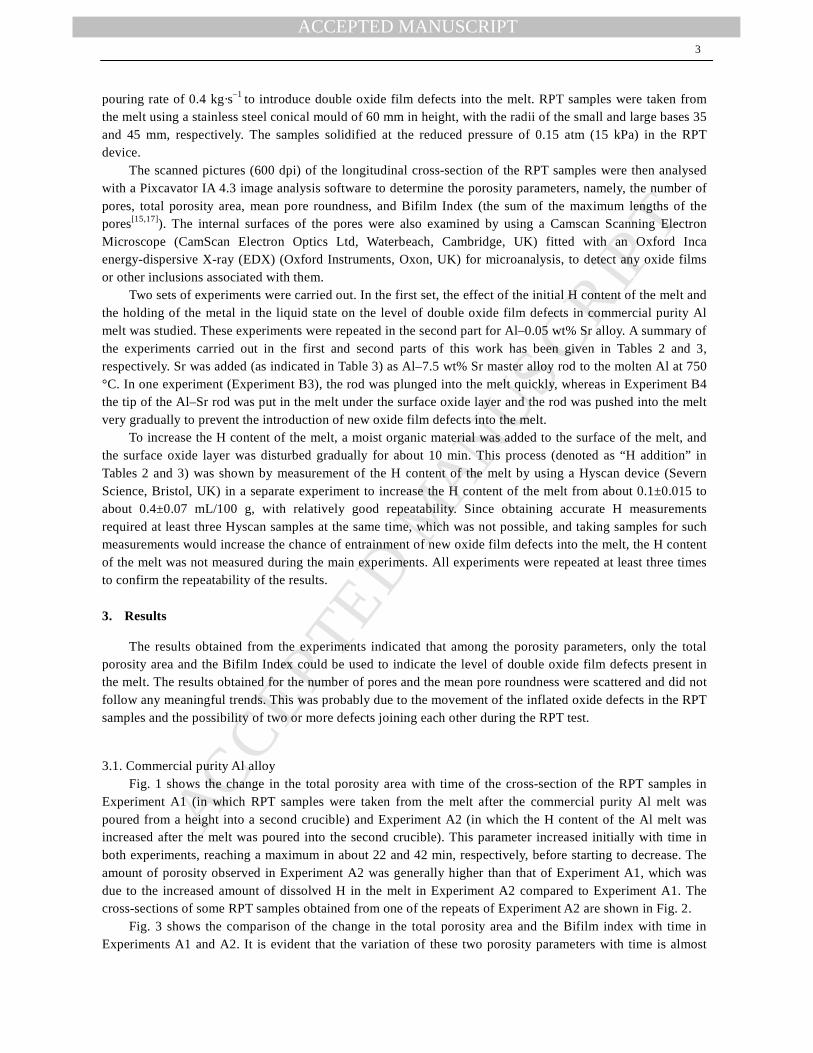
pouring rate of 0.4 kg·s–1 to introduce double oxide film defects into the melt. RPT samples were taken from the melt using a stainless steel conical mould of 60 mm in height, with the radii of the small and large bases 35 and 45 mm, respectively. The samples solidified at the reduced pressure of 0.15 atm (15 kPa) in the RPT device.
The scanned pictures (600 dpi) of the longitudinal cross-section of the RPT samples were then analysed with a Pixcavator IA 4.3 image analysis software to determine the porosity parameters, namely, the number of pores, total porosity area, mean pore roundness, and Bifilm Index (the sum of the maximum lengths of the pores[15,17]). The internal surfaces of the pores were also examined by using a Camscan Scanning Electron Microscope (CamScan Electron Optics Ltd, Waterbeach, Cambridge, UK) fitted with an Oxford Inca energy-dispersive X-ray (EDX) (Oxford Instruments, Oxon, UK) for microanalysis, to detect any oxide films or other inclusions associated with them.
Two sets of experiments were carried out. In the first set, the effect of the initial H content of the melt and the holding of the metal in the liquid state on the level of double oxide film defects in commercial purity Al melt was studied. These experiments were repeated in the second part for Al–0.05 wt% Sr alloy. A summary of the experiments carried out in the first and second parts of this work has been given in Tables 2 and 3, respectively. Sr was added (as indicated in Table 3) as Al–7.5 wt% Sr master alloy rod to the molten Al at 750 °C. In one experiment (Experiment B3), the rod was plunged into the melt quickly, whereas in Experiment B4 the tip of the Al–Sr rod was put in the melt under the surface oxide layer and the rod was pushed into the melt very gradually to prevent the introduction of new oxide film defects into the melt.
To increase the H content of the melt, a moist organic material was added to the surface of the melt, and the surface oxide layer was disturbed gradually for about 10 min. This process (denoted as “H addition” in Tables 2 and 3) was shown by measurement of the H content of the melt by using a Hyscan device (Severn Science, Bristol, UK) in a separate experiment to increase the H content of the melt from about 0.1±0.015 to about 0.4±0.07 mL/100 g, with relatively good repeatability. Since obtaining accurate H measurements required at least three Hyscan samples at the same time, which was not possible, and taking samples for such measurements would increase the chance of entrainment of new oxide film defects into the melt, the H content of the melt was not measured during the main experiments. All experiments were repeated at least three times to confirm the repeatability of the results.
3. Results
The results obtained from the experiments indicated that among the porosity parameters, only the total porosity area and the Bifilm Index could be used to indicate the level of double oxide film defects present in the melt. The results obtained for the number of pores and the mean pore roundness were scattered and did not follow any meaningful trends. This was probably due to the movement of the inflated oxide defects in the RPT samples and the possibility of two or more defects joining each other during the RPT test.
3.1. Commercial purity Al alloy Fig. 1 shows the change in the total porosity area with time of the cross-section of the RPT samples in
Experiment A1 (in which RPT samples were taken from the melt after the commercial purity Al melt was poured from a height into a second crucible) and Experiment A2 (in which the H content of the Al melt was increased after the melt was poured into the second crucible). This parameter increased initially with time in both experiments, reaching a maximum in about 22 and 42 min, respectively, before starting to decrease. The amount of porosity observed in Experiment A2 was generally higher than that of Experiment A1, which was due to the increased amount of dissolved H in the melt in Experiment A2 compared to Experiment A1. The cross-sections of some RPT samples obtained from one of the repeats of Experiment A2 are shown in Fig. 2.
Fig. 3 shows the comparison of the change in the total porosity area and the Bifilm index with time in Experiments A1 and A2. It is evident that the variation of these two porosity parameters with time is almost
MANUSCRIP
T
ACCEPTED
ACCEPTED MANUSCRIPT
4
identical, and that either of them can be used as an indication of the double oxide film content of the melt. Fig. 4 shows an SEM micrograph from a pore that formed in the RPT sample taken from the melt in
Experiment A1, 15 min after the start of the sampling. Comparison of the EDX spectra obtained from the surface of this pore (i.e., from point P1, shown in Fig. 5(a)) with that obtained from the cross-section of the RPT sample (out of any pores, given in Fig. 5(b)) illustrated that the pore is covered with a relatively thick layer of Al2O3. The surfaces of the dendrites inside the pores were also occasionally covered with Al2O3 fragments. Such fragments are evident in Fig. 6, which shows the SEM micrograph of a pore formed in an RPT sample taken from the melt in Experiment A1, 30 min after the start of the sampling.
Fig. 7 shows the comparison of the total porosity areas in Experiments A2, A3 and A4. The commercial purity Al melt in Experiment A3 was held in the furnace for 24 h before its H content was increased and the RPT samples were taken. Fig. 7 shows that although the total porosity area in the samples obtained from Experiment A3 were generally lower than that of Experiment A2, the 24 h holding of the metal in the liquid state did not cause the oxide film defects to be eliminated from the melt.
The commercial purity melt in Experiment A4 was also held in the furnace for 24 h, but the H content of the melt was increased before this holding time. The cross-section of the RPT samples obtained from this experiment showed only a few small pores in the RPT sample that was taken from the melt 15 min after the start of the sampling (see Fig. 8). This indicated that the procedure caused almost all of the oxide film defects to be eliminated from the liquid metal.
The SEM micrograph obtained from the internal surface of a pore formed in the RPT sample taken from the melt in Experiment A3, 2 h after the start of the sampling, is shown in Fig. 9. It illustrates the wrinkled surface, from which liquid metal emerged and then solidified to form raised dendrites. The EDX spectra obtained from the surface of the raised dendrites (not presented here for brevity) showed 0.0 wt% O, which indicated that the O of the trapped atmosphere within the double oxide film defect had been consumed completely before this time.
3.2. Al–0.05 wt% Sr Alloy
The change in the total porosity area with time of the samples obtained from Experiments B1 and B2, in which 0.05 wt% Sr was added to the commercial purity Al melt, as well as the variation of the concentration of Sr in the melt with time, are shown in Fig. 10. As is evident in this figure, the total porosity area of the samples taken from Experiment B2 was higher than that obtained from Experiment B1 in all samples, which is due to the increased amount of dissolved H in the melt in Experiment B2 compared to Experiment B1.
Comparison of the total porosity area in Experiment B2 and Experiment A2 (dotted curve in Fig. 10) indicated that the presence of 0.05 wt% Sr in the melt increased the total porosity area and the durability of the gas pores in the samples significantly. The total porosity area in Experiment A2 increased to its maximum in about 50 min and decreased sharply, whereas this porosity parameter in Experiment B2 reached its maximum in about 3 h, and then decreased more gradually.
Fig. 10 also illustrates that the concentration of Sr in the melt decreased in the liquid metal with an exponential decay trend, a trend typical of parameters in which the rate of decrease is proportional to their values. This trend was not analogous to that of the total porosity area in Experiments B1 and B2. The concentration of Sr in the melt went from 0.047 wt% to 0.001 wt% in 30 h. Despite the very low Sr content of 0.004 wt% in the melt, the total porosity area at the cross-section of the RPT sample taken from the melt 21 h after the start of the sampling in Experiment B2 showed a high total porosity area of about 145 mm2.
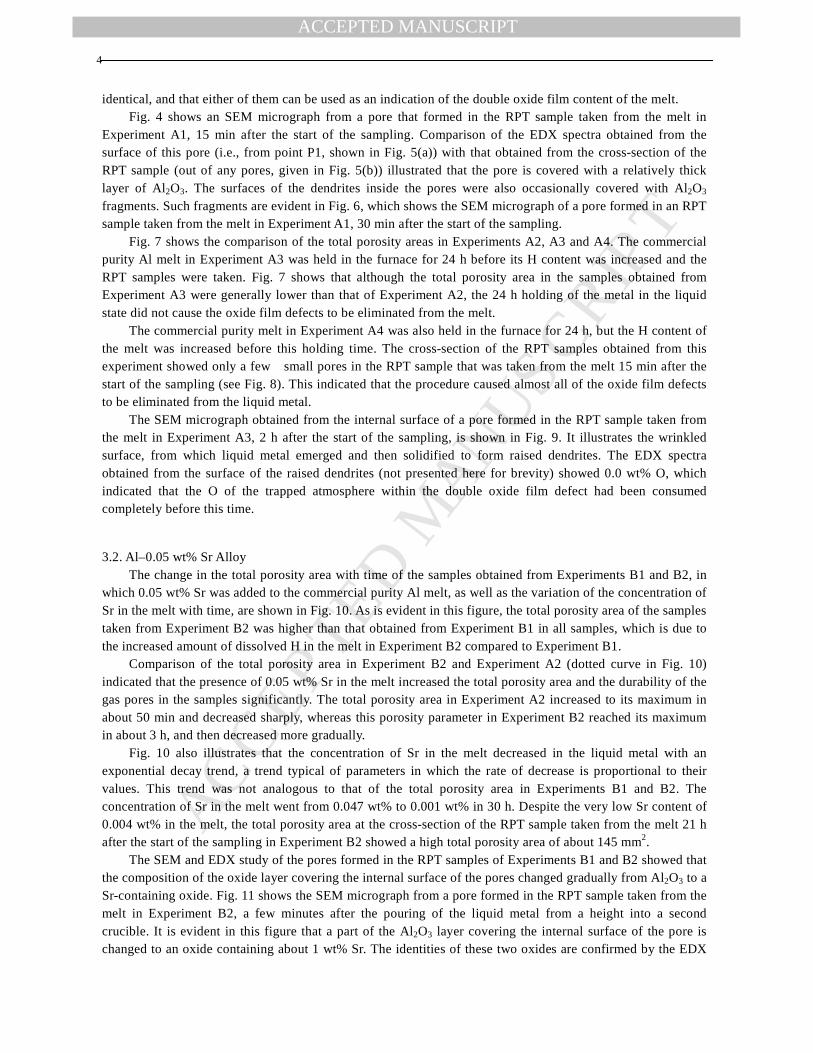
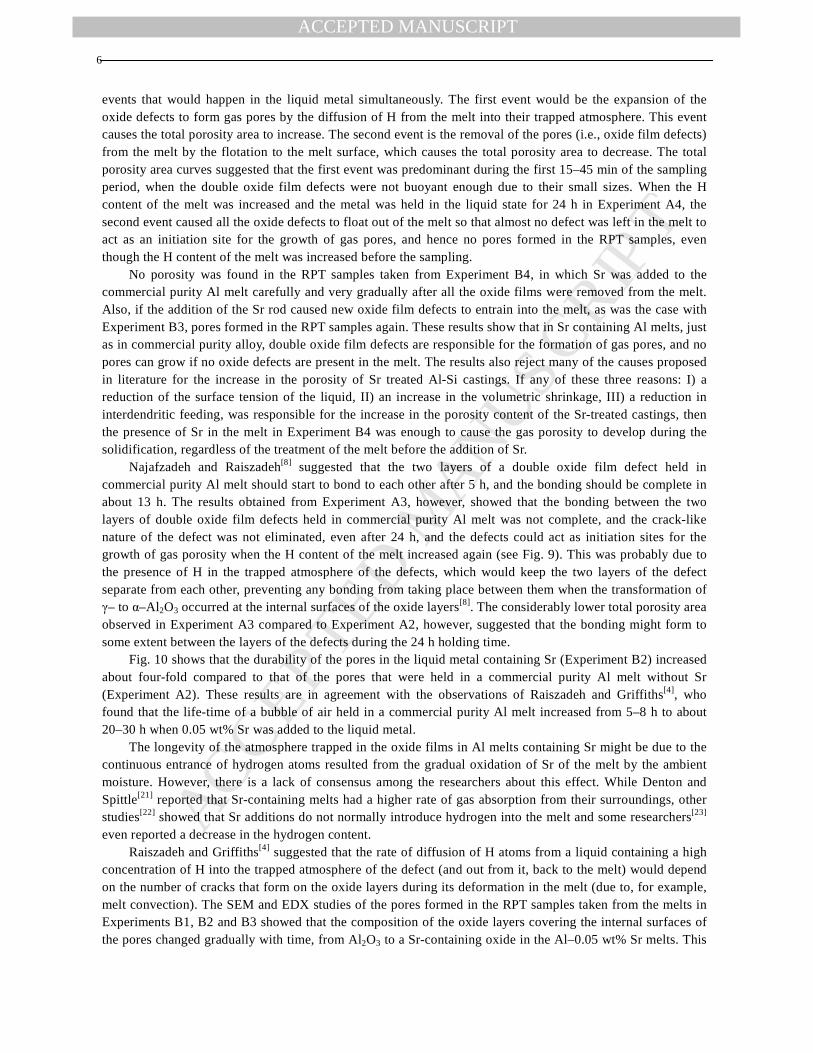
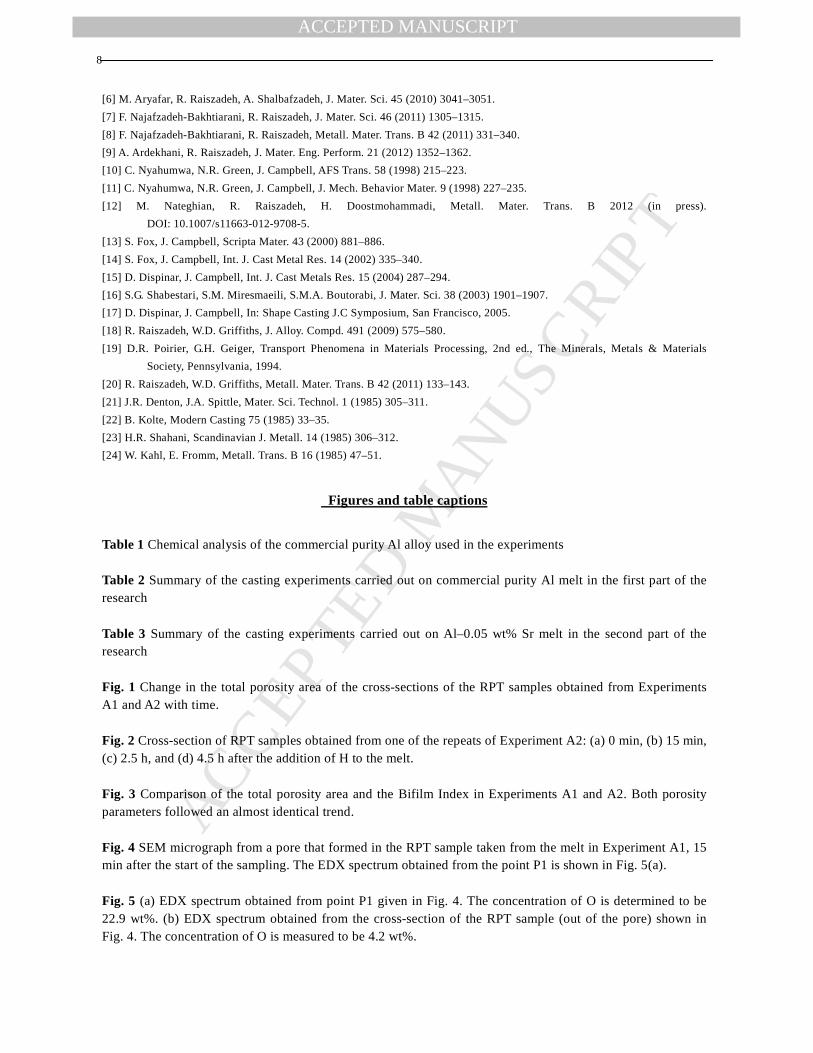
The SEM and EDX study of the pores formed in the RPT samples of Experiments B1 and B2 showed that the composition of the oxide layer covering the internal surface of the pores changed gradually from Al2O3 to a Sr-containing oxide. Fig. 11 shows the SEM micrograph from a pore formed in the RPT sample taken from the melt in Experiment B2, a few minutes after the pouring of the liquid metal from a height into a second crucible. It is evident in this figure that a part of the Al2O3 layer covering the internal surface of the pore is changed to an oxide containing about 1 wt% Sr. The identities of these two oxides are confirmed by the EDX

MANUSCRIP
T
ACCEPTED
ACCEPTED MANUSCRIPT
5
spectra shown in Figs. 12(a) and 12(b). The extent of the transformed area increased as the metal remained in the liquid state for a longer time, so that most of the internal surface of the pores formed in the RPT samples obtained from Experiment B1, 5 h after the start of the sampling was covered by the Sr-containing oxide layer (see Figs. 13 and 14).
In Fig. 15, the change in the total porosity area with time obtained in Experiments B3 and B4 is compared with those of Experiments A2 and B2. The H content of the commercial purity Al melt was increased in Experiments B3 and B4 before the melt was held in the furnace for 24 h, and Al-Sr rod was added to the melt after this holding time. Fig. 15 shows that the change in the total porosity area in Experiment B3, in which the Al–Sr rod was plunged into the melt, was similar to that of Experiment A2, whereas no porosity was formed at the cross-section of the RPT samples taken from Experiment B4, in which the Al–Sr rod was pushed into the melt very slowly so that the tip of the rod melted gradually just beneath the surface oxide layer. The concentration of Sr in the melt was measured, after the addition of Al–Sr rod, as 0.053 and 0.045 wt% in Experiments B3 and B4, respectively.
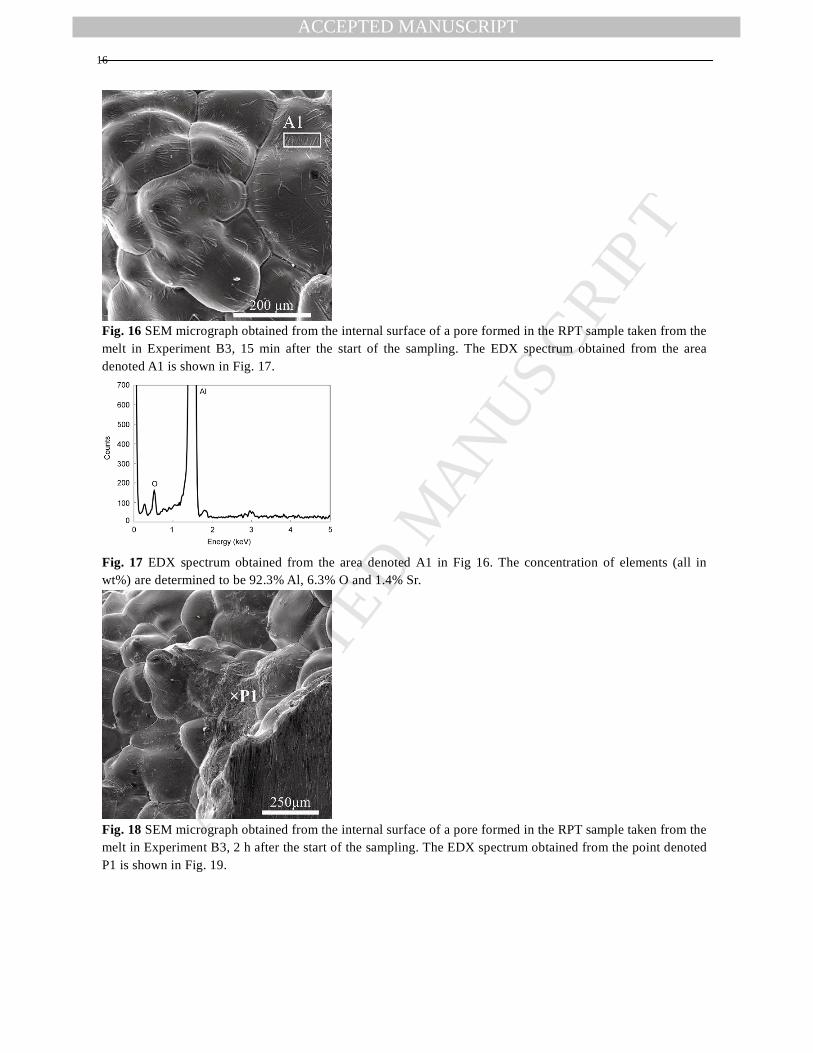
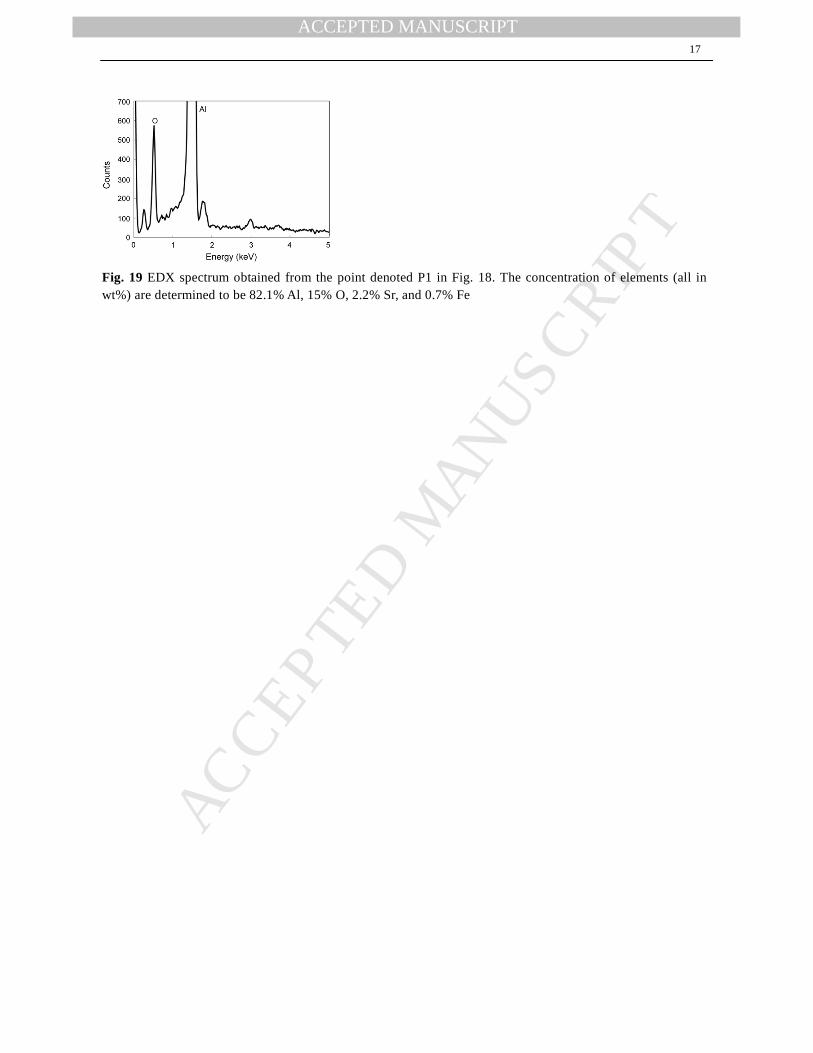
Figs. 16 and 18 show the SEM micrographs obtained from the internal surfaces of the pores formed in the RPT samples taken from the melts in Experiment B3, 15 min and 2 h after the start of the sampling, respectively. Fig. 16 illustrates that the internal surface of the pore was covered by a thin layer of a Sr-containing oxide layer. The identity of this layer was confirmed by the EDX spectrum obtained from the area denoted A1 in this figure (shown in Fig. 17). When being held in the liquid state for a longer time (2 h, see Fig. 18), thicker layers with higher concentrations of Sr and O (Fig. 19) appeared in the internal surfaces of the pores.
4. Discussion
Raiszadeh and Griffiths[18] studied the effect of holding an Al melt containing double oxide film defects
under 1000 and 80 mbar (100×103 and 8×10³ Pa) for extended periods of time up to 60 min. Their results suggested that the number of oxide film defects in the melt would gradually decrease due to their continuous migration towards the upper surface, and that holding the melt under a vacuum would increase this removal rate due to enhanced floatation. In the present study, therefore, it was assumed that increasing the H content of the melt (to expand the defects and increase their buoyancy) and holding the melt for 24 h would eliminate, or at least drastically reduce the number of oxide defects in the melt. According to Campbell[3] and Dispinar[1], if no oxide defect is present in the melt, regardless of the H content of the melt, no gas porosity would form during the solidification.
The results obtained in this study supported the above hypothesis. The internal surfaces of the pores formed in all the RPT samples were covered with a layer of oxide, with no exception. Also, despite the presence of a high concentration of H in the melt, almost no pore was found in the RPT samples taken from the melt in Experiments A4 and B4, in which the H content of the melt was increased before the melt was held in the furnace for 24 h, and therefore no oxide film defect was presumably present in the melt [18].
The diffusion of H into the trapped atmosphere within the defect inflated the atmosphere (as suggested by Raiszadeh and Griffiths[18]) and increased the buoyancy of the defect[19]. The expansion of the defect would tear it open and allow its internal atmosphere to come into contact with, and react with, the surrounding melt. Such reactions might reseal the defect due to the formation of the reaction products, Al2O3 and AlN[6]. This may be repeated until the entire O and N within the double oxide film defect is consumed. Fig. 9 is an example of this case. The oxide layer covering the internal surface of the pore confirms that the pore formed as a result of the expansion of the atmosphere of a double oxide film defect. The cracks that formed on the oxide layer after the O and N of the atmosphere were consumed did not seal off, and the liquid metal penetrated through these tears to form the raised dendrites visible in the figure.
The total porosity area in all of the experiments initially increased during the first 15–45 min of the sampling period (see Figs. 1, 7 and 10) before it started to decrease gradually. This behaviour, which was also observed by Raiszadeh and Griffiths in two different studies[18,20], could be explained by considering the two
MANUSCRIP
T
ACCEPTED
ACCEPTED MANUSCRIPT
6
events that would happen in the liquid metal simultaneously. The first event would be the expansion of the oxide defects to form gas pores by the diffusion of H from the melt into their trapped atmosphere. This event causes the total porosity area to increase. The second event is the removal of the pores (i.e., oxide film defects) from the melt by the flotation to the melt surface, which causes the total porosity area to decrease. The total porosity area curves suggested that the first event was predominant during the first 15–45 min of the sampling period, when the double oxide film defects were not buoyant enough due to their small sizes. When the H content of the melt was increased and the metal was held in the liquid state for 24 h in Experiment A4, the second event caused all the oxide defects to float out of the melt so that almost no defect was left in the melt to act as an initiation site for the growth of gas pores, and hence no pores formed in the RPT samples, even though the H content of the melt was increased before the sampling.
No porosity was found in the RPT samples taken from Experiment B4, in which Sr was added to the commercial purity Al melt carefully and very gradually after all the oxide films were removed from the melt. Also, if the addition of the Sr rod caused new oxide film defects to entrain into the melt, as was the case with Experiment B3, pores formed in the RPT samples again. These results show that in Sr containing Al melts, just as in commercial purity alloy, double oxide film defects are responsible for the formation of gas pores, and no pores can grow if no oxide defects are present in the melt. The results also reject many of the causes proposed in literature for the increase in the porosity of Sr treated Al-Si castings. If any of these three reasons: I) a reduction of the surface tension of the liquid, II) an increase in the volumetric shrinkage, III) a reduction in interdendritic feeding, was responsible for the increase in the porosity content of the Sr-treated castings, then the presence of Sr in the melt in Experiment B4 was enough to cause the gas porosity to develop during the solidification, regardless of the treatment of the melt before the addition of Sr.
Najafzadeh and Raiszadeh[8] suggested that the two layers of a double oxide film defect held in commercial purity Al melt should start to bond to each other after 5 h, and the bonding should be complete in about 13 h. The results obtained from Experiment A3, however, showed that the bonding between the two layers of double oxide film defects held in commercial purity Al melt was not complete, and the crack-like nature of the defect was not eliminated, even after 24 h, and the defects could act as initiation sites for the growth of gas porosity when the H content of the melt increased again (see Fig. 9). This was probably due to the presence of H in the trapped atmosphere of the defects, which would keep the two layers of the defect separate from each other, preventing any bonding from taking place between them when the transformation of γ– to α–Al2O3 occurred at the internal surfaces of the oxide layers[8]. The considerably lower total porosity area observed in Experiment A3 compared to Experiment A2, however, suggested that the bonding might form to some extent between the layers of the defects during the 24 h holding time.
Fig. 10 shows that the durability of the pores in the liquid metal containing Sr (Experiment B2) increased about four-fold compared to that of the pores that were held in a commercial purity Al melt without Sr (Experiment A2). These results are in agreement with the observations of Raiszadeh and Griffiths[4], who found that the life-time of a bubble of air held in a commercial purity Al melt increased from 5–8 h to about 20–30 h when 0.05 wt% Sr was added to the liquid metal.
The longevity of the atmosphere trapped in the oxide films in Al melts containing Sr might be due to the continuous entrance of hydrogen atoms resulted from the gradual oxidation of Sr of the melt by the ambient moisture. However, there is a lack of consensus among the researchers about this effect. While Denton and Spittle[21] reported that Sr-containing melts had a higher rate of gas absorption from their surroundings, other studies[22] showed that Sr additions do not normally introduce hydrogen into the melt and some researchers[23] even reported a decrease in the hydrogen content.
Raiszadeh and Griffiths[4] suggested that the rate of diffusion of H atoms from a liquid containing a high concentration of H into the trapped atmosphere of the defect (and out from it, back to the melt) would depend on the number of cracks that form on the oxide layers during its deformation in the melt (due to, for example, melt convection). The SEM and EDX studies of the pores formed in the RPT samples taken from the melts in Experiments B1, B2 and B3 showed that the composition of the oxide layers covering the internal surfaces of the pores changed gradually with time, from Al2O3 to a Sr-containing oxide in the Al–0.05 wt% Sr melts. This

MANUSCRIP
T
ACCEPTED
ACCEPTED MANUSCRIPT
7
behaviour has also been observed by Nateghian et al.[12]. Kahl and Fromm[24], who developed a new method to determine the strength of solid skins on liquid metals, realized that small amounts of Na, Li or Ca increase the strength of oxide skins on Al melts dramatically. These researchers did not study the influence of Sr on the strength of oxide skins. However, if this element also exhibits the same influence, then the gradual change in the composition of the oxide layers of a double oxide film defect should gradually increase the mechanical strength of the layers, and hence, decrease the number of cracks that can form on them.
In the above case, the rate of diffusion of H from the melt into the trapped atmosphere would decrease gradually with time, and therefore the defect atmosphere would expand and float to the melt surface at a considerably slower rate compared to when the defect is held in a commercial purity Al melt with no Sr added. When the H content of the melt decreases by equilibrating with the surrounding atmosphere, the H that has diffused into the trapped atmosphere would not be able to diffuse back to the melt easily, and therefore the two layers of the defect would be kept separate from each other, preventing any bonding from taking place between the layers[6–8,12]. The defects would then expand during the reduced pressure solidification to form large pores in the RPT samples. This might explain the longevity of the atmosphere trapped in the oxide films in Al melts containing Sr. This hypothesis, however, needs more experimental evidence for verification.
5. Conclusions
1) Increasing the H content of the melt before holding it for 24 h eliminated all the porosity from the cross-section of the RPT samples, in both commercial purity and Al–0.05 wt% Sr alloys. It is suggested that this procedure caused all the oxide film defects to be removed from the melt by expansion and floatation to the melt surface. This observation supports the proposition of double oxide film defects as the initiators of the gas pores in Al melts.
2) The lack of formation of pores at the cross-sections of the RPT samples taken from the melt which contained Sr but no oxide film defects rejected some of the reasons that are proposed in literature for the effect of Sr on the increase of the porosity content of castings. These reasons are: a reduction of the surface tension of the melt, an increase in the volumetric shrinkage, and a reduction in interdendritic feeding.
3) The durability of the oxide film defects in the melt was increased considerably when 0.05 wt% Sr was added to the melt. The gradual change in the composition of the oxide layers, which would increase the strength of the layers and decrease the number of cracks that formed on the layers during movement in the melt, was suggested to make the diffusion of H atoms into and out from the trapped atmosphere within the defect more difficult and slower, causing the defect to stay in the melt longer than when being held in commercial purity Al melt. This mechanism was suggested to be responsible for the increase in the porosity content of Sr-treated Al castings.
4) Holding the commercial purity Al in the liquid state for 24 h did not cause the two layers of double oxide film defects to bond to each other completely or the crack-like nature of the defect to be eliminated (as was suggested in literature), although the results did suggest that the bonding occurred between the layers to some extent.
REFERENCES
[1] D. Dispinar, J. Campbell, Int. J. Cast Metals Res. 17 (2004) 280–286.
[2] K. Kubo, R.D. Pehlke, AFS Trans. 140 (1986) 753–756.
[3] J. Campbell, Complete Casting Handbook, Butterworth-Heinemann, London, 2011.
[4] R. Raiszadeh, W.D. Griffiths, Metall. Mater. Trans. B 37 (2006) 865–871.
[5] R. Raiszadeh, W.D. Griffiths, Metall. Mater. Trans. B 39 (2008) 298–303.
MANUSCRIP
T
ACCEPTED
ACCEPTED MANUSCRIPT
8
[6] M. Aryafar, R. Raiszadeh, A. Shalbafzadeh, J. Mater. Sci. 45 (2010) 3041–3051.
[7] F. Najafzadeh-Bakhtiarani, R. Raiszadeh, J. Mater. Sci. 46 (2011) 1305–1315.
[8] F. Najafzadeh-Bakhtiarani, R. Raiszadeh, Metall. Mater. Trans. B 42 (2011) 331–340.
[9] A. Ardekhani, R. Raiszadeh, J. Mater. Eng. Perform. 21 (2012) 1352–1362.
[10] C. Nyahumwa, N.R. Green, J. Campbell, AFS Trans. 58 (1998) 215–223.
[11] C. Nyahumwa, N.R. Green, J. Campbell, J. Mech. Behavior Mater. 9 (1998) 227–235.
[12] M. Nateghian, R. Raiszadeh, H. Doostmohammadi, Metall. Mater. Trans. B 2012 (in press).
DOI: 10.1007/s11663-012-9708-5.
[13] S. Fox, J. Campbell, Scripta Mater. 43 (2000) 881–886.
[14] S. Fox, J. Campbell, Int. J. Cast Metal Res. 14 (2002) 335–340.
[15] D. Dispinar, J. Campbell, Int. J. Cast Metals Res. 15 (2004) 287–294.
[16] S.G. Shabestari, S.M. Miresmaeili, S.M.A. Boutorabi, J. Mater. Sci. 38 (2003) 1901–1907.
[17] D. Dispinar, J. Campbell, In: Shape Casting J.C Symposium, San Francisco, 2005.
[18] R. Raiszadeh, W.D. Griffiths, J. Alloy. Compd. 491 (2009) 575–580.
[19] D.R. Poirier, G.H. Geiger, Transport Phenomena in Materials Processing, 2nd ed., The Minerals, Metals & Materials
Society, Pennsylvania, 1994.
[20] R. Raiszadeh, W.D. Griffiths, Metall. Mater. Trans. B 42 (2011) 133–143.
[21] J.R. Denton, J.A. Spittle, Mater. Sci. Technol. 1 (1985) 305–311.
[22] B. Kolte, Modern Casting 75 (1985) 33–35.
[23] H.R. Shahani, Scandinavian J. Metall. 14 (1985) 306–312.
[24] W. Kahl, E. Fromm, Metall. Trans. B 16 (1985) 47–51.
Figures and table captions
Table 1 Chemical analysis of the commercial purity Al alloy used in the experiments Table 2 Summary of the casting experiments carried out on commercial purity Al melt in the first part of the research Table 3 Summary of the casting experiments carried out on Al–0.05 wt% Sr melt in the second part of the research Fig. 1 Change in the total porosity area of the cross-sections of the RPT samples obtained from Experiments A1 and A2 with time. Fig. 2 Cross-section of RPT samples obtained from one of the repeats of Experiment A2: (a) 0 min, (b) 15 min, (c) 2.5 h, and (d) 4.5 h after the addition of H to the melt. Fig. 3 Comparison of the total porosity area and the Bifilm Index in Experiments A1 and A2. Both porosity parameters followed an almost identical trend. Fig. 4 SEM micrograph from a pore that formed in the RPT sample taken from the melt in Experiment A1, 15 min after the start of the sampling. The EDX spectrum obtained from the point P1 is shown in Fig. 5(a). Fig. 5 (a) EDX spectrum obtained from point P1 given in Fig. 4. The concentration of O is determined to be 22.9 wt%. (b) EDX spectrum obtained from the cross-section of the RPT sample (out of the pore) shown in Fig. 4. The concentration of O is measured to be 4.2 wt%.

MANUSCRIP
T
ACCEPTED
ACCEPTED MANUSCRIPT
9
Fig. 6 SEM micrograph from a pore that formed in the RPT sample taken from the melt in Experiment A1, 30 min after the start of the sampling. The concentration of elements at point P1 is determined to be 48.5 wt% O and 51.5 wt% Al. Fig. 7 Change in total porosity area with time in Experiments A2, A3 and A4. Fig. 8 Variation of total porosity area with time in the first hour in Experiments A3 and A4. Fig. 9 SEM micrograph obtained from the internal surface of a pore formed in the RPT sample taken from the melt in Experiment A3, 2 h after the start of sampling. The concentration of O on the wrinkled surface and on the raised dendrites is measured to be 10.3 and 0 wt%, respectively. Fig. 10 Change in the total porosity area with time of the samples obtained from Experiments B1 and B2, and the variation of the concentration of Sr in the melt with time. Fig. 11 SEM micrograph from a pore that formed in the RPT sample taken from the melt in Experiment B2, a few minutes after the pouring of the liquid metal from a height into a second crucible. The EDX spectrum obtained from the points P1 and P2 are shown in Fig. 12(a) and 12(b), respectively. Fig. 12 (a) EDX spectrum obtained from point P1 given in Fig. 11. The concentration of elements are determined (all in wt%) to be 97.3% Al, 2.7% O. (b) EDX spectrum obtained from point P2 given in Fig. 11. The concentration of elements are determined (all in wt%) to be 83.8% Al, 15.3% O and 0.9% Sr. Fig. 13 SEM micrograph obtained from the internal surface of a pore formed in the RPT sample taken from the melt in Experiment B1, 5 h after the start of sampling. The concentration of elements at point P1 (all in wt%) is determined to be 88.6% Al, 9.4% O, and 2.02% Sr. Fig. 14 A higher magnification of the SEM micrograph shown in Fig. 13. Fig. 15 Change in total porosity area with time in Experiments A2, B2, B3 and B4. Fig. 16 SEM micrograph obtained from the internal surface of a pore formed in the RPT sample taken from the melt in Experiment B3, 15 min after the start of the sampling. The EDX spectrum obtained from the area denoted A1 is shown in Fig. 17. Fig. 17 EDX spectrum obtained from the area denoted A1 in Fig 16. The concentration of elements (all in wt%) are determined to be 92.3% Al, 6.3% O and 1.4% Sr. Fig. 18 SEM micrograph obtained from the internal surface of a pore formed in the RPT sample taken from the melt in Experiment B3, 2 h after the start of the sampling. The EDX spectrum obtained from the point denoted P1 is shown in Fig. 19. Fig. 19 EDX spectrum obtained from the point denoted P1 in Fig. 18. The concentration of elements (all in wt%) are determined to be 82.1% Al, 15% O, 2.2% Sr, and 0.7% Fe

MANUSCRIP
T
ACCEPTED
ACCEPTED MANUSCRIPT
10
Table list:
Table 1 Chemical analysis of the commercial purity Al alloy used in the experiments Al Pb Cr Zn Mg Mn Cu Fe Si
Bal. 0.02 0.009 0.005 0.002 0.006 0.001 0.07 0.03
Table 2 Summary of the casting experiments carried out on commercial purity Al melt in the first part of the research
Chronological sequence �
Exp. # Alloy Pouring Holding H addition
Holding Sampling
A1 C. Pure √ — — — √
A2 C. Pure √ — √ — √
A3 C. Pure √ 24 h √ — √
A4 C. Pure √ — √ 24 h √
Table 3 Summary of the casting experiments carried out on Al–0.05 wt% Sr melt in the second part of the research
Chronological sequence �
Exp. # Alloy pouring H addition
Holding Sr addition
Sampling
B1 Al+Sr √ — — — √
B2 Al+Sr √ √ — — √
B3 C. Pure √ √ 24 h √a √
B4 C. Pure √ √ 24 h √b √ a Al–Sr rod was plunged into the melt quickly. b The tip of the Al–Sr rod was put into the melt, just beneath the surface oxide layer, and the rod was pushed into the melt very gradually.

MANUSCRIP
T
ACCEPTED
ACCEPTED MANUSCRIPT
11
Fig. 1 Change in the total porosity area of the cross-sections of the RPT samples obtained from Experiments A1 and A2 with time.
Fig. 2 Cross-section of RPT samples obtained from one of the repeats of Experiment A2: (a) 0 min, (b) 15 min, (c) 2.5 h, and (d) 4.5 h after the addition of H to the melt.
Fig. 3 Comparison of the total porosity area and the Bifilm Index in Experiments A1 and A2. Both porosity parameters followed an almost identical trend.
Fig. 4 SEM micrograph from a pore that formed in the RPT sample taken from the melt in Experiment A1, 15 min after the start of the sampling. The EDX spectrum obtained from the point P1 is shown in Fig. 5(a).

MANUSCRIP
T
ACCEPTED
ACCEPTED MANUSCRIPT
12
Fig. 5 (a) EDX spectrum obtained from point P1 given in Fig. 4. The concentration of O is determined to be 22.9 wt%. (b) EDX spectrum obtained from the cross-section of the RPT sample (out of the pore) shown in Fig. 4. The concentration of O is measured to be 4.2 wt%.
Fig. 6 SEM micrograph from a pore that formed in the RPT sample taken from the melt in Experiment A1, 30 min after the start of the sampling. The concentration of elements at point P1 is determined to be 48.5 wt% O and 51.5 wt% Al.
Fig. 7 Change in total porosity area with time in Experiments A2, A3 and A4.

MANUSCRIP
T
ACCEPTED
ACCEPTED MANUSCRIPT
13
Fig. 8 Variation of total porosity area with time in the first hour in Experiments A3 and A4.
Fig. 9 SEM micrograph obtained from the internal surface of a pore formed in the RPT sample taken from the melt in Experiment A3, 2 h after the start of sampling. The concentration of O on the wrinkled surface and on the raised dendrites is measured to be 10.3 and 0 wt%, respectively.
Fig. 10 Change in the total porosity area with time of the samples obtained from Experiments B1 and B2, and the variation of the concentration of Sr in the melt with time.
MANUSCRIP
T
ACCEPTED
ACCEPTED MANUSCRIPT
14
Fig. 11 SEM micrograph from a pore that formed in the RPT sample taken from the melt in Experiment B2, a few minutes after the pouring of the liquid metal from a height into a second crucible. The EDX spectrum obtained from the points P1 and P2 are shown in Fig. 12(a) and 12(b), respectively.
Fig. 12 (a) EDX spectrum obtained from point P1 given in Fig. 11. The concentration of elements are determined (all in wt%) to be 97.3% Al, 2.7% O. (b) EDX spectrum obtained from point P2 given in Fig. 11. The concentration of elements are determined (all in wt%) to be 83.8% Al, 15.3% O and 0.9% Sr.

MANUSCRIP
T
ACCEPTED
ACCEPTED MANUSCRIPT
15
Fig. 13 SEM micrograph obtained from the internal surface of a pore formed in the RPT sample taken from the melt in Experiment B1, 5 h after the start of sampling. The concentration of elements at point P1 (all in wt%) is determined to be 88.6% Al, 9.4% O, and 2.02% Sr.
Fig. 14 A higher magnification of the SEM micrograph shown in Fig. 13.
Fig. 15 Change in total porosity area with time in Experiments A2, B2, B3 and B4.
MANUSCRIP
T
ACCEPTED
ACCEPTED MANUSCRIPT
16
Fig. 16 SEM micrograph obtained from the internal surface of a pore formed in the RPT sample taken from the melt in Experiment B3, 15 min after the start of the sampling. The EDX spectrum obtained from the area denoted A1 is shown in Fig. 17.
Fig. 17 EDX spectrum obtained from the area denoted A1 in Fig 16. The concentration of elements (all in wt%) are determined to be 92.3% Al, 6.3% O and 1.4% Sr.
Fig. 18 SEM micrograph obtained from the internal surface of a pore formed in the RPT sample taken from the melt in Experiment B3, 2 h after the start of the sampling. The EDX spectrum obtained from the point denoted P1 is shown in Fig. 19.
MANUSCRIP
T
ACCEPTED
ACCEPTED MANUSCRIPT
17
Fig. 19 EDX spectrum obtained from the point denoted P1 in Fig. 18. The concentration of elements (all in wt%) are determined to be 82.1% Al, 15% O, 2.2% Sr, and 0.7% Fe