Embed Size (px)
Citation preview
Role of feedback and dynamics in a gene regulatory network
Thesis by
Ophelia S. Venturelli
In Partial Fulfillment of the Requirements
for the Degree of
Doctor of Philosophy
California Institute of Technology
Pasadena, California
2013
(Defended May 30, 2013)

ii
c© 2013
Ophelia S. Venturelli
All Rights Reserved

iii
Acknowledgements
I am very fortunate to have had the opportunity of attending Caltech for graduate school. I ap-preciate many unique characteristics of Caltech including an intimate community where I can walkaround campus and recognize many familiar faces, a relaxed yet challenging and stimulating intellec-tual environment and the absence of barriers for interdisciplinary research. I also had the privilegeof spending almost two years at UCSF during my graduate studies. UCSF is a cutting-edge andexciting place to work and I have learned a tremendous amount during my tenure at UCSF.
I would like to especially thank my advisor Richard Murray for his guidance, support and forallowing me the freedom to explore interesting scientific questions. Richard has an incredible positiveenergy and enthusiasm that has reinforced my motivation about science over the years. By workingwith Richard, I have learned a quantitative and rigorous reasoning about biological systems. I haveenjoyed interacting with members of the Murray group and appreciate their diverse backgrounds inmath, computer science, engineering and biology.
I am most grateful to Hana El-Samad, who has been a second advisor to me, for the opportunityto pursue exciting research projects in her lab and for supporting my research. Hana is very detail-oriented and meticulous about scientific research and as a consequence I think my approach toscientific problems and writing has significantly improved. Hana also has excellent intuition for howto tie together a set of data to tell a compelling scientific story. Finally, Hana provided me with anenjoyable and intellectually stimulating environment. I have learned many lessons in her lab thatwill be indispensable for my future scientific career.
I would like to credit many colleagues at both Caltech and UCSF for their guidance, supportand scientific feedback. I would like to especially recognize Ignacio Zuleta for our productive col-laboration. I have greatly benefited from countless scientific discussions with Fiona Chandra, ElisaFranco and Marcella Gomez. I am appreciative for Andres Aranda’s help in the lab. My researchhas significantly benefited from my collaboration with Adam Rosenthal. I am thankful to DavidSoloveichik for helping me to think differently about theoretical research problems. Richard’s grouprecently exhibited an period of exponential growth and I would like to thank the new members ofhis lab including Dan Siegal-Gaskins, Anu Thubagere, Jongmin Kim, Nadine Dabby, Emzo de losSantos, Joe Meyerowitz, Enoch Yeung and Vanessa Jonsson. Finally, I would like to extend myappreciation to other members of Hana’s lab including Benjamin Heineike, Raj Bhatnagar, MichaelChevalier, Joanna Lipinski-Kruszka, Susan Chen, Patrick Harrigan and Graham Heimberg.
I am especially grateful to my committee including Michael Elowitz, Rob Phillips and RaymondDeshaies for providing valuable feedback. In particular, I am indebted to Michael Elowitz whoallowed me to participate in his lab’s group meetings and provide excellent scientific guidance.Michael’s approach to biology has been an inspiration for my graduate work. I am thankful to SteveMayo for providing me with lab space at Caltech.
I would like to recognize the Biochemistry and Molecular Biophysics (BMB) graduate programand especially thank Allison Ross and Doug Rees in organizing this program and supporting graduatestudents.
I would not be where I am today without the love and support of my family. My parents, Shaliniand Peter Venturelli have provided me with unconditional support and I would like to thank themfor always believing in me. My brother, Philip Venturelli, instilled in me a deep scientific curiosity.I am obliged to Louis and Shelley Romero for their assistance during my graduate studies. In

iv
particular, my research has benefited significantly from many instructive conversations with LouisRomero about math and dynamical systems. It has been really fun to share my graduate experienceswith my husband, Philip Romero. Philip’s scientific feedback and support has been invaluable.

v
Abstract
Cells exhibit a diverse repertoire of dynamic behaviors. These dynamic functions are implementedby circuits of interacting biomolecules. Although these regulatory networks function determinis-tically by executing specific programs in response to extracellular signals, molecular interactionsare inherently governed by stochastic fluctuations. This molecular noise can manifest as cell-to-cellphenotypic heterogeneity in a well-mixed environment. Single-cell variability may seem like a designflaw but the coexistence of diverse phenotypes in an isogenic population of cells can also serve abiological function by increasing the probability of survival of individual cells upon an abrupt changein environmental conditions. Decades of extensive molecular and biochemical characterization haverevealed the connectivity and mechanisms that constitute regulatory networks. We are now con-fronted with the challenge of integrating this information to link the structure of these circuits tosystems-level properties such as cellular decision making. To investigate cellular decision-making,we used the well studied galactose gene-regulatory network in Saccharomyces cerevisiae. We ana-lyzed the mechanism and dynamics of the coexistence of two stable on and off states for pathwayactivity. We demonstrate that this bimodality in the pathway activity originates from two positivefeedback loops that trigger bistability in the network. By measuring the dynamics of single-cellsin a mixed sugar environment, we observe that the bimodality in gene expression is a transientphenomenon. Our experiments indicate that early pathway activation in a cohort of cells priorto galactose metabolism can accelerate galactose consumption and provide a transient increase ingrowth rate. Together these results provide important insights into strategies implemented by cellsthat may have been evolutionary advantageous in competitive environments.
vi
Contents
Acknowledgements iii
Abstract v
1 Introduction 1
2 Dual feedback loops established by molecular sequestration generates robust bi-
modal response 5
Bibliography 58

1
Chapter 1
Introduction
Introduction
Biological systems exhibit remarkable phenotypic diversity. The myriad of phenotypes are achieved
through networks of interacting biomolecules that produce a rich repertoire of dynamical functions
at the cellular level. For example, these circuits have been shown to produce oscillations, excitability,
adaptive responses and bistability [1, 2, 3, 4]. Due to the discrete nature of molecular interactions, the
dynamic responses are inherently stochastic and display significant fluctuations in the concentrations
of components. Indeed, single microbial and eukaryotic cells can exhibit significant phenotypic
heterogeneity that does not stem from a genetic origin.
Although the inescapable noise in the levels and activities of biomolecules seems undesirable
for cells, previous studies have shown that phenotypic variability can be functionally beneficial in
specific environments. This bet-hedging phenomenon is characterized by more than one coexisting
phenotype in a uniform environment that provides a temporary disadvantage for the population
but can confer a long-term fitness advantage upon an abrupt environmental change [5]. In bacteria
for example, competence, sporulation, and persistence in response to high doses of antibiotics have
been shown to enhance population fitness by increasing the chance of survival upon a shift in the
environmental conditions [6, 7, 8]. In all of these cases, noise in the levels of critical regulatory
molecules influences a binary cellular decisions. Recently, yeast have also been shown to benefit
from bet-hedging strategies by diversifying the range of growth rates or displaying asymmetric

2
growth behaviors in response to specific stress stimuli such as metal deprivation or heat [9, 10].
In several cases, the potential for significant phenotypic variability has been shown to arise
from the feedback structure of the regulatory network [11, 12, 13, 2]. Feedback loops are defined
as molecular interactions that link the output of a system back to the input [14]. These loops
ubiquitous regulatory features of biological networks and can significantly modulate the dynamics
and function of circuits. For example, negative feedback can quantitatively shape cellular responses
by enhancing the system’s response time, reducing phenotypic variability and generating transient
dynamic behaviors [15, 16, 17]. Positive feedback loops can provide signal amplification and induce
bistability if the positive feedback loop is coupled to a sufficiently ultrasensitive mechanism [4, 18, 19].
Natural biological circuits frequently contain many feedback loops and it is a challenging task to
disentangle the roles of individual loops and understand how their activities are coordinated in a
densely connected network [13].
In this work, we have explored the role of feedback loops, dynamics and biological function of
single-cell variability using the galactose gene-regulatory network (GAL) in Saccharomyces cere-
visiae (S. cerevisiae) as a model system. The galactose regulatory network is a very well analyzed
eukaryotic gene circuit that provides cells with the capability to metabolize the galactose as a car-
bon source. Extensive biochemical and molecular characterization has elucidated the key molecular
events that enable cells to turn this metabolic switch on and off in response to changes in environ-
mental signals. Here, we built upon this foundation to understand how these complex molecular
interactions can combine to produce system level properties. This gene regulatory network has two
interesting behaviors: single-cells can exhibit coexisting all-or-none network activity for intermediate
concentrations of galactose or combinations of glucose and galactose [19, 20, 18] and small variations
in concentration of galactose can generate a large fold change in the downstream enzyme levels,
referred to as ultrasensitivity. Our analysis of this system identified the mechanism that generates
the switch-like bistable response and revealed how this bimodal strategy can be advantageous for a
population of cells in a combinatorial environment.
In Chapter 2, we use a combination of experiments and computational modeling to analyze the

3
roles of the feedback loops on the bimodal response of the GAL system. We demonstrate that two
positive feedback loops established by the bifunctional galatokinase and signal transducer Gal1p
and signal transducer Gal3p collaborate to induce bistability in the system. Our computational
analysis identifies molecular sequestration as a critical mechanism for generating the ultrasensitive
stage necessary for robust bistability in the system.
In Chapter 3, we probe how the GAL network integrates two signals of glucose and galactose to
generate a dynamic transcriptional response. By measuring single-cell dynamics over a long time
scale, we observe transient bimodality for conditions of similar concentrations of the two sugars. In
fact, after many cell generations, all cells in the population converge to a single monomodal on-state.
We construct a computational model that captures the structure of the network with two inputs.
Our analysis of the model reveals that the observed transient bimodality originates from bistability
that vanishes when glucose is depleted beyond a threshold. Sugar measurements indicate that the
delayed turn-on of the repressed subpopulation of cells occurs precisely when cells begin to consume
galactose following glucose depletion. The early activation of the GAL genes in a fraction of cells is
shown to reduce the transition time between carbon sources and provides a transient enhancement
of cellular growth rate. Our experiments also reveal a cost to constitutive GAL gene expression that
arises from a reduced glucose consumption rate, thus highlighting the intricate tradeoffs involved in
the timing of GAL gene induction.
In Chapter 4, we investigate the mapping between promoter sequence and expression level us-
ing the bidirectional GAL1-10 promoter. We construct a library of randomly mutated promoter
sequences and model the effects of these mutations with a statistical model to identify the relative
contributions of single nucleotides to the observed expression levels. By measuring the expression
levels of both directions of this bidirectional promoter, our results indicate that individual nucleotides
can differentially tune the promoter activity. Experimental characterization of critical nucleotides
displays a strong correlation with the model’s prediction, highlighting the predictive capabilities of
the model.
In Chapter 5, using a computational model of the GAL network, we analyze the roles of the feed-

4
back loops and sequestration on a set of phenotypes including bistability, ultrasensitivity, switching
threshold, dynamic range, response time and tunability.

5
Chapter 2
Dual feedback loops established bymolecular sequestration generatesrobust bimodal response
A version of this chapter has been published as [19].
Introduction
Cells are continuously faced with the challenge of sensing signals in their environment and eliciting
intracellular programs accordingly. While changes in some environmental cues engender graded and
proportional responses, others induce decisive action whereby a cell exhibits a binary (on or off)
phenotypic change. In the latter case, amplification of phenotypic heterogeneity may arise since
single cells in a population make individual decisions based on their perception of the environmental
stimulus, stochastic fluctuations in their molecular components, and memory of past conditions.
This thresholded cellular response can manifest as a bimodal distribution in network activity across
an isogenic cell population.
Feedback regulation, which links the output of a circuit back to its input, expands the set of
possible biological properties, including robustness to uncertainty [14] and can produce single cell
phenotypic heterogeneity in a uniform environment. Many features of individual positive and neg-
ative feedback loops have been elucidated, including enhancement of response time and reduction
of gene expression noise by negative autoregulation, and signal amplification and bistability using

6
positive autoregulation [15, 16, 21, 13]. However, quantitative characterization of how multiple feed-
back pathways interact to regulate and fine-tune cellular decision-making presents many unresolved
challenges.
The galactose gene-regulatory network S. cerevisiae (GAL) contains numerous feedback path-
ways. Isogenic single cells respond heterogeneously to a range of galactose concentrations, which
manifests as a bimodal distribution of GAL gene expression across the cell population [18]. In con-
trast to a graded response, in which the mean of a unimodal distribution is continuously adjusted
as the input is modulated, variations in the concentration of galactose within a range shifts the
fraction of the cell population distributed between distinct metabolic states. Here, we focused on
how the multiple feedback loops in the system shape this bimodal cellular decision-making strategy
in response to galactose.
The GAL circuit consists of regulatory machinery (Gal2p, Gal3p, Gal80p, Gal4p) that dictates
network activity and a set of enzymes required for metabolizing galactose (Gal1p, Gal7p, Gal10p).
In the absence of galactose, GAL genes are repressed due to the sequestration of the potent tran-
scriptional activator Gal4p by the repressor Gal80p (Fig. 2.1). [22]. In the presence of galactose,
the membrane-bound permease transporter Gal2p significantly increases the rate of galactose up-
take from the extracellular environment [23]. Galactose and ATP-dependent activation of the signal
transducer Gal3p lead to repression of Gal80p by sequestration, thus liberating Gal4p [24]. The
galactokinase Gal1p catalyzes the first step in galactose metabolism by phosphorylating galactose
to form galactose 1-phosphate and has been shown to possess weak co-inducing functionality [25].
Galactose-dependent regulation of Gal2p, Gal3p and Gal80p form feedback loops because these
proteins modulate network activity and are themselves transcriptionally regulated by Gal4p [27].
Gal2p and Gal3p form positive feedback loops since up-regulation of their expression levels leads to
an increase in pathway activity, whereas Gal80p reduces pathway activity and thus forms a negative
feedback loop.
In addition to Gal2p, Gal3p and Gal80p, there is evidence to suggest that Gal1p has a regulatory
role beyond its vital enzymatic function for growth on galactose [28, 25, 29]. Gal1p is a close homolog

7
Gal2p
gal
Gal3p Gal3p*
GAL1PGAL1-10GAL10GAL7
GAL3PGAL3
GAL2PGAL2
Gal4p
Gal1p gal+ galPGal1p* +
Gal10p
glycolysis
Gal80p
GAL80PGAL80Gal7p
Gal1p
Figure 2.1: The galactose gene-regulatory network in S. cerevisiae. The permease Gal2p facilitatesintracellular galactose transport. By binding to galactose, the signal transducer Gal3p becomeshighly activated to sequester the transcriptional repressor Gal80p. In the absence of galactose,Gal3p can also inhibit Gal80p, presumably with lower affinity, leading to GAL gene induction [25].Repression of Gal80p liberates the transcriptional activator Gal4p to up-regulate a set of targetenzymatic and regulatory genes. A series of enzymatic reactions (interactions inside box) transformsgalactose into glucose-6-phosphate for glycolysis through the activities of the galactokinase Gal1p,transferase Gal7p, and epimerase Gal10p. The regulatory proteins Gal2p, Gal3p and Gal80p, formpositive, positive and negative feedback loops, respectively. Gal1p, a paralogue of Gal3p, has beenshown to possess bifunctional activities by sequestering Gal80p in the presence and absence ofgalactose with different affinities, leading to GAL gene activation [25, 26]. GAL1 and GAL10 sharea bidirectional promoter (PGAL10-1).

8
of Gal3p and has been shown to interact with Gal80p with a weaker affinity than Gal3p [30, 31].
Furthermore, a GAL3 deletion strain was shown to induce GAL gene expression at a significantly
slower rate compared to wild-type whereas cells with combined GAL1 and GAL3 deletions fail to
activate their GAL pathway [32]. A recent study demonstrated that cells initially grown in galactose
and then transferred to glucose exhibit a faster induction response to a second galactose exposure
than cells grown only in glucose, and that Gal1p was critical for this decrease in response time [33].
Finally, galactose induction was shown to consist of two stages, the first of which is dominated by
rapid association of Gal3p to Gal80p and a delayed second stage consisting of dominance of the
Gal1p-Gal80p complex [34].
In this paper, we use a combination of experimental measurements and computational modeling
to demonstrate that the observed bimodality in the galactose metabolic pathway arises from an
underlying bistability in the system and that this bimodal response relies on the synergistic interplay
of the GAL1 and GAL3 feedback loops. These central mediators have unique mechanistic roles in
the GAL system since they both regulate circuit activity by competitive molecular sequestration
of Gal80p. While the bimodal response can be transformed into a graded response in the absence
of the individual GAL1 and GAL3 feedback loops, this only occurs in a specific parameter regime
in which the constitutive production rates of Gal1p and Gal3p are greater than a threshold. A
mathematical model recapitulates the experimental results and provides crucial insights about the
roles of the autoregulatory loops on bistability. More broadly, a simple mathematical model is used
to identify generalizable properties of positive feedback loops created by molecular sequestration
that implement robust switch-like responses.

9
Results
History-dependent response indicates that bimodality arises from under-
lying bistability and Gal1p significantly enhances sensitivity to galactose
The presence of bimodality does not necessarily imply bistability since a bimodal distribution can
arise from stochastic effects [35, 36, 37]. Hysteresis is a characteristic feature of bistability, in
which the system jumps from one branch of stable steady-states to a different branch of steady-
states as a parameter is continuously increased, but jumps from the second branch of steady-states
back to the first branch at a different value of the parameter as it is continuously decreased. This
behavior stems from a difference in the local stability of multiple stable equilibria. To determine if
bimodality in the GAL system was linked to bistability, we checked for a history-dependent response,
which is an indicator of local equilibrium point stability. The bistable stochastic counterpart of a
deterministic bistable system may not exhibit hysteresis due to an insufficient time-scale separation
and a deterministic system can be bistable without displaying hysteresis [38, 39]. Here, we tested for
a stochastic system that exhibits hysteresis, which would be consistent with an underlying bistability
in a deterministic model of the system. Distinguishing whether bimodality arises from stochastic
interactions or a deterministic bistability provides critical information about the operation of the
system, including the types of molecular interactions that might be underlying this response and
suggests a mathematical modeling framework for studying this phenotype.
We investigated the GAL system’s history-dependent response by comparing the stability of
its high and low metabolic states as a function of galactose. To measure relative expression state
stability, we used flow cytometry to quantify the fluorescence distributions of a genome integrated
GAL10 promoter fusion to Venus (YFP) in wild-type (WT) single cells as an indicator of network
activity [40] (PGAL10Venus). The cells were grown first in the presence (EH) and absence (EL) of
2% galactose in 2% raffinose media. Cells from the two environments were then shifted to a second
set of environments containing a wide range of galactose concentrations.
A history-dependent response existed if cell populations grown in the two environments (EL

10
Galactose (%)
Frac
tion
of h
igh
cells
10−2 10−10
0.5
1
EL WTEH WT
10−2 10−10
0.5
1
EL GAL1Δ
EH GAL1Δ
Figure 2.2: History response experiment indicates that GAL bimodal response arises from underlyingbistability. (A) Conceptual diagram of the history response experiment in which the depth of thepotential wells (expression level vs. stability) can be controlled by a bifurcation parameter (galactoseconcentration). In this experiment, isogenic cells were grown in two environments until steady-state,EH and EL. In EH (2% galactose and 2% raffinose), the high expression state (H) has a lower potentialenergy and is strongly favored whereas the low expression state (L) is favored in EL (2% raffinose).Cells are then transferred from the two initial environments to a new set of environments (E1, . . . ,En) containing a range of galactose concentrations. A history-dependent response was present ifcells from EH and EL were distributed differently between the high and low states for a range ofgalactose concentrations after 30 hours of induction. (B) History-dependent response experimentindicates that the GAL network is bistable. Experimental data showing history response region forwild-type (WT) cells (top) following the experimental procedure outlined in A. Cells that do notmetabolize galactose (GAL1∆) also displayed a history-dependent response (bottom). Each datapoint is the mean of the fraction of cells in the high expression state and the error bars representone standard deviation (n=3). Lines represent fitted Hill functions.

11
and EH) had a different fraction of cells distributed between the high and low expression states in
a range of galactose concentrations after approximately 10 cell divisions post shift (30 hours). A
30-hour induction period was selected to allow a sufficient number of cell divisions for dilution of
the fluorescent reporter from EH cells (Section S2.1). Within a range of galactose concentrations,
cells from EL and EH were distributed differently between the high and low metabolic states (Fig.
2.2), revealing a history-dependent response and corroborating the existence of bistability.
To exclude the possibility that the difference in the thresholds of the dose responses was due to
variable consumption of galactose, the history-response experiment was performed using a GAL1
deletion strain that is incapable of metabolizing galactose (GAL1∆) [41]. The GAL1∆ strain was
used since cells with gene deletions for the transferase GAL7 and epimerase GAL10 are unable to
grow in the presence of galactose due to the toxic accumulation of phosphorylated galactose [42].
Investigation of history-dependence in the GAL1∆ strain revealed that its dose response threshold
was approximately twofold higher than WT, demonstrating that Gal1p significantly contributes to
galactose sensitivity. The GAL1∆ cells also exhibited a history-dependent difference in the galactose
threshold. However, the area separating the activation response curves for GAL1∆ was smaller than
WT, indicating a diminished history-dependent response. Taken together, these data corroborate
bistability as the source of bimodality in the response of the GAL network to galactose and strongly
suggest that Gal1p plays an important regulatory role in addition to its metabolic function.
Combined deletion of the GAL1 and GAL3 feedback loops produces a
graded response, demonstrating the unique role of Gal1p and Gal3p in
generating bistability
To further explore Gal1p as a regulatory component of the system and evaluate its role relative to
the other autoregulatory loops, we constructed a series of feedback loop deletions involving different
components of the system. To do so, we deleted the coding region of a given gene and integrated a
single copy of this gene regulated by an inducible TET promoter or a constitutive promoter. The
rate of production from the TET promoter could be adjusted by a doxycycline (dox) dependent

12
activation of rtTA, a reverse mutant of the transcription factor, TetR [43]. In this fashion, the
expression of the gene involved in the feedback loop can be decoupled from the activity of the
galactose pathway since the regulation of the constitutive or inducible promoter is external to the
GAL regulatory circuit.
In order to compare the operation of the WT system and the different feedback mutants on
equal footing, we selected the strength of constitutive expression of each gene by mapping it to the
corresponding WT expression levels using quantitative real-time PCR (qPCR) (Table 1 and Sup-
plementary Fig. 2.3). We also explored a range of TET promoter expression levels by scanning
different dox concentrations to investigate the relationship between constitutive expression of each
regulatory component and the steady-state dose response. The fluorescence distributions were clas-
sified as unimodal or bimodal using a Gaussian mixture model threshold (GMM) (see Materials and
methods).
Eliminating the GAL2 or GAL80 feedback loops did not abolish the GAL system’s bimodal
response (Fig. 3B-1 and B-2). Instead, bimodality persisted for a range of expression levels for
Gal2p and Gal80p (Supplementary Fig. 2.5B,C). Compared to WT, cells with a deleted GAL80
feedback loop (GAL80∆ fb) displayed bimodality for a larger number of galactose concentrations.
Contrary to a previous study [20], we observed that the GAL3 feedback loop was not necessary for
bimodality for WT expression levels of Gal3p (Fig. 3A-4 and Supplementary Fig. 2.2). However in
the GAL3∆ fb cells, the bimodal response could be transformed into a graded response by driving
the rate of constitutive Gal3p production beyond a critical threshold (Fig. 5B). We found that the
discrepancy with the previous study [20] can be explained by constitutive Gal3p expression above
this threshold (Section S2.2).
Since the GAL2, GAL3 and GAL80 feedback loops were not individually necessary for bimodal-
ity, we hypothesized that they either play compensatory roles or that bimodality relies on yet another
uncharacterized feedback loop. To address the possibility that the feedback loops had overlapping
or compensatory functions, we constructed combinations of feedback loop deletions of GAL2, GAL3
and GAL80 by constitutively expressing them from the ADH1, TET and STE5 promoters, respec-

13
A
B
log 1
0(PGA
L10Ven
us)
Galactose (%)
log 1
0(PGA
L10V
enus
)
Galactose (%)
Galactose (%) Galactose (%)
log 1
0(PGA
L10Ven
us)
GAL1� fbWTlo
g 10(P
GAL1
0Ven
us)
GAL3� fb
log 1
0(PGA
L10V
enus
)
GAL1� GAL3� fb
Galactose (%)
GAL1�
A-1 A-2 A-3
A-4 A-5
Galactose (%)
log 1
0(PGA
L10V
enus
)
Galactose (%)
log 1
0(PGA
L10V
enus
)
GAL80� fb 15 ng/ml
Galactose (%)
log 1
0(PGA
L10V
enus
)GAL2� fb GAL3� fb
Galactose (%)
log 1
0(PGA
L10V
enus
)
GAL2� fb GAL3� fb GAL80� fb
Galactose (%)
log 1
0(PGA
L10V
enus
)
GAL1� GAL2� fb 100 ng/ml
Galactose (%)
log 1
0(PGA
L10V
enus
)
GAL1� GAL80� fb 15 ng/ml
GAL2� fb 100 ng/ml
B-1 B-2 B-3
B-4 B-5 B-6
Figure 2.3: Double deletion of GAL1 and the GAL3 feedback loop abolishes bimodality. Repre-sentative steady-state flow cytometry data of PGAL10Venus in wild-type (WT) and a set of singleand multiple feedback loop deletions induced with a range of galactose concentrations. Each blackcircle indicates the mean of the distribution determined by a Gaussian mixture model (see Materialsand methods). Small random deviations were added to each galactose concentration to highlightthe spread of the fluorescence distributions. (A) Either the GAL1 or the GAL3 feedback loop isrequired for bimodality. The wild-type (WT), GAL1 deletion (GAL1∆), GAL1 feedback deletion(GAL1∆ fb) and GAL3 feedback deletion (GAL3∆ fb) strains displayed bimodality for at least onegalactose concentration. GAL1∆ fb and GAL3∆ fb were not induced with doxycycline (dox). Elim-inating the GAL3 feedback loop in the absence of GAL1 (GAL1∆ GAL3∆ fb) produced a gradedresponse for the full range of galactose. (B) Bimodality was preserved for a series of feedback loopdisruptions. The single GAL2 (GAL2∆ fb) and GAL80 (GAL80∆ fb) loop deletions were inducedwith 100 and 15 ng/ml dox, respectively. Bimodality persisted for a dual feedback loop disruptionof GAL2 and GAL3 (GAL1∆ fb GAL3∆ fb) and a triple feedback deletion of GAL2, GAL3 andGAL80 (GAL2∆ fb GAL3∆ fb GAL80∆ fb). For these two strains, GAL2, GAL3 and GAL80 wereexpressed from an ADH1, TET and STE5 promoter, respectively in the absence of dox. Deletingthe GAL2 (GAL1∆ GAL2∆ fb) and GAL80 (GAL1∆ GAL80∆ fb) feedback loops individually ina strain lacking GAL1 preserved bimodality. GAL1∆ GAL2∆ fb and GAL1∆ GAL80∆ fb wereinduced with 100 and 15 ng/ml dox, respectively.

14
tively. Remarkably, bimodality was preserved in the absence of both the GAL2 and GAL3 feedback
loops (GAL2∆ fb GAL3∆ fb) and also in a triple feedback loop deletion strain of GAL2, GAL3 and
GAL80 (Fig. 3B-3 and B-4).
Therefore, combinations of GAL2, GAL3 and GAL80 feedback loops did not functionally overlap
to create bimodality. Since Gal1p regulates both sensitivity and memory of the GAL network to
galactose (Fig. 2.2), we explored the possibility that Gal1p could be an important component of the
system’s bimodality.
In contrast to Gal3p and Gal80p transcriptional regulation, Gal1p is tightly repressed in the
absence and strongly induced in the presence of galactose. As a consequence, matching the open
and closed loop production rates using the TET promoter was challenging. Similar to Gal3p,
Gal1p has been shown to activate GAL genes independently of galactose, and a sufficiently strong
constitutive Gal1p production rate could shift the operating point of the network [25]. We first
explored the lowest regime of Gal1p expression using a GAL1 gene deletion (GAL1∆) and bimodality
was detected in this strain for several galactose concentrations (Fig. 2.3A-2). The GAL1 feedback
loop deletion, PTETGAL1 (GAL1∆ fb) was also bimodal in the absence of dox for at least one
galactose concentration (Fig. 2.3A-3) but was graded in the presence of 10, 25, 50 and 100 ng/ml
doxycycline (Supplementary Fig. 2.4).
We examined the combined effect of removing the GAL2, GAL3 or GAL80 in a strain lacking
GAL1. As shown in Fig. 2.3B-5, B-6, the combined deletion of GAL1 and the GAL2 feedback loop
(GAL1∆ GAL2∆ fb) and dual deletion of GAL1 and the GAL80 feedback loop (GAL1∆ GAL80∆
fb) displayed bimodality for at least two galactose concentrations.
By stark contrast, the simultaneous deletion of GAL1 and the GAL3 feedback loop (GAL1∆
GAL3∆ fb) produced a graded response for the entire range of galactose (Fig. 2.3A-5). Remarkably,
this graded response persisted irrespective of the constitutive Gal3p production rate in contrast to
the single GAL3 feedback knockout that displayed bimodality for some range of constitutive Gal3p
levels (Supplementary Fig. 2.5A). These data provide further evidence that GAL1 is an active
regulatory component of the circuit and that the interplay between the GAL1 and GAL3 feedback
15
loops is crucial for bimodality.
In addition to eliminating bimodality, our results revealed that removing GAL1 and the GAL3
feedback loop abolished ultrasensitivity in the dose-response to galactose, indicating a coupling be-
tween the mechanisms for ultrasensitivity and bistability in the GAL network. We found that the
Hill coefficient for PGAL10Venus in WT was approximately 3 whereas this same reporter exhib-
ited a Hill coefficient of approximately 1.3 in the absence of GAL1 and the GAL3 feedback loop
(GAL1∆ GAL3∆ fb) (Supplementary Fig. 2.5D). This link between ultrasensitivity and bimodality
may arise due to the necessity of ultrasensitivity for bistability [44].
Cooperative Gal4p interactions at the promoter level does not generate
bimodal response
Bimodality was not observed using the GAL3 and GAL80 promoters as reporters of GAL network
activity in WT for any concentration of galactose (Supplementary Fig. 2.1C). In contrast to the
GAL10 promoter, these promoters each contain a single GAL4 binding site. Multiple GAL4 binding
sites may augment the dynamic range of the reporter to provide a sufficient separation of the
high and low expression states or cooperativity of Gal4 proteins at the promoter level may be an
important parameter of the bimodal response. To test whether multiple GAL4 binding sites are
necessary for bimodality, a synthetic GAL promoter containing a single Gal4p binding site from
the GAL7 promoter driving the expression of a fluorescent reporter was constructed (see Materials
and methods). This reporter had minimal cooperativity and yet bimodality was detected for two
galactose concentrations at steady-state (Supplementary Fig. 2.6). These data demonstrate that
bimodality is not an exclusive property of promoters with multiple GAL4 binding sites but is instead
a property of the upstream regulatory network.

16
Deterministic model of GAL network recapitulates experimental results
and provides insights into the roles of feedback loops
To further probe the roles of the feedback loops, we constructed an ordinary differential equation
(ODE) model of the system (Section S2.4) which takes into account the concentrations of Gal1p
(G1), Gal3p (G3), Gal4p (G4) and Gal80p (G80). Since Gal1p and Gal3p can function as co-
inducers of GAL gene expression independently of galactose, presumably with lower affinities than
the galactose bound forms, these different forms were not differentiated in the model [25].
Based on these assumptions (see Section S2.4 for a full description), the set of differential equa-
tions for G1, G3, G4 and G80 that model the interactions shown in Fig. 2.1 is given by
d[G1]dt
= αgalε+αG1[G4]3
[G4]3 +K3G1
+ ω[G1][G80]− γG1[G1],
d[G3]dt
= αgal +αG3[G4]2
[G4]2 +K2G3
+ δ[G3][G80]− γG3[G3],
d[G4]dt
= αG4 + β[G80][G4]− γG4[G4],
d[G80]dt
= αoG80 +αG80[G4]2
[G42 +K2G80
+ ω[G1][G80] + δ[G3][G80] + β[G80][G4]− γG80[G80].
Here, αgal represents galactose as a constant input rate. Parameters were approximated from ex-
perimental measurements and values from the literature (Section S2.5). Using these estimates, the
Hill coefficients for the feedback functions involving GAL1, GAL3 and GAL80 were set to 3, 2 and
2, respectively, but our conclusions were not sensitive to variations in these values. Models of the
individual GAL1, GAL3, GAL80 and combined GAL1 and GAL3 feedback knockouts (GAL1∆ fb,
GAL3∆ fb, GAL80∆ fb, GAL1∆ GAL3∆ fb, respectively) were constructed by modifying appro-
priate terms in the WT model (Section S2.6).
Bifurcation analysis of GAL model confirms that only the combined GAL1 and GAL3
feedback deletion eliminates bistability
At equilibrium, the concentration of Gal4p can be written as an eleventh-order polynomial as de-
scribed in Section S2.4. Similarly, the individual feedback deletion models for GAL1, GAL3 and

17
GAL80 and combined GAL1, GAL3 were simplified to an eighth, ninth, ninth and sixth order
polynomials, respectively (Section S2.6). The roots of these polynomials include the equilibrium
concentrations of Gal4p, which represents the activity of the GAL network. All of the models had
the potential for bistability for some region of parameter space since the degrees of the polynomials
were larger than a quadratic. Indeed, models with individual feedback deletions were still capable
of bistability as a function of αgal (Fig. 2.4A-1, A-2, A-3 and A-4). By contrast, removing both the
GAL1 and GAL3 feedback loops abolished bistability for the entire range of αgal, consistent with
experimental data (Fig. 2.4A-5 and A-6).
GAL1 and GAL3 feedback loops combine synergistically to augment bistability
Using the model, we explored the effects of the GAL1 and GAL3 feedback loops on the range of αgal
for which the system exhibits bistability. We defined the hysteresis strength DH as the difference
between the bifurcation points of αgal as shown in Fig. 2.4A-1 (see Materials and methods). DH
represents the range of conditions in which the system exhibits bistability and thus the robustness
of bistability to parameter variations increases with DH . The GAL1 and GAL3 feedback deletion
models had approximately 48% and 31% DH compared to WT (Fig. 2.4B). By contrast, removing
the GAL80 feedback significantly increased DH to 166% compared to its WT value, indicating that
this negative autoregulatory loop undermines bistability.
The generality of these results and the dependence on parameters were explored by comparing the
DH of the WT and feedback deletions using randomly generated parameter sets. 10,000 parameter
sets were obtained by sampling a normal distribution with mean equal to the values of parameter
set I and coefficient of variation equal to 0.1. All parameters were varied except for the constitutive
production rates of Gal1p (αG1s), Gal3p (αG3s) and Gal80p (αG80s). This computation confirmed
that GAL80∆ fb had a larger DH compared to WT and that the WT exhibited a larger DH than
either of the GAL1∆ fb or GAL3∆ fb models for all parameter sets (Fig. 2.4C). These findings are
consistent with the experimental characterization of history-dependent response of the GAL1∆ strain
(Fig. 2.2B) and the data showing that range of galactose concentrations that produced bimodality

18
0 0.5 1 1.5 20
10
20
30
40
50
0 0.5 1 1.5 20
10
20
30
40
50
0 0.5 1 1.5 20
10
20
30
40
50
0 0.5 1 1.5 20
10
20
30
40
50
0 0.5 1 1.5 20
10
20
30
40
50
0 0.5 1 1.5 20
10
20
30
40
50
A
αgal (nM/min)
GAL80� fb GAL1� fb GAL3� fb
WT GAL1� fb GAL3� fb
GAL1� GAL3� fbG4 e
(nM
) A-1 A-2 A-3
A-4 A-5 A-6
0
0.5
1
1.5
2
WT 6GAL1 fb 6GAL3 fb 6GAL80 fb
Nor
mal
ized
DH
Nor
mal
ized
DH
WT GAL1� fb GAL3� fb GAL80� fb
B CCv = 0.1
WT
DH
Single positive feedback loop DH
DH
GAL1� fbGAL3� fb
GAL80� fb
Figure 2.4: Bifurcation analysis of GAL model qualitatively matches experimental results and revealsthat the GAL1 and GAL3 feedback loops combine synergistically to expand the parameter regionfor bistability. The bifurcation parameter αgal represents galactose and the equilibrium value ofGal4p (G4e) represents the activity level of the GAL network. (A) Bifurcation plots of wild-type(WT) and the feedback deletions of GAL1 (GAL1∆ fb), GAL3 (GAL3∆ fb), GAL80 (GAL80∆ fb)and combined GAL1 and GAL3 (GAL1∆ GAL3∆ fb and GAL1∆ fb GAL3∆ fb). Blue and redrepresent stable and unstable equilibrium points, respectively. Reflecting the experimental results inFig. 3, WT, GAL3∆ fb, GAL1∆ fb and GAL80∆ fb exhibits bistability whereas GAL1∆ GAL3∆fb and GAL1∆ fb GAL3∆ fb are monostable for the full range of αgal. A representative distancebetween the bifurcation points, DH, is highlighted by a solid black line. (B) Quantification ofthe range of bistability for the WT and single feedback knockouts shown in A. Normalized DH isequal to the range of αgal that produces bistability relative to WT. (C) Comparison of DH in theWT, GAL1∆ fb (blue), GAL3∆ fb (red) and GAL80∆ fb (magenta) models for 5000 representativerandomly generated parameters sets sampled from a normal distribution with Cv = 0.1. Data pointsabove the x = y line (black) correspond to parameter sets where DH is larger in WT compared tothe single feedback loop knockouts.

19
was expanded in the absence of the GAL80 feedback loop (Fig. 2.3B-2).
In summary, collaboration between the GAL1 and GAL3 autoregulatory loops expands the
region of bistability across a broad region of parameter space, suggesting that this synergy between
dual positive feedback loops may be a consequence of the unique regulatory roles of Gal1p and Gal3p
in the GAL circuit. In addition, we found that GAL1∆ fb GAL3∆fb and GAL1∆ fb GAL3∆fb
were monostable for all 10,000 parameter sets, indicating that one of these autoregulatory loops is
necessary for generating bistability across a broad region of parameter space.
Recently, a two-stage galactose induction model has been proposed whereby the Gal3p-Gal80p
complex (C83) dominates initially and the Gal1p-Gal80 complex (C81) dominates at a later stage
[34]. To check the consequences of including this feature in our model, we scanned over a wide range
of parameters using the Latin hypercube sampling method [45] (Section S2.5) and identified sets of
parameters that qualitatively matched all of our data in addition to the dynamic ordering response
of C83 and C81 (Supplementary Fig. 2.7B,C). This new parameter set exhibited the same roles for
the GAL1 and GAL3 feedback loops in enhancing DH across a broad region of parameter space,
further illustrating the generality of our results (Supplementary Fig. 2.7D).
Constitutive production of Gal1p and Gal3p can abolish bimodality in the absence of
the individual GAL1 and GAL3 feedback loops
We next tested whether the model could predict and explain the disappearance of bimodality due
to high unregulated levels of Gal1p and Gal3p in the absence of their individual feedback loops
(Fig. 2.5, Supplementary Fig. 2.2 and Supplementary Fig. 2.4). The individual GAL1 and GAL3
feedback loop deletion models predicted the loss of bistability as the rates of constitutive production,
αG1s or αG3s, was increased (Fig. 2.5C,D). An increase in αG1s in the GAL1∆ fb model caused the
bistable region to contract and vanish at a critical value (αG1s = 4) (Fig. 2.5C). In the GAL3∆ fb
model, increasing αG3s caused the bistable region to shift to smaller values of αgal (Fig. 2.5D) and
eventually move out the positive orthant to negative values of αgal at a critical αG3s (αG3s = 1),
thus producing monostability for all physically realistic values of αgal.

20
0 0.5 1 1.5 20
10
20
30
40
50
0 0.5 1 1.5 20
10
20
30
40
50
E
αG3s (nM/min)
Diff
eren
ce in
G1 e
(nM
) αG3s critical
B
log 1
0(PG
AL10
Venu
s)
GAL3� fb 10 ng/ml
Galactose (%)
A
αG1s (nM/min)
αG3s (nM/min)
α gal (n
M/m
in)
0
α gal (n
M/m
in)
αgal (nM/min)
αgal (nM/min)
G4 e
(nM
)
GAL3� fb
G4 e
(nM
)
GAL1� fb
αG1s
αG3s
log 1
0(PG
AL10
Venu
s)
GAL1� fb 100 ng/ml
Galactose (%)C
D
0.10.51
0.124
Figure 2.5

21
Figure 2.5: Model predicts that constitutive production of Gal1p or Gal3p above a threshold canabolish bistability in the absence of the individual GAL1 or GAL3 feedback loops (matching exper-imental data in Section S2.2, Supplementary Fig. 2.2 and Supplementary Fig. 2.4). (A) Criticalconstitutive level of Gal1p in the absence of the GAL1 feedback loop produced a graded response.Flow cytometry measurements of PGAL10Venus in a GAL1 feedback deletion strain (GAL1∆ fb).In this strain, GAL1 was expressed from a TET promoter and induced with 100 ng/ml doxycycline(dox), corresponding to approximately 20% of fully induced wild-type (WT) levels (SupplementaryFig. 2.3A-1). (B) Critical level of Gal3p in the absence of the GAL3 feedback loop produced agraded response. Flow cytometry measurements of the GAL3 feedback deletion strain (GAL3∆fb). GAL3 was expressed from a TET promoter and induced with 10 ng/ml dox, corresponding toapproximately 63% of fully induced WT levels (Supplementary Fig. 2.3A-3). (C) In the GAL1∆ fbmodel, increasing the constitutive production rate of Gal1p (αG1s) decreases the region of bistabilityand causes bistability to vanish at a critical value (αG1s = 4 nM/min). Regions of bistability (red)and monostability (blue) for different values of αG1s and αgal in GAL1∆ fb shows that the bistabilityparameter region contracts and eventually vanishes with increasing αG1s. (D) In the GAL3∆ fbmodel, increasing the constitutive production rate of Gal3p (αG3s) eliminates bistability by shiftingthe bistable region to smaller αgal values. A critical threshold of αG3s (αG3s = 1 nM/min) causesthe bistable region to move out of the positive orthant, producing monostability for all physicallyrealistic αgal values. Regions of bistability (red) and monostability (blue) for different values of αG3s
and αgal. (E) The GAL1 feedback nonlinearity disappears with increasing αG3s in the GAL3∆ fbmodel. The maximum difference in Gal1p steady-state concentration (G1e) was computed acrossthe full range of αgal for a series of αG3s values and represents the activity of the GAL1 feedbackloop. Above the critical αG3s threshold (dashed blue line), G1e does not change in response αgal,indicating that the GAL1 autoregulatory loop is not active in this parameter regime.
Since Gal1p and Gal3p played an important role in generating bistability, we suspected that the
disappearance of bistable behavior for αG3s or αG1s exceeding critical values could be the result of
an indirect neutralization of the remaining loop. For example, it could be case that overexpression
of Gal3p in a GAL3 feedback deletion had the effect of neutralizing the GAL1 feedback loop.
The computational model afforded us the possibility of testing this hypothesis. For a given value
of αG3s, we defined the GAL1 feedback activity as the maximum change in steady-state Gal1p
concentration (G1e) across the full range of galactose (αgal = 0 − 2 nM/min). As shown in Fig.
2.5E, the GAL1 feedback was highly active for a range of αG3s values but abruptly approached zero
at a critical threshold of αG3s (dashed blue line). Therefore, increasing the constitutive production
rate of Gal3p was indeed equivalent to removing the GAL1 feedback since a sufficiently large αG3s
mapped the GAL1 feedback nonlinearity to a saturated (inactive) regime.
The insight generated by the model about the link between the constitutive production rates of
Gal1p or Gal3p and the loss of bistability suggested that the graded response observed in GAL3∆
fb (Fig. 2.5B) should be the result of overexpressing the Gal3 protein. To test this possibility, we
22
compared the GAL3 mRNA expressed from the TET promoter to that of WT induced with 0.005%
and 0.05% galactose using qPCR. These data showed that the GAL3 mRNA level in GAL3∆ fb
induced with 10 ng/ml dox was overexpressed by 43% relative to WT induced with 0.05% galactose,
significantly higher than GAL3 mRNA levels for the bimodal range of WT and GAL3∆ fb (Sup-
plementary Fig. 2.3A-3). These results argue that in order to study the functional contribution of
feedback loops to a phenotype, the strength of constitutive expression needs to be carefully tuned
in order to recapitulate the physiological operating point(s) of the wild-type circuit.
Properties of positive feedback loops established by molecular sequestra-
tion
Sequestration binding affinity of an activator and repressor can tune the range of con-
ditions for bistability
To generalize our results further, we explored the principles by which the interactions of the positive
feedback loops mediated by Gal1p and Gal3p generate bistability. Characterizing the set of essential
molecular interactions that combine to generate bistability in the GAL system may be useful for
analyzing other natural switch-like biological networks and for constructing robust and tunable
bistable synthetic circuits. Gal1p and Gal3p competitively sequester a common protein, Gal80p.
Competitive binding interactions and molecular sequestration can produce ultrasensitivity, which
is crucial building block for a bistable system [46, 47, 48, 49]. Therefore, we suspected that the
competitive sequestration of Gal80p by Gal1p and Gal3p may constitute a critical feature of the
system.
To probe the functionalities provided by positive feedback loops linked to molecular sequestra-
tion, we examined a simple model of a single positive feedback loop that is implemented by an
activator x that can form an inactive complex with a transcriptional repressor z. In this circuit, z
transcriptionally represses the production of x and therefore a positive feedback loop is established
by inhibition of the transcriptional repressor using molecular sequestration (Supplementary Fig.
2.8A). We first examined the parameter dependence of this system in the absence of transcriptional

23
cooperativity and found that this circuit could exhibit bistability depending on the value of the
binding affinity of the activator and repressor (Supplementary Fig. 2.8B). Therefore, modifying this
parameter is an alternative mechanism to induce bistability in the circuit without increasing the
cooperativity.
Building on these results, we next investigated the roles of double positive feedback loops con-
nected by molecular sequestration. We considered a three-state ODE model consisting of a tran-
scriptional repressor z that directly regulates two activators, x1 and x2 with Hill coefficients of 3
and 2, respectively. x1 and x2 can form inactive heterodimers with z and hence x1 and x2 compete
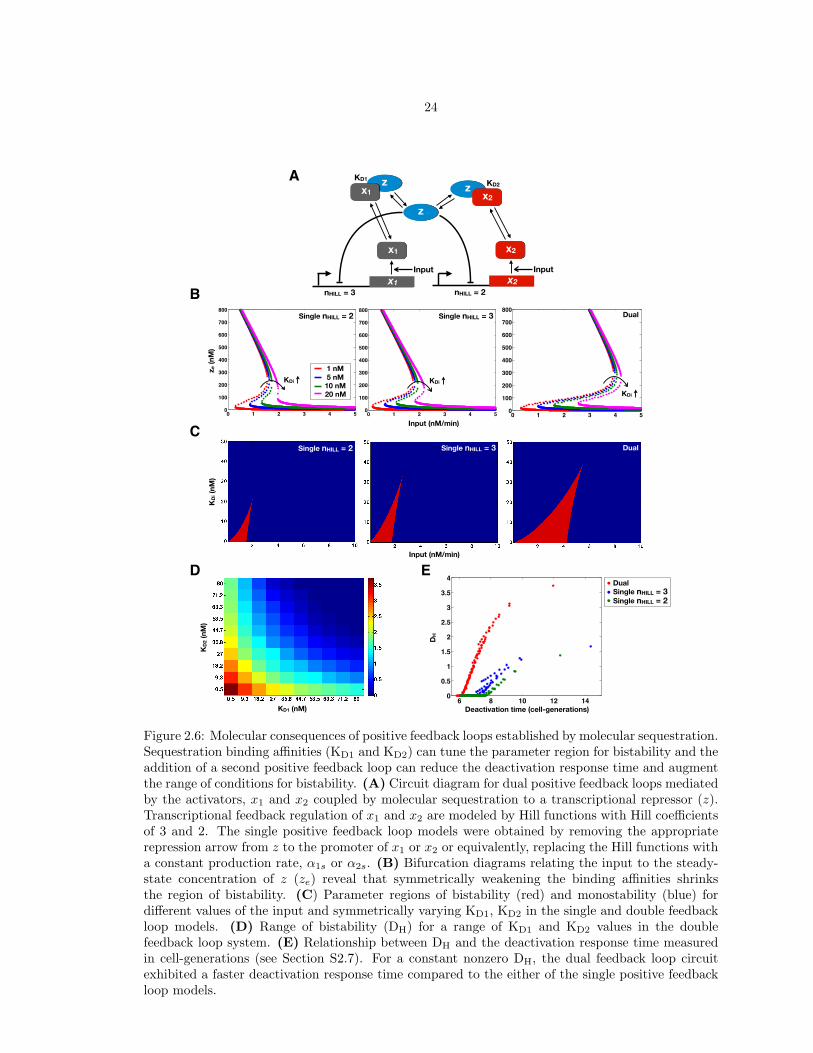
to bind z (Fig. 2.6A). In this model, the mechanisms of sequestration and positive feedback are
triggered by an input (u) that represents a basal production rate of x1 and x2. The system of
equations that model the interactions in Fig. 2.6A (see Section S2.7 for a full description) is
dx1
dt= u+
α1K31
K31 + z3
+ β1x1z − γ1x1,
dx2
dt= u+
α2K22
K22 + z2
+ β2x2z − γ2x2,
dz
dt= αz + β1x1z + β2x2z − γzz.
In the double positive feedback case, bistability could be induced in this system by adjusting the
binding affinities KD1 and KD2 (which modify β1 and β2) as bifurcation parameters without changing
the cooperativity of the transcriptional regulation (Fig. 2.6B,C). Setting KD1 = KD2, we found that
the range of the input that produced bistability was inversely related to the magnitude of the binding
affinities (Fig. 2.6B). In addition, the range of the input that generated bistability was increased in
a system with two positive feedback loops compared to a single positive feedback loop for the set of
symmetrically varying KD1 and KD2 values (Fig. 2.6C).
To explore asymmetry in the binding affinities, DH was computed for a series of linearly spaced
KD1 and KD2 values within the range of 0.5-80 nM (Fig. 2.6D). The largest range of bistability
was obtained for the strongest binding affinities and DH decreased monotonically with increasing
KD1 or KD2. In addition, fixing one KD while varying the other (left column and bottom row)
24
0 1 2 3 4 50
100
200
300
400
500
600
700
800
A
x2
x2
KD2
x1
x1
KD1 zx1 z
x2
z
B
Input (nM/min)
z e (n
M)
KD (n
M)
Input (nM/min)
KD
i (nM
)
KD
i (nM
)
0 1 2 3 4 50
100
200
300
400
500
600
700
800
0 1 2 3 4 50
100
200
300
400
500
600
700
800
nHILL = 2nHILL = 3
C
KDi
Single nHILL = 3 Dual
D
Deactivation time (cell-generations)
DH
1 nM5 nM
10 nM20 nM
KDi
KDi
E
KD
2 (nM
)
KD1 (nM)
Input Inputx1
6 8 10 12 140
0.5
1
1.5
2
2.5
3
3.5
4 Dual
Single nHILL = 2
Single nHILL = 2 Single nHILL = 3 Dual
Single nHILL = 3Single nHILL = 2
Figure 2.6: Molecular consequences of positive feedback loops established by molecular sequestration.Sequestration binding affinities (KD1 and KD2) can tune the parameter region for bistability and theaddition of a second positive feedback loop can reduce the deactivation response time and augmentthe range of conditions for bistability. (A) Circuit diagram for dual positive feedback loops mediatedby the activators, x1 and x2 coupled by molecular sequestration to a transcriptional repressor (z).Transcriptional feedback regulation of x1 and x2 are modeled by Hill functions with Hill coefficientsof 3 and 2. The single positive feedback loop models were obtained by removing the appropriaterepression arrow from z to the promoter of x1 or x2 or equivalently, replacing the Hill functions witha constant production rate, α1s or α2s. (B) Bifurcation diagrams relating the input to the steady-state concentration of z (ze) reveal that symmetrically weakening the binding affinities shrinksthe region of bistability. (C) Parameter regions of bistability (red) and monostability (blue) fordifferent values of the input and symmetrically varying KD1, KD2 in the single and double feedbackloop models. (D) Range of bistability (DH) for a range of KD1 and KD2 values in the doublefeedback loop system. (E) Relationship between DH and the deactivation response time measuredin cell-generations (see Section S2.7). For a constant nonzero DH, the dual feedback loop circuitexhibited a faster deactivation response time compared to the either of the single positive feedbackloop models.
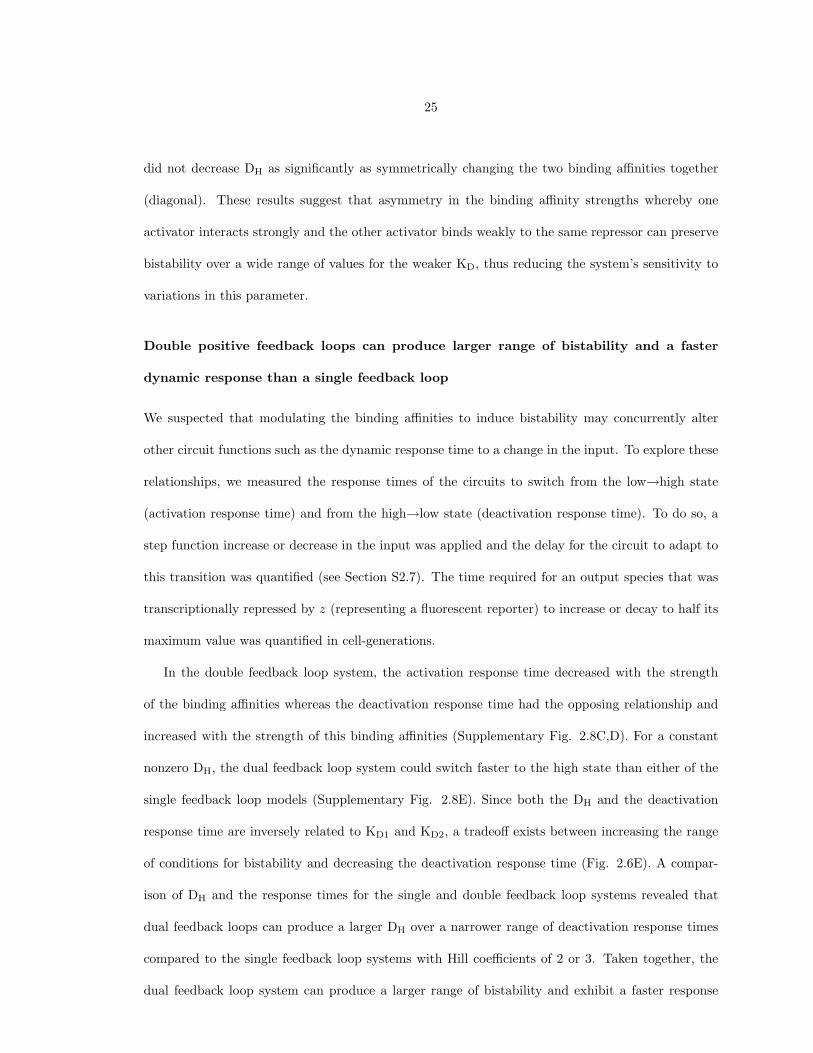
25
did not decrease DH as significantly as symmetrically changing the two binding affinities together
(diagonal). These results suggest that asymmetry in the binding affinity strengths whereby one
activator interacts strongly and the other activator binds weakly to the same repressor can preserve
bistability over a wide range of values for the weaker KD, thus reducing the system’s sensitivity to
variations in this parameter.
Double positive feedback loops can produce larger range of bistability and a faster
dynamic response than a single feedback loop
We suspected that modulating the binding affinities to induce bistability may concurrently alter
other circuit functions such as the dynamic response time to a change in the input. To explore these
relationships, we measured the response times of the circuits to switch from the low→high state
(activation response time) and from the high→low state (deactivation response time). To do so, a
step function increase or decrease in the input was applied and the delay for the circuit to adapt to
this transition was quantified (see Section S2.7). The time required for an output species that was
transcriptionally repressed by z (representing a fluorescent reporter) to increase or decay to half its
maximum value was quantified in cell-generations.
In the double feedback loop system, the activation response time decreased with the strength
of the binding affinities whereas the deactivation response time had the opposing relationship and
increased with the strength of this binding affinities (Supplementary Fig. 2.8C,D). For a constant
nonzero DH, the dual feedback loop system could switch faster to the high state than either of the
single feedback loop models (Supplementary Fig. 2.8E). Since both the DH and the deactivation
response time are inversely related to KD1 and KD2, a tradeoff exists between increasing the range
of conditions for bistability and decreasing the deactivation response time (Fig. 2.6E). A compar-
ison of DH and the response times for the single and double feedback loop systems revealed that
dual feedback loops can produce a larger DH over a narrower range of deactivation response times
compared to the single feedback loop systems with Hill coefficients of 2 or 3. Taken together, the
dual feedback loop system can produce a larger range of bistability and exhibit a faster response

26
time to abrupt changes in the environment compared to a single feedback loop system.
Discussion
A bimodal distribution of gene expression across a population of isogenic cells, which generates two
distinct cellular states, can produce significant cell-to-cell heterogeneity. This bimodality can also
lead to a switch-like response that filters out noise below a threshold and produces a large fold-
change in the system’s output if the input crosses this threshold [50]. In this work, we used the
GAL gene-regulatory circuit as a model system to dissect and analyze the origins of bimodality in a
natural biological network. We demonstrated that bistability underlies this bimodality and used a
combination of experiments and computational modeling to identify two key features that produce
bistability: (1) a threshold established by two positive feedback loops mediated by Gal1p and Gal3p
and (2) an ultrasensitive stage produced by competitive molecular sequestration of Gal80p by Gal1p
and Gal3p.
To unravel the molecular interactions critical for bistability in the GAL system, we performed
a comprehensive exploration of multiple feedback loops. Our investigations revealed that the GAL
bimodal response is remarkably robust to feedback loop perturbations. Indeed, individual elimina-
tion of the GAL1, GAL2, GAL3, and GAL80 feedback loops was insufficient to abolish bimodality.
Furthermore, bimodality persisted for multiple deletions of these loops and, surprisingly, only dis-
appeared in a double deletion of GAL1 and the GAL3 feedback loop. We therefore identified Gal1p
and Gal3p as central mediators of two synergistic positive feedback loops that generate bistability
in the GAL gene-regulatory network. Multiple positive feedback loops can facilitate the bistable be-
havior of a circuit by expanding the range of conditions for bistability, which improves the robustness
of bistability to parameter variations [50].
A previous study attributed bimodality in the GAL pathway to the activity of the GAL3 feedback
loop [20]. Here we demonstrate that cells with a deleted GAL3 feedback loop are still capable of
bimodality in their response to galactose for low levels of constitutive Gal3p expression. However,
we found experimentally that bimodality vanishes when Gal3p is expressed at high and unregulated
27
levels. Our computational model explains this behavior by the loss of remaining GAL1 feedback
due to constitutive expression of Gal3p beyond a threshold. Interestingly, in this regime, the genetic
wiring of the GAL1 feedback loop is present, but the feedback loop was rendered inactive indirectly
by constitutive Gal3p expression above a threshold.
These results underscore the challenges inherent in the interpretation of feedback deletion ex-
periments in which the specific range of constitutive expression of the deleted link might become
an important determinant of the system’s properties and can mask the true functional roles of the
feedback pathway. These findings also argue that the complete interpretation of feedback knockouts
requires thorough investigation of active mechanisms and nonlinearities that are operational in a
given circuit, beyond static snapshots of the circuit’s topology as determined by genetics [51].
Stoichiometric binding interactions, for example, molecular sequestration of a repressor by an
activator or inhibition of an enzyme by a small molecule, can produce ultrasensitivity in biological
circuits [46, 47, 48, 49, 52]. Our computational model indicates that competitive molecular seques-
tration of Gal80p by Gal1p and Gal3p produces an ultrasensitive change in the concentration of
free Gal4p in response to a small variations in extracellular galactose and this ultrasensitivity does
not rely on cooperative binding of Gal4p to GAL promoters and/or oligomerization. These results
suggest that the stoichiometric inhibition of Gal80p by Gal1p and Gal3p is a crucial source of ultra-
sensitivity in the GAL network that sets the stage for a robust bistable response to galactose since
ultrasensitivity is required for bistability [53, 49].
Beyond the GAL system, we believe these results to be applicable to many bistable systems. We
used a simple computational model to explore the general mechanisms by which positive feedback
loops linked to competitive sequestration can produce ultrasensitivity and bistability. Using this
model, we found that the positive feedback and sequestration topology can be used to build a bistable
system in the absence of transcriptional cooperativity by adjusting the binding affinity parameter
between the activator and inhibitor. If bistability confers an fitness advantage, this parameter could
be adjusted through mutation of the protein-protein binding interface and may be more evolvable
than modifying the cooperativity of transcriptional regulation through oligomerization or multiple

28
transcription factor binding sites. In addition, we identified a tradeoff between the range of bistability
and the deactivation response time of this circuit. In response to an abrupt change in the stimulus,
we found that a system with double positive feedback loops can switch faster to the low state
compared to the single feedback loop system for a fixed range of bistability, highlighting a novel
advantage of multiple positive feedback loops.
Positive feedback loops established by molecular sequestration may represent a general class of
systems for implementing robust switch-like cellular responses. For example, the conserved regula-
tory network that controls cell-differentiation in Drosophila consists of similar molecular mechanisms
to the GAL circuit including molecular sequestration and multiple feedback loops that implement
a switch-like developmental program [54, 55]. Activation of this cell-differentiation circuit relies on
molecular titration of a repressor, Extramacrochaetae (Emc) by the activators Daughterless (Da)
and the Achaete-Scute Complex (As-c). Da and As-c transcriptionally autoregulate and thus form
two positive feedback loops [56].
S. cerevisiae cells growing on galactose could benefit from bistability on a single-cell and popu-
lation level. A bistable circuit can produce a decisive response to a slow variation in the stimulus
[52]. This decoupling ensures that the abrupt change in the system’s output is not dependent on the
rate of change of the stimulus and is instead an intrinsic property of the circuit’s dynamical system.
In addition, bimodality due to an underlying bistability can produce stable lineages of cells with a
memory of previous environmental conditions. As a consequence of hysteresis, cells with a history
of the stimulus will respond differently to a second exposure due to a shift in the threshold of de-
activation. This epigenetic memory of previous environments can fine-tune the switching threshold
and provide an additional source of cell-to-cell heterogeneity in the perception of the stimulus.
There are also several potential advantages of bimodality at a population level. For example, sig-
nificant single-cell phenotypic variation, generated by bimodality, can serve as a bet-hedging strategy
for microbial populations in uncertain environments [7, 57]. Since S. cerervisiae grows poorly even
in the presence of high concentrations of galactose and risks accumulation of the toxic intermediate
galactose-1-phosphate, the bimodal response may serve as a population strategy to weigh the ener-

29
getic costs and benefits of activating the GAL regulon [42]. Another intriguing possibility is whether
bimodality establishes a division-of-labor in which the high population metabolizes galactose and
produces a byproduct that is used by the low population [58].
Feedback loops are ubiquitous in biological systems, and dissecting their precise quantitative
roles is a crucial step for unraveling the organizational principles of cellular decision-making. While
a single transcriptional positive feedback loop can generate bistability with cooperativity and pre-
cise parameter tuning, this study suggests that a single noncooperative positive feedback loop with
sequestration can generate bistability and this bistability parameter region can be significantly aug-
mented by the addition of a second positive feedback loop. These insights will be essential for
pinpointing the operational principles of switch-like cellular responses, in addition to suggesting
rules for designing robust synthetic circuits.
Materials and Methods
Strains
All plasmids used in this study were derived from a set of yeast single integration vectors constructed
in the lab of Wendell Lim (UCSF). These vectors contain markers and targeting sequences for the
LEU2, HIS3, TRP1 and URA3 loci. These vectors were linearized for transformation by digesting
with PmeI and transformed using standard techniques. Promoters were cloned between the PspOMI
and XhoI restriction sites and coding sequences were inserted between the XhoI and BamHI sites.
These plasmids contained an ADH1 terminator downstream of BamHI site. All strains were haploid
with the exception of MA0182 and wild-type diploid [20]. In the haploid backgrounds, rtTA-M2 was
expressed from a medium strength variant of the TEF promoter, TEFm4 [43, 59]. Gene deletions
were verified using polymerase chain reaction. A functional test for constitutive PGAL10Venus ex-
pression in the absence of galactose was also used to verify successful deletion of GAL80. Strains
are listed in Table SII. The sequences for the GAL3, GAL10 and GAL80 promoters were 1017,
646 and 283 base pairs upstream of the start codons, respectively. The TET promoter consisted

30
of a region of the CYC1 promoter and two TetR operator binding sites [60]. The synthetic single
GAL4 binding site promoter, PCYC1-G4BS, consisted of a binding site from the GAL7 promoter
(CGGACAACTGTTGACCG) upstream of the CYC1 core promoter.
Growth conditions and flow cytometry
Cells were grown in appropriate dropout media supplemented with 2% filter-sterilized raffinose at
30◦C. In 2% raffinose media supplemented with zero or small amounts of galactose, cell divisions
occurred approximately every three hours during exponential growth phase. Steady-state measure-
ments were performed after a 20 hour induction period. Cells were induced for 30 hours for hysteresis
experiments as explained in Section S2.1. OD600 (cell density) was maintained below 0.1 to prevent
significant changes in the galactose concentration for the duration of the experiment. Flow cytome-
try measurements were made using a MACSQuant VYB (Miltenyi Biotec) or LSRII analyzer (BD
Biosciences). For both instruments, a blue (488 nm) laser was used to excite YFP. Emission was
detected on the MACSQuant or LSRII using a 525/50 nm and 530/30 nm filter, respectively. At
least 10,000 cells were collected for each measurement.
Analysis of flow cytometry distributions
Bimodality classification
Flow cytometry distributions were analyzed using a Gaussian mixture model algorithm (GMM,
MATLAB) [61]. The GMM assumes that the data is a mixture distribution where the probability
density function is a linear combination with coefficients that sum to one (ξ1 + ξ2 = 1).
f(x) = ξ1N1 (µ1, σ1) + ξ2N2 (µ2, σ2) .
31
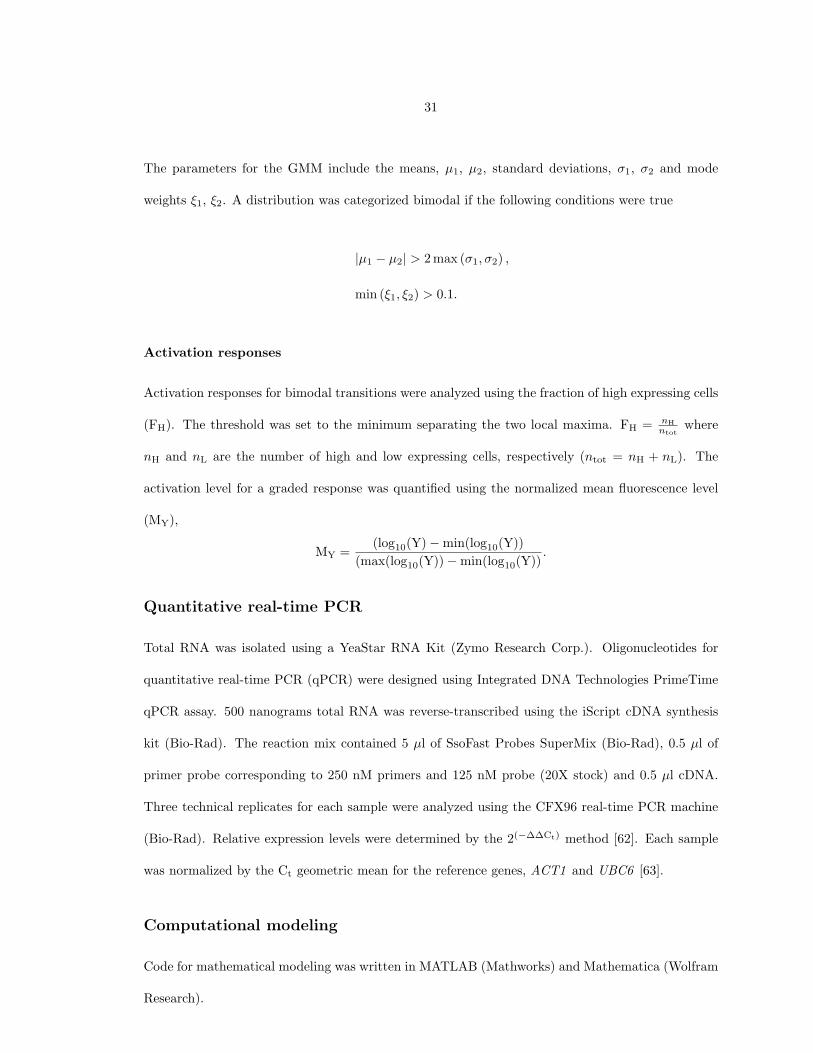
The parameters for the GMM include the means, µ1, µ2, standard deviations, σ1, σ2 and mode
weights ξ1, ξ2. A distribution was categorized bimodal if the following conditions were true
|µ1 − µ2| > 2 max (σ1, σ2) ,
min (ξ1, ξ2) > 0.1.
Activation responses
Activation responses for bimodal transitions were analyzed using the fraction of high expressing cells
(FH). The threshold was set to the minimum separating the two local maxima. FH = nHntot
where
nH and nL are the number of high and low expressing cells, respectively (ntot = nH + nL). The
activation level for a graded response was quantified using the normalized mean fluorescence level
(MY),
MY =(log10(Y)−min(log10(Y))
(max(log10(Y))−min(log10(Y)).
Quantitative real-time PCR
Total RNA was isolated using a YeaStar RNA Kit (Zymo Research Corp.). Oligonucleotides for
quantitative real-time PCR (qPCR) were designed using Integrated DNA Technologies PrimeTime
qPCR assay. 500 nanograms total RNA was reverse-transcribed using the iScript cDNA synthesis
kit (Bio-Rad). The reaction mix contained 5 µl of SsoFast Probes SuperMix (Bio-Rad), 0.5 µl of
primer probe corresponding to 250 nM primers and 125 nM probe (20X stock) and 0.5 µl cDNA.
Three technical replicates for each sample were analyzed using the CFX96 real-time PCR machine
(Bio-Rad). Relative expression levels were determined by the 2(−∆∆Ct) method [62]. Each sample
was normalized by the Ct geometric mean for the reference genes, ACT1 and UBC6 [63].
Computational modeling
Code for mathematical modeling was written in MATLAB (Mathworks) and Mathematica (Wolfram
Research).

32
Bifurcation points
We identified turning, fold and saddle-node bifurcation points that can create bistability by comput-
ing the values of αgal that caused a real eigenvalue of the Jacobian matrix to change from negative
to positive, producing a singular Jacobian matrix at the point where the real part of the eigenvalue
equaled zero. The bifurcation parameter (λ = αgal) appeared linearly in the polynomial equations
for the equilibrium concentrations of Gal4p. To satisfy the conditions of a singular Jacobian matrix
and equilibrium, there were two equations in two unknowns using the Gal4p polynomial (x = Gal4p)
f (x) + λg (x) = 0,
f ′ (x) + λg′ (x) = 0.
We solved the system of equations using the Sylvester resultant [64]. This resultant provides condi-
tions for the coefficients of two polynomials of a single variable to have a root in common. Sylvester
matrices A and B contained the coefficients of f , f ′ and g, g′, respectively. The dimensions of A
and B were (d1 + d2) x (d1 + d2) where d1, d2 are the degrees of highest polynomial of either f or
g and correspondingly f ′ or g′, respectively. The bifurcation points were computed by solving the
generalized eigenvalue problem (A+ λB)φ = 0.
Acknowledgments
The authors would like to thank Michael Elowitz, Marcella Gomez and Fiona Chandra for helpful
discussions, Louis Romero for mathematical modeling insights, and Rochelle Diamond and Josh
Verceles for assistance with flow cytometry. We are grateful to the laboratory of Christina Smolke
and to Murat Acar for providing yeast strains used in this study. This research project was sup-
ported by the Institute for Collaborative Biotechnologies through grant W911NF-09-0001 from the
U.S. Army Research Office.
Author contributions

33
OSV, RMM and HES conceived the research and OSV did the experiments, analyzed the data, con-
structed the model, did the analysis and wrote the manuscript with substantial input from RMM
and HES.

34
Supplementary Information
1. Distinguishing dilution memory from a history-dependent response
2. Characterization of the GAL3 feedback loop on the bimodal response
3. Comparison of open and closed loop transcriptional circuits
4. GAL model description and steady-state solution
5. Estimation of GAL model parameters
6. GAL feedback loop deletion models
7. General model for positive feedback loops established by molecular sequestration

35
S2.1 Distinguishing dilution memory from a history-dependent response
YFP is highly stable and predominantly decreases through cell dilution [65]. As a consequence,
activation of PGAL10YFP is faster than deactivation, and distributions of cells from EH and EL will
inevitably differ until cells equilibrate to a new steady-state in the second set of environments (E1,
. . . , En). We estimated the amount of time and hence the number of cell divisions necessary to
distinguish dilution memory from a history-dependent response (Fig. 2.2).
In the presence of 2% galactose, the steady-state YFP fluorescence expressed from the GAL10
promoter was approximately 78% of YFP fluorescence expressed from the TDH3 promoter after aut-
ofluorescent background subtraction (Supplementary Fig. 2.1A). There are approximately 169,000
Tdh3 proteins present in glucose conditions in a haploid S. cerevisiae background [66], corresponding
to 131,820 Gal10 proteins (assuming promoter strength is proportional to the number of molecules).
Therefore, the concentration of Gal10p is 7.5 µM at full galactose induction [67]. As a lower bound,
we assumed that 150 molecules of YFP (8.6 nM) was indistinguishable from the autofluorescence
background using flow cytometry [68]. Therefore, the number of cell divisions required to dilute
YFP from full induction to background is log2(7.5)− log2(0.0086) = 9.8. In minimal dropout media
supplemented with 2% raffinose, cells doubled approximately every three hours during exponen-
tial phase, which corresponds to 30 hours to distinguish dilution memory from a history-dependent
response.
S2.2 Characterization of the GAL3 feedback loop on the bimodal re-
sponse
We found that bimodality persisted in the absence of the GAL3 feedback loop for a range of wild-
type (WT) GAL3 levels as shown in Fig. 2.3A-4. These results are different from a previous
study that attributed the observed bimodality of the GAL network to the activity of the GAL3
feedback loop [20]. This study used a diploid GAL3 feedback loop deletion strain where Gal3p was
constitutively expressed with a TET inducible promoter. Using fluorescent Gal3 fusion proteins,
the authors identified 50 ng/ml dox as equivalent to 80% of the WT GAL3 levels induced with 0.5%
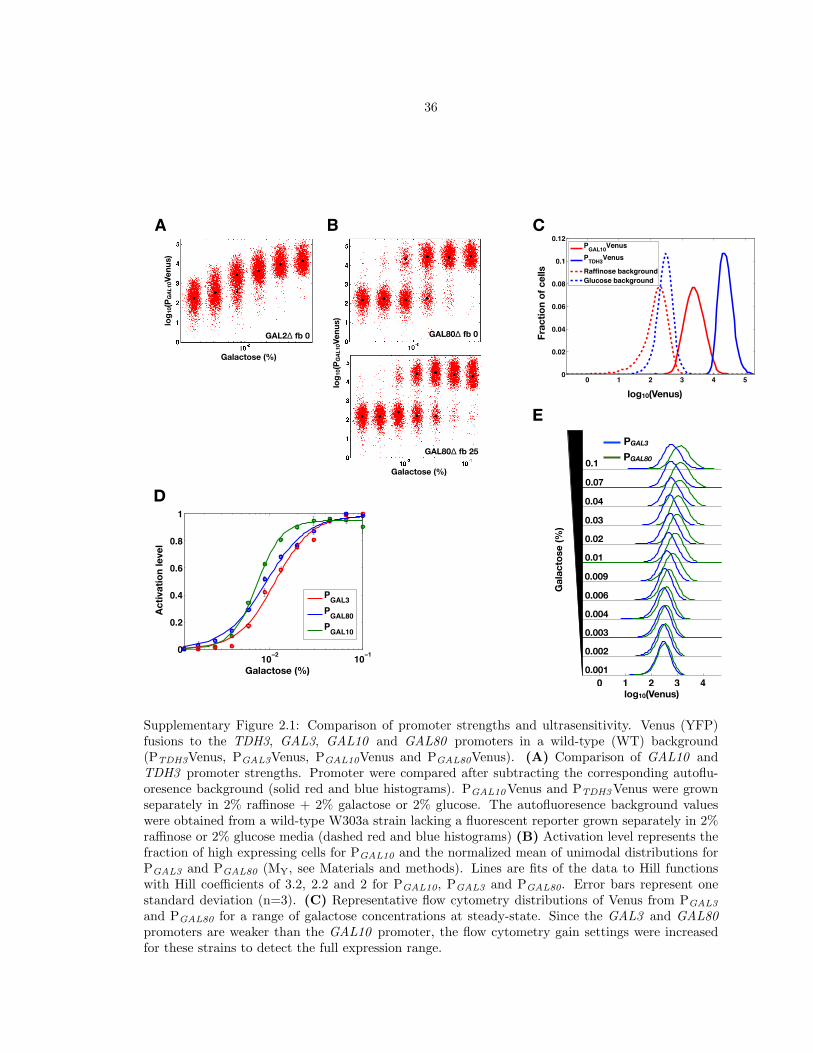
36
D
10−2 10−10
0.2
0.4
0.6
0.8
1
Percent galactose
Act
ivat
ion
leve
l
PGAL3PGAL80PGAL10
Galactose (%)
Activ
atio
n le
vel
C
log10(Venus)
Frac
tion
of c
ells
0 1 2 3 4 50
0.02
0.04
0.06
0.08
0.1
0.12
PGAL10VenusPTDH3Venus
Raffinose backgroundGlucose background
E
0 1 2 3 4log(PGALx−Venus)
PGAL3
PGAL800.1
0.07
0.04
0.03
0.02
0.01
0.009
0.006
0.004
0.003
0.002
0.001
Gal
acto
se (%
)
log10(Venus)
GAL2Δ fb 0
A
log 1
0(PGAL
10Ve
nus)
Galactose (%)
B
Galactose (%)
log 1
0(PGAL
10Ve
nus)
GAL80Δ fb 0
GAL80Δ fb 25
Supplementary Figure 2.1: Comparison of promoter strengths and ultrasensitivity. Venus (YFP)fusions to the TDH3, GAL3, GAL10 and GAL80 promoters in a wild-type (WT) background(PTDH3Venus, PGAL3Venus, PGAL10Venus and PGAL80Venus). (A) Comparison of GAL10 andTDH3 promoter strengths. Promoter were compared after subtracting the corresponding autoflu-oresence background (solid red and blue histograms). PGAL10Venus and PTDH3Venus were grownseparately in 2% raffinose + 2% galactose or 2% glucose. The autofluoresence background valueswere obtained from a wild-type W303a strain lacking a fluorescent reporter grown separately in 2%raffinose or 2% glucose media (dashed red and blue histograms) (B) Activation level represents thefraction of high expressing cells for PGAL10 and the normalized mean of unimodal distributions forPGAL3 and PGAL80 (MY, see Materials and methods). Lines are fits of the data to Hill functionswith Hill coefficients of 3.2, 2.2 and 2 for PGAL10, PGAL3 and PGAL80. Error bars represent onestandard deviation (n=3). (C) Representative flow cytometry distributions of Venus from PGAL3
and PGAL80 for a range of galactose concentrations at steady-state. Since the GAL3 and GAL80promoters are weaker than the GAL10 promoter, the flow cytometry gain settings were increasedfor these strains to detect the full expression range.

37
galactose.
To further explore the roles of the GAL3 feedback loop on the bimodal response, we repeated
the experiments from Acar et al. using the MA0182 strain. Following the authors’ protocol, we
observed bimodality in PGAL1YFP expression after an induction of 27 hours for 0.004% galactose in
the absence of doxycycline (dox) (Supplementary Fig. 2.2A). A Gaussian mixture model (GMM) was
used to classify bimodality (see Materials and Methods). Using this criteria, these data showed the
GAL3 feedback loop was not necessary for bimodality for some range of GAL3 levels (Supplementary
Fig. 2.2B).
The galactose dose response was next measured for different GAL3 levels by inducing MA0182
with a range of galactose and dox concentrations (Supplementary Fig. 2.2A). These data showed
that MA0182 was bimodal for at least one galactose concentration between 0-25 ng/ml dox (Sup-
plementary Fig. 2.2B). However, bimodality was not detected for 50 ng/ml dox.
We compared GAL3 mRNA levels to WT GAL3 expression using quantitative real-time PCR
(qPCR). According to these results, 50 ng/ml dox corresponded to approximately 150% GAL3 levels
relative to WT induced with 0.5% galactose (Supplementary Fig. 2.2C). These results indicated
that WT GAL3 expression in MA0182 was between 0 ng/ml (36%) and approximately 35 ng/ml
dox (100%). Acar et al. stated that MA0182 displayed a graded response for 5-300% of GAL3 levels
with respect to WT. In our experiments, the lower bound for GAL3 levels in MA0182 was 36% of
maximal WT levels due to leakiness of the TET inducible promoter system.
In summary, MA0182 exhibited a bimodal response for a range of WT GAL3 expression levels
and was graded when Gal3p was overexpressed. This transformation of the GAL dose response from
bimodal to graded by tuning the concentration of Gal3p corroborates the importance of comparing
feedback loop knockouts at similar operating point(s) to fully understand the contribution of these
regulatory connections to a phenotype (Section S2.3) [69].
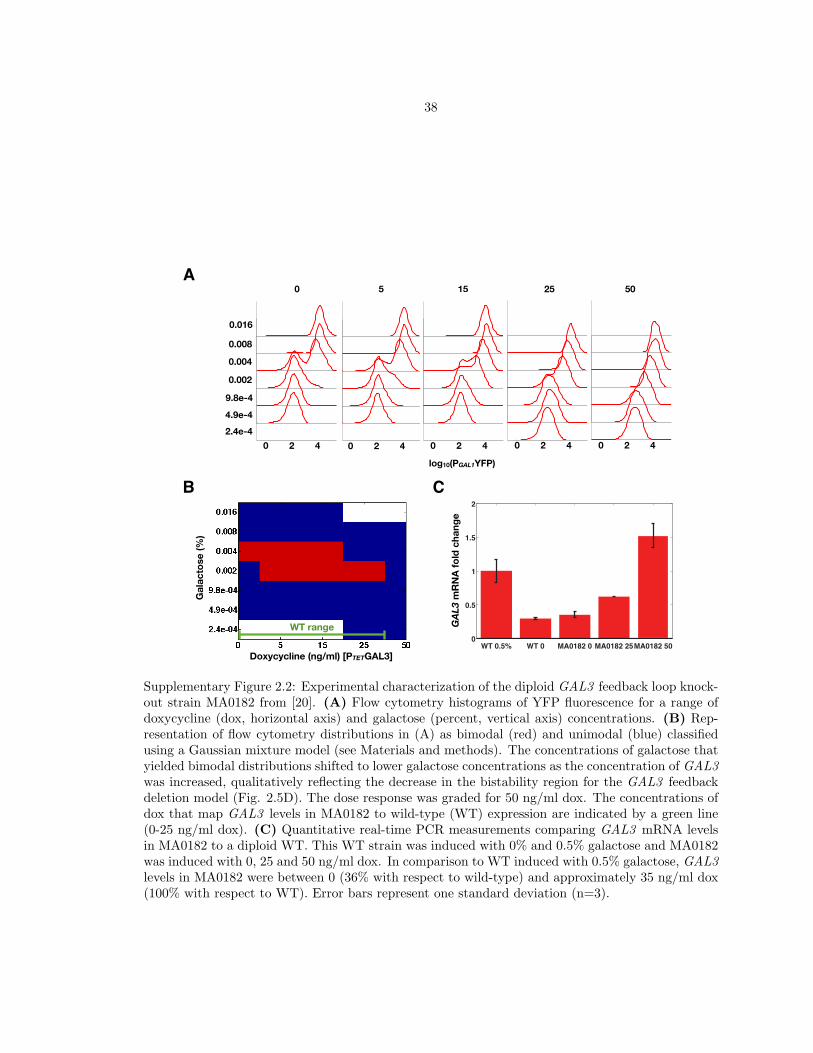
38
A
B C
0.016
0.008
0.004
0.002
9.8e-4
4.9e-4
2.4e-4
0 5 15 25
0 2 4log(PGAL1−YFP)
0 2 4log(PGAL1−YFP)
0 2 4log(PGAL1−YFP)
0 2 4log(PGAL1−YFP)
0 2 4log(PGAL1−YFP)
50
Gal
acto
se (%
)
Doxycycline (ng/ml) [PTETGAL3]
WT range0
0.5
1
1.5
2
WT 0.5% WT 0 MA0182 0 MA0182 25MA0182 50
GAL3
mR
NA
fold
cha
nge
log10(PGAL1YFP)
0 2 4 0 2 4 0 2 4 0 2 4 0 2 4
Supplementary Figure 2.2: Experimental characterization of the diploid GAL3 feedback loop knock-out strain MA0182 from [20]. (A) Flow cytometry histograms of YFP fluorescence for a range ofdoxycycline (dox, horizontal axis) and galactose (percent, vertical axis) concentrations. (B) Rep-resentation of flow cytometry distributions in (A) as bimodal (red) and unimodal (blue) classifiedusing a Gaussian mixture model (see Materials and methods). The concentrations of galactose thatyielded bimodal distributions shifted to lower galactose concentrations as the concentration of GAL3was increased, qualitatively reflecting the decrease in the bistability region for the GAL3 feedbackdeletion model (Fig. 2.5D). The dose response was graded for 50 ng/ml dox. The concentrations ofdox that map GAL3 levels in MA0182 to wild-type (WT) expression are indicated by a green line(0-25 ng/ml dox). (C) Quantitative real-time PCR measurements comparing GAL3 mRNA levelsin MA0182 to a diploid WT. This WT strain was induced with 0% and 0.5% galactose and MA0182was induced with 0, 25 and 50 ng/ml dox. In comparison to WT induced with 0.5% galactose, GAL3levels in MA0182 were between 0 (36% with respect to wild-type) and approximately 35 ng/ml dox(100% with respect to WT). Error bars represent one standard deviation (n=3).

39
S2.3 Comparison of open and closed loop transcriptional circuits
In engineering, closed and open loop systems are frequently compared to determine the advantages
of feedback control on performance [14]. Similarly, in biology, a controlled comparison for open and
closed loop systems may provide insight about the role of a feedback loop [69]. One approach to
creating the open loop system is to delete the gene involved in the loop. However, deleting a gene
is an aggressive approach that may significantly shift the operating point of the circuit, making it
difficult to attribute the changes in phenotype to the function of the feedback loop. Deleting the
coding region of the gene involved in the loop and expressing this gene from a constitutive promoter
is a superior approach for evaluating the function of a feedback loop. The constitutive promoter
strength is an important parameter to adjust since a comparison of the open and closed loop systems
should be made in the neighborhood of the wild-type equilibrium point(s).
Consider a bistable transcriptional circuit modeled by an ordinary differential equation (ODE)
that has two stable steady-states for a specific range of an input parameter, u, dxdt = u+H(x, θ)−γx.
We are interested in the role of a positive feedback loop of protein, x. In the closed loop system
(wild-type), H(x, θ) represents transcriptional feedback regulation where
H(x, θ) =αxn
xn +Kn.
For u = u1, dxdt = 0 ⇒ x = xei where i corresponds to the particular equilibrium point (i = 1, 2
within the bistable parameter regime). Given u = u1 in the bistable region, the open loop system
should be evaluated at αOL1 = H(xe1, θ)∣∣u=u1
and αOL2 = H(xe2, θ)∣∣u=u1
,
where αOL1 and αOL2 represents the constitutive (open-loop) production rates. Experimentally
mapping the open and closed loop production rates for a range of inputs, u = u1, . . . , un, may
be challenging due to a limited number of well-characterized constitutive promoters and restricted
dynamic ranges of inducible promoter systems. To circumvent this, an intermediate α′OL can be
chosen within the WT expression range
40
α′OL ∈ [H(min(xei), θ), H(max(xei), θ)] for u1, . . . , un.
The caveat for this approximation is that α′OL produces a higher and/or lower open loop expression
level compared to WT for each value of u. Using this approach, it is therefore important to check
that the role of the feedback does not depend on the specific value α′OL by scanning several values
within WT range (Supplementary Fig. 2.2 and Supplementary Fig. 2.3).
S2.4 Model description and steady-state solution
An ODE model of the GAL gene-regulatory circuit was constructed based on the interactions shown
in Fig. 2.1. This model was able to provide explanations for experimental data and insights about
the interplay of feedback loops. We assumed the following:
• Intracellular galactose concentration is constant.
• Since the GAL2 feedback is not necessary for bimodality, Gal2p was not modeled for simplicity
(Fig. 2.3B-1).
• No distinction was made between Gal1p, Gal1p bound to galactose (Gal1p*) and Gal3p, Gal3
bound to galactose (Gal3p*) since both the galactose bound and unbound forms can function
as co-inducers of GAL gene expression, presumably with different affinities [25].
• We did not differentiate between nuclear and cytoplasmic partitioning of the GAL proteins
because this is a subject of debate [70, 71, 72].
• Dimerization of Gal4p and Gal80p was not modeled for simplicity [73, 74].
For constant galactose concentrations, conversion of Gal1p, Gal3p into Gal1p*, Gal3p* is a first order
reaction. This first order reaction was approximated as a zeroth order reaction using a constant input
rate (αgal). The protein concentrations of Gal1p (G1), Gal3p (G3), Gal4p (G4) and Gal80p (G80)
were modeled. The Hill coefficients for G1 (n1), G3 (n3) and G80 (n80) were estimated as 3, 2 and
2 based on experimental measurements (Supplementary Fig. 2.1B).
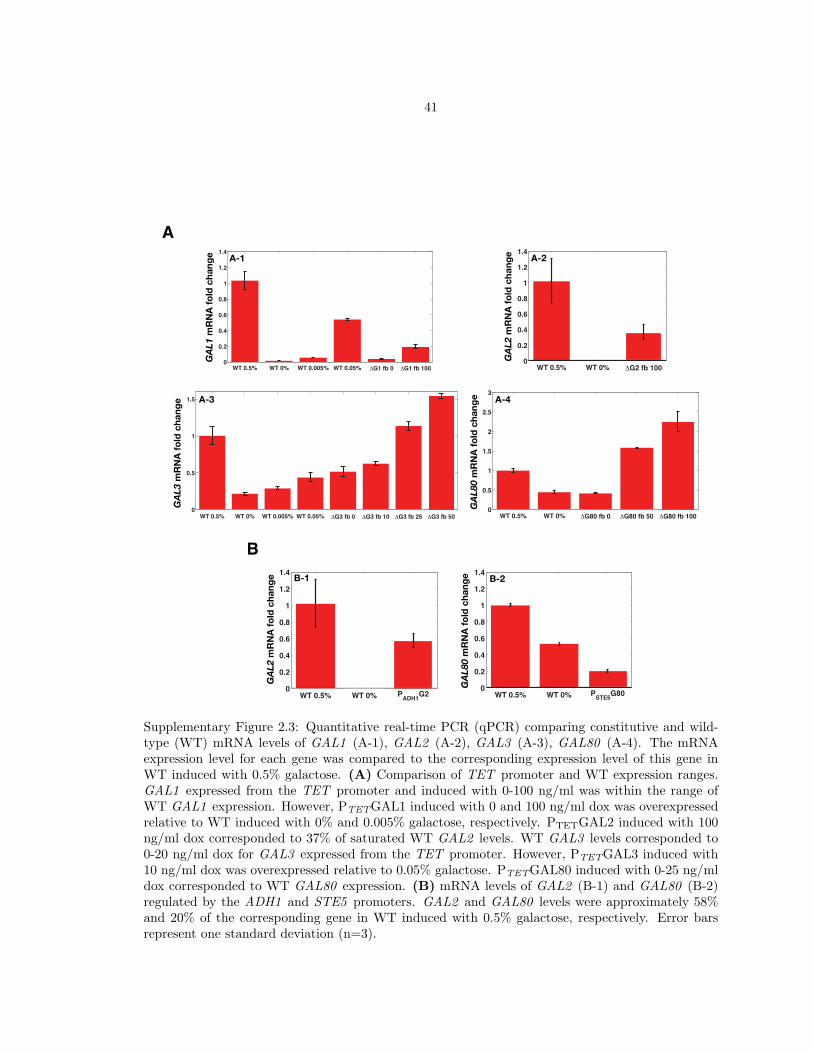
41
A
GAL3
mR
NA
fold
cha
nge
GAL8
0 m
RN
A fo
ld c
hang
e
GAL1
mR
NA
fold
cha
nge
0
0.5
1
1.5
WT 0.5% WT 0% WT 0.005% WT 0.05% ΔG3 fb 0 ΔG3 fb 10 ΔG3 fb 25 ΔG3 fb 50
GAL3
fold
chan
ge (2
−(ΔΔ
Ct) )
0
0.2
0.4
0.6
0.8
1
1.2
1.4
WT 0.5% WT 0% WT 0.005% WT 0.05% ΔG1 fb 0 ΔG1 fb 100
0
0.2
0.4
0.6
0.8
1
1.2
1.4
WT 0.5% WT 0% ΔG2 fb 100
0
0.5
1
1.5
2
2.5
3
WT 0.5% WT 0% ΔG80 fb 0 ΔG80 fb 50 ΔG80 fb 100
B
GAL2
mR
NA
fold
cha
nge
GAL8
0 m
RN
A fo
ld c
hang
e
0
0.2
0.4
0.6
0.8
1
1.2
1.4
WT 0.5% WT 0% PADH1G2 0
0.2
0.4
0.6
0.8
1
1.2
1.4
WT 0.5% WT 0% PSTE5G80
GAL2
mR
NA
fold
cha
ngeA-1 A-2
A-3 A-4
B-1 B-2
Supplementary Figure 2.3: Quantitative real-time PCR (qPCR) comparing constitutive and wild-type (WT) mRNA levels of GAL1 (A-1), GAL2 (A-2), GAL3 (A-3), GAL80 (A-4). The mRNAexpression level for each gene was compared to the corresponding expression level of this gene inWT induced with 0.5% galactose. (A) Comparison of TET promoter and WT expression ranges.GAL1 expressed from the TET promoter and induced with 0-100 ng/ml was within the range ofWT GAL1 expression. However, PTETGAL1 induced with 0 and 100 ng/ml dox was overexpressedrelative to WT induced with 0% and 0.005% galactose, respectively. PTETGAL2 induced with 100ng/ml dox corresponded to 37% of saturated WT GAL2 levels. WT GAL3 levels corresponded to0-20 ng/ml dox for GAL3 expressed from the TET promoter. However, PTETGAL3 induced with10 ng/ml dox was overexpressed relative to 0.05% galactose. PTETGAL80 induced with 0-25 ng/mldox corresponded to WT GAL80 expression. (B) mRNA levels of GAL2 (B-1) and GAL80 (B-2)regulated by the ADH1 and STE5 promoters. GAL2 and GAL80 levels were approximately 58%and 20% of the corresponding gene in WT induced with 0.5% galactose, respectively. Error barsrepresent one standard deviation (n=3).

42
Based on these assumptions, the model that captures the set of critical molecular interactions for
bistability in the wild-type (WT) GAL network is
d[G1]dt
= εαgal + αG1
([G4]n1
Kn1G1 + [G4]n1
)− kf81[G1][G80] + kr81[C81]− γG1[G1],
d[G3]dt
= αgal + αG3
([G4]n3
Kn3G3 + [G4]n3
)− kf83[G3][G80] + kr83[C83]− γG3[G3],
d[G4]dt
= αG4 − kf84[G4][G80] + kr84[C84]− γG4[G4],
d[G80]dt
= αoG80 + αG80
([G4]n80
Kn80G80 + [G4]n80
)− kf81[G1][G80] + kr81[C81]
− kf83[G3][G80] + kr83[C83]− kf84[G4][G80] + kr84[C84]− γG80[G80],
d[C81]dt
= kf81[G1][G80]− kr81[C81]− γC81[C81],
d[C83]dt
= kf83[G3][G80]− kr83[C83]− γC83[C83],
d[C84]dt
= kf84[G4][G80]− kr84[C84]− γC84[C84].
Using the quasi-steady-state assumption, the concentrations of the complexes, Gal1p-Gal80p (C81),
Gal3p-Gal80p (C83) and Gal4p-Gal80p (C84) reached their respective equilibria significantly faster
the dynamics of G1, G3, G4 and G80 (d[C81]dt = d[C83]
dt = d[C84]dt = 0), yielding
[C81] =kf81[G1][G80]kr81 + γC81
, [C83] =kf83[G3][G80]kr83 + γC83
, [C84] =kf84[G4][G80]kr84 + γC84
.
This assumption was used to simplify the system of equations to the following four ODEs
d[G1]dt
= αgalε+ αG1
([G4]n1
Kn1G1[G4]n1
)+ ω[G1][G80]− γG1[G1],
d[G3]dt
= αgal + αG3
([G4]n3
Kn3G3 + [G4]n3
)+ δ[G3][G80]− γG3[G3],
d[G4]dt
= αG4 + β[G80][G4]− γG4[G4],
d[G80]dt
= αoG80 + αG80
([G4]n80
Kn80G80 + [G4]n80
)+ ω[G1][G80] + δ[G3][G80] + β[G80][G4]− γG80[G80],

43
where
ω =kr81kf81
kr81 + γC81− kf81, δ =
kr83kf83
kr83 + γC83− kf83, β =
kr84kf84
kr84 + γC84− kf84.
At steady-state, d[G1]dt = d[G3]
dt = d[G4]dt = d[G80]
dt = 0 and the equilibrium concentrations are
G1e =−εαgal −HG1(G4e, θG1)
ωG80e − γG1,
G3e =−αgal −HG3(G4e, θG3)
δG80e − γG1,
G80e =−αG4 + γG4G4e
βG4e,
where G1e,G3e,G4e and G80e are the equilibrium values of G1, G3, G80 and G4. G4e was deter-
mined by computing the roots of a eleventh order polynomial
a0 + a1G4e + · · ·+ a11G411e = 0,
where the coefficients, ai, are functions of the model parameters. The GAL1, GAL3 and GAL80
feedback deletion models listed in Section S2.6 were solved by applying the same procedure. The
stability of the equilibrium points was determined by computing the eigenvalues of the Jacobian
matrix of the system of equations [14].
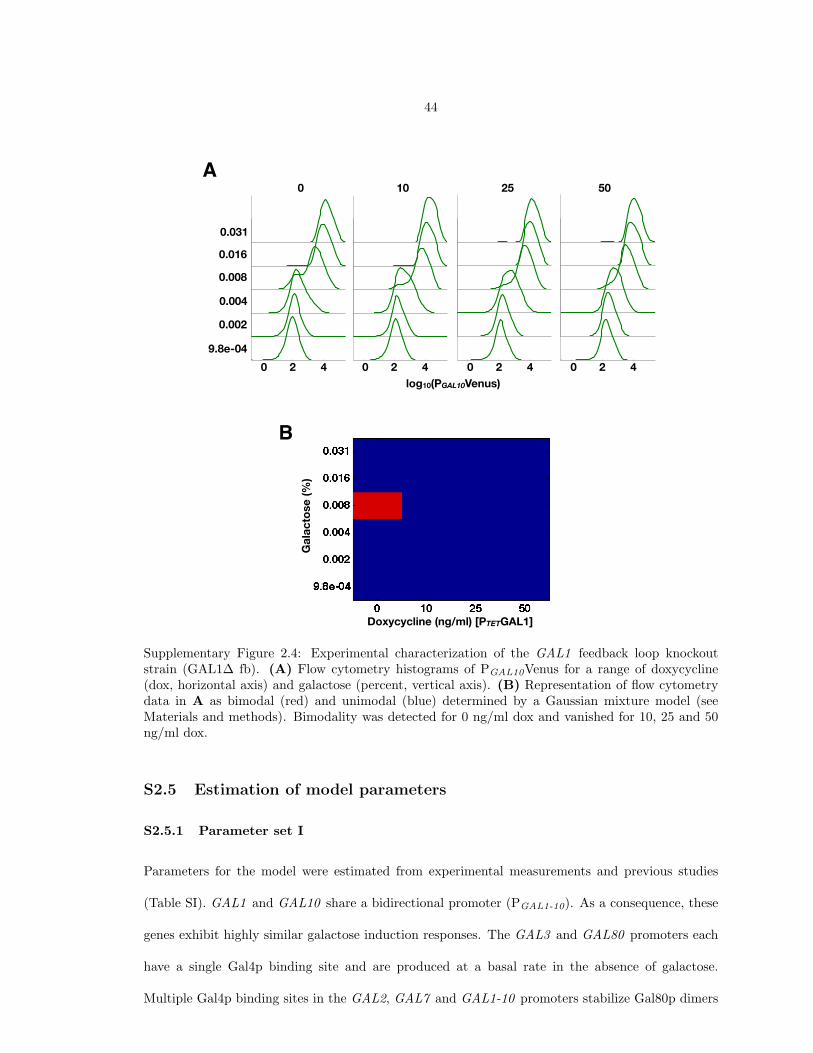
44
0 2 4log(PGAL10−Venus)
0 2 4log(PGAL10−Venus)
0 2 4log(PGAL10−Venus)
0 2 4log(PGAL10−Venus)
0.031
0.016
0.008
0.004
0.002
9.8e-04
A0 10 25 50
B
Doxycycline (ng/ml) [PTETGAL1]
Gal
acto
se (%
)
0 2 4 0 2 4 0 2 4 0 2 4log10(PGAL10Venus)
Supplementary Figure 2.4: Experimental characterization of the GAL1 feedback loop knockoutstrain (GAL1∆ fb). (A) Flow cytometry histograms of PGAL10Venus for a range of doxycycline(dox, horizontal axis) and galactose (percent, vertical axis). (B) Representation of flow cytometrydata in A as bimodal (red) and unimodal (blue) determined by a Gaussian mixture model (seeMaterials and methods). Bimodality was detected for 0 ng/ml dox and vanished for 10, 25 and 50ng/ml dox.
S2.5 Estimation of model parameters
S2.5.1 Parameter set I
Parameters for the model were estimated from experimental measurements and previous studies
(Table SI). GAL1 and GAL10 share a bidirectional promoter (PGAL1-10). As a consequence, these
genes exhibit highly similar galactose induction responses. The GAL3 and GAL80 promoters each
have a single Gal4p binding site and are produced at a basal rate in the absence of galactose.
Multiple Gal4p binding sites in the GAL2, GAL7 and GAL1-10 promoters stabilize Gal80p dimers

45
A
Galactose (%)
log 1
0(PGA
L10V
enus
)
5 ng/ml 10 ng/ml
15 ng/ml 20 ng/ml
B
10−5 10−4 10−3 10−2 10−10
0.2
0.4
0.6
0.8
1
GAL16 GAL36 fbWT
Galactose (%)
Activ
atio
n le
vel (
P GAL
10Ve
nus)
Supplementary Figure 2.5: Deletion of GAL1 and the GAL3 feedback loop (GAL1∆ GAL3∆ fb)produced a graded response irrespective of the concentration of GAL3. Bimodality persists inthe absence of the individual GAL2 and GAL80 feedback loops for a wide range of constitu-tive GAL2 and GAL80 levels. (A) Steady-state flow cytometry measurements of PGAL10Venusin GAL1∆ GAL3∆ fb cells where GAL3 was expressed from a TET promoter induced with 5,10, 15 and 20 ng/ml doxycycline (dox). These concentrations of dox correspond to wild-typeGAL3 levels (Supplementary Fig. 2.3A-3). These measurements were taken on an LSRII ana-lyzer. (B) GAL2 feedback deletion (GAL2∆ fb) displayed bimodality in the absence of doxycycline(dox). (C) GAL80 feedback deletion (GAL80∆ fb) exhibited bimodal distributions for 0 and 25ng/ml dox. These concentrations of dox correspond to 40% and 100% of fully induced WT GAL80mRNA levels, respectively. (D) Steady-state activation responses of PGAL10Venus in the WT andGAL1∆ GAL3∆ fb. The Hill coefficient for the WT was approximately 3 whereas the Hill coefficientfor GAL1∆ GAL3∆ fb was approximately 1.3. Each data point for GAL1∆ GAL3∆ fb representsthe normalized mean of fluorescence (MY, see Materials and methods) and the error bars representone standard deviation (n=3). Each data point for the WT represents mean of the fraction cells inthe high expression state and the error bars represent one standard deviation (n=3).

46
Galactose (%)
log 1
0(PCY
C1-G
4BSV
enus
)
Supplementary Figure 2.6: GAL bimodal response does not require multiple GAL4 binding sites. Asynthetic GAL regulated promoter fusion to Venus with a single GAL4 binding site was bimodal fortwo galactose concentrations at steady-state. Bimodality was determined using a Gaussian mixturemodel (GMM, see Materials and methods). Black circles represent the means of the fluorescencedistributions.
A B
0 200 400 600 800 10000
50
100
150
200
250
300
350
400
Time (min)
Con
cent
ratio
n (n
M)
C81C83
0 200 400 600 800 10000
20
40
60
80
100
120
Time (min)
Con
cent
ratio
n (n
M)
C81C83
C
0 2 4 6 8 100
50
100
150
200
250
300
0 2 4 6 8 100
50
100
150
200
250
3000 2 4 6 8 100
50
100
150
200
250
300
0 2 4 6 8 100
50
100
150
200
250
300
0 2 4 6 8 100
50
100
150
200
250
300
WT ΔGAL1 fb ΔGAL3 fb
ΔGAL80 fb ΔGAL1 fb ΔGAL3 fb G4 e
(nM
)
αgal (nM/min)
Single feedback loop DH
WT
DH
GAL1Δ fbGAL3Δ fb
DTime (min)
Con
cent
ratio
n (n
M)
Time (min)
Con
cent
ratio
n (n
M)
0 2 4 6 8 100
50
100
150
200
250
300ΔGAL1 ΔGAL3 fb
Supplementary Figure 2.7: Parameter set II captures dynamic interplay of Gal1p and Gal3p complexwith Gal80p (C81 and C83) and feedback loop knockout experimental results. (A) Parameter set Iindicates that the complex of Gal3p with Gal80p (C83) dominates transiently and at steady-statecompared to C81 (complex of Gal1p with Gal80p). (B) Random parameter sampling (see Materialsand Methods) was used to identify a new parameter set that exhibits transient dominance of theC83 complex and steady-state dominance of the C81 complex. (C) Parameter set II qualitativelymatches the feedback loop knockout experimental data showing bistability in all feedback loopdeletions except the double deletion of GAL1 and the GAL3 feedback loop. (D) WT model exhibitsa larger range of bistability (DH) compared to the single positive feedback loop systems (GAL1 andGAL3 ) across a broad region of parameter space (Cv = 0.1). Parameter sets I and II are listed inTable SI.

47
on DNA, augmenting the strength of repression and the maximum production rate [75]. As a result,
promoters with multiple Gal4p binding sites have a significantly larger dynamic range of expression.
Flow cytometry measurements of GAL3, GAL10 and GAL80 promoter fusions to Venus in
response to galactose were used to compare relative promoter strengths and cooperativity. The
GAL3 (PGAL3) and GAL80 (PGAL80) promoter fusions exhibited a graded response whereas the
GAL10 promoter fusion had a bimodal response as shown in Fig. 2.3A-1. The Hill coefficients for
the Gal4p dependent feedback terms were approximated by fitting the means of the graded response
distributions (MY as described in the Materials and methods) and the fraction of high expressing
cells for the bimodal response (PGAL10) to Hill functions.
A Hill function fit to the means of the distributions for PGAL3Venus and PGAL80Venus in response
to galactose generated Hill coefficients of 2.2 and 2. Gal4p binds to DNA as a dimer and has been
shown to interact cooperatively [73, 76]. Based on these results, we assumed that the Hill coefficients
for the GAL3 and GAL80 transcriptional feedback terms were two [73, 76].
Fitting the fraction of high expression cells for PGAL10 produced a Hill coefficient of approxi-
mately 3.2. The GAL1-10 promoter has four Gal4p binding sites which have been shown to increase
cooperativity. Therefore, we set the Hill coefficient of the GAL1 feedback to three [76]. We note
that the main conclusions about the roles of the GAL1, GAL3 and GAL80 feedback loops do not
change if the Hill coefficients of the feedback terms for Gal1p, Gal3p and Gal80p and are set to 4,
1, 1 or 3, 1, 1.
The constitutive and feedback production rates were approximated using the number of proteins
per cell [66]. Gal4p is weakly expressed and its constitutive production rate (αG4) was selected to
reflect this observation [77]. The mean expression levels for PGAL3Venus and PGAL80Venus were
similar in response to galactose as shown in Supplementary Fig. 2.1C. At saturation (0.1% galactose),
PGAL80Venus was approximately 15% higher than PGAL3Venus. The production rates, αG3, αG80,
αoG80, were chosen to have similar ratios to mirror the experimental measurements. Since Gal1p
has been shown to bind to Gal80p with lower affinity than Gal3p, a scaling factor of ε was used to
modify αgal [26, 32].

48
Par
amet
erD
escr
ipti
onU
nit
sP
aram
eter
Set
I∗P
aram
eter
set
II†
kf
81
forw
ard
bind
ing
rate
ofG
al1p
toG
al80
p(n
Mm
in)−
110
010
0kr81
unbi
ndin
gra
teof
Gal
1pfr
omG
al80
pm
in−
115
0025
00kf
83
forw
ard
bind
ing
rate
ofG
al3p
toG
al80
p(n
Mm
in)−
110
010
0kr83
unbi
ndin
gra
teof
Gal
3pfr
omG
al80
pm
in−
11
462
kf
84
forw
ard
bind
ing
rate
ofG
al4p
toG
al80
p(n
Mm
in)−
110
010
0kr84
unbi
ndin
gra
teof
Gal
4pfr
omG
al80
pm
in−
125
1300
αG
1G
al1p
prod
ucti
onra
tenM
min−
115
35αG
3G
al3p
prod
ucti
onra
tenM
min−
10.
98
αG
4G
al4p
prod
ucti
onra
tenM
min−
10.
23.
6αoG
80
Bas
alG
al80
ppr
oduc
tion
rate
nMm
in−
10.
65.
9αG
80
Gal
80p
prod
ucti
onra
tenM
min−
10.
99
KG
1G
AL1
tran
scri
ptio
nal
feed
back
thre
shol
dnM
886
.7KG
3G
AL3
tran
scri
ptio
nal
feed
back
thre
shol
dnM
864
.9KG
80
GA
L80
tran
scri
ptio
nal
feed
back
thre
shol
dnM
21.
5n
1G
AL1
Hill
coeffi
cien
tdi
men
sion
less
33
n3
GA
L3
Hill
coeffi
cien
tdi
men
sion
less
22
n80
GA
L80
Hill
coeffi
cien
tdi
men
sion
less
22
γG
1G
al1p
degr
adat
ion
rate
min−
10.
004
0.02
63γG
3G
al3p
degr
adat
ion
rate
min−
10.
004
0.00
4γG
4G
al4p
degr
adat
ion
rate
min−
10.
004
0.01
19γG
80
Gal
80p
degr
adat
ion
rate
min−
10.
004
0.00
73γC
81
Gal
1p-G
al80
p(C
81)
degr
adat
ion
rate
min−
10.
004
0.00
84γC
83
Gal
3p-G
al80
p(C
83)
degr
adat
ion
rate
min−
10.
004
0.05
27γC
84
Gal
4p-G
al80
p(C
84)
degr
adat
ion
rate
min−
10.
004
0.01
77ε
scal
ing
fact
ordi
men
sion
less
0.1
1.02
αG
1s
cons
tant
Gal
1ppr
oduc
tion
rate
nMm
in−
10.
10.
1αG
3s
cons
tant
Gal
3ppr
oduc
tion
rate
nMm
in−
10.
16
αG
80s
cons
tant
Gal
80p
prod
ucti
onra
tenM
min−
11.
513
.5
Supp
lem
enta
ryT
able
I:D
escr
ipti
onof
mod
elpa
ram
eter
sus
edin
this
stud
y.∗ O
rigi
nalp
aram
eter
set
esti
mat
edas
desc
ribe
din
Sect
ion
S2.5
(Fig
.2.
4an
dF
ig.
2.5)
.† N
ewpa
ram
eter
set
obta
ined
byra
ndom
para
met
ersa
mpl
ing
(Lat
inhy
perc
ube
met
hod)
that
capt
ures
the
dyna
mic
inte
rpla
yof
Gal
1pan
dG
al3p
[34]
.

49
Forward binding rates (kf83, kf81 and kf84) were estimated using the limits of diffusion. The
dissociation rates (kr83, kr81, kr84) were free parameters with the requirement that kr81 � kr83
[26, 32]. The protein concentrations of Gal1, Gal3, Gal4, Gal4 and the complexes C81, C83 and C84
were assumed to degrade linearly at approximately the rate of cell division.
S2.5.2 Parameter set II
To identify parameter sets that qualitatively matched the previously reported dynamic switch re-
sponse of Gal1p and Gal3p [34], 10,000 parameter sets were sampled uniformly in linear scale in the
22-dimensional parameter space, using the Latin hypercube sampling method [45]. The following
parameter ranges were used: 10-160 (nM min)−1 for the forward binding constants (kf81, kf83 and
kf84), 1-5000 min−1 for the dissociation constants (kf81, kf83 and kf84), 0.0035-0.06 min−1 for the
degradation rates (γG1, γG3, γG80, γG4, γC81, γC83 and γC84), 0.01-100 nM for the EC50 values
in the Hill functions (KG1, KG3 and KG80), 0.1-40 nM min−1 for αG1, 0.1-10 nM min−1 for αG3,
αoG80 and αG80, 0.1-5 nM min−1 for αG4 and 0.01-2 for ε. The constitutive rates for the feedback
knockouts were fixed at 0.1, 0.1 and 1.5 nM min−1 for αG1s, αG3s and αG80s, respectively. DH
was computed for each parameter set and for each of the five models (WT, GAL1∆ fb, GAL3∆
fb, GAL80∆ fb and GAL1∆ fb GAL3∆ fb). First, these parameter sets were filtered based on the
presence of bistability. Second, the subset of parameter sets that satisfied these constraints were
simulated and the relative concentrations of C81 and C83 were calculated at an initial (10 min)
and delayed (500 min) time point by simulation of the full WT model (7-state) before applying the
quasi-steady-state assumption.
S2.6 Feedback loop deletion models
The individual GAL1, GAL3, GAL80 and combined GAL1 and GAL3 feedback deletions were
obtained by replacing the appropriate Hill functions representing transcriptional regulation by Gal4p
with a constant or equivalently setting the appropriate thresholds in the Hill functions, KGx, x =
1, 3, 80 to zero. In the GAL80∆ fb model, the basal and constitutive production rate were lumped

50
into one parameter, αG80s. The GAL1∆ GAL3∆ fb model was obtained from the GAL1∆ fb GAL3∆
fb model by setting αG1s = 0 and ε = 0. The set of ordinary differential equations to model the five
feedback loop knockout topologies are as follows.
S2.6.1 GAL1 feedback deletion (GAL1∆ fb)
d[G1]dt
= εαgal + αG1s + ω[G1][G80]− γG1[G1],
d[G3]dt
= αgal + αG3
([G4]2
K2G3 + [G4]2
)+ δ[G3][G80]− γG3[G3],
d[G4]dt
= αG4 + β[G80][G4]− γG4[G4],
d[G80]dt
= αoG80 + αG80
([G4]2
K2G80 + [G4]2
)+ ω[G1][G80] + δ[G3][G80] + β[G80][G4]− γG80[G80],
S2.6.2 GAL3 feedback deletion (GAL3∆ fb)
d[G1]dt
= εαgal + αG1
([G4]3
K3G1 + [G4]3
)+ ω[G1][G80]− γG1[G1],
d[G3]dt
= αgal + αG3s + δ[G3][G80]− γG3[G3],
d[G4]dt
= αG4 + β[G80][G4]− γG4[G4],
d[G80]dt
= αoG80 + αG80
([G4]2
K2G80 + [G4]2
)+ ω[G1][G80] + δ[G3][G80] + β[G80][G4]− γG80[G80],
S2.6.3 GAL80 feedback deletion (GAL80∆ fb)
d[G1]dt
= εαgal + αG1
([G4]3
K3G1 + [G4]3
)+ ω[G1][G80]− γG1[G1],
d[G3]dt
= αgal + αG3
([G4]2
K2G3 + [G4]2
)+ δ[G3][G80]− γG3[G3],
d[G4]dt
= αG4 + β[G80][G4]− γG4[G4],
d[G80]dt
= αG80s + ω[G1][G80] + δ[G3][G80] + β[G80][G4]− γG80[G80],

51
S2.6.4 GAL1 and GAL3 feedback deletions (GAL1∆ fb GAL3∆ fb)
d[G1]dt
= εαgal + αG1s + ω[G1][G80]− γG1[G1],
d[G3]dt
= αgal + αG3s + δ[G3][G80]− γG3[G3],
d[G4]dt
= αG4 + β[G80][G4]− γG4[G4],
d[G80]dt
= αoG80 + αG80
([G4]2
K2G80 + [G4]2
)+ ω[G1][G80] + δ[G3][G80] + β[G80][G4]− γG80[G80].
S2.7 General models of molecular sequestration with positive feedback
We constructed generalizable models of molecular sequestration and positive feedback to examine the
relationship between the binding affinity of the activator-repressor pair(s) and the system’s region
of bistability. We first explored the parameter dependence of a simple model of an activator x that
is regulated by a transcriptional repressor z with a Hill coefficient of 1 (noncooperative). In this
model, x can sequester z to form an inactive heterodimer, hence generating a positive feedback loop.
Next, we analyzed the steady-state and dynamic properties of systems with two activators, x1
and x2 that are each regulated by the transcriptional repressor z and can sequester z into two
inactive complexes (c1 and c2), thus forming one or two positive feedback loops. In these models,
the mechanisms of sequestration and positive feedback are triggered by an input (u) that represents
a basal production rate of x, x1 and x2.
S2.7.1 Model description for single noncooperative sequestration feedback loop
The three equations that implement a single noncooperative sequestration feedback loop (Supple-
mentary Fig. 2.8A,B) are

52
dx
dt= u+
αK
K + z− kfxz + krc− γxx,
dc
dt= kfxz − krc− γcc,
dz
dt= αz − kfxz + krc− γzz.
Here, u represents the input. Assuming that dcdt = 0 (quasi-steady-state approximation), the model
was reduced to
dx
dt= u+
αK
K + z+ βxz − γxx,
dz
dt= αz + βxz − γzz,
where β = kf
(kr
kr+γc− 1
). The parameter values were set to αx = 5 nM min−1, αz = 10 nM min−1,
γx = γc = γz = 0.005 min−1, K = 100 nM, kf = 100 (nM min)−1. u and kr varied within the range
of 0.1-10 nM min−1 and 0.1-1000 min−1 (Supplementary Fig. 2.8B). Similar to the GAL model, a
bifurcation analysis was performed by computing the roots of the cubic polynomial in z.
S2.7.2 Model description for double sequestration linked feedback loops
The ODE model that represents a double sequestration linked feedback loop system shown in Fig.
2.6A consists of the following equations

53
A
z
X
x
z xKD
nHILL = 1
Input
5.5 6 6.5 70
0.5
1
1.5
2
2.5
3
3.5
4E
Activation time (cell-generations)
DH
DualSingle H(z,p1,3)Single H(z,p2,2)
KD (n
M)
B
Input (nM/min)
C D
KD1 (nM)
KD
2 (n
M)
KD1 (nM)
KD
2 (n
M)
Supplementary Figure 2.8: Molecular sequestration can generate bistability without cooperativity.Relationships between the binding affinities and activation or deactivation response times for thedual feedback loop sequestration model. (A) Circuit topology consists of an activator x that canform inactive heterodimers with a transcriptional repressor, z. z transcriptionally represses x witha Hill coefficient of 1 (noncooperative). (B) Regions of bistability (red) and monostability (blue)for a set of input and KD values (binding affinity of x to z). The region of bistability shrinks andeventually disappears as the binding affinity decreases. Model equations and parameter values arelisted in Section S2.7. (C) Activation response times measured in cell-generations for the doublefeedback loop sequestration model for different values of KD1 and KD2. (D) Deactivation responsetimes measured in cell-generations for the double feedback loop sequestration model for differentvalues of KD1 and KD2. (E) Relationship between activation response times and range of bistability(DH) for the double positive feedback loop sequestration model for a set of KD1 and KD2 values.For a fixed nonzero DH, the double positive feedback loop system could exhibit a faster activationresponse compared to the single positive feedback loop models.
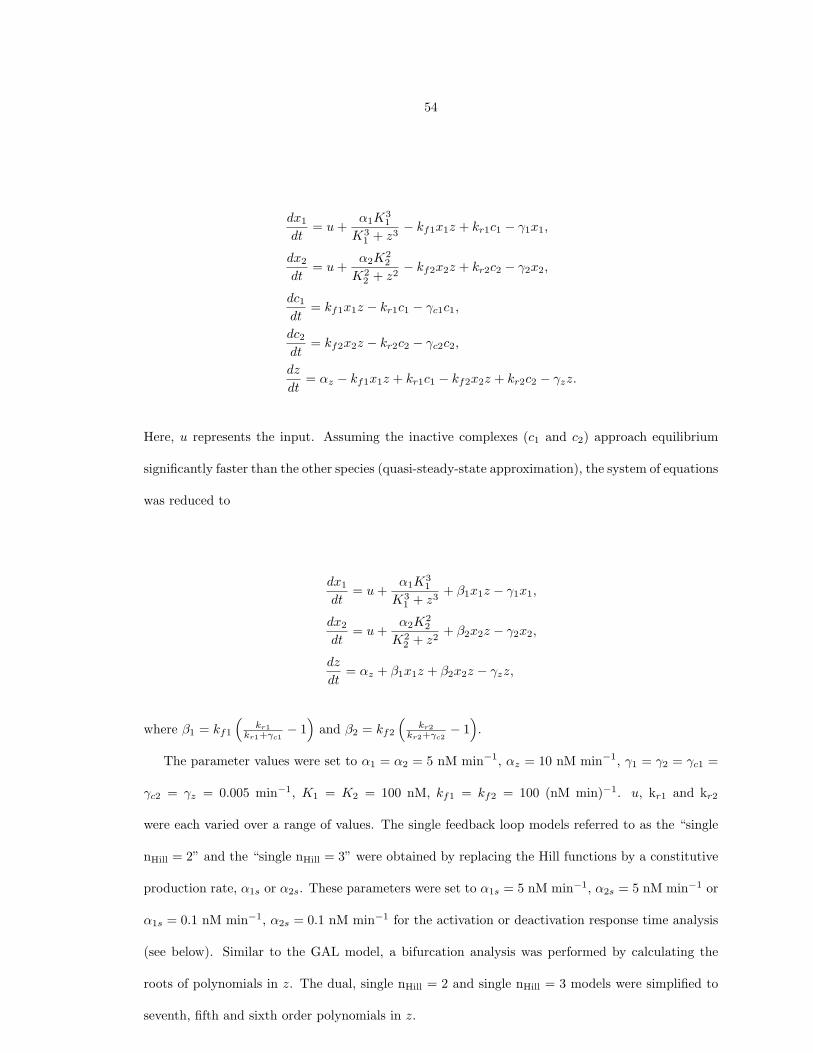
54
dx1
dt= u+
α1K31
K31 + z3
− kf1x1z + kr1c1 − γ1x1,
dx2
dt= u+
α2K22
K22 + z2
− kf2x2z + kr2c2 − γ2x2,
dc1dt
= kf1x1z − kr1c1 − γc1c1,
dc2dt
= kf2x2z − kr2c2 − γc2c2,
dz
dt= αz − kf1x1z + kr1c1 − kf2x2z + kr2c2 − γzz.
Here, u represents the input. Assuming the inactive complexes (c1 and c2) approach equilibrium
significantly faster than the other species (quasi-steady-state approximation), the system of equations
was reduced to
dx1
dt= u+
α1K31
K31 + z3
+ β1x1z − γ1x1,
dx2
dt= u+
α2K22
K22 + z2
+ β2x2z − γ2x2,
dz
dt= αz + β1x1z + β2x2z − γzz,
where β1 = kf1
(kr1
kr1+γc1− 1
)and β2 = kf2
(kr2
kr2+γc2− 1
).
The parameter values were set to α1 = α2 = 5 nM min−1, αz = 10 nM min−1, γ1 = γ2 = γc1 =
γc2 = γz = 0.005 min−1, K1 = K2 = 100 nM, kf1 = kf2 = 100 (nM min)−1. u, kr1 and kr2
were each varied over a range of values. The single feedback loop models referred to as the “single
nHill = 2” and the “single nHill = 3” were obtained by replacing the Hill functions by a constitutive
production rate, α1s or α2s. These parameters were set to α1s = 5 nM min−1, α2s = 5 nM min−1 or
α1s = 0.1 nM min−1, α2s = 0.1 nM min−1 for the activation or deactivation response time analysis
(see below). Similar to the GAL model, a bifurcation analysis was performed by calculating the
roots of polynomials in z. The dual, single nHill = 2 and single nHill = 3 models were simplified to
seventh, fifth and sixth order polynomials in z.

55
Response time analysis
The activation and deactivation response times were computed by simulation of the full sequestration
models described above before applying the quasi-steady-state approximation (six-state ODE model
including an output species, y). Total simulation time was 5000 min. The equation for the output
species was
dy
dt=
αyK3y
K3y + z3
− γyy,
and the parameters equaled αy = 10 nM min−1, Ky = 100 nM, γy = 0.005 min−1.
Activation response times
For the activation time simulations, u = 0 for t ≤ 500 min and then u = 10 for t > 500 min. The
initial conditions approximated the steady-state concentrations for the low state where x1o = 0.005
nM, x2o = 0.01 nM, c1o = 0.12 nM, c2o = 2.4 nM, zo = 1998 nM and yo = 0.26 nM. The time
required for y (normalized between 0 and 1) to increase to half its maximum value was computed
for each set of KD1 and KD2 values. In the single feedback loop models, the constitutive production
rates of x1 or x2 (α1s or α2s) were set to 0.1 nM min−1 because this value approximated the Hill
functions at equilibrium for u = 0 .
Deactivation response times
For the deactivation time simulations, u = 10 for t ≤ 500 min and then u = 0 for t > 500 min. The
initial conditions approximated the steady-state concentrations for the high state where x1o = 1943
nM, x2o = 1891 nM, c1o = 993 nM, c2o = 966 nM, zo = 40.9 nM and yo = 1872 nM. The time
required for y (normalized between 0 and 1) to decay to half its maximum value was computed for
each set of KD1 and KD2 values. In the single feedback loop models, the constitutive production
rates of x1 or x2 (α1s or α2s) were set to 5 nM min−1 because this value approximated the Hill

56
functions at equilibrium for u = 10.

57
Strain name GenotypeWild-type (WT) PGAL10Venus MATa leu2, trp1::TRP1-PGAL10Venus, ura3, ade2::ADE2, his3GAL2∆ fb MATa leu2::LEU2-PTEFm4rtTA-M2, trp1::TRP1-PGAL10Venus,
ura3::URA3-PTETGAL2, ade2::ADE2, his3, GAL2∆::KANGAL3∆ fb MATa leu2::LEU2-PTEFm4rtTA-M2, trp1::TRP1-PGAL10Venus,
ura3::URA3-PTETGAL3, ade2::ADE2, his3, GAL3∆::KANGAL80∆ fb MATa leu2::LEU2-PTEFm4rtTA-M2, trp1::TRP1-PGAL10Venus,
ura3::URA3-PTETGAL80, ade2::ADE2, his3, GAL80∆::HPHGAL2∆ fb GAL3∆ fb MATa leu2::LEU2-PTEFm4rtTA-M2, trp1::TRP1-PGAL10Venus,
ura3::URA3-PTETGAL3, ade2::ADE2, his3::HIS3-PADH1GAL2,GAL3∆::KAN, GAL2∆::NAT
GAL2∆ fb GAL3∆ fb GAL80∆fb
MATα ura3:URA3-PTETGAL3, leu2::LEU2-PSTE5GAL80,ade2::ADE2-PGAL10Venus, trp1::TRP1-PADH1GAL2, his3::HIS3-PTEFm4rtTA-M2, GAL3∆::KAN, GAL2∆::NAT, GAL80∆::HPH
GAL1∆† MATα leu2, trp1::TRP1-PGAL10Venus, ura3, ade2::ADE2, his3, GAL1∆GAL1∆† fb MATα leu2::LEU2-PTEFm4rtTA-M2, trp1::TRP1-PGAL10Venus, ura3,
ade2::ADE2, his3, GAL1∆GAL1∆† GAL2∆ fb MATα leu2::LEU2-PTEFm4rtTA-M2, trp1::TRP1-PGAL10Venus,
ura3::URA3-PTETGAL2, ade2::ADE2, his3, GAL2∆::NAT, GAL1∆GAL1∆† GAL3∆ fb MATα leu2::LEU2-PTEFm4rtTA-M2, trp1::TRP1-PGAL10Venus,
ura3::URA3-PTETGAL3, ade2::ADE2, his3, GAL3∆::KAN, GAL1∆GAL1∆† GAL80∆ fb MATα leu2::LEU2-PTEFm4rtTA-M2, trp1::TRP1-PGAL10Venus,
ura3::URA3-PTETGAL3, ade2::ADE2, his3, GAL80∆::HPH, GAL1∆WT PGAL3Venus MATa leu2, trp1::TRP1-PGAL3Venus, ura3, ade2::ADE2, his3WT PGAL80Venus MATa leu2, trp1::TRP1-PGAL80Venus, ura3, ade2::ADE2, his3WT PTDH3Venus MATa leu2, trp1::TRP1-PTDH3Venus, ura3, ade2::ADE2, his3WT PCYC1-G4BSVenus MATa leu2, trp1::TRP1-PCYC1-G4BSVenus, ura3, ade2::ADE2, his3Wild-type diploid MATa/α leu2/leu2::LEU2-PTEFm4rtTA-M2, trp1::TRP1-
PGAL10Venus/trp1, ura3/ura3, ade2::ADE2/ade2, his3/his3MA0182∗ MATa/α, ura3/ura3::URA3-PTETO2GAL3, his3::HIS3/his3,
ade2::ADE2-PMYO2rtTA/ade2::ADE2-PGAL1YFP,GAL3∆::KAN/GAL3∆::KAN
Supplementary Table II: Strains used in this study. All strains were W303. †Constructed usingCSY53 background described in [28]. ∗Strain described in [20].

58
Bibliography
[1] M Nakajima, K Imai, H Ito, T Nishiwaki, Y Murayama, H Iwasaki, T Oyama, and T Kondo.
Reconstitution of circadian oscillation of cyanobacterial kaiC phosphorylation in vitro. Science,
308(5720):414–5, 2005.
[2] GM Suel, J Garcia-Ojalvo, LM Liberman, and MB Elowitz. An excitable gene regulatory circuit
induces transient cellular differentiation. Nature, 440(7083):545–50, 2006.
[3] SM Block, JE Segall, and HC Berg. Adaptation kinetics in bacterial chemotaxis. Journal of
bacteriology, 154(1):312–23, 1983.
[4] A Novick and M Weiner. Enzyme induction as an all-or-none phenomenon. Proceedings of the
National Academy of Sciences, 43(7):553–66, 1957.
[5] IG de Jong, P Haccou, and OP Kuipers. Bet hedging or not? A guide to proper classification
of microbial survival strategies. Bioessays, 33(3):215–23, 2011.
[6] H Maamar, A Raj, and D Dubnau. Noise in gene expression determines cell fate in Bacillus
subtilis. Science, 317(5837):526–9, 2007.
[7] JW Veening, EJ Stewart, TW Berngruber, F Taddei, OP Kuipers, and LW Hamoen. Bet-
hedging and epigenetic inheritance in bacterial cell development. Proceedings of the National
Academy of Sciences, 105(11):4393–8, 2008.
[8] NQ Balaban, J Merrin, R Chait, L Kowalik, and S Leibler. Bacterial persistence as a phenotypic
switch. Science, 305(5690):1622–5, 2004.

59
[9] SF Levy, N Ziv, and ML Siegal. Bet hedging in yeast by heterogeneous, age-correlated expression
of a stress protectant. PLoS Biology, 10(5):e1001325, 2012.
[10] N Avraham, I Soifer, M Carmi, and N Barkai. Increasing population growth by asymmetric
segregation of a limiting resource during cell division. Molecular Systems Biology, 9:656, 2013.
[11] MA Strauch, JJ Wu, RH Jonas, and JA Hoch. A positive feedback loop controls transcription
of the spoOF gene, a component of the sporulation phosphorelay in Bacillus subtilis. Molecular
Microbiology, 7(6):967–74, 1993.
[12] H Maamar and D Dubnau. Bistability in the Bacillus subtilis K-state (competence) system
requires a positive feedback loop. Molecular Microbiology, 56(3):615–24, 2005.
[13] O Brandman and T Meyer. Feedback loops shape cellular signals in space and time. Science,
322(5900):390–395, 2008.
[14] KJ Astrom and RM Murray. Feedback Systems: An Introduction for Scientists and Engineers.
Princeton University Press, 2008.
[15] N Rosenfeld, MB Elowitz, and U Alon. Negative autoregulation speeds the response time of
transcription networks. Journal of Molecular Biology, 323(5):785–793, 2002.
[16] A Becskei and L Serrano. Engineering stability in gene networks by autoregulation. Nature,
405:590–593, 2000.
[17] L Ashall, CA Horton, DE Nelson, P Paszek, CV Harper, K Sillitoe, S Ryan, DG Spiller,
JF Unitt, DS Broomhead, DB Kell, DA Rand, V See, and MR White. Pulsatile stimulation de-
termines timing and specificity of NF-kappaB-dependent transcription. Science, 324(5924):242–
6, 2009.
[18] SR Biggar and GR Crabtree. Cell signaling can direct either binary or graded transcriptional
responses. The EMBO Journal, 20(12):3167–76, 2001.

60
[19] OS Venturelli, H El-Samad, and RM Murray. Synergistic dual positive feedback loops estab-
lished by molecular sequestration generate robust bimodal response. Proceedings of the National
Academy of Sciences, 109(48), 2012.
[20] M Acar, A Becskei, and A Oudenaarden. Enhancement of cellular memory by reducing stochas-
tic transitions. Nature, 435:228–232, 2005.
[21] FJ Isaacs, J Hasty, CR Cantor, and JJ Collins. Prediction and measurement of an autoregu-
latory genetic module. Proceedings of the National Academy of Sciences, 100(13):7714–7719,
2003.
[22] TE Torchia, RW Hamilton, CL Cano, and JE Hopper. Disruption of regulatory gene GAL80
in Saccharomyces cerevisiae: effects on carbon-controlled regulation of the galactose/melibiose
pathway genes. Molecular Cellular Biology, 4(8):1521–7, 1984.
[23] JF Tschopp, SD Emr, C Field, and R Schekman. GAL2 codes for a membrane-bound subunit
of the galactose permease in Saccharomyces cerevisiae.
[24] TE Torchia and JE Hopper. Genetic and molecular analysis of the GAL3 gene in the expression
of the galactose/melibiose regulon of Saccharomyces cerevisiae. Genetics, 113(2):229–46, 1986.
[25] P Bhat and J Hopper. Overproduction of the GAL1 or GAL3 protein causes galactose-
independent activation of the GAL4 protein: evidence for a new model of induction for the
yeast GAL/MEL regulon. Molecular Cell Biology, 12(6):2701–2707, 1992.
[26] DJ Timson, HC Ross, and RJ Reece. Gal3p and Gal1p interact with the transcriptional repres-
sor Gal80p to form a complex of 1:1 stoichiometry. Biochemistry Journal, 363(Pt 3):515–20,
2002.
[27] W Bajwa, TE Torchia, and JE Hopper. Yeast regulatory gene GAL3: carbon regulation;
UASGal elements in common with GAL1, GAL2, GAL7, GAL10, GAL80, and MEL1; encoded
protein strikingly similar to yeast and Escherichia coli galactokinases, journal = Molecular
Cellular Biology, volume = 8, number = 8, pages = 3439-47, year = 1988.

61
[28] MK Hawkins and CD Smolke. The regulatory roles of the galactose permease and kinase in
the induction response of the GAL network in Saccharomyces cerevisae. Journal of Biological
Chemistry, 281(19):13485–13492, 2006.
[29] CA Sellick, TA Jowitt, and RJ Reece. The effect of ligand binding on the galactokinase ac-
tivity of yeast Gal1p and its ability to activate transcription. Journal of Biological Chemistry,
284(1):229–36, 2009.
[30] JB Thoden, CA Sellick, DJ Timson, RJ Reece, and HM Holden. Molecular structure of Sac-
charomyces cerevisiae Gal1p, a bifunctional galactokinase and transcriptional inducer. Journal
of Biological Chemistry, 280(44):36905–11, 2005.
[31] TC Hittinger and SB Carroll. Gene duplication and the adaptive evolution of a classic genetic
switch. Nature, 449:677–681, 2007.
[32] M Johnston. A model fungal gene regulatory mechanism: the GAL genes of Saccharomyces
cerevisiae. Microbiological Reviews, 51(4):458–476, 1987.
[33] I Zacharloudakis, T Gligoris, and D Tzamarias. A yeast catabolic enzyme controls transcrip-
tional memory. Current Biology, 17(23):2041–2046, 2007.
[34] D Abramczyk, S Holden, CJ Page, and RJ Reece. Interplay of a ligand sensor and an enzyme in
controlling expression of the Saccharomyces cerevisiae GAL genes. Eukaryotic Cell, 11(3):334–
42, 2011.
[35] MN Artyomov, J Das, M Kardar, and A Chakraborty. Purely stochastic binary decisions in
cell signaling models without underlying deterministic bistabilities. Proceedings of the National
Academy of Sciences, 104(48):18958–18963, 2007.
[36] M Samoilov, S Plyasunov, and A Arkin. Stochastic amplification and signaling in enzymatic
futile cycles through noise-induced bistability with oscillations. Proceedings of the National
Academy of Sciences, 102(7):2310–2315, 2005.

62
[37] TB Kepler and TC Elston. Stochasticity in transcriptional regulation: origins, consequences
and mathematical representations. Biophysical Journal, 81(6):3116–3136, 2001.
[38] I Lestas, J Paulsson, NE Ross, and G Vinnicombe. Noise in gene regulatory networks. Automatic
Control, IEEE Transactions, 53(Special issue on systems biology):189–200, 2008.
[39] GM Guidi and A Goldbeter. Bistability without hysteresis in chemical reaction systems: A
theoretical analysis of irreversible transitions between multiple steady states. Journal of Physical
Chemistry, 101:9367–9376, 1997.
[40] T Nagai, K Ibata, ES Park, M Kubota, K Mikoshiba, and A Miyawaki. A variant of yellow
fluorescent protein with fast and efficient maturation for cell-biological applications. Nature
Biotechnology, 20(1):87–90, 2002.
[41] HC Douglas and DC Hawthorne. Enzymatic expression and genetic linkage of genes controlling
galactose utilization in Saccharomyces. Genetics, 49:837–44, 1964.
[42] MI Riley and RC Dickson. Genetic and biochemical characterization of the galactose gene
cluster in Kluyveromyces lactis. Journal of bacteriology, 158(2):705–12, 1984.
[43] S Urlinger, U Baron, M Thellmann, MT Hasan, H Bujard, and W Hillen. Exploring the sequence
space for tetracycline-dependent transcriptional activators: novel mutations yield expanded
range and sensitivity. Proceedings of the National Academy of Sciences of the United States of
America, 97(14):7963–8, 2000.
[44] D Angeli, JE Ferrell, and ED Sontag. Detection of multistability, bifurcations, and hysteresis
in a large class of biological positive-feedback systems. Proceedings of the National Academy of
Sciences of the United States of America, 101(7):1822–7, 2004.
[45] RL Iman, JM Davenport, and DK Zeigler. Latin hypercube sampling program users guide.
Technical Report Sandia Labs, 1980.
[46] Jr. Ferrell, JE. Tripping the switch fantastic: how a protein kinase cascade can convert graded
inputs into switch-like outputs. Trends Biochemical Sciences, 21(12):460–6, 1996.

63
[47] NE Buchler and M Louis. Molecular titration and ultrasensitivity in regulatory networks.
Journal of Molecular Biology, 384(5):1106–19, 2008.
[48] NE Buchler and FR Cross. Protein sequestration generates a flexible ultrasensitive response in
a genetic network. Molecular Systems Biology, 5:272, 2009.
[49] SY Kim and Jr Ferrell, JE. Substrate competition as a source of ultrasensitivity in the inacti-
vation of Wee1. Cell, 128(6):1133–45, 2007.
[50] Jr Ferrell, JE. Feedback regulation of opposing enzymes generates robust, all-or-none bistable
responses. Current Biology, 18(6):R244–5, 2008.
[51] MJ Dunlop, RS Cox, JH Levine, RM Murray, and MB Elowitz. Regulatory activity revealed
by dynamic correlations in gene expression noise. Nature Genetics, 40(12):1493–8, 2008.
[52] CD Thron. A model for a bistable biochemical trigger of mitosis. Biophysical Chemistry,
57(2-3):239–51, 1996.
[53] Jr Ferrell, JE. Self-perpetuating states in signal transduction: positive feedback, double-
negative feedback and bistability. Current Opinion in Cell Biology, 14(2):140–8, 2002.
[54] CV Cabrera, MC Alonso, and H Huikeshoven. Regulation of scute function by extramacrochaete
in vitro and in vivo. Development, 120(12):3595–603, 1994.
[55] A Bhattacharya and NE Baker. A network of broadly expressed HLH genes regulates tissue-
specific cell fates. Cell, 147(4):881–92, 2011.
[56] M Van Doren, HM Ellis, and JW Posakony. The Drosophila extramacrochaetae protein antag-
onizes sequence-specific DNA binding by daughterless/achaete-scute protein complexes. Devel-
opment, 113(1):245–55, 1991.
[57] JW Veening, WK Smits, and OP Kuipers. Bistability, epigenetics, and bet-hedging in bacteria.
Annual Reviews Microbiology, 62:193–210, 2008.

64
[58] T Pfeiffer and S Bonhoeffer. Evolution of cross-feeding in microbial populations. The American
Naturalist, 163(6), 2004.
[59] E Nevoigt, J Kohnke, CR Fischer, H Alper, U Stahl, and G Stephanopoulos. Engineering of
promoter replacement cassettes for fine-tuning of gene expression in Saccharomyces cerevisiae.
Applied Environmental Microbiology, 72(8):5266–73, 2006.
[60] R Lutz and H Bujard. Independent and tight regulation of transcriptional units in Escherichia
coli via the LacR/O, the TetR/O and AraC/I1-I2 regulatory elements. Nucleic Acids Research,
25(6):1203–10, 1997.
[61] CM Bishop. Pattern recognition and machine learning. Springer, 2006.
[62] KJ Livak and TD Schmittgen. Analysis of relative gene expression data using real-time quan-
titative PCR and the 2−∆∆Ct method. Methods, 25:402–408, 2001.
[63] MA Teste, M Duquenne, JM Francois, and JL Parrou. Validation of reference genes for quan-
titative expression analysis by real-time RT-PCR in Saccharomyces cerevisiae. BMC Molecular
Biology, 10:99, 2009.
[64] A Dickenstein and IZ Emiris. Solving Polynomial Equations: Foundations, Algorithms, and
Applications (Algorithms and Computation in Mathematics). Springer, 2005.
[65] C Mateus and SV Avery. Destabilized green fluorescent protein for monitoring dynamic changes
in yeast gene expression with flow cytometry. Yeast, 16(14):1313–23, 2000.
[66] WK Huh, JV Falvo, LC Gerke, AS Carroll, RW Howson, JS Weissman, and EK O’Shea. Global
analysis of protein localization in budding yeast. Nature, 425(6959):686–91, 2003.
[67] CB Tyson, PG Lord, and AE Wheals. Dependency of size of Saccharomyces cerevisiae cells on
growth rate. Journal of bacteriology, 138(1):92–8, 1979.
[68] JR Newman, S Ghaemmaghami, J Ihmels, DK Breslow, M Noble, JL DeRisi, and JS Weissman.
Single-cell proteomic analysis of S. cerevisiae reveals the architecture of biological noise. Nature,
441(7095):840–6, 2006.

65
[69] MA Savageau. Biochemical Systems Analysis. Addison-Wesley Publishing Company, 1976.
[70] G Peng and JE Hopper. Evidence for Gal3p’s cytoplasmic location and Gal80p’s dual
cytoplasmic-nuclear location implicates new mechanisms for controlling Gal4p activity in Sac-
charomyces cerevisiae. Molecular Cellular Biology, 20(14):5140–8, 2000.
[71] R Wightman, R Bell, and RJ Reece. Localization and interaction of the proteins constituting
the GAL genetic switch in Saccharomyces cerevisiae. Eukaryotic Cell, 7(12):2061–8, 2008.
[72] O Egriboz, F Jiang, and JE Hopper. Rapid GAL gene switch of Saccharomyces cerevisiae
depends on nuclear Gal3, not nucleocytoplasmic trafficking of Gal3 and Gal80. Genetics,
189(3):825–36, 2011.
[73] M Hong, MX Fitzgerald, S Harper, C Luo, DW Speicher, and R Marmorstein. Structural basis
for dimerization in DNA recognition by Gal4. Structure, 16(7):1019–26, 2008.
[74] V Pilauri, M Bewley, C Diep, and J Hopper. Gal80 dimerization and the yeast GAL gene
switch. Genetics, 169(4):1903–14, 2005.
[75] K Melcher and E Xu. Gal80-Gal80 interaction on adjacent Gal4p binding sites is required for
complete GAL gene repression. The EMBO Journal, 20:841–851, 2001.
[76] E Giniger and M Ptashne. Cooperative DNA binding of the yeast transcriptional activator
GAL4. Proceedings of the National Academy of Sciences, 85(2):382–6, 1988.
[77] DW Griggs and M Johnston. Promoter elements determining weak expression of the GAL4
regulatory gene of Saccharomyces cerevisiae. Molecular Cell Biology, 13(8):4999–5009, 1993.