Embed Size (px)
Citation preview

ROLE OF GIS IN THE STUDY OF CHANGING OCCUPATIONAL
STRUCTURE IN RAJPUR-SONARPUR MUNICIPAL AREA, SOUTH 24
PARGANAS, WEST BENGAL
Pompa Mondal1 Dr. Tapas Mistri2
1.Research Scholar, Department of Geography, The University of Burdwan, West Bengal.
2.Assistant Professor, Department of Geography, The University of Burdwan, West Bengal.
Email: [email protected] [email protected]
Abstract:
Most of the urban places in the recent past has undergone with sea changes in terms of
its population dynamics, administrative boundaries, redistribution of settlements etc. As a part of
that changes of occupational structure become significant due to vast job diversification for
changing technological bases and land use land cover changes. The traditional rural society being
replaced by modern urban growth features and eventually leads to specific occupational pattern
within the economy. The present study is concerned with the study of changing occupational
structure in Rajpur-Sonarpur municipal area, South 24 Parganas. Such types of studies have
immense to importance to understand spatio-temporal changes in economy as societal directions
as well. At first the most part of the study area was under Gram Panchayat where paddy
cultivation and fishing were practiced. But due to proximity of this area with the city of Kolkata
helps to develop infrastructure such as wide roads and various inter connecting lanes and by
lanes along with drainage network development and water supply facilities the large number of
people migrated mostly from southern part of the Sundarbans settled here for getting better
standard of living specially education and job facilities that eventually brought changes in
occupational structure that become actually superimposed over this area. These migrated people
also brought huge changes in settlement pattern, structure and size that subsequently rapidly
changing the skyline of the outer fringe of the study area. Moreover the technological
development, job diversification, city services on daily basis mainly served by the people of this
area. To understand the nature of urban sprawl and LULC changes and related occupational
changes may be portrayed and justified through RS and GIS techniques along with thorough
field survey. With rapid urban growth the huge influx of migrated population in the study area is
suffering from the challenges of mitigation of their daily demands of livelihood. Actually income
security and employment is the biggest challenge of this century. Proper economic goals
considering the ecological limits and vitality need to be implemented to sustain these vast
populations.
Keywords: Occupational structure; changing pattern; urban sprawl; GIS.
Journal of Xi'an University of Architecture & Technology
Volume XII, Issue II, 2020
Issn No : 1006-7930
Page No: 2979

Introduction:
Occupational structure is one of the important contents of the study of population
geography. It is closely related with the socio-economic development of any area [3, 4]. Not only
that to assess the human development it plays an important role. Percentages of population of
any area engage in which sector reveals the actual status of the socio-economic development of
this unit. Therefore to understand the level of economic development and livelihood pattern of
any area it is important to study the occupational structure not only that growth of economy
along with time also reveals by studying the changing pattern of occupational structure i.e.
movement of work participation rate from primary sector to secondary and tertiary sector refers
to the progress of economy [1, 2].
Rajpur-Sonarpur municipality is one the fastest growing municipalities not only in
India but all over the world and one of the oldest Municipalities of the district S. 24 Parganas in
the state of West Bengal was formed in 1876 under the style of South Suburban Town
Committee covering Behala, Tollygunge, Garia, Rajpur etc. Later, in the year 1876, out of the
said area Rajpur was segregated to Rajpur Municipality comprising Rajpur, Jagaddal, Harinavi,
Malancha and Kodalia with only five wards and had a small area of two square miles. Since then
underwent expansion of urban area takes place from time to time. For a long time the study area
existed with 14 Wards in 20.98 sq.km. Due to location of this urban unit within KMDA and
closeness to the city of Kolkata it acts as a gateway of South 24 Parganas [11]. A large number of
people who are coming from peripheral areas of South 24 Parganas namely Gosaba, Canning I,
Canning II, Basanti, Namkhana etc to get better facilities like education, health, employment in
this area .
On the other hand increasing congestion at the central part of the city drives people out
but not too far away from the central part of the city till is the magnet for cultural and economic
specialization as we see all over the India [13]. A major portion of the residents of the study area
go to Kolkata for their daily job in the morning every day but at evening they come back after
doing their work to live with peaceful life by getting less pollution, fresh fruits and vegetables
etc.
Almost three decades ago the major economic activity of this study area was
agriculture. Most of the land was under paddy cultivation. Huge area was covered by a large
number of water bodies, vegetation biomass. Most of workers also engaged in primary activities
namely agriculture, fishing etc. But immigrated people from both the city of Kolkata and
peripheral district of S. 24 Parganas changed the scenarios by occupying the job in secondary
and tertiary sectors namely teaching, nursing, telecommunication, pharmacy, mass media,
manufacturing etc [7].
Journal of Xi'an University of Architecture & Technology
Volume XII, Issue II, 2020
Issn No : 1006-7930
Page No: 2980

Literature review:
The Researcher has reviewed books, journals, Reports and conference proceedings,
journals etc related to the present the study. Singh (1981) has explained the importance of
activities related to trade and commerce in urban centres of eastern Uttar Pradesh. It finds that 36
towns out of 69 to be specialized in trade and commerce. Khalil (1996) analyzes structural
transformation of work force in Iran. It is found that diversification of economy in Iran changes
the structural pattern of the workforce with time and this changing pattern mainly towards
tertiary sectors rather than the secondary sectors. Bagchi, Das and Chattopadhyay (2005)
examined the structural changes in the economy of Gujarat from1970 to 2000. From the study it
is found that work participation rate in primary activities mainly agricultural has been stagnant or
even declining. On the other hand high rate of growth has been shown in secondary and tertiary
sectors. Khadke (2019) showed the changing occupational structure in Aurangabad city. They
found that primary activities are not playing an important role in terms of economic development
and urban growth of the city. It is also found that gender inequality in work participation rate is
continuously decreasing. Akanda (2005) analyzes the structural changes in land use and rural
livelihoods of Bangladesh. It discussed the how changing land use pattern, technological
development and micro credit has improved rural livelihoods. Clerk (1940) showed the strong
relationship between the occupational structure and growth of economy of any area. Economic
development is the result of necessary and predictable changes in occupational structure.
Study area:
Rajpur-Sonarpur municipality extends from 22015’N to 22019’N latitude and 88032’E to
88034’E longitude is basically a part of Gangetic Delta with an average elevation of 8.5m. It is
the 7th largest municipality of West Bengal in terms of population after Kolkata Municipal
Corporation, Asansol, Howrah, Siliguri, Durgapur and Maheshtala with an area of 55.00 sq. km
as per Census of India, 2011. This municipality is bounded to the north by Kolkata Municipal
Corporation, to the south by Baruipur Municipal area and to the east as well as to the west by the
gram Panchayat Samity. The Eastern Railways Station namely Garia, Narendrapur, Sonarpur
and Subhasgram, are within this municipal area. As per 2011 Census of India study area have a
total population of 423,806; of which male and female are 215,983 and 207,823 respectively.
According to census of India total population of RSM (Rajpur-Sonarpur Municipality) recorded
as 64000 in 1991 and it increased to 336628 in 2001 and decadal growth rate was 425%.
Population density of the study area is 8603/sq.km according to 2011 Census. It has been
notified that the population density has increased nearly 3 times from 1991 to 2011. Ward wise
population growth rate shown by the fig no. 3. Average literacy rate of Rajpur Sonarpur
Municipal area is 91.06 % of which male and female literacy rate are 94.28% and 87.71%
respectively. The sex ratio is 962 per 1000 males. Figure-1 shows the location of the study area [6].
Journal of Xi'an University of Architecture & Technology
Volume XII, Issue II, 2020
Issn No : 1006-7930
Page No: 2981

Objectives:
Main objective of this study is to analyze changing occupational structure in Rajpur-
Sonarpur Municipal area. To fulfill the main objective sub objectives are followed.
1. To show the changing pattern of work participation rate in the study area.
2. To analyze the changing pattern of occupational structure with related to urban growth.
3. To explore the underlying causes of economic changes as a part of social change.
Methodology:
This study is mainly based on secondary data. After the extensive review of literatures
of different aspects on occupational structure and relevant reports such as District Human
development Reports of South 24 Parganas, Human development Reports of West Bengal data
were collected from different sources such as Census of India, District Census Handbook, South
24 Parganas 1901 to 2011; the Bureau of Applied Economics and Statistics: Government of West
Bengal, District Statistical Handbook, South 24 Parganas, 2005 to 2013; different Local Urban
Bodies. Various administrative and thematic maps related to the study were gathered from
National Atlas and Thematic Mapping Organization, Census of India and local urban offices etc.
Geographical Information System is a power full tool to represent the accurate and
spatio-temporal information of any changes of any area. After tabulating and calculating the data
GIS software are used for mapping the resulted values, analyze data and fulfill the objectives [9].
Work participation rate of any area is the percentage of total workers to the total
population of this unit. Thus,
Work Participation Rate = Total workers (Main + Marginal) / Total population *100
Male Work Participation Rate = Total male workers (Main + Marginal) / Total male
population *100
Female Work Participation Rate = Total Female workers (Main + Marginal) / Total female
population *100
Work Participation Rate as Main or Marginal = Total main or marginal workers /Total
population *100
Occupational diversification is calculated by dividing the number of workers in any sector of the
occupation (Cultivators, Agricultural labourers, Household industrial workers, Other workers) by
the total number of workers as main or marginal and result is multiplied by 100. Thus,
Occupational diversification of Main Workers = Total workers engaged as main workers in
specific sector of occupation / Total main workers *100
Journal of Xi'an University of Architecture & Technology
Volume XII, Issue II, 2020
Issn No : 1006-7930
Page No: 2982

Figure- 1: Rajpur-Sonarpur Municipality: Location Map
Location Map
Source: District Planning Map Series, NATMO, Kolkata
Journal of Xi'an University of Architecture & Technology
Volume XII, Issue II, 2020
Issn No : 1006-7930
Page No: 2983
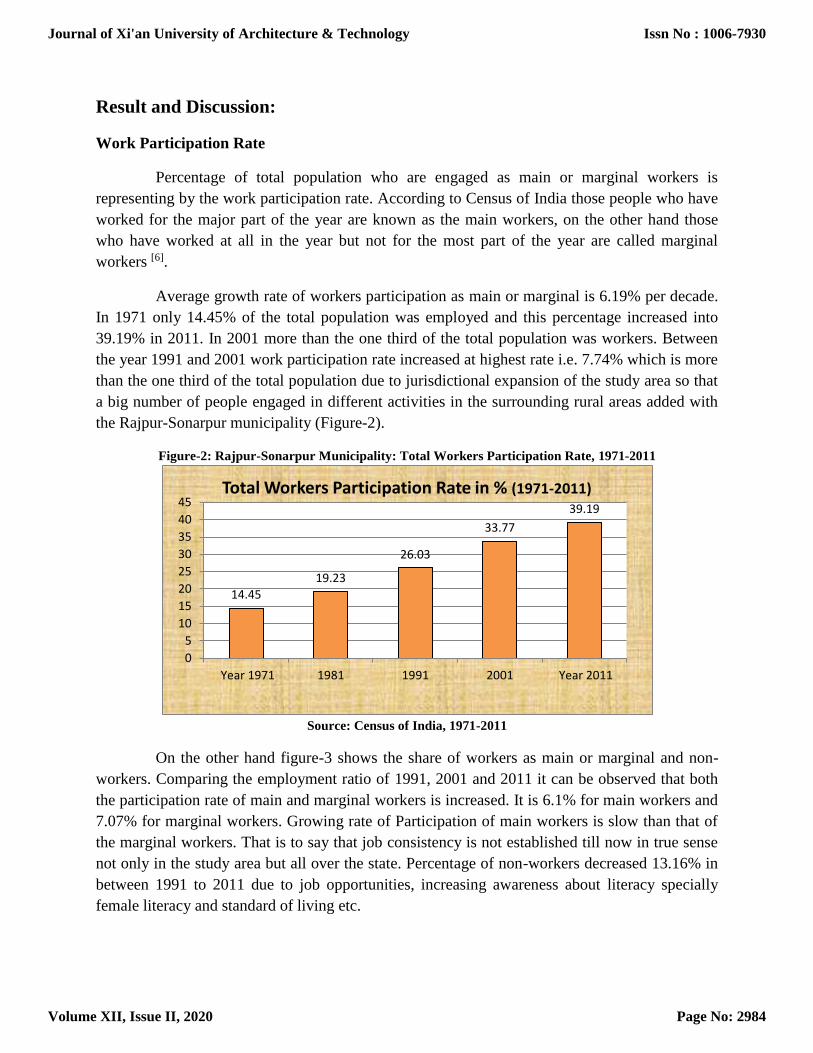
Result and Discussion:
Work Participation Rate
Percentage of total population who are engaged as main or marginal workers is
representing by the work participation rate. According to Census of India those people who have
worked for the major part of the year are known as the main workers, on the other hand those
who have worked at all in the year but not for the most part of the year are called marginal
workers [6].
Average growth rate of workers participation as main or marginal is 6.19% per decade.
In 1971 only 14.45% of the total population was employed and this percentage increased into
39.19% in 2011. In 2001 more than the one third of the total population was workers. Between
the year 1991 and 2001 work participation rate increased at highest rate i.e. 7.74% which is more
than the one third of the total population due to jurisdictional expansion of the study area so that
a big number of people engaged in different activities in the surrounding rural areas added with
the Rajpur-Sonarpur municipality (Figure-2).
Figure-2: Rajpur-Sonarpur Municipality: Total Workers Participation Rate, 1971-2011
Source: Census of India, 1971-2011
On the other hand figure-3 shows the share of workers as main or marginal and non-
workers. Comparing the employment ratio of 1991, 2001 and 2011 it can be observed that both
the participation rate of main and marginal workers is increased. It is 6.1% for main workers and
7.07% for marginal workers. Growing rate of Participation of main workers is slow than that of
the marginal workers. That is to say that job consistency is not established till now in true sense
not only in the study area but all over the state. Percentage of non-workers decreased 13.16% in
between 1991 to 2011 due to job opportunities, increasing awareness about literacy specially
female literacy and standard of living etc.
14.4519.23
26.03
33.77
39.19
0
5
10
15
20
25
30
35
40
45
Year 1971 1981 1991 2001 Year 2011
Total Workers Participation Rate in % (1971-2011)
Journal of Xi'an University of Architecture & Technology
Volume XII, Issue II, 2020
Issn No : 1006-7930
Page No: 2984
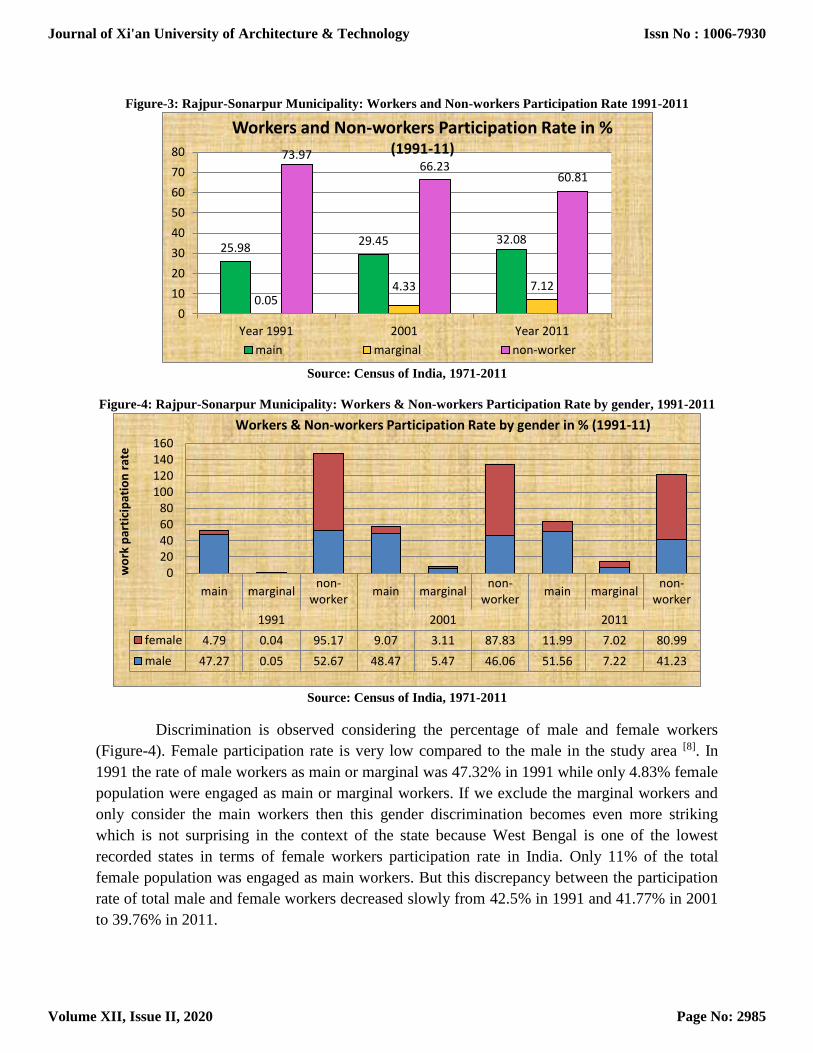
Figure-3: Rajpur-Sonarpur Municipality: Workers and Non-workers Participation Rate 1991-2011
Source: Census of India, 1971-2011
Figure-4: Rajpur-Sonarpur Municipality: Workers & Non-workers Participation Rate by gender, 1991-2011
Source: Census of India, 1971-2011
Discrimination is observed considering the percentage of male and female workers
(Figure-4). Female participation rate is very low compared to the male in the study area [8]. In
1991 the rate of male workers as main or marginal was 47.32% in 1991 while only 4.83% female
population were engaged as main or marginal workers. If we exclude the marginal workers and
only consider the main workers then this gender discrimination becomes even more striking
which is not surprising in the context of the state because West Bengal is one of the lowest
recorded states in terms of female workers participation rate in India. Only 11% of the total
female population was engaged as main workers. But this discrepancy between the participation
rate of total male and female workers decreased slowly from 42.5% in 1991 and 41.77% in 2001
to 39.76% in 2011.
25.9829.45 32.08
0.054.33 7.12
73.9766.23
60.81
0
10
20
30
40
50
60
70
80
Year 1991 2001 Year 2011
Workers and Non-workers Participation Rate in % (1991-11)
main marginal non-worker
main marginalnon-
workermain marginal
non-worker
main marginalnon-
worker
1991 2001 2011
female 4.79 0.04 95.17 9.07 3.11 87.83 11.99 7.02 80.99
male 47.27 0.05 52.67 48.47 5.47 46.06 51.56 7.22 41.23
020406080
100120140160
wo
rk p
arti
cip
atio
n r
ate
Workers & Non-workers Participation Rate by gender in % (1991-11)
Journal of Xi'an University of Architecture & Technology
Volume XII, Issue II, 2020
Issn No : 1006-7930
Page No: 2985

Figure-5: Rajpur-Sonarpur Municipality: Decadal growth rate of Population and Total workers, 1971-2011
Source: Census of India, 1971-2011
According to Human Development Report 2004 this gender discrimination of work
participation rate is may be due to the under reporting because of social invisibility and lack of
recognizing women’s unpaid work [7]. Fig.6 shows Ward wise male female work participation
rate of the study area. The inter-wards status of female work participation rate is more or less
same. Of course, the rate of female participation in all the wards is much lower than the male.
Lowest gap between the male and female work participation rate is 28.45% seen in ward no. 25
and highest is 46.26% seen in ward no 32 in 2011 (see Table-1).
Figure-6: Rajpur-Sonarpur Municipality: Ward level Work Participation Rate by gender, 2011
Source: Census of India, 2011
70.19 85.17
625
46.2627.89 36.81
459.55
26.03
0
100
200
300
400
500
600
700
1971-81 1981-91 1991-01 2001-11
Decadal growth rate of Population & Total workers in % (1971-11)
workers population
Journal of Xi'an University of Architecture & Technology
Volume XII, Issue II, 2020
Issn No : 1006-7930
Page No: 2986

From the decadal growth rate of total population and total workers (figure-5) it can be
observed that growth rate of workers is more than that of the population from 1971 to 2011. It
means growing population generates more workers than the earlier. It is the good sign of the
economy of any area. It is also observed that there is a huge growth rate taken place in both the
sectors population and workers in between 1991 to 2001 due to areal expansion of the
municipality from 20.98 sq. km to 49.26 sq. km.
The Ward Level:
In 1991 this municipality had only 14 wards within an area of 20.98 sq. km. There had
been administrative redistribution between 1991and 2001. In 1993 total area of this municipality
expanded to 49.26 sq. km by merging the surrounded Panchayat rural areas and number of wards
increased to 33. So it is difficult to compare the work participation rate of the wards with one to
one correspondence from 1991 to 2001 and 2011. On the other hand number to improve the
services ward number 2 and 18 were divided into two halves and number of wards increased
from 33 to 35 in 2009 which creates another problem to calculate the ward wise growth of work
participation rate from 2001 to 2011. To solve this problem total number of wards of the year
2001 i. e has been taken as the basis calculated the data.
Figure-7: Rajpur-Sonarpur Municipality: Ward level changing pattern of Work Participation Rate, 2001-11
Source: Census of India, 2001 and 2011
Ward level changing pattern of the work participation is shown by the figure-7. It
shows that the growth of work participation rate is not even all over the municipality. Highest
Journal of Xi'an University of Architecture & Technology
Volume XII, Issue II, 2020
Issn No : 1006-7930
Page No: 2987

Ward No
2001 2011
Main Marginal Main Marginal
1 31.69 4.14 34.78 6.35
2 32.56 1.68 31.19 9.62
3 31.50 3.37 32.94 6.36
4 29.30 5.58 35.40 7.21
5 29.17 3.27 34.33 6.62
6 27.81 3.66 31.32 5.42
7 26.60 4.68 31.87 3.17
8 28.79 3.34 32.09 9.66
9 30.65 2.70 30.71 5.17
10 28.85 6.05 31.51 7.65
11 30.65 2.41 35.06 6.40
12 29.93 1.85 32.09 6.41
13 28.78 4.15 32.03 4.43
14 29.74 4.29 31.54 10.60
15 27.64 3.66 31.58 8.95
16 27.76 4.67 31.98 6.45
17 28.12 4.69 28.25 5.95
18 30.01 1.95 33.83 4.44
19 30.64 3.86 30.45 5.81
20 30.11 3.59 33.42 3.54
21 32.77 3.06 34.60 2.75
22 29.34 4.62 35.02 8.21
23 29.09 3.73 31.08 10.55
24 28.53 8.50 29.40 7.99
25 23.10 6.09 27.48 6.02
26 32.60 3.02 32.48 7.14
27 33.04 3.54 32.69 10.05
28 33.95 3.25 33.11 5.97
29 28.13 6.20 32.91 9.21
30 25.67 9.11 31.02 11.66
31 29.03 4.23 31.29 5.73
32 24.88 9.47 31.10 5.70
33 30.31 5.78 30.57 9.16
Source: Compiled by author based on District Census Handbook, South 24 Parganas, 2001 &2011
2001 2011 Change
in Total WPR 2001-
11
Ward No
Male Female Total Male Female Total
1 53.45 17.20 35.83 58.86 23.38 41.13 5.29
2 54.64 12.98 34.24 61.40 20.05 40.81 6.57
3 55.55 12.66 34.87 60.59 17.47 39.30 4.43
4 54.65 13.08 34.89 61.66 23.19 42.61 7.72
5 52.68 10.89 32.43 59.05 21.83 40.95 8.52
6 51.81 10.00 31.47 58.12 14.20 36.74 5.27
7 51.57 9.30 31.27 55.56 14.16 35.04 3.76
8 53.64 9.31 32.13 59.40 23.56 41.75 9.61
9 55.30 9.73 33.35 57.00 14.44 35.88 2.53
10 53.14 14.81 34.90 57.89 19.91 39.16 4.26
11 51.92 11.56 33.06 59.70 22.74 41.46 8.40
12 51.07 10.56 31.78 57.62 19.63 38.50 6.72
13 54.05 10.52 32.93 57.70 15.02 36.46 3.53
14 54.62 12.78 34.03 61.77 21.70 42.14 8.11
15 52.47 9.36 31.31 59.72 21.15 40.54 9.23
16 53.42 10.68 32.44 58.87 18.26 38.43 6.00
17 54.05 11.01 32.81 54.35 13.82 34.21 1.40
18 54.06 9.26 31.97 60.91 15.53 38.27 6.30
19 55.43 13.17 34.51 58.29 14.43 36.26 1.75
20 54.32 12.43 33.70 58.72 15.16 36.96 3.26
21 57.05 13.86 35.83 59.08 14.82 37.35 1.52
22 56.60 9.74 33.96 63.09 22.00 43.24 9.28
23 55.02 9.12 32.81 60.64 22.12 41.63 8.82
24 55.67 17.02 37.03 57.43 16.90 37.39 0.36
25 42.15 9.60 29.19 45.86 17.42 33.50 4.31
26 56.05 14.70 35.62 56.65 22.31 39.62 4.00
27 55.79 16.46 36.57 58.64 26.71 42.73 6.16
28 58.15 14.87 37.20 59.61 17.84 39.09 1.89
29 54.14 13.39 34.33 61.37 22.75 42.12 7.79
30 56.76 11.80 34.78 63.10 21.76 42.68 7.90
31 55.40 10.59 33.25 58.06 15.05 37.02 3.77
32 56.05 11.81 34.35 59.68 13.42 36.80 2.45
33 56.74 14.32 36.09 58.31 20.07 39.74 3.65
Table-1: Rajpur-Sonarpur Municipality: Ward Wise
Workers Participation Rate by gender in %, 2001-11
Table-2: Rajpur-Sonarpur Municipality:
Ward Wise Workers Participation Rate
as main and marginal in %, 2001 & 2011
Journal of Xi'an University of Architecture & Technology
Volume XII, Issue II, 2020
Issn No : 1006-7930
Page No: 2988
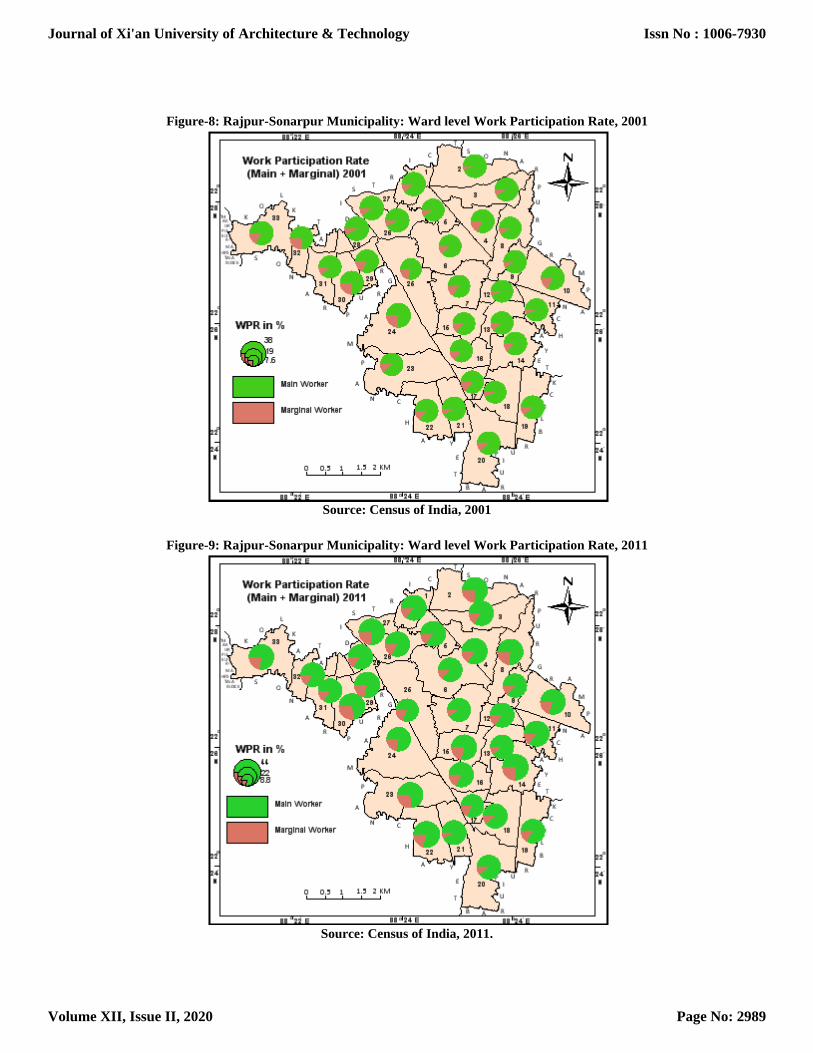
Figure-8: Rajpur-Sonarpur Municipality: Ward level Work Participation Rate, 2001
Source: Census of India, 2001
Figure-9: Rajpur-Sonarpur Municipality: Ward level Work Participation Rate, 2011
Source: Census of India, 2011.
Journal of Xi'an University of Architecture & Technology
Volume XII, Issue II, 2020
Issn No : 1006-7930
Page No: 2989
increase is seen along the Eastern railway line that is the northern, northeastern and eastern sides
of the study area. So that workers can easily communicate with other areas mainly with the
megacity. Work participation rate increased more than 6 % in all these areas between the year
2001 and 2011 (see Table-1). On the other hand work participation rate increase below 3% in the
border areas of Kolkata because this rate was already high in all those areas in 2001. Due to the
absence of infrastructural facilities, poor transportation network and different local problems
work participation rate increase less in the southern part of the study area.
From the ward level analysis of main and marginal work participation rate of the year
2001 and 2011 in the study area it is found that most of the workers involved as main workers in
both the years (Figure-8 & 9). Percentage of workers as marginal and main to the total
population has increased near about at the same rate in the most parts of the study area. In 2001
highest rate of main and marginal workers participation was 33.95% in ward no 28 and 9.47% in
ward no 32 respectively. Both the wards are located at the border areas of Kolkata. In 2011 ward
no 4 and 30 ranked first in terms of main work participation rate i.e. 35.4% and marginal work
participation rate i.e. 11.66% respectively. Between 2001 and 2011 main work participation rate
increased more than 5% in the wards no 4, 5, 7, 22, 30, and 32. On the other hand negative
growth has been taken place in ward no 2, 19, 26, 27 and 28. In terms of marginal work
participation rate ward no 2, 8, 14, 15, 23 and 28 performed better than the other wards (see
Table-2).
Occupational Diversification:
It is important to identify the sectoral distribution of workers to represent the mobility
of the economy in any area. There are four main categories of workers i. e cultivators,
agricultural labourers, household industrial workers and other workers. Almost 2 to 3 decades
ago main economic activity of Rajpur-Sonarpur Municipality was agriculture. Huge area was
under paddy cultivation. A large number of people were engaged as main or marginal workers in
agriculture. But after 1980’s the process of urbanization at the adjacent rural areas was so rapid
that makes changes in land use and land cover of the study area tremendously. Agricultural land
is the prime victim of the process of land transformation in the study area.
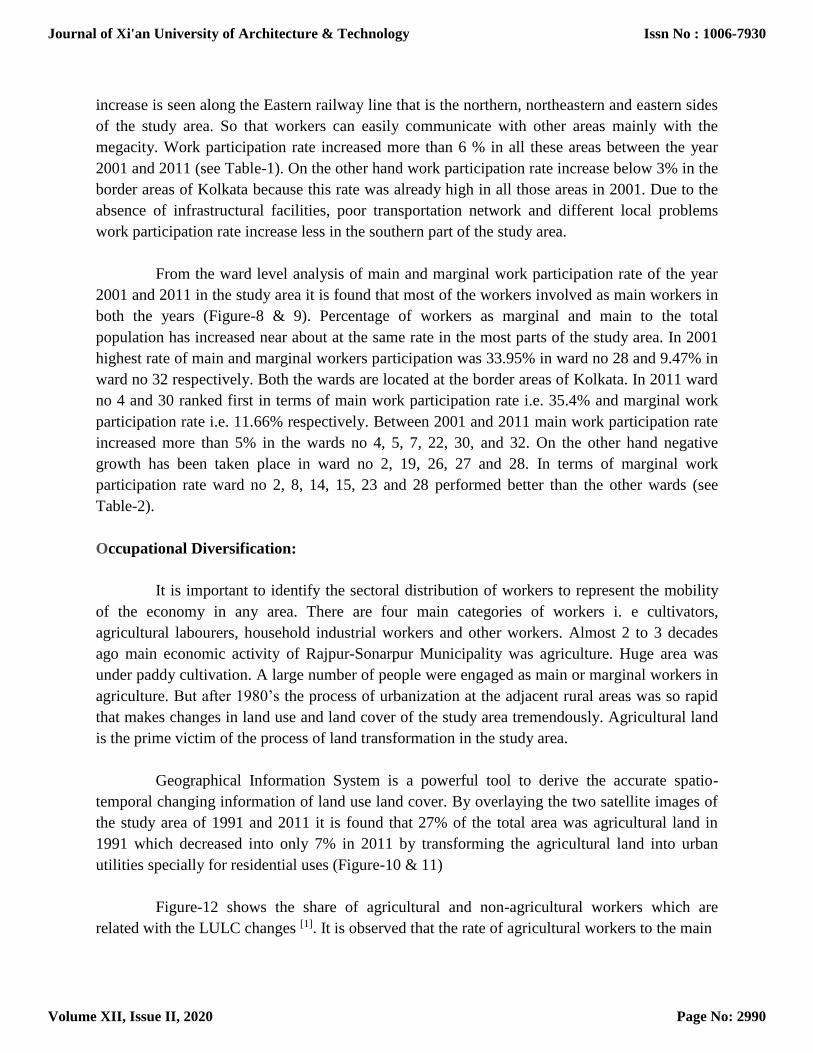
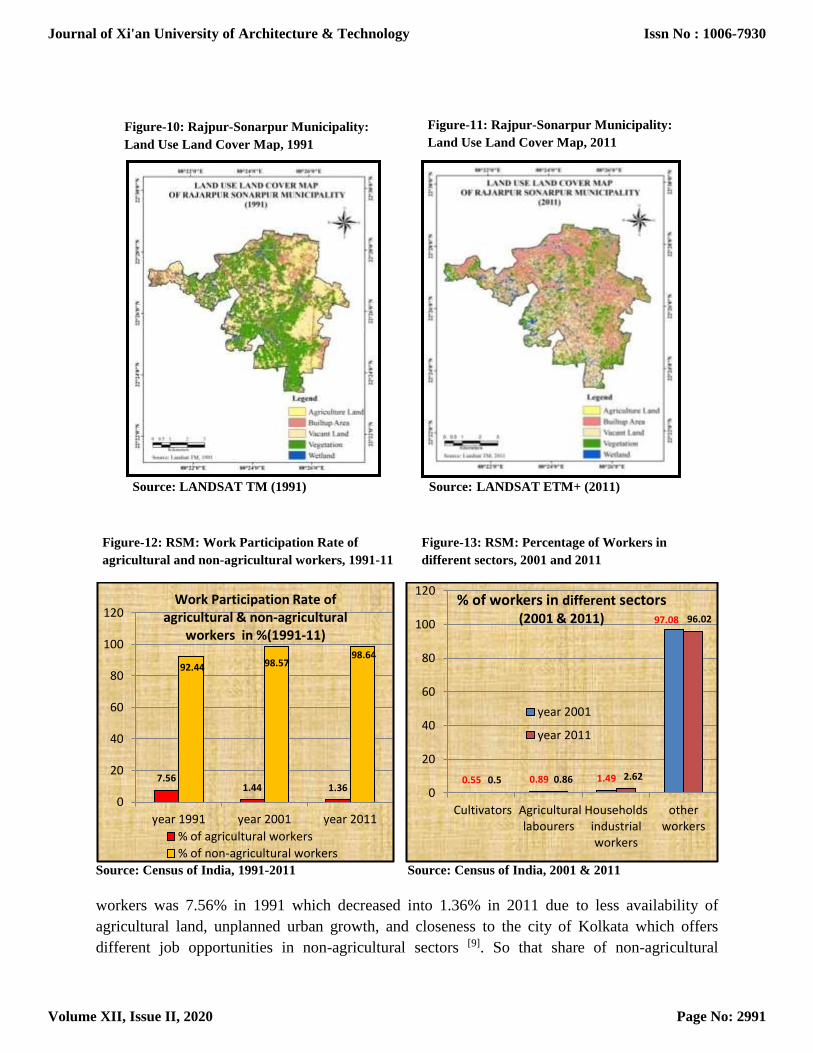
Geographical Information System is a powerful tool to derive the accurate spatio-
temporal changing information of land use land cover. By overlaying the two satellite images of
the study area of 1991 and 2011 it is found that 27% of the total area was agricultural land in
1991 which decreased into only 7% in 2011 by transforming the agricultural land into urban
utilities specially for residential uses (Figure-10 & 11)
Figure-12 shows the share of agricultural and non-agricultural workers which are
related with the LULC changes [1]. It is observed that the rate of agricultural workers to the main
Journal of Xi'an University of Architecture & Technology
Volume XII, Issue II, 2020
Issn No : 1006-7930
Page No: 2990
Source: LANDSAT TM (1991) Source: LANDSAT ETM+ (2011)
Source: Census of India, 1991-2011 Source: Census of India, 2001 & 2011
workers was 7.56% in 1991 which decreased into 1.36% in 2011 due to less availability of
agricultural land, unplanned urban growth, and closeness to the city of Kolkata which offers
different job opportunities in non-agricultural sectors [9]. So that share of non-agricultural
7.561.44 1.36
92.44 98.5798.64
0
20
40
60
80
100
120
year 1991 year 2001 year 2011
Work Participation Rate of agricultural & non-agricultural
workers in %(1991-11)
% of agricultural workers
% of non-agricultural workers
0.55 0.89 1.49
97.08
0.5 0.86 2.62
96.02
0
20
40
60
80
100
120
Cultivators Agriculturallabourers
Householdsindustrialworkers
otherworkers
% of workers in different sectors (2001 & 2011)
year 2001
year 2011
Figure-12: RSM: Work Participation Rate of
agricultural and non-agricultural workers, 1991-11 Figure-13: RSM: Percentage of Workers in
different sectors, 2001 and 2011
Figure-10: Rajpur-Sonarpur Municipality:
Land Use Land Cover Map, 1991
Figure-11: Rajpur-Sonarpur Municipality:
Land Use Land Cover Map, 2011
Journal of Xi'an University of Architecture & Technology
Volume XII, Issue II, 2020
Issn No : 1006-7930
Page No: 2991

workers increased from 92.44% to 98.64% between 1991 and 2011 based on the same reasons. If
we consider the pattern of workforce participation rate in non-agricultural sectors it is to be
found that most of the part is moving towards unorganized and informal sectors [15].
Negative changes have seen in the percentage of cultivators and agricultural labourers
and other workers (Figure-13) between 2001 and 2011 in the study area. Development of
Calcutta Leather Complex, Bantala and Special Economic Zone accelerated the industrial growth
which increased the percentage of workers in households industry from 1.49% to 2.62% to the
total workers over the decade.
Figure-14 & 15 show the percentage of workers engaged in different sectors at ward
level that reflected the similar result to the municipality. Share of cultivators and agricultural
labourers and other workers to the total workers fall in all over the municipality between 2001
and 2011 except few wards. Only the percentage of household industrial workers increased in all
over the area except ward no. 3, 12, 13, 25 and 33. It increased from 0.38% in ward no. 24 to
5.61% in ward no 19 (see Table-3). Except industrial growth also being well connected through
roads and railways with Kolkata and other parts of the district provides better marketing channels
for household industrial products.
Causes of economic changes as a part of the social change:
From the perception study of the employer and employed judging their real life status,
it is evident that youths of this generation are failing to keep away themselves out of the impact
of engrossing consumerism, moreover dismantling family structure, income insecurity, huge
competition for jobs have been keeping away these youths to pursue long term future plans and
goals. These actually collectively leads to the engagement of increasing number of middleclass
and lower middleclass youths in the secondary and tertiary sectors that demands multitasking
jobs. It actually validates the macroeconomic concepts of the shadow of vicious cycle of poverty.
Overall employment is increasing along with literacy rates. But, the striking features is
that most part of the earning are used for their daily needs and savings is very meager amount
that is actually manifested in terms of production, development and sustainability of their
standard of living as the escape from the marginality seemed far away due to limitations of
knowledge and training access for this generation.
Increasing population has widened the gap between the demand and supply of land.
Rapid and unplanned urban growth consumes most of the agricultural land in the study area. Not
only that low agricultural output motivates the farmers to sell their agricultural lands to the
property dealers, developers, industrialists, Government etc. Farmers not only lost their fertile
agricultural assets but also lost their livelihood. There was occupational shift as cultivators or
Journal of Xi'an University of Architecture & Technology
Volume XII, Issue II, 2020
Issn No : 1006-7930
Page No: 2992
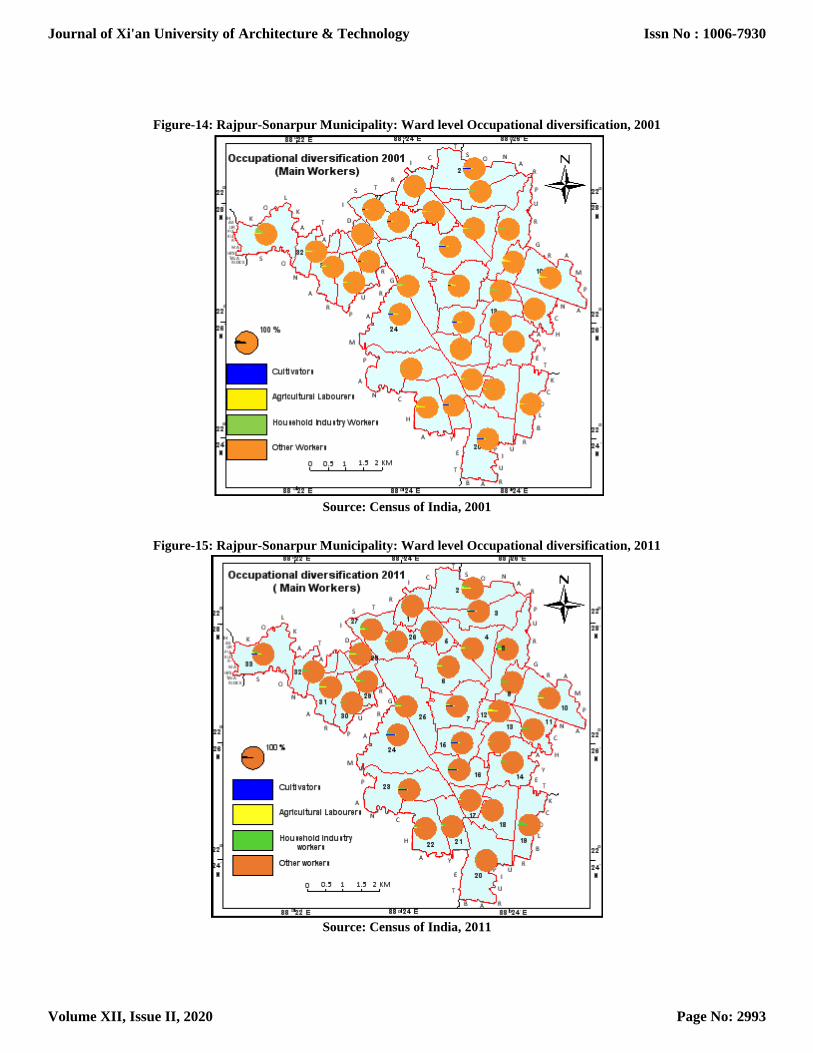
Figure-14: Rajpur-Sonarpur Municipality: Ward level Occupational diversification, 2001
Source: Census of India, 2001
Figure-15: Rajpur-Sonarpur Municipality: Ward level Occupational diversification, 2011
Source: Census of India, 2011
Journal of Xi'an University of Architecture & Technology
Volume XII, Issue II, 2020
Issn No : 1006-7930
Page No: 2993

Table-3: Rajpur-Sonarpur Municipality: Occupational diversification of main workers, 2001 & 2011
Ward No
Cultivators Agricultural Labourers Household industries Other services
2001 2011 2001 2011 2001 2011 2001 2011
1 0.47 0.52 0.23 0.22 0.33 1.30 98.98 97.95
2 0.74 0.35 1.50 1.83 0.83 3.91 96.93 93.90
3 0.46 0.92 1.02 1.35 1.80 1.57 96.72 96.16
4 0.13 0.50 0.30 0.76 0.53 2.30 99.04 96.44
5 0.17 0.24 0.13 0.15 0.67 1.32 99.02 98.29
6 1.54 0.59 2.18 1.53 1.39 2.18 94.88 95.70
7 1.46 1.59 2.34 1.51 0.59 1.19 95.61 95.71
8 0.53 0.46 0.46 0.91 2.17 5.61 96.84 93.01
9 0.21 0.14 4.52 0.21 0.45 2.98 94.82 96.68
10 0.62 0.50 2.61 0.76 0.74 1.93 96.04 96.81
11 0.20 0.29 0.31 0.34 0.61 2.82 98.88 96.55
12 0.63 0.37 0.17 3.00 3.25 1.36 95.95 95.27
13 0.00 0.11 0.26 0.84 1.82 1.19 97.92 97.86
14 0.14 0.31 0.11 0.39 0.93 2.62 98.83 96.68
15 0.63 0.67 1.13 0.67 1.17 2.42 97.07 96.24
16 0.34 0.40 0.17 0.52 1.07 2.58 98.42 96.51
17 0.36 0.88 0.47 0.29 0.94 1.86 98.23 96.96
18 0.22 0.10 0.51 0.37 1.38 1.46 97.89 98.07
19 0.13 0.11 0.30 0.16 0.50 6.11 99.07 93.62
20 1.08 0.42 0.70 0.79 1.00 1.92 97.22 96.87
21 1.88 0.90 0.30 0.71 1.09 3.44 96.73 94.96
22 0.49 0.67 2.09 0.98 1.35 1.97 96.06 96.39
23 0.48 0.80 0.48 0.96 1.46 2.42 97.59 95.81
24 0.43 0.77 1.25 0.65 3.59 3.96 94.73 94.61
25 0.92 0.60 1.20 1.17 3.85 3.14 94.02 95.09
26 0.52 0.81 0.16 0.42 1.21 1.28 98.11 97.49
27 0.36 0.52 0.21 0.69 0.33 4.18 99.09 94.61
28 0.32 0.29 0.00 0.44 1.00 2.63 98.68 96.64
29 0.31 0.31 0.03 1.36 1.28 3.90 98.37 94.42
30 0.29 0.55 0.29 0.46 1.28 2.21 98.13 96.78
31 0.90 0.36 0.94 1.07 1.58 1.65 96.58 96.92
32 0.23 0.23 0.51 0.43 2.24 2.46 97.01 96.88
33 0.80 0.71 1.95 1.68 6.94 3.45 90.32 94.15
Source: Compiled by author based on District Census Handbook, South 24 Parganas, 2001 &2011
agricultural labourers from agriculture to non-agricultural activities. Elevated land prices have
further limited their ability to acquire extra commercial space. They are progressively getting
involved in different secondary and tertiary activities.
Journal of Xi'an University of Architecture & Technology
Volume XII, Issue II, 2020
Issn No : 1006-7930
Page No: 2994

On the other hand excessive in-migration changes the scenario of occupational
structure. Immigrants both from the overcrowded city of Kolkata and peripheral rural areas
engaged in different non-agricultural activities are settled here changed the actual data of
occupational structure in the study area.
Conclusion:
From the study it is observed that overall dependence on agriculture is decline largely
in the study area. Of course, the extent of changes is not even all over the municipality.
Expectedly as an urban unit most of the workers are involved in non-agricultural sectors for their
livelihood. Lack of agricultural land, proximity and well connectivity with the city of Kolkata
and peripheral blocks of the districts through roads and railways, location within KMDA etc. are
the main reasons of dependence on non-agricultural activities of the residents in the study area.
Migrated people from both the overcrowded city of Kolkata and southern part of Sundarbans not
only brought changes in occupational structure but also changes in settlement pattern, structure
and size that subsequently rapidly changing the skyline of the outer fringe of the study area.
According to census data increase of work participation rate in non-agricultural activities is more
in other sector while increase in household industry workers is nominal. This rapid occupational
diversification towards non-agricultural activities mainly other sectors is identified as a new
phenomenon. But the quality of the workers in terms of production, development, sustainability
of their standard of life is not improved at the same rate of quantity of employment.
References:
1. Akanda, M. A. I. (2005). Structural Changes in Land Use and Rural Livelihoods of
Bangladesh. Pakistan Journal of Social Sciences, 3(1), 175-181.
2. Bagchi, A. K., Panchanan Das, S. K. Chattopadhyay (2005). Growth and Structural
Change in the Economy of Gujarat, 1970-2000, Economic and Political Weekly,
Volume 40, No. 28, pp. 3039-3047.
3. Banu, S. (2015).Changing Occupational structure and Economic Condition of Farm
laborers in India: A Study, Socio-economic voices. www.indiastat.com May - June,
2015.
4. Clerk, C. (1940). The Condition of Economic Progress. London, Macmillan.
5. Deshmukh. M and Khadke .P (2015). Study of Occupational structure in Nanded
City, An International Peer Reviewed and Referred Journal, Scholarly Research
Journal for Humanity Science and English Language, ISSN: 2348-3083) Vol.2/10,
Page 2620-2626.
6. District Census Handbook, South 24 Parganas (1971-2011). Census of India.
Journal of Xi'an University of Architecture & Technology
Volume XII, Issue II, 2020
Issn No : 1006-7930
Page No: 2995
7. District Human Development Report, South 24 Parganas (2009). Development and
Planning Department Government of West Bengal.
8. Khadke A. (2019). Changing Occupational Structure in Aurangabad City,
International Journal of Research in Engineering, IT and Social Sciences, ISSN
2250-0588 Volume 09 Issue 03 pp. 25-32
9. Khalil, K. (2008). Major Challenges of Iranian Rural Communities for Achieving
Sustainable Development, American Journal of Agriculture and Biological Science,
3(4):724-728. DOI: 10.3844/ajabssp.2008.724.728.
10. Kumar, A (2018). Trends of Occupational Pattern in India: An analysis, International
Journal of Research in Social Sciences, Vol. 8 Issue 1, January 2018, ISSN: 2249-
2496
11. Mondal, P., Mistri T (2018). Urban growth and its impact on land use pattern of
Rajpur-Sonarpur municipal area, South 24 Parganas, West Bengal. In Biswas. B
(Ed.), Discourses on Human Nature Interaction in Eastern India (pp.229-242).
Kolkata, India: Rhito Prakashan.
12. Sarkar, C (2017). Urban Functional And occupational Structure In North 24 Parganas
District, West Bengal, International Journal Of Recent Research In Social Sciences
And Humanities, Vol. 4, Issue 1, Pp: 1-14
13. Singh R.N (1981).Occupational structure of Urban Centres of Eastern Uttarpradesh:
A Case study of Trade and Commerce, The Indian Geographical Journal Vol.56,
No.1& 2. Pp. 55-62.
14. Surwase, K (2018). A Geographical Analysis of Occupational Structure of Urban
Centers in Satara District, American International Journal of Research in Humanities,
Artsand Social Sciences, ISSN (Print): 2328-3734, ISSN (Online): 2328-3696.
15. Unni, Jemol and Rani (2008). Flexibility of Labour in Globalizing India: The
Challenge of Skills and Technology, Tulika Books, New Delhi.
https://www.google.com/url?sa=t&souce=web&rct=j&url=https://www.reserchgate.net/publication/326376
68....
https://www.google.com/url?sa=t&source=web&rct=j&urL=https://www.indiastat.com/SOCIO_PDF/120/f
ultext.pdf&ved
https://www.google.com/url?sa=t&souce=web&rct=j&url=https://www.jstor.org/stable/pdf/22
25658.pdf&ved
http://www.undp.org/content/dam/india/docs/hdr_south24_parganas_2009_full_report.pdf
http://www.ubplan.gov.in/docs/Handbook_2001/24Pgs(S)1.pdf
Journal of Xi'an University of Architecture & Technology
Volume XII, Issue II, 2020
Issn No : 1006-7930
Page No: 2996