Embed Size (px)
Citation preview

ROLE OF INSULATION IN
ENERGY CONSUMPTION IN COMMERCIAL
AND OFFICE BUILDINGS
Submitted by
JAYANTHI.R.V
In fulfillment of the requirements of the degree of
MASTER OF TECHNOLOGY
IN
CONSTRUCTION ENGINEERING AND MANAGEMENT
Under the supervision of
Prof. B. Bhattacharjee (IIT, Delhi)
&
Prof.J.L.Scartezzini (EPFL,Switzerland)
DEPARTMENT OF CIVIL ENGINEERING
INDIAN INSTITUTE OF TECHNOLOGY, DELHI
SOLAR ENERGY & BUILDING PHYSICS LABORATRY
ECOLE POLYTECHNIQUE FEDERALE DE LAUSANNE
MAY 2007
Acknowledgement
I want to express my gratitude to my parents, staff and friends for their immense support
and belief given throughout this professional course period that has made this final thesis
possible.
I am deeply indebted to my guide Dr. B.Bhattacharjee, Professor, Department of Civil
Engineering, Indian Institute of Technology, Delhi for his immense support and his
valuable guidance given in shaping the ideology and the process, both during my thesis
session and throughout my professional education. I am extremely grateful for his
valuable time and effort during the course of my project.
I wish to express my sincere gratitude to Jean Louis Scartezzini Professor, Solar
energy and Building Physics Laboratory, Ecole Polytechnique Federale De
Lausanne, Switzerland, for his valuable time and guidance during the course of my
project. I also thank Stephane Cithrelet, for his valuable input, and for providing his tool
to use in my analysis.
I’m very thankful to Dr. K.N.Jha, for his immense support and valuable time spent during
this professional course which has shaped a different perspective towards this profession.
I would like to express my sincere acknowledgement to Mr. Rajan Venkateshwaran,
Chief Architect, M/s. Larsen & Toubro limited, Mr. Venkateshwaran, M/s. Ascendas
India Pvt. Ltd., for their support and kind cooperation.
I am very thankful to Bhulu sir, Research scholar, for his kind advices, and support
during this course period. I would also like to thank my friends at IIT Delhi and LESO,
EPFL for their continous support and timely help.
This would be incomplete without my sincere expression of gratitude to this noble field
of powerful creation that transforms stone to building; this process has transformed
my perception of life, MY SALUTATIONS.
(Jayanthi.R.V) Date: 25.05.2007

Abstract
Buildings, as climate modifiers, are usually designed to shelter occupants and
achieve thermal comfort in the occupied space backed up by mechanized cooling and
heating systems as necessary. This heating and air-conditioning load can be reduced
through many means; notable among them is the proper design and selection of building
envelope components. The effect on reduction in energy consumption by using insulation
materials is the major thrust of this project. The life cycle energy cost of a building has
been realized to be critical to the energy consumption in buildings, which is reaching a
serious proportion, as the energy needs have to be met for the fast growing population
and also to sustain the development. The life cycle cost of a building, includes the initial
cost, energy cost, other operation and maintenance cost. The effect of increase in the
initial energy cost, constituted by the insulation materials to the energy savings that can
be obtained, is studied by simulating two case buildings chosen, using eQUEST
simulation tool. Parametric studies were carried out with different insulation materials at
different climatic conditions in Indian context. Correlation between the resistance and
thickness of the insulation material, to the percentage of energy savings were found to
obey a logarithmic relationship. The life cycle energy cost analysis showed that energy
savings up to 47% could be achieved during a 50 year life span of a building, with a very
negligible increase in embodied energy due to the insulation materials.

Table of Contents
Contents Page No
Certificate
Acknowledgement
Abstract
Table of Contents
List of Tables
List of Figures
List of plates
List of Notations
CHAPTER – 1 INTRODUCTION 1 - 7
1.1 Constructive solutions of the past 1
1.2 Office and Commercial buildings of present 3
1.3 Need for Building Assessment 4
1.4 Objectives of the present project 5
1.5 Scope and Work Methodology of the project 6
CHAPTER – 2 LITERATURE REVIEW 9-16
2.1 Factors affecting energy consumption 9
2.2 Thermal insulation 13
2.3 Thermal mass and storage 14
2.4 Tools available for Assessment of buildings and their comparisons 15
2.5 eQUEST Simulation tool 15
CHAPTER – 3 CASE STUIES & SIMULATIONS 17-41
3.1 The INFOTECH building 17
3.1.1 Building description 17
3.1.2 Space summary 20
3.1.3 Building envelope components 20
3.1.4 Computer Model 22
3.1.5 Simulation output 26
3.2 The ASCENDAS building 29
3.2.1 Building description 29
3.2.2 Space summary 31
3.2.3 Building envelope components 31
3.2.4 Computer Model 33
3.2.5 Simulation output 37
3.3 Validation of the Computer model developed in eQUEST 40
CHAPTER – 4 LIFE CYCLE ENERGY CALCULATION 43-55
4.1 Embodied energy calculation 43
4.1.1 Energy in building materials 43

4.1.2 Energy in transportation of building material 44
4.1.3 Energy in Flooring & roofing systems 45
4.2 Insulation materials 48
4.3 Operating Energy 49
4.4 Life cycle energy calculation 50
4.5 Life cycle impact assessment 52
CHAPTER – 5 ANALYSIS & DISCUSSIONS 57-70
5.1 Comparison of Model with ECBC & ASHRAE standards 57
5.2 Analysis of Building envelope components in Energy Consumption 59
5.2.1 Role of insulation in energy consumption 59
5.2.2 Role of Thermal mass and Storage 63
5.2.3 Role of Windows in energy consumption 64
5.3 Evaluation of Life Cycle Energy 66
5.3.1 Embodied energy of insulation materials 67
5.3.2 Comparison of saving from different Insulation material 69
CHAPTER – 6 CONCLUSIONS & STRATEGIES 71-72
References 73-74
Appendix 75-85
Appendix A – Comparison of Simulation tools 75
Appendix B – Insulation material properties 85
Appendix C – Input data in eQUEST 89

List of Tables
Table No Name Page No.
Table 3.1 Summary of the building use spaces of
INFOTECH building 20
Table 3.2 Details of window area in the fazard of the
INFOTECH building. 21
Table 3.3 Details of HVAC systems. 22
Table 3.4. Occupancy density in different zones. 24
Table 3.5 Lighting power density at different zones. 25
Table 3.6 Summary of the building use spaces of
ASCENDAS building. 31
Table 3.7 Glass details used in the fazard of
ASCENDAS building. 32
Table 3.8 Specifications of glass types 32
Table 3.9 Details of HVAC systems. 33
Table 3.10 Occupancy density in different zones. 35
Table 3.11 Lighting power density at different zones. 36
Table 3.12 Actual and Simulated values of monthly
energy consumption, year 2006 40
Table 4.1 Energy in basic building materials 44
Table 4.2 Energy in transportation of building materials 44
Table 4.2. Energy in mortars 45
Table 4.4 Energy in different floor/roofing systems 45
Table 4.5 Embodied energy for INFOTECH building
during its life span. 46
Table 4.6 Embodied energy of ASCENDAS building
in its life span 46

Table No Name Page No.
Table 4.7 Embodied energy of different insulation
materials of varying thickness 49
Table 4.8 The total energy consumed during the life
span of INFOTECH building. 50
Table 4.9 The total energy consumed during the life
span of ASCENDAS building 51
Table 5.1 Insulation materials, their properties and the
corresponding energy savings. 62
Table 5.2 Percentage of energy savings due to parameters
of window. 65
Table 5.3 percentage of energy savings due to various
parameters of glass type. 65

List of Figures
Figure No Name Page No.
Figure 1.1 Clerestory of the hypostyle hall of the
AMMON temple, Karnak 2
Figure 2.1 Energy consumed in the life of a building
(source: UNEP) 10
Figure 2.2 Shares of different end-use purposes in some countries 12
Figure 2.3 Status of Building standards 12
Figure 3.1 Exterior 3-d View of INFOTECH building 17
Figure 3.2 Plan of INFOTECH Building
(typical open office plan) 18
Figure 3.3 False ceiling Plan of typical office floor,
INFOTECH Building 18
Figure 3.4 Different views of INFOTECH Building 19
Figure 3.5 Roof slab section detail, Section of external wall 20
Figure 3.6 Zoning done in a typical floor in INFOTECH building 22
Figure 3.7 Computer model in eQUEST of INFOTECH Building 23
Figure 3.8 Occupancy schedule during a typical working day 24
Figure 3.9 Lighting profile of a typical working day 25
Figure 3.10 Exterior 3-d view of ASCENDAS building 29
Figure 3.11 Plan of a typical office floor in ASCENDAS building 20
Figure 3.12 Exterior and interior views of ASCENDAS building 30
Figure 3.13 Section of exterior wall 31
Figure 3.14 Zoning done in a typical floor in ASCENDAS building 33
Figure 3.15 Computer model in eQUEST of ASCENDAS Building 34
Figure 3.16 Occupancy Schedule during a typical working day 35
Figure 3.17 Lighting profile of a typical working day 36
Figure 3.18 Comparison of building simulation result and
actual billing data 40

Figure No Name Page No
Figure 3.17 Comparison of the actual billing data and
building simulation results. 41
Figure 4.1 Initial Embodied energy of INFOTECH building 46
Figure 4.2 Initial Embodied energy of ASCENDAS building 47
Figure 4.3 Embodied energy of building materials used
in the envelope components of ASCENDAS building 47
Figure 4.4 The life cycle energy of INFOTECH building 51
Figure 4.5 The life cycle energy of Ascendas building 52
Figure 4.6Life cycle impact assessment of Materials and Energy 53
Figure 4.7 Life cycle impact assessment of the building elements 53
Figure 4.8 Life cycle impact assessment of building materials 54
Figure 4.9 Life cycle impact assessment of the building elements 55
Figure 4.10 Life cycle impact assessment of building materials 55
Figure 5.1 Comparison of Energy Consumption with
ASHRAE standard (INFOTECH building) 57
Figure 5.2 Comparison of Energy consumption with
ECBC standards (INFOTECH building) 58
Figure 5.3 Comparison of Energy consumption with
ECBC standards (ASCENDAS building) 58
Figure 5.4 Energy savings after application of insulation material
on the exterior wall surface 60
Figure 5.5 The energy savings in reference with the thickness
of insulation 61
Figure 5.6 Effect of increase in thermal capacity to the percentage
of energy savings 63
Figure 5.7 Overall thermal u-value of wall to the percentage of
energy savings 64

Figure No Name Page No
Figure 5.8 Effect of Parameters of glass, Shading coefficient
and Visual light transmittance 66
Figure 5.9 Embodied energy of the insulation materials of
different thickness 67
Figure 5.10 Life cycle energy consumption of INFOTECH building 68
Figure 5.11 Life cycle energy consumption of ASCENDAS building 68
Figure 5.12 Embodied energy of the building materials and
the additional insulation material 69
Figure 5.13 Comparison saving for insulation material studied 69
Figure 5.14 Energy Savings after the application of insulation
materials of different thickness 70

List of Plates
Plate No Name Page No.
Plate 3.1 Annual energy consumption by endues
under various parameters 26
Plate 3.2 Simulation results showing annual electrical
energy consumption under various parameters
for the year 2006 27
Plate 3.3 Monthly Electric Peak loads for the year 2006 28
Plate 3.4 Annual energy consumption by endues under
various parameters 37
Plate 3.3.5.2 Simulation results showing annual electrical
Energy consumption under various parameters
for the year 2006 38
Plate 3.5. Monthly Electric Peak loads for the year 2006 39

xii
Summary of the contents of the report
Chapter 1 presents the ingenious constructive solutions developed in the past that
could fulfill several assignments simultaneously. The construction industry at present
has brought forward new architectural concepts, which need performance assessment
of buildings. It also presents the overview on the objectives, scope and work
methodology of the project.
Chapter 2 reports different potential approaches to assess the buildings performance.
This chapter analyses the capabilities of available integrated simulation programs,
which leads to the conclusion to choose one of the software to perform the assessment
of the building performance (thermal, lighting, ventilation), the occupant comfort.
Chapter 3 focuses on the model developed in the software for existing buildings, with
sufficient information to support the software, and its assessment. The model developed
is simulated in accordance to the actual materials used in the construction of the
building with the actual climatic file referring to the original location of the buildings.
Further, the simulated output values are compared with the actual data collected, to
assess the capability of the software used.
Chapter 4 presents the life cycle energy calculation done for both the case buildings,
which specifies the embodied energy of the building envelope components and the
different insulation materials.
Chapter 5 presents the analysis done with the same buildings, by varying different
parameters at different climatic regions in India. The aim is to check whether
insulation material is the only key factor in energy consumption of the buildings. It
also presents the evaluation of the life cycle energy of the buildings pertaining to the
embodied energy and the energy consumed every year during its entire life span. The
results of all the parametric studies and life cycle energy costing done are discussed.

xiii
Chapter 6 presents the conclusions derived from the analysis performed in the previous
chapter and strategy developed to minimize the sum total of energy consumed during
the entire life span of the building.

1
CHAPTER – 1 INTRODUCTION
Every major civilization has developed an architecture with characteristic lines
as specific as its language, costumes or folklore. For thousands of years, the humans
has developed architectural concepts to provide acceptable comfort in a specific
environment, taking into account local climatic conditions, available for construction
materials, as well as cultural and religious aspects.
With modern architecture an important concern of the scientific community, is to
resolve specific problems the building industry is confronted with. But the necessity for
an efficient construction industry has brought forward new architectural concepts,
which need performance assessment of buildings. This chapter presents several
ingenious systems developed through time that could fulfill several assignments and
illustrates the consequences resulting of a lack of building assessment in appraising
the building performance in modern architecture. It also presents the objectives, Scope
and work methodology of this project.
1.1 CONSTRUCTIVE SOLUTIONS OF THE PAST
Vernacular architecture, which can be regarded as a sustainable and natural
contract between man and nature, is the fruit of imagination, years of evolution and
climatic requirements. It was limited to the local materials and techniques available at a
given time. Transport was limited, which reduced the use of imported materials. This led
to constructive concepts that took into account not only occupant comfort but also the
local resources and the environmental impacts of the use of the construction. Vernacular
architecture was able to provide many concepts to maintain comfortable conditions while
striking a balance with the environment as it can be illustrated with the following
examples.
Providing daylight and ventilation simultaneously was an important issue, which
was solved in different ways. In ancient Egyptian period (2635-2155BC), it was not
conceivable to bore through thick temple roof and walls. To solve the problem, small
slots were pierced at the junction of the flat roof and the temple wall (sphinx temple).
Because of their size and location, these slots faintly lighted the upper part of the walls.

2
In small temples or in dwellings, where the roof was thinner, small apertures were bored
through the roof-terrace, to improve day lighting and ventilation. The new empire (1550-
1080BC) found a way to improve the efficiency of these apertures, by taking into
advantage of the level difference between roof-terraces. For instance, in the Ammon
temple in Karnak, louvers were pierced into vertical slabs (walls) to provide better
ventilation and allow the light to enter obliquely, which avoided glare problems as shown
in figure 1.1.
Figure 1.1: Clerestory of the hypostyle hall of the AMMON temple,
Karnak.(source: Moore F)

3
The summerians (Mesopotamia, 3000-2000BC) are at the origin of several of the
most outstanding human inventions, such as the wheel, the cuneiform writing or
architectural concepts such as the vault. To avoid, overheating, they covered roofs with
about 1 meter of earth. But the load induced by the weight on the roof reduced its span,
because palm-tree was used for the structure. Therefore, houses were narrow and long,
which complicated their natural ventilation. Thus, the occupants comfort was directly
related to the structure. The evolution of this roof-terrace concept led to the famous
suspended gardens of Babylon. They were located near wells, from which an astute
system raised water to the roof construction for the irrigation of the gardens. Water
evaporation reduced the ambient temperature and the roof cover reduced house
overheating.
For many centuries, vernacular architecture has been seen as the product of an
evolutionary process in which most suitable forms have survived by designing
comfortable architectural spaces that respect local climatic conditions.
In the evolution of time, the occupants’ necessity for buildings serving for their specific
purpose has been evolved. Among them Office and commercial buildings have more
significance in the present.
1.2 OFFICE AND COMMERCIAL BUILDINGS OF THE PRESENT
Office buildings provide the working environment for a large and increasing
proportion of the Indian workforce. There are considerable diversity in the type and
location of buildings used as offices throughout India. The principal requirement of office
buildings is to provide comfortable, healthy and productive conditions for the workers.
However costs, both capital and running, play an increasingly important part in decision-
making for design, fitting out, etc. With increasing international concern about energy
use and its environmental consequences, another dimension is becoming increasingly
important, that of energy consumption in offices and the component production of carbon
dioxide, and other ways in which offices can affect local and global environments.
New buildings are frequently thought to provide more prestigious and efficient
offices than older buildings. There are basically two different approaches to achieving

4
good internal conditions in an office-using natural force as far as possible, or relying on
mechanical equipment. Natural methods include day lighting, thermal insulation, solar
gain, opening windows, solar shading, and free cooling using thermal mass. On the other
hand, modern offices in many countries are built to rely on artificial lighting, heating
cooling, and ventilation using mechanical equipment and sophisticated automatic control
systems, and this trend also affects refurbishment. The energy consumption of offices
with sophisticated mechanical systems is always many times higher than that of climate
respecting buildings which minimize such equipments by use of natural forces.
However it must be remembered that ‘comfort’ can be defined in a number of
ways and has different meanings to different people. Whilst an air-conditioned office can
provide temperatures within a closely defined range (typically 19 to 23degree
Celsius(66.2F to 73.4F), a naturally ventilated office will have much higher temperatures
in summer, though the effects of an open window and moving fresh air can make these
equally or more acceptable. Similarly, an artificial lit office with tinted windows to
reduce glare and solar gain will provide a consistent light level, but the changing light
levels and clear views from a day lit office may provide a more pleasant and stimulating
environment. Some research has demonstrated the importance to a person’s perceived
level of comfort, of individual control over the local environment, a concept becoming
known as ‘adaptive opportunities’.
To maintain external and visual comfort level there is a large amount of energy
need, in offices with sophisticated mechanical systems. Moreover, these buildings
demand energy in their life cycle, both directly and indirectly. Directly, for their
construction, operation (operating energy), rehabilitation and eventually demolition.
Indirectly through the production of materials they are made of and the materials
technical installations are made of (embodied energy). There has been always a need to
know the building performance in such cases during its life span, in its construction phase
and operation phase.
1.3 NEED FOR BUILDING ASSESSMENT
The building sector is responsible for a large share of the worlds total energy
consumption. The international Energy Agency (IEA 2005) estimates that buildings
5
account for 30-40% of the worldwide energy use, which is equivalent to 2500 Mtoe
(million tons of oil equivalent) of energy every year. Buildings are large users of
materials with a high content of embodied energy.
Energy is also used for heating, cooling, lighting, cooking, ventilation and so on during
the period that the building is in use. Over the years this adds up to significantly more
energy than is used for manufacturing building materials and for constructing the
building itself. In some of literatures, however, lowering the overall energy consumption
has a direct positive impact upon life cycle costs. For which, there is a need to assess the
performance of the building during its operation stage and at the construction stage.
1.4 OBJECTIVES OF THE PROJECT
As climate modifiers, buildings are usually designed to shelter occupants and
achieve thermal comfort in the occupied space backed up by mechanized cooling and
heating systems as necessary. Significant energy savings could be realized in buildings if
they are properly designed and operated. The energy consumed can be reduced through
many means: notable among them is the proper design and selection of building envelope
and its components. Studies have been carried out on the building envelope and its
components. The impact of operating temperature on the thermal performance of
insulation materials has been the subject of some studies. Optimization of insulation
thickness for building using life cycle costs has been discussed by T.M. Mahlia [1].
Performance characteristics of thermal insulation materials have been studied by Dr.
Mohammad [5].
Further, studies indicate that opportunities for energy efficiency in buildings, is
achievable by many means. The diversity of buildings and their distinct use imply major
differences of energy conservation models. No single legislative rule can be effective in
all case. The energy sources used, methods applied and equipment added are to be
tailored according to individual needs. The same applies to building codes, operation
guidelines and the monitoring of their implementation. There is no study made on the
relative importance of operating and embodied energy in a building life cycle, in specific

6
to Indian context, in office and commercial buildings, with the building codes taken into
account. Hence this study is focused towards the same with the following objectives:
1. To evaluate the role of thermal insulation in energy consumption in office and
commercial buildings.
2. To analyze the role of thermal mass and storage in relation with the energy
consumption of a building.
3. To evaluate the Life cycle energy of a building pertaining to the embodied energy
(pre-occupation) and the energy consumed every year (post occupation).
4. To prepare a strategy to minimize the sum total of the energy consumed during
pre-occupation and post occupation.
1.5 SCOPE AND WORK METHODOLOGY OF THE PROJECT
With the above objectives in consideration the project had been phased into two.
The first phase of the project is to choose appropriate software to perform the simulation
of namely two buildings. The second phase is to obtain a methodology or develop a
model to calculate the Life cycle energy cost of a building.
PHASE – I
In the first phase of the project work data on two buildings were collected, and the
simulation was performed for the same using the appropriate software. As the first step,
soft wares available for simulation were studied and an appropriate one for the same was
chosen. As the Second step data on the two buildings such as their plans, sections and
elevations and their actual energy consumption data was collected. As the third step the
chosen buildings was modeled and the simulation was performed for the same. In the
fourth step the results were compared with the actual data to validate the software chosen.
And in the fifth step simulations were performed with different insulating materials for
the same buildings, to analyze the fact that if insulation is the only key factor affecting
the energy consumption of these buildings.
PHASE - II
The second phase was focused on to obtain a methodology or develop a model to
evaluate the life cycle energy cost of the building. Life-cycle costing accounts for initial

7
cost, energy cost, other operating and maintenance cost (including labor), life of each
component forming the system; discount rate, inflation and escalation of some cost items
such as energy cost, and salvage value of each component when its life is expired. The
first two items dominate in our case. In the application of life cycle costing principle to
determine the role of insulation, to analyze if it is the key factor affecting the energy
performance, or is there other building systems that play an important role in minimum
performance, extensive examples of alternative insulating materials and systems of
different performance had to be simulated and their life cycle energy costs had to be
evaluated.
In summary, this chapter has shown that through time, architecture has
developed ingenious constructive solutions that could fulfill several assignments
simultaneously. The limitation of available materials and construction process was
compensated by long experience leading to a constructive balance between occupant
requirements and environmental impact. The significance of reducing the overall
energy consumption of a building necessitates the need for building performance
assessment and to analyze the factors affecting the energy consumption. This
complexity calls for to focus on the objectives of the project. The next chapter presents
the review of available tools for building performance assessment, and describes the
eQUEST simulation tool.

8

9
CHAPTER – 2 LITERATURE REVIEW
At all times, the analysis of physical phenomena was dependent on technical
developments and scientific knowledge. In the past, performance assessment relied on
thumb rules and hand calculation. At present, the advent of building simulation
programs has enabled non-trivial performance appraisals. The current generation of
application for the assessment of building performance ranges from simple
spreadsheets based on simplified calculation methods to advanced programs, which
allow the simulation of transient physical processes using complex numerical methods.
In general, these programs deal, however, only with a small of the overall problem.
Advanced architectural developments require an integrated approach to design. The
domains of heating, lighting, ventilation and acoustics, for example, are often closely
related and it is only by taking into account their interactions that a complete
understanding of building behavior can be obtained. This chapter begins with a
comparison of various methods developed to perform a multiple-view appraisal of
building performance. The chapter follows with an analysis of the different simulation
program types that support multiple-view assessment. Finally, the most common
simulation tools available on the market are compared.
Over the past 50 years, literally hundreds of building energy programs have been
developed, enhanced, and are in use throughout the building energy community. The
core tools in the building energy field are the whole-building energy simulation
programs that provide users with key building performance indicators such as energy
use and demand, temperature, humidity, and costs.
2.1 FACTORS AFFECTING ENERGY CONSUMPTION
Modern buildings consume energy in a number of ways. Energy consumption in
buildings occurs in five phases, as shown in figure 2.1.

10
Figure 2.1: Energy consumed in the life of a building (source: UNEP)
The first phase corresponds to the manufacturing of materials and a component, which is
termed, embodied energy. The second and third phases correspond to the energy used to
transport materials from production plants to the building site and the energy used in the
actual construction of the building, which are respectively referred to as grey energy and
induced energy. Fourthly, energy is consumed at the operational phase (operation energy),
which corresponds to the running of the building when it is occupied – estimated till 50
years. Finally, energy is consumed in the demolition process of buildings as well as in the
recycling of their parts, when this is promoted (demolition – recycling energy). The
major factors that affect the energy consumption of a building at the first four phases are:
a. Building envelope
The building wall is affected by all three heat transfer mechanisms; conduction,
convection, and radiation. The incoming solar radiation into the outer wall surface will be
converted to heat by absorption and transmitted into the building by conduction. At the
same time, convective thermal transmissions occurs from air outside of the building to
the outer surface of the wall and the inner surface of the wall to the air inside of the
building. It makes portion of heat gains from the outside of the building wall occurs and
by air leakage since the inner building area has lower temperature. K.S. Al-Jabri [ ] has
reviewed his research on use of insulating materials is not popular, despite their long term
financial benefit. His research is concerned with the development of light weight concrete
blocks for thermal insulation either by using different hole arrangements or by using
indigenous and by-product materials. T.Nussbaumer, as part of research programme on

11
“High performance Thermal Insulation in buildings and building systems” of IEA agency,
determined the thermal performance of vacuum-insulation panels applied to walls I
building constructions.
b. Building Materials
Y.G.Yohanis, in his studies [12] has concluded that initially embodied energy in a
building could be as much as 67% of its operating energy over a 25 year period. The
building materials used initially directly constitute to the embodied energy, which
includes extraction, processing, manufacture and transport of the materials and its
components. The relative significance of embodied energy forms a higher proportion of
the total amount of energy used over the lifetime of a building. Potential to reduce energy
consumption at the initial stages, in the materials selection plays a vital role.
c. Lighting systems
Reduction in energy use in one system can affect the energy use in another system.
In Bangkok, lighting savings lead to significant reductions in energy used for cooling and
ventilation systems [15]. Even in extreme cases of Sweden, commercial buildings enjoy a
net HVAC benefit from lighting savings. According to studies at Chalmers university,
typical modern Swedish buildings require cooling even at an out door temperature of -
10degree Celsius. This is because of considerable internal heat generated by people,
lighting and other energy-using equipment.
d. Energy supply systems
The operational energy normally accounts for the major part of the total energy
used in buildings [12]. Therefore it is of great importance to have energy efficient system,
that which provides good indoor conditions without consuming too much energy. These
can include energy saving appliances, lighting controls and thermostats, activated blinds,
fans, efficient heating systems and cooling systems. It should be noted that energy
systems are usually designed for 20 to 40 years and if they are not chosen carefully, the
potential to change to a different energy source may be lost for that period.
The pattern of the energy use of a building first and foremost depends on the
building type and the climate zone where it is located. In addition, the level of economic
development in the area is also influential in shaping the energy use-pattern. Shares of

12
different energy uses during the operational phase of the building are shown in figure
2.2.
Figure2.2: Shares of different end-use purposes in some countries. (Source: Department
of energy 2006, U.S, office of energy efficiency, natural resources Canada, 2006.)
It shows that in terms of international averages, most residential energy in developed
countries is consumed for space heating. Building type usually sets different requirements
for the indoor climate and internal loads. The impact of climate differences also affects
the energy demand in a building. In order to achieve large scale energy efficiency
improvements, a range of different approaches have been studied. Researches carried
out in different countries are focused to the local needs.
Figure2.3: status of Building standards (Source UNEP)

13
There are different strategies for using legislative instruments to control energy
consumption level of buildings. Scandinavian countries generally use national building
codes and standards, which regulate physical, thermal and electrical requirements of
building components, service systems and equipment. The regulations also cover indoor
conditions, health and safety standards, operation and maintenance procedures and
energy calculation methods. Some codes accept limited compensation between building
components; for instance, the glass area may for instance be increased, if the exterior wall
insulation is also improved. Building codes are crucial to help induce the improvement of
the energy efficiency of the building sector. A number of building codes currently include
energy performance standards, limiting the amount of energy that buildings can consume.
In India the codes that are specific to energy consumption are ECBC standards 2006 [2],
and ASHRAE 90.1.-2004 [6] is followed for LEED rating system of buildings. The
LEED Green building Rating System is a voluntary, consensus-based, market-driven
building rating system based on existing proven technology. It evaluates environmental
performance from a whole building perspective over a building’s life cycle, providing a
definitive standard for what constitutes a “green building”. Both these standards have
given importance and strategies of use of thermal insulation materials in buildings. In
AHRAE 90.1-2004, sections 5.4 and 5.5 gives the mandatory provisions of insulation
materials to provided for the walls, roofs, and floor. Section 5.8 specifies the insulation
product information and installation requirements. ECBC standards specify the
prescriptive requirements of insulations in section 4.3 for roofs, opaque walls.
2.2 THERMAL INSULATION
Thermal insulation is a material or combination of materials, that, when properly
applied, retard the rate of heat flow by conduction, convection, and radiation. It retards
heat flow into or building due to its high thermal resistance.
Thermal insulating materials resist heat flow as a result of the countless microscopic dead
air cells, which suppress convective heat transfer. It is the entrapped air within the
insulation, which provides the thermal resistance, not the insulation material.
2.2.1 Available types of Insulation

14
Many types of insulation are available which fall under the following
basic materials and composites:
1. Inorganic materials:
a. Fibrous materials such as glass, rock, and slag wool.
b. Cellular materials such as calcium silicate, bonded perlite, vermiculite,
and ceramic products.
2. Organic materials
a. Fibrous materials such as cellulose, cotton, wood, pulp, cane, or synthetic
fibers.
b. Cellular materials such as cork, foamed rubber, polystyrene, polyethylene,
polyurethane, polyisocyanurate and other polymers.
3. Metallic or metallized reflective membranes. These must face an air-filled, gas-
filled, or evacuated space to be effective.
Accordingly, insulating materials are produced in different forms as follows:
a. Mineral fiber blankets: batts and rolls (fiberglass and rock wool)
b. Loose fill that can be blown-in ( fiberglass, rock wool) , poured in, or
mixed with concrete (cellulose, perlite, vermiculite)
c. Rigid boards (polystyrene, polyurethane, polyisocyanurate, and fiberglass).
d. Boards or blocks (perlite and vermiculite).
e. Insulated concrete blocks.
f. Reflective materials (aluminum foil, ceramic coatings).
2.3 THERMAL MASS
Massing of the building structure is influenced by the seasonal and daily
temperature variations, which determine the need for thermal resistance and mass of the
building structure. Thermal mass reduces heat gain in the structure by delaying the entry
of heat into the building. Building thermal mass plays a more significant role in dry
climates with
a. High daily summer temperatures.
b. Large diurnal ranges.

15
2.4 TOOLS AVAILABLE FOR ASSESSMENT OF BUILDINGS AND THEIR
COMPARISONS
A number of comparative survey of energy programs have been published, most
recently, “Contrasting the capabilities of Building Energy Performance Simulation
programs” published by Drury B.Crawley, Jon W. Hand, Michael Kummert and Brent T.
Griffith, gives an up-to-date comparison of the features and capabilities of major building
energy simulation programs: BLAST, BSim, Dest, DOE-2.1E, ECOTECT, Ener-Win,
Energy Express, Energy-10, Energy Plus, eQUEST, ESP-r, IDA ICE, IES, HAP, HEED,
PowerDomus, SUNREL, Tas, TRACE and TRANSYS. The comparison is given in
appendix 1. The conclusion of this report is that, who have specific simulation tasks or
technologies in mind should be able to identify the likely tool. Hence, with objective of
the project in mind, eQUEST was chosen to use it for modeling the chosen buildings.
2.5 eQUEST VERSION 3.55
eQUEST is an easy to use building energy use analysis tool which provides
professional-level results with an affordable level of effort. This is accomplished by
combining a building creation wizard, an energy efficiency measure (EEM) wizard, and a
graphical results display module with an enhanced DOE2.2 – derived building energy use
simulation program.
eQUEST features a building creation wizard that walks through the process of creating an
effective building energy model. This involves following a series of steps that describe
the features of the design that would impact energy use, such as architectural design,
HVAC equipment, building type and size, floor plan layout, construction materials, area
usage and occupancy, and lighting system.
After compiling a building description, eQUEST produces a detailed simulation of the
building, as well as an estimate of how much energy it would use. Although these results
are generated quickly, this software utilizes the full capabilities of DOE-2.2.
Within eQUEST, DOE2.2 performs an hourly simulation of the building design for a one
year period. It calculates heating or cooling loads for each hour of the year, based on the

16
factors such as walls, windows, glass, people, plug loads, and ventilation. DOE-2.2 also
simulates the performance of fans, pumps, chillers, boilers, and other energy consuming
devices. During the simulation, DOE-2.2 also tabulates the building’s projected use for
various end uses.
eQUEST produces several graphical formats for viewing the simulation results. For
instance, graphing the simulated overall building energy on an annual or monthly basis or
comparing the performance of alternative building designs. In addition, eQUEST allows
performing multiple simulations and viewing alternative results side-by-side graphics. It
produces energy cost estimating, day lighting and lighting system control, and automatic
implementation of common energy efficiency measures (by selecting preferred measures
from a list). This reasons for selecting this software was, the ease to interface with auto
cad drawing, user interface to input the data, and the tool being a free tool.
Input to the program consists of a detailed description of the building being analyzed,
including hourly scheduling of occupants, lighting, equipment, and thermostat settings.

17
CHAPTER – 3 CASE STUIES & SIMULATIONS
The previous chapters have described in detail the necessity, the elaboration
and finally the implementation of a data model that enables assessment of building
performance. The present chapter, which is a significant part of the study, presents the
overall performance obtained for an office and a commercial building as modeled in
eQUEST. The simulation results have been compared with the actual energy
consumption metered in the building during the occupancy of the building for the year
2006. This chapter also presents the validation of the simulation performed using
eQUEST.
3.1 THE INFOTECH BUILDING
The INFOTECH building, one of the IT buildings in Chennai, was selected as a
case study because: (1) the wall and floor slab sections were different from other
buildings, and (2) for the proximity and the ease of collection of data for the same.
3.1.1 BUILDING DESCRIPTION
The INFOTECH building is a four story office building, constructed in 2003-04
in Chennai, a city in southeast coast of India (Latitude 13.04 N, Longitude 80.17E,
altitude- 6m). The building comprises seminar halls, conference rooms and museum in
ground floor, and open offices in the top four floors (2400 Sqm each floor). The open
office space is built as a column free space; the concrete floor slab is supported by the 6”
thick shear concrete walls at the periphery, and by the central service core of the building.
Figure 3.1: Exterior 3-d View of INFOTECH building.

18
Figure 3.2: Plan of INFOTECH Building (typical open office plan)
Figure 3.3: False ceiling Plan of typical office floor, INFOTECH Building
5m 10m

19
Figure 3.4: Different views of INFOTECH Building.

20
3.1.2 SPACE SUMMARY
The building use spaces are classified into major zones as: (1) office – open plan,
(2) Auditorium (3) Corridor (4) Lobby (5) Restrooms (6) Conference Rooms (7)
Mechanical / Electrical room (8) All others. The table 3.1 gives the space summary.
Building Use
Conditioned
Area (Sqm)
Unconditioned
Area (Sqm)
Total (Sqm)
Office (open plan) 8848.32 8848.32
Auditorium 712.75 712.75
Corridor 414.77 414.77
Lobby 370.44 370.44
Restrooms 545.31 545.31
Conference Rooms 874.38 874.38
Mechanical/Electrical rooms 196.68 196.68
All others 26.35 26.35
Total 11247.04 742.00 11989.05
Table 3.1: Summary of the building use spaces of INFOTECH building.
3.1.3 BUILDING ENVELOPE COMPONENTS
Section of external wall (dimensions in mm)
Roof slab section detail
Figure 3.5 Details of constructions, Roof slab & External Wall.

21
The envelope of the building is 6” thick shear concrete walls, plastered on both
sides, with a u-value of 4.33 W/m2K (0.763 Btu/h.ft
2.F). The details of construction of the
external wall, and roof slab are shown in figure 3.5. The roof slab has a u-value of 0.028
W/m2K (0.005 Btu/h.ft
2.F).
3.1.3.1 WINDOWS
The INFOTECH building has Double glazing systems of Saint Gobain, for the
facade. They are made of double clear float panes with air gap in between. The properties
of the glazing are
1. Shading coefficient = 0.23
2. U-value = 2.895 W/m2K (0.51 Btu/h.ft
2.F).
3. Visual Light transmittance = 0.15
4. Emissivity = 0.84
The table 3.2 summarizes the window area in the external fazard of INFOTECH building,
and the glass details.
Description South East
North West
North East
South West
Total
Wall Area 13869.36 14245.2 17416.08 17416.08 62946.72
Total Window Area 4460.882 1594.437 1594.437 4282.585 11932.341
Fixed Window Area 3904.202 943.367 1179.347 3867.495 9894.411
% of Window area 37.385 13.362 13.362 35.891
Table 3.2: Details of window area in the fazard of the INFOTECH building.
3.1.3.2 Artificial Lighting
The Open office spaces are lit with Compact fluorescent lamps (2 X 36 W), and
the corridors with Compact fluorescent lamps (2 X 18 W). There is no control at every
desk, but for they are controlled in different zones.
3.2.3.3 Occupancy Density and Design Ventilation
The INFOTECH building uses Multi zone Air handler, with chilled water coils as
its HVAC systems. The Fan control is of Variable speed drive. Four Screw type chillers
of 163 ton each, which gives output at 1.407kW/ton full load efficiency. The more
detailed data of the HVAC system type used is tabulated in table 3.3.

22
Mechanical systems
HVAC System Type(s)
1. Multi Zone Air Handler.
2. Chilled Water Coils
Design Supply Air
Temperature
20 ºF
Fan Control VSD Control
Fan Power 4 in WG, Standard Supply.
Economizer Control No
Chiller Type, Capacity, and
Efficiency
4, 163 ton VSD, Screw Type chiller: 1.407 KW/ton
full load efficiency, Variable Speed control for
part load operation.
Chilled Water Loop and
Pump Parameters
Variable Primary Flow with 647 gpm variable
speed pump. Chilled Water Fixed temperature at
45ºF
Condenser Water Loop and
Pump Parameters
Constant Flow with 484 gpm, single speed pump,
Condenser water temperature 75ºF
Table 3.3: Details of HVAC systems.
3.1.4 COMPUTER MODEL
In order to setup a realistic computer model, it was necessary to find and gather
relevant information on the building geometry, construction, usage details. The
INFOTECH building was modeled in eQUEST by using the gathered information and the
physical properties that were determined from the architectural drawings, and
manufacturer data. With the help of these sources, a detailed computer model was setup,
representing the whole building. The zones were classified as same as given in the table
3.1 and shown in the figure 3.6.
Figure 3.6: Zoning done in a typical floor in INFOTECH building.

23
Figure 3.7: Computer model in eQUEST of INFOTECH Building.
The exterior curved walls on the north east and southwest have a tilt of 78º with
the ground, which couldn’t be modeled in eQUEST. Hence they could be modeled with a
tilt of 90º to the ground. Further, the pergolas and other features constructed for aesthetic
purpose could not be modeled in eQUEST. The materials used in the buildings, were
defined in eQUEST using certain pre defined materials in its library, and also from
manufacturers data. The data are documented in appendix C.

24
3.1.4.1 Occupancy Schedule
The occupancy density for each zones classified are as per the table 3.4. and the
people occupy these spaces on weekdays, from Monday to Friday from 9:00AM to
6:00PM, and the office is closed in the weekends. The list of holidays in the year 2006 is
also considered. The occupancy profile considered on a weekday is shown in the figure
3.8.
Building Use
Area
Percentage
Design Maximum
Occupancy
(Sqft/Person)
Design Ventilation
(CFM/Person)
Office (open plan) 71.9 47 17
Auditorium 5.7 750 5
Corridor 3.3 82 6
Lobby 2.1 163 7
Restrooms 2.6 275 17
Conference Rooms 12.9 47 6
Mechanical/Electrical
rooms
1.3 360 17
All others 0.2 275 15
Table 3.4: Occupancy density in different zones.
3.1.4.2 Occupancy Profile
Figure 3.8: Occupancy schedule during a typical working day.

25
3.1.4.3 Lighting Schedule
The office spaces were lit with ceiling mounted Compact Fluorescent Lamps (2 X
36 W), the corridors were lit with CFL’s (2 x 18 W). The Interior Lighting power
illuminance was calculated from the as built false ceiling drawings in the classified zone.
The lighting power density in the classified zones is as tabulated in table 3.5 and shown
in figure 3.9.
Building Use
Area (Sqft) Lighting
Density
(Watt/Sqft)
AHSRAE
(9.6.1)
Interior
Lighting
power (Watt)
Office (open plan) 8848.32 10.1 11.1 98644.40
Auditorium 712.75 10.0 9.3 6621.72
Corridor 414.77 10.0 4.6 1926.70
Lobby 370.44 7.0 13.0 4818.19
Restrooms 6.0 9.3 5066.14
Conference Rooms 874.38 18.3 13.0 11372.62
Mechanical/Electrical
rooms
8.1 14.9 2923.68
All others 26.35 7.0 9.3 244.84
Total 11247.04 (average) 10.4 131618.29
Table 3.5: Lighting power density at different zones.
3.1.4.4 Lighting profile
Figure 3.9: Lighting profile of a typical working day.

26
3.1.5 SIMULATION OUTPUT
Once established, the computer model was simulated to obtain monthly Energy
consumed for space cooling, Area lighting, miscellaneous equipments, ventilation fans
and the pumps. They are shown in figures
Plate 3.1: Annual energy consumption by enduse under various parameters.

27
Plate 3.2: Simulation results showing annual electrical energy consumption under various parameters for the year 2006.

28
Plate 3.3: Monthly Electric Peak loads for the year 2006.
In the simulation output shown in above plates, it is observed that energy
consumed for space cooling is 53% of the total energy consumed. The miscellaneous
equipments used in office, computers which contribute the major percentage in it,
constitutes 18% to the overall energy consumption. 17% is consumed by the lighting
systems installed in the office. Ventilation fans consume 9% of the total annual energy
consumption. Space cooling consumes the maximum percentage of the total energy
consumption which has huge potential to reduce energy consumption. The area lighting
and equipments have a same uniform consumption throughout the year, where as the
space cooling demand is considerably less during the January and February, November
and December in comparison with the other eight months. There is considerably higher
demand in March, May, June and August.

29
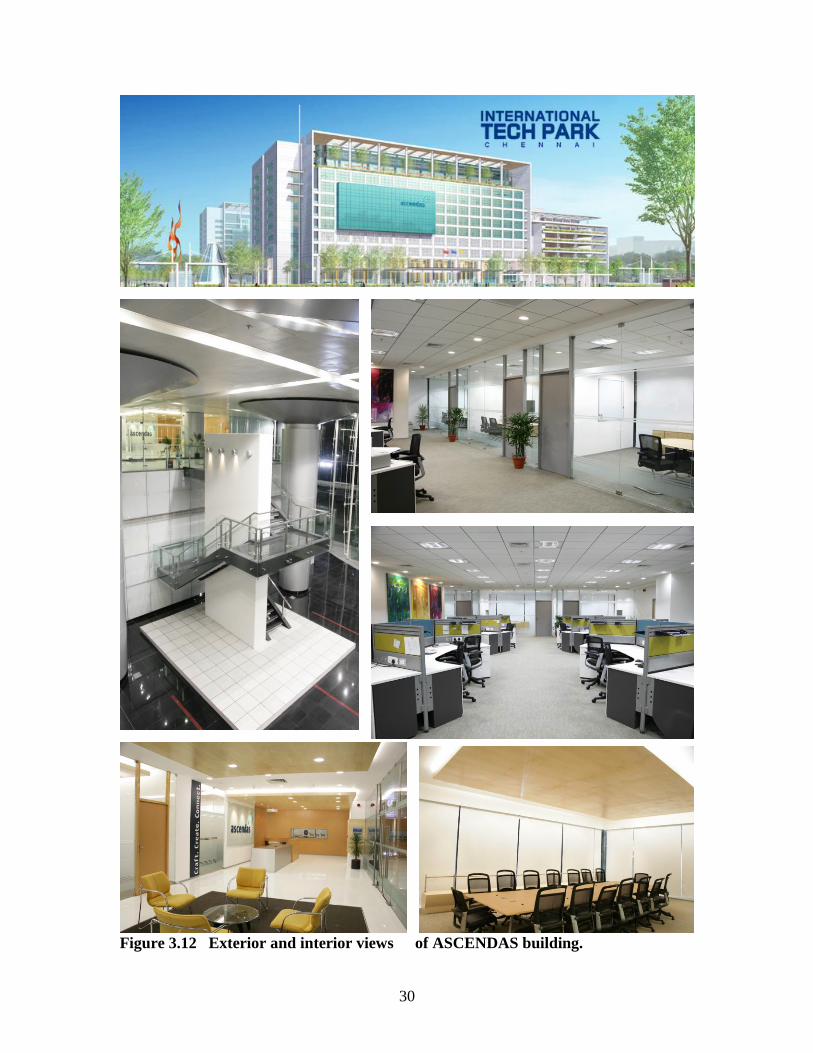
3.2 THE ASCENDAS BUILDING
The ASCENDAS building, one of the commercial buildings in Chennai, was
selected as a case study because of the proximity and the ease of collection of data.
3.2.1 Building Description:
The ASCENDAS building is a ten story office building, spread over an area of
6,00,00sqm; constructed in 2004-05 in Chennai, a city in southeast coast of India
(Latitude 13.04 N, Longitude 80.17E, altitude- 6m). The building comprises of shopping
complexes in ground and first floor, the second and third floor used for car parking, and
open offices in the top eight floors (60,00 Sqm per floor).
Figure 3.10: Exterior 3-d view of ASCENDAS building.
Figure 3.11 Plan of a typical office floor in ASCENDAS building. 5m 10m
30
Figure 3.12 Exterior and interior views of ASCENDAS building.

31
3.2.2 Space Summary:
The building use spaces are classified into major zones as: (1) office – open plan,
(2) Lobby (3) Restrooms (4) Conference Rooms (5) Mechanical/Electrical rooms. The
following table 3.6 gives the space summary.
Building Use
Conditioned Area
(Sqft)
Unconditioned Area
(Sqft)
Total (Sqft)
Office (open plan) 438000 438000
Lobby 24000 24000
Restrooms 63000 63000
Conference rooms 45000 45000
Mechanical/Electrical
room
30000 30000
Total 507000 93000 600000
Table 3.6: Summary of the building use spaces of ASCENDAS building.
3.2.3 Building Envelope Components:
The exterior walls of the building are of 200mm thick solid concrete block with
Aluminium composite panels used for exterior cladding the section of the exterior wall
which has a u-value of 0.55 W/m2K (0.098 Btu/h.ft
2.F)is shown in the figure 3.13. The
roof slab and floor slab are of 150 mm thick concrete slab, constructed as a flat slab
construction. The roof slab has been given a 3” thick under deck insulation with
polystyrene. The overall u –value of the roof slab is 0.232 W/m2K (0.041 Btu/h.ft
2.F).
Figure 3.13: Section of exterior wall

32
3.2.3.1 Windows:
The ASCENDAS building has different types of glazing of Saint Gobain, used in
the fazard. The glass types used, their area and their characteristics are tabulated in table
3.7. The window has aluminium frames.
Glass Type
Area (Sqm) Perimeter (m) Specifications
Glass type VS1 483 15.19
6mm +12mm air gap
+6mm clear float glass
Glass type VS2 1938 15.19
6mm +12mm air gap
+6mm clear float glass
Glass type VS3 686 31.6
6mm thick clear float
glass
Glass type VS4 1554.6 37.2
12mm thick clear float
glass
Table 3.7: Glass details used in the fazard of ASCENDAS building.
Glass Type
U-value W/m
2K
(Btu/h.ft2.F)
SHGC
(%)
Reflectance
(%) Visual Light
Transmittance (%)
Glass type VS1 2.83 (0.498) 0.41 0.23 0.28
Glass type VS2 2.83(0.498) 0.26 0.39 0.16
Glass type VS3 5.73(1.009) 0.77 0.21 0.63
Glass type VS4 5.73(1.009) 0.76 0.21 0.63
Table 3.8 Specifications of the glass types.
3.2.3.2 Artificial Lighting:
The Open office spaces are lit with Compact fluorescent lamps (2 X 36 W), and
the corridors with Compact fluorescent lamps (2 X 18 W). There is no control at every
desk, but for they are controlled in different zones.
3.2.3.3 Occupancy Density and Design Ventilation:
The ASCENDAS building uses Multi zone Air handler, with chilled water coils
as its HVAC systems. The Fan control is of Variable speed drive. Six Screw type chillers
of 296 ton each, which gives output at 1.26 KW/ton full load efficiency. The more
detailed data of the HVAC system type used is as follows:

33
Mechanical systems
HVAC System Type(s)
1. Single Zone Air Handler (cooling only).
2. Chilled Water Coils
Design Supply Air
Temperature
20 ºF
Fan Control VSD Control
Fan Power 4 in WG, Standard Supply.
Economizer Control No
Chiller Type, Capacity,
and Efficiency
6, 296 ton VSD, Screw Type chiller: 1.26 KW/ton full
load efficiency, Variable Speed control for part load
operation.
Chilled Water Loop
and Pump Parameters
Variable Primary Flow with 1800 gpm variable speed
pump. Chilled Water Fixed temperature at 44ºF
Condenser Water Loop
and Pump Parameters
Constant Flow with 1800 gpm, single speed pump,
Condenser water temperature 75ºF
Table 3.9: Details of HVAC systems.
3.2.4 Computer Model
In order to setup a realistic computer model, it was necessary to find and gather
relevant information on the building geometry, construction, usage details. The
ASCENDAS building was modeled in eQUEST by using the gathered information and
the physical properties that were determined from the architectural drawings, and
manufacturer data. With the help of these sources, a detailed computer model was setup,
representing the whole building. The zones were classified as same as given in the table 3.
1. and shown in figure 3.14.
Figure 3.14: Zoning of Spaces in a typical office floor in ASCENDAS building.

34
Figure 3.15: Computer model in eQUEST of ASCENDAS Building.
The model developed shown in figure 3.15, has taken into account all basic
features of the building envelope except for few aesthetic features that could not be
modeled in eQUEST. The materials used in the buildings, were defined in eQUEST using
certain pre defined materials in its library, and also from manufacturers data. The data are
documented in appendix C.

35
3.2.4.1 Occupancy Schedule:
The occupancy density for each zones classified are as per the table 3.6, and the
occupancy in the different offices, vary, but mostly the occupancy on weekdays, from
Monday to Friday is from 8:00AM to 11:00PM, and in the weekends from 10:00AM to
10:00PM. The list of holidays considered in the year 2006, is also considered. The
occupancy profile considered on a weekday is shown in figure 3.16.
Building Use
Area
Percentage
Design Maximum
Occupancy
(Sqft/Person)
Design Ventilation
(CFM/Person)
Office (open plan) 73 200 20
Lobby 4 100 15
Restrooms 10.5 300 50
Conference rooms 7.5 50 20
Mechanical/Electrical
rooms
5 2000 100
Table 3.10: Occupancy density in different zones.
3.2.4.2 Occupancy Profile:
Figure 3.16: Occupancy Schedule during a typical working day.

36
3.2.4.3 Lighting Schedule:
The office spaces were lit with ceiling mounted Compact Fluorescent Lamps (2 X
36 W), the corridors with CFL’s (2 x 18 W). The Interior Lighting power luminance was
calculated from the as built false ceiling drawings in the classified zone. The lighting
power density in the classified zones is as shown in the table 3.11.
Building Use
Area (Sqm) Lighting
Density
(Watt/Sqft)
AHSRAE
(9.6.1)
Interior
Lighting
power (Watt)
Office (open plan) 43800 12.4 11.1 543120
Lobby 2400 15.2 13.0 36480
Restrooms 6300 7.7 9.3 48510
Conference rooms 4500 9.2 13.0 41400
Mechanical/Electrical
rooms
3000 8.1 14.9 24300
Total 60000 (average)
11.5
693810
Table 3.11: Lighting power density at different zones.
3.2.4.4 Lighting profile:
Figure 3.17: Lighting profile of a typical working day.

37
3.2.5 Simulation output
Monthly Energy consumed for space cooling, Area lighting, miscellaneous
equipments, ventilation fans and the pumps are obtained by simulating the model
developed, it is as follows:
Plate 3.4: Annual energy consumption by endues under various parameters.

38
Plate 3.5: Simulation results showing annual electrical energy consumption under various parameters for the year 2006.

39
Plate 3.6: Monthly Electric Peak loads for the year 2006.
In the simulation output shown in above plates, it is observed that energy
consumed for space cooling is 37% of the total energy consumed. The miscellaneous
equipments used in office, computers which contribute the major percentage in it,
constitutes 12% to the overall energy consumption. 15% is consumed by the lighting
systems installed in the office. Ventilation fans consume 34% of the total annual energy
consumption. Space cooling consumes the maximum percentage of the total energy
consumption and equally the ventilation fans, which has a huge potential to reduce
energy consumption. The area lighting and equipments have a same uniform
consumption throughout the year, where as the space cooling demand is considerably less
during the January and February, November and December in comparison with the other
eight months. There is considerably higher demand in March, May, June and August.

40
3.3 VALIDATION OF THE MODEL DEVELOPED IN EQUEST
The model developed and its simulation results got, the monthly energy
consumption for the year 2006, was compared with the actual monthly energy
consumption for the same year, as recorded in the electric meters in the building. The
following table 3.12 gives the actual and simulated energy consumption values in Kilo
Watt hour, and their percentage difference and plotted in figures 3.18 and 3.19.
Months Actual Billing Data
(KWh)
Simulated Values from
eQUEST(KWh)
Percentage
Difference
Jan 818613 1380000 40.68
Feb 935390 1330000 29.67
Mar 1225450 1720000 28.75
Apr 1535582 1580000 2.81
May 1821384 1730000 -5.28
Jun 1737225 1700000 -2.19
Jul 1843659 1590000 -15.95
Aug 1666434 1720000 3.11
Sep 1764524 1540000 -14.58
Oct 1688254 1580000 -6.85
Nov 1542173 1430000 -7.84
Dec 1517753 1420000 -6.88
Total 18096441 18720000 3.33
Table 3.12: Actual and Simulated values of monthly energy consumption, year 2006. Model in Comparison with Actual
0
200
400
600
800
1000
1200
1400
1600
1800
2000
Jan Feb Mar Apr May Jun Jul Aug Sep Oct Nov Dec
Months
Ele
ctr
ic C
on
sum
pti
on
(k
wh
X1
00
0)
Simulated Values of eQUEST Actual Billing Data
Figure3.18: Comparison of building simulation result and actual billing data

41
0
200
400
600
800
1000
1200
1400
1600
1800
2000
Jan Feb Mar Apr May Jun Jul Aug Sep Oct Nov Dec
Th
ou
san
ds
Months
En
erg
y (
KW
h)
Actual Billing data
Simulated values
Figure 3.19: Comparison of the actual billing data and building simulation results.
The result shows that energy simulation program predicts the energy use pattern
of the building fairly well. The higher difference in January, February and March is
significant as all the floors of ASCENDAS building was not fully occupied by the tenants.
The Table 3.12 shows that there is less than 8% difference for the months of April, May,
June, August, October, November and December and a maximum of 15% difference for
months of July and September between the simulation results and the actual billing data
of ASCENDAS for the year 2006.

42

43
CHAPTER - 4 LIFE CYCLE ENERGY CALCULATION
Embodied energy corresponds to energy consumed by all of the processes
associated with the production of building materials and components. This includes the
mining and manufacturing of materials and equipments. Embodied energy is
proportional to the level of processing required by a material. The more complex the
material is and the greater the amount of energy consumed. High levels of embodied
energy imply higher levels of pollution at the end of the production line, as the
consumption of energy usually results in emissions. Every building is a complex
combination of many processed materials, each of which contributes to the building’s
total embodied energy. This chapter presents the calculations done for embodied
energy for the structural and the envelope components are considered, as the focus is
on the building envelope components and it would be more complex to consider the
finishing materials used inside the building.
4.1 EMBODIED ENERGY CALCULATION
Embodied energy can be calculated on an industrial sector basis (i.e., total
embodied energy divided by the total material used in a sector, e.g., manufacture of steel)
or by process analysis in which the embodied energy of a particular material is tracked
from extraction to end-use. The figures produced by each approach differ, particularly for
low-volume commodities [12]. The figures used in this study, are referred from
Embodied energy of common and alternative building materials and technologies by
B.V.Venkatarama Reddy, K.S.Jagadish [11] and Eco balance assessment tool (Eco –
BAT,www.eco-bat.ch) developed by Stephane Cithrelet [16].
Embodied energy can be split into: (1) energy consumed in the production of
basic building materials, (2) energy needed for transportation of the building materials,
and (3) energy required for assembling the various materials to form the building.
4.1.1 Energy in building materials:
Energy consumed during production of basic building materials is given in table
4.1. (Reference)

44
Type of material Thermal Energy (MJ/Kg)
Cement 5.85
Lime 5.63
Lime- pozzolana 2.33
Steel 42.00
Aluminium 236.80
Glass 25.8
Table 4.1: Energy in basic building materials
4.1.2 Energy in transportation of building materials
Transportation of materials is a major in the cost and energy of a building. Bulk of
the building materials in urban and semi-urban centers are transported using trucks in
India. The transportation distance may vary depending upon the location of construction
activity. In urban areas, the materials travel anywhere between 10 to 100 km in the Indian
context. Materials such as sand are transported from a distance of 70-100 Km in cities
like Bangalore, India. Similarly bricks/blocks crushed aggregate, etc. travel about 40-60
km before reaching a construction site, in urban and semi-urban centers.
Cement and steel travel even longer distances, of the order of 500 Km or more.
Long haul of cement and steel is handled through rail transport. Building materials such
as marble, paints, etc. are sometimes transported from great distances (>1500Km) in
India. Table 4.2 gives diesel energy spent during transportation of various building
materials, along with energy consumed in production.
Type of material
Energy (MJ/Kg)
Production Transportation
50 Km 100 Km
Sand (m3)
0.0 87.5 175
Crushed aggregate (m3)
20.5 87.5 175
Burnt clay bricks (m3)
2550 100 200
Portland Cement (tonnes) 5850 50 100
Steel (tonnes) 42000 50 100
Table 4.2: Energy in transportation of building materials

45
4.1.3 Energy in Mortars
Mortar is a mixture of cementitious material and sand. It is used for the
construction of masonry as well as plastering. Details of mortar type, their proportions
and energy content /m3
of mortar is given in the table 4.3.
Type of Mortar Proportions of materials
Energy (MJ)/ m3
Cement Soil Sand
Cement Mortar 1 0 6 1268
1 0 8 1006
Cement pozzolana mortar 0.8:0.2b 0 6 918
0.8:0.2b 0 8 736
Cement-soil mortar 1 2 6 849
1 2 8 773
Lime pozzolana mortar 1 (1:2) c 0 3 732
Table 4.3: Energy in mortars a
a Energy content: Portland cement = 5.85MJ/Kg; and sand=175MJ/m
3
b Cement: Pozzolana (0.8: 0.2)
c Lime: Pozzolana (1: 2)
4.1.4 Energy in flooring/roofing systems:
There are many alternatives available for the construction of roof/floor of a
building. Energy content of different types of floor/roofing systems are given in table 4.4.
The table gives the energy/ m2 of
plan area of roof/floor and an equivalent of RC slab
energy.
Type of roof/floor Energy (MJ/m2)
RC slab 730
Stabilized mud block filler slab 590
RC ribbed slab roof 491
Ferroconcrete roof 158
Table 4.4: Energy in different floor/roofing systems
The information from the tables 4.2.1, 4.2.2, 4.2.3 and 4.2.4 was used to calculate
the embodied energy for the two buildings in this study. As there a huge number of
materials used in the interiors of the two buildings, in this study only the building
envelope components were considered, they are, Concrete wall, Floor slab, Roof slab and
Glass. Their corresponding embodied energy during the life span is shown in the figure
4.1, and tabulated for INFOTECH building in table 4.5.

46
Building
Component
First year
(MJ)
20 years
(MJ)
40 years
(MJ)
60 years
(MJ)
80 years
(MJ)
Wall 3267576.30 3267576.30 3267576.30 3267576.30 3267576.3
Floor Slab 18207431.7 18207431.70 18207431.70 18207431.7 18207431
Glass 1464499.01 1464499.01 1464499.01 29335106.4 3682936
Roof Slab 5096349.00 5096349.00 5641660.97 5641660.97 6186972
Table 4.5: Embodied energy for INFOTECH building during its life span.
Embodied Energy of Building Envelope Materials
0
5000
10000
15000
20000
25000
30000
1
Th
ou
san
ds
Em
bod
ied
En
erg
y M
J
Roof Slab
Glass
Floor Slab
Concrete Wall
Fig 4.1: Initial Embodied energy of INFOTECH building
The building envelope components considered for ASCENDAS building are the
Exterior wall, Floor slab, Roof slab and Glass. Their corresponding embodied energy
during the life span, is shown in the figure 4.2, and tabulated for ASCENDAS building in
table 4.6.
Building
Components
Initial
Embodied
Energy
(MJ)
20 years
(MJ)
40 years
(MJ)
60 years
(MJ)
80 years
(MJ)
Exterior
Wall
15899847.39 15899847.39 15899847.39 15899847.39 15899847.39
Floor Slab 34952400.00 34952400.00 34952400.00 34952400.00 34952400.00
Glass 7676435.32 7676435.32 7676435.32 12917355.76 19859780.59
Roof Slab 5096349.00 5545528.10 6722906.20 6722906.20 7900284.30
Table 4.6: Embodied energy of ASCENDAS building in its life span

47
Embodied Energy of Building Envelope Materials
0
10000
20000
30000
40000
50000
60000
70000
80000
90000
1
Th
ou
san
ds
Em
bod
ied
En
erg
y M
J
Roof Slab
Glass
Floor Slab
Exterior Wall
Fig 4.2: Initial Embodied energy of ASCENDAS building
The embodied energy of the building materials of the above mentioned envelope
components are shown in the figure 4.3.
Embodied Energy of Building Envelope Materials
0
10000
20000
30000
40000
50000
60000
70000
1
Th
ou
san
ds
Em
bod
ied
En
erg
y M
J
Glass
Bitumen (water proofing)
Concrete (rooof slab)
Concrete (floor slab)
Cement mortar
Alcopolic Panel
Solid Concrete Blocks
Fig 4.3: Embodied energy of building materials used in the envelope components of
ASCENDAS building.

48
4.2 Insulation materials:
Thermal insulation is material or combination of materials, that, when properly
applied, retard the rate of heat flow by conduction, convection, and radiation. It retards
heat flow into or out of a building due to its high thermal resistance. Thermal insulation
materials like other natural or man-made materials exhibit temperature dependant
properties that vary with the nature of the material and the influencing temperature range.
Thermal insulating materials resist heat flow as a result of the countless
microscopic dead air-cells, which suppress (by preventing air from moving) convective
heat transfer. It is the air entrapped within the insulation, which provides the thermal
resistance, not the insulation material.
Creating small cells (closed cell structure) within thermal insulation across which the
temperature difference is not large also reduces radiation effects. It causes radiation
‘paths’ to be broken into small distances where the long-wave infrared radiation is
absorbed and /or scattered by the insulation material (low-e materials can also be used to
minimize radiation effects). However, conduction usually increases as the cell size
decreases (the density increases).
Typically, air-based insulation materials cannot exceed the R-value of still air. However,
plastic foam insulations (e.g., polystyrene and polyurethane) use fluorocarbons gas
(heavier than air) instead of air within the insulation cells, which gives higher R-value.
Therefore, the interaction of the three modes of heat transfer of convection, radiation, and
conduction determines the overall effectiveness of insulation and is represented by what
is called the apparent thermal conductivity which indicates the lack of pure conduction
especially at higher temperatures.
Both vapor passage and moisture absorption are more critical in open cell structure
insulation as compared to closed cell structure. Vapor retarders are commonly used to
prevent moisture penetration into low-temperature insulation. Vapor retarders are used
inside of insulation in cold climates and to outside of insulation in hot and humid
climates (allowing moisture escape from the other side). Vapor retarders placement,
however, is a challenge in mixed climates.
The embodied energy of different insulation materials of varying thickness are
tabulated in table 4.7.

49
Table 4.7: Embodied energy of different insulation materials of varying thickness
4.3 OPERATING ENERGY
Energy used in buildings during their operational phase, as for cooling, ventilation,
hot water, lighting, heating, and other electrical appliances. It might be expressed either
in terms of end-use or primary energy. End-use energy is measured at final use level, so it
somehow expresses the performance of a building. Primary energy is measured at the
natural resource level, including losses from the processes of extraction of the resources,
their transformation and distribution, and so it expresses the real load on the environment
caused by a building.
In other words, the same building placed in different countries but with similar
climates is likely to have similar figures about end-use energy. The difference in terms of
Insulation material Thickness (cm) Embodied energy
(80 years)
Polystyrene 2.5 652992.35
5 1305984.71
7.5 1958977.06
10 2611969.41
20 5223938.83
30 7835908.24
Polyurethane Foam 2.5 1010367.26
5 2020734.51
7.5 3031101.77
10 4041469.03
20 8082938.05
30 12124407.10
Glass wool 2.5 371432.03
5 742864.06
7.5 1114296.10
10 1485728.13
20 2971456.26
30 4457184.39
Rock wool 2.5 334217.85
5 668435.69
7.5 1002653.55
10 1336871.40
20 2673742.80
30 4010614.20

50
primary energy, however, can be significant because of the different energy carriers
available for thermal purposes (like cooling, heating, electricity) and /or because of the
different ways to produce electricity. For example, India, Thermal 66%, Hydropower
26.5%, Nuclear 3%, renewable 4.8% [Ministry of Power, India].
Concerning Operating energy, eQUEST tool used in this study gives the end use
energy consumption. A linear relationship exists between operating and total energy
consumed by a building [14]. Life cycle assessment, provide better understanding and
better estimation of energy aspects in the life cycle of any sort of good. Hence, this study
focuses only on operating energy and embodied energy in the life cycle of buildings.
4.4 LIFE CYCLE ENERGY CALCULATION
The total energy used in a building over its life is the sum of the operational
energy and embodied energy. The embodied energy of the building envelope components
is tabulated in table 4.2, and the operating energy (end-use) of the buildings, obtained
from the simulation carried out in eQUEST (3.2.6), is sum totaled to obtain the Life cycle
energy of the building from 20 years till the life span of the building. The sum total
energy calculation for INFOTECH building is tabulated in table 4.8 as follows:
Year Embodied Energy
(MJ)
Operational
Energy (MJ)
Total Energy (MJ)
1 28092894.12 9067320 37160214.12
5 28092894.12 45336600 73429494.12
10 28092894.12 90673200 118766094.1
15 28092894.12 136009800 164102694.1
20 28092894.12 181346400 209439294.1
40 28638206.09 362692800 391331006.1
50 29335106.49 453366000 482701106.5
Table 4.48: The total energy consumed during the life span of INFOTECH building.

51
The sum total energy calculation for ASCENDAS building is tabulated in table 4.9 as
follows:
Year Embodied Energy
(MJ)
Operational
Energy (MJ)
Total Energy
(MJ)
1 64075110.82 67392000 131467110.8
5 64075110.82 336960000 401035110.8
10 64075110.82 673920000 737995110.8
15 64075110.82 1010880000 1074955111
20 64075110.82 1347840000 1411915111
40 65252488.92 2695680000 2760932489
50 70493409.35 3369600000 3440093409
Table 4.9: The total energy consumed during the life span of ASCENDAS building.
The life cycle energy of the two buildings, tabulated above is shown in the figure 4.4 and
4.5 .
Life cycle energy of INFOTECH building
0
50000
100000
150000
200000
250000
300000
350000
400000
450000
500000
1 5 10 15 20 40 50
Th
ou
san
ds
Years
En
erg
y P
erc
en
tag
e (
MJ)
Embodied Energy
Operation Energy
Fig 4.4: The life cycle energy of INFOTECH building
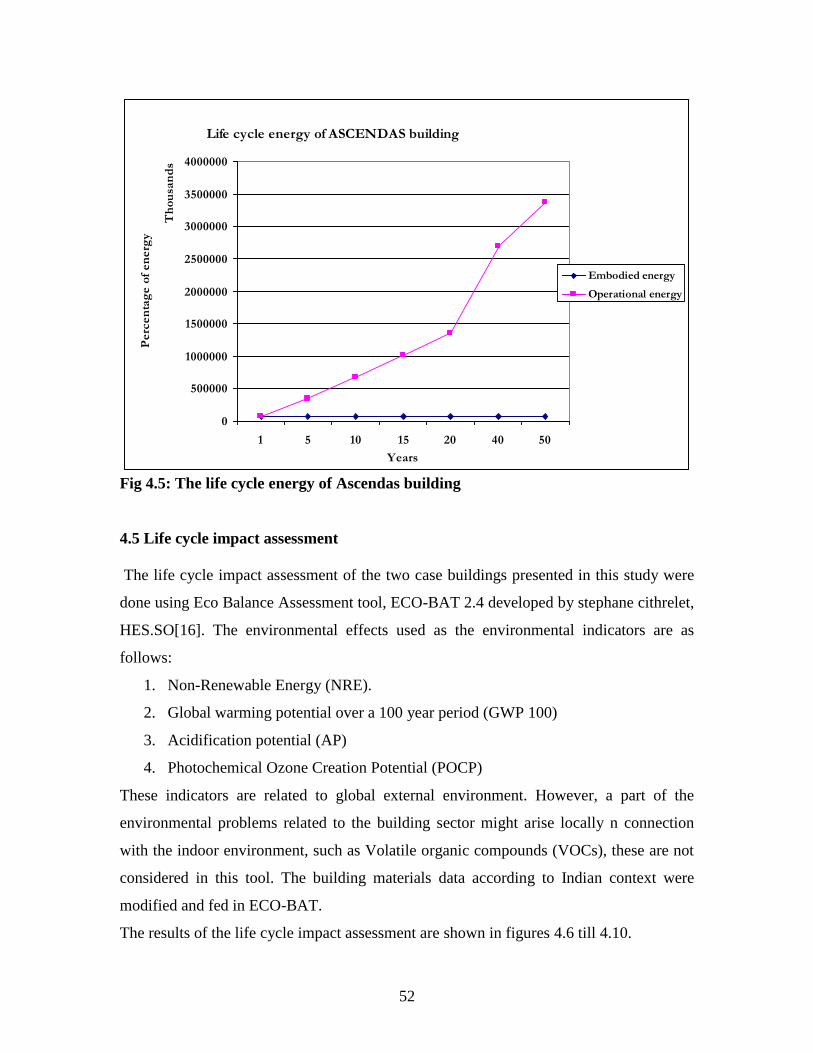
52
Life cycle energy of ASCENDAS building
0
500000
1000000
1500000
2000000
2500000
3000000
3500000
4000000
1 5 10 15 20 40 50
Th
ou
san
ds
Years
Perc
en
tag
e o
f en
erg
y
Embodied energy
Operational energy
Fig 4.5: The life cycle energy of Ascendas building
4.5 Life cycle impact assessment
The life cycle impact assessment of the two case buildings presented in this study were
done using Eco Balance Assessment tool, ECO-BAT 2.4 developed by stephane cithrelet,
HES.SO[16]. The environmental effects used as the environmental indicators are as
follows:
1. Non-Renewable Energy (NRE).
2. Global warming potential over a 100 year period (GWP 100)
3. Acidification potential (AP)
4. Photochemical Ozone Creation Potential (POCP)
These indicators are related to global external environment. However, a part of the
environmental problems related to the building sector might arise locally n connection
with the indoor environment, such as Volatile organic compounds (VOCs), these are not
considered in this tool. The building materials data according to Indian context were
modified and fed in ECO-BAT.
The results of the life cycle impact assessment are shown in figures 4.6 till 4.10.
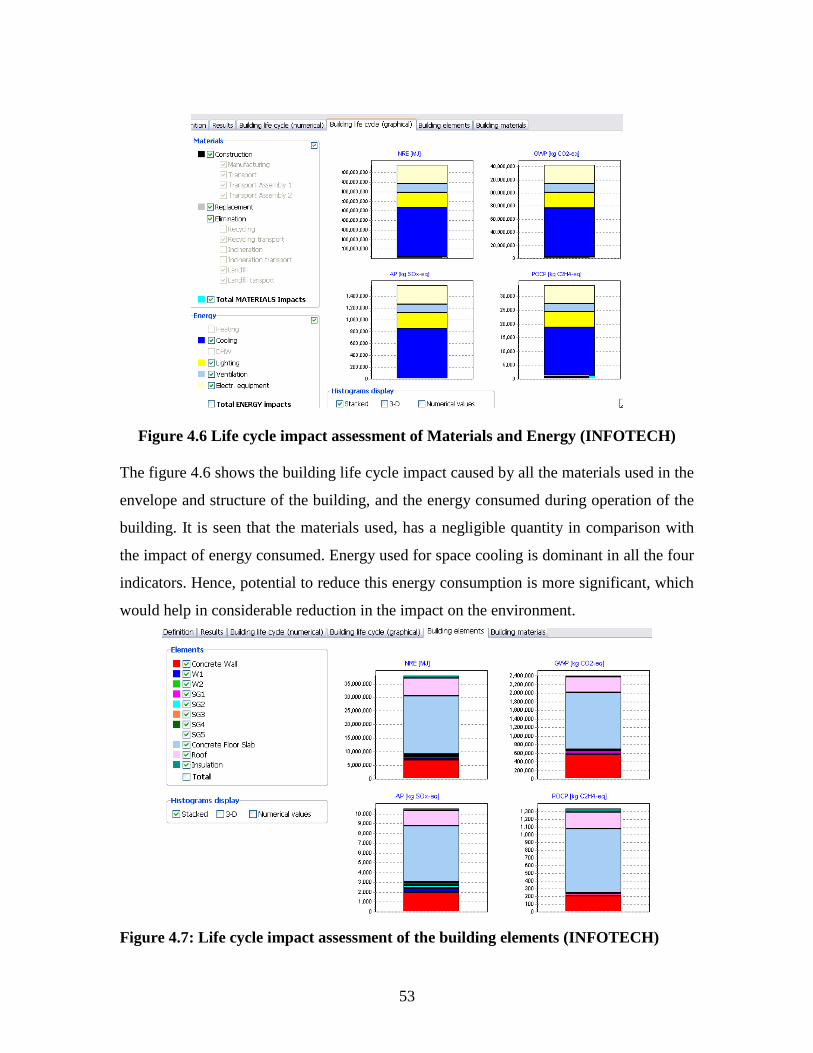
53
Figure 4.6 Life cycle impact assessment of Materials and Energy (INFOTECH)
The figure 4.6 shows the building life cycle impact caused by all the materials used in the
envelope and structure of the building, and the energy consumed during operation of the
building. It is seen that the materials used, has a negligible quantity in comparison with
the impact of energy consumed. Energy used for space cooling is dominant in all the four
indicators. Hence, potential to reduce this energy consumption is more significant, which
would help in considerable reduction in the impact on the environment.
Figure 4.7: Life cycle impact assessment of the building elements (INFOTECH)

54
The figure 4.7 shows the NRE (MJ), GWP (kg Co2), AP (kg Sox), POCP (kgc2H4)
indicators of the Building elements in INFOTECH building. The building elements of the
envelope considered for assessment are the concrete wall, glazing, concrete floor slab,
and roof slab and insulation material if applied on the exterior walls. It is seen that,
concrete floor slab element is dominant in all the four indicators. Concrete used for walls
and roof slab are again more dominant in all the four indicators. Glazing shows a very
less percentage of impact in comparison with the other elements. Thermal Insulation
materials used for the exterior walls also have a negligible impact in comparison with the
other elements. They have more impact on POCP, in comparison with the other
indicators.
Figure 4.8: Life cycle impact assessment of building materials (INFOTECH)
The figure 4.8 shows the impact on environment caused individually by each building
material used in INFOTECH building. It is seen that, the reinforced concrete and
polystyrene used in floor slabs, are dominant in all the four indicators. Polystyrene has a
major impact on POCP, ozone creation potential.

55
Figure 4.9: Life cycle impact assessment of the building elements (ASCENDAS)
Figure 4.10: Life cycle impact assessment of building materials (ASCENDAS)
The figure 4.9 and 4.10 shows that NRE (MJ), GWP (kg Co2), AP (kg Sox), POCP
(kgc2H4) indicators of the Building elements in ASCENDAS building. The building
elements of the envelope considered for assessment are the exterior wall, glazing,
concrete floor slab, roof slab, columns and insulation material if applied on the exterior
walls. It is seen that, concrete floor slab element is dominant in all the four indicators.
Glazing shows a very less percentage of impact in comparison with the other elements.

56

57
CHAPTER – 5 ANALYSIS & DISCUSSIONS
With the objectives of the project in focus, this chapter presents the analysis and
discussions on the results obtained in the previous chapter. Firstly, the performance of
the existing buildings in reference with the standards was analyzed to check if the two
buildings comply with the same. Secondly, the role of the building envelope
components and the key role of insulation in Energy consumption are analyzed.
Finally, the life cycle energy consumption of the buildings is analyzed to derive
conclusions and strategies to minimize the total energy consumption of the buildings.
5.1 COMPARISON OF THE MODEL WITH ECBC & ASHRAE STANDARDS:
The developed computer model in eQUEST for both the buildings, INFOTECH &
ASCENDAS, was compared with the ANSI/ASHRAE/IESNA Standard 90.1-2004
(Energy standard for buildings except for low rise residential buildings), and Energy
conservation Building Code,2006 (Bureau of Energy Efficiency, ECBC). The
INFOTECH building showed 25% of energy consumption more than the ASHRAE 90.1-
2004 standards, shown in figure 5.1, and the figure 5.2 shows the same building
consumes 3.5% of more energy than ECBC standards. The ASCENDAS building showed
9.6% of energy consumption more than ECBC standards as shown in figure 5.3. Comparison of Energy Consumption with ASHRAE standard
0
50
100
150
200
250
300
Jan Feb Mar Apr May Jun Jul Aug Sep Oct Nov Dec
Months
Ele
ctri
c co
nsu
mp
tio
n (
KW
h X
100
0)
Model (estimated) ASHRAE standard(estimated)
Fig 5.1: Comparison with ASHRAE standard (INFOTECH building)

58
Energy Consumption- Comaprison with ECBC code standards
0
50
100
150
200
250
300
Jan Feb Mar Apr May Jun Jul Aug Sep Oct Nov Dec
Months
Ele
ctr
ic C
on
su
mp
tion
(K
Wh
X10
00)
Model(estimated) ECBC (estimated).
Fig 5.2: Comparison with ECBC standards (INFOTECH building)
Energy Consumption - Comparison with ECBC Standards
0
500
1000
1500
2000
2500
Jan Feb Mar Apr May Jun Jul Aug Sep Oct Nov Dec
Months
Ele
ctr
ical C
on
su
mp
tion
(K
Wh
X10
00)
Model (estimated) ECBC standards
Fig 5.3: Comparison of with ECBC standards (ASCENDAS building)

59
The above comparisons with the standards show that, either of the building is not
satisfying the codal requirements of ECBC standards, and ASHRAE standards. Hence the
influence of different parameters on the buildings to reduce the energy consumption is
significant, which lead to further analysis.
5.2 ANALYSIS OF BUILDING ENVELOPE COMPONENTS IN ENERGY
CONSUMPTION
The energy consumption of a building is affected by different parameters, the
climate of the region where the building is located, the physical properties of materials
used in the building envelope, the internal loads, the HVAC systems installed etc., To
analyze these parameters and check whether the insulation application on the building
envelope is the only key factor, affecting the energy consumption of a building, the
analysis of building envelope components were done.
5.2.1 ROLE OF INSULATION MATERIAL IN ENERGY CONSUMPTION
The amount of energy required for cooling or heating a building depends on how
well the envelope of that building is treated thermally [5]. The thermal performance of a
building envelope is determined by the thermal properties of the materials used in
construction characterized by its ability to absorb or emit solar heat in addition to the
overall U-value of the corresponding component including insulation. The placement of
the insulation materials within the building component can affect its performance under
transient heat flow. The best performance can be achieved by placing the insulation
material close to the point of entry of heat flow [5]. This means placement of insulation
to the inside for climatic regions where winter heating is dominant and to the outside
where summer cooling is dominant. To estimate the amount of energy savings that could
be obtained by the application of insulation, Simulations were performed by applying
different insulation materials on the exterior walls of INFOTECH building, under
different climatic conditions in India.

60
0
2
4
6
8
10
12
0 1 2 3 4 5 6 7 8
Resistance of Insulation (m2-K/W)
Perc
en
tag
e o
f E
nerg
y S
avi
ng
s
Chennai
New Delhi
Jodhpur
Bangalore
Fig 5.4: Energy savings after application of insulation material on the exterior wall
surface.
The results of the simulations are tabulated in table 5.1, and displayed in figure
5.4. It shows that, increasing the resistance value of insulation material does not yield
proportional return in percentage of energy saving (Y) beyond a certain point. The
relationship between the percentage of energy savings (Y) and the resistance of insulation
material (X) is not linear. It obeys a logarithmic function of y = 1.2612 Ln (x) + 8.3158,
R2
=0.9588, with respect to Hot-dry climate (Jodhpur). In respect with composite climate
(New Delhi), it obeys Y = 1.4302 Ln (x) +7.559, R2
=0.7476, Warm-Humid climate
(Chennai) it obeys Y=0.9732 Ln (x) + 5.7066, R2
=0.9692, and in Moderate Climate
(Bangalore) it obeys Y= 0.7547 Ln (x) +5.1813, R2
=0.97.
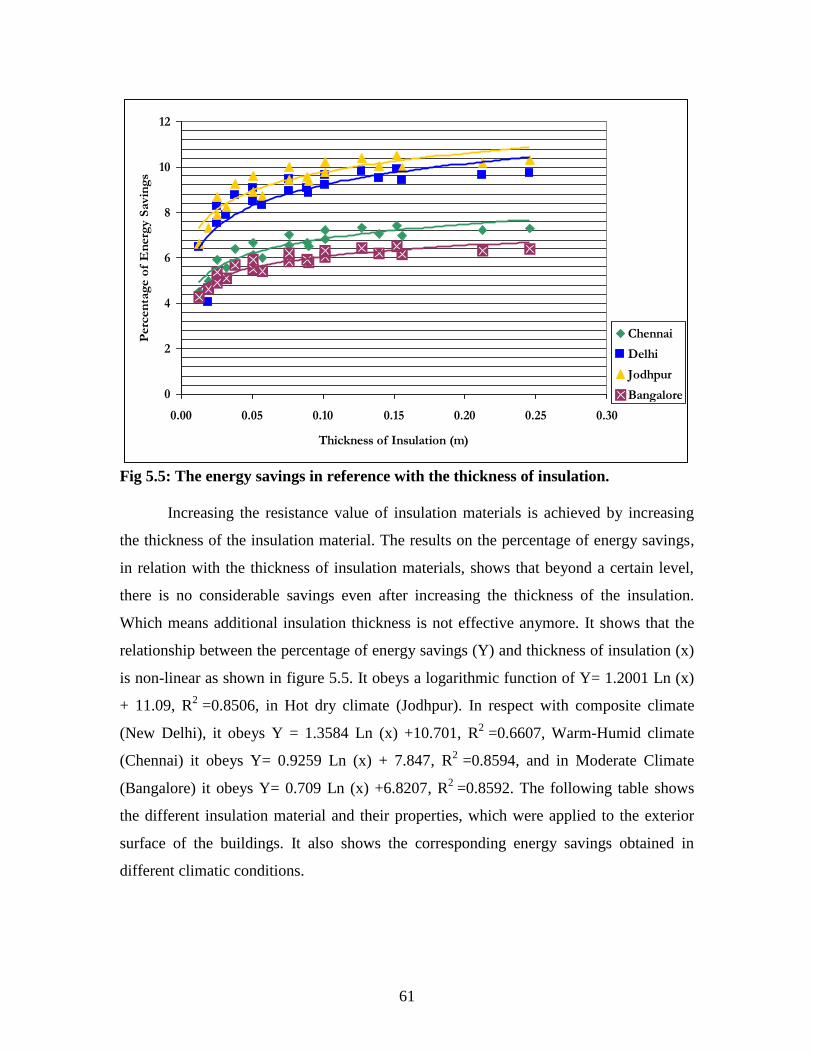
61
0
2
4
6
8
10
12
0.00 0.05 0.10 0.15 0.20 0.25 0.30
Thickness of Insulation (m)
Perc
en
tag
e o
f E
nerg
y S
avin
gs
Chennai
Delhi
Jodhpur
Bangalore
Fig 5.5: The energy savings in reference with the thickness of insulation.
Increasing the resistance value of insulation materials is achieved by increasing
the thickness of the insulation material. The results on the percentage of energy savings,
in relation with the thickness of insulation materials, shows that beyond a certain level,
there is no considerable savings even after increasing the thickness of the insulation.
Which means additional insulation thickness is not effective anymore. It shows that the
relationship between the percentage of energy savings (Y) and thickness of insulation (x)
is non-linear as shown in figure 5.5. It obeys a logarithmic function of Y= 1.2001 Ln (x)
+ 11.09, R2
=0.8506, in Hot dry climate (Jodhpur). In respect with composite climate
(New Delhi), it obeys Y = 1.3584 Ln (x) +10.701, R2
=0.6607, Warm-Humid climate
(Chennai) it obeys Y= 0.9259 Ln (x) + 7.847, R2
=0.8594, and in Moderate Climate
(Bangalore) it obeys Y= 0.709 Ln (x) +6.8207, R2
=0.8592. The following table shows
the different insulation material and their properties, which were applied to the exterior
surface of the buildings. It also shows the corresponding energy savings obtained in
different climatic conditions.

62
Insulation Material L (ft) K
(Btu/hr-ft2-F) P lb/ft3
C
Btu/lb-
F
R
hr-ft2-F/Btu
Overall
u-value
Chennai %
of Savings
Delhi %
of Savings
Jodhpur %
of
Savings
Bangalore%
of Savings
Min Wool Batt R7 0.1882 0.025 0.6 0.2 7.530 0.101 6.011 8.332 8.761 5.419
Min Wool Batt R11 0.2957 0.025 0.6 0.2 11.830 0.071 6.503 8.867 9.373 5.785
Min Wool Batt R19 0.5108 0.025 0.6 0.2 20.430 0.044 6.972 9.397 9.958 6.157
Min Wool Batt R24 0.6969 0.025 0.6 0.2 27.880 0.033 7.198 9.639 10.215 6.323
Min Wool Batt R30 0.8065 0.025 0.6 0.2 32.360 0.029 7.278 9.735 10.321 6.383
Min Wool Fill 3.5 in R11 0.2917 0.025 0.6 0.2 10.800 0.061 6.670 9.051 9.582 5.911
Min Wool Fill 5.5 in R19 0.4583 0.025 0.6 0.2 16.970 0.04 7.047 9.481 10.044 6.212
Polystyrene,
Expanded
Polystyrene ½ in 0.0417 0.02 1.8 0.29 2.080 0.226 4.518 6.468 6.616 4.259
Polystyrene ¾ in 0.0625 0.02 1.8 0.29 3.120 0.183 4.995 4.043 7.343 4.645
Polystyrene 1 in 0.0833 0.02 1.8 0.29 4.160 0.154 5.324 7.538 7.864 4.891
Polystyrene 1.25 in 0.1042 0.02 1.8 0.29 5.210 0.132 5.582 7.867 8.227 5.097
Polystyrene 2 in 0.1667 0.02 1.8 0.29 8.330 0.094 6.130 8.455 8.907 5.504
Polystyrene 3 in 0.25 0.02 1.8 0.29 12.500 0.067 6.559 8.928 9.437 5.825
Polystyrene 4 in 0.3333 0.02 1.8 0.29 16.660 0.053 6.817 9.209 9.766 6.031
Polyisocyanurate
Polyisocyanurate 1" 0.083 0.0117 2 0.22 7.094 0.106 5.940 8.262 8.676 5.373
Polyisocyanurate 1.5" 0.125 0.0117 2 0.22 10.684 0.077 6.400 8.753 9.244 5.700
Polyisocyanurate 2" 0.167 0.0117 2 0.22 14.274 0.06 6.678 9.064 9.595 5.921
Polyisocyanurate 3" 0.25 0.0117 2 0.22 21.368 0.042 7.008 9.437 9.997 6.182
Polyisocyanurate 4" 0.333 0.0117 2 0.22 28.462 0.032 7.210 9.656 10.232 6.333
Polyisocyanurate 5" 0.417 0.0117 2 0.22 35.641 0.026 7.329 9.801 10.390 6.428
Polyisocyanurate 6" 0.5 0.0117 2 0.22 42.735 0.022 7.420 9.902 10.497 6.498
Table 5.1: Insulation materials, their properties and the corresponding energy savings.

63
5.2.2 ROLE OF THERMAL MASS AND STORAGE
Thermal mass reduces heat gain in the structure by delaying the entry of heat into
the building. Internal mass stores excess heat, whether from the sun or internal loads of
the building, for release during unoccupied or cooler periods. Material thermal mass is
characterized by its time lag which is the length of time from when the outdoor
temperature reaches its peak until the indoor temperature reaches its peak.
The heat capacity per unit surface area of a structure is the product of density,
thickness and specific heat of its components. Any increase in the heat capacity achieved
by higher density is accompanied by a decrease in the thermal conductivity, reducing
thermal resistance. Replacement of heavy weight with lighter materials of higher thermal
resistance, with no change in wall thickness, reduces the heat capacity, moderately
improve thermal conditions. If wall thickness is increased to raise heat capacity, the
overall thermal resistance increases proportionally, greater thermal effect.
0
2
4
6
8
10
12
0 2 4 6 8 10
p l2 c / k
Perc
en
tag
e o
f E
nerg
y s
avin
gs
Chennai
New Delhi
Jodhpur
Bangalore
Figure 5.6: Effect of increase in thermal capacity to the percentage of energy savings.
In multi-layer walls the combined effect of thermal resistance and heat capacity
depends not only on the overall thermal transmittance and heat capacity but also on the
specific order of the various layers, which may differ in thickness and thermo physical
properties. To analyze this, the product of (ρLc/k) (L), where L is the thickness, c is the

64
specific heat, ρ is the density and k the thermal conductivity was plotted against the
percentage of energy savings. The figure 5.6 shows that the equivalent thermal
resistance-capacity product(x) has logarithmic relationship with the percentage of energy
savings(y). It does not give proportional return to percentage of energy savings.
The figure 5.7 shows that there is a linear relationship between percentage of
energy savings (Y) and overall U-value (x) of the wall. Hence there is always increase in
percentage of energy savings with the reduction in overall u-value.
0
2
4
6
8
10
12
0 0.2 0.4 0.6 0.8 1 1.2 1.4
Overall U-value (W/m2-K)
Perc
en
tag
e o
f en
erg
y s
avin
gs
Chennai
New Delhi
Jodhpur
Bangalore
Figure 5.7: Overall thermal u-value of wall to the percentage of energy savings
5.2.3 ROLE OF WINDOWS IN ENERGY CONSUMPTION
The table 5.2 shows the energy savings achieved by applying exterior movable
blinds over the windows. It shows that the energy savings due to the external blinds is as
much as only 1%. This is because the ratio of the glass area to the floor area, in
INFOTECH building is 10.6% and in ASCENDAS building it is 12.97%.

65
Window (Exterior Movable blinds)
Chennai % of Savings
Delhi % of Savings
Jodhpur % of Savings
Bangalore % of
Savings
Shade - Thin - T20-R70 1.084 1.316 1.684 1.080
Shade - Thin - T30-R30 1.004 1.342 1.684 1.356
Shade - Thin - T30-R50 1.004 1.342 1.684 1.356
Shade - Thin - T30-R60 1.004 1.342 1.684 1.356 a – Movable window shades, appendix ( )
Table 5.2: Percentage of energy savings due to parameters of window.
Type Of Glass a
U-Value
Shading
coefficient
(%)
Visual Light
Transmittance
(%)
Percentage of
Energy Savings
2204 0.48 0.57 0.47 5.034
2205 0.45 0.56 0.47 4.998
2210 0.48 0.57 0.66 5.084
2211 0.45 0.57 0.66 5.048
2216 0.48 0.54 0.38 4.768
2217 0.45 0.54 0.38 4.717
2219 0.48 0.57 0.5 5.012
2220 0.45 0.56 0.5 4.973
2411 0.4 0.15 0.05 -0.056
2412 0.36 0.15 0.05 -0.267
2414 0.41 0.18 0.08 0.336
2415 0.38 0.17 0.08 0.139
2434 0.41 0.22 0.12 0.842
2435 0.37 0.21 0.12 0.651
2634 0.31 0.65 0.75 6.029
2635 0.26 0.66 0.75 6.054
2637 0.31 0.43 0.44 3.387
Table 5.3: percentage of energy savings due to various parameters of glass type.
The significant parameters of the glass type are, the U-value, shading coefficient,
and visual light transmittance. Shading coefficient is the ratio of solar heat gain at normal
incidence through glazing to that occurring through 3 mm thick clear, double-strength
glass. Shading coefficient, as used herein, does not include interior, exterior, or integral
shading devices. These parameters from the Saint Gobain glass manufacturers (appendix)
were simulated to see their effect in reduction in energy consumption. The figure5.8
shows the linear relationship between the shading coefficient and the visual light
transmittance with the percentage of energy savings.

66
Analysis of Parameters of Glass
-1
0
1
2
3
4
5
6
7
0 0.1 0.2 0.3 0.4 0.5 0.6 0.7 0.8
Shading Coefficient, Visual Light Transmission percentage
Perc
en
tag
e o
f E
en
erg
y S
avin
gs
Shading coefficient
Visual Light Transmittance
Figure 5.8: Effect of Parameters of glass, Shading coefficient and Visual light
transmittance
5.3 EVALUATION OF LIFE CYCLE ENERGY
The application of different insulation materials showed significant energy
savings in yearly energy consumption. To see the additional embodied energy imparted
into the insulation material, if it is effective during the operation phase of a building, the
life cycle energy cost has to be determined. The figure 5.9 shows the embodied energy of
different thickness of polyurethane foam, polystyrene, and mineral wool insulations like
glass wool and rock wool, which have applications mostly on walls in buildings. It shows
that Polyurethane foam and polystyrene has higher embodied energy in comparison with
the mineral wool insulations.

67
Embodied energy of Insulation materials
0
2000
4000
6000
8000
10000
12000
14000
0 5 10 15 20 25 30 35
Th
ou
san
ds
Thickness of Insulation
Em
bod
ied
En
erg
y
Polystyrene
Polyurethane foam
Glass Wool
Rock Wool
Fig 5.9: Embodied energy of the insulation materials of different thickness
The energy initially embodied in a building could be as much as 67% of its
operating energy over a 25 year period [12]. In the figure 5.4.2, it is seen that the initial
embodied energy of the envelope and structural components constitutes as mush as 76%
of the operating energy at the first year of operation phase in INFOTECH building, and
49% of the operating energy in ASCENDAS building shown in figure 5.10 and 5.11
respectively. The difference in the two buildings is because of the main constituent of
concrete wall and polystyrene filling in the roof slab, used in INFOTECH building as
seen in fig 5.12. In further years it is observed that the operating energy constitutes higher
percentage to the total energy consumption in comparison with the embodied energy.

68
Life cycle energy of INFOTECH building
0%
20%
40%
60%
80%
100%
1 5 10 15 20 40 60 80
Years
En
erg
y P
erc
en
tag
e (
MJ)
Operation Energy
Embodied Energy
Fig 5.10: Life cycle energy consumption of INFOTECH building
Life cycle energy of ASCENDAS building
0%
10%
20%
30%
40%
50%
60%
70%
80%
90%
100%
1 5 10 15 20 40 60 80
Years
Perc
en
tag
e o
f en
erg
y
Operational energy
Embodied energy
Fig 5.11: Life cycle energy consumption of ASCENDAS building

69
The figure 5.12, below shows the embodied energy of the envelope and structural
components, in addition to it, the polystyrene insulation which has comparatively higher
embodied energy constitutes as much as only 6% to it.
Embodied Energy of Building Envelope Materials
0
5000
10000
15000
20000
25000
30000
35000
40000
1
Th
ou
san
ds
Em
bod
ied
En
erg
y M
J
Insulation Material
Roof Slab
Glass
Floor Slab
Concrete Wall
Fig 5.12: Embodied energy of the building materials and the additional insulation
material.
0
1000
2000
3000
4000
5000
6000
7000
8000
9000
0 0.05 0.1 0.15 0.2 0.25 0.3
Th
ou
san
ds
Insulation Thickness (m)
Savin
gs
(MJ)
Log. (Polystyrene)
Log. (Polyisocyanurate)
Log. (Mineral Wool)
Fig 5.13: Comparison saving for insulation material studied.

70
The energy savings in specific with the different insulation materials of varying
thickness is shown in figure 5.13. It shows that poysicocyanurate insulation which has
higher embodied energy gives higher energy savings than polystyrene or mineral wool
insulations. It also shows that with the increase of insulation thickness, there is significant
energy savings but not beyond a certain point. The relationship between percentage of
energy savings (Y) and the thickness of insulation material (x) is non-linear.
Percentage of Embodied energy and Operation Energy
0%
20%
40%
60%
80%
100%
1 5 10 15 20 40 50
Years
En
erg
y P
erc
en
tag
e (
MJ)
Savings
Operation Energy
Embodied energy
Fig 5.14: Energy Savings after the application of insulation materials of different
thickness.
The replacement of the insulation materials (or) the life span of insulation
materials varies from 15 to 30 years. The figure 5.14 shows the total embodied energy
with additional insulation, operating energy and the energy savings achieved from the
first year of operations phase of the building till the life span of 80 years of INFOTECH
building. It shows that the energy savings due to installation of insulation is as much as
19% at the first year and reaches a maximum of 44% during the life span of 80 years.

71
CHAPTER 6 – CONCLUSION AND STRATEGIES
The work and analysis done in this project to evaluate the role of insulation in energy
consumption in commercial and office buildings, has lead to the following conclusions.
1. The analysis of the case studies of the building on their performance shows that,
they do not comply with the ECBC, 2006 and ASHRAE 90.1.2004, standards.
INFOTECH building showed 25% of more energy consumption in comparison
with ASHRAE standards and 3.5% more than ECBC standards. The
ASCENDAS building showed 9.6% of energy consumption more than ECBC
standards.
2. The results of the analysis done on the influence of different parameters of the
buildings that affect the energy consumption, shows that, firstly, in respect with
the application of insulation materials on the exterior walls, shows that, the
relationship between the percentage of energy savings(y) and the resistance of
insulation materials(x) is non-linear. It obeys a logarithmic function in respect
with all climates in India. Beyond a certain value of (X) the resistance value of
the insulation material does not yield proportional return in percentage of
energy savings. The thickness of the insulation material also obeys a
logarithmic function with the percentage of energy savings.
3. Secondly, the role of thermal mass in energy consumption showed that the
equivalent thermal resistance-capacity product has logarithmic relationship
with the percentage of energy savings. It does not give proportional return to
percentage of energy savings. There is a linear relationship between percentage
of energy savings and overall U-value of the wall. Hence there is always
increase in percentage of energy savings with the reduction in overall u-value.
4. Thirdly, the effect of window shades, movable interior or exterior do not have
any considerable effect in the reduction, since the ratio of the glass area to the

72
floor area in INFOTECH building is 10.6% and in ASCENDAS building it is
12.97%, which is very less percentage to have any considerable effect in
reduction in energy consumption.
5. Fourthly, the result on analysis on the parameters of glass type, the shading
coefficient and visual light transmittance shows a linear relationship with the
percentage of energy savings. Energy savings as much as 6 to 7% with higher
values of these parameters can be achieved. But higher the values of SC and
VLT, the u-value of the glass increases. Hence, all the three parameters have to
be considered simultaneously.
6. Fifth, the results of analysis on the additional energy cost of insulation material
to the initial embodied energy showed that the embodied energy of the
insulation material is as much as only 6% of the total initial embodied energy of
the building envelope components. The energy savings is specific with the
insulation material with the highest embodied energy yield higher energy
savings which exhibit a logarithmic function.
7. Finally, the results of analysis on the lifecycle energy cost, sum total of the
embodied energy and the operating energy, shows that the initially at the first
year the energy savings is as much as 19% and reaches a maximum of 47%
during the life span of 50 years with a very negligible increase in the embodied
energy of the insulation material.

73
REFERENCES
1. T.M.I.Mahlia, B.N.Taufiq, Ismail, H.H.Masjuki, Department of Mechanical
Engineering, University of Malaya, Department of physics, University of
Syiah Kuala,”Correlation between thermal conductivity and the thickness of
selected insulation materials for building wall. Indonesia. June 2006.
2. Energy Conservation Building Code 2006.
3. Drury B.Crawley, Jon W.Hand, Michael Kummert and Brent T.Griffith. U.S.
Department of Energy, Washington, DC, USA., Energy Systems Research
unit, University of Strattclyde, Glasgow, Scotland, U.K. University of
Wisconsin Madison, Solar Energy laboratory, “Contrasting the capabilities of
Building Energy Performance Simulation programs”. Madison, U.S.A. July 2005.
4. N.Farhamieh, S.Sattari. School of Mechanical Engineering, “Simulation of
energy saving in Iranian buildings using integrative modeling for insulation”. Iran,
April 2005.
5. Dr.Mohammad S. Al-Homoud, Architectural Engineering Department, King
Fahd University of petroleum and minerals, “Performance Characteristics and
practical applications of common building thermal insulation materials”. Saudi
Arabia, May 2004.
6. ANSI/ASHRAE/IESNA standard 90.1.-2004. Energy standard for Building
except Low-Rise Residential Buildings.
7. ANSI/ASHRAE/IESNA standard 62.1.-2004. Ventilation for Acceptable Indoor
Air Quality.
8. Chris Schemer, Georgy A.Keoleian, Peter Repper. Center for sustainable
Systems, School of Natural resources and Environment, University of
Michigan, “Life Cycle energy and environmental performance of a new
university building: Modeling challenges and design applications”,U.S.A, May
2003.
9. Dr. Najamuddin, Dr. S.K.Kaushik, Dr.P.S.Chani, Department of
Architecture and planning, Indian Institute of Technology,” Comparative
analysis of embodied energy rates for walling elements in India”, Roorkee, June
2003.

74
10. W.L.Lee, F.W.Yik, P.Jones, J.Burnett, Department of Building Science
Engineering, The Hong Kong polytechnic University, Hong Kong, China.
Welsh School of Architecture, University of Wales, College of Cardiff,
“Energy saving by realistic design data for commercial buildings in Hong Kong”,
U.K, March 2001.
11. B.V. Venkatarama Reddy, K.S.Jagdish Department of civil Engineering,
Indian Institute of Science, “Embodied energy of common and alternative
building materials and technologies”, India, November 2001.
12. Life-cycle operational and embodied energy for a generic single-storey office
building in the UK. Y.G.Yohanis, B.Norton. Center for sustainable Technologies,
School of the Built Environment, University of Ulster, Newtown abbey, Co.Antrim,
BT37 0QB, Northern Ireland, UK. February 1999.
13. Manual of Tropical Housing and Building by Koeinsberger, Ingersoll.
14. I. Sartori, A.G. Hestnes, Department of Architectural Design, History and
Technology, Norwegian University of Science and Technology, ”Energy use in
life cycle of conventional and low-energy buildings”, A review article, Norway.
July 2006.
15. Building and climate change, status, challenges and opportunities, United
Nations Environment Programme.[UNEP]
16. Towards the holistic assessment of building performance based on an
integrated simulation approach , Stephane Cithrelet (Phd Thesis)

75
APPENDIX – A Comparison of simulation tools

76
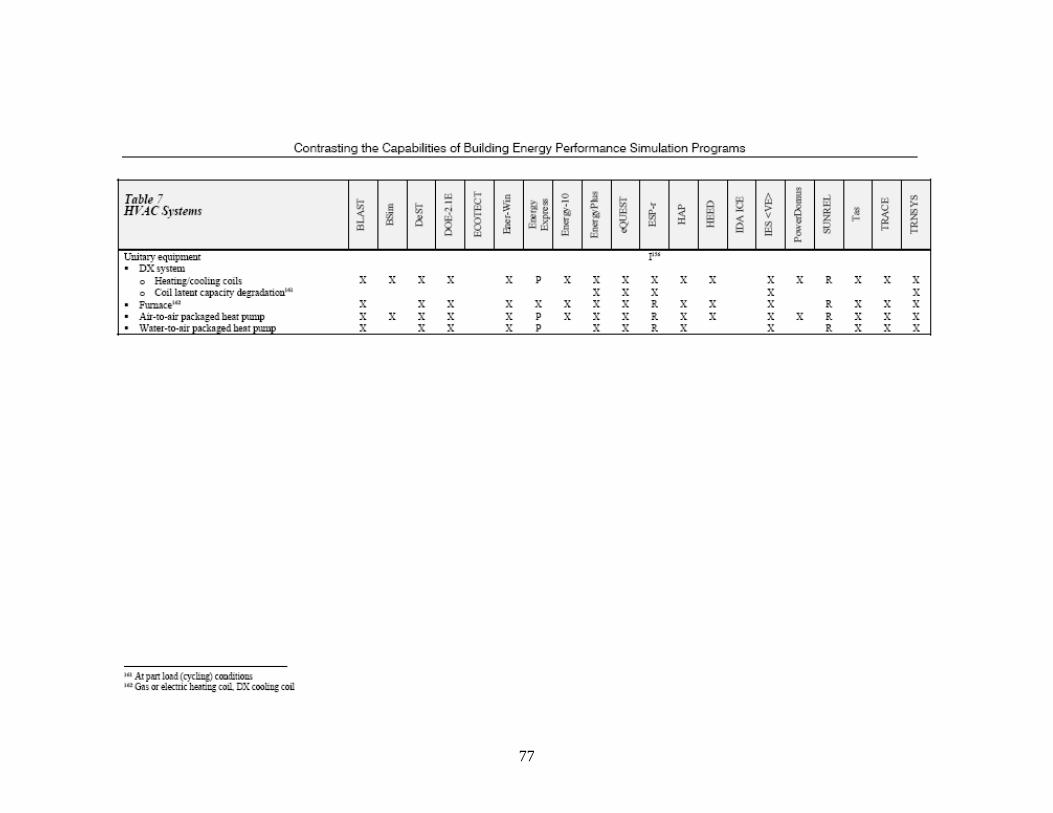
77
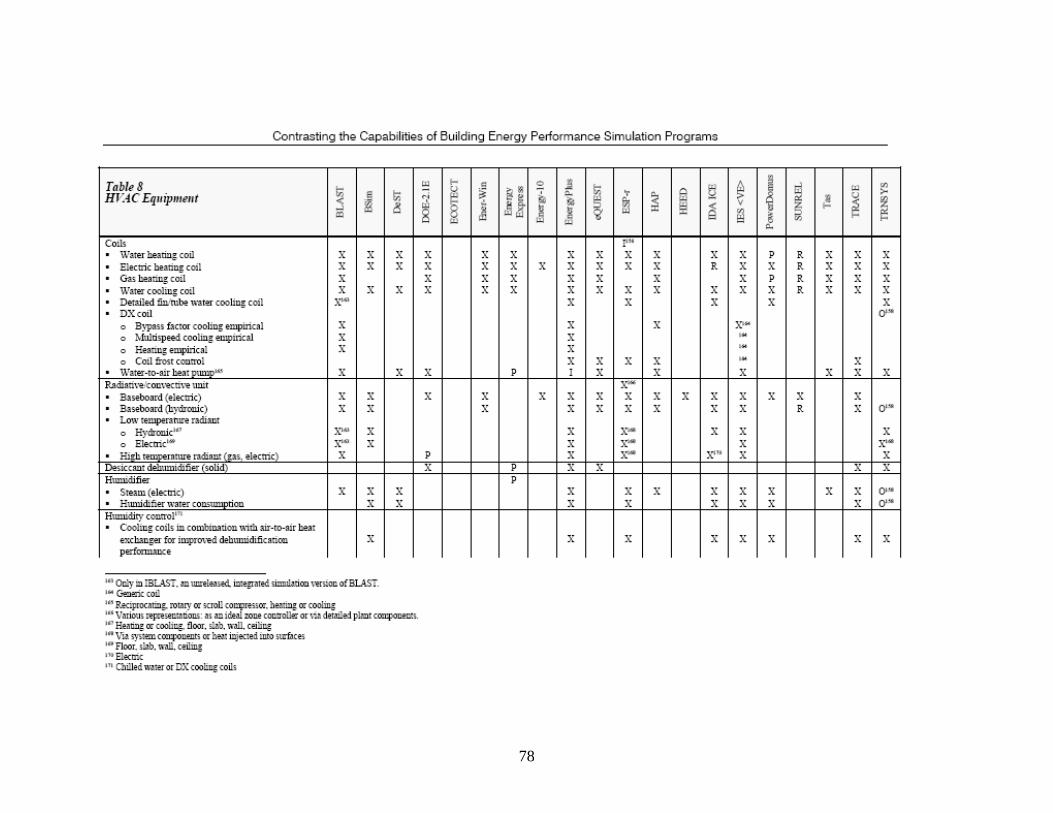
78

79

80

81

82

83

84

85

86
Appendix - B
Insulating Materials
Table 1 Insulating Materials
Code-
Word
Description Thickness Conductivity Density Specific
Heat
Resistanc
e
ft
(m)
Btu/hr-ft2-F
(W/m-K)
lb/ft3
(kg/m3)
Btu/lb-F
(kJ/kg-
K)
hr-ft2-
F/Btu
(K-m2/W)
Mineral Wool/Fiber MinWool Batt
R7 (IN01) Batt, R-7* 0.1882
(0.0574) 0.0250 (0.043) 0.60 (10) 0.2 (837) 7.53 (1.327)
MinWool Batt
R11 (IN02) Batt, R-11 0.2957
(0.0901) 0.0250 (0.043) 0.60 (10) 0.2 (837) 11.83 (2.085)
MinWool Batt
R19 (IN03) Batt, R-19 0.5108
(0.1557) 0.0250 (0.043) 0.60 (10) 0.2 (837) 20.43 (3.600)
MinWool Batt
R24 (IN04) Batt, R-24 0.6969
(0.2124) 0.0250 (0.043) 0.60 (10) 0.2 (837) 27.88 (4.913)
MinWool Batt
R30 (IN05) Batt, R-30 0.8065
(0.2458) 0.0250 (0.043) 0.60 (10) 0.2 (837) 32.26 (5.685)
MinWool Fill
3.5in R11
(IN11)
Fill, 3.5 in
(8.9 cm), R-11 0.2917
(0.0889) 0.0270 (0.046) 0.60 (10) 0.2 (837) 10.80 (1.903)
MinWool Fill
5.5in R19
(IN12)
Fill, 5.5 in
(13.4 cm), R-19 0.4583
(0.1397) 0.0270 (0.046) 0.63 (11) 0.2 (837) 16.97 (2.991)
Cellulose Fill Cellulose
3.5in R-13
(IN13)
3.5 in (8.9 cm),
R-13 0.2917
(0.0889) 0.0225 (0.039) 3.0 (48) 0.33
(1381) 12.96 (2.284)
Cellulose
5.5in R-20
(IN14)
5.5 in (13.4
cm), R-20 0.4583
(0.1397) 0.0225 (0.039) 3.0 (48) 0.33
(1381) 20.37 (3.590)
Insulation Insul Bd 1in
(HF-B2) 1 in (2.5 cm) 0.0830
(0.0254) 0.0250 (0.043) 2.0 (32) 0.2 (837) 3.32 (0.585)
Insul Bd 2in
(HF-B3) 2 in (3.1 cm) 0.1670
(0.0508) 0.0250 (0.043) 2.0 (32) 0.2 (837) 6.68 (1.177)
Insul Bd 3in
(HF-B4) 3 in (7.6 cm) 0.2500
(0.0762) 0.0250 (0.043) 2.0 (32) 0.2 (837) 10.00 (1.762)
Insul Bd 1in
(HF-B5) 1 in (2.5 cm) 0.0830
(0.0254) 0.0250 (0.043) 5.7 (91) 0.2 (837) 3.29 (0.580)
Insul Bd 2in
(HF-B6) 2 in (3.1 cm) 0.1670
(0.0508) 0.0250 (0.043) 5.7 (91) 0.2 (837) 6.68 (1.177)
Insul Bd 3in
(HF-B12) 3 in (7.6 cm) 0.2500
(0.0762) 0.0250 (0.043) 5.7 (91) 0.2 (837) 10.00 (1.762)
Preformed Mineral Board MinBd 7/8in
R-3 (N21) 7/8 in (2.2 cm),
R-3 0.0729
(0.0222) 0.0240 (0.042) 15.0 (240) 0.17 (711) 3.04 (0.536)
MinBd 1in R-
3 (IN22) 1 in (2.5 cm),
R-3.5 0.0833
(0.0254) 0.0240 (0.042) 15.0 (240) 0.17 (711) 3.47 (0.612)
MinBd 2in R-
7 (IN23) 2 in (2.5 cm),
R-7 0.1667
(0.0508) 0.0240 (0.042) 15.0 (240) 0.17 (711) 6.95 (1.225)
MinBd 3in R-
10.4 (IN24) 3 in (7.6 cm),
R-10.4 0.2500
(0.0762) 0.0240 (0.042) 15.0 (240) 0.17 (711) 10.42 (1.836)
Polystyrene, Expanded

87
Table 1 Insulating Materials
Code-
Word
Description Thickness Conductivity Density Specific
Heat
Resistanc
e
ft
(m)
Btu/hr-ft2-F
(W/m-K)
lb/ft3
(kg/m3)
Btu/lb-F
(kJ/kg-
K)
hr-ft2-
F/Btu
(K-m2/W)
Polystyrene
1/2in (IN31) 1/2 in (1.3cm) 0.0417
(0.0127) 0.0200 (0.035) 1.8 (29) 0.29
(1213) 2.08 (0.367)
Polystyrene
3/4in (IN32) 3/4 in (1.9 cm) 0.0625
(0.0191) 0.0200 (0.035) 1.8 (29) 0.29
(1213) 3.12 (0.550)
Polystyrene
1in (IN33) 1 in (2.5 cm) 0.0833
(0.0254) 0.0200 (0.035) 1.8 (29) 0.29
(1213) 4.16 (0.733)
Polystyrene
1.25in (IN34) 1.25 in (3.2 cm) 0.1042
(0.0318) 0.0200 (0.035) 1.8 (29) 0.29
(1213) 5.21 (0.918)
Polystyrene
2in (IN35) 2 in (3.1 cm) 0.1667
(0.0508) 0.0200 (0.035) 1.8 (29) 0.29
(1213) 8.33 (1.468)
Polystyrene
3in (IN36) 3 in (7.6 cm) 0.2500
(0.0762) 0.0200 (0.035) 1.8 (29) 0.29
(1213) 12.50 (2.203)
Polystyrene
4in (IN37) 4 in (10.2 cm) 0.3333
(0.1016) 0.0200 (0.035) 1.8 (29) 0.29
(1213) 16.66 (2.936)
Polyurethane, Expanded Polyurethane
1/2in (IN41) 1/2 in (1.3cm) 0.0417
(0.0127) 0.0133 (0.023) 1.5 (24) 0.38
(1590) 3.14 (0.553)
Polyurethane
3/4n (IN42) 3/4 in (1.9 cm) 0.0625
(0.0191) 0.0133 (0.023) 1.5 (24) 0.38
(1590) 4.67 (0.823)
Polyurethane
1in (IN43) 1 in (2.5 cm) 0.0833
(0.0254) 0.0133 (0.023) 1.5 (24) 0.38
(1590) 6.26 (1.103)
Polyurethane
1.25in (IN44) 1.25 in (3.2 cm) 0.1042
(0.0318) 0.0133 (0.023) 1.5 (24) 0.38
(1590) 7.83 (1.380)
Polyurethane
2in (IN45) 2 in (3.1 cm) 0.1667
(0.0508) 0.0133 (0.023) 1.5 (24) 0.38
(1590) 12.53 (2.208)
Polyurethane
3in (IN46) 3 in (7.6 cm) 0.2500
(0.0762) 0.0133 (0.023) 1.5 (24) 0.38
(1590) 18.80 (3.313)
Polyurethane
4in (IN47) 4 in (10.2 cm) 0.3333
(0.1016) 0.0133 (0.023) 1.5 (24) 0.38
(1590) 25.06 (4.416)
* Nominal thickness is 2 to 2-3/4 in (3.1 to 7 cm). Resistance value is based on a
thickness of 2.26 in (5.74 cm).
Urea Formaldehyde Urea Formald
3.5in R19
(IN51)
3.5 in (8.9 cm),
R-15 0.2910
(0.0887) 0.0200 (0.035) 0.7 (11) 0.3 (1255) 14.55 (2.564)
Urea Formald
5.5in R23
(IN52)
5.5 in (13.4
cm), R-23 0.4580
(0.1396) 0.0200 (0.035) 0.7 (11) 0.3 (1255) 22.90 (4.036)
Insulation Board Insul Bd 1/2in
(IN61) Sheathing, 1/2
in
(1.3cm)
0.0417
(0.0127) 0.0316 (0.055) 18.0 (288) 0.31
(1297) 1.32 (0.232)
Insul Bd 3/4in
(IN62) Sheathing, 3/4
in
(1.9 cm)
0.0625
(0.0191) 0.0316 (0.055) 18.0 (288) 0.31
(1297) 1.98 (0.348)
Insul Bd 3/8in
(IN63) Shingle Backer,
3/8 in (1 cm) 0.0313
(0.0096) 0.0331 (0.058) 18.0 (288) 0.31
(1297) 0.95 (0.167)
Insul Bd 1/2in
(IN64) Nail Base
Sheathing, 1/2
in
(1.3cm)
0.0417
(0.0127) 0.0366 (0.064) 25.0 (400) 0.31
(1297) 1.14 (0.200)
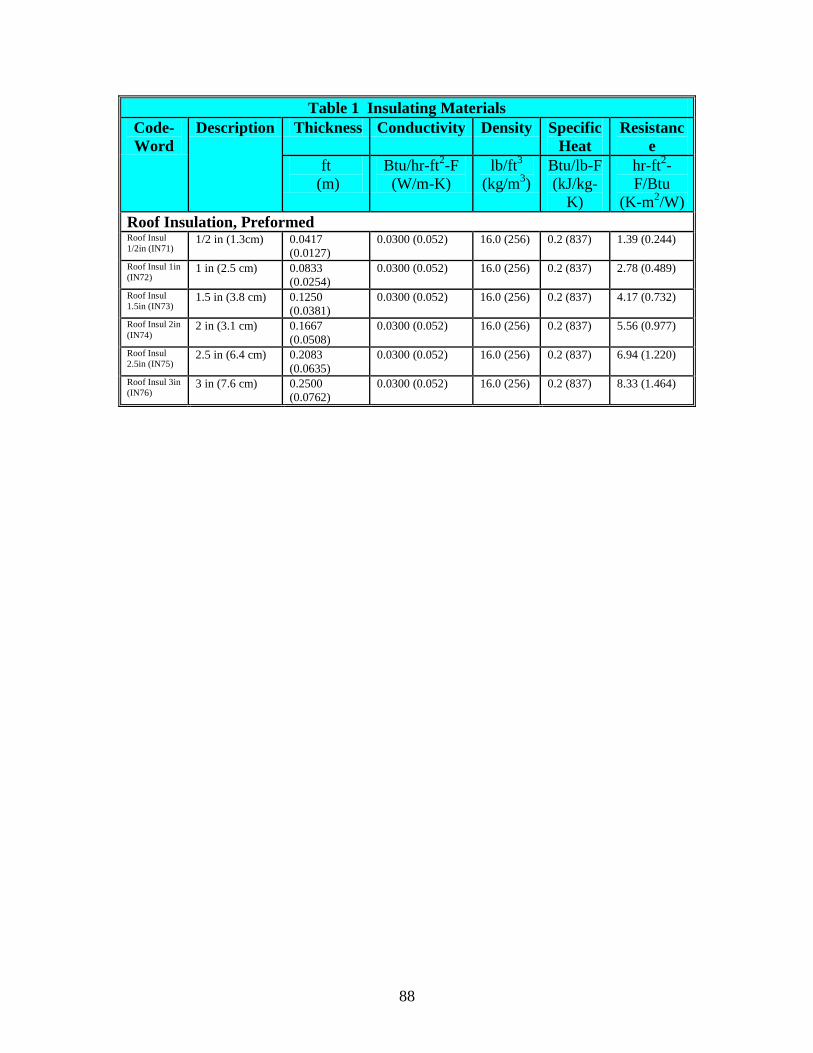
88
Table 1 Insulating Materials
Code-
Word
Description Thickness Conductivity Density Specific
Heat
Resistanc
e
ft
(m)
Btu/hr-ft2-F
(W/m-K)
lb/ft3
(kg/m3)
Btu/lb-F
(kJ/kg-
K)
hr-ft2-
F/Btu
(K-m2/W)
Roof Insulation, Preformed Roof Insul
1/2in (IN71) 1/2 in (1.3cm) 0.0417
(0.0127) 0.0300 (0.052) 16.0 (256) 0.2 (837) 1.39 (0.244)
Roof Insul 1in
(IN72) 1 in (2.5 cm) 0.0833
(0.0254) 0.0300 (0.052) 16.0 (256) 0.2 (837) 2.78 (0.489)
Roof Insul
1.5in (IN73) 1.5 in (3.8 cm) 0.1250
(0.0381) 0.0300 (0.052) 16.0 (256) 0.2 (837) 4.17 (0.732)
Roof Insul 2in
(IN74) 2 in (3.1 cm) 0.1667
(0.0508) 0.0300 (0.052) 16.0 (256) 0.2 (837) 5.56 (0.977)
Roof Insul
2.5in (IN75) 2.5 in (6.4 cm) 0.2083
(0.0635) 0.0300 (0.052) 16.0 (256) 0.2 (837) 6.94 (1.220)
Roof Insul 3in
(IN76) 3 in (7.6 cm) 0.2500
(0.0762) 0.0300 (0.052) 16.0 (256) 0.2 (837) 8.33 (1.464)

89
APPENDIX – C
INPUT DATA IN eQUEST.

90

91


![HOME [] · Fibreglass Insulation Improving your home's insulation can reduce heating and cooling energy consumption by up to 40%. Fibreglass insulation is an easy, cost-effective](https://img.pdfslide.net/doc/110x75/5f10c9a17e708231d44ad137/home-fibreglass-insulation-improving-your-homes-insulation-can-reduce-heating.jpg)