Embed Size (px)
Citation preview
Lappeenranta-Lahti University of Technology LUT
School of Business and Management
Master's Degree Programme in Supply Management
Juho Punkari
ROLE OF INVENTORY MANAGEMENT IN VALUE CREATION
Examiners: Professor Katrina Lintukangas
Professor Veli Matti Virolainen

2
ABSTRACT
Author’s name: Punkari, Juho
Title of thesis: Role of inventory management in value
creation
School: LUT School of Business and Management
Master’s Program: Supply Management
Year: 2020
Master’s Thesis: Lappeenranta-Lahti University of Technology
LUT
75 pages, 10 figures, 2 tables
Examiners: Professor Katrina Lintukangas
Professor Veli Matti Virolainen
Keywords: Inventory management, value creation
Objective of this thesis is to research how inventory management impacts the overall
value creation process. Furthermore, the study aims to identify how to best measure the
performance of inventory management and to examine how to improve inventory
management practices. Study is conducted as qualitative research due to the need for
collecting descriptive data on the topics. Chosen data collection method is semi-structured
interviews, which are carried out with the employees of a single case company. Case
company operates in footwear and apparel industry; thus, this research can give
implications especially applicable for the given field. Empirical data is supported by
literature review presented in the thesis on the main topics and concepts. Findings of the
research suggest that there are multiple factors influencing end customer value. However,
main role of inventory management was found to be ensuring on time delivery, with the
lowest possible costs, while assuring efficient flow of information from customers to
suppliers and vice versa, as well as within the organization. Furthermore, findings
indicated that the performance of inventory management is best measured by using
multiple metrics together and that there are challenges in implementing best inventory
management processes, even when these practices are known and understood within the
organization. Future research is required in the field to reach generalizable results.

3
TIIVISTELMÄ
Tekijä: Punkari, Juho
Tutkielman nimi: Role of inventory management in value
creation
Tiedekunta: Kauppatieteellinen tiedekunta
Maisteriohjelma: Supply Management
Vuosi: 2020
Pro Gradu -tutkielma: Lappeenrannan-Lahden teknillinen yliopisto
LUT
75 sivua, 10 kuvaa, 2 taulukkoa
Tarkastajat: Professori Katrina Lintukangas
Professori Veli Matti Virolainen
Hakusanat: Varastonohjaus, arvonluonti
Tämän laadullisen tutkimuksen tavoitteena on tutkia kuinka varastonohjaus vaikuttaa
arvonluontiprosessiin. Lisäksi työ pyrkii määrittelemään kuinka varastonohjauksen
onnistumista voidaan parhaiten mitata, sekä kuinka parantaa toiminnon prosesseja.
Tutkimus on toteutettu tapaustutkimuksena, jossa empiirinen tieto on kerätty
haastatteluilla. Case-yhtiön toimiala on kenkä -ja vaatemuoti, jonka vuoksi tutkimus
tarjoaa alakohtaisia yksityiskohtia aiheeseen liittyen. Tutkimus sisältää myös katsauksen
akateemiseen kirjallisuuten aiheiden ja käsitteiden määrittelemiseksi. Tulokset osoittavat
monen asian vaikuttavan arvonluontiprosessiin, mutta varastonohjauksen roolin olevan
tuotteiden oikea-aikaisen toimittamisen takaaminen, kuluja halliten, ja tiedon välittämisen
edesauttaminen aina asiakkailta toimittajille ja toisinpäin, kuten myös organisaation
sisäisesti. Lisäksi tulokset esittivät, että onnistumisen mittaamiseen paras menetelmä on
käyttää useaa mittaria yhtäaikaisesti. Parhaiksi havaittujen prosessien toimeen panossa
löydettiin haasteita, vaikka organisaatiossa ymmärrettäisiinkin muutoston tarve.
Tutkimuksen tuloksia ei voida pitää yleistettävinä ja lisätutkimus aiheeseen liittyen on
tarpeen.

4
ACKNOWLEDGEMENTS
I would like to thank my supervisors Katrina Lintukangas and Veli Matti Virolainen for
their help and feedback on my thesis. I am also grateful for all the professors and staff
who guided me during my studies in LUT. Attending LUT was truly a great and
unforgettable experience.
I want to thank all my colleagues who supported me in writing my thesis. I would not
have been able to complete the work without their aid and inspiration throughout the
process.
Finally, I would like to express my gratitude to all my friends and family members for
their endless encouragement and support.
Amsterdam, 27.9.2020
Juho Punkari

5
TABLE OF CONTENTS
1 INTRODUCTION ....................................................................................................... 7
1.1 Background .......................................................................................................... 7 1.2 Research questions and objectives ....................................................................... 8 1.3 Methods and delimitations ................................................................................... 9 1.4 Definitions and key concepts ............................................................................. 10 1.5 Theoretical framework ....................................................................................... 11
1.6 Structure of the research .................................................................................... 13
2 THEORY AND LITERATURE ................................................................................ 15
2.1 Value creation .................................................................................................... 15
2.1.1 Value chain and business model ............................................................ 16 2.1.2 Value delivery and capture .................................................................... 18
2.2 Inventory management ...................................................................................... 19
2.2.1 Lean Management .................................................................................. 22 2.2.2 Material requirements planning (MRP) ................................................. 24 2.2.3 Performance metrics .............................................................................. 27
3 RESEARCH METHODOLOGY ............................................................................... 31
3.1 Data, methodology and analysis ........................................................................ 31
3.2 Reliability and validity ...................................................................................... 33
4 EMPIRICAL FINDINGS AND ANALYSIS ............................................................ 35
4.1 Case company profile ........................................................................................ 35 4.1.1 Business model ...................................................................................... 36
4.1.2 Value stream .......................................................................................... 41 4.2 Inventory planning ............................................................................................. 43
4.2.1 Impact on value creation ........................................................................ 49 4.2.2 Measuring performance ......................................................................... 52
4.2.3 Discovered challenges............................................................................ 54 4.3 Identified improvement opportunities ............................................................... 57
4.3.1 Inventory planning ................................................................................. 57 4.3.2 Key performance indicators ................................................................... 59
5 CONCLUSIONS ........................................................................................................ 62
5.1 Summary of results ............................................................................................ 62 5.2 Conclusions........................................................................................................ 67
5.3 Limitations, validity and reliability ................................................................... 68 5.4 Future research ................................................................................................... 68
REFERENCES................................................................................................................ 70

6
LIST OF TABLES AND FIGURES
Figures
Figure 1: Theoretical framework.
Figure 2: Porter’s generic value chain
Figure 3: Inventory movement in Pull vs Push system
Figure 4: Metrics Journey
Figure 5: MTS vs MTO approach in case company
Figure 6: Case company monthly buy process
Figure 7: Buy strategy assignment
Figure 8: Information flows outside of monthly buy process
Figure 9: Order on-time coverage metric
Figure 10: MRP requested production schedule on products planned late
Tables
Table 1: Standard inventory metrics
Table 2: Interviewees for data collection

7
1 INTRODUCTION
This chapter will begin by giving the background of the thesis, to provide understanding on
why this research was needed. From there, objectives are examined more in detail, along
with the research questions for the thesis. Furthermore, the selected research methodology
is briefly introduced and delimitations for the thesis presented. These sections are followed
by definitions on the key concepts used in this research, which will enable the discussion
later in the paper. Key concepts will further be supported by literature review in chapter two.
After presenting the key concepts, this chapter will continue to examine the theoretical
framework established for this study. Finally, structure of the thesis is presented in the last
part of this chapter. Following chapters of the paper will examine more thoroughly the theory
and literature regarding the topic, research methodology of the study, empirical findings and
conclusions of the thesis.
1.1 Background
Traditionally the literature on value chains has very much concentrated on capturing the full
financial value added by each step of the process, whereas research on supply chains has
mostly focused on operational excellence and tools. There has been very little research
combining these two aspects, which has led to scarcity of theory that would link together the
strategic value creation and operational sides of supply management. (Holweg & Helo 2014,
230-231.) This thesis aims to build on the previous literature, by merging the operational
view on inventory management and existing understanding of value creation process.
Recent studies have gone towards the direction of broadening the overall idea of value
creation to include customers, suppliers, networks and business ecosystems. Furthermore,
supply management has undoubtably a role within the value creation process, but most of
the literature so far has focused on the savings attained in purchasing, although some
research has been done on value creation through collaboration with suppliers. (Kähkönen
& Lintukangas 2018, 979-980, 991.) This thesis positions itself to cover the gap that exists

8
in regard to the relationship between value creation and inventory management. Need for
this type of research was also pointed out by Chikán (2009, 131.), who states that recent
developments in business environment have led to inventory management taking more
strategic role in companies and that this shift has created a call for more research on the
relationship between inventories and value creation. Existing literature has proven inventory
management to have direct effect on the performance of a company, however the impact
varies significantly depending on the industry in question (Koumanakos 2008, 356-358).
Therefore, conducting this research on specific field can provide new insights that are
distinct for that business area. This is something to be considered regarding the results of the
thesis, as the study is done in very specific industry; footwear and apparel business.
Selected case company was chosen because it matched the profile required for this research,
although it is important to disclose that the company in question is also author’s primary
employer. In addition to analyzing the impact of inventory management towards created
value, this thesis also aims to understand potential improvement opportunities for the
inventory management function as well as ideal key performance indicators. Chapter two
will dive more in depth regarding the literature gathered for the theoretical backgrounds of
this research. Furthermore, the case company and its business model are introduced with the
empirical findings in chapter four.
1.2 Research questions and objectives
Aim of this research is to build on existing theory and literature on inventory management,
to further understand how inventory planning impacts value creation. Moreover, the case
company in question operates in footwear and apparel industry, thus this study’s objective
is to garner observations of this specific business field in relation to inventory management.
Furthermore, aim includes understanding which metrics would be most efficient in
measuring the performance of inventory management. Ideally, this study can provide
insights and managerial implications, derived from the research, leading to process
improvements in inventory management.

9
In line with the objectives of this thesis, main research question for this study is:
How does inventory management create value?
Supporting sub questions selected for this thesis are:
How to measure performance in inventory management?
How to improve practices in inventory management?
Empirical research will concentrate on gathering data to answer these questions and compare
the findings with established theory on the topics. Finally, chapter five of this thesis will
present the discussion and conclusions based on the collected data in relation to these
research problems and the needs that remain for further research.
1.3 Methods and delimitations
Research was chosen to be carried out as a qualitative study because qualitative approach
allows collection of descriptive data, explaining life world phenomena, that cannot directly
be measured by numbers (McNeill 2006, 77). Thus, qualitative research method was found
to be most suitable for the research problems of the thesis. Furthermore, data collection is
conducted through series of interviews, as attaining descriptions from the interviewees and
interpreting those descriptions is imperative for understanding the phenomena in question.
Moreover, these interviews are conducted by the author, in a semi-structured format, with
the employees of the case company. In addition to the empirical data collection, literature
review is performed, to define main theory related to the research and to merge the existing
knowledge in the field into the body of the work. (Brinkmann 2013, 21-22, 87.) Research
methodology, as well as the reliability of this study, are discussed further in detail in chapter
three of this thesis.
10
This research is carried out as single case study; thus, the results cannot be widely
generalized without further consideration. Scope of this thesis is delimited to consider
inventory management function, leaving out other functions within the case company,
except when discussed in direct relation to inventory management. Furthermore, literature
review on inventory management is focused on theory relevant for the case study; material
requirements planning, and lean management are examined due to their relevance for the
case company, along with general definitions on inventory management. Moreover, theory
on value creation is reviewed in relation to inventory management. These delimitations are
established not to digress from themes relevant for research questions.
1.4 Definitions and key concepts
Thesis is constructed around the theory on inventory management and value creation. In
addition to these main themes, several concepts need to be defined to enable comprehensive
discussion on the topic. This sub-chapter will briefly determine some of these concepts, to
provide compact view on the main subjects involved in the study. These themes are
examined more in depth in chapter two, which represents the literature review for this
research.
Supply chain: “System of organizations, people, activities, information, and resources
involved in moving a product or service from supplier to customer. Supply chain activities
involve the transformation of natural resources, raw materials, and components into a
finished product that is delivered to the end customer” (Singh & Verma 2018, 3868).
Value chain: Theory presented by Porter in 1985, used to describe role of different functions
within a company and how they add value to the final product. Furthermore, differences in
value chains determine direction of competitive advantage among firms. (Porter 1985, 33-
36, 38.)

11
Value proposition: Reason why customer choses a product or a service. Something that the
company can do to solve a problem or satisfy a need the customer has. Value offered to the
customer can be both emotional or functional, qualitative (experience, design, etc.) or
quantitative (cost, speed, etc.) (Osterwalder & Pigneur 2010, 22-23.)
Business model: Describes how company seeks to reach its goals - how organization or its
unit creates, delivers and captures value. Typically, resources, structure and the value
proposition of the firm are considered as part of the business model. (Geissdoerfer et al.
2018, 402-403.)
Inventory: “Inventory is the raw materials, work-in-process products and finished goods
that are considered to be the portion of a business's assets that are ready or will be ready for
sale. Inventory represents one of the most important assets of a business.” (Singh & Verma
2018, 3868.)
1.5 Theoretical framework
Framework for this study, as visualized in Figure 1, consists of inventory management as
part of the wider value chain, contributing to the final value proposition towards the customer
in the business model of a company. Value chain was first introduced by Porter (1985, 33-
36.) to examine how different functions within an organization contribute to the final value
created for the customer. Moreover, Porter suggested that differences in value chains are the
source of competitive advantage for firms over others. Business model itself describes how
a company is structured and how it seeks to reach the goals it has determined (Geissdoerfer
et al. 2018, 402-403; Massa et al. 2017, 73). However, as this thesis is delimited to value
creation in relation to inventory management, other internal functions of the organization
are not examined.
As suppliers are part of the overall business model and closely intervened with the inventory
management performance of a company, vendors are included in the framework as partners
in value creation. This is aligned with broadened view of resource-based theory, which

12
considers co-operative partnerships as part of the rare, valuable, inimitable, and non-
substitutable resources that shape company’s competitive advantage (Massa et al. 2017, 97;
Hitt et al. 2016, 77). Furthermore, principles of lean management also encourage to build
knowledge-sharing networks between a company and its suppliers, to maximize efficiency
throughout the supply chain (Dyer & Hatch 2004, 61).
Finally, customer must utilize the goods to create actual value in use, and therefore
customers are considered part of the business model and the framework for this research
(Grönroos & Ravald 2011, 7-8). Moreover, this approach aligns with theories on value
networks (Kothandaraman & Wilson 2001, 380.) and value co-creation (Kähkönen &
Lintukangas 2018, 981; Andreu et al. 2010, 249.), which consider all participating partners
as contributors in the value creation process. Figure 1 presents these contributors in the
overall value creation process, which translates to the business model of an organization.
Inventory management is singled out from the value chain as this research concentrates on
the questions relating to its part in the value creation process.
Figure 1. Theoretical framework.
This framework is used as the structure for the theory in the study and to presents the angle
from which the research problems are observed from. Theories and concepts are examined
more in detail in chapter two of this thesis. Determined framework, along with the supporting
13
concepts, will be later used to analyze the empirical findings of the study. Furthermore,
thesis will discuss literature published on the theory presented in the framework to establish
a foundation which can then be built upon, by the findings of the study. Moreover, results
and conclusions of the thesis will compare the existing theory and empirical findings of the
research.
1.6 Structure of the research
Thesis is constructed to a format in which first chapter introduces the background of the
study as well as its main objectives and research questions. Furthermore, delimitations are
defined along a brief overview on the research methods used. In addition, chapter one
outlines the key concepts of the research, to be later applied in the coming chapters.
Theoretical framework is also presented to establish the foundation for the literature review
and empirical analysis in the thesis.
Second chapter of thesis is a literature review conducted by the author on academic literature
and publications regarding the main theories utilized in the research. Both inventory
management and value creation, along with the key concepts of the study, will be closely
examined to reach comprehensive understanding of the theoretical background. Therefore,
this chapter enables the empirical analysis and final conclusions in later parts of the thesis,
through examining current academic perception of the main theories involved.
After presenting theory and literature, thesis will move on to discuss the research
methodology and data collection more in detail in chapter three. Aim of this part of the
thesis is to introduce how required data was collected and analyzed, and on what premises
were these certain methods chosen. Furthermore, the reliability and validity of the research
are discussed in this chapter. Following chapter will demonstrate the actual findings that
resulted from research.
Chapter four goes through the empirical findings and analysis conducted by the author.
Moreover, case company and its business model are examined along with the discoveries
14
regarding inventory management. Aim of the chapter is to present collected data for the final
discussion and conclusions of the thesis. The empirical analysis in this chapter is based on
results gathered during the research and built upon the theory established on earlier chapters
of the thesis.
Fifth and last chapter of the thesis concludes the research by summarizing the findings and
results of the study. Furthermore, author will discuss the final conclusions of the thesis.
Additionally, the limitations of the thesis, as well as the need for future research regarding
the topics are discussed in this chapter.
15
2 THEORY AND LITERATURE
This chapter will focus on presenting the existing theory related to the main topics of the
thesis. Literature review will allow discussion within the presented framework in the coming
chapters, which will add the element of empirical research and analysis to the study. First,
value creation, delivery and capture are discussed in relation to supply management and
therefore inventory planning. Concepts, such as value chain, resource-based view and
business model, are defined, after which the chapter will proceed review when and how
value is realized in the scope of this thesis. Once value components have been clearly
determined, the chapter will discuss inventory management. Background is presented by
compiling studies done so far on inventory management, along with the main theories related
to this research. Following chapters of this paper will include discussion and conclusions
that are built on the theory and literature accumulated in this chapter.
2.1 Value creation
Value creation is considered a key concept in various fields and has attracted fair amount of
research throughout the years; however, it could be argued that holistic consensus has not
been formed on how value creation should exactly be defined. This could partly be due to
such diversity in perspectives looking at value creation from variety of academic disciplines.
(Lepak et al. 2007, 180, 190.) Furthermore, value can mean different things to different
individuals as well as it can be perceived differently by various stakeholders of a company.
Thus, the subjective nature of value creation leaves some room for interpretations. (Bowman
& Ambrosini 2010, 479; Lepak et al. 2007, 192; De Chernatony et al. 2000, 52-53.) As this
thesis considers value creation in regards to inventory management, aspects of value that are
not relevant to supply management of an enterprise are delimited from this research.

16
2.1.1 Value chain and business model
Porter (1985, 33-36.) introduced value chain to examine different function within a company
and how they add value to the final product. Furthermore, he determined that differences
between value chains are the root cause for competitive advantage separating companies
from each other. Porter (1985, 38.) considered the created end value as the final price
customer is willing to pay for the product. Thus, margin being the difference between the
cost of the value activities and the amount received for delivering the product. In addition,
value chain divides functions to be considered either supporting activities or primary
activities as presented in Figure 2. Porter’s model has been criticized for considering only
the activities taking place within the single firm, whereas modern literature finds co-
operative partnerships between companies one of the key factors in value creation.
(Kothandaraman & Wilson 2001, 379-380).
Figure 2. Porter’s generic value chain (1985, 37)
Resource-based view (RBV) was discussed by Barney (1991, 99.), who stated that sustained
competitive advantage can be achieved through management of rare, valuable, inimitable,
and non-substitutable resources held by the company. Valuable and rare resources are the
key in RBV for gaining competitive advantage. Furthermore, to maintain the competitive

17
advantage, it is imperative that the resources are in addition non-substitutable and inimitable
by other enterprises. (Hitt et al. 2016, 78.) RBV has been considered as one of the main
theories determining how value is created and captured, however criticized for concentrating
on the internal resources and dismissing essential external factors impacting value creation
(Massa et al. 2017, 75, 97). Furthermore, idea of value creating networks has become more
popular in recent theory. Value network is considered to consist of several companies
working in co-operation to deliver value for the end customer. (Kothandaraman & Wilson
2001, 380.)
Building on Porter’s idea of using value chain, to examine the organization structure and
value adding activities, and the resource-based view, in last decades the concept of business
model has received fair amount of attention (Morris et al. 2005, 727-728). With literature
accumulating on the topic, many different views and definitions have surfaced (Geissdoerfer
et al. 2018, 404; Massa et al. 2017, 77-78; Morris et al. 2005, 728). However, although the
definitions are not in full consensus when it comes to details, the general accepted idea of
business model is to present structure of an organization and how it seeks to reach its goals
(Massa et al. 2017, 73). The concept itself started to gain popularity during the 1990s dot-
com boom, as it was found useful when presenting complicated ideas to potential investors,
sometimes in very short timelines (Geissdoerfer et al. 2018, 402). In modern literature,
business model is perceived to describe, plan or analyze, how organization or its unit,
creates, delivers and captures value. Furthermore, the model recognizes the economic
structure (costs, revenues, inventory turnover, et cetera), key resources (people, technology,
tools, knowledge, brand, et cetera) as well as the value proposition towards the customer.
(Geissdoerfer et al. 2018, 402; Massa et al. 2017, 75; Osterwalder and Pigneur 2010, 14;
Johnson et al. 58.)
This thesis will consider inventory management as part of the company’s value chain,
however, extending the business model to include both suppliers and customers to gain
holistic view on created value throughout the process. This is aligned with broadened view
on resource-based theory, which is extended to consider co-operative partnerships as part of
the rare, valuable, inimitable, and non-substitutable resources that shape company’s
competitive advantage (Massa et al. 2017, 97; Hitt et al. 2016, 77).
18
2.1.2 Value delivery and capture
After defining the framework for participants in the value creation process, it is just as
important to understand how the value is realized. Bowman and Ambrosini (2000, 2-4.)
introduced a theory of dividing created value to use value and exchange value, where the
first represents the perceived value by the customer, whereas the latter is the amount paid
when the exchange is realized. Moreover, exchange value is what the customer pays to
receive the use value. Therefore, value can’t be truly defined before the newly created use
value has been sold and customer has agreed to certain exchange value. Buying party usually
compares the product or service with competing offers and choses the one they deem to have
the highest use value, validating the exchange value. Furthermore, use value is subjective
and perceived by the customer. De Chernatony et al. (2000, 51-53.) stated that value
perceived by the customer can be either functional or emotional, however always relative to
the competition. Profit is made when exchange value is higher than what the company
invested in creating the use value (Bowman and Ambrosini 2000, 5; Porter 1985, 38). If the
monetary amounts received by the seller is not higher than the costs occurred from creating
the use value, business can be considered unsustainable in a longer term. Same way,
customers don’t tend to repeat the business action if they won’t receive use value higher than
the exchange value. Therefore, both these conditions need to be fulfilled repeatedly to
maintain sustainable business relationship. (Lepak et al. 2007, 182.)
Once company has acquired a resource, such as raw material or a tool, the labor force of the
organization needs to transform those resources by adding their input to create value.
Resources on their own are not worth more than when they were procured, without at least
some intervention from the employees. Therefore, competitive advantage can be reached
only through the difference made by the labor force within the organization in comparison
to competition. Contrarily, unproductive labor, such as working on factors the customers
don’t deem valuable or unnecessary supervision, can destroy value and make the company
less competitive. (Bowman and Ambrosini 2000, 5-6). Thus, it is crucial for the company to
understand what adds value for the customer, to be able to adjust its investments and efforts
accordingly.
19
It is important to highlight that in modern literature, value is not perceived only as monetary,
but can also be tied to something more abstract, such as time and effort (Chernatony et al.
2000, 40, 46). Furthermore, value can be considered as the difference between the benefits
and sacrifices involved in the process (Kähkönen & Lintukangas 2018, 980). Value creation
is only realized finally in use; thus, it should be considered separate from the resource
produced for the value creation purpose. Moreover, value can be created from a produced
resource, but for that the customer needs to integrate the resource in the process and gain
actual value-in-use from it. Hence, value is not created by the supplier itself, but instead in
the process in which the customer uses the provided product or service. (Grönroos & Ravald
2011, 7-8.) Therefore, company’s supply chain aims to create value from the inputs it
receives from the firm’s suppliers in form of resources and capabilities. Through
collaboration and knowledge accumulation, supply management can be part of creating
value simultaneously for the firm, suppliers and customers. Combining resources and
capabilities for value creating activities, can result in both monetary and non-monetary gains
for all parties. (Kähkönen & Lintukangas 2018, 981). Therefore, maximized benefits are
not received in simplified transaction, but by sharing knowledge and resources to boost the
co-creation of value for all the partners involved. (Andreu et al. 2010, 249). This is aligned
with earlier notion, extending business model to include company’s suppliers and customers.
2.2 Inventory management
Singh and Verma (2018, 3868) define inventory management as “the continuing process of
planning, organizing and controlling inventory that aims at minimizing the investment in
inventory while balancing supply and demand”. Inventories are unavoidable for many
industries and can tie up vast amounts of capital, but despite this, literature regarding
inventories is scarce in comparison to many other fields in business (Chikán 2007, 54).
Inventory management is crucial part of business and by investing in optimizing it,
companies can have substantial positive impact on the operating cost of the enterprise.
Furthermore, inventory can be considered both an asset and a liability depending on the
situation. High inventory levels can create unnecessary costs as well as consume physical
space that could be used for something else. Carrying substantial amounts of excess stock

20
can hide fundamental issues in company’s planning and processes that are never unveiled
due to high inventory making up for them. On the other hand, maintaining too low of an
inventory level can result in bad customer experiences and risk of disrupting business.
(Koumanakos 2008, 356).
In the most basic essence, the purpose of inventory management is to maximize sales and
profit by ensuring enough inventory is on hand when needed, while still maintaining as low
of a total stock level as possible to minimize costs associated with holding inventory.
Another additional aspect is considering purchasing costs that are influenced by volumes
bought and potential price shifts. (Ahmad & Zabri 2018, 83.) In modern literature,
inventories are viewed as strategic assets for value creation and means of flexibility and
control. However, this is not how inventory management has always been perceived, but
development brought by changes in business and economic environment. (Chikán 2009,
132.)
Literature regarding inventory research started really cumulating in the 1950s on both
mathematical and conceptual sides, building on earlier theory which had been relatively
simplified (Chikán 2007, 55). Until mid-1970s inventories were primarily managed through
carrying excess volume to safeguard business opportunities, but along with the
developments in technology, tracking inventory data came a bigger focus. New tools
provided management teams with better opportunities to put in place processes on inventory
control, with the aim to reduce unnecessary costs related to storage spaces, taxes, insurances
etc. During the next couple of decades, inventory levels came down substantially from what
they had been in many industries. (Loar 1992, 70-71, 93.) Another significant development
from that period was that inventory management was no longer seen as separate entity, that
could be handled independently from other functions within the enterprise (Chikán 2009,
132). Later, in 1990s, lean thinking influenced perception of inventory management greatly,
which is discussed more thoroughly in sub-chapter 2.2.1.
Korhonen and Pirttilä (2003, 195.) suggest, that to improve processes regarding inventory
management, cross functional nature of the decision making needs to be thoroughly
considered. Furthermore, this is crucial as inventory management is linked to many of the
functions within a company, which can create friction if priorities are not aligned. Chikán

21
(2009, 132.) also highlights the need for functional integration in modern inventory
management along with Chaharsooghi and Heydari (2010, 283-285). Lack of alignment can
easily lead to a situation where inventory levels are kept higher than operationally necessary
or economically efficient, just to relief organizational pressure (Korhonen & Pirttilä 2003,
195; Koumanakos 2008, 356). Thus, it is imperative to maintain cross functional
understanding of the inventory strategy within the company when striving for best practices
in inventory planning.
Choosing an inventory strategy is in the end a trade-off between lowering costs and ensuring
certain service level (Ahmad & Zabri 2018, 83). In times of uncertainty, when forecasting is
challenging, companies often choose to keep safety stock to guarantee degree of service with
the aim of maximizing profitability (Chaharsooghi & Heydari 2010, 283-284). For complex,
specific or expensive products, firms can be inclined to choose Make-To-Order (MTO)
strategy instead of Make-To-Stock (MTS) approach. MTO is less risky in terms of
cumulating excess inventory, but capacity planning on the other hand can turn into a
challenge, which is a problem when lead-time is the key to competitive advantage.
Furthermore, in a scenario where a company offers variety of products from which some fit
MTS better and some MTO, hybrid model can ease the capacity planning if MTS products
can be produced in times of slow demand for MTO goods. (Soman et al. 2004, 223-225.)
Another way to look at inventory strategy is to consider the process either push or pull
system. In a pull, process is initiated by customer order and the supply chain acts as a
response, whereas in a push, process acts in anticipation of demand. (Singh & Verma 2018,
3869.)
Lot sizing is often used in modern inventory planning to determine when production should
take place to ensure on-time delivery, while still minimizing the costs such as holding
inventory, transaction and production costs. Where lot sizing scenarios often succeed to
recognize associated costs and product lead times, they have not usually considered the
limitations in production and inventory capacity. (Woarawichai et al. 2011, 250.) Berretta et
al. (2005, 261-263) are aligned to this in their findings, but also point out that many of the
automated material requirements planning (MRP) systems fail to recognize setup, inventory
and production costs in addition to capacity constraints when determining lot sizing.

22
MRP system is further examined in chapter 2.2.2, due to its critical role in inventory
management for the case company and thus for this research. Furthermore, final part of this
chapter will review literature discussing different methods of measuring performance of
inventory management. However, firstly lean management is explored, to reach
comprehensive understanding of the differences between pull and push approaches in
inventory management. In addition, lean management will bring in more process-oriented
aspect. Examining these two widely used methods will allow this thesis to compare the
practices and determine which is more favorable considering the priorities and current
strategy of a company.
2.2.1 Lean Management
Idea of lean management started to spread from early 1990s and widely influenced the
thinking regarding inventories. Core objective in lean is fine tune processes and remove
everything that is deemed unnecessary with the aim of reaching highest possible efficiency
(Machado & Leitner 2010, 383). Term “Lean” was first used by John Krafcik, who was part
of the MIT International Motor Vehicle Programme (IMVP). IMVP was led by Daniel Roos,
James Womack and Daniel Roos, who published their findings in the book The Machine
that Changed the World, in 1990. Womack and Jones continued identifying the lean
principles in their book Lean Thinking, published in 1996 (Bendell 2006, 257).
Lean management originates from Toyota Production System (TPS), which was developed
in Japan, by Toyota Motor Corporation. TPS was built on the idea of doing more with less,
by rationalizing processes to achieve efficiency and higher quality of end products.
(Machado & Leitner 2010, 383.) Soon after the Second World War, Kiichiro Toyoda
(member of the founding family of Toyota) and Taiichi Ohno (Toyota’s leading
manufacturing engineer) had a chance to visit Ford Motor Company’s factories. Toyota took
some methods from Ford’s, at the time, impressive and extremely effective production line,
but transformed attention towards the total process instead of just mechanical efficiency.
This eventually led to lean management. (Riviera et al. 2007, 243-244.)

23
The goal of lean is to improve process through eliminating all waste. The steps that are non-
value adding in the process, the steps that customer is not willing to pay for, are considered
waste. Key is to identify which parts of the process are value adding and which are non-
value adding so that the waste can be eliminated and eventually all steps in the process create
value for the customer, forming a value stream. Waste can be categorized into seven areas
from which unnecessary inventory is one. The other six types of waste are waiting, over
processing, defects, over production, unnecessary motion and excessive transportation.
(Machado & Leitner 2010, 384.) For eliminating waste, it essential to understand the
following main principles of lean thinking:
• Understand what creates value for the customer
• Identify the value streams of each product/service, to see the non-value adding steps
• Create continuous flow through the process, without waiting or interruptions (JIT)
• Establish pull, customer must pull products from the system and the same way activities of
the process pull from previous steps (Kanban). Only make what is needed
• Continuous pursuit of perfection (Kaizen)
The transformation towards lean methods starts by understanding and mapping the current
state of the process in hand. For this, it is crucial to understand what creates value and
therefore what can be considered as waste. Next step is to set the goal for future, defining
which activities in process are futile and therefore removed or replaced in the future. When
the vision for future and the plan how to carry out these changes are set, the implementation
of lean practices can begin. All employees should be committed to continuous improvement,
kaizen, and the state should be sustained so that newly implemented practices won’t slip
away in time. (Machado & Leitner 2010, 390-391.) Lean thinking also encourages
companies to create knowledge-sharing networks between the company and its suppliers, to
maximize efficiency throughout the supply process, the value stream (Dyer & Hatch 2004,
61).
There are several methods, such as the mentioned JIT (just-in-time) and kaizen, and tools
for measuring, mapping and developing processes in lean. Goal of these methods and tools
is to outline the current situation or to strive towards flexibility, lower costs, inventory
reduction, better cycle time, efficiency and higher quality (Belekoukias et al. 2014, 5346-

24
5350). Especially JIT and Kanban can be seen as relevant principles to consider in terms of
inventory planning, as the idea is based on pull system, opposed to push. Differences
between these two methods are more thoroughly reviewed in following sub-chapter.
Furthermore, understanding value creation of inventory management is directly linked to
this research. Therefore, these attributes of lean management will be taken into consideration
later in this thesis, when findings, analysis and conclusions.
2.2.2 Material requirements planning (MRP)
In its basic essence, material resource planning is used to determine the flow in which
materials need to be purchased and produced to fulfill the estimated finished goods demand
in each given time. MRP considers the lead-times of components and factors in the parts that
need to be acquired or produced to complete the final product. Due to these qualities, many
companies have chosen to transition to MRP over the previously common reorder point
system, which wasn’t purely based on forecasted future demand of finished goods, but
instead mainly held safety stock thresholds for each component separately (Cooper & Zmud
1989, 471-472.)
Nowadays, MRP systems are widely used through enterprise resource planning (ERP)
software, which have become popular tools in many industries. This has been enabled by the
reduction in costs of powerful computing technology, but still there are challenges in running
complicated MRP models and including all desired variables. Especially inventory and
production capacity are factors that have commonly been left out of solutions provided to
companies. (Milne et al. 2015, 220-221; Clark 2003, 115.) In addition to missing certain
capacity constraints, MRP has been criticized for constantly assuming the same lead-time
for products, despite this not always being the case. Moreover, current production capacity
utilization rate impacts the lead-time of components accordingly, but this is not reality in
most systems used by enterprises today. (Jodlbauer & Reitner 2012, 4477-4480.) When lead-
times are expected to be the same for a batch of hundred and a batch of hundred thousand
units, capacity over or underutilization is bound to happen at some point. Thus, planners
often add in buffers to lead-times to avoid delays. (Plenert 1999, 95.) However, in recent

25
years several optimization and advanced planning tools have surfaced, which are tackling
the past issues within ERP run MRP capacity considerations to various degrees (Clark 2003,
115).
Plenert (1999, 91) suggests that the main reason many companies are sticking with MRP,
instead of divesting to earlier introduced JIT, or other system, is the initial investment and
re-structuring required for the change. However, JIT as a system is more effective mainly
when it comes to repetitive production, with little product variations and similar sized
production batches. Buffers used in lead-times tend to cumulate inventory in MRP guided
processes, whereas JIT is more efficient in keeping inventory levels low, as batch sizes are
usually smaller and safety stock is not utilized. MPR on the other hand generates bigger
production batches and therefore higher inventory in given times but is more labor efficient
and provides more product flexibility. (Plenert 1999, 91-94.) Furthermore, MRP can be seen
as a push system, where job is sent to next workstation after finishing previous step, which
means it might need to be stored for a while before process continues, if the second
workstation has accumulated backlog. In addition, unexpected increase in demand could
cause accumulation of work-in-process (WIP) stock in MRP run process. In JIT system, the
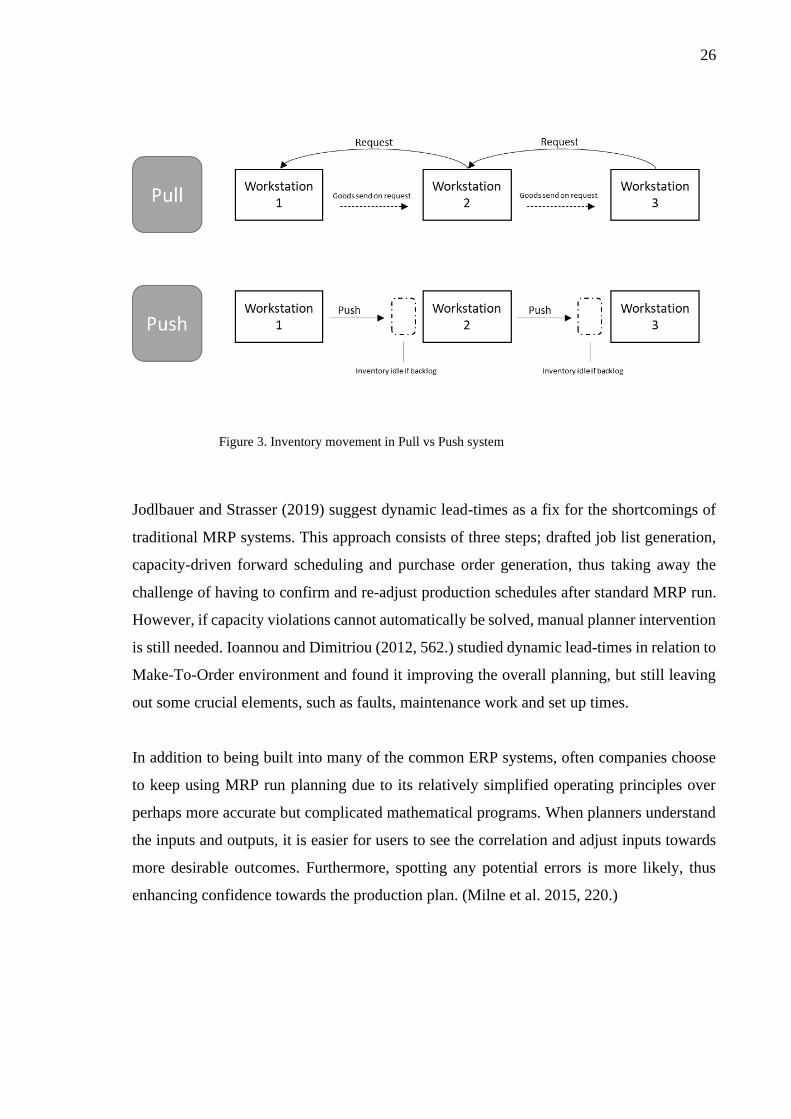
job is pulled from first workstation to the next, as demonstrated in Figure 3. Thus, as per
lean principles, waste such as inventory cumulation is eliminated. (Kumar & Panneerselvam
2007, 393-394.) Both systems are widely used, however based on very different premises.
MRP focuses mainly on scheduling, based on lead-times, that consider the labor intensity of
each step of production, leading to the finished good. Lead-times usually buffer in transfer
and waiting times, assuring that workers will always have the next batch to work on ready.
JIT doesn’t require much computation once it is set up and maintains low inventory level,
but can create labor inefficiency if workers need to wait for the previous step to finish before
getting to perform their own task. (Plenert 1999, 93-95.)
26
Figure 3. Inventory movement in Pull vs Push system
Jodlbauer and Strasser (2019) suggest dynamic lead-times as a fix for the shortcomings of
traditional MRP systems. This approach consists of three steps; drafted job list generation,
capacity-driven forward scheduling and purchase order generation, thus taking away the
challenge of having to confirm and re-adjust production schedules after standard MRP run.
However, if capacity violations cannot automatically be solved, manual planner intervention
is still needed. Ioannou and Dimitriou (2012, 562.) studied dynamic lead-times in relation to
Make-To-Order environment and found it improving the overall planning, but still leaving
out some crucial elements, such as faults, maintenance work and set up times.
In addition to being built into many of the common ERP systems, often companies choose
to keep using MRP run planning due to its relatively simplified operating principles over
perhaps more accurate but complicated mathematical programs. When planners understand
the inputs and outputs, it is easier for users to see the correlation and adjust inputs towards
more desirable outcomes. Furthermore, spotting any potential errors is more likely, thus
enhancing confidence towards the production plan. (Milne et al. 2015, 220.)

27
2.2.3 Performance metrics
In today’s business environment, many companies are seeking competitive advantage
through their supply chains and there is no doubt that company’s overall performance ties
very closely to the efficiency of its supply management. Enterprises are trying to shift their
supply and value chains to be more adaptive and responsive, however for this end,
organizations need to be able to measure the performance of these functions. (Anand &
Grover 2015, 135-136.) Carrying inventory is often seen as necessary evil, although it is
necessity in many industries. Therefore, firms mainly measure their inventory with the aim
of reducing their total stock levels. Most common metrics include inventory turn ratio,
weeks/days of supply and total monetary value of the inventory. Furthermore, it is important
that inventory can be segregated to understand what raw materials or goods are forming a
risk to the company in terms of aging or cumulating excess. (Krupp 1994, 1.)
Table 1. Standard inventory metrics (Bragg 2012, 210-238.)
Another accepted way of looking at the performance of inventory management, is examining
the fill rates and service level towards the customers. In cases where company doesn’t have
enough inventory to fulfill all the demand in the marketplace, it may choose to prioritize
some customers over others. Furthermore, customers can be divided into different segments,
which each have separate service level and fill rate targets assigned. (Samii et al. 2011, 393.)
Chosen metrics need to be chosen in accordance to the inventory management strategy of
the company. Fill rates provide crucial information in Make-To-Stock environments,

28
whereas on-time delivery performance is more sufficient indicator of performance for Make-
To-Order strategy. (Hausman 2004, 69.) Lead-times directly impact the customer service
level, even to an extent that holding safety stock and absorbing the costs can be more
beneficial for the organization than risking low customer satisfaction, which is known to
reduce future demand. (Milne et al. 2015, 221; Samii et al. 2011, 393.) In some industries,
it is possible to even have penalties determined for stockout situations (Torabi et al. 2012,
530). Hence, it is crucial to measure if the assigned lead-times are accurate to avoid
imprecise commitments towards the customers and to reduce holding costs derived from
carrying safety stock.
Cecere (2015, 124.) underlined that no metric should be examined in isolation, but together
with other inventory management performance indicators, to reach holistic understanding of
the situation. In addition, targets shouldn’t solely be based on historical performance, but
instead take reference from past, while in the end aligning to the outlook and strategic goals
of the company. Furthermore, just like corporate goals should flow down to reflect targets
of individual functions, employees should align their personal objectives to the functional
ones. By defining relevant performance measures, companies can simplify decision making
processes and reduce non-value adding activities. Moreover, improving supply chain is a
continuous effort that requires re-visiting the key performance indicators from time to time.
(Anand & Grover 2015, 136-140.)
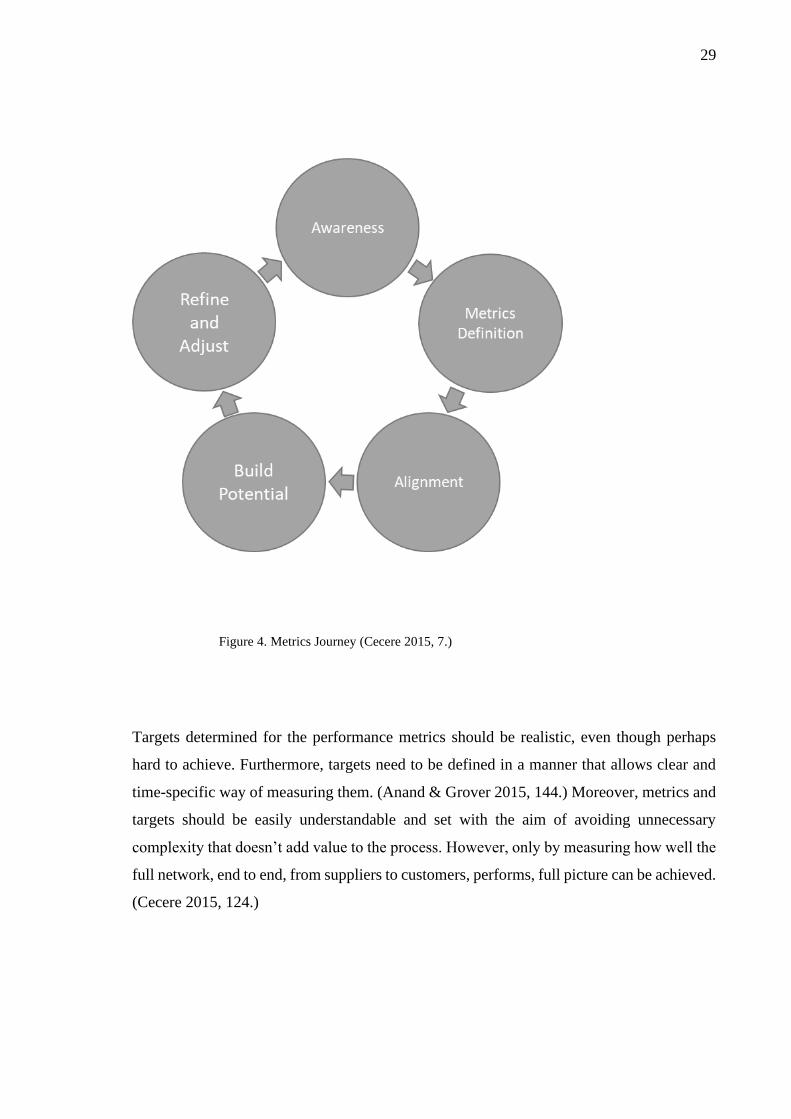
Figure 4 demonstrates the metric journey described by Cecere (2015, 7.), in which the
process starts with the awareness of need to change the existing performance metrics. This
is followed by revising the metrics to match current strategy of the organization and aligning
in the targets cross-functionally. Building organizational potential can be achieved by
benchmarking the performance against industry peers and creating a roadmap how to
maximize the potential of the company or function. Finally, metrics and targets need to be
fine-tuned to aim for highest long-term benefits.
29
Figure 4. Metrics Journey (Cecere 2015, 7.)
Targets determined for the performance metrics should be realistic, even though perhaps
hard to achieve. Furthermore, targets need to be defined in a manner that allows clear and
time-specific way of measuring them. (Anand & Grover 2015, 144.) Moreover, metrics and
targets should be easily understandable and set with the aim of avoiding unnecessary
complexity that doesn’t add value to the process. However, only by measuring how well the
full network, end to end, from suppliers to customers, performs, full picture can be achieved.
(Cecere 2015, 124.)

30
Based on the presented principles and inventory metrics, empirical part of this research will
review and discuss the methods used in the case company to measure the performance of
inventory management. Furthermore, the process of setting targets for the metrics in question
is examined and later discussed in relation to the theory presented. In addition, potential
improvement opportunities are presented and the role of inventory management function in
relation to value creation is further examined.

31
3 RESEARCH METHODOLOGY
This chapter will present how the empirical research for this thesis was conducted and
examine the chosen methods in relation to literature discussing research methodology. The
ways of data collection and analysis are reviewed first, after which the chapter will move to
consider the reliability and validity of the methodology chosen, and therefore the thesis
itself. Described methods will later be visible in coming chapters, which will more closely
interpret the findings and results of the research.
3.1 Data, methodology and analysis
Topic for this thesis was determined both through analyzing publications on inventory
management and by author’s experiences in the case company, thus the subject was selected
based on exposure to field situations and literature review (Krishnaswamy & Satyaprasad
2010, 25). Research was chosen to be carried out as a qualitative study due to the nature of
the objective, which was to understand how inventory management impacts the total value
creation. When attempting to understand how certain things work, qualitative study allows
most in depth and leveled analysis, because of descriptive nature of the data. (Brinkmann
2013, 141.) Moreover, value is not purely quantifiable in traditional terms, as defined in
chapter two, hence qualitative approach was most suitable option. In addition, the supporting
research questions presented in this thesis require qualitative aspect to provide needed
insights. As qualitative data is gathered in form of words, instead of numbers, it enables very
descriptive results to examine. (McNeill 2006, 77.) Furthermore, literature review was used
to create the theoretical background for the research. Thus, merging the existing knowledge
in the field to the body of the work. (Brinkmann 2013, 87.)
Research was carried out as a case study, which is widely established way of gaining
comprehensive, in-depth, understanding of a phenomenon and the interaction between
factors, explaining the present status (Krishnaswamy & Satyaprasad 2010, 15). Data
collection was performed through series of semi-structured research interviews with the

32
employees of the case company. Semi-structured interview method was selected as purpose
of the research was to examine life world phenomena, for which the method is suitable, as
it allows the interviewees to provide descriptions that can be interpreted to understand the
meaning of the phenomena. Furthermore, main goal of the interview process is to obtain
interviewee’s description on the topic rather than their theories on the subject. (Brinkmann
2013, 21-22.) Interviewees were working both within the inventory management team and
in close interaction with the function, thus able to provide characterizations and observations
from various angles and perspectives. Therefore, data collected, allows interpretation about
a life world phenomena through interviewees descriptions that are based on life world
experience on the subject.
Interviewing is considered favorable method in qualitative research, because often
respondents are more open to discuss matters than writing down their answers on paper.
Furthermore, semi-structured interviewing has certain benefits in comparison to other data
collection methods, such as allowing space for follow up questions and clarifications.
(Krishnaswamy & Satyaprasad 2010, 100). Therefore, semi-structured interviewing also
leaves room for dialogue that can be used to retrieve more in-depth insights. Moreover,
interview situation allows to modify or replace questions that the interviewee is not
comfortable answering, thus enabling data collection that might have been missed in a
survey or other stricter format. Hence, qualitative interviewing can, in many instances, result
in better quality of data than other research methods. (Krishnaswamy & Satyaprasad 2010,
100).
Table 2. Interviewees for data collection

33
Interviews were conducted through video calls and structured by pre-determined questions,
however allowing space for dialogue and follow up questions as defined for semi-structured
research interviews. Respondents didn’t receive the questions beforehand, to allow
interviewer to capture the authentic reactions and spontaneous descriptions. As presented in
Table 2, interviewees hold differing roles within the case company, thus allowing the data
to include aspects from diverse points of view.
3.2 Reliability and validity
All research studies must be open for critique and evaluation to ensure the reliability and
validity of the results. Assessing the methods used and accuracy of the findings reduces the
chance of the research leading to meaningless or even completely wrong implications. (Long
& Johnson 2000, 30.)
Reliability is generally considered best evaluated through the consistency of the measuring
instrument. Consistency can be assessed through understanding to what degree instances are
assigned to same category by different observers or by same observers on different
occasions. Validity in qualitative research can be determined based on the extent it describes,
theorizes or explains the features of the phenomena it aims to examine. Moreover, validity
is evaluated based the degree the research measures what it aims to study, the degree the
research investigates the entirety of the phenomena and the degree the method is related to
the outcome. (Long & Johnson 2000, 30-31.)
As the research was conducted as qualitative case study, the results are not fully
generalizable. However, case study can provide important insights and help to understand
phenomena in certain context. (Brinkmann 2013, 89.) Furthermore, results gained by
interviewing can be affected by interviewer's interactions, way of recording the answers and
inability to articulate the findings. (Krishnaswamy & Satyaprasad 2010, 101.) Interviewing
relies on subjectivity and researcher’s perception, which leaves room to discuss the analysis
and interpretations. Nevertheless, this doesn’t invalidate the findings or data collected, but

34
needs to be taken into consideration when evaluating the research. (Brinkmann 2013, 142-
143.)
Due to the nature of single case study, the results of the thesis cannot be generalized.
However, findings provide information from a life world phenomenon in a certain context.
Data collection was performed in a consistent manner, using the same semi-structured
interview format, allowing the observer to use same measuring instrument on multiple
occasions. Therefore, the study can be considered reliable and results valid. Interviewer’s
status as employee of the case company is disclosed, giving full visibility on the potential
impact it may have on the interpretations of the author. Furthermore, detailed description of
the research methodology allows reader to asses reliability and validity of the thesis.

35
4 EMPIRICAL FINDINGS AND ANALYSIS
This chapter will present the findings of the empirical research conducted for the thesis. First
sub-chapter will give a brief overview of the case company, to provide context on the results
and to explain the environment of the case study. Furthermore, business model of the case
company is examined, including the value proposition, hence providing a view on how the
firm operates and what it aims for. After looking into the case company, chapter will move
on to review the role of inventory management within the organization and the impact
inventory management has on the value creation. The interpretations of business model,
inventory management and value creation are derived from the data collected for the study
and discussed along the theoretical background presented in chapter two. In addition, current
performance measures for inventory management in case company are discussed in this
chapter. Finally, author will move on to present the discovered improvement opportunities
regarding the inventory planning function and on methods of measuring its performance.
Findings are summarized and further discussed in chapter five, which also includes the
conclusions of this thesis, along with the assessment for the need of future research on the
topic.
4.1 Case company profile
Research was conducted on a case company that operates globally in the footwear and
apparel industry. Its functions include all steps from designing the products to delivering the
goods directly to consumers or to retail partners. However, manufacturing is outsourced to
selected vendors. Firms direct to consumer sales are formed through both e-commerce and
owned retail store channels. Furthermore, the number of stores has exceeded 150 locations
to date. The yearly revenue of the case company is around two billion dollars and its products
are sold all around the world. Due to its over hundred-year-old history and some iconic
products, the company can be considered widely known. Moreover, based on yearly revenue,
the case company is one of the world’s biggest shoe companies.

36
4.1.1 Business model
All interviewees saw that case company’s customers expect shoes that please their fashion
taste in return for the monetary value they are exchanging the goods against. Furthermore,
IP1 and IP2 pointed out that consumers are looking not only design but also comfortability
in the product. These attributes can be seen as the value proposition towards the end
consumer.
“Bottom line for consumers is obviously the design, price and whether product is
comfortable to wear.” (IP2, 2020)
ECB elaborated that consumers are served both through retail partners and by the direct to
consumer channels owned by the case company. Moreover, the findings are very much
aligned with the existing theory, as value proposition is considered to include functional and
emotional factors (Osterwalder & Pigneur 2010, 22-23; De Chernatony et al. 2000, 51-53).
Design of the products creates emotional value whereas comfort functional value for the
consumers. In addition, IP2 and ECB highlighted that some consumers have emotionally
connected with the brand and used the products for a long time, which can bring them back
repeatedly.
“We have the consumers that are coming back, and they already really engage with our
fashion styles.” (ECB, 2020)
Literature review on the topic suggested that price point of the goods is crucial factor in the
exchange as the customers compare the perceived use value to the exchange value they
would need to pay in return (Bowman and Ambrosini 2000, 2-4). This statement was also
confirmed to apply in the field in question by the interviewees. However, in addition to direct
to consumer model, case company does business with retailers who then sell the product to
their customers. Therefore, it is imperative to also examine the value proposition towards
the retail partners to gain holistic understanding of the full business model.

37
Although case company is receiving smaller sales margin from selling the product to
retailers in comparison to selling directly to consumers, IP2 and SBP suggested that it is
beneficial practice for the firm due to the reduced overall risks involved. Retailers carry the
risk of running the stores and managing staff, as well as provide access to markets that could
be costly to enter, or sometimes even impossible, for example due to political reasons. In
return, retailers expect to purchase the goods with a price that still allows them to make
profit.
In addition to costs, main factors called out in terms of value proposition towards the retail
partners were the design of the products and delivery in accordance to the agreed schedule.
Retailers need for well-designed and high-quality product is very much aligned to the value
proposition towards the consumer, as in the end final customer is purchasing the same
product, only difference being the retailer in the middle, as pointed out by ECB.
Furthermore, level of service, agility and ability to adapt on special requests from the
retailers were mentioned as factors influencing the performance in the eyes of the retail
partners. SBP stated that commitment from case company on marketing investments is also
a point of consideration for the retailers, because the brand spent from case company would
drive traffic to stores selling the products of the case company, thus benefitting the retail
partners.
As established, design is very important in fashion, but so is getting the goods on the market
during the intended season. Interviewees all asserted this notion and that on-time delivery
plays a big role in customer satisfaction. Holding some level of safety stock has been
suggested as a solution to ensure a degree of service and to maximize profitability (Milne et
al. 2015, 221; Samii et al. 2011, 393; Chaharsooghi & Heydari 2010, 283-284.), however
IP1 and IP2 pointed out that this can generate is risk of cumulating inventory that will
become obsolete once the season the product was intended for is over. Furthermore, also
Krupp (1994, 1.) and Bragg (2012, 210-238.) highlighted the risk of generating aged
inventory and suggested that it is imperative to monitor this liability.

38
“Core business is very high volume of our business and for this group of products we always
want to have safety stock. Demand is constant. For these products we buy to stock. For the
rest we buy to order, except when trying to mitigate capacity peeks.” (IP1, 2020)
Case company has approached this issue by buying small number of “Core” products to
stock. Intention being to offer these products through always available model and this way
guarantee certain service level, whereas more seasonal styles are only produced against
orders. Soman et al. (2004, 223-225.) proposed hybrid approach between Make-To-Stock
and Make-To-Order strategies, however mainly due to benefits gained for capacity planning
purposes. Furthermore, literature reviewed was aligned to the perception of the interviewees,
IP1 and IP2, who stated that Make-To-Order carries less inventory risk. Moreover, case
company applies Make-To-Stock strategy to guarantee certain service level and Make-To-
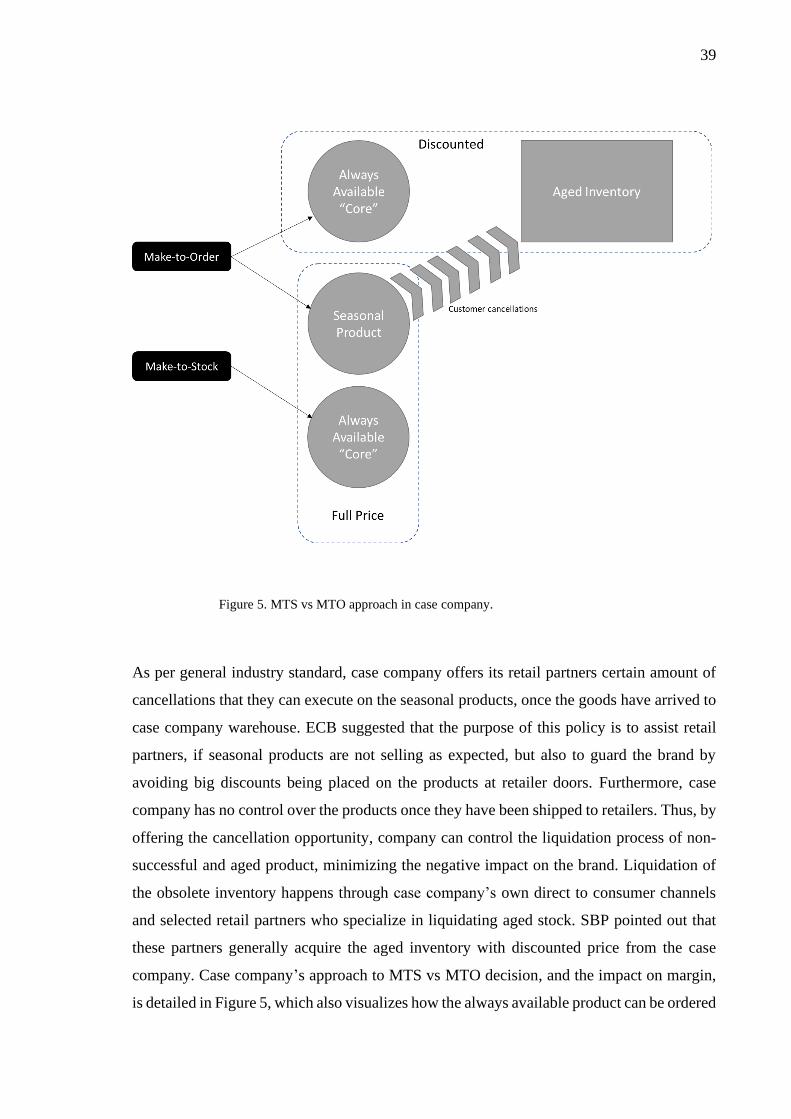
Order mitigate inventory risk for their seasonal offering as presented in Figure 5. Hence,
business model includes value proposition in which the intended competitive advantage is
speed (always available) and another where the delivery takes time, but the goods are
intended for a certain time period and come with a specific seasonal design. By producing
the seasonal products against orders, case company shares the risk with its retail partners.
Seasonal design on the products is part of the value proposition, whereas the always available
products that are made to stock don’t offer anything new in terms of design.
39
Figure 5. MTS vs MTO approach in case company.
As per general industry standard, case company offers its retail partners certain amount of
cancellations that they can execute on the seasonal products, once the goods have arrived to
case company warehouse. ECB suggested that the purpose of this policy is to assist retail
partners, if seasonal products are not selling as expected, but also to guard the brand by
avoiding big discounts being placed on the products at retailer doors. Furthermore, case
company has no control over the products once they have been shipped to retailers. Thus, by
offering the cancellation opportunity, company can control the liquidation process of non-
successful and aged product, minimizing the negative impact on the brand. Liquidation of
the obsolete inventory happens through case company’s own direct to consumer channels
and selected retail partners who specialize in liquidating aged stock. SBP pointed out that
these partners generally acquire the aged inventory with discounted price from the case
company. Case company’s approach to MTS vs MTO decision, and the impact on margin,
is detailed in Figure 5, which also visualizes how the always available product can be ordered

40
through both models by the retail partners. As at-once rush orders the products are sold with
what is considered full price, but if the retail partner accepts a certain amount of the risk and
places the order early enough for MTO process, case company offers a discounts on the price
of the goods.
“Most of our goods are produced in Asia, but also some in Italy and other locations within
the geographies. Factories are in different countries to mitigate risks, but also because of
different transit times around the globe.” (SP, 2020)
Case company sources most of its finished goods from factories in Far East, mainly due to
cost reasons. Furthermore, vendors are located in several countries to mitigate risks, but also
to allow shorter transit times to different geographies of the case company. For example,
transit time by standard ocean freight from India is much shorter to Europe than to North
America. In addition, as stated by SP, case company has suppliers within each geography,
with smaller production capacity, to address geography specific needs in agile way. ECB
pointed out that the local for local production specializes in the needs of that specific
geography and the products are usually also designed within that geography for the
marketplace requirements, providing speed in responding to shifts in demand.
SP and IP1 mentioned that case company does not own any manufacturing operations,
although the firm audits and works closely with its vendors. Thus, the case company is
structured in way that it designs, sells and manages the inventories for the end products, but
the manufacturing process of the goods is outsourced to external vendors. Furthermore, as
discussed in chapter 2.1.1, business model can extend to both suppliers and customers of a
firm, in alignment to broadened view on resource-based theory. Moreover, this requires co-
operative partnerships that can be considered part of the rare, valuable, inimitable, and non-
substitutable resources that shape company’s competitive advantage. (Massa et al. 2017, 97;
Hitt et al. 2016, 77). Therefore, in its basic essence, case company’s business model is to
design shoes and apparel which are manufactured by external partners and then marketed,
sold, and distributed by the case company to both retail partners and directly to consumers.
In return, case company receives monetary profit, but also gains access to marketplaces and
consumers through retailers. This access is valuable as the company itself would have to do
substantial investments to gain same level of market presence on its own.

41
4.1.2 Value stream
As it is crucial for case company’s success that customers choose its products over its
competitors and that it stays relevant in the face of consumers, this sub-chapter will examine
the ways value can be created within the business model of the case company. As suggested
by the literature and theory reviewed earlier in this paper, creating a finished product itself
does not equal creating value, as the product needs to have actual value-in-use (Grönroos &
Ravald 2011, 7-8). Furthermore, the employees of the company need to transform those
resources and by adding their input to create that value (Bowman and Ambrosini 2000, 5-
6).
“We need to be flexible and adapt to customer needs or we will not succeed.” (IP1, 2020)
Towards consumers, value-in-use could be considered the emotional and functional impact
owning and using the product will have on their experience. In the specific industry, clothing
carries functional purpose, but is also often associated with emotional factors more related
to fashion or brand itself. IP2 stated that case company is aiming to position itself as
sustainable, inclusive and youthful brand that has represented the voice of the youth for
decades. These things impact how the consumer perceives the product, but also how wearing
them can create emotional value-in-use. Furthermore, history with the brand’s products can
affect how the consumer might feel about the brand and owning and wearing the products.
“Brand aims to give back to the consumers as well, in terms of helping the environment.”
(IP2, 2020)
Retailers on the other hand can create value out of the goods by adding their own
contribution and transforming them to the direction they wish, for example through
marketing or purely by making the goods available to certain group of consumers as
highlighted by SBP. Chernatony et al. (2000, 40, 46.) suggested that perceived value can be
something as abstract as time or effort. In this specific scenario retailers can have a store
fleet or locations that will provide this added value to the end consumer that case company
itself could not answer to. Case company makes the products available for its retail partners

42
and creates assortments that aim to build a story for the consumer journey, which is also
creating value out of the merely finished good.
“It just isn’t financially sensible to open an owned store to every market and city, there are
too many costs and research required that it wouldn’t make sense.” (SBP, 2020)
Just as consumers and retailers can create value-in-use from the products of the case
company, suppliers provide the finished goods to the case company after which the
employees of the firm need to transform the goods to create value (Bowman and Ambrosini
2000, 5-6). There are various functions within the company that can contribute to value
creation, from marketing to sales and from logistics to e-commerce. Furthermore, IP1 stated
that in the end, what matters to customer, should be determining factors also within the case
company.
“We aim to work together with the vendors to have flexible production, to adapt to customer
needs. This is not only one way, but we also try to help the vendors as much as we can,
mainly through improving our forecast accuracy and providing them information on future
shifts in the marketplaces.” (IP1, 2020)
Literature review conducted for this research supported knowledge sharing and highlighted
benefits it can have on overall co-creation of value for all the partners involved (Kähkönen
& Lintukangas 2018, 981; Andreu et al. 2010, 249). Importance of information flow was
also mentioned by all the interviewees and the general consensus in the data was that sharing
more knowledge, and as early as possible, would benefit all parties involved in the process.
Based on the theory and collected data, it can be stated that holistic and streamlined
knowledge sharing will lead to higher potential in overall value creation. Moreover,
understanding the capabilities and needs of each partner, from supplier to end customer, will
have positive impact on the total difference between sacrifices and benefits, if these factors
are effectively communicated through the network.
43
4.2 Inventory planning
In the organization studied, inventory management is done separately in each geography and
the inventory management teams work as part of the wider operations team for that region.
Besides inventory management, geo operations also include other teams that are dedicated
to running the distribution centers, demand planning, inbound logistics and sales and
operations planning. Furthermore, sizes of the teams vary in different geographies as well as
the overall volume that passes through each marketplace. In addition to operations teams
dedicated to individual geographies, the company has global operations functions, such as
sourcing, manufacturing, supply planning, product integrity and long-term demand
planning. Global functions work together with each geo operations team as well as directly
with vendors. Moreover, these global functions concentrate on the overall needs of the
company, similarly as the geography dedicated teams combine the needs coming from
different countries and sales groups within their regions.
“Our goal is to deliver the right products at the right time in right quantities” (IP1, 2020)
Interviewees described the role of the inventory management team to consist of
consolidating demand for the geography, determining the optimal flow of goods and
submitting the buy to global supply planning. Buy submission is executed once a month and
after receiving the orders from all geographies, supply planning reviews which products
meet the global production minimums and passes the purchase orders to the factories for
manufacturing. Furthermore, submission is done in the company ERP system on product
and size level.
In addition to the monthly buy submission, inventory management teams provide reporting,
analysis and forecasts on supply and inventory, which are used by the function itself but also
by other teams within the company. Reporting mainly considers current inventory level and
composition, whereas forecasts are concentrated on estimating future flow of supply,
development of overall inventory ownership and the risk of generating obsolete stock.
Within the case company, these insights are used to plan production, logistical capacity and

44
estimate sales order coverage, but also to understand risks and opportunities regarding
inventory composition.
As discussed previously in the thesis, case company’s business model relies on omnichannel
strategy where the end consumers are reached through both e-commerce and physical direct
to consumer stores, as well as by retail partners selling products of the case company.
However, inventory management in the case company considers the total demand for the
region in its planning, hence there is no differentiation how channels are approached in terms
of purchasing the supply. Goods that are produced as Make-To-Order require the retail
partners and internal, direct to consumer, teams to submit their orders at least six months
before the desired in-store date. ISD marks the date when goods are planned to be found
from the stores or websites and within reach of consumers, as explained by SBP. IP1
highlighted that inventory management consolidates all this demand together and attempts
to cover the bulk need, without looking much into the details on whose orders are part of the
mix.
Figure 6. Case company monthly buy process.
As shown in Figure 6, the buy process, owned by the inventory management teams, starts
once sales department of the case company has received orders from their accounts, direct
to consumer channels have determined their needs and customer operations has entered all

45
of this demand as sales orders to the ERP system. Moreover, these sales orders represent the
Make-To-Order demand, which is submitted with at least six months in between of sales
order entry and in-store date. Furthermore, for the always available goods, inventory
planners also consider the expected demand that occurs as at-once business.
Inventory planners determine buy strategies for each product after reviewing current
inventory, already issued purchase orders and the total demand. IP1 and IP2 stated that
ideally goods would flow to the distribution center as late as possible while still making it in
time to fulfill demand, to minimize the costs of holding inventory. Furthermore, even flow
of purchased volume allows the vendors to operate without spikes in their production
scheduling. However, certain production minimums need to be met for the manufacturing to
be cost efficient. Therefore, planners often combine the demand of multiple months to a
single purchase order for a certain product as visualized in Figure 7.
Figure 7. Buy strategy assignment
As shown in Figure 7, for products that meet the minimum production threshold in every
month of the season, planners only purchase the required quantity in the corresponding buy
Month 1 Month 2 Month 3
Product X 3,000 2,700 2,500
Product Y 2,000 1,000 1,000
Product Z 200 200 200
1st Buy Cycle 2nd Buy Cycle 3rd Buy Cycle
Product X 3,000 2,700 2,500
Product Y 2,000 2,000 -
Product Z 600 - -
*Scenario based on assumption that presented demand is known
in the 1st buy cycle and production minimum is 2,000 units
Demand per month for a season
Purchase orders issued in each buy cycle for the season*

46
cycle. In the figure this type of products are represented by the example Product X. For
Product Y, the planner could see that there is enough demand to reach the production
threshold twice, so the strategy would be to combine second and third month demand into
one purchase order, to guarantee reaching minimums second time, while slightly evening
the flow. On Product Z the preferred approach would be to consolidate all the demand into
one order submitted in the first buy cycle, which would then only make production
minimums if other geographies would have enough volume in the buy to have it reach the
threshold of two thousand units in total. IP1 and IP2 stated they review the system before
each buy cycle to understand if additional demand has been added or any other shifts have
happened since the previous buy cycle.
Once inventory planners in each geography have determined the buy strategies they want to
follow for each product, these parameters are uploaded into the ERP system which then
conducts the MRP run. What is referred to as buy strategy in the case company can be
considered similar to lot size discussed in the literature review (Woarawichai et al. 2011,
250; Berretta et al. 2005, 261-263). MRP considers all the demand it sees and generates
purchase requisitions based on the buy strategy it sees for each product. Milne et al. (2015,
220-221.) pointed out that MRP systems often don’t calculate in the production or inventory
capacities as factors and this notion also applies to the case company in question. Thus, the
calculation is purely based on the flow shaped by the computation done on the demand,
assigned material lead-time and the set buy strategy as described by IP1 and IP2.
“The thing is that MRP does need to be manually supervised, but in the end, it reduces
risks.” (IP1, 2020)
Consensus among the inventory and supply planners in the case company was that the output
of MRP still leaves variety of manual tasks and checks to complete to ensure good results
for the enterprise. Purchase requisitions generated by the MRP are reviewed and adjusted by
each of the inventory management teams in different geographies with very limited visibility
on what the other teams are doing. Once purchase requisitions are passed to supply planning,
the team reviews which products reach the global production minimums in the buy cycle
and confirms that all the products are placed for the right season. Furthermore, SP states that
the case company has over thousand different models for each season, which lasts always

47
three months, but to purchase these goods, costing and manufacturing details must be pre-
determined with the vendors. Moreover, assortment is selected before sales approaches their
accounts, but occasionally customers order goods which are not part of the agreed line.
Demand and inventory planning teams in the geographies aim to detect these errors in an
earlier phase, but at the latest supply planning will drop the purchase requisitions from the
buy before submitting the purchase orders for manufacturing.
Once supply planning has a clear understanding on the products and orders that meet the
criteria to be purchased, vendor allocation takes places. Majority of the products are single
sourced from one vendor, but especially bigger volume products can have multiple sourcing
options to utilize. In addition to estimated free capacity, supply planning considers location
of the vendor in the allocation. Transit times to different destinations can vary as well as
customs policies. One country of origin can have lighter import tax to a certain region than
other.
After vendor allocation and converting purchase requisitions to purchase orders in the case
company ERP system, supply planning passes the buy to case company liaison office (LO).
LO communicates with the vendors to understand if the requested delivery schedules are
feasible and manages the information flow in case there are any questions from either side.
Furthermore, once the vendors have provided their answers, all purchase orders that
wouldn’t meet the requested delivery schedule are send back to inventory management
teams, to review and either accept the delay or cancel the order. At this time inventory
management teams can also request value added services (VAS) for any of the goods
ordered, with additional costs. Typical these are special labels added on the shoe boxes or
outer cartons that help specific retailers to handle the goods upon receipt.
Same way as every season is set to last three months, case company also does three buy
cycles for each season. Furthermore, if certain product doesn’t meet production minimums
and therefore doesn’t get purchased, general practice is to push the demand to the following
month to try again. Moreover, in case more sales orders are received later on, the product
might rise above the threshold to get manufactured. However, it is possible that some of the
products don’t get purchased at all, in which case the sales orders for the product are canceled
once the buying for the season is over. Inventory management teams communicate to

48
customer operations after each buy cycle which products got purchased and which orders
need to be moved to a following month or canceled if buying for the season ends. Customer
operations keeps the ERP system up to date regarding the sales orders, as well as passes
information to their accounts, which can also choose to reject some of their buys instead of
pushing them further due to not making minimums.
“There are certain accounts that carry higher priority than the others. Also, our own digital,
the website, is considered the highest priority to get any goods.” (IP2, 2020)
Case company has two separate storage locations and ways of operating its distribution
center (DC). Purchase-to-order (PTO) model is mostly used by bigger accounts, as in
addition to meeting production minimums, vendors require individual orders to carry certain
amount of volume. PTO purchase order is directly linked to a specific sales order and the
goods only pass through the company DC without further work done in the warehouse. VAS
is only possible on PTOs, because goods are earmarked for a certain customer. The second
option is pick and pack storage location. All the demand placed for pick and pack gets
consolidated together in the MRP run and purchased in a bulk purchase order, if the product
meets the manufacturing volume threshold. Case company’s direct to consumer business
submits their orders to the pick and pack pool as well. Furthermore, upon arrival goods
allocate to sales orders based on pre-determined priorities, which are aligned to commercial
preferences of the case company. First ranked is its own DTC business, followed by biggest
and most important strategic accounts. As also stated by Koumanakos (2008, 356), inability
to deliver can present a risk of disrupting business and seriously impact the customer
experience, hence case company has prioritized its most important partners to maintain
certain level of service towards them.
IP2 suggests that in a situation where all demand is covered and all of supply is arriving on
time, the allocation priorities don’t hold much value. However, in a scenario where a certain
product is purchased already for the season and additional sales orders are received, but not
enough to make production minimums again, a situation occurs where demand for the season
is only partially covered. Furthermore, in case there are any production related delays,
portion of the volume for a certain product can be on time and some part late. In these
instances, allocation priority plays an important role determining which accounts receive

49
higher level of service. This approach is aligned to findings of Samii et al. (2011, 393.) who
suggested separate priority groups for customers, but also assigning different fill rate targets
for customers.
4.2.1 Impact on value creation
Overall value chain for the case company consists of many steps all the way from product
design to sales, manufacturing, logistics and marketing, but as the aim of this research is to
specifically look into the role of inventory management in value creation, only the impact of
inventory management is further examined. All interviewees highlighted the importance of
inventory management in having the supply arrive on time and in full, to cover the demand
that the case company has for its products. Furthermore, customer satisfaction level is bound
to decrease, along with the service level, if goods are not delivered as promised. Delivery
performance also impacts all following steps in the process. Thus, if goods are acquired too
late, every team later in the chain starts their process trying to make up for the time lost,
which creates additional pressure and costs. For example, bringing goods in by air freight is
possible, however very expensive in comparison to standard ocean freight used by the case
company, hence would have direct impact on the margin and profits of case company.
“It definitely hurts the company if there's a specific trend and we are late to deliver for that
season.” (IP2, 2020)
As stated by Bowman and Ambrosini (2000, 5-6.) resources are not of any higher value
without intervention, work, done on them. Although inventory management plays a big role
in delivery precision for the case company, it does not work directly with any raw material
resources nor the finished good itself. Both IP1 and IP2 suggested that the added value comes
mainly from making sure all products are purchased, to maximize order coverage, but also
from managing the flow. Furthermore, by optimizing the flow of goods, inventory
management does not only utilize the capabilities of the case company’s vendors, but also
tries to enhance vendors’ ability to meet the needed requirements, while keeping the end
customers satisfied. Later on in the process, this leveling of the flow will also lower the

50
peaks for both inbound logistics as well as DC operations when they are receiving the
products.
“You need to work closely with vendors and also with the final accounts to know what
exactly the real need is, the real demand.” (IP1, 2020)
Supply planning function in the case company stays in close contact with the vendors to
understand what their production capacity is and communicates this to inventory
management teams. Based on this information, inventory management teams try to adjust
their flow as much as possible to accommodate the available capacity, however still
considering both the risks of losing business and generating obsolete inventory in their
decisions. Vice versa, inventory management teams provide updated buy forecasts to supply
planning to be consolidated and handed out to vendors. Furthermore, in cases where it is not
possible to meet customer requested delivery schedule, inventory planners communicate this
to customer operations who pass the information to account teams, thus managing
expectations. As Massa et al. (2017, 97.) and Hitt et al. (2016, 77.) pointed out, co-operative
partnerships can be considered part of the rare, valuable, inimitable, and non-substitutable
resources that shape company’s competitive advantage in the broadened view of resource-
based theory, which seems to also be true for the case company. This is also aligned to
findings of Kähkönen and Lintukangas (2018, 981.) who noted that collaboration and
knowledge accumulation, along with combining resources and capabilities in supply
management, can create value for all parties involved. Figure 8 presents some of these value
adding information flows between different functions, outside of the standard monthly buy
cycle, in the case company. Presented knowledge sharing elements help each participant to
better react to any changes and to understand the needs of vendors, the case company and
the end customer as described by the interviewees.

51
Figure 8. Main information flows outside of monthly buy process
Furthermore, other information shared with the customers continuously is the estimated fill
rates, which are monitored in weekly cadence. Finance department of the case company is
also interested on the estimated fill rates, as they reflect future revenues and profits. In
addition, total inventory ownership is a point of interest as it has direct impact on financial
reporting. Reporting and forecasting inventory levels and composition don’t have direct
implications for neither vendors nor customers, however, provide insights for the inventory
management team itself, as well as the leadership team of the case company. Inventory
related reports and forecasts support decision making and can guide strategic decisions made
on company’s direction. Moreover, role of inventory management is also to interpret these
figures and analyze the causality, to understand in which direction the inventory is
developing and for what reasons. Therefore, inventory forecasting and reporting are mainly
done for sharing knowledge and information for internal stakeholders, but these insights can
give information used to guide the company in a direction that will in longer term help to
maximize the value creation for all parties involved.
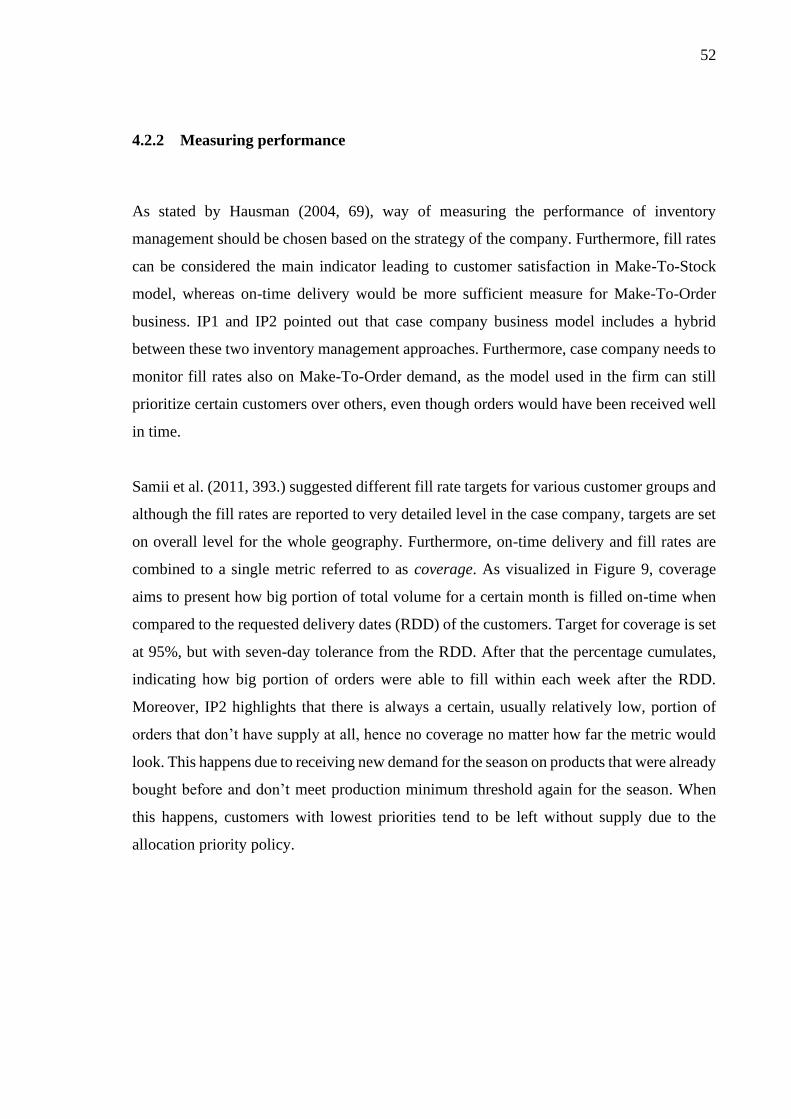
52
4.2.2 Measuring performance
As stated by Hausman (2004, 69), way of measuring the performance of inventory
management should be chosen based on the strategy of the company. Furthermore, fill rates
can be considered the main indicator leading to customer satisfaction in Make-To-Stock
model, whereas on-time delivery would be more sufficient measure for Make-To-Order
business. IP1 and IP2 pointed out that case company business model includes a hybrid
between these two inventory management approaches. Furthermore, case company needs to
monitor fill rates also on Make-To-Order demand, as the model used in the firm can still
prioritize certain customers over others, even though orders would have been received well
in time.
Samii et al. (2011, 393.) suggested different fill rate targets for various customer groups and
although the fill rates are reported to very detailed level in the case company, targets are set
on overall level for the whole geography. Furthermore, on-time delivery and fill rates are
combined to a single metric referred to as coverage. As visualized in Figure 9, coverage
aims to present how big portion of total volume for a certain month is filled on-time when
compared to the requested delivery dates (RDD) of the customers. Target for coverage is set
at 95%, but with seven-day tolerance from the RDD. After that the percentage cumulates,
indicating how big portion of orders were able to fill within each week after the RDD.
Moreover, IP2 highlights that there is always a certain, usually relatively low, portion of
orders that don’t have supply at all, hence no coverage no matter how far the metric would
look. This happens due to receiving new demand for the season on products that were already
bought before and don’t meet production minimum threshold again for the season. When
this happens, customers with lowest priorities tend to be left without supply due to the
allocation priority policy.

53
Figure 9. Order on-time coverage metric
Other main key performance indicators brought up by the interviewees were Days Sales of
Inventory (DSI) and obsolete inventory percentage. In addition to coverage and overall
inventory level, these two metrics are the ones drawing most attention in the case company
and monitored closely by the overlooking global functions of the firm. Furthermore, DC
turns are reported in a monthly cadence as well, but used mostly within each geography.
Supply planning also monitors the vendor performance on committed delivery schedules. In
the future, the organization is planning to implement forward looking DSI metric in addition
to the current performance indicators. Forward looking DSI would compare current
inventory level to estimated future sales, instead of past sales. Overall, the planners were
satisfied with the amount of performance indicators and didn’t feel the need to add more on
top of the ones currently used and, in the plans, to implement.
“If you have too many measures you can get lost in it. Having too many can make you lose
focus on what matters.” (IP2, 2020)
Targets for overall inventory level, DSI and obsolete inventory percentage are first pitched
by the inventory management teams to the local leadership of the wider operations team.
Once approved, these figures are submitted to global operations team for review. Global
operations consolidate all the data from different geographies and can determine changes to
the targets based on the overall picture they are looking at. This process takes place once a
year, before start of each fiscal year of the company, and the targets are determined for the
full fiscal year. Performance of each geography inventory management is measured on
monthly cadence against these targets and deviations reported to finance and leadership
teams along with commentary on the reasons for parting from the targets.
Month 1 Month 2 Month 3
Coverage RDD +7 69% 87% 94%
Coverage RDD +14 74% 93% 98%
Coverage RDD +21 79% 97% 99%
Coverage RDD +28 85% 98% 99%

54
4.2.3 Discovered challenges
Majority of the challenges pointed out by the interviewees were very much related to
information flows and co-operations between teams as well as the current technological
solutions and tools in use. Furthermore, some fundamental issues in the processes of the
company were pointed out, which create problematic situations for the supply chain.
“One thing that I think is failing a little bit, is the communication between IM teams globally,
because I feel like North America, sometimes is buying in completely different by cycles.”
(ECB, 2020)
Regarding co-operation between different teams, collaboration among different geographies
was raised several times in the interviews. Furthermore, production minimum thresholds are
applied based on the total volume submitted globally in a buy cycle and if one geography
tries to later order product it can be challenging to reach the threshold without support from
other regions. Especially representatives of more commercially oriented teams felt the need
for more alignment between inventory management teams, to ensure geographies would
submit their orders for individual styles in the same buy cycles, to enhance overall coverage.
ECB also pointed out the need for more visibility on which products appear to reach
production minimums and which not.
“We don’t have issues with capacity, but we have issues with production flow.” (SP, 2020)
Production wise, challenges identified were related to flowing the orders evenly to the
vendors without causing peaks that manufacturing wouldn’t be able to respond to. IP1 stated
that to mitigate the capacity impact, some products are bought to forecast even though
technically the strategy is Make-To-Order. This adds some risk, but is necessary in the
current seasonal business, where the demand tends to pile on the first half of the three-month
season. Furthermore, all the retail partners and direct to consumer teams wish to have the
seasonal products available in the beginning of the season, which then easily translates to
very uneven purchase volume towards the vendors. SP highlighted that the overall
production capacity acquired for the company is easily enough to produce all the goods

55
consumed, but peaks can easily create delays for certain months with extremely high
volumes.
“MRP supports us, but in modern times I believe there could be better tools. MRP still
requires a lot of manual work.” (IP1, 2020)
As also pointed out in the literature review, there are some fundamental principles in the
MRP solution that require manual supervision and intervention. One of these is the lack of
ability to consider the available capacity in both production and warehouses of the firm.
Furthermore, literature review showed that material lead-times can often be inflated to
compensate for this factor. Findings of this thesis also support this notion. Another challenge
discovered regarding MRP was related to the way the system calculates requested delivery
date for the purchase orders issued by the case company. As MRP assumes full material
lead-time is needed for the production, the ask towards vendors might not always correspond
with the required fill dates as presented in Figure 10. This happens in scenarios where the
orders are placed too late to deliver on time to cover the demand, when compared to material
lead-times. However, as the lead-times can be slightly inflated, or vendors could be running
ahead of schedule, it is possible the fill date could be met. Despite potentially being able to
fulfill the order on time, the vendors don’t know to aim for earlier delivery because the
purchase requisitions generated by MRP are asking for a date aligned to the assigned
material lead-time. To overwrite this, the planners would need to go requisition by
requisition and manually adjust the requested delivery dates before submitting to supply
planning and vendors, in order to pass this message. This scenario was found to mostly
happen on products that had longer than average lead-time. Additional challenge identified
on these products was that demand is still entered in the same cadence as for all the standard
lead-time products, six months ahead of in-store date, but this means the planning could
already be late from the start. In these cases, vendors would need to always beat the assigned
material lead-time for the customer to receive the goods as promised.

56
Figure 10. MRP requested production schedule on products planned late
Interviews brought some light on challenges that are not directly linked to inventory
planning itself, but flow down to inventory planning and potentially even further. As
mentioned earlier, demand, inventory and supply planning all try to identify orders that are
not supposed to be placed for a certain time period. Furthermore, the product line for each
season is determined beforehand and costing and product details agreed with the vendors.
However, demand still gets entered for products that are not in the line. This does not only
cause extra work for the planners having to review the orderbook in the system, but it can
also be lost business opportunity for the company. In the end, these products can’t be
supplied and this demand is lost, whereas it could have been placed on a valid product to
begin with.
“We keep having orderbook issues, sales orders being incorrect incorrectly entered.” (IP2,
2020)
Another concern brought up, regarding managing the orderbook on the demand side, was
the late adjustments planners were seeing after the official sales order entry deadlines.
Moreover, changes done in late stage were viewed as a risk because of the increased chance
that supply would not meet the demand. In addition, IP1 and IP2 stated that trying to discover
where the shortages are coming from can be very difficult and time consuming. Planners
found this to be especially frustrating, as technically the demand should not be adjusted after
the deadlines had passed. Occasionally, commercial teams would also request adjustments
on supply, due to changed situations in the marketplace. While highlighting the importance
of being flexible and service mind oriented, IP1 also raised the point that sometimes the
57
costs of executing changes on existing purchase orders can actually be more costly than the
profit gained from the changes made.
On the key performance indicators, all interviewees were aware of coverage and total
inventory level, but the rest was mainly familiar to the inventory planners. Furthermore, how
the targets were determined was also found to be unclear for the planners, because the targets
were mainly discussed by the operations management team of each geography.
4.3 Identified improvement opportunities
There is always room for improving processes, tools and systems, which also came clear
during the research interviews. As this thesis is delimited to discuss factors relating to
inventory management, challenges identified were considering processes and tools used by
inventory management function, or teams whose action directly impact the capability of
inventory management to perform their tasks. These findings will be presented in this sub-
chapter, followed by the potential improvement opportunities regarding the key performance
indicators used to measure the efficiency of the inventory management.
4.3.1 Inventory planning
Identified improvement opportunities tie very tightly to challenges identified earlier in this
thesis and main themes rotate around enhancing the communication between different teams
and tools used to support business processes. Regarding tools, both inventory planners
interviewed were hoping to get a limitation in place for the company sales order entry
interface, which now allows entering demand past the given deadlines. Furthermore, ideally
the interface was seen to block all orders not meeting standard requirements needed to
purchase the goods in orderly manner, as an example not allowing PTO orders entered with
volume below minimum purchase order quantity. Intervened with the same process, IP1 saw

58
need to educate other teams on the costs and additional work caused by order entry mistakes,
to provide more visibility on the overall impact these errors can have.
On purely purchasing side of the company ERP system, planners stated that the MRP leaves
room for improvement. For example, on the products which are planned late, inventory
planners would need to manually go one-by-one to adjust the purchase requisitions in the
system before submitting the orders to vendors, to indicate that they would ideally have the
goods arrive sooner than the standard material lead-time would allow. Based on the
comments made, there could be need to implement a mass update tool or some more
automated solution for this purpose. One option identified was to provide vendors an
additional field they would see on the order, showing the ideal delivery date, if the order
timing violates the material lead-time. Purely process wise, this issue could be solved by not
allowing demand being entered in a way that delivering the supply on time is not possible in
terms of material lead-times. Furthermore, another opportunity was identified in buying the
long lead-time products to forecast, however this would increase inventory risk substantially.
“I think we should give more visibility to factories on priorities, so they know which orders
to be prioritized when capacity is tight.” (IP1, 2020)
From capacity planning perspective, the biggest challenge was found to originate from the
strong orderbook frontloading that happens for the beginning of each season in the case
company. Ability to split the demand more evenly across the season could alleviate the
pressure according to SP and IP1. Furthermore, other possibilities introduced were reserving
enough capacity to get through the peaks without production delays or flowing the supply
more evenly by utilizing Make-To-Stock approach for a larger spectrum of products. SP
stated that having enough capacity to respond to peaks can be done, however it leads to high
costs, as the level of capacity would need to be acquired for ongoing basis, whereas it would
only be utilized for the beginning of each three-month season. Flowing supply instead of
demand, by buying to forecast, also includes inventory risk, just as for the long lead time
products. Moreover, the planners stated that teams could pinpoint certain products with most
historical data and attempt buying those to forecast. This was seen as the most realistic
options to mitigate the capacity issue, as the inventory risk was considered relatively low to
a certain extent. In situations where not all orders can be produced in time, IP1 suggested

59
providing vendors priorities between orders. SP found this approach problematic in the sense
that global function would be put into a situation where they need to determine which
geography’s orders are the most important for the overall business of the case company. Pre-
determined rules on what to prioritize could alleviate this pressure from a single team, if
agreement would be found on the criteria.
ECB brought up the further need for cross geography alignment between inventory
management teams across the globe. Moreover, by initially submitting orders for the same
products in the same buy cycles the company could maximize the coverage for demand
globally. IP1 confirmed following this practice would make it rarer for single geography
getting left under production minimums in their attempt to purchase the goods.
Generally, the commercially oriented interviewees were seeing a clear ask for more
transparency and visibility from the inventory management side on which products have
made it through the buy consolidation and met the production minimum threshold.
Furthermore, ideally knowing already during the buy execution which products are in risk
of falling under production minimums and having the chance to drive for actions to
safeguard some products. Inventory planners on the other hand stated that with current
scheduling they only have visibility on the global buy quantities in a very late stage and
don’t have enough time to communicate these volumes to other teams. This leaves clear
improvement opportunity in terms of either enhancing the tools to enable faster buy
execution, increasing the bandwidth in the inventory management team or pulling the sales
order entry deadline earlier, thus allowing buy execution in time to conduct a buy review
with the commercial teams.
4.3.2 Key performance indicators
As Anand and Grover (2015, 136-140.) stated, improving supply chain is a continuous effort
that requires re-visiting the key performance indicators from time to time. Based on the
interviews with IP1 and IP2, the current performance measures have been in place for quite
a while, which could indicate there is room to review the if the current ways of reporting

60
performance are still valid. However, the clearest improvement opportunity was found in
cross functional alignment on the measures and targets. Teams outside of operations were
not aware of most of the measures and targets, which implies need for transferring this
knowledge from supply chain to other functions of the company. Cecere (2015, 7) suggested
that as the targets don’t only impact teams in supply chain, the targets should also be
determined and agreed by wider group within the organization. Sharing the vision and agreed
approach would then help the overall performance of the company as all teams would know
the reasoning behind decisions made later to hit these targets.
“I know the targets for the KPIs, but it is not very transparent how the targets are
determined.” (IP1, 2020)
Literature review found the best approach to be flowing corporate strategy down to reflect
the functional goals and further to individual objectives for the employees. Based on the
collected data, inventory planners understood how the overall company strategy shows in
their team goals but didn’t have clear understanding on how the targets were exactly
determined and what they were based on. Adding transparency and visibility to the process
would help the inventory planners to commit to these goals. Furthermore, if the planners
were part of the discussion the effect could be even more significant.
Most of the targets were found to be determined in time bound manner, usual measuring
point being the change of each month. However, coverage target, the measure found most
widely used within the organization, was not tied to any specific moment. Coverage could
change any moment until the goods arrive to the warehouse, but the assigned target had no
defined point of reference. Anand and Grover (2015, 144.) highlighted the importance of
time specific target setting to ensure best possible way of measuring the performance. By
creating a time specific target, organization could make understanding the performance of
inventory management more straight forward. Furthermore, comparing current level of
performance to past performance would become more structured, as well as determining
future goals for the metric.
Another identified improvement opportunity in regards the key performance indicators was
the lack of a metric that would capture the overall performance of the supply chain. Currently

61
used measures captured well the performance of each specific function and some even cross
functionally to a certain extent, but no single way of measuring was utilized that would
indicate efficiency from end to end within the case company supply chain. Furthermore,
Cecere (2015, 124.) also implied the need to find a practice that would capture full length of
the value chain, from supplier to customer.
Overall, the interviewees felt confident that the current ways of measuring performance are
sufficient. However, there was consensus that to maintain or improve competitive advantage,
company must keep evaluating its processes as well as key performance indicators.
Furthermore, comparison to industry peers was considered a good point of reference to the
extent it is possible.

62
5 CONCLUSIONS
This final chapter of the thesis will present discussion and conclusions of the research.
Furthermore, the empirical findings of the study are further compared to theory gathered
through literature review on the topics, as presented in chapter two. Comparison will discuss
similarities with established theory, as well as new key findings on the subjects. In addition,
managerial implications are summarized, and research questions answered. Finally,
limitations and validity of the results are examined, followed by the implications of further
need for research on the subjects.
5.1 Summary of results
As discovered in the literature review for this research, value can mean very different things
depending on the perspective it is observed from. However, in the end there must be value
realized for the end user or the business model cannot be successful and sustainable. In the
industry studied, the value in use for the end customer can be both emotional and functional.
These findings align with the examined theory on value proposition, stating that the company
must solve a problem or satisfy a need the customer has for the consumer to choose a certain
product (Osterwalder & Pigneur 2010, 22-23). Aligned with the theory presented in chapter
two, the value creating process was found to extent through the whole supply chain, from
end to end, for optimal outcome in terms of what the customer wants to see in a product.
Fashion industry has traditionally been very focused on the branding and aesthetics, which
are still key elements, but sustainability aspects are also taking increasing amount of
attention. Furthermore, this direction from the consumers and employees within the
organization is guiding the companies to pay more attention to environmental and social
matters. Moreover, as these elements play a role in the final value added to the consumer,
they are also a focus point for a modern supply chain.
Business model of an apparel and footwear company was found to include the vendors
manufacturing the finished goods. These products were designed by the company itself, but

63
production had been outsourced to third parties. Even though the fashion brand wouldn’t
manufacture the goods, it is imperative for the end value to monitor that the full supply chain
operates in way that aligns to the expectations and wishes of the consumer. In practice this
means working together with the vendors and even auditing the suppliers of the vendors, to
uphold standards that make the goods most appealing to the end customer. Furthermore, by
making sure the full value chain is reaching the social and environmental expectations set
for the brand, can the company ensure maximized value added within the supply chain.
Findings on vendors role in the value creation process are in line with the extended resource-
based view (Massa et al. 2017, 97; Hitt et al. 2016, 77.), value network (Kothandaraman &
Wilson 2001, 380.) and value co-creation (Kähkönen & Lintukangas 2018, 981; Andreu et
al. 2010, 249.) theories. In addition to sustainability, design and comfort of the product,
consumers were found to look for quality and price. These factors can be considered the
reasons that provide firm competitive advantage over another.
Same as every function along the value chain, inventory management needs to target all its
action in a way that serves the outcome of adding value to the end customer. For this purpose,
it is crucial that the information flows within the value chain, thus allowing the planners to
understand what are the value adding factors for the consumer. Because of the operational
nature of the function, findings suggested that even more attention is required on knowing
what actions do not create value. By eliminating the non-value creating tasks, the employees
have more time to concentrate on what matters. Furthermore, eliminating waste has potential
for cost benefits throughout the process. These findings are in line with the principles of lean
management as presented in chapter two of this thesis (Machado & Leitner 2010, 383-391).
Moreover, lean management also suggests knowledge sharing networks among partners for
maximizing the benefits for all participants in the value stream (Dyer & Hatch 2004, 61).
Both, empirical findings and theory, also highlight the need for knowledge sharing
throughout the network. Thus, it is imperative for the information to flow all the way from
the customer to the vendors for best possible results in terms of value creation.
When it comes to information flows, the traffic was often found somewhat one way.
Customer needs were communicated, and their importance well understood among the
participants of the value chain, but the information from the suppliers and supply chain
functions of the firm did not always reach the other end of the value chain. Teams working
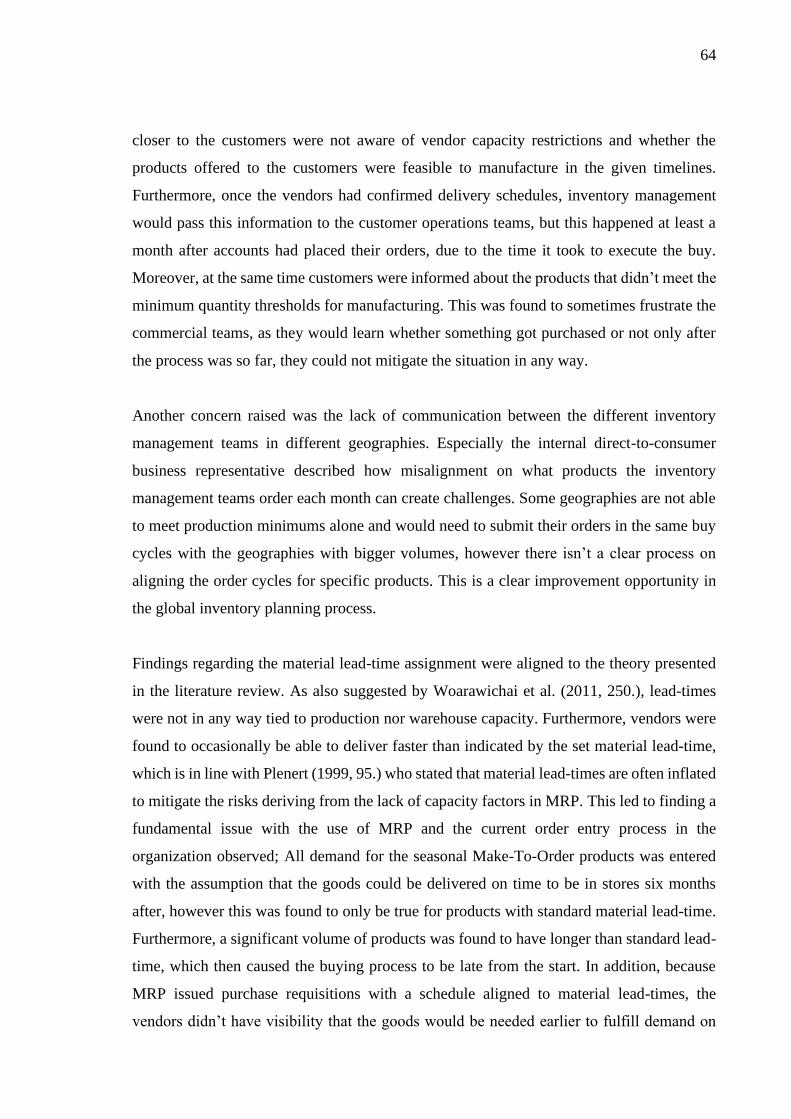
64
closer to the customers were not aware of vendor capacity restrictions and whether the
products offered to the customers were feasible to manufacture in the given timelines.
Furthermore, once the vendors had confirmed delivery schedules, inventory management
would pass this information to the customer operations teams, but this happened at least a
month after accounts had placed their orders, due to the time it took to execute the buy.
Moreover, at the same time customers were informed about the products that didn’t meet the
minimum quantity thresholds for manufacturing. This was found to sometimes frustrate the
commercial teams, as they would learn whether something got purchased or not only after
the process was so far, they could not mitigate the situation in any way.
Another concern raised was the lack of communication between the different inventory
management teams in different geographies. Especially the internal direct-to-consumer
business representative described how misalignment on what products the inventory
management teams order each month can create challenges. Some geographies are not able
to meet production minimums alone and would need to submit their orders in the same buy
cycles with the geographies with bigger volumes, however there isn’t a clear process on
aligning the order cycles for specific products. This is a clear improvement opportunity in
the global inventory planning process.
Findings regarding the material lead-time assignment were aligned to the theory presented
in the literature review. As also suggested by Woarawichai et al. (2011, 250.), lead-times
were not in any way tied to production nor warehouse capacity. Furthermore, vendors were
found to occasionally be able to deliver faster than indicated by the set material lead-time,
which is in line with Plenert (1999, 95.) who stated that material lead-times are often inflated
to mitigate the risks deriving from the lack of capacity factors in MRP. This led to finding a
fundamental issue with the use of MRP and the current order entry process in the
organization observed; All demand for the seasonal Make-To-Order products was entered
with the assumption that the goods could be delivered on time to be in stores six months
after, however this was found to only be true for products with standard material lead-time.
Furthermore, a significant volume of products was found to have longer than standard lead-
time, which then caused the buying process to be late from the start. In addition, because
MRP issued purchase requisitions with a schedule aligned to material lead-times, the
vendors didn’t have visibility that the goods would be needed earlier to fulfill demand on

65
time. Thus, even if the vendors had been able to produce the goods faster than implicated by
material lead-time, they would have not known to aim for it. In some inventory management
teams this issue was mitigated by manually adjusting the purchase requisitions after the MRP
run, to indicate to vendors that certain goods would ideally be needed earlier than what
material lead-time would normally allow. However, this practice does not remove the issue,
as for many of the products vendors would not be able to beat the assigned material lead-
time. Therefore, with current sales order entry process, portion of goods will undoubtably
be late, unless the inventory management team chooses to purchase the longer than standard
lead-time products through Make-To-Stock model instead of current Make-To-Order model.
Empirical findings, as well as theory examined (Ahmad & Zabri 2018, 83; Chaharsooghi &
Heydari 2010, 283-284; Soman et al. 2004, 223-225.) on the topic, suggests that where
Make-To-Stock can increase service level, it also carries higher inventory risk.
Many of the key performance indicators for inventory management were found to be
unfamiliar to other functions within the organization. Furthermore, inventory planners were
not aware how the targets were determined for the key performance metrics used to measure
the performance of the function. Therefore, the way of determining both inventory metrics
and targets is not aligned to best practices identified in the literature review. Lack of cross
functional alignment can be a risk factor in terms of lost visibility on why certain decisions
are being made (Chaharsooghi & Heydari 2010, 283-285; Chikán 2009, 132; Korhonen &
Pirttilä 2003, 195). Moreover, inventory planners’ unawareness of the target setting process
can lead to lack of commitment or even misalignment on the desired strategic outcomes.
Cecere (2015, 124.) stated that to properly measure the performance, it would be crucial to
establish an end to end metric, instead of only measuring individual phases of the supply
chain. Whereas the empirical findings showed aspiration towards using such measure, so
far, no such metrics had been successfully introduced. Furthermore, findings were in
harmony with theory suggesting that performance of inventory management should not be
only measured with a single metric nor should any metric be examined in isolation.
Based on the empirical results of the study, inventory management was mainly seen as the
function ensuring demand is covered full and on time to the best possible extent.
Furthermore, inventory management was discovered to act as an information hub between

66
each geography’s commercial teams, liaison offices and global supply planning function.
These discussions were found to concern customer and vendor needs as well as alignment
in situations where either adjustment was needed on standing orders or delays had to be
communicated. Moreover, other regular communications were found to take place with
demand planning, distribution center, inbound logistics, finance and sales and operations
planning. However, these conversations were more in terms of internal processes than to
address customer or vendor needs directly.
From customer perspective, the main need inventory planning was addressing was to receive
the goods when they needed them and with the correct value-added services. Nevertheless,
the costs associated with buying the product were found to impact the customer perceived
value, as also presented in the literature review of this thesis. Many of the internal processes
worked on by inventory management were found to have direct impact on the costs of
running the business and therefore an impact on the cost of products to customers. Biggest
factors of these being the flow of supply, relating directly to inventory holding costs, and
finding the balance between ideal service level and obsolete inventory risk.
Empirical findings also showed inventory management to effect many of the internal,
strategic, decisions made within the organization, through reporting and forecasting
provided by the function on regular basis. Reporting current inventory availability,
composition and overall level were used for evaluating imminent commercial opportunities
as well as for risk assessments regarding future obsolete stock. Forecasting on the other hand
was utilized from vendor capacity planning, to inbound container need assessment and all
the way to distribution center workforce planning. In addition, predictions given on the
future sales order coverage were discovered to give insights on estimated future service level
and therefore revenue realization. Furthermore, forecasting future inventory levels and the
ability to meet targets determined for inventory management were found to be valuable for
financial planning of the company.

67
5.2 Conclusions
Findings of the research where overall aligned with the existing theory in terms of identified
best practices and overall role of inventory management in value creation process. However,
despite the alignment on theoretical level, some of the processes were not fully implemented
in real life environment. For one, knowledge sharing was understood as the main element
contributing to value creation process, along with the actual buy execution, but
communications and collaboration between different teams within the organization
remained as a challenge. Furthermore, for optimized results, information would need to flow
to both directions, from end to end, and laterally between different inventory management
teams working for the same outcome.
Transparency and visibility on the inventory management operations was found to increase
to confidence towards the process from other functions. Moreover, inventory management
related key performance indicators were unfamiliar to representatives of other teams. Based
on theory examined for this research, it would be beneficial for the organization to educate
other functions on the key performance indicators and what decisions are made to reach
targets set for these metrics. Furthermore, a selection of different performance indicators
should always be examined together to understand the current position and preferably
including at least one indicator for full end to end performance of the supply chain. In
addition, targets should be determined not only based on historical data, but also by utilizing
outlook of the firm and the strategic goals of the whole organization.
Regarding both inventory management processes and performance indicators, main driver
for continuous improvement is to keep monitoring the current state and re-evaluating
potential for bettering the status quo. Technology is developing in rapid pace, which allows
automation of many tasks that used to be conducted in extremely labor heavy fashion. By
being in the forefront of implementing new tools and technologies, companies can gain
competitive advantage over other firms in the field.

68
5.3 Limitations, validity and reliability
Research can be considered limited as it only studies relation between inventory
management and value creation in a specific field, footwear and apparel industry.
Furthermore, because the research was conducted as qualitative single case study, the results
are not generalizable to full extent. Different sized organizations or companies operating in
other geographical areas could have dissimilarities between each other. However, data was
collected in a consistent manner and by using the same measuring instrument, therefore
allowing the results to be treated as reliable and valid in the given context. Moreover,
detailed description of the research methodology in chapter three allows the readers to
individually asses reliability and validity of the thesis.
Data collection was conducted through semi-structured interview format, which can be
considered to leave some room for the interpretations of the observer and therefore never
fully unbiased. Nevertheless, as the interviews were conducted by the same interviewer and
in the same format, the data collection can be considered to have been executed in unvarying
manner. Finally, interviewer’s status as employee of the case company is disclosed, giving
full visibility on the potential impact it may have on the interpretations of the author. The
limitations of the research indicate needs for future research in order to gain more
comprehensive understanding of the topics.
5.4 Future research
There are clear needs for future research regarding the topics discussed in this thesis. As
findings of this thesis are limited to a certain industry, further studies are needed to determine
the role of inventory management in value creation in other fields, to understand if these
results are applicable more widely or specific to a certain field. Furthermore, as the research
was conducted as a single case study, more research on the given industry would implicate
if the conclusions of the thesis are generalizable in a larger scale.

69
This study was conducted as a case study and the data collection was done from a globally
well-established organization in its field. Therefore, future research would be needed to
establish if the findings are also valid in small and medium size enterprises, and to what
extent. Furthermore, the business models within the same industry could be different from
each other, leaving room for interpretations on the role of inventory management as well.
In addition, further research is needed to understand the difficulties in implementing the
strategies and practices, in real life environment, that are widely considered to positively
correlate with value creation for the end customer.

70
REFERENCES
Ahmad, K. & Zabri, S.M. 2018. The mediating effect of knowledge of inventory
management in the relationship between inventory management practices and
performance: The case of micro retailing enterprises. Journal of Business and Retail
Management Research, vol. 12 (2), pp. 83-93.
Anand, N. & Grover, N. 2015. Measuring retail supply chain performance. Benchmarking:
An International Journal, vol. 22 (1), pp. 135-166.
Andreu, Luisa., Isabel Sánchez, & Cristina Mele. 2010. Value Co-creation Among
Retailers and Consumers: New Insights Into the Furniture Market. Journal of Retailing and
Consumer Services, vol. 17 (4), pp. 241-250.
Barney, J. (1991). Firm resources and sustained competitive advantage. Journal of
Management, vol. 17 (1), pp. 99-120.
Belekoukias, I., Garza-Reyes, J. & Kumar, V. 2014. The impact of lean methods and tools
on the operational performance of manufacturing organisations. International Journal of
Production Research, vol. 52 (18), pp. 5346–5366.
Bendell, T. 2006. A review and comparison of six sigma and the lean organisations. The
TQM Magazine, vol. 18 (3), pp. 255 – 262.
Berretta, R., França, P.M. & Armentano, V.A. 2005. Metaheuristic approaches for the
multilevel resource-constrained lot-sizing problem with setup and lead times. Asia-Pacific
Journal of Operational Research, vol. 22 (02), pp. 261-286.
Bowman, C. & Ambrosini, V. 2010. How value is created, captured and destroyed.
European business review, vol. 22 (5), pp. 479-495.

71
Bowman, C. & Ambrosini, V. 2000. Value creation versus value capture: towards a
coherent definition of value in strategy. British journal of management, vol. 11 (1), pp. 1-
15.
Bragg, S. Business Ratios and Formulas: A Comprehensive Guide. 3rd ed. Hoboken, N.J.:
Wiley, 2012.
Brinkmann, S. 2013. Qualitative interviewing. Oxford, England: Oxford University Press.
Cecere, L. M. 2015. Supply chain metrics that matter. Hoboken, New Jersey: John Wiley
& Sons, Inc.
Chaharsooghi, S.K. & Heydari, J. 2010. Optimum coverage of uncertainties in a supply
chain with an order size constraint. The International Journal of Advanced Manufacturing
Technology, vol. 47, pp. 283–293.
Chikán, A. 2009. An empirical analysis of managerial approaches to the role of
inventories. International Journal of Production Economics, vol. 118 (1), pp. 131-135.
Chikán, A. 2007. The new role of inventories in business: Real world changes and research
consequences. International Journal of Production Economics, vol. 108(1-2), pp. 54-62.
Clark, A.R., 2003. Optimization approximations for capacity constrained material
requirements planning. International Journal of Production Economics, vol. 84 (2), pp.
115-131.
Cooper, R.B. & Zmud, R.W. 1989. Material requirements planning system infusion.
Omega, vol. 17 (5), pp.471-481.
De Chernatony, L., Harris, F. & Riley, F.D.O. 2000. Added value: its nature, roles and
sustainability. European Journal of marketing, vol. 34 (nos ½), pp. 39-56.

72
Dyer, J. & Hatch, N. 2004. Using Supplier Networks to Learn Faster. MIT Sloan
Management Review, vol. 45 (3), pp. 57-63.
Geissdoerfer, M., Vladimirova, D. & Evans, S. 2018. Sustainable business model
innovation: A review. Journal of Cleaner Production, 198, pp. 401-416.
Grönroos, C. & Ravald, A. (2011), Service as business logic: implications for value
creation and marketing. Journal of Service Management, vol. 22 (1), pp. 5-22.
Hausman, W.H., 2004. Supply chain performance metrics. In The practice of supply chain
management: Where theory and application converge, pp. 61-73. Springer, Boston, MA.
Hitt, M.A., Xu, K. & Carnes, C.M. 2016. Resource based theory in operations management
research. Journal of Operations Management, vol. 41, pp.77-94.
Holweg, M. & Helo, P. 2014. Defining value chain architectures: Linking strategic value
creation to operational supply chain design. International Journal of Production
Economics, vol. 147(PB), pp. 230-238.
Ioannou, G. & Dimitriou, S. 2012. Lead time estimation in MRP/ERP for make-to-order
manufacturing systems. International Journal of Production Economics. vol. 139 (2), pp.
551–563.
Jodlbauer, H. & Strasser, S., 2019. Capacity-driven production planning. Computers in
Industry, vol. 113, p. 103126.
Jodlbauer, H. & Reitner, S., 2012. Material and capacity requirements planning with
dynamic lead times. International Journal of Production Research, vol. 50 (16), pp. 4477-
4492.

73
Johnson, M.W., Christensen, C.M. & Kagermann, H. 2008. Reinventing your business
model. Harvard business review, vol. 86 (12), pp. 57-68.
Kothandaraman, P. & Wilson, D.T., 2001. The future of competition: value-creating
networks. Industrial marketing management, vol. 30 (4), pp.379-389.
Korhonen, K. & Pirttilä, T. 2003. Cross-functional decision-making in improving
inventory management decision procedures. International Journal of Production
Economics, vol. 81-82, pp. 195-203.
Koumanakos, D. P. 2008. The effect of inventory management on firm performance.
International Journal of Productivity and Performance Management, vol. 57(5), pp. 355-
369.
Krishnaswamy, O. R. & Satyaprasad, B. G. 2010. Business research methods. Mumbai
[India]: Himalaya Pub. House.
Krupp, J.A.G. 1994. Measuring inventory management performance, Production and
Inventory Management Journal, vol. 35 (4), pp. 1-6.
Kumar, C.S. & Panneerselvam, R. 2007. Literature review of JIT-KANBAN system. The
International Journal of Advanced Manufacturing Technology, vol. 32 (3-4), pp. 393-408.
Kähkönen, A-K. & Lintukangas K. 2018. Key dimensions of supply management’s value
creation ability. International Journal of Operations & Production Management, vol. 38
(4), pp. 979-996.
Kähkönen, A.K. & Lintukangas, K. 2012. The underlying potential of supply management
in value creation. Journal of Purchasing and Supply Management, vol. 18 (2), pp. 68-75.

74
Lepak, D.P., Smith, K.G. & Taylor, M.S. 2007. Introduction to Special Topic Forum Value
Creation and Value Capture: A Multilevel Perspective. Academy of Management Review,
vol. 32 (1), pp. 180-194.
Loar, T. 1992. Patterns of inventory management and policy: a study of four industries.
Journal of Business Logistics, vol. 13 (2), pp. 69-96.
Long, T. & Johnson, M. 2000. Rigour, reliability and validity in qualitative research.
Clinical Effectiveness in Nursing, vol. 4, (1), pp. 30-37.
Machado, V. & Leitner, U. 2010. Lean tools and lean transformation process in health
care. International Journal of Management Science and Engineering Management, vol. 5
(5), pp. 383-392.
Massa, L., Tucci, C.L. and Afuah, A. 2017. A critical assessment of business model
research. Academy of Management Annals, vol. 11(1), pp.73-104.
McNeill, P. 2006. Research methods. 2nd ed. London: Taylor & Francis.
Milne, R., Mahapatra, S. & Wang, C-T. 2015. Optimizing planned lead times For
Enhancing Performance of MRP Systems. International Journal of Production Economics,
vol. 167, pp. 220-231.
Morris, M., Schindehutte, M. & Allen, J. 2005. The entrepreneur's business model: toward
a unified perspective. Journal of business research, vol. 58(6), pp. 726-735.
Osterwalder, A. & Pigneur, Y. 2010. Business model generation: a handbook for
visionaries, game changers, and challengers. John Wiley & Sons.
Plenert, G. 1999. Focusing material requirements planning (MRP) towards performance.
European Journal of Operational Research, vol. 119 (1), pp. 91-99.

75
Porter, M. E. The Competitive Advantage: Creating and Sustaining Superior Performance.
NY: Free Press, 1985. (Republished with a new introduction, 1998.)
Riviera, L., Wan, H., Chen, F. & Lee, W. 2007. Beyond Partnerships: The Power of Lean
Supply Chains. In: Jung, H., Jeong, B. & Chen, F. (eds.) Trends in Supply Chain Design
and Management: Technologies and Methodologies. London. Springer-Verlag.
Samii, A-B., & Pibernik, R. & Yadav, P. 2011. An inventory reservation problem with
nesting and fill rate-based performance measures. International Journal of Production
Economics, vol. 133 (1), pp. 393-402.
Singh, D. & Verma, A. 2018. Inventory Management in Supply Chain. Materials Today:
Proceedings, vol. 5, pp. 3867-3872.
Soman, C. A., Donk, D. P. V., & Gaalman, G. 2002. Combined make-to-order and make-
to-stock in a food. International Journal of Production Economics, vol. 90 (2), pp. 223-235.
Torabi, S.A., Hatefi, M. & Saleck Pay, B. 2012. ABC inventory classification in the
presence of both quantitative and qualitative criteria. Computers & Industrial Engineering,
vol. 63, pp. 530-537.
Woarawichai, C., Kullpattaranirun, T. & Rungreunganun, V. 2011. Inventory lot-sizing
problem with supplier selection under storage space and budget constraints. International
Journal of Computer Science Issues (IJCSI), vol. 8 (2), pp. 250-255.