Embed Size (px)
Citation preview

Role of membranes in mammalian stress response:
sensing, lipid signals and adaptation
Gábor Balogh
PhD Thesis 2011
Thesis submitted in fulfilment of the requirements of the degree of
Doctor of Philosophy, Cardiff University
Institute of Biochemistry
Biological Research Centre
Hungarian Academy of Sciences
Szeged, Hungary

i
Declaration iv
Summary v
Acknowledgements vi
Abbreviations vii
CHAPTER 1. Introduction 1
1.1. Stress 1
1.2. Cellular stress 1 1.2.1. Heat stress at cellular level 2
1.3. The heat shock response 3
1.4. Heat shock proteins 4 1.4.1. Hsp families 7
1.5. Transcriptional regulation of Hsp response 17
1.6. Stress sensing 20 1.6.1. Membranes and membrane lipids 24
1.7. Role of membranes and lipids in temperature adaptation and stress response 47 1.7.1. Cold 47 1.7.2. Heat stress 48 1.7.3. Lipid-interacting non-toxic drugs 52 1.7.4. Lipid signalling of HS 53 1.7.5. HS signals through growth factor receptors 56 1.7.6. Altered HSR in diabetes and cancer 58 1.7.7. Mild and severe heat stress: the significance of fever 60
1.8. Aims of the thesis 62
CHAPTER 2. General materials and methods 63
2.1. General materials 63
2.2. Cell culture 63
2.3. Protein determination 63
2.4. Membrane isolation 64
2.5. Fluorescence anisotropy 65 2.5.1. Membrane fluidity measurements 68
CHAPTER 3. The hyperfluidization of mammalian cell membranes acts as a signal to initiate the heat shock response 69
3.1. Materials and methods 70 3.1.1. Cell culture 70 3.1.2. Membrane fluidity measurements 70 3.1.3. In vivo protein labelling 71 3.1.4. Measurement of intracellular free Ca2+ level 71 3.1.5. Measurement of mitochondrial membrane potential ΔΨm 72 3.1.6. Estimation of the level of in vivo and in vitro protein denaturation in response to
heat stress and membrane fluidizing alcohols 73 3.1.7. Electron microscopy 74 3.1.8. Statistics 74
3.2. Results 75

ii
3.2.1. Selection of the critical concentrations of membrane perturbers equipotent in fluidization with temperature upshifts 75
3.2.2. Membrane fluidizers lower the set-point temperature of Hsp70 synthesis 76 3.2.3. Effects of heat and membrane fluidizers on the cellular morphology and the
cytosolic free Ca2+ level 77 3.2.4. The effects of membrane fluidizers and heat stress on mitochondrial membrane
potential (ΔΨm) 80 3.2.5. The chemical membrane fluidizers exert no measurable effect on protein
denaturation 82
3.3. Discussion 83
CHAPTER 4. Membrane changes during early stress responses in a murine melanoma cell line 88
4.1. Materials and methods 93 4.1.1. Materials 93 4.1.2. Inhibitors 93 4.1.3. Cell culturing and treatments 93 4.1.4. Lipid extraction 94 4.1.5. GC-MS analysis of lipid classes 94 4.1.6. Quantitative analysis of lipid classes using ESI-MS/MS 96 4.1.7. Annotation of lipid species 98 4.1.8. Multidrug resistant (MDR) activity 98 4.1.9. PLA2 activity in vitro 100 4.1.10. Quantitative real-time RT-PCR 101 4.1.11. fPEG-Chol labelling, confocal microscopy, and domain size analysis 101 4.1.12. Statistics 103
4.2. Results 104 4.2.1. Characterization of the B16 lipidome 104 4.2.2. Principal Component Analysis (PCA) shows that B16 cell lipidome is altered in a
stimulus-specific manner due to membrane stress 105 4.2.3. Stress-induced lipid remodelling 107 4.2.4. Proposed involvement of phospholipases 109 4.2.5. Inhibitor studies to uncover the mechanism of arachidonate release 113
4.3. Discussion 118
CHAPTER 5. Heat stress causes spatially-distinct membrane re-modelling in K562 leukemia cells 126
5.1. Materials and methods 128 5.1.1. Materials 128 5.1.2. Cell culture 129 5.1.3. Fluorescence anisotropy 129 5.1.4. DPH lifetime distribution studies 129 5.1.5. EPR studies 130 5.1.6. Laurdan two-photon microscopy 132 5.1.7. Fluorescence microscopy 133 5.1.8. Statistics 133
5.2. Results 134 5.2.1. Laurdan two-photon microscopy shows that heat stress gives rise to spatially-
distinct membrane re-organisation in vivo 134 5.2.2. Fluorescent polarisation revealed the usual fluidity changes in isolated membranes
but unusual alterations in cells 136 5.2.3. Benzyl alcohol-induced fluidization also shows distinct differences between
isolated plasma membranes and cells in vivo 138

iii
5.2.4. Changes in membrane heterogeneity, as detected by lifetime distribution, are caused by heat stress 140
5.2.5. DPH analogues distribute differently within cells 141 5.2.6. EPR studies provide confirmation that heat stress causes re-arrangements of
membrane structure 143
5.3. Discussion 144 5.3.1. Different probes reveal different aspects of membrane organisation 144 5.3.2. Contrasting temperature-induced alterations in fluidity in different cellular
membranes were shown with Laurdan 145 5.3.3. Depending on their chemical structure DPH analogues distribute differently in
cells 146 5.3.4. DPH itself partitions into lipid droplets 147 5.3.5. Cells modify the fluidization seen in isolated membranes 148 5.3.6. The probes detect stress-induced changes in membrane rafts 149 5.3.7. Thermosensitivity or tolerance can be influenced by membrane heterogeneity 150
CHAPTER 6. General discussion 152
Bibliography 160
Appendix 1 – Publication list 183
Appendix 2 – Copyright permissions 187

iv
DECLARATION
This work has not previously been accepted in substance for any degree and is not concurrently submitted in candidature for any degree.
Signed … (Gábor Balogh) Date 30 November 2011
STATEMENT 1 This thesis is being submitted in partial fulfillment of the requirements for the degree of PhD
Signed … (Gábor Balogh) Date 30 November 2011
STATEMENT 2 This thesis is the result of my own independent work/investigation, except where otherwise stated. Other sources are acknowledged by explicit references.
Signed … (Gábor Balogh) Date 30 November 2011
STATEMENT 3 I hereby give consent for my thesis, if accepted, to be available for photocopying and for inter-library loan, and for the title and summary to be made available to outside organisations.
Signed … (Gábor Balogh) Date 30 November 2011

v
SUMMARY
It was suggested that under heat stress the accumulation of denatured proteins alone
triggers the expression of heat shock proteins. However, earlier research suggested that
during abrupt temperature fluctuations membranes represent the most thermally-
sensitive macromolecular structures. The aim of this thesis to confirm experimentally
for the membrane sensor theory in mammalian cells and to explore the mechanisms
behind membrane lipid structural reorganizations. The main results are as follows:
(i) I provide the first evidence that heat-analogous, chemically-induced membrane
perturbation of K562 erythroleukemic cells is indeed capable of activating heat shock
protein formation at the growth temperature, without causing measurable protein
denaturation;
(ii) I showed that the membrane fluidizer benzyl alcohol acts as a chaperone-
inducer also in B16(F10) melanoma cells. Furthermore, following both alcohol and heat
treatments, condensation of ordered plasma membrane domains was detected by
fluorescence microscopy;
(iii) lipidomic fingerprints revealed that stress achieved either by heat or benzyl
alcohol resulted in pronounced and highly specific alterations of membrane lipids in
B16(F10) cells. The loss in polyenes with the concomitant increase in saturated lipid
species was shown to be a consequence of activation of phospholipases. The
accumulation of lipid species with raft-forming properties may explain the condensation
of ordered plasma membrane domains detected previously;
(iv) with Laurdan two-photon microscopy it was demonstrated that, in contrast to
the formation of ordered domains in surface membranes, the molecular disorder is
significantly elevated within the internal membranes of cells preexposed to mild heat
stress. These results were compared with those obtained by other probes and
visualisation methods. It was found that the structurally different probes revealed
substantially distinct alterations in membrane heterogeneity.
The results highlight that even subtle changes in membrane microstructure may
play a role in temperature sensing and thermal cell killing and, therefore, could have
potential in treatment of several diseases.

vi
ACKNOWLEDGEMENTS
I would like to thank my supervisors, Prof. John Harwood and Prof. László Vígh, for
providing me with the opportunity to complete my PhD thesis at the Cardiff University
as an external student from the Biological Research Centre in Szeged. I am very grateful
for their patience, motivation, enthusiasm, and immense knowledge in lipid, membrane
and stress biochemistry. I want to thank László for the many insightful discussions and
creating ideas together. He gave me the freedom to design and pursue various projects.
Special thanks to John for the continuous support, and the critical questions, corrections
and language editing from which I learned a lot.
I am also very grateful to present and past members of the Laboratory of Molecular
Stress Biology in BRC, especially to Ibolya Horváth for the discussions and in-depth
proofreading of my manuscripts, to Zsolt Török for his advices in biophysical methods,
Imre Gombos and Enikő Nagy for their collaboration, and Attila Glatz for his advice
about molecular biology. Special thanks to Maria Péter, my closest coworker and
generous friend for the everyday helping to finish up the manuscripts and the thesis. I
want to thank for the skillful technical assistance Éva Dobóné Barta and Gabi
Bogdánné.
I want to thank our collaborators in other groups of the BRC (Elfrieda Fodor and Tibor
Páli), and in Italy (Tiziana Parasassi, Giuseppe Maulucci, Marco De Spirito), Germany
(Gerhard Liebisch and Gerd Schmitz) and France (Olivier Bensaude), for their kindness,
friendship and support. I spent professionally fruitful times in all countries. Their
contribution will be detailed in the corresponding chapters of the thesis.
I also thank my wife, Marta for the love, patience and support.

vii
ABBREVIATIONS
AA arachidonic acid AM acetoxymethyl ester Akt/PKB protein kinase B BA benzyl alcohol BCA bicinchoninic acid BMP bis(monoacylglycero)phosphate [Ca2+]i intracellular free calcium CaMKII calcium/calmodulin-dependent protein kinase II CCCP carbonyl cyanide p-chlorophenylhydrazone CDP cytidine diphosphate CE cholesteryl ester Cer ceramide CG cholesteryl glucoside Chol cholesterol CL cardiolipin COX cyclooxygenase CSR cellular stress response DG/DAG diradylglycerol/diacylglycerol DGL diacylglycerol lipase DHA docosahexaenoic acid DHSph dihydrosphingosine DMA dimethyl acetal DMSO dimethyl sulfoxide DPH 1,6-diphenyl-1,3,5-hexatriene DPH-PA 1,6-diphenyl-1,3,5-hexatriene propionic acid DRM detergent-resistant membrane domains EGFR epidermal growth factor receptor EGTA ethylene glycol tetraacetic acid EPA eicosapentaenoic acid EPR electron paramagnetic resonance ER endoplasmic reticulum ERK extracellular signal-regulated kinase ESI-MS electrospray ionization tandem mass spectrometry FA fatty acid/fatty acyl FAAH fatty acid amide hydrolase FAME fatty acid methyl esters FCS fetal calf serum FFA free fatty acid FFT fast Fourier transform fPEG-Chol fluorescein ester of polyethylene glycol-derivatized cholesterol GalCer galactosylceramide GC-MS gas chromatography-mass spectrometry GL glycerolipid GluCer glucosylceramide GP generalized polarization GPI glycosylphosphatidylinositol GPL glycerophospholipid GSK3 glycogen synthase kinase-3

viii
GSL glycosphingolipid HE heptanol HER heregulin HS heat stress/heat shock HSE heat shock element HSF heat shock factor Hsp heat shock protein Hsp heat shock protein gene HSR heat shock response IGF insulin-like growth factors IP3 inositol triphosphate JC-1 5,59,6,69-tetrachloro-1,19,3,39-tetraethyl-
benzimidazolylcarbocyanine iodide JNK c-jun N-terminal kinase Laurdan 6-dodecanoyl-2-dimethylaminonaphthalene LD lipid droplet Ld liquid-disordered phase Lo liquid-ordered phase LOX lipoxygenase LPA lysophosphatidic acid LPC lysophosphatidylcholine MAF MDR activity factor MAFP methyl arachidonyl fluorophosphonate MAPK mitogen-activated protein kinase MDR multidrug resistance MDR1 multidrug resistant protein MG/MAG monoradylglycerol/monoacylglycerol MGL monoacylglycerol lipase MUFA monounsaturated fatty acid NIST National Institute of Standards and Technology NSAID non-steroidal anti-inflammatory drug PA phosphatidic acid PAF platelet activating factor PBS phosphate buffered saline PC phosphatidylcholine PC1/PC2/PC3 principal components 1/2/3 PCA principal component analysis PC-O 1-alkyl-2-acyl species of phosphatidylcholine PE phosphatidylethanolamine PEMT phosphatidylethanolamine N-methyltransferase PE-P 1-(1Z-alkenyl)-2-acyl species of PE PG phosphatidylglycerol PGA/PGG/PGH/PGJ different series of prostaglandins PI phosphatidylinositol PI3K phosphoinositide 3-kinase PIP2 phosphatidylinositol-4,5-biphosphate (PI(4,5)P2) PIP3 phosphatidylinositol-3,4,5-triphosphate PIPn phosphoinositides PKA protein kinase A PKB/Akt protein kinase B PKC protein kinase C PL phospholipid

ix
PLA1 phospholipase A1 PLA2 phospholipase A2
PLC phospholipase C PLD phospholipase D PM plasma membrane PPO 2,5-diphenyloxazole PS phosphatidylserine PSL phosphosphingolipid PTEN phosphatase and tensin homologue protein PUFA polyunsaturated fatty acid Rac1 Ras-related C3 botulinum toxin substrate 1 ROI Region-of-Interest 5- and 16-SASL 5- and 16-(4',4'-dimethyloxazolidine-N-oxyl)stearic acid spin
labels SD standard deviation SDS sodium dodecyl sulfate SEM standard error of mean S1P sphingosine-1-phosphate SFA saturated fatty acid SIRT1 sirtuin 1 SL sphingolipid SM sphingomyelin Sn stereospecific numbering SPC sphingosyl phosphorylcholine Sph sphingosine THL tetrahydrolipstatin TG/TAG triradylglycerol/triacylglycerol TGL triacylglycerol lipase TMA-DPH 1-(4-trimethylammoniumphenyl)-6-phenyl-1,3,5-hexatriene TPL total polar lipid ΔΨm mitochondrial membrane potential

1
CHAPTER 1. INTRODUCTION
“Without stress, there would be no life”
Hans Selye
1.1. STRESS
Hans Selye discovered stress in 1936 as a syndrome occurring in laboratory rats which
he termed the "general adaptation syndrome" (Selye, 1936). In 1950 he summarised his
thesis concerning stress: "Anything that causes stress endangers life, unless it is met by
adequate adaptive responses; conversely, anything that endangers life causes stress and
adaptive responses. Adaptability and resistance to stress are fundamental prerequisites
for life, and every vital organ and function participates in them." (Selye, 1950).
Nowadays Selye's notion of a universal non-specific reaction has become accepted, and
biochemists and physiologists use stress as a unifying concept to understand the
interaction of organic life with the environment.
General adaptation can be divided into three stages. The first stage is called the
alarm reaction, the second resistance or adaptation and the third exhaustion (Selye,
1936). In the first two phases the stress response does not lead to adverse health
outcomes; rather, it protects an organism from harm by increasing alertness, mobilizing
energy, and protecting against pathogens. Every time the stress response is activated,
however, physiological adjustments must be made, and over time, these adjustments
may lead to cumulative exhaustion (Piazza et al., 2010).
The beneficial effect of stress is to enable the organism to cope with a subsequent,
more severe stress. This ability is called stress tolerance. In a positive case of mild stress
with no apparent damage this phenomenon is called hormesis. However, if damage
overwhelms the adaptation, it results in functional decline, a so-called distress. The
organismal adaptation response is mediated by the vegetative nervous system and the
hypothalamo-pituitary-adrenal axis (Söti and Csermely, 2007). But how can the
organisms cope with stress at the cellular level?
1.2. CELLULAR STRESS
Acute and chronic stresses are able to cause deleterious effects on cellular infrastructure
and disturb cellular homeostasis. Most types of environmental stress, including osmotic

2
stress (Hochachka and Somero, 2002), thermal stress (Hochachka and Somero, 2002),
heavy metal stress (Farrer and Pecoraro, 2002), ionizing radiation (Kempner, 1993),
baric stress (Somero, 1992), oxidative stress (Kasprzak, 2002) and hypoxia/ischemia
(Borkan and Gullans, 2002), manifest themselves with changes in protein conformation.
Likewise, many of these various stresses are also known to cause DNA damage
(Galloway et al., 1987; Kasprzak, 2002; Kültz and Chakravarty, 2001; Liu, 2001;
Rydberg, 2001). Lipids are also well-known targets of oxidative (see e.g. Catalá, 2010)
and heat stresses (Yatvin and Cramp, 1993), X-ray (Yukawa et al., 2005) and UV
(Roshchupkin and Murina, 1998) irradiations. Moreover, the stress response in
eukaryotic cells often inhibits translation initiation and leads to the formation of
cytoplasmic RNA-protein complexes referred to as stress granules (Buchan and Parker,
2009).
As a consequence, organisms have developed the capacity to initiate a number of
adaptive cellular response pathways that attempt to reduce damage and maintain or re-
establish cellular homeostasis (Gupta et al., 2010). The cellular stress response (CSR) is
a universal mechanism of extraordinary physiological/pathophysiological significance
(Kültz, 2003). Many aspects of CSR are not stressor-specific because cells monitor
stress based on macromolecular damage regardless of the type of stress that causes such
damage; cellular mechanisms activated by DNA, protein and membrane (lipid) damage
are interconnected and share common elements. Other cellular responses directed at re-
establishing homeostasis are stressor-specific and often activated in parallel to the CSR.
All organisms have stress proteins, and universally conserved stress proteins can be
regarded as the minimal stress proteome. Functional analysis of the minimal stress
proteome yields information about key aspects of the cellular stress response, including
physiological mechanisms of sensing membrane lipid, protein, and DNA damage; redox
sensing and regulation; cell cycle control; macromolecular stabilization/repair; and
control of energy metabolism. In addition, cells can quantify stress and activate a death
program (apoptosis) when tolerance limits are exceeded (Kültz, 2005).
1.2.1. Heat stress at cellular level
A major type of damage observed in response to heat stress (HS) conditions, especially
in eukaryotes, are defects of the cytoskeleton (Richter et al., 2010). In Figure 1.1 an
unstressed cell is compared to a heat-stressed cell. Mild HS leads to the reorganization
of actin filaments into stress fibres, while severe HS results in the aggregation of

3
vimentin or other filament-forming proteins (microtubuli), leading to the collapse of
intermediary, actin, and tubulin networks (Welch and Suhan, 1985; Welch and Suhan,
1986). Along with the disruption of the cytoskeleton, the loss of the correct localization
of organelles and a breakdown of intracellular transport processes are observed. The
Golgi system and the endoplasmic reticulum (ER) become fragmented under stress
conditions, and the number and integrity of mitochondria and lysosomes decreases
(Welch and Suhan, 1985). The uncoupling of oxidative phosphorylation and the loss of
mitochondria are connected to a dramatic drop in ATP levels during HS (Patriarca et al.,
1992). The nucleoli, sites of ribosome assembly, swell, and large granular depositions,
the stress granula, become visible in the cytosol in addition to protein aggregates.
Finally, there are changes in the membrane morphology, aggregation of membrane
proteins, and an increase in membrane fluidity. Together, all these effects stop growth
and lead to cell-cycle arrest as indicated by non-condensed chromosomes in the nucleus.
Figure 1.1. Effects of heat shock on the organization of the eukaryotic cell (Richter et al.,
2010). An unstressed eukaryotic cell (left) is compared to a cell under heat stress (right).
The different subcompartments are colour-coded: actin filaments, blue; microtubuli, red;
endoplasmic reticulum, white; mitochondria, green; lysosomes, yellow-white gradient;
stress granula, yellow; protein aggregates (hexagonal versus spaghetti style), orange.
1.3. THE HEAT SHOCK RESPONSE
An important subclass of CSR is the heat shock response (HSR). According to the
definition of Westerheide and Morimoto, the HSR is an ordered genetic response to
diverse environmental and physiological stressors that results in the immediate
induction of genes, called stress genes or heat shock genes, encoding molecular
chaperones, proteases, and other proteins (Westerheide and Morimoto, 2005). These are
essential for protection and recovery from cellular damage associated with the
expression of misfolded proteins and/or other compromised cell sensory elements such

4
as RNA, redox sensors and membranes (see later). The list of “stressors” that activate
transcription of stress genes is large and includes various acute and chronic conditions
such as elevated temperatures, heavy metals, small molecule chemical toxicants,
infection, and oxidative stress.
However, from a survey of the literature it is clear that hyperthermia causes an
increase in cholesterol and a rearrangement in phospholipid composition in cellular
membranes as well (Yatvin and Cramp, 1993). Furthermore, the functional changes in
membrane lipids at high temperature – linked with the alterations in fatty acid
unsaturation and with other subtle changes in membrane lipid composition – can
influence the response of organisms to high temperature (Guschina and Harwood,
2006). Therefore, in this thesis I use the term HSR in a wider sense including also
processes which not necessarily or directly lead to stress gene induction and protein
expression, but cause membrane remodelling in response to stress (see also Chapters 3–
5).
1.4. HEAT SHOCK PROTEINS
In the early 1960s, Ritossa made the seminal discovery of temperature-induced puffs in
polytene chromosomes of Drosophila melanogaster larvae salivary glands (Ritossa,
1962). A decade later, it was shown that the puffing pattern corresponded to a robust
activation of genes encoding the heat shock proteins (Hsps) (Lindquist, 1986; Tissières
et al., 1974). Many of these proteins function as molecular chaperones to guide
conformational states critical in the synthesis, folding, translocation, assembly, and
degradation of proteins (Bukau and Horwich, 1998; Hartl, 1996). Some of the major
chaperones are present at high concentrations in non-stressed cells reaching 1–5 % of
total cellular protein, which shows that a continuous intense demand is present to guard
the protein conformational homeostasis.
A meta-analysis of microarray data (Figure 1.2) showed that a short sub-lethal HS
(43 °C, 60 min) upregulated about 2 % of the human genes more than 3.16-fold (in
monocyte leukemia THP-1 cells). Chaperone genes were 17 times more likely to be
induced by heat than non-chaperone genes and 20 % of the chaperome was massively
(>20-fold) induced by elevated temperature. Despite this general high propensity of the
chaperones to be induced by heat, a majority of chaperone genes (66 % for human) still
remained uninduced (Finka et al., 2011). The terms “chaperones” and “Hsps” are often
indiscriminately used in the literature. However, the above analysis clearly confirms the

5
importance of not confusing Hsps with chaperones and vice versa, because most Hsps
are not chaperones, and most chaperones are not Hsps (Finka et al., 2011).
Figure 1.2. Distribution and fold-expression levels of heat-induced genes in human
monocyte leukemia THP-1 cells (adapted from Finka et al., 2011). Cells were heat
stressed at 43 C for 1 h. Microarray probes corresponding to bioinformatically-predicted
chaperone genes are in white, non-chaperone genes are grey and heat-induced chaperones
are black.
In the present work I use the term "Hsp" in a narrower sense by focusing on heat-
induced chaperones (black intersection in Figure 1.2). (Hsp) chaperones display various
activities in the cell, such as:
1. proper folding of nascent polypeptide chains,
2. facilitating protein translocation across various cellular compartments,
3. modulating protein activity via stabilization and/or maturation to
functionally-competent conformation, masking mild mutation at the
conformational level
4. promoting multiprotein complex assembly/disassembly,
5. refolding of misfolded proteins,
6. protecting against protein aggregation,
7. targeting ultimately damaged proteins in degradation,

6
8. sequestering damaged proteins to aggregates,
9. solubilizing protein aggregates for refolding/degradation.
Moreover, chaperones work in concert with co-chaperones and regulate local protein
and signalling networks of the cell (Pratt and Toft, 2003; Söti and Csermely, 2000; Söti
and Csermely, 2007; Söti et al., 2005; Young et al., 2004).
Activation and induction of Hsps are the molecular basis of both aquired
thermotolerance and cross-tolerance (Kültz, 2005). When organisms are grown at
normal temperatures and shifted suddenly to severe temperatures they die rapidly.
However, if they are given a brief pretreatment at a more moderate but Hsp-inducing
temperature they have a higher chance of survival at severe temperatures. The effects of
pretreatments are very dramatic. Differences in survival between naive and conditioned
organisms are often in the range of 100- to 1000-fold. This phenomenon is also called
acquired thermotolerance. Conditioning heat treatment also provides tolerance to many
other types of stress, such as sodium arsenite or heat in yeast (Parsell et al., 1993).
Similarly, ischemic preconditioning and mild hyperthermia induce Hsp70 and decrease
reperfusion injury of human muscle and kidney (Lepore et al., 2001).
A moonlighting function of Hsps is linked to their membrane association. A
subpopulation of Hsps is present either on the surface or within cellular membranes
(Horváth et al., 2008). On the basis of prokaryotic models, it was suggested earlier that
a lipid-selective association of a subpopulation of Hsps (GroEL and sHsps) with
membranes, leading to increased molecular order, may in turn result in down-regulation
of hsp gene expression (Horváth et al., 1998; Török et al., 1997; Török et al., 2001).
Such hypothetical ‘cross-talk’ between the membrane primary stress sensors and Hsps
suggests a feedback loop mechanism in the regulation of hsp genes (Escribá et al., 2008;
Vigh et al., 1998; Vigh et al., 2007a). sHsps have been shown to modulate major
attributes of the membrane lipid phase such as the fluidity, permeability, or non-bilayer
propensity via their specific membrane lipid interactions. It is emphasized that different
Hsps have been found to associate to a variable extent with detergent-resistant
microdomains (“rafts”), and the association of the Hsps with these microdomains can be
modulated by stress (Broquet et al., 2003). Further important aspects of membrane-
associated stress proteins, e.g. the membrane quality control by lipid–sHsp interactions,
the membrane expression of Hsp70 and its release into the extracellular milieu, and the
question, how Hsp70 promotes cell survival by inhibiting lysosomal membrane
permeabilization, are not discussed in details in this thesis. However, exhaustive
information can be found in a recent review (Horváth et al., 2008).

7
1.4.1. Hsp families
Hsp chaperone families include members whose expression is constitutive,
developmentally/organ-specifically regulated, and/or responsive to heat or other abiotic
stresses (Finka et al., 2011), indicating that molecular chaperones take part in many
physiological and stress-related cellular processes.
The heat shock gene superfamily is organized by molecular size and functional
class, including the Hsp100, Hsp90, Hsp70, Hsp60, Hsp40 (J-domain proteins), and
small heat shock protein (sHsp) families.
Hsps were originally identified as stress-responsive proteins required to deal with
thermal and other proteotoxic stresses. It became clear shortly thereafter that Hsp
families also encode constitutively expressed members like Hsc70 (HSPA8) in the
Hsp70 family. With the sequencing of the human genome and the computational
annotation of its genes, it became apparent that most Hsp families contain additional
members.
The expanding number of members in the various human Hsp families and the
inconsistencies in their nomenclature have often led to confusion (Kampinga et al.,
2009). The nomenclature of the human Hsp families with the alternative names and the
mouse orthologs are listed in Tables 1.1–1.5 in order to help orientate the reader.

8
Table 1.1. HSP Nomenclature. HSP70 superfamily: HSPA (HSP70) and HSPH (HSP110) families (Kampinga et al., 2009).
Gene name
Protein name
Old names Human gene ID
Mouse ortholog ID
HSP A
1 HSPA1A HSPA1A HSP70-1; HSP72; HSPA1 3303 193740
2 HSPA1B HSPA1B HSP70-2 3304 15511
3 HSPA1L HSPA1L hum70t; hum70t; Hsp-hom 3305 15482
4 HSPA2 HSPA2 Heat-shock 70kD protein-2 3306 15512
5 HSPA5 HSPA5 BIP; GRP78; MIF2 3309 14828
6 HSPA6 HSPA6 Heat shock 70kD protein 6 (HSP70B′)
3310 unknown
7 HSPA7 a HSPA7 Heat shock 70kD protein 7 3311 unknown
8 HSPA8 HSPA8 HSC70; HSC71; HSP71; HSP73
3312 15481
9 HSPA9 HSPA9 GRP75; HSPA9B; MOT; MOT2; PBP74; mot-2
3313 15526
10 HSPA12A HSPA12A FLJ13874; KIAA0417 259217 73442
11 HSPA12B HSPA12B RP23-32L15.1; 2700081N06Rik
116835 72630
12 HSPA13 b HSPA13 Stch 6782 110920
13 HSPA14 HSPA14 HSP70-4; HSP70L1; MGC131990
51182 50497
HSP H
1 HSPH1 HSPH1 HSP105 10808 15505
2 HSPH2 b HSPH2 HSPA4; APG-2; HSP110 3308 15525
3 HSPH3 b HSPH3 HSPA4L; APG-1 22824 18415
4 HSPH4 b HSPH4 HYOU1/Grp170; ORP150; HSP12A
10525 12282
aAnnotated as pseudogene, but possibly a true gene bUnder consultation with the HUGO Gene Nomenclature Committee (HGNC) and the scientific community

9
Table 1.2. HSP Nomenclature. The DNAJ (HSP40) family (Kampinga et al., 2009).
Gene name
Protein name
Old names Human gene ID
Mouse ortholog ID
DnaJA
1 DNAJA1 DNAJA1 DJ-2; DjA1; HDJ2; HSDJ; HSJ2; HSPF4; hDJ-2
3301 15502
2 DNAJA2 DNAJA2 DNJ3; mDj3; Dnaj3; HIRIP4 10294 56445
3 DNAJA3 DNAJA3 Tid-1; Tid1l 9093 83945
4 DNAJA4 DNAJA4 Dj4; Hsj4 55466 58233
DnaJB
5 DNAJB1 DNAJB1 HSPF1; HSP40 3337 81489
6 DNAJB2 DNAJB2 HSJ1; HSPF3; Dnajb10; MDJ8 3300 56812
7 DNAJB3 DNAJB3 Hsj3; Msj1; MSJ-1; Hcg3a 414061a 15504
8 DNAJB4 DNAJB4 Hsc40 11080 67035
9 DNAJB5 DNAJB5 Hsc40; HSP40-3 25822 56323
10 DNAJB6 DNAJB6 Mrj; mDj4 10049 23950
11 DNAJB7 DNAJB7 Dj5; mDj5 150353 57755
12 DNAJB8 DNAJB8 mDj6 165721 56691
13 DNAJB9 DNAJB9 Mdg1; mDj7; ERdj4 4189 27362
14 DNAJB11 DNAJB11 Dj9; ABBP-2; Erdj3 51726 67838
15 DNAJB12 DNAJB12 Dj10; mDj10 54788 56709
16 DNAJB13 DNAJB13 Tsarg6; Tsarg 3 protein 374407 69387
17 DNAJB14 DNAJB14 EGNR9427; FLJ14281 79982 70604
DnaJC
19 DNAJC1 DNAJC1 MTJ1; ERdj1; ERj1p; Dnajl1 64215 13418
20 DNAJC2 b DNAJC2 Zrf1; Zrf2; MIDA1;M-phase phosphatase protein 11; MPP11; zuotin; ZUO1
27000 22791
21 DNAJC3 DNAJC3 p58; mp58; Prkri; Dnajc3; p58IPK; Dnajc3b
5611 100037258
22 DNAJC4 DNAJC4 HSPf2; Mcg18 3338 57431
23 DNAJC5 DNAJC5 Csp 80331 13002
24 DNAJC5B DNAJC5B CSP-beta 85479 66326
25 DNAJC5G DNAJC5G MGC107182; gamma-CSP 285126 231098
26 DNAJC6 DNAJC6 mKIAA0473; auxilin 9829 72685
27 DNAJC7 DNAJC7 Ttc2; mDj11; mTpr2 7266 56354
28 DNAJC8 DNAJC8 AL024084; AU019262; splicing protein (spf31)
22826 68598
29 DNAJC9 DNAJC9 AU020082; RcDNAJ9 23234 108671
30 DNAJC10 DNAJC10 JPDI; ERdj5; macrothioredoxin 54431 66861
31 DNAJC11 DNAJC11 FLJ10737; dJ126A5.1 55735 230935

10
Gene name
Protein name
Old names Human gene ID
Mouse ortholog ID
32 DNAJC12 DNAJC12 Jdp1; mJDP1 56521 30045
33 DNAJC13 DNAJC13 Rme8; RME-8; Gm1124 23317 235567
34 DNAJC14 DNAJC14 HDJ3; LIP6; DRIP78 85406 74330
35 DNAJC15 DNAJC15 Dnajd1; MCJ; Cell growth-inhibiting 22 protein
29103 66148
36 DNAJC16 DNAJC16 mKIAA0962 23341 214063
37 DNAJC17 DNAJC17 C87112 55192 69408
38 DNAJC18 DNAJC18 MGC29463 202052 76594
39 DNAJC19 DNAJC19 TIM14; TIMM14 131118 67713
40 DNAJC20 b
DNAJC20 JAC1; HSC20; HscB 150274 100900
41 DNAJC21 DNAJC21 GS3; JJJ1; DNAJA5 134218 78244
42 DNAJC22 DNAJC22 FLJ13236; Wurst 79962 72778
43 DNAJC23 b
DNAJC23 Sec63; AI649014 11231 140740
44 DNAJC24 b
DNAJC24 DPH4; zinc finger, CSL-type containing 3
120526 99349
45 DNAJC25 DNAJC25 bA16L21.2.1; DnaJ-like protein; AAH48318; LOC552891; G-protein gamma 10
548645 72429
46 DNAJC26 DNAJC26 GAK; cyclin G associated kinase; auxilin-2
2580 231580
47 DNAJC27 b
DNAJC27 RBJ; RabJ 51277 217378
48 DNAJC28 DNAJC28 Orf28 open reading frame 28; C21orf55, oculomedin
54943 246738
49 DNAJC29 b
Sacsin; SACS 26278 50720
50 DNAJC30 DNAJC30 WBSCR18; Williams–Beuren syndrome chromosome region 18 homolog (human)
84277 66114
aHcg3 is the closest human homologue of, and is syntenic with, MSJ-1 which encodes both N- and C-terminal domains in the same transcript but there is a reported frame shift between these domains bUnder consultation with HGNC and the scientific community

11
Table 1.3. HSP Nomenclature. The HSPB family (small heat shock proteins) (Kampinga et al., 2009).
Gene name
Protein name
Old names Human gene ID
Mouse ortholog ID
1 HSPB1 HSPB1 CMT2F; HMN2B; HSP27; HSP28; HSP25; HS.76067; DKFZp586P1322
3315 15507
2 HSPB2 HSPB2 MKBP; HSP27; Hs.78846; LOH11CR1K; MGC133245
3316 69253
3 HSPB3 HSPB3 HSPL27 8988 56534
4 HSPB4 a HSPB4 crystallin alpha A; CRYAA, CRYA1 1409 12954
5 HSPB5 a HSPB5 crystallin alpha B, CRYAB; CRYA2 1410 12955
6 HSPB6 HSPB6 HSP20; FLJ32389 126393 243912
7 HSPB7 HSPB7 cvHSP; FLJ32733; DKFZp779D0968 27129 29818
8 HSPB8 HSPB8 H11; HMN2; CMT2L; DHMN2; E2IG1; HMN2A; HSP22
26353 80888
9 HSPB9 HSPB9 FLJ27437 94086 75482
10 HSPB10 a
HSPB10 ODF1; ODF; RT7; ODF2; ODFP; SODF; ODF27; ODFPG; ODFPGA; ODFPGB; MGC129928; MGC129929
4956 18285
11 HSPB11 HSPB11 HSP16.2; C1orf41; PP25 51668 72938 aUnder consultation with HGNC and the scientific community Table 1.4 HSP Nomenclature. The HSP90/HSPC family (Kampinga et al., 2009).
Gene name
Protein name
Old names Human gene ID
Mouse ortholog ID
1 HSPC1 a
HSPC1
HSP90AA1; HSPN; LAP2; HSP86; HSPC1; HSPCA; HSP89; HSP90; HSP90A; HSP90N; HSPCAL1; HSPCAL4; FLJ31884
3320 15519
2 HSPC2 a
HSPC2 HSP90AA2; HSPCA; HSPCAL3; HSP90ALPHA;
3324 unknown
3 HSPC3 a
HSPC3 HSP90AB1; HSPC2; HSPCB; D6S182; HSP90B; FLJ26984; HSP90-BETA
3326 15516
4 HSPC4 a
HSPC4 HSP90B1;ECGP; GP96; TRA1; GRP94; endoplasmin
7184 22027
5 HSPC5 a
HSPC5 TRAP1; HSP75; HSP90L 10131 68015
aUnder consultation with HGNC and the scientific community

12
Table 1.5. HSP Nomenclature. Chaperonins and related genes (Kampinga et al., 2009).
Gene name
Protein name
Old names Human gene ID
Mouse ortholog ID
HSPD
1 HSPD1 HSPD1 HSP60; GroEL 3329 15510
HSPE
1 HSPE1 HSPE1 HSP10; chaperonin 10; GroES 3336 15528
CCT
1 CCT1 a CCT1 TCP1; CCTA; CCT-alpha; TCP-1-alpha
6950 21454
2 CCT2 CCT2 CCTB; CCT-beta; TCP-1-beta 10576 12461
3 CCT3 CCT3 CCTG; CCT-gamma; TCP-1-gamma; TRiC-P5
7203 12462
4 CCT4 CCT4 CCTD; CCT-delta,;TCP-1-delta; SRB
10575 12464
5 CCT5 CCT5 CCTE; CCT-epsilon; TCP-1-epsilon 22948 12465
6 CCT6A CCT6A CCT6; CCTZ; CCT-zeta; CCT-zeta1; TCP-1-zeta; HTR3; TCP20
908 12466
7 CCT6B CCT6B CCTZ2; CCT-zeta2; TSA303 10693 12467
8 CCT7 CCT7 CCTH; CCT-eta; TCP-1-eta 10574 12468
9 CCT8 CCT8 CCTQ; CCT-theta; TCP-1-theta; KIAA002
10694 12469
Other chaperonin-like
1 MKKS MKKS McKusick–Kaufman syndrome; MKS; Bardet–Biedl syndrome 6; BBS6
8195 59030
2 BBS10 BBS10 Bardet–Biedl syndrome 10 79738 71769
3 BBS12 BBS12 Bardet–Biedl syndrome 12 166379 241950 aUnder consultation with HGNC and the scientific community

13
Small Hsps (sHsps or HSPB in mammals) are ATP-independent low-molecular
mass chaperones found in every kingdom. sHsps are characterized by the presence of a
conserved crystallin domain flanked by a variable N-terminus and C-terminus. The N-
and C-termini, together with part of the crystallin domain, are involved in substrate
binding (Vos et al., 2008). One of the most notable features is their large oligomeric
structure with conserved structural organization. It is well documented that sHsps can
capture unfolding, aggregation-prone proteins to form stable complexes and prevent
their irreversible aggregation. The release of substrate proteins from the transient
reservoirs, i.e. complexes and aggregates with small heat shock proteins, and their
refolding require cooperation with ATP-dependent chaperone systems (Nakamoto and
Vigh, 2007).
Hsp90 is an evolutionarily conserved molecular chaperone involved in the
folding, stabilization, activation, and assembly of its 'client' proteins (Csermely et al.,
1998; Pearl et al., 2008; Pratt et al., 2008), and is an essential component of the
protective heat shock response (Heads et al., 1995; Taipale et al., 2010). In non-stressed
cells, Hsp90 is highly abundant and associates with a wide array of client proteins that
depend on its chaperoning function to acquire their active conformations. Hsp90's
ATPase activity, which is essential for its chaperone function, is regulated and coupled
with the conformational changes of Hsp90 dimer (Hahn, 2009). The protein folding by
Hsp90 is involved in signal transduction, protein trafficking, receptor maturation and
innate and adaptive immunity. In doing so, Hsp90 interacts with more than 20 co-
chaperones, which guide its recognition of client proteins and modulate its biochemical
activities. These activities are closely coupled to environmental perturbations (Taipale
et al., 2010).
Recently, it was found that Hsp110 members act as nucleotide exchange factors
for both mammalian and yeast Hsp70 proteins (Dragovic et al., 2006; Raviol et al.,
2006). Hsp110 proteins are known to have the capacity to hold unfolded proteins in a
folded competent state. As both heat-inducible substrate binders and heat-inducible
nucleotide exchange factors, Hsp110 proteins may be particularly relevant under (heat)
stress conditions during which it may hold substrates (like sHSPs) to be passed on to
Hsp70 for further handling after the stress (Vos et al., 2008).
Chaperonins represented by Hsp60 homologues are found in bacteria (GroEL),
mitochondria, chloroplasts and in the cytosol of eukaryotes (TIRC). A functional Hsp60
complex comprises 14 identical subunits arranged in two stacked heptameric rings,
requiring two heptameric co-chaperones, Hsp10/GroES (Azem et al., 1995). Artificially

14
denatured proteins become prevented from aggregating upon binding to purified GroEL
and, moreover, become subsequently refolded to the native state in a strict GroES- and
ATP-dependent manner (Finka et al., 2011; Goloubinoff et al., 1989).
Hsp70s are ubiquitous molecular chaperones that function in a myriad of
biological processes, modulating polypeptide folding, degradation and translocation
across membranes, as well as protein–protein interactions (Kampinga and Craig, 2010).
However, Hsp70s have never been found to function alone. Much of their functional
diversity is driven by a diverse class of cofactors, J-proteins (also called Hsp40s). Often,
multiple J-proteins function with a single Hsp70. Some target Hsp70 activity to clients
at precise locations in cells; others bind client proteins, thereby delivering specific
clients to Hsp70, directly determining their fate.
All cellular functions of the Hsp70/Hsp40 core machine (Figure 1.3) use the
same mechanism of ATP-driven polypeptide binding and release; binding and
hydrolysis of ATP regulates their interactions with unfolded polypeptide substrates and
are essential both in vitro and in vivo for the chaperone activity (Mayer and Bukau,
2005; Young, 2010).
Figure 1.3. Chaperone networks; the arrows indicate client transfer to and from the
various chaperone complexes (see Kampinga and Craig, 2010).
The core machines can form partnerships with at least three other Hsp families.
These include partnerships with the ATP-dependent chaperonins (Hsp60/TRIC family),

15
the Hsp90 family and the ATP-independent chaperones of the small Hsp families. Each
of these families is composed of several members and the size of these families
(especially the small Hsps) has increased substantially during evolution. In various
processes, the Hsp70 core machine can act simultaneously or sequentially with these
other Hsp families in protein (re)folding, -assembly, -degradation, or even -
disaggregation (Figure 1.3).
A summary of the properties of different human HSPs is given in Table 1.6.
Table 1.6. Properties of the human HSP families (Vos et al., 2008).
molecular size (kDa)
tissue distribution
subcellular localization
clients/ substrates
associated disease
sHSP family HSPB1 22.8 ubiquitous cytosol cytoskeletal
components, ubiquitin, cytochrome c
Charcot-Marie-Tooth disease, distal hereditary motor neuropathy
HSPB2 20.2 heart and skeletal muscle
cytosolic granules/mitochondria
myotonic dystrophy protein kinase
–
HSPB3 17 muscle unknown – HSPB4 19.9 eye lens cytoplasm – cataract HSPB5 20.2 ubiquitous cytosol/nucleus cytoskeletal
components cataract, desmin-related myopathy
HSPB6 17.1 heart, muscle, brain
cytosol 14-3-3 γ, Bax –
HSPB7 18.6 heart and skeletal muscle
cytosol/nucleus α-filamin upregulated in muscular dystrophy
HSPB8 21.6 muscle, brain, keratinocytes, placenta
cytosol/plasma membrane
BAG-3 Charcot-Marie-Tooth disease, distal hereditary motor neuropathy
HSPB9 17.5 testis cytosol/nucleus DynLT1 upregulated in certain tumors
HSPB10 28.4 testis sperm cell tails – –
HSPB11 16.3 unknown cytosol/nucleus Hsp90 upregulated in certain tumors
HSP90 family HSPH1 96.9 ubiquitous cytosol/nucleus – – HSPH2 94.3 ubiquitous cytosol/nucleus – – HSPH3 94.5 testis, brain,
kidney, liver, lung, spleen
cytosol/nucleus – –

16
HSPH4 111.3 ubiquitous endoplasmic reticulum (ER)
– –
HSP70 family HSPA1A 70 ubiquitous cytosol promiscuous upregulated in
certain tumors
HSPA1B 70 ubiquitous cytosol promiscuous upregulated in certain tumors
HSPA1L 70.4 testis cytosol – rs2075800 G allele associates with sarcoidosis
HSPA2 70 testis/ubiquitous
cytosol/nucleus – upregulated in certain tumors
HSPA5 71 ubiquitous ER ATF6 – HSPA6 71 brain, liver,
ovary, saliva cytosol/nucleus – in the proximity
of a susceptibility locus for schizophrenia
HSPA7 ND unknown unknown – in the proximity of a susceptibility locus for schizophrenia
HSPA8 70.9 ubiquitous cytosol/nucleus many growth factors
upregulated in certain tumors
HSPA9 73.7 B cell, brain, liver, ovary, platelet, saliva
mitochondria mitochondrial proteins, p53
–
HSPA12A 141 endothelia, brain, heart, kidney, muscle, testis
unknown – associates with atherosclerosis
HSPA12B 75.7 endothelia, ubiquitous
unknown – associates with atherosclerosis
HSPA13 51.9 unknown microsomes – – HSPA14 54.8 unknown unknown – – HSP40 family DNAJA1 44.9 ubiquitous cytosol promiscuous – DNAJA2 45.7 brain, heart,
kidney, liver cytosol promiscuous –
DNAJA3 52.5 fetus, mammary gland, B cell
mitochondria – protects against dilated cardiomyopathy
DNAJA4 44.7 brain membranes promiscuous – DNAJB1 38.2 ubiquitous cytosol promiscuous protects against
various neuronal misfolding diseases
DNAJB2 35.6/30.6 heart, muscle, brain
cytosol/ER – –
DNAJB3 26.7 testis unknown – – DNAJB4 37.8 ubiquitous unknown G protein β
subunit

17
DNAJB5 39.1/26.9 brain, heart, liver, pancreas, skeletal muscle, spleen
unknown – –
DNAJB6 36.1 ubiquitous cytosol/nucleus keratin-18 – DNAJB7 35.4 ubiquitous unknown – –
DNAJB8 25.7 testis unknown – – DNAJB9 25.5 ubiquitous ER – –
DNAJB10 30.6/28.6 unknown unknown – – DNAJB11 40.5 ubiquitous ER APOBEC1 DNAJB12 41.9 blood plasma unknown – – DNAJB13 36.1 fetus,
spermatozoa, testis
unknown – –
DNAJB14 42.5/33.5 unknown unknown – –
1.5. TRANSCRIPTIONAL REGULATION OF HSP RESPONSE
When summarising the regulation of Hsp response it is usual to follow a bottom-up
style. The Hsps consist the main well-characterized group of the effector molecules, as
summarised above. As we approach the earlier events, our knowledge becomes weaker
– the interconnecting steps are often missing.
In eukaryotes the Hsp response is regulated mainly at the level of transcription by
heat shock factors (HSFs). HSF1 is a master regulator of the heat shock genes in
mammalian cells (Björk and Sistonen, 2010) and by far the best-characterized member
of the HSF family. Hsf1-knockout mouse and cell models have revealed that HSF1 is a
prerequisite for the transactivation of hsp genes, maintenance of cellular integrity during
stress and development of thermotolerance (Akerfelt et al., 2010).
HSF1 is constitutively expressed in most tissues and cell types. Its activation cycle
is depicted in Figure 1.4. In its resting state, the DNA-binding activity and
transactivating capacity of HSF1 are subject to negative regulation, i.e., the majority of
HSF1 exists diffusely distributed in the nucleus or cytosol in an inert monomeric form
through intra- and intermolecular interactions, including interactions with Hsps (Figure
1.4). In response to stress, HSF1 is rapidly converted into a transcriptionally active form
involving nuclear accumulation, a monomer-to-trimer transition, extensive post-
translational modifications (phosphorylation, sumoylation, acetylation) and DNA-
binding through a regulatory upstream promoter element, called the heat shock element
(HSE) (Anckar and Sistonen, 2011). Sumoylation (small ubiquitin-like modification)

18
occurs rapidly without affecting the DNA-binding capacity, but it is diminished upon
more severe profound and sustained stress. The stress-inducible hyperphosphorylation
of the key serines within the regulatory domain could function as a trigger, relieving the
inhibition of the transactivation domain to enable activation of the target genes.
Figure 1.4. Functional domains and acetylation cycle of HSF1 (see Björk and Sistonen,
2010). (A) Schematic presentation of HSF1 with its functional domains. Some of the sites
subjected to stress-induced posttranslational modifications are marked with flags. (B) The
activation cycle of HSF1. A, acetylation; AD, transactivation domain; C, cysteine
residues subjected to disulfide bond formation; DBD, DNA-binding domain; HR-A/B and
HR-C, hydrophobic heptad repeats; P, phosphorylation; RD, regulatory domain; S,
sumoylation.
Despite numerous studies conducted in different laboratories, the impact of
multisite phosphorylation on HSF1 functions has remained elusive (Björk and Sistonen,
2010). Only a small number of the phosphorylation sites of human HSF1 identified to
date (Ser121, Ser230, Ser292, Ser303, Ser307, Ser314, Ser319, Ser320, Ser326, Ser344, Ser363,
Ser419 and Ser444) appears to play a role in activation of the factor during a stress (Ser230,
Ser326) or inactivation subsequent to a stress (Ser303, Ser307, Ser363) (Voellmy and
Boellmann, 2007). Moreover, certain sites are constitutively phosphorylated whereas
others are stress-inducible (Holmberg et al., 2001). During the attenuation phase the

19
transactivation capacity of HSF1 is repressed through a negative-feedback loop via
binding to Hsps. The DNA-binding activity of HSF1 is inhibited by acetylation of
several lysines within the DNA-binding domain (Akerfelt et al., 2010). The attenuation
phase is regulated by the deacetylase sirtuin 1 (SIRT1).
The induction of HSF by diverse stressors and the wide variety of
posttranslational modifications suggests that HSF may be a convergence point for
several signalling pathways thus functioning as a stress integrator. Indeed, the stress-
activated signal transduction pathways, (see below) leave their signatures on the HSF
protein. A number of protein kinases are activated by heat shock and can profoundly
influence the Hsp response in positive or negative ways (Figure 1.5) (Calderwood et al.,
2010).
Figure 1.5. Signalling kinase cascades activated by HS and their downstream (serine)
targets (based on Calderwood et al., 2010) on HSF1. p38MK, p38 mitogen-activated
protein kinase; CaMKII, calcium/calmodulin-dependent protein kinase II; PI3K,
phosphoinositide 3-kinase; ERK, extracellular signal-regulated kinase; PKA, protein
kinase A; PKC, protein kinase C; JNK, c-jun N-terminal kinase; MK2, MAPK-activated
protein kinase 2; Akt, protein kinase B; GSK3, glycogen synthase kinase-3; HSF1, heat
shock factor 1.
These HS-activated signal transducing kinases comprise the three mitogen-
activated protein kinase (MAPK) pathways, namely the extracellular signal-regulated

20
kinase (ERK), c-jun N-terminal kinase (JNK) and p38. Protein kinase B (PKB/Akt) is
another important kinase rapidly stimulated by HS. The early induction of the pathways
leading to MAPK and PKB induction can either serve to trigger adaptive responses or
be used to signal cell death (Nadeau and Landry, 2007).
It was demonstrated in NIH 3T3 fibroblasts that early upstream signalling events
in response to HS may involve activation of phosphoinositide 3-kinase (PI3K), tyrosine
kinases and growth factor receptors such as epidermal growth factor receptor (EGFR).
Activation of important downstream pathways occur by divergent signalling
mechanisms similar to growth factor stimulation (Lin et al., 1997). Interestingly, the
activation of EGFR by HS is ligand-independent. This mode of induction resembles the
activation of the ERK pathway by UV light, hyperosmolarity and hydrogen peroxide
(H2O2), which all hijack growth factor receptors from their normal physiological
function to initiate stress signals (Nadeau and Landry, 2007) and refs therein).
Calcium/calmodulin-dependent protein kinase II (CaMKII) signalling is involved in the
positive regulation of HSF1-mediated transactivation (Holmberg et al., 2001). It has
been reported that activation of protein kinase C (PKC) induced Hsps (Kiang and
Tsokos, 1998). Furthermore, intracellular protein kinase A (PKA) levels and
phosphorylation of HSF1 at Ser320 were both required for HSF1 to be localized to the
nucleus, bind to response elements in the promoter of an HSF1 target gene (hsp70.1)
and activate hsp70.1 after stress (Murshid et al., 2010). Taken together, several kinases
are activated in response to HS and all of them are participate in direct regulation of
HSF1 or in other apoptotic or antiapoptotic pathways.
1.6. STRESS SENSING
Heat (and other stresses) is rapidly sensed by physico-chemical perturbations of various
biomolecules in the plasma membrane (PM), cytosol and subcellular organelles of cells,
which provoke particular signals for the Hsp response. However, no consensus has been
reached as to the actual stress sensors. The possible sensors of (heat) stress are
summarised in Figure 1.6 (Vigh et al., 2007a).

21
Figure 1.6. Sensors of the HSR in mammalian cells. Four examples are indicated: protein
denaturation, membrane fluidity or microdomain organization, RNA structure and redox
control (see Vigh et al., 2007a).
Although HSF1 can be activated by diverse stimuli, according to the denatured
protein sensor hypothesis (Figure 1.7), a common denominator might be misfolded or
aggregated proteins disturbing protein homeostasis (Morimoto, 1998). The suggestion
that denaturation of intracellular proteins may be produced by metabolic stresses to
induce the activation of the hsp genes was examined by co-injection of purified proteins
and hsp genes into frog oocytes. Activation of hsp genes was observed if the proteins
were denatured prior to injection but not if they were introduced in their native form
(Ananthan et al., 1986).
As a defence mechanism, HSFs induce the synthesis of Hsps that act as molecular
chaperones through binding to the hydrophobic surfaces of unfolded proteins, thereby
facilitating refolding of peptides and preventing protein aggregation (Björk and
Sistonen, 2010; Morimoto, 1998). The discovery of an interaction between HSF1 and
Hsps, such as Hsp70/Hsp40 and Hsp90, led to the hypothesis of a negative-feedback
loop, where excess Hsps under non-stress conditions keep HSF1 inactive (Morimoto,
1998). Upon exposure to stress, the Hsps are sequestered to denatured proteins and
HSF1 is released from the chaperone complexes to induce transcription of the genes
encoding additional Hsps. Once the pools of Hsps are saturated, they can again bind
HSF1 and inhibit its function (Figure 1.7).

22
Figure 1.7. Regulation of the HSR sensed by unfolded proteins (see Morimoto, 1998).
The concept of an RNA thermometer is not new – a few bacterial examples have
been described previously (Johansson et al., 2002; Morita et al., 1999). Recently it was
proposed that the translation elongation factor eEF1A and a novel non-coding RNA,
HSR1, act in tandem to activate HSF during HS in mammalian cells (Shamovsky et al.,
2006). Curiously, eEF1A is one of the most conserved and most abundant proteins in
eukaryotic cell, and HSR1 appears to be highly conserved as well. eEF1A has been
implicated in a variety of cellular processes in addition to its canonical role in mRNA
translation during protein synthesis. Notably, it is the key component regulating the
actin cytoskeleton architecture in the cell. The authors assigned a new function to
eEF1A as a co-activator of HSF1 and suggest that this ubiquitous protein has a
multifaceted role in the response to HS. HS leads to two major physiological
perturbations in the cell − translational shutdown and cytoskeleton collapse. These
events might cause the release of eEF1A, which then becomes available for interaction
with HSR1 and HSF1 to initiate the Hsp response (Figure 1.8) (Shamovsky and Nudler,
2008; Shamovsky et al., 2006).

23
Figure 1.8. An integrated model of HSR activation in mammalian cells implying RNA as
stress sensor (see Shamovsky et al., 2006).
Mammalian HSF1 was shown to directly sense heat and oxidative stress in vitro to
assemble into a homotrimer in a reversible and redox-regulated manner that requires
cysteine residues at two positions within or adjacent to the DNA-binding domain.
Cysteine residues (C35 and C105) required for HSF1 redox regulation are essential for
stress activation of HSF1 multimerization, DNA-binding, nuclear accumulation, hsp
target gene activation, and the protection of mammalian cells from stress-induced
apoptosis. Furthermore, mutation of the cysteine residues rendered HSF1 refractory to
stress (Ahn and Thiele, 2003).
Several essential cellular activities depend on proper membrane function. Thus,
membrane lipid composition and membrane lipid dynamics have received significant
attention for over a decade (Vigh et al., 1998). It is well known that, following a
temperature change, cells compensate for stress-induced cellular disturbances through
physiological and biochemical mechanisms of homeoviscous adaptation adjusting its
membrane lipid composition to maintain fluidity. Here and throughout the thesis I use
the term fluidity, nevertheless, the fluidity of cell membranes is an imprecise concept
which is generally considered in terms of the relative motion of constituents of the
membrane. The property is attributed solely to the lipid constituents but membrane
fluidity as assessed by a variety of physical techniques is known to be markedly affected
by membrane proteins (Quinn, 1981). The structural order of the membrane lipids is
related to the degree of molecular packing and this suggest its inverse relationship to the
lateral diffusion of membrane lipids and proteins (Van Blitterswijk et al., 1981).
Microviscosity should be regarded as an operational term which was introduced for the

24
application of classical hydrodynamic expression of microscopic fluid regions
(Shinitzky and Barenholz, 1978). Microviscosity is the measure of frictional resistance
to rotational and translational motions of molecules and often considered as the
reciprocal to fluidity (Demchenko et al., 2009). However, others (Heyn, 1979; Van
Blitterswijk et al., 1981) argued against this notion, mentioning that “lipid fluidity” may
be defined as the reciprocal of the lipid structural order parameter rather than of the
microviscosity (Van Blitterswijk et al., 1981).
The natural modulators of lipid fluidity can be divided into chemical modulators
and physical effectors. The main modulators are the cholesterol (Chol) level, the degree
of unsaturation of the phospholipid (PL) acyl chains, the level of sphingomyelin (SM),
and the level of membrane proteins. The stationary levels of these modulators in a
biological membrane can change in response to a regulatory signal or stress. The
physical effectors of lipid fluidity are temperature, pressure, pH, membrane potential
and Ca2+, and their effect is practically instantaneous (Shinitzky, 1984).
To my knowledge, in 1992 Dietz and Somero (by studying two extremely
eurythermal goby fishes) provided the first example of seasonal changes in the
temperature at which enhanced synthesis of a specific type of Hsps was induced (Dietz
and Somero, 1992). Therefore, it turned into a useful tool to alter the fluidity of cell
membranes by temperature acclimation or by addition of a fluidizer (e.g. alcohols) and
test the membrane physical state-dependent variation in HSR threshold temperatures in
different organisms (in details see later). The early findings using the above-mentioned
approaches led to the formulation of a hypothesis in 1998 by Vigh, Maresca and
Harwood that membranes can sense environmental changes and, as a consequence of
changes in their phase state and microdomain organisation, transmit HS signals that
activate hsp transcription (Vigh et al., 1998).
To better understand the details of the membrane sensor hypothesis I feel it
important to give first an overview on membrane/membrane lipid structure and
organizations.
1.6.1. Membranes and membrane lipids
Membranes provide the structural framework that divides cells from their environment
and that, in eukaryotic cells, permits compartmentation (Vigh et al., 1998). This
compartmentalization enables segregation of specific chemical reactions for the

25
purposes of increased biochemical efficiency and restricted dissemination of reaction
products.
The unique property of lipids, particularly in an aqueous environment, is self-
aggregation, i.e. biological lipids generally form aggregates of various sorts, mostly
extended sheet-like structures, known as bilayers. The bilayer, the structural basis of the
cell membrane, is formed by ‘amphipathic’ lipid molecules, i.e. molecules that possess
both a hydrophilic portion in contact with the water, and a lipophilic portion which
remains isolated from the aqueous medium. Biological membranes are thus water-
immiscible structures consisting of a microenvironment composed of lipids and proteins
which allow a considerable degree of freedom to diffuse, both rotationally and laterally,
in the plane of the membrane (van Meer et al., 2008).
The Singer–Nicolson fluid mosaic model, which is near its 40th anniversary, with
some restrictions is still valid. The fluid mosaic structure is formally analogous to a
two-dimensional oriented solution of integral proteins (or lipoproteins) in the viscous
phospholipid bilayer solvent (Singer and Nicolson, 1972) and predicts lateral and
rotational freedom and random distribution of molecular components in the membrane.
Now it is known, however, that this freedom of protein (and lipid) mobility is far from
being unrestricted (Vereb et al., 2003), i.e., most membrane proteins do not enjoy the
continuous unrestricted lateral diffusion characteristic of a random, two-dimensional
fluid. Instead, proteins diffuse in a more complicated way that indicates considerable
lateral heterogeneity in membrane structure, at least on a nanometer scale (Jacobson et
al., 1995).
Progress in biophysics, chemistry and genetics has attracted renewed attention to
the biological roles of the great variety of membrane lipids. In addition to the barrier
function, lipids provide membranes with the potential for budding, tubulation, fission
and fusion, characteristics that are essential for cell division, biological reproduction
and intracellular membrane trafficking. The membrane and its constituent lipids are also
indispensable participants in many events of signal transduction and enzyme activity.
1.6.1.1. Lipid structure and diversity
Lipids are small molecules of enormous chemical diversity, and currently there is an
increasing awareness across many disciplines of the critical importance of lipids in all
aspects of life (Wenk, 2010). Unlike other major biomolecules, they are not genetically
encoded. Instead, they are the result of anabolic and catabolic reactions that are under
complex dietary and physiological control. It is thus difficult to define, name, and

26
categorize lipids in a coherent and comprehensive fashion (Christie and Han, 2010;
Fahy et al., 2005; Fahy et al., 2009). The graphical overview in Figure 1.9 focuses,
according to the subject of this thesis, on the main mammalian lipids including the most
important structural, mediator and storage molecules, and is based on the three main
backbone structures (squalene, glycerol and sphingoid base).
Figure 1.9. Main classes of mammalian lipids.
Several reaction steps on the squalene backbone lead to one of the most unique
mammalian lipids, cholesterol (Chol). Chol itself has a dominant part in modulating
membrane fluidity, it is a major component of specific membrane subdomains (rafts),
but also its derivatives play important roles in signalling such as the glucose-derivative
cholesterol glucoside, or in energy storing such as the fatty acid (FA)-derivative
subclass cholesteryl ester (CE).

27
The other two backbones, the trifunctional alcohol glycerol and the long-chain
amino diol sphingoid base bear similarities (both real and apparent) in many respects.
The OH groups of glycerol, attached to carbons C-1 and C-2, can be stepwise
substituted to get first the intermediate signalling lipids mono- (MG) and
diradylglycerols (DG) (see below for explanation of "radyl"). DGs play a central role in
glycerolipid (GL) metabolism (see later), and this is exactly the case for ceramide (Cer)
which functions as a hub for sphingolipid (SL) metabolism and can be obtained from
the corresponding sphingoid base by addition of a FA to the amino group attached to the
C-2 carbon.
Upon substitution, the C-2 carbon in glycerol becomes chiral (i.e., possesses 4
different subsituents), and in complex mixtures the designation of the resulting
enantiomers become difficult. To avoid such problems the "stereospecific numbering"
(sn) system was recommended by a IUPAC-IUB commission, in which the prefix sn is
placed before the stem name of the GL if its stereochemistry is known. In the SL
category stereochemistry should be specified only in cases when it differs from the
2S,3R configuration of the natural core base (see later).
By further substitution of the OH group on the sn-3 carbon in DG, and on the C-1
carbon in Cers, the main structural and storage lipids can be formed. Triradylglycerols
(TG), major constituents of the cell's storage compartments (i.e., lipid droplets), can be
formed with an additional radyl group from DGs.
In case of GLs, the addition of different phosphate-containing headgroups to the
sn-3 OH results in the formation of the most widely studied glycerophospholipids
(GPLs) in mammals. Figure 1.10 represents the sources of structural diversity of this
lipid class originating from differences in headgroup moieties, different O-radyl linkage
types and variability of the hydrocarbon chain R in the hydrophobic tail.
The simplest GPL is phosphatidic acid (PA), where the headgroup is the
phosphate itself. The other derivatives can be derived by esterification of the phosphate
of PA with an alcohol-type agent, such as ethanolamine in phosphatidylethanolamine
(PE), serine in phosphatidylserine (PS), glycerol in phosphatidylglycerol (PG), choline
in phosphatidylcholine (PC), and inositol in phosphatidylinositol (PI). The size (relative
to the hydrophobic tail) and polarity/charge of these hydrophilic headgroup moieties
largely determines the shape and electronic properties of the resulting lipids, and the
differences that arise lead to diverse discrete additional functions beyond the common
structural role. For example, PC with the zwitterionic phosphocholine headgroup has a
cylindrical shape and is, therefore, a typical bilayer-forming lipid, while PE, according

28
to its smaller headgroup, has a conical shape, which creates a stress in the bilayer and
this non-bilayer-forming property is believed important for membrane curvature. The
influence of lipid shapes in determining this arrangement in membranes has been
described well by Israelachvili (1978).
Figure 1.10. Sources of glycerophospholipid variability.
A further variation possibility originates from the linkage type of the radyl groups
to the oxygen atoms of the glycerol hydroxyls. The general term “radyl” is used to
denote either acyl, alkyl, or 1Z-alkenyl substituents corresponding to an ester, an ether,
or a vinyl ether linkage, respectively, allowing for coverage of diacyl, alkyl-acyl
(plasmanyl) and 1Z-alkenyl-acyl (plasmenyl, plasmalogen) glycerols. Among these, the
most abundant linkage type is the ester, when the glycerol hydroxyl(s) in sn-1 and/or sn-
2 position are esterified by fatty acids. In ether-type lipids the alkyl or alkenyl
substituent is found generally in sn-1 position (with an acyl substituent in sn-2).
Although occurring in lesser amount, these compounds play important roles as signal
lipids, such as the ether lipid platelet-activating factor, whereas plasmalogens may serve
as a store of polyunsaturated fatty acids (PUFAs) or as antioxidants due to the presence
of the vinyl ether double bond (Brites et al., 2004).
The diversity of GPLs can be still largely expanded by varying the hydrocarbon
chain R in case of the ester linkage type, i.e. in the esterifying FA, as detailed in Figure

29
1.10. In most naturally occurring unsaturated fatty acids the double bonds are in the cis
configuration, while a trans double bond is typically a result of human processing (e.g.,
hydrogenation). As an example, 1-hexadecanoyl-2-arachidonoyl-sn-glycero-3-
phosphocholine is shown, which can be designated by the "Headgroup(sn-1/sn-2)”
format, where the structures of the side chains (chain length of the FA and, after the
colon, the number of double bonds) are indicated within parentheses, i.e. PC(16:0/20:4).
Additionally, presence of an alkyl ether linkage can be represented by an “O-”
identifier, as in PC(O-16:0/18:1), whereas “P-” denotes a 1Z-alkenyl ether linkage, as in
PE(P-16:0/18:1).
The substitution of different Cers on the C-1 carbon produces the corresponding
phosphosphingo- (PSLs) and glycosphingolipids (GSLs). Figure 1.11 represents the
sources of structural diversity of these complex SLs originating from differences in the
sphingoid base (Pruett et al., 2008) and the amide-linked FAs, and also from variability
in headgroup moieties (both for phosphate- and sugar-containing ones).
The commonest sphingoid base in animal tissues is sphingosine (Sph),
(2S,3R,4E)-2-amino-4-octadecen-1,3-diol or 4E-sphingenine, with a C18 aliphatic
chain, hydroxyl groups in positions 1 and 3 and an amino group in position 2;
importantly, the double bond in position 4 has the trans (E) configuration. It is usually
accompanied by the saturated analogue, dihydrosphingosine (DHSph) or sphinganine.
Among PSLs by far the most abundant is SM, a structural analogue of the
glycerophospholipid PC, containing a phosphocholine head. It is a stable and
chemically resistant building block of the outer leaflet of the plasma membrane.
Nevertheless, the similarity between PC and SM is superficial, and there are great
differences in the hydrogen bonding capacities and physical properties of the two lipids.
SM has an amide bond at position 2 and a hydroxyl on position 3 of the sphingoid base
that can both participate in hydrogen bonding. The trans double bond also appears to
assist intermolecular interactions in membranes resulting in tight packing capability. On
the contrary, in acyl-containing PCs, the two ester carbonyl groups can only act as
hydrogen acceptors. The degree of unsaturation in the hydrophobic tails in each lipid is
very different, and this gives them significantly different packing properties in
membranes. SM and Chol have a high affinity for each other and are usually located
together in microdomains of membranes. As an example, N-(octadecanoyl)-sphing-4-
enine-1-phosphocholine is shown, which can be designated by the shorthand
SM(d18:1/18:0). In the parentheses first the number of hydroxyl groups (e.g., “d” for
the two hydroxyls of Sph and DHSph), the number of carbon atoms, and after the colon

30
the number of double bonds of the sphingoid base are indicated followed by the N-acyl
chain composition (FA chain length and saturation).
Figure 1.11. Sources of sphingolipid variability.
Glycosphingolipids (GSLs) are composed of the two-tail Cer backbone with a
wide variety of carbohydrate headgroups. Based on the extreme variability of headgroup
structure (quality and substitution of sugars, number and linkage of sugar building
blocks), four principal classes can be distinguished: monoglycosylceramides (mostly
glucosylceramide (GluCer) and galactosylceramide (GalCer)), non-acidic
oligoglycosylceramides, and two classes of acidic GSLs, gangliosides which contain the
characteristic N-acetylneuraminic acid (sialic acid, NeuAc) residues, and
sulfogalactoceramides (sulfatides). Acidic GSLs are considered as 'un-lipid-like' lipids,
because they are rather water-soluble. In the conventional lipid extraction methods they
partition predominately into the aqueous layer rather than with the "classical" lipids in
the organic (chloroform) layer. GSLs can be found exclusively in the outer plasma

31
membrane leaflet, and all of them are important as membrane microdomain
substituents. The very large surface area occupied by the oligosaccharide chain, (e.g., in
gangliosides) imparts a strong positive curvature to the membrane. In addition, they
may have other vital biological functions, for example as cellular messengers or as part
of the immune system. As an example, a GM1 ganglioside, Galβ1-3GalNAcβ1-
4(NeuAcα2-3)Galβ1-4Glcβ-Cer(d18:1/18:0) is shown.
There are also (partly) deacylated counterparts of more complex lipids which
contain a hydrogen instead of a corresponding radyl or acyl group. The so-called
lysolipids can be specified with a letter “L” in the abbreviation, for example,
lysophosphatidylcholine as LPC. Lysolipids are minor lipid components compared to
the major membrane lipids. They are produced during the metabolism of higher order
molecules. However, they are not simple metabolic intermediates, but exhibit biological
properties resembling those of extracellular growth factors or signalling molecules. The
most biologically significant lysolipids are sphingosine-1-phosphate (S1P),
lysophosphatidic acid (LPA), LPC, and sphingosyl phosphorylcholine (SPC).
The above-shown staggering structural diversity of lipids is accompanied by
diversity in polarity covering the whole palette from the hydrocarbon-soluble TGs to the
water-soluble gangliosides. Above all, also the range which should be covered during an
analysis of the individual elements of a complex mixture – ranging from the bulk
structural lipids to minor signalling components – reaches (or even exceeds) 5–6 orders
of magnitude difference in concentration. This multi-level diversity could only be
studied during the past decade when technological developments, especially in mass
spectrometry and bioinformatics, have revealed that living cells contain (ten)thousands
rather than dozens of different lipids (van Meer and de Kroon, 2011). Cellular
lipidomics must, however, not only determine which lipids are present but also the
concentration of each lipid at each specific intracellular location in time; it must include
the enzymes of lipid metabolism and transport, their specificity, localization and
regulation; and it requires a thorough understanding of the physical properties of lipids
and membranes, especially lipid–lipid and lipid–protein interactions. In the context of a
cell, the complex relationships between and within the different layers of determinants
(genome, transcriptome, proteome and metabolome) can only be understood by viewing
them as an integrated system by means of systems biology, i.e., lipidomics (as a part of
metabolomics) should also be integrated into the "omics" trends. The first studies
combining genomics and lipidomics have just been published. Given the central role of
lipids as key metabolites with remarkably diverse biological roles, the field of

32
lipidomics may follow a steeply ascending trajectory comparable to the developments
seen in genomics and proteomics over the past decade (Wenk, 2010).
The biosynthetic pathways of lipids are very complex with several additional
intermediate molecules and junctions, and work in concert with catabolic events. The
reactions build up a highly complex network in which the synthesis of a given
compound means, at least in part, the degradation of another one. Moreover, often the
reactions are reversible, and also the production and catabolism of a certain molecule is
multi-directional. The same lipid class can be synthesised in different compartments in
different ways (e.g., PE in ER vs. mitochondria) or even in the same organelle in several
ways (e.g., PC by the PE N-methyltransferase vs. cytidine diphosphate-choline
pathways in ER). Many times the enzymes that catalyse the formation or degradation of
lipids possess high product selectivity (e.g., chain length selectivity of Cer synthases) or
substrate selectivity/specificity (e.g. headgroup- or FA chain-specificity of
phospholipases) leading to compositionally different pools of lipids (e.g. two DG pools
in the nucleus). In the following sections I give a brief overview of lipid biosynthesis.
1.6.1.2. Fatty acids – nomenclature, families and metabolism
In addition to acting as constituents of higher-order glycero- (GLs) and sphingolipids
(SLs) and cholesteryl esters (CEs), free (non-esterified) fatty acids (FFAs) (and their
derivatives) are themselves individual lipids with several vital metabolic and signalling
functions. FAs play essential roles in the biosynthesis of more complex lipids. In their
CoA-activated form they participate as "co-substrates" in several anabolic steps, and
very importantly, they are "by-products" in numerous catabolic reactions catalysed by a
wide range of hydrolytic enzymes (e.g., phospholipases, sphingomyelinases) – see
below. The diversity of FAs (as acyl chains in complex lipids) was summarised in
Figure 1.10 (section 1.6.1.1). In assigning the position of an individual double bond I
follow the "n-" nomenclature, in which the position of the first double bond from the
methyl end is described. This "reversed" convention is particularly useful is designating
groups of FAs derived from the same parent compound as metabolic reactions do not
occur on the methyl end of an existing double bond. If not specified otherwise, the
double bond configuration is always cis and the double bonds are methylene interrupted
(Cook and McMaster, 2004).
FA biosynthesis is a stepwise assembly using acetyl-CoA (but units mostly as
malonyl-CoA, derived from glycolysis/lipolysis) by a fatty acid synthase (FAS)
complex in the cytoplasm (Figure 1.12). The usual FA produced by FAS is palmitate

33
(hexadecanoic acid, 16:0), an abundant saturated FA (SFA). When the C16 stage is
reached, palmitic acid can be released from the enzyme and can then undergo separate
elongation and/or desaturation steps to yield other FA molecules although FAS in most
organisms can form stearic acid (18:0) as well. Elongation and desaturation occur
predominantly in the ER, but also in the mitochondria, from both endogenously
synthesized and dietary FAs. Elongation involves condensation of acyl-CoA groups
with malonyl-CoA yielding the corresponding two carbons longer FA, e.g., stearate
(18:0) from palmitate. There are three main FA desaturase enzymes in mammals
designated as 9, 6 and 5 FA-CoA desaturases according to the position, counted
from the carboxyl end, where they insert the double bond. The first double bond
introduced into a SFA is generally in the 9 position, thus yielding monounsaturated
FAs (MUFAs). Oleate (18:1 n-9) and palmitoleate (16:1 n-7) represent the majority of
MUFAs present in membrane PLs, TGs, and CEs. The ratio of SFA to MUFA in
membrane PLs is critical to normal cellular function and alterations in this ratio have
been correlated with several pathological/disease states, such as diabetes, obesity,
cardiovascular disease and cancer.
Since the mammalian desaturases cannot introduce sites of unsaturation beyond
C-9, they cannot synthesize either 18:2 n-6 (linoleic) or 18:3 n-3 (α-linolenic acids).
These polyunsaturated FAs (PUFAs) must be acquired from the diet and are needed for
good health. They are, therefore, referred to as essential FAs (see Gurr et al., 2002).
Linoleic acid is important in that it is required for the synthesis of arachidonic
acid (AA), 20:4 n-6, an abundant PUFA in most animal tissues. When cells are
stimulated by a variety of external stimuli, arachidonic acid is released from cell
membranes through the action of phospholipases (see later). The released arachidonic
acid then serves as the precursor for the synthesis of the biologically active eicosanoids
(prostaglandins, thromboxanes and leukotrienes) which function in diverse biological
phenomena such as inflammation, immunity, or as second messengers in the central
nervous system.
Once taken up, the essential α-linolenic acid (18:3 n-3) is converted to 20:5 n-3
(eicosapentaenoic acid, EPA) and then to 22:6 n-3 (docosahexaenoic acid, DHA) which
serve as important precursors for the potent anti-inflammatory lipids called resolvins
and protectins. EPA also gives rises to non- (or poorly) inflammatory eicosanoids. They
have also been shown to be important for normal brain development and function.
In the n-9 series a 20-carbon long PUFA is worth a mention, 20:3 n-9, the so-
called Mead acid. Animals can make it de novo from oleic acid; its elevated presence is

34
an indication of essential FA deficiency and attention should be paid to its amount in
controlling cell culture conditions.
FAs in the form of acyl-CoA molecules are broken down by the process of β-
oxidation in mitochondria and/or in peroxisomes to generate acetyl-CoA, the entry
molecule for the citric acid cycle. β-oxidation and FA synthesis share essentially
reversal chemistry with a few (but not discussed here) key differences (see Gurr et al.,
2002).
Figure 1.12. Major pathways of FA synthesis in animal tissues. The predominant FA
families are shown with different colours: n-9, red; n-7, orange; n-6, blue; n-3, green. AA,
arachidonic acid; DHA, docosahexaenoic acid; ACC, acetyl-CoA carboxylase; FAS, fatty
acid synthase; 9, 6 and 5 denote the corresponding fatty acyl-CoA desaturases (based
on Cook and McMaster, 2004).
1.6.1.3. Sites of lipid synthesis
The main lipid biosynthetic organelle is the endoplasmic reticulum (ER), which
produces the bulk of the structural GPLs, Chol, and SLs to Cer (and GalCer) (Figure
1.13).

35
Figure 1.13. Sites of lipid synthesis and steady-state composition of cell membranes
(based on van Meer et al., 2008). The lipid compositional data (shown in graphs) are
expressed as a percentage of the total phospholipid (PL) in mammals (blue). As a
measure of sterol content, the molar ratio of cholesterol (Chol; in mammals) to PL is
included. The figure shows the site of synthesis of the major phospholipids (blue) and
lipids that are involved in signalling and organelle recognition pathways (red). PC,
phosphatidylcholine; PE, phosphatidylethanolamine; PI, phosphatidylinositol; PS,
phosphatidylserine; PA, phosphatidic acid; PG, phosphatidylglycerol; CL, cardiolipin;
BMP, bis(monoacylglycero)phosphate; Cer, ceramide, GalCer, galactosylceramide,
GluCer, glucosylceramide; Chol, cholesterol; TG, triradylglycerol; SM, sphingomyelin;
GSLs, complex glycosphingolipids; DG, diradylglycerol; PI(3,4)P2, phosphatidylinositol-
(3,4)-bisphosphate; PI(3,5)P2, phosphatidylinositol-(3,5)-bisphosphate; PI(4,5)P2,
phosphatidylinositol-(4,5)-bisphosphate; PI(3,4,5)P3, phosphatidylinositol-(3,4,5)-
trisphosphate; PI4P, phosphatidylinositol-4-phosphate; S1P, sphingosine-1-phosphate;
Sph, sphingosine; R, remaining lipids.
Both the ER and lipid droplets (LDs) participate in CE and TG synthesis. Significant
levels of lipid synthesis occur in the Golgi which specializes in higher-order SL
synthesis, such as SM, GluCer and complex GSLs. Mitochondria are also an active lipid
synthetic site, almost half of its PLs autonomously synthesized here. Moreover, PG and
cardiolipin (CL, diphosphatidylglycerol) are confined to that organelle, i.e. they are
mitochondrial marker lipids, whereas bis(monoacylglycero)phosphate (BMP) is a major

36
PL in the inner membranes of late endosomes and lysosomes. Phosphoinositides (PIPn),
different phosphate derivatives of PI, are specialized for different organelles (PM,
Golgi, early and late endosomes) and, to an extent, can be used as marker lipids for
these sites. Due to intensive and specific sorting events (van Meer et al., 2008), which,
however, cannot be discussed here, the lipid composition of different organellar
membranes varies significantly throughout the cell as shown in Figure 1.13.
1.6.1.4. Glycerolipid metabolism
GLs arise by several mechanisms, most sharing PA and DG as key intermediates
(Figure 1.14) (Snyder et al., 2004; Vance, 2004). Most of PA is generated through sn-
glycerol-3-phosphate (G3P) and acyl LPA (1-acyl-sn-glycerol-3P) via the
Kornberg/Pricer pathway with the successive additions of CoA-activated FA chains, but
acyl LPA can also be obtained from dihydroxyacetone phosphate (DHAP) via 1-acyl-
DHAP in peroxisomes. A portion of PA is synthesized from DG via the action of
diacylglycerol kinase (DGK) or it may originate upon the action of PLD from a GPL
(see below). The other GLs can be obtained from PA by two mechanisms. One utilizes
cytidine-diphosphate (CDP)-activated DG and the polar headgroups inositol and G3P to
yield PI and PG, respectively. From PI its position-specific phosphate derivatives (PIPn)
with important signalling properties can be produced, while PG is the precursor for CL
and BMP formation. In the other mechanism first DG is formed from PA by PA-
phosphatase (PAP) which is then converted to TG by DG acyltransferase (DGAT) (the
whole process from G3P to TG is the so-called Kennedy pathway). DG can be produced
in the reversed reaction by triacylglycerol lipase (TGL), and upon the action of PLC
from a GPL as well. In addition, DG can also be coupled with the corresponding CDP-
activated polar headgroups (CDP-choline and CDP-ethanolamine) to produce PC and
PE; from these PS is synthesised by an exchange reaction with L-serine. In addition, the
mitochondrial PS-decarboxylase produces half of the cellular PE from PS. A second
pathway for biosynthesis of PC involves sequential methylation of PE with mono- and
dimethyl-PE as intermediates and catalysed by the enzyme PE N-methyltransferase
(PEMT pathway). Importantly, a third route of PC synthesis occurs in the SL network
(Figure 1.16) during the degradation of SM to Cer by sphingomyelinase (SMase) when
PC is simultaneously formed from DG. It has been suggested that the ratios of PC/SM
and DG/Cer are intrinsically related, with possible implications for cross-talk between
glycerolipid and sphingolipid signalling.

37
Figure 1.14. Overview of glycerolipid metabolism (based on Gurr et al., 2002). Major
sites of synthesis are colour-coded: ER - green, peroxisome - blue, mitochondria - orange,
Golgi - purple. P, phosphate; X, headgroup moiety; CTP, cytidine triphosphate; DHAP,
dihydroxyaceton-phosphate; G3P, glycerol-3-phosphate; LPA, lysophosphatidic acid; PA,
phosphatidic acid; DG, diradylglycerol; CDP-, cytidine-diphosphate-; TG,
triradylglycerol; MG, monoradylglycerol; PG, phosphatidylglycerol; PI,
phosphatidylinositol; PIPn, phosphoinositide; BMP, bis(monoacylglycero)phosphate; CL,
cardiolipin; PC, phosphatidylcholine; PE, phosphatidylethanolamine; PMME,
phosphatidylmonomethylethanolamine; PDME, phosphatidyldimethylethanolamine; PS,
phosphatidylserine; Etn, ethanolamine; SM, sphingomyelin; Cer, ceramide. Enzymes:
DHAP-AT, dihydroxyaceton-phosphate acyltransferase; FA-CoA, fatty acyl coenzyme A;
GPAT, glycerolphosphate acyltransferase; PAP, phosphatidic acid phosphatase; DGK,
DG kinase; PEMT, PE N-methyltransferase; SMS, SM synthase; SMase;
sphingomyelinase, PLC, phospholipase C; PLD, phospholipase D, MGAT,
monoacylglycerol acyltransferase; DGAT, diacylglycerol acyltransferase; MGL,
monoacylglycerol lipase; DGL, diacylglycerol lipase; TGL, triacylglycerol lipase.
In case of the ether-type glycerols, the first two biosynthetic reaction steps are
carried out in the peroxisomes, where DHAP is converted to 1-alkyl-DHAP by
introducing the ether bond. The following reduction step is the fusion point between
ether and acyl lipid synthesis resulting in the formation of 1-alkyl-G3P (alkyl LPA). It is
then converted to the corresponding 1-alkyl-2-acyl-PE by the same enzyme system used
for diacyl GL synthesis. The final step involves the insertion of the vinyl ether bond to
form plasmalogen PE that, in turn, can be transformed to the plasmalogen PC analogue.

38
Breakdown of the fully or partially substituted GLs goes through several
intermediates which are generated in course of hydrolytic processes, such as cleavage of
radyl (acyl) groups, headgroups or headgroup moieties (Figures 1.14 and 1.15). The
enzymes that catalyse these reactions are called phospholipases. Although the
phospholipase denomination is specifically used for GPLs, analogous reactions take
place on the simple glycerolipids MG, DG and TG upon the release of the radyl (acyl)
substituents from the glycerol backbone. In this respect, as mentioned above, DG is the
hydrolysis product of TGL from TG. At the same time, DG is the precursor of MG
formation by DG lipase (DGL), which, in turn, can be further hydrolyzed by MG lipase
(MGL) to glycerol and a non-esterified (free) FA. This reaction is an important source
of AA production, while glycerol can be re-delivered into the GL biosynthetic cycle
(Figure 1.14).
According to the site of action four different families can be distinguished,
phospholipases A1, A2, C and D (Figure 1.15) (Wilton and Waite, 2004). In some
tissues, such as intestine, there is a phospholipase B that cleaves both fatty acid esters –
but this is exceptional.
Figure 1.15. Glycerophospholipid degradation and remodelling (as an example a diacyl
GPL is shown). PLA1, phospholipase A1; PLA2, phospholipase A1; PLC, phospholipase
C; PLD, phospholipase D; FFA, free fatty acid; GPL, glycerophospholipid; PA,
phosphatidic acid; DAG, diacylglycerol; P, phosphate; X, headgroup moiety; R1 and R2;
fatty acyl chains.

39
Phospholipase A2 (PLA2) cleaves the sn-2 ester bond of a diacyl GPL specifically,
generating a free fatty acid (FFA) and a 1-acyl lysophospholipid (lysoPL), while
phospholipase A1 (PLA1) is able to hydrolyse the sn-1 ester bond. The resulting lysoPLs
can be further hydrolysed by lysophospholipases or can be re-acylated by CoA-
dependent acyltransferases and CoA-dependent/independent transacylases (Yamashita
et al., 1997). Subsequent hydrolysis and re-acylation/transacylation of GPLs (often
referred to Lands' cycle) is an apparently extensive re-modelling process which post-
synthetically determines the FA compositions and positional distributions on the
glycerol moiety (Figure 1.15). The turnover of glycerolipid acyl chains functions not
only to form specific glycerolipid molecular species, but in part to repair membranes by
removing oxidized fatty acids.
The PLA2 superfamily includes 15 enzymes which comprise four main types
including the secreted sPLA2, cytosolic cPLA2, calcium independent iPLA2, and platelet
activating factor (PAF) acetyl hydrolase/oxidized lipid lipoprotein associated (Lp)PLA2
(Burke and Dennis, 2009). The groups are designated by a comprehensive Group
numbering system; assignment of the enzymes to a certain group is based on the
catalytic mechanism as well as functional and structural features. The most well-studied
is the cytosolic GIVA PLA2. It requires Ca2+ for activity, and it is the only PLA2 with a
preference for arachidonic acid (AA) in the sn-2 position of phospholipids. This enzyme
has been proposed to play a major role in inflammatory diseases. The iPLA2s (Group
VI) have high molecular masses (about 85 kDa), do not require Ca2+ for activity and are
not selective for AA-containing phospholipids. PLA2s often possess lysophospholipase
and transacylase activity, too.
Phospholipase C (PLC) cleaves the phosphate-containing headgroup thus yielding
diacylglycerol (DAG), while PLD hydrolyzes the headgroup moiety and generates PA.
These phospholipases possess high headgroup specificity, i.e., the FA compositions of
the released products reflect the composition of the parent phospholipids. In particular,
DAGs derived from PIs (and PIPn) via PI-specific PLC are highly enriched in
molecular species containing stearic acid in position sn-1 and AA in position sn-2, the
most abundant FA chain combinations in PI. Nevertheless, in the cell nucleus it appears
that there are two distinct pools of DAGs with very different compositions produced
from PIPn (polyunsaturated) via the action of a PI-specific PLC and from PC (saturated
and monoenoic) via the action of a PC-specific PLC by specific stimuli, and these may
have different functions (Carrasco and Mérida, 2007).

40
Phospholipase D (PLD) uses normally (albeit not exclusively) PC to generate the
lipid second messenger PA and choline. There are two mammalian isoforms: PLD1 and
PLD2. PLD has been implicated in a variety of physiological cellular functions, such as
intracellular protein trafficking, cytoskeletal dynamics, membrane remodelling and cell
proliferation in mammalian cells (Gomez-Cambronero, 2010).
1.6.1.5. Sphingolipid metabolism
In the SL metabolic network Cer (and dihydroceramide (DHCer) to a lesser degree) can
be considered to be a metabolic hub because it occupies a central position in SL
biosynthesis and catabolism as depicted in Figure 1.16 (Hannun and Obeid, 2008).
Briefly, mammalian SLs are predominantly synthesized de novo from serine and
palmitate by serine palmitoyltransferase (SPT) yielding the saturated
dihydrosphingosine (DHSph), (2S,3R)-2-aminooctadecane-1,3-diol, one of the major
sphingoid bases (d18:0). In turn, it is acylated by highly specific (dihydro)-ceramide
synthases (also known as Lass or CerS). Cer is formed by the desaturation of DHCer. In
SL biosynthetic pathways, Cer (and DHCer) can be phosphorylated by ceramide kinase
(CK), glycosylated by glucosyl or galactosyl ceramide synthases (GluCS or GalCS), or
can receive a phosphocholine headgroup from PC in the biosynthesis of SM through the
action of SM synthases (SMSs), which thereby also serve to generate DG from PC.
Breakdown of complex SLs proceeds through the action of specific hydrolases
(Merrill, 2008), leading to the formation of GluCer and GalCer. In turn, specific β-
glucosidases and galactosidases hydrolyse these lipids to regenerate ceramide. The
breakdown of SM is catalysed by sphingomyelinases (SMases) that are distinguished
according to their pH optima and subcellular localization and, to date, several have been
characterized: lysosomal acid sphingomyelinase (aSMase), zinc ion-dependent secretory
sphingomyelinase (sSMase), neutral magnesium ion-dependent SMase (nSMase), and
alkaline SMase (bSMase). These are all categorized as SMase C enzymes, i.e., cleave
the phosphodiester bond on the side of the linkage to Cer, so the products are Cer and
choline phosphate (in the presence of DG, PC is produced, see above). Ceramide may
be broken down by one of several ceramidases (CDases) leading to the formation of
sphingosine (Sph), which seems to have one of two fates (Hannun and Obeid, 2008).
Sph may be ‘salvaged’ or recycled into SL pathways, or it can be phosphorylated by one
of two Sph kinases (SKs). The product S1P can be dephosphorylated to regenerate Sph
through the action of specific intracellular S1P phosphatases (SPPases) and, possibly,
non-specific extracellular lipid phosphate phosphatases. Alternatively, S1P lyase can

41
irreversibly cleave S1P to generate ethanolamine phosphate (Etn-P) and hexadecenal
which, in turn, can be reduced to palmitate and subsequently reincorporated into lipid
metabolic pathways.
Figure 1.16. Sphingolipid metabolism and interconnection of bioactive SLs (based on
Hannun and Obeid, 2008). DHSph, dihydrosphingosine; DHCer, dihydroceramide;
DHSM, dihydrosphingomyelin; DHCer1P, dihydroceramide-1-phosphate;
Glu/GalDHCer, glucosyl/galactosyl dihydroceramide; Sph, sphingosine; Cer, ceramide;
SM, sphingomyelin; Cer1P, ceramide-1-phosphate; Glu/GalCer, glucosyl/galactosyl
ceramide; GSL, glycosphingolipid; S1P, shpingosine-1-phosphate; Etn-P, ethanolamine
phosphate; PC, phosphatidylcholine; DAG, diacylglycerol. Enzymes: SPT, serine
palmitoyl transferase; CerS, ceramide synthase; CDase, ceramidase; CK, ceramide
kinase; CPPase, ceramide-1-phosphate phosphatase; SK, sphingosine kinase; SPPase,
sphingosine-1-phosphate phosphatase; S1P lyase, sphingosine-1-phosphate lyase;
GluCase/GalCase, glucosyl/galactosyl ceramidase; GluCS/GalCS, glucosyl/galactosyl
ceramide synthase; SMase, sphingomyelinase; SMS, sphingomyelin synthase.
It should be emphasized that the phosphorylated vs. non-phosphorylated
intermediates in the SL network imply completely opposite biological roles, i.e. Cer and
Sph induce apoptosis and cell-cycle arrest, while Cer1P and S1P take part in cell
survival and proliferation. The significance of proper functioning of the SL network can
be well illustrated by the fact, that a whole set of disorders, collectively called as
sphingolipidoses (Harwood et al., 2007), can be connected practically to every step of
the catabolic flow starting from complex SLs towards Cer. Such sphingolipidoses

42
include Niemann-Pick (SMase disorder) and Gaucher disease (GCase disorder) and are
caused by the absence of specific catabolic enzymes, thus leading to accumulation of
their substrate.
1.6.1.6. Cholesterol metabolism
In animals, cells can obtain the Chol they require either from the diet via the circulating
low-density lipoproteins, or they can synthesise it themselves. Chol biosynthesis
involves a highly complex series of at least thirty different enzymatic reactions (Liscum,
2004), a subject that cannot be treated in detail here. Basically, Chol is built up from
acetyl-CoA transported from the mitochondria to the cytosol, where also the first
reaction steps are carried out generating mevalonic acid. All the subsequent reductive
reactions of Chol biosynthesis use membrane-bound ER-localized enzymes and
NADPH as a major cofactor. The isoprenoid intermediates, with squalene as a key
structure (shown in Figure 1.9), can be diverted to either sterol or non-sterol pathways.
CEs, i.e. with long-chain FAs linked to the hydroxyl group, are much less polar than
free Chol and represent a biologically inert form of Chol (and other derivatives, too) for
storage in LDs and transport in lipoproteins (Gurr et al., 2002). Chol is also a precursor
of signalling molecules, such as Chol glucoside, and of oxysterols, bile acids and steroid
hormones, all possessing versatile biological functions.
1.6.1.7. Membrane heterogeneity
As I have shown above, lipid concentrations and compositions may vary between
organelles, but importantly, it may be different between the two leaflets of the lipid
bilayer and even within the lateral plane of the membrane resulting in membrane
(leaflet) asymmetry and the existence of membrane microdomains (often referred as
rafts), respectively.
In 1971, Bretscher first hypothesized that the PLs of the human erythrocyte
membrane were arranged asymmetrically (Bretscher, 1971). A critical discussion of
these early data and the techniques used can be found in (Boon and Smith, 2002)).
PLs in the PM of eukaryotic cells are highly regulated so that cells are able to
maintain a non-random distribution of PLs across the PM. Thus, in general, the amino
phospholipids PS and PE are restricted to the cytoplasmic leaflet of the PM, whereas
PC, SM and GSLs are enriched in the exoplasmic leaflet (Pomorski and Menon, 2006).
A detailed table can be found in Boon and Smith (2002) containing several results with

43
references for lipid asymmetry in different cell types and species. The basis for this
transmembrane lipid asymmetry lies in the fact that GLs are primarily synthesized on
the cytosolic and SLs on the non-cytosolic surface of cellular membranes (van Meer,
2011). In addition, this asymmetric lipid arrangement is thought to come about as a
result of the action of energy-dependent flippases that use ATP hydrolysis to move
specific lipids against a concentration gradient (Pomorski and Menon, 2006) (Figure
1.17). In the PM of eukaryotic cells, flip-flop of PLs is constrained owing to the absence
of constitutive bi-directional flippases. Thus, ATP-dependent flippases can maintain an
asymmetric phospholipid distribution by moving specific lipids towards (P-type ATPase
family members) or away from the cytosolic leaflet (ABC transporters). Alternatively,
ABC transporters could flip the lipid molecule to present it for release to an acceptor
(A).
Cellular activation can collapse the lipid asymmetry by the transient activity of an
ATP-independent scramblase. As shown originally for activated platelets, many cell
membranes harbour a Ca2+-dependent mechanism that can rapidly move PLs back and
forth between the two membrane leaflets (lipid scrambling), leading to a loss of
membrane PL asymmetry. The loss of lipid asymmetry in the PM and the appearance of
the anionic PLs such as PE and, particularly, PS on the cell surface have been
implicated in numerous biological processes, including blood coagulation, myotube
formation, vesicle fusion, cell division, sperm capacitation, and phagocytic recognition
and clearance of apoptotic cell corpses (Fadeel and Xue, 2009 and refs therein). Various
scramblase candidates have been proposed but none has been validated (Bevers and
Williamson, 2010).
Figure 1.17. Lipid flippases in the PM of eukaryotic cells (see Pomorski and Menon,
2006). A, lipid acceptor.

44
Chol plays a unique role among the many lipids in mammalian cells. This is based
partly on its biophysical properties, which allow it to be inserted into or extracted from
membranes relatively easily. Additionally, it plays a special role in organizing the
biophysical properties of other lipids in a bilayer (Maxfield and van Meer, 2010). Chol
has been shown by many biophysical approaches to have a preferential interaction with
SM and, therefore, was supposed to be mostly localised in the outer leaflet of PM.
However, like the findings in erythrocytes (Schroeder et al., 1991), also in nucleated
cells (Mondal et al., 2009) all (indirect) evidence points to an enrichment of Chol in the
cytosolic leaflet of the PM (van Meer, 2011). This is counter-intuitive because the SLs
in the non-cytosolic leaflet should enrich the sterols there. In addition, at the typical PM
content of 40 mol % cholesterol (and with a Chol surface area half that of PC),
restriction of the Chol to one leaflet would yield a ratio Chol/PL in that leaflet of 2,
which is the limiting solubility of Chol in PC but (far) above that of PE-containing
membranes (van Meer, 2011). Even after nearly 40 years of intense research on the
transbilayer organization of lipids, there are still dramatic gaps in our knowledge (van
Meer, 2011). The understanding, e.g., how Chol is distributed could be essential for the
clarification of raft structure mentioned below.
The Singer–Nicholson model of membranes postulated a uniform lipid bilayer
randomly studded with floating proteins. However, it became clear almost immediately
that membranes were not uniform and that clusters of lipids in a more ordered state
existed within the generally disordered lipid milieu of the membrane. These clusters of
ordered lipids (with proteins) are now referred to as membrane rafts (Pike, 2009). Early
descriptions of membrane rafts noted their enrichment with Chol and GSLs and focused
on their ability to resist extraction by non-ionic detergents (Brown and Rose, 1992).
They are a heterogeneous collection of domains that differ in protein and lipid
composition as well as in temporal stability. A role for the protein components of rafts
in their organization has also become apparent (Pike, 2009). This new concept is
embodied in the consensus definition of a lipid raft developed at the 2006 Keystone
Symposium of Lipid Rafts and Cell Function: “Lipid rafts are small (10–200 nm),
heterogeneous, highly dynamic, sterol- and sphingolipid-enriched domains that
compartmentalize cellular processes. Small rafts can sometimes be stabilized to form
larger platforms through protein–protein and protein–lipid interactions.” (Pike, 2006).
The distinctive lipid composition of membrane rafts was discovered by lipidomic
analyses. Different types of rafts have been reported – some are enriched in Chol while
others are enriched in SLs. Chol levels in rafts are generally double those found in the

45
PMs from which they were derived. Likewise, SM levels are elevated by approximately
50 % compared with PMs. The elevated SM levels are offset by decreased levels of PC
so the total amount of choline-containing lipids is similar in rafts and the rest of the PM
(Pike et al., 2002; Pike, 2009). PS levels are elevated 2- to 3-fold in rafts as compared
with the bulk PMs. This suggests that rafts may be a source for the rapid externalization
of PS during apoptosis or platelet activation. Rafts are also enriched in ethanolamine
plasmalogens, particularly those containing AA (Pike et al., 2002; Pike et al., 2005).
Plasmalogens can function as antioxidants and the presence of these compounds in rafts
may serve to detoxify molecules that are internalized via lipid rafts or caveolae. It is
also possible that rafts serve as an enriched source of AA-containing PLs for hydrolysis
by PLA2 enzymes. As with proteomic studies of lipid rafts, lipidomic studies of these
domains have been done using rafts prepared by both detergent-free and detergent-
containing protocols. When direct comparisons of the various preparations have been
done, significant differences in lipid composition have been identified (Pike et al., 2005;
Pike, 2009).
Separation of artificial membranes into liquid-ordered (Lo) and liquid-disordered
(Ld) phases is regarded as a common model for lateral heterogeneity. The models have
focused on Lo phases that are formed between SM and Chol. This has stemmed from
studies characterising the motional constraints on the lipids in dispersions of the PL
with Chol and resistance of such phases to solubilisation by Triton X-100 at 4 °C.
However, examination of the presently available data on the lipid composition of
membrane rafts indicates that a Lo phase of SM and Chol represents less than 25 % of
the raft lipids (Quinn, 2010). Thus, in cell membranes, which are dynamic systems not
in thermodynamic equilibrium, the underlying propensity of the lipids to phase separate
is likely modulated by the presence of proteins and their state of aggregation as well as
the continuous trafficking of lipids to and from the PM (Pike, 2009). Moreover, a recent
study (Lingwood et al., 2008) suggested that Lo phases are not equivalent to stabilized
raft domains at physiological temperature. The selective inclusion of transmembrane
proteins suggests that this phase possesses a quality in addition to the lipid basis for Lo–
Ld phase separation seen in model membranes (Lingwood and Simons, 2010). Indeed,
the raft ganglioside GM1 phase in PM spheres exhibited considerably lower order than
that of the Lo domain of model membranes as measured by the membrane order-sensing
dye Laurdan. This is consistent with different partitioning of lipid and transmembrane
protein markers suggesting additional interactions between proteins and lipids (Kaiser et
al., 2009).

46
In order to cope with the above-mentioned controversies of raft formation, the
lipid matrix model of raft structure was proposed (Quinn, 2010) consisting of four main
types of membrane domains. These include (i) ordered structures in which membrane
proteins are the principle architects; (ii) fluid domains in which oligomeric protein
structures are packaged into the fluid bilayer matrix by lipids that typically form non-
bilayer structures; (iii) liquid-ordered domains formed by interaction of sterols with
polar membrane lipids (in mammalian membranes this is a stoichiometric complex
formed between symmetric molecular species of SLs and Chol in molar proportions
1.7:1); and (iv) quasi-crystalline domains that form between asymmetric SLs and PLs.
All these structures have their special role which cannot be discussed here.
In a very recent review, Simons and Sampaio also summarised their view on raft
structure and function (Simons and Sampaio, 2011). In living cells, raft assemblies can
be stabilized by specific oligomerization of raft proteins or lipids with little energy
input. The merger of specific nanoscale rafts into larger and more stable platforms
brings into function specific rafts in membrane trafficking both in biosynthetic and
endocytic pathways as well as in signal transduction and other raft-associated processes
as illustrated in Figure 1.18 (Simons and Sampaio, 2011).
Resting-state rafts are dynamic, nanoscopic assemblies of lipids and proteins that
persist for a certain period of time, i.e. they are metastable. Most raft proteins are either
solely lipid-anchored (glycosylphosphatidylinositol (GPI)-anchored) in the exoplasmic
(1) or doubly acylated in the cytoplasmic leaflet (2). They may contain acyl chains
besides their transmembrane domain (3), they could undergo a conformational change
when partitioning into rafts (4) or following binding to GSLs (5). After oligomerization
of raft proteins by multivalent ligands (6) or cytoplasmic scaffolds (7), the small raft
domains coalesce and become more stable by forming small raft clusters. They may
contain more than one family of raft proteins. Although still having a size below the
resolution limits of light microscopes, they could already function as signalling
platforms. Large raft clusters are probably assembled only when due to protein
modifications (like phosphorylation) the number of protein–protein interactions
increases and it leads to the coalescence of small clusters into larger domains on the
scale of several hundred nanometres (8).

47
Figure 1.18. The tuneable states of rafts (see Simons and Sampaio, 2011); the different
states are explained in the text).
1.7. ROLE OF MEMBRANES AND LIPIDS IN TEMPERATURE
ADAPTATION AND STRESS RESPONSE
1.7.1. Cold
One of the most important feature of a lipid bilayer is the relative mobility of the
individual lipid molecules and how this mobility alters with temperature. This response
is known as the phase behaviour of the bilayer. Basically, at a given temperature a lipid

48
bilayer can exist in either a gel or a liquid phase. Upon increasing temperature all lipids
have a characteristic temperature, referred to as the transition temperature, at which they
undergo a transition from the viscous gel (frozen) to the fluid (melted) liquid phase
upon increasing temperature. Lowering the ambient temperature of poikilotherms is
likely to cause an increase in membrane lipid order. Because of the mixture of lipid
classes and lipid molecular species in biological membranes, this will mean that one or
more of these molecular species will be below its liquid to gel phase transition
temperature. As soon as this phenomenon becomes significant then phase separation of
the affected lipids can take place (Guschina and Harwood, 2006). When the growth
temperature of poikilotherms is lowered, a number of changes in their membrane lipids
have been observed (re-tailoring of membrane species, increase in FA unsaturation,
chain shortening, alteration of FA type, changes in lipid classes and lipid/protein ratio
changes) which are commensurate with attempts to maintain lipid order at
physiologically-advantageous values. These alterations could, therefore, be viewed as
adaptation. Rigidification of membrane lipids has been thought to be a general
mechanism which could provide a simple way in which homeostatic regulation of
membrane properties could be achieved (see reviews: Guschina and Harwood, 2006;
Vigh et al., 1998). As an example, it has been shown that modification of the
membrane’s physical state by surface membrane selective catalytic lipid hydrogenation
induces the cold-responsive 12 desaturase (desA) gene in Synechocystis PCC 6803
under isothermal conditions (Vigh et al., 1993). Catalytic hydrogenation of a small pool
of PM FAs in live Synechocystis cells stimulated the transcription of the desA gene in
the same way as chilling. In addition, hydrogenated cells displayed an elevated
sensitivity to cold stress, indicating that hydrogenation and cooling have “additive
effects” on desA induction and that cold perception is mediated through changes in
membrane fluidity.
1.7.2. Heat stress
If heat is truly transduced into an intracellular signal at the level of membranes, then any
manipulation that modulates membrane physical parameters (fluidity, lipid domain
organization) should alter the profile and temperature threshold of the HSR.
It was demonstrated in the yeast S. cerevisiae that a series of aliphatic alcohols
(from methanol to n-pentanol) can lower the temperature required for the maximum
induction of a HS-inducible promoter by 3 °C and that the concentration needed to

49
achieve this decreases as alcohol hydrophobicity increases (Curran and Khalawan,
1994). The lipid–water partition coefficient of alcohols increases with increasing carbon
chain length. That a proportionally lower concentration of alcohol elicited the same shift
in the maximum HSR threshold as the carbon chain length increased, supports the
hypothesis that the membrane plays a role in modulating the cell's response to an
increase in temperature. Furthermore, the HS and ethanol stress responses exhibited an
extensive similarity and functional overlap. The Hsps required a temperature above ca.
35 °C or ethanol levels above a threshold level of 4–6 % (v/v) for strong induction
(Piper, 1995). It was shown that genetic modification of lipid unsaturation and the
membrane fluid state, obtained by over-expression of a desaturase gene in the yeast S.
cerevisiae, resets the optimal temperature of HSR (Carratù et al., 1996).
To confirm the “membrane sensor” hypothesis in the cyanobacterium
Synechocystis PCC 6803, Northern blot analysis was performed on cells acclimated to
contrasting temperatures (22 °C vs. 36 °C), or treated by the membrane fluidizer benzyl
alcohol (BA) before various heat exposures (Horváth et al., 1998). The results showed
that in cells acclimated to 36 °C all four hs genes tested (dnaK, groEL, cpn60, and
hsp17) were activated at significantly elevated temperatures in comparison with the low
temperature-grown counterparts (Figure 1.19). The threshold temperature for the
maximal activation was 44 °C in 36 °C samples whereas this value downshifted to 38–
40 °C in 22 °C-grown cells. Moreover, unlike dnaK, groEL, and cpn60, the hsp17 gene
was transcribed exclusively at 44 °C and above in samples of 36 °C-grown cells.
These results also demonstrated that the temperature setpoint for the activation of
the hsp genes is not a fixed value but is clearly affected by the growth temperature. The
main factors governing the long-term acclimation in cyanobacteria to ambient
temperatures are changes in the level of lipid unsaturation and ratio of proteins to lipids
in the membrane (Horváth et al., 1998; Török et al., 1997), which in turn, cause an
alteration in the membrane physical state. To test whether correlation between growth
temperature, thylakoid thermosensitivity, and activation of hsp genes are truly mediated
via changes in the membrane physical state, the membrane fluidity of isothermally
grown cells was modulated before temperature stress (Figure 1.19). Administration of
BA to 36 °C-grown cells, causing reduced molecular order in both the cytoplasmic and
thylakoid membranes, dramatically lowered the threshold temperature of heat shock
gene activation. Further supporting its unique feature, the administration of the fluidizer
increased the hsp17 either at mRNA or protein level throughout the whole temperature
range tested.

50
Figure 1.19. Effect of membrane modulations on the temperature profile of hsp gene
(dnaK, groESL, cpn60, and hsp17) expression in Synechocystis (adapted from Horváth et
al., 1998). Cells, acclimated to 36 °C, 22 °C, grown at 36 °C and treated with 30 mM BA
(36 °C +BA), were incubated at indicated temperatures, and the extracted total RNA were
subjected to Northern analysis. Hybridizations with rRNA were served as loading
controls.
The precise mechanism(s) by which Escherichia coli cells sense environmental
stress and transduce signals affecting the expression of genes involved in defence,
recovery, and stress acclimation are still unclear. To address whether membrane
changes directly participate in generating signals for the activation of heat shock genes,
a study was conducted on wild type (wt) and rpoH (encoding the major heat shock
sigma factor, σ32) deletion mutant E. coli strains exposing cells to HS and BA treatment
(Shigapova et al., 2005). In the wt cells, both GroEL and dnaK, representing the two
major chaperone systems of E. coli, could be activated by a temperature upshift or BA
treatment at the growth temperature. It is known that the transcription of the heat shock
genes is strongly reduced in the absence of σ32 (Zhou et al., 1988). Interestingly, in the
strain lacking σ32, transcripts of both groEL and dnaK (this latter in a relatively large
amount) were already present at 30 °C and their levels were slightly reduced rather than
induced upon BA administration. In contrast, a transcriptional activation of these genes
upon temperature upshift to 43 or 46 °C was observed. Western blot experiments were
carried out to follow the accumulation of the major Hsps, DnaK and GroEL.
Surprisingly, in contrast to a short HS (43 or 46 °C, 20 min), resulting in the formation
of both hsp transcripts and Hsps, BA treatment accumulated hsp transcripts but did not
cause sizable formation of the Hsps.

51
Interestingly, the amount of Hsps that were induced in P. patens by a specific HS
did not depend only on the inducing temperature, but also on the basal growth
temperature (Saidi et al., 2009a; Saidi et al., 2010). When mosses which had been pre-
acclimated at 22 °C were treated 1 h at 34 °C they showed a 4-fold higher HSR
compared to mosses pre-acclimated at 30 °C. This correlated with a massive increase in
the lipid saturation of their membranes at 30 °C as compared to 22 °C.
Furthermore, the exposure of moss cells to compounds that increase membrane
fluidity has led to a significant activation of Hsps at non-inducing temperatures (Saidi et
al., 2007; Saidi et al., 2009a). Membrane fluidizers like BA induced a major (albeit
transient) elevation of cytosolic Ca2+, activated Hsp promoters and improved P. patens
thermotolerance (Saidi et al., 2009a; Saidi et al., 2010). Exposure to BA also evoked the
opening of a non-selective Ca2+ channel in excised PM patches, which was very similar,
in conductance and ion selectivity, to the heat-activated channel. Moreover, BA-
mediated HSR was strictly dependent on extracellular Ca2+ and addition of Ca2+
chelators abolished the BA-mediated thermotolerance (Saidi et al., 2009a).
In their study, Samples and colleagues showed that leukocytes, isolated from the
pronephros of rainbow trout Oncorhynchus mykiss, acclimated to 5 or 19 °C expressed
elevated levels of hsp70 mRNA when heat-shocked at 5 °C above their respective
acclimation temperature (Samples et al., 1999). Supplementation with exogenous DHA
or AA followed by HS enhanced the levels of hsp70 mRNA. These authors suggested
that HS initiates changes in membrane physical state, which when acted upon by
phospholipases, may release lipid mediators that could serve as triggering signals during
the HSR.
Another example for the HS threshold alteration due to the acclimation was given
by examining the HSR in testis (Sarge et al., 1995; Sarge, 1995). A unique feature of the
male gonads of many species is their location outside the main body cavity, so that testis
cells have a significantly lower growth temperature relative to cells of other tissues. In
the mouse, testis temperature is tightly regulated at 30 °C, 7 °C lower than the body
cavity temperature at which other tissues such as liver are maintained. It was
demonstrated that HSF1 DNA-binding is induced at significantly lower temperatures in
a preparation of mixed male germ cell types relative to other mouse cell types (Sarge et
al., 1995). This result suggested the possibility that the growth temperature experienced
by a particular cell type in vivo plays a primary role in determining the HSF1 activation
temperature in that cell type. Interestingly, the phenomenon of reduced HSF1 activation
temperature in testis is a property unique to male germ cell types within this tissue, as it

52
is exhibited by pachytene spermatocytes but not by somatic testis cell types (Sarge,
1995).
Attenuation of cardiac Hsp expression has been shown in some pathological
conditions, such as cardiac hypertrophy and aging. For example, it has been shown that
the expression of Hsp70 in response to heat and ischemic stress is also diminished in
hearts of rats fed a Chol-enriched diet (Csont et al., 2002). Since hyperlipidemia is
known to alter lipid composition (Hexeberg et al., 1993) and, thereby, the physical state
of myocardial membranes, it also likely limits the capacity of cells to accumulate Hsps
under various stress conditions (Vigh and Maresca, 2002).
1.7.3. Lipid-interacting non-toxic drugs
Bimoclomol, a hydroxylamine derivative (N-[2-hydroxy-3-(1-piperidinyl)propoxy]-3-
pyridine carboximidoylchloride maleate), and its analogues was shown to have potential
therapeutic uses in the treatment of diabetes, cardiac dysfunction and cerebrovascular
disorders (Chung et al., 2008; Jednákovits et al., 2000; Kürthy et al., 2002; Vigh et al.,
1997). Arimoclomol, a closely related bimoclomol analogue, delayed the disease
progression in amyotrophic lateral sclerosis (Kieran et al., 2004). The first evidence that
these non-toxic compounds are coinducers of Hsps (i.e., they cannot amplify the hsp
gene expression without a concomitant stress, but the stress-induced increase in Hsp
levels is further elevated by their presence) was provided 15 years ago (Vigh et al.,
1997). The precise mechanism of Hsp coinduction by these new drugs is still unknown,
but they have been documented not to interact with a number of known conventional
pharmacological targets. Coinducing effects of bimoclomol on Hsp expression were
shown to be mediated by means of HSF1 (Hargitai et al., 2003). It was also
demonstrated (Török et al., 2003), however, that the presence of bimoclomol does not
affect protein denaturation in various mammalian cells. Instead, it was documented that
the compound (and its analogues) specifically interacts with and significantly increases
the fluidity of negatively charged membrane lipids. On the other hand, bimoclomol is an
efficient inhibitor of bilayer–nonbilayer lipid phase transitions. This was the first
evidence that non-toxic compounds possess the capability of Hsp coinduction in the
absence of the production of unfolded proteins. It was suggested that bimoclomol and
the related compounds modify those membrane domains where the thermally or
chemically induced perturbation of lipid phase is sensed and transduced into a cellular
signal, leading to enhanced activation of heat shock genes (Török et al., 2003).

53
1.7.4. Lipid signalling of HS
Requirements and availability together determine the amount of a certain lipid (in
membranes) by a very intimate regulation of the anabolic and catabolic pathways of
lipid metabolism. Because of this, the actual local concentration of a lipid, is decisive in
terms of functionality, and can be largely influenced by changing stress conditions. This
fact has important consequences during the process of stress response, since even subtle
changes in lipid concentration/composition may result in alterations in lipid–lipid and
lipid–protein interactions leading to altered functional properties such as in signalling.
Lipids of cell membranes can serve as a source of those mediators which can be
involved in the activation or attenuation of Hsp signalling pathways. Stresses and
clinical conditions can induce alterations in the metabolism of membrane lipids in
producing a unique set of lipid mediators with the potential of retailoring the pre-
existing Hsp profile (Escribá et al., 2008). Thus, it has been shown that exogenous
PLA2, which stimulates AA release, and AA itself both activate the HSR (Jurivich et al.,
1994; Jurivich et al., 1996).
HS and other agents that induce the stress response activate PLC and PLA2 in
different cell lines, including cells of human, rat, mouse, and hamster origin
(Calderwood and Stevenson, 1993) producing AA (Calderwood et al., 1989) and
inositol triphosphate (IP3) as a result of PI(4,5)P2 hydrolysis (Calderwood et al., 1987;
Calderwood et al., 1988). Furthermore, in human epidermoid A431 cells U-73122 (an
inhibitor of PLC) treatment reduced the levels of heat-induced Hsp72 almost by half
(Kiang et al., 1994).
On the other hand, during HS, AA is used in the synthesis of eicosanoids via
cyclooxygenases (COX) and lipoxygenases (LOX) (Calderwood et al., 1989). The
cyclopentenone prostaglandins PGA1, PGA2 and PGJ2 also lead to activation of HSF1
(Amici et al., 1992; Amici et al., 1993; Ianaro et al., 2003; Ohno et al., 1988). Hsp70
induction by these compounds is mediated by cycloheximide-sensitive activation of
HSF1, and sustained for long periods of time (12–24 h, depending on the type of
prostaglandin) in human cells (Santoro, 2000). Moreover, certain lipoxygenase products
of AA, such as 12-hydroxyeicosatetraenoic acid, have also been shown to induce the
expression of individual Hsps in human leucocytes (Köller and König, 1991).
Non-steroidal anti-inflammatory drugs (NSAIDs) partially activate components of
the HSR and often work in conjunction with a secondary stress signal for full induction
of Hsp70 expression (Westerheide and Morimoto, 2005). Sodium salicylate (Jurivich et

54
al., 1992) and other NSAIDs such as indomethacin (Lee et al., 1995) induce both HSF1
DNA binding and hyperphosphorylation of HSF1 and drug pretreatment lowers the
temperature threshold of HSF1 activation (Lee et al., 1995). Conventional non-steroidal
anti-inflammatory drugs are non-selective inhibitors of COX-1 and COX-2 enzymes
(Wu, 1998). COX is a bifunctional enzyme, containing the COX activity that catalyzes
the bisoxygenation of AA to form PGG and a peroxidase activity, which catalyzes the
reduction of PGG to PGH (Smith and Marnett, 1991). Therefore, inhibition of COX
results in an elevated AA level. Taken together, one possible explanation for the
mechanism of Hsp coinducing activity of NSAIDs could be that these compounds are
able to elevate the AA level during stress conditions. However, Roussou et al. suggested
that indomethacin at moderate temperatures increases the level of denatured proteins in
the cell, thus lowering the temperature threshold for HSR (Roussou et al., 2000).
It has been shown that the binding of HSF to HSE can be activated by Ca2+.
Treatment with Ca2+ ions resulted in a concentration- and time-dependent activation of
HSF in vitro in cell-free HeLa system (Mosser et al., 1990). In permeabilized NIH3T3
cells, Ca2+ activated HSF binding only in combination with HS (Price and Calderwood,
1991). In intact fibroblast cells HS elevated intracellular Ca2+, but raising intracellular
Ca2+ failed to activate the HSR (Stevenson et al., 1987), indicating that Ca2+ alone is
insufficient to activate expression of the heat shock genes. Hyperthermia caused a large
(3- to 5-fold) increase in intracellular free calcium ([Ca2+]i) in HA-1 fibroblasts.
Increased [Ca2+]i appeared initially to be due to release of Ca2+ from an internal store.
These heat-induced changes in Ca2+ homeostasis were correlated with a rapid release of
IP3 within 1 min at 45 C (Calderwood et al., 1988). However, in human epidermoid
A431 cells heat activates the Na+–Ca2+ exchange system so as to increase [Ca2+]i and
reduce [Na+]i (Kiang et al., 1992).
Increases in [Ca2+]i induced by ionomycin (a Ca2+ ionophore) promote Hsp70
production in A431 cells (Ding et al., 1996), MDCK cells (Yamamoto et al., 1994), and
rat luteal cells (Khanna et al., 1995). Furthermore, inhibition of increases in [Ca2+]i in
A-431 cells by removal of external Ca2+, addition of the chelator EGTA in the medium,
or treatment with an intracellular Ca2+ chelator, greatly attenuates HSF translocation
from the cytosol to the nucleus, HSF binding to HSE, hsp70 gene expression, and
protein synthesis (Kiang et al., 1994).
In cells that overexpress Hsp70 as a result of HS or hsp70 gene transfection,
increases in [Ca2+]i induced by HS, air hypoxia, or chemical hypoxia are attenuated
(Kiang and Tsokos, 1998). It was suggested by Kiang and Tsokos (Kiang and Tsokos,

55
1998) that IP3 itself is important in the regulation of the expression of Hsps because
treatment with pertussis toxin, cholera toxin, or forskolin increases the production of IP3
(Kiang and McClain, 1993). This increased production leads to the increased levels of
hsp70 mRNA and protein in human epidermoid A431 cells. They hypothesized that
induction of Hsp70 may be a result of IP3 binding to its receptors (Kiang and Tsokos,
1998).
Investigating the roles of membrane fluidity and Cer in hyperthermia and alcohol
stimulation of TRAIL apoptosis, Moulin and coworkers showed (Moulin et al., 2007),
that HS, BA or ethanol treatment, had the ability to up-regulate total cellular Cer levels
in Jurkat cells. Cer is widely considered as an effector promoting cell cycle arrest and
apoptosis, which are important components of the stress response. However, the
increase in Cer does not necessarily lead to cell death since B16 cells remain viable
after 41–43 °C heat or 40 mM BA treatment for 1 h (Nagy et al., 2007). A similar
distinction of heat-induced Cer generation and apoptosis induction was demonstrated in
Molt-4 cells (Jenkins et al., 2002). Nevertheless, when the damage is extensive (i.e. due
to a heating over 44 °C or prolonged HS) cells undergo apoptosis (Zhang et al., 2009).
Moreover, a direct link between heat-induced Cer production and specific stress protein
induction was reported on NIH WT-3T3 cells (Chang et al., 1995), where HS at 42.5 °C
for 2 h caused a 2-fold increase of total Cer. Application of exogenous C2 (acetyl)-Cer
or increased endogenous intracellular Cer was found to induce a sHsp -crystallin, but
not the structurally similar Hsp25.
SPC is naturally produced via breakdown of SM by SM deacylase. SPC (but not
S1P) activates Hsp27 via the p38 MAPK pathway in isolated rat cerebral arteries
(Mathieson and Nixon, 2006). In contrast, in osteoblast-like MC3T3-E1 cells and aortic
smooth muscle A10 cells S1P stimulates the induction of Hsp27 via p38 MAPK and
PI3K/Akt pathways (Kozawa et al., 1999a; Kozawa et al., 1999b; Takai et al., 2006).
In addition, during HS Chol can be rapidly converted to cholesteryl glucoside
(Kunimoto et al., 2000). Exogenous cholesteryl glucoside rapidly activated HSF1 and
induced the synthesis of Hsp70 in fibroblast cells (Kunimoto et al., 2002).
The stress response-modulating lipid mediators are summarised in Figure 1.20
which is based on the original figure published in a recent review (Escribá et al., 2008).

56
Glycerolipids
Arachidonic acid
DAG, IP3
Prostaglandins Leukotrienes
Sphingomyelin
Ceramide SPC
Sphingosine Sphingosine-1P
Cholesterol
Cholesterylglucoside
PLA2 PLC
COX LOX
DAG lipaseMAG lipase
SMase SM deacetylase SGT
Raft region
Figure 1.20. Some typical lipid mediators capable of altering the HSR. SMase:
sphingomyelinase; SGT: sterol glucosyltransferase; COX: cyclooxygenase and LOX:
lipoxygenase (adapted from Escribá et al., 2008).
1.7.5. HS signals through growth factor receptors
It was suggested (Escribá et al., 2008; Park et al., 2005; Vigh et al., 2005) that signalling
from the transmembrane growth factor receptors to hsp genes may link PM events to
Hsp expression induced by mild HS and membrane fluidizers. Membrane
rearrangement by mild HS or chemical fluidizers may activate growth factor receptor
tyrosine kinases by causing their non-specific clustering (Vigh et al., 2005). Ligand-
independent activation of the EGFR by lipid raft disruption was demonstrated on
keratinocytes (Lambert et al., 2006). The authors hypothesized that Chol depletion leads
to the release of EGFR from the damaged rafts of methyl--cyclodextrin-treated cells
into small confined areas of the membrane, where the receptor molecules are likely to
be spontaneously activated owing to a very high density and/or separation from the
inhibitory factors remaining in the surrounding portions of the membrane.
PI3Ks are activated by growth factor receptor tyrosine kinases, either directly or
through interaction with the insulin receptor substrate family of adaptor molecules. This
activity results in the production of PIP3. A bifurcation of the signalling pathway exists
downstream of PI3K and PIP3, so that Akt and Rac1 (a member of the Rho family of

57
small GTPases) activation occur in parallel (Ishikura et al., 2008). The serine/threonine
kinase Akt links growth factor signalling with cellular growth, proliferation,
metabolism, survival (Akhavan et al., 2010) and Hsp response by inhibiting GSK3.
Rac1 plays a fundamental role in a wide variety of cellular processes, including actin
cytoskeletal reorganization, cell transformation, the induction of DNA synthesis,
superoxide production, axonal guidance, cell migration (Bosco et al., 2009) and also in
Hsp response (Han et al., 2001).
Moderate HS (43 °C) has been shown to activate PI3K in NIH3T3 fibroblasts (Lin
et al., 1997). Additionally, mild HS (41–42 °C) induces phosphorylation and activation
of Akt in a PI3K-dependent manner in NIH3T3 fibroblasts (Bang et al., 2000; Han et
al., 2002), and in human neuroblastoma SHSY5Y cells (Bijur and Jope, 2000). HS
treatment of SHSY5Y cells also caused a rapid increase in HSF1 DNA-binding activity
that was partially dependent on PI3K activity. HS-induced activation of PI3K and the
inhibitory effect of GSK-3b on HSF1 activation and Hsp70 expression imply that Akt-
induced inhibition of GSK-3b contributes to the activation of HSF1 (Bijur and Jope,
2000). In vivo experiments also showed that mild HS (41 °C, 30 min) application
induces PI3K activation and GSK-3b inactivation (Maroni et al., 2000).
Mild HS (39–42 °C, 15–20 min) has been shown to activate Rac1 pathway as
demonstrated by pull-down assay using the Rac1-binding domain of p21-activated
kinase. Overexpression of Rac1N17, a dominant negative mutant Rac1, completely
prevents HSF1 activation and Hsp expression in response to mild or moderate HS (40–
43 °C, 20 min), but not to severe HS (44–45 °C, 20 min) (Han et al., 2001), indicating
that the Rac1 GTPases play a critical role in stress-induced HSF1 activation and Hsp70
expression (Park et al., 2005). The signalling pathways are summarised in Figure 1.21
(based on Akhavan et al., 2010; Escribá et al., 2008; Park et al., 2005; Vigh et al.,
2005).
As mentioned above, raft perturbation may result in ligand-independent growth
factor receptor activation. An important HS-induced process resulting in raft
rearrangement is Cer generation. Cer, which has the unique property of fusing
membranes, appears to drive the coalescence of raft microdomains to form large, Cer-
enriched membrane platforms, which exclude Chol (Grassme et al., 2007; Gulbins and
Kolesnick, 2003), in other words elevated Cer level rapidly displaces Chol from
membrane/lipid-“Chol-raft” and forms “Cer-raft” (Patra, 2008). It was hypothesised that
extracellular stimuli employ Cer-enriched platforms to achieve a critical density of

58
receptors and other signalling molecules that are required for biochemical transfer of the
stress across the PM.
Figure 1.21. Cascade of possible HS signal generation and transduction events linking
plasma membrane (growth factor signalling) to heat shock genes during Hsp response
induced by mild HS and membrane fluidizers (based on Akhavan et al., 2010; Escribá et
al., 2008; Park et al., 2005; Vigh et al., 2005). IGF-1, insulin-like growth factor 1; IRS-1,
insulin receptor substrate 1; PIP2, phosphatidylinositol biphosphate; PIP3,
phosphatidylinositol triphosphate; Akt, protein kinase B; Rac1, a small GTPase protein;
GSK3, glycogen synthase kinase-3; HSF1, heat shock factor 1; PI3K, phosphoinositide 3-
kinase; PTEN, phosphatase and tensin homologue protein.
1.7.6. Altered HSR in diabetes and cancer
Insulin resistance and type 2 diabetes are known to be associated with low Hsp levels,
and with decreased PI3K and enhanced GSK3 activities. Stimulation of the
translocation of GLUT4 glucose transporters in muscle and adipose tissue shares the
PI3K-Akt pathway with HSR, therefore common insulin and Hsp signal attenuation in
type 2 diabetes has been suggested (see in Figure 1.21) (Chung et al., 2008). Using
rodent models, it has been demonstrated that the localization of insulin receptor in the

59
caveolae is interrupted by elevated levels of the endogenous ganglioside GM3 during a
state of insulin resistance (Kabayama et al., 2007). In agreement, diseases or treatments,
which alter raft lipid composition, also change insulin sensitivity and presumably the
HSR as well (Vigh et al., 2007a). Certain lipid-interacting non-toxic drugs (see above)
have been reported to improve insulin sensitivity. Using BGP-15 to achieve an elevation
of Hsp72 protein, protection against diet or obesity-induced hyperglycaemia,
hyperinsulinemia, glucose intolerance and insulin resistance was observed (Chung et al.,
2008). It is highly probable that these drugs may influence the above-mentioned
common signal pathways.
On the other hand, in cancer HSF1 becomes activated and its activity is associated
with transformation and maintenance of the malignant phenotype. As documented by
Khaleque et al. (2005), Hsp elevation in tumour cells can be induced by the malignant
growth factor heregulin (HER), which causes homo- and heterodimerization between
each member of the four ErbB receptor molecules (Khaleque et al., 2005). The
formation of raft-associated growth factor receptor dimers is followed by tyrosine
phosphorylation of their intracellular domains. The major downstream signalling
pathways include the Ras–Raf1–Mek–ERK and PI3K–PDK1–Akt pathways (Escribá et
al., 2008; Khaleque et al., 2005). HER appears to be linked to Hsp expression by its
activation of HSF1 through inhibition of the constitutive kinase GSK3. As GSK3 is
inhibitory for HSF1, HER2/Akt signalling can then activate HSF1 by blocking
inhibitory signalling (Calderwood et al., 2010).
Elevated Hsp expression promotes cancer by inhibiting programmed cell death
(Hsp27, Hsp70) and by promoting autonomous growth (Hsp90) and leads to resistance
to chemotherapy and hyperthermia. Tumour Hsps have another property that can be
exploited in therapy. They are immunogenic and can be used to form the basis of
anticancer vaccines. Elevation in Hsp levels may thus have competing effects in tumour
growth, being required for tumour cell survival but conferring a hazard for cancer cells
due to their immunogenic properties (Calderwood and Ciocca, 2008).
Membrane fluidizing treatments such as mild hyperthermia, aliphatic alcohols and
local anaesthetics change the lipid dynamics of cell membranes resulting in an increase
in local fluidity. The use of fluidizing treatments in combination with chemotherapeutic
agents may therefore allow more efficient entry of the drugs into the tumour cell. Such
combination therapies may also allow the use of lower drug concentrations, thereby
limiting the damage to normal cells (see reviews: Baritaki et al., 2007 and Grimm et al.,
2009). In addition to causing cell membrane fluidization, hyperthermia treatment causes

60
vasodilation of local blood vessels and increases oxygenation which, when combined
with chemotherapy may result in improved delivery of the drug (Dempsey et al., 2010).
Moreover, synergistic effects of compounds able to alter membrane fluidity could also
be exerted with cytotoxic drugs or radiation leading finally to apoptotic cell death
(Baritaki et al., 2007).
1.7.7. Mild and severe heat stress: the significance of fever
It is important to distinguish between mild (natural and usually beneficial) and severe
(mostly destructive) HS. The severity of HS is determined by heat dose, meaning both
temperature and exposure time. Furthermore, HS sensitivity varies depending on
biological factors, including cell types, tissue origin, developmental stage, a cell cycle
phase of the cell line analyzed and the cellular events measured. Thus, the criteria for
grading HS should be considered in both their arithmetic and biological aspects. The
major difference between the cellular responses to mild and severe HS is adaptation of
growth conditions (mild) versus cell death or morbidity (severe) (Park et al., 2005).
The prevalence of fever in modern day members of the 2 major animal divisions,
Deuterostomia (vertebrates) and Protostomia (arthropods and annelids), suggests that it
must have first appeared approximately 600 millions years ago. The persistence of fever
for over 600 million years despite its considerable metabolic cost offers persuasive
evidence that it is protective to the infected host (Hasday and Singh, 2000).
It is known that mild hyperthermia alters cellular immune function (Peer et al.,
2010). In 2000 Hasday and Singh proposed four ways by which fever might protect the
infected host: (i) exposure to fever-like temperatures might be directly cytostatic or
cytotoxic or for attacking microbial pathogens, it can shorten disease duration and speed
up pathogen clearance; (ii) fever might confer protection during infection by inducing
Hsp expression in host cells, it can elevate their resistance to the chemical stresses
originated from the infected microenvironment; (iii) fever might defend the infected
host by stimulating the pathogens to produce Hsps, many of which are effective
activators of host innate immune defences; (iv) fever might ameliorate survival potential
during infection by helping to optimize and orchestrate the host immune response
through the use of components of the HSR (Hasday and Singh, 2000).
HSF1 has been shown to be involved in the thermal attenuation of the production
of cytokines like TNFα �(Singh et al., 2000) and the CXC family of chemokines
(Nagarsekar et al., 2005). For adaptive immunity, stress proteins are able to chaperone

61
intracellular peptide antigens, protect them from degradation and transport them from
the cell. They might be seen as portable vehicles of immune surveillance and appear to
have played a significant role in immunity for long stretches of evolutionary time. In
addition, Hsps might be a component of an endogenous immunoregulatory mechanism
functioning to control and resolve inflammatory events (Pockley et al., 2008).
1.7.7.1. What could be the sensors of HSR in fever?
Fever appears to be an evolutionarily conserved response to bacterial or viral infection,
which implies it may have survival benefits (Peer et al., 2010). It is important to note
that the overexpression of Hsps can be activated under mild physiological conditions
that are unlikely to cause any protein denaturation in the cell (Saidi et al., 2007; Saidi et
al., 2010; Vigh et al., 1998; de Marco et al., 2005). It is noted that phospholipase
activation plays a central role both in HSR (discussed above) and inflammation. Since
Milton and Wendlandt discovered the pyrogenic activity of prostaglandins of the E
series (Milton and Wendlandt, 1970), and Vane found that non-steroidal anti-
inflammatory drugs block fever by inhibiting prostaglandin synthesis (Vane, 1971), it
has been accepted that fever is mediated by prostaglandins, specifically PGE2 (Elmquist
et al., 1997; Engblom et al., 2002; Ivanov and Romanovsky, 2004) which are
synthesized from AA released by PLA2 from membrane PLs. Moreover, a plethora of
data is available in the literature that mammalian MAP kinase signal transduction
pathways are activated by both stress (discussed above) and inflammation (reviewed in
detail by (Kyriakis and Avruch, 2001).
The sensing of HSR therefore shares certain common mechanisms with
inflammation with possible initiation points coupled to the functional changes at cellular
membranes. It is conceivable that HS sensor(s) evolved in parallel to the fever response
in vertebrates by detecting the elevation of temperature without any recognisable
damage to the main cellular functions (e.g. in the absence of protein denaturation),
thereby supplying the evolutionary basis for the membrane sensor theory.
Considering its obvious importance in several aspects for living organisms, as
shown in this Chapter, the experimental work to be presented in the following sections
was planned and carried out to evaluate further the membrane sensor hypothesis.

62
1.8. AIMS OF THE THESIS
Earlier research on prokaryotes and yeast clearly suggested that during abrupt
temperature fluctuations membranes represent the most thermally sensitive
macromolecular structures.
The aims of this thesis were to test experimentally the membrane sensor theory in
mammalian cells and to explore the mechanisms behind the lipid signals and membrane
lipid structural reorganizations leading to heat stress response and adaptation. The
experiments to achieve this objective were:
1) To test the membrane sensor hypothesis on K562 mammalian cells comparing the
effect of two distinct membrane fluidizer (alcohols and heat stress) on membrane
microviscosity and the heat shock response (HSR).
2) To check whether the fluidizers applied at heat shock-inducing conditions act
primarily on membranes without effect on protein denaturation.
3) To investigate the Ca2+ signals and mitochondrial membrane potential alterations
elicited by heat or membrane perturbing agents.
4) To extend the validity of membrane sensor hypothesis to B16(F10) cells and test the
induction of major hsp genes comparing heat and benzyl alcohol (BA) as stressors.
5) To explore further commonalities in plasma membrane rearrangement through
testing the cholesterol-rich domain structure alterations by heat or BA treatment.
6) To systematically map the lipid changes following membrane perturbation caused
by heat or BA treatment by means of lipidomic mass spectrometry measurements in
order to uncover novel lipid alterations during the initial phase of the stress
response.
7) To identity possible lipid signalling pathway elements.
8) To gain further insights into the role of membrane organisation alterations during
hyperfluidization-induced stress by different visualization methods which use
different reporters regarding structure, charge and localization.

63
CHAPTER 2. GENERAL MATERIALS AND METHODS
2.1. GENERAL MATERIALS
Most of the chemicals such as solvents, buffers, reagents were from Sigma (Steinheim,
Germany) unless otherwise indicated, and were of the best available grade
2.2. CELL CULTURE
K562 (ATCC: CCL-243) human erythroleukemic cells and B16(F10) (ATCC CRL-
6475) mouse melanoma cells were cultured in RPMI-1640 medium supplemented with
10 % fetal calf serum (FCS) and 2 mM glutamine in a humidified 5 % CO2, 95 % air
atmosphere at 37 C and routinely subcultured three times a week.
Cells were plated in 3x10⁶ cell number/10 cm plate and grown additionally for 1
day. For heat shock treatments, the plates were immersed in a water bath set to the
indicated temperature (±0.1 °C). For BA treatment, the growth medium was changed to
fresh growth medium containing BA at the indicated concentrations.
Because it was found that culture conditions (e.g. cell number, serum quantity)
affect lipid composition and metabolism in B16 cells, very careful attention was paid to
the above conditions and only cultured for a few passages. Independently-grown
samples were used as replicates.
2.3. PROTEIN DETERMINATION
For protein measurement the enhanced bicinchoninic acid (BCA) assay (available in kit
form from Pierce, Rockford, Illinois) was applied according to the manufacturers
instructions. The absorbtion of the purple-coloured reaction product formed by the
chelation of two molecules of BCA with one Cu1+ ion was measured at 562 nm. A
series of dilutions of bovine serum albumin in the concentration range of 5-250 µg/mL
were prepared and assayed in order to determine the standard curve.

64
2.4. MEMBRANE ISOLATION
Subcellular fractions of K562 cells were isolated based on the method of (Maeda et al.,
1980). Cells (5x10⁷) were harvested by centrifugation (1000 g, 5 min) and washed with
ice-cold phosphate buffered saline (PBS) twice. All further procedures were carried out
at 4 °C. Cells were resuspended in 4 ml TNM buffer (10 mM Tris-HCl pH 7.5, 10 mM
NaCl, 1.5 mM MgCl2, 1mM PMSF 2 µM leupeptin) for 5 min. After swelling cells were
disrupted with Dounce homogenizer (40 strokes). Intact cell and nuclei were removed
by centrifugation (1000 g, 5 min). The supernatant were centrifuged (8000 g, 15 min) in
order to pellet the PM and mitochondrial/lysosomal fraction. The resulting supernatant
contains the microsomal fraction. The pellet was resuspended in 8 mL TNM buffer,
layered over 36 % sucrose (dissolved in TNM) and centrifuged in a Beckman
ultracentrifuge (Beckman L7, Beckman Coulter, Inc.) equipped with SW-41 rotor
(90,000 g, 2.5 h). The band on sucrose layer (PM fraction) and the pellet
(mitochondrial/lysosomal fraction) was removed and resuspended in 8 mL TNM. These
two fractions and the supernatant containing the microsomal fraction were centrifuged
(100,000 g, 40 min). The resultant pellets (PM, mitochondrial/lysosomal fraction and
microsomal fraction) were resuspended in 0.5 mL 10 mM Tris, 10 mM NaCl (pH 7.5)
for further analysis. Protein content was measured by BCA kit (see above) and lipid
content was determined as described in Chapter 4.1.5.
The purity of PM fraction was checked in two representative preparations by
enzymatic assays (Table 2.1). The microsomal and mitochondrial fractions were
combined and compared with the PM fraction. The activity of marker enzymes of PM
(ouabain sensitive Na, K-ATPase), mitochondria (oligomycin sensitive Mg-ATPase)
and microsomes (glucose-6-phosphate dehydrogenase) were determined from a portion
of these fraction corresponding to 100 µg protein per assay.
Ouabain sensitive Na, K-ATPase activity (PM marker) was assayed as the
difference between phosphate (Pi) liberated from ATP after a 10-min time interval (see
below). 100 µg protein was incubated in the presence of K+ (167 mM NaCl, 50 mM
KCl, 33.3 mM imidazole, pH 7.2) and in the absence of K+ but in the presence of
ouabain (217 mM NaCl, 33.3 mM imidazole, 1 mM ouabain, pH 7.2) (Kimelberg and
Papahadjopoulos, 1974). The reaction was initiated by adding 3.3 mM ATP.
Oligomycin sensitive Mg-ATPase activity (mitochondrial marker) was assayed as
the difference between Pi production in the presence and absence of 1 µg oligomycin for
4 min at 30 °C in a total volume of 0.45 mL (10 mM MgCl2, 8.3 mM imidazole buffer,

65
pH 6.9). For reaction initiation 0.15 mL ATP was then added in a final concentration of
10 mM (Futai et al., 1974). From the difference in Pi production (see below) the
oligomycin sensitive activity was calculated.
In the above assays the ATPase reactions were stopped by addition of 100 μL
20 % sodium dodecyl sulfate (SDS). The Pi formed was determined from a 0.1 mL
aliquot of the reaction mixture (Baginski et al., 1967). It was mixed with 0.25 mL of
reagent A (3 % ascorbic acid in 0.5 M HCl and 0.5 % ammonium molybdate solution)
and the tubes were incubated on ice for 10 min. Then 0.5 mL of reagent B (2 % sodium-
arsenite, 2 % trisodium citrate and 2 % acetic acid) was added. The colour developed
after 10 min at 37 °C was measured at 850 nm (HP 8452A Diode Array
Spectrophotometer, Hewlett Packard, USA). The enzyme activities were expressed as
nmol Pi/mg prot/min.
Glucose-6-phosphate dehydrogenase (microsomal marker) was assayed in 2.7 mL
55 mM Tris-HCl buffer (pH 7.8) containing 3.3 mM MgCl2 at 30 °C. The reaction was
started with 0.1 mL 6 mM nicotinamide adenine dinucleotide phosphate (monosodium
salt). The increase in the absorbance difference A340 - A374 (in dual wavelength mode)
resulting from the reduction of NADP to NADPH was recorded for 4 min. The glucose-
6-phosphate dehydrogenase activity was expressed as nmol NADP/mg prot/min (an
absorption coefficient of 6.0 mM-l * cm-1 was used) (Hino and Minakami, 1982).
Table 2.1. The activity of marker enzymes of PM (ouabain sensitive Na, K-ATPase), mitochondria (oligomycin sensitive Mg-ATPase) and microsomes (glucose-6-phosphate dehydrogenase) in the membrane fractions of K562 cells (n=2).
Fraction Ouabain
sensitive
Na, K-
ATPase#
Oligomycin
sensitive Mg-
ATPase #
Glucose-6-
phosphate
dehydrogenase##
Plasma membrane 112.1 ± 21.5 8.2 ± 3.8 7.2 ± 1.9
microsomes+mitochondria 4.2 ± 1.7 75 ± 12.3 23.6 ± 5.4
# nmol Pi/mg prot/min, ## nmol NADP/mg prot/min
2.5. FLUORESCENCE ANISOTROPY
In fluorescence anisotropy measurements, the light filtered by a monochromator passes
through a vertical polarizing filter and excites fluorescent molecules in the sample tube.
Only those molecules that are closely oriented in the vertically polarized plane absorb

66
light, become excited with the highest probability (called photoselection) and
subsequently emit light. The emitted light is measured passing through horizontal and
vertical polarizing filters. The anisotropy (r) is defined as the ratio of the polarized
components to the total intensity r=(I║ − I┴)/(I║ + 2I┴). The probability distribution
function determines the maximum photoselection and therefore the theoretical
maximum anisotropy can be calculated: rmax= 0.4 for single photon excitation, while r=0
when the emission is completely depolarized (Lakowicz, 2006). The anisotropy reflects
the average angular displacement of the probe molecule between the time points of
excitation and emission.
The measurement of fluorescence anisotropy is well suitable to estimate certain
aspects of the membrane physical state, because the characteristic time constant of the
rotational diffusion (rotational correlation time ()) is comparable to the average time
the fluorophore (e.g. DPH) stays in its excited state (lifetime ()). Based on a model by
(Perrin, 1926) derived from the theory of Brownian motion, the rotational correlation
time (for a spherical probe) can be estimated as follows: = V/RT, where η = solvent
viscosity, T = temperature, R = gas constant and V = molecular volume of the
fluorescent probe. Therefore, anisotropy provides information on local viscosities of the
fluorophore environment. Furthermore, anisotropy depends on the temperature and
molecular volume (and shape) of the fluorophore. The determination of the instrumental
response factor (G) and the anisotropy are described in Figure 2.1.
In systems, where the fluorescent probe molecules are dispersed in lipid bilayer
membranes, it is expected that the long axis of the rodshaped molecules, like 1,6-
diphenyl-1,3,5-hexatriene (DPH) and its analogues, is more or less preferentially
aligned along the normal of the membrane. Moreover, the motion of these dipoles
expected to reflect closely the motion of neighbouring hydrophobic parts of lipids. The
structure of DPH and its derivatives, 1-(4-trimethylammoniumphenyl)-6-phenyl-1,3,5-
hexatriene (TMA-DPH) and 1,6-diphenyl-1,3,5-hexatriene propionic acid (DPH-PA)
are depicted in Figure. 2.2.

67
Figure 2.1. Diagram of T-format fluorescence anisotropy measurement. IVV and IVH are
the parallel and perpendicular polarized fluorescence intensities measured with the
vertically polarized excitation light, IHV and IHH are the same fluorescence intensities
measured with the excitation light horizontally polarized, and G is the instrumental
correction factor.
Figure 2.2 Structure of DPH analogues.

68
2.5.1. Membrane fluidity measurements
The PM fraction of K562 cells was isolated as described above (Maeda et al., 1980).
Isolated PMs were labelled in 10 mM Tris, 10 mM NaCl (pH 7.5) or PBS with 0.2 µM
DPH or its derivatives, TMA-DPH and DPH-PA, at a molar ratio of about 1:200
probe/phospholipid for 5–10 min. For in vivo fluidity measurements, K562 cells were
rinsed and resuspended in PBS at OD430=0.1 in the fluorimeter cuvette. The cells were
labelled with 0.2 µm DPH for 30 min, or with DPH-PA and TMA-DPH for 5 min (these
times are appropriate for the individual probes, (Kitagawa et al., 1991).
Steady-state fluorescence anisotropy was determined in a PTI spectrofluorometer
(Quanta Master QM-1, Photon Technology International, Inc., Princeton, NJ, USA).
Excitation and emission wavelengths were 360 and 430 nm, respectively (5-nm slits)
(Török et al., 1997). The details of the instrument architecture are shown on Fig 2.3.
The temperature in the cuvette was followed by a sensor and recorded by computer.
Figure 2.3 Diagram of the Quanta Master T-format spectrofluorometer equipped for
steady state fluorescence anisotropy measurement. The temperature of the turret was
controlled by a heating and cooling circulating water temperature controller with built-in
PID algorithms.

69
CHAPTER 3. THE HYPERFLUIDIZATION OF
MAMMALIAN CELL MEMBRANES ACTS AS A SIGNAL
TO INITIATE THE HEAT SHOCK RESPONSE
The experiments presented in this chapter were conceived and designed in collaboration
with László Vígh. All experiments, evaluation and statistical analysis were performed by
myself, with the following exceptions: Luciferase assays were performed in collaboration
with Olivier Bensaude in Paris. Electron microscopy analysis was performed by Zsófia
Hoyk. Zsolt Török, Olivier Bensaude, Zsófia Hoyk, Enikő Nagy and Ibolya Horváth took
valuable part in the interpretation of results. The paper published from that research was
written in collaboration with László Vígh, Ibolya Horváth. The contribution of all co-
authors is gratefully acknowledged.
Up to now, most published studies have focused mainly on the cellular responses to
severe HS, which causes the unfolding of pre-existing proteins and the misfolding of
nascent polypeptides (Sarge et al., 1993). Therefore, it has been proposed that the
denaturation of a portion of the cellular proteins during severe heat serves as the
primary heat-sensing machinery which triggers the up-regulation of the hsp gene
expression. Because mild HS is not coupled with the extended unfolding of cellular
proteins, it was suggested that it is sensed by a different mechanism (Park et al., 2005).
Moreover, many results support the notion that instead of proteotoxicity, an alteration in
membrane fluidity may be the first event that detects a change in temperature. Thus, it
may be considered as a thermosensor under such circumstances (Carratù et al., 1996;
Horváth et al., 1998; Shigapova et al., 2005; Vigh and Maresca, 2002). Fever-range
hyperthermia may cause the activation of membrane proteins, e.g. multiple growth
factor receptors, by affecting the membrane microdomain structure and mobility (Park
et al., 2005). In turn, the activation of growth factor receptors may activate the Ras/Rac1
pathway, which has been shown to play a critical role in HSF1 activation and Hsp up-
regulation (Han et al., 2001).
It has been documented that specific alterations in the membrane’s physical state
for prokaryotes and yeasts, can act as an additional stress sensor (Carratù et al., 1996;
Horváth et al., 1998; Shigapova et al., 2005). It was assumed that membrane-controlled
signalling events might exist temporarily if a re-adjustment of the membrane
hyperstructure is completed after stress (Vigh and Maresca, 2002; Vigh et al., 1998).
Here, I furnish the first evidence that chemically-induced perturbations in membranes of
K562 erythroleukemic cells, analogous to heat-induced PM fluidization, are indeed
capable of activating Hsp production even at normal growth temperatures without

70
resulting in measurable protein denaturation. I also demonstrate that, similarly to the
response to HS, after the administration of membrane fluidizers there are prompt
elevations in [Ca2+]i level and mitochondrial membrane potential, ΔΨm,. Thus, it is
highly possible that alterations in the PM fluidity, which is affected considerably by
environmental stress, are well suited for cells to sense stress. In a wider sense, even
subtle changes or defects in the lipid phase of membranes (known to be present under
pathophysiological conditions or during aging) should affect membrane-initiated
signalling processes that lead to a dysregulated stress response.
3.1. MATERIALS AND METHODS
3.1.1. Cell culture
K562 cells were cultured in RPMI-1640 medium supplemented with 10 % FCS and 2
mM glutamine in a humidified 5 % CO2, 95 % air atmosphere at 37 C and routinely
subcultured three times a week.
3.1.2. Membrane fluidity measurements
The PM fraction of K562 cells was isolated, labelled and membrane fluidity was
measured as detailed in Chapter 2.5. When the temperature dependence of fluidity was
followed, the temperature was gradually (0.4 C/min) increased and the anisotropy data
were collected every 30 s.
DPH-labelled membranes were incubated with different concentrations of
heptanol (HE) or BA for 5 min at 37 C, and DPH anisotropy was measured at 37 C.
For in vivo fluidity measurements, K562 cells were labelled with 0.2 μM DPH for
30 min or TMA-DPH for 5 min, (these times are appropriate for the individual probes,
(Kitagawa et al., 1991), and incubated further with BA (0–50 mM) or HE (0–6 mM) for
an additional 5 min. Steady-state fluorescence anisotropy was monitored (Török et al.,
1997).

71
3.1.3. In vivo protein labelling
Cells (1 mL of 106/mL) were treated with various concentrations of BA or HE for 1 h at
different temperatures, as indicated in Figure 3.3. The cells were then washed and
further incubated in serum-completed medium for 3 h at 37 C. Next, the medium was
changed for 1 mL buffer A (1.2 mM CaCl2, 2.7 mM KCl, 1.5 mM KH2PO4, 0.5 mM
MgCl2, 136 mM NaCl, 6.5 mM Na2HPO4, 5 mM D-glucose) containing 10 μL L-[U-14C]-labelled amino acid mixture (mixture of Ala, Arg, Asp, Glu, Gly, His, Ile, Leu,
Lys, Met, Phe, Pro, Ser, Thr, Tyr and Val in water containing 2 % ethanol,
Radiochemical Centre, Amersham, Bucks., UK; product code: CFB25, radioactive
concentration 50 μCi/mL). The cells were incubated for 1 h at 37 C, then harvested and
resuspended in SDS sample buffer. Proteins were separated by SDS polyacrylamide gel
electrophoresis (SDS-PAGE, acrylamide concentration 8 %) and prepared for
fluorography.
In fluorography, radioactively-labelled substances emit radiation that excites a
scintillator molecule (e.g. 2,5-diphenyloxazole, PPO) that is present in the gel. Upon
relaxation to its ground state, the scintillator emits a photon of visible or ultraviolet light
that is detected by an X-ray film at low temperature (−80 °C). For PPO incorporation,
the gel was soaked in acetic acid for 5 min, then in acetic acid containing 20 % (w/v)
PPO for l.5 h. Thereafter the gel was immersed in water containing 5 % glycerol for 30
min, layered over a Whatman 3MM blotting paper (Whatman International Ltd, UK),
covered with plastic foil and dried under vacuum in a gel dryer at 70 °C. Finally, the gel
was exposed to preflashed X-ray film for one week at -80 °C (Skinner and Griswold,
1983). After development, the de novo synthesized proteins could be visualized on the
film. The method allowed the sensitive detection of newly produced Hsp70 following
stress treatments.
3.1.4. Measurement of intracellular free Ca2+ level
Measurement of [Ca2+]i was performed by applying Fura-2 AM (Molecular Probes,
Eugene, USA), a ratiometric dye. The analysis with Fura-2 can usually be performed
over a long period of time without significant loss of fluorescence resulting from either
bleaching or leakage. The acetoxymethyl ester (AM) derivative of Fura-2 is a
membrane-permeant uncharged molecule, therefore it is useful for non-invasive
intracellular loading. Inside the cell, the AM group is hydrolysed by non-specific

72
esterases producing the charged non-membrane-permeant form. Moreover, Fura-2 has a
good selectivity for Ca2+ over other divalent cations (Grynkiewicz et al., 1985).
K562 cells were washed in buffer A and loaded with 5 mM Fura-2 AM
(Molecular Probes, Eugene, USA) at 37 C for 45 min. They were then washed with
buffer A and loaded into the measuring cell at D510 = 0.25 at 37 C and treated with BA
or HE or subjected to 42 C. The fluorescence signal was measured with a PTI
spectrofluorometer (Photon Technology International, Inc., South Brunswick, NJ, USA)
with emission at 510 nm and dual excitation at 340 and 380 nm (slit width 5 nm). The
340/380 nm excitation ratio (Rfl) was directly calculated by the fluorimeter software.
The autofluorescence from the cells not loaded with the dye was subtracted from the
Fura-2 signal. The Fura-2 leakage at 37 C was assessed as in (Khaled et al., 2001).
When the contribution of the [Ca2+]i mobilization was tested, the cells were
resuspended in buffer A without Ca2+, but containing 10 mM ethylene glycol tetraacetic
acid (EGTA). Following the experimental treatment, the Fura-2 responses were
calibrated using the calcium ionophore ionomycin (10 µM) followed by addition of 1
mM CaCl2 to obtain the fluorescence ratio of maximal response, Rmax. Thereafter, 10
mM EGTA was added to yield the Ca2+-independent fluorescence ratio of Fura-2, Rmin.
[Ca2+]i was then calculated according to the formula: [Ca2+]i = Kd [Rfl − Rmin)/(Rmax −
Rfl)], where Kd for Fura-2 = 224 nM (Grynkiewicz et al., 1985).
3.1.5. Measurement of mitochondrial membrane potential ∆Ψm
Lipophilic fluorescent dyes bearing a delocalized positive charge can be used to
measure the membrane potential of the cells because they are membrane permeable and
bind to the membranes with low affinity. Cations are attracted to the negative potential
across the inner mitochondrial membrane, and thus, they accumulate into the
mitochondria in living cells. 5,59,6,69-tetrachloro-1,19,3,39-tetraethyl-
benzimidazolylcarbo-cyanine iodide (JC-1) dye is more specific for mitochondrial
versus PM potential and more consistent in its response to depolarization than some
other cationic dyes such as DiOC6 and rhodamine 123 (Cottet-Rousselle et al., 2011).
JC-1 forms a concentration-dependent fluorescent nematic phase consisting of J-
aggregates. The monomers emit light at 527 nm and J-aggregates at 590 nm (ex= 490
nm). It is known that increasing concentrations of JC-1 above a certain level cause a

73
linear rise in the J-aggregate fluorescence. The intact mitochondria accumulate JC-1
into the matrix with subsequent formation of J-aggregates (Reers et al., 1991).
ΔΨm was analyzed as in Khaled et al. (2001) by using JC-1 (Molecular Probes,
Eugene, USA). K562 cells (0.5 x 10⁶) were incubated with JC-1 (5 μg/mL) during the
last 15 min of any treatment in the dark and were immediately analyzed with a
FACScan flow cytometer (Becton-Dickinson, USA) equipped with a 488 nm argon
laser. Dead cells were excluded by forward and side scatter gating. JC-1 aggregates
were detectable in the FL2 (585 ± 21 nm), and JC-1 monomers were detectable in the
FL1 (530 ± 15 nm) channel. Data on 104 cells per sample were acquired and analyzed
with Cell Quest software. The mean fluorescence intensity of J-aggregates was used to
determine the ΔΨm. Cells treated with carbonyl cyanide p-chlorophenylhydrazone
(CCCP), causing quick mitochondrial membrane depolarization, served as positive
control.
3.1.6. Estimation of the level of in vivo and in vitro protein
denaturation in response to heat stress and membrane
fluidizing alcohols
The heat-induced denaturation of luciferase was described first in 1945 (Johnson et al.,
1945). In order to study the effects of HS on proteins, it was suggested to follow the
activity of exogenous well characterized enzymes (e.g. firefly luciferase) (Nguyen et al.,
1989).
The effects of heat or fluidizer treatment on in vivo protein denaturation were
followed via measurement of the luciferase activity expressed in HeLa cells as in Qian
et al. (2004) using a bioluminescence assay. HeLa cells 5x10⁵/tube were grown in tissue
culture tubes in 10% FCS-supplemented DMEM medium. The cells were incubated at
37 C with 30 mM BA or 4.5 mM HE or at 42 C for 5, 15, 30 and 45 min. Immediately
after treatment, the cells were cooled to 4 C and lysed. A brief wash with ice-cold PBS
was followed by the cell lysis in 0.5 mL of lysis buffer (25 mM H3PO4/Tris, pH 7.8, 10
mM MgCl2, 1 % Triton X-100 (v/v), 15 % glycerol (v/v), 1 mM EDTA) containing
0.5 % 2-mercaptoethanol (v/v). The lysates were kept frozen at −20 °C before
measurement of luciferase activity. Luciferase activities were determined in a Berthold
Lumat 9501 luminometer for 10 s after the addition of substrates (1.25 mM ATP and 87

74
mg/mL luciferin (Sigma) in lysis buffer) (Nguyen and Bensaude, 1994). For
inactivation experiments, the activity before treatment was taken as 100 %.
In vitro protein denaturation was followed using diluted cytosolic fraction of
K562 cells. Cells (5x10⁸) were disrupted by 40 strokes of potter homogenizer in 4 mL
buffer-Cyt containing 50 mM Hepes, 150 mM KCl, 20 mM MgCl2 (pH 7.4). The debris
was removed by pelleting at 1000 g for 5 min. The supernatant was adjusted to 12 mL
and centrifuged in Beckman ultracentrifuge equipped with SW-41 rotor (100,000 g, 40
min ). 250 µL supernatant was mixed with 250 µL buffer-Cyt in the absence or presence
of 60 mM BA (final conc. 30 mM) or 9 mM HE (final conc. 4.5 mM). The test tubes
were incubated at 37 °C or heat treated at 40, 42 or 44 °C for 1 h. The tubes were cooled
on ice for 5 min and centrifuged at 15,000 g for 15 min at 4 °C. The supernatant was
carefully removed and the pellet was redissolved in solubilisation buffer containing 50
mM Tris-HCl (pH 8.0), 5 mM EDTA, 150 mM NaCl, 0.1 % SDS, 1mM dithiothreitol
and 1 % Triton X-100. It should be noted that a small amount of insoluble proteins was
formed during 1 h incubation even at 37 °C. The protein content was determined with
BCA method against the solubilisation buffer (blank). The level of insoluble proteins
after treatments was normalized to the 37 °C control samples.
3.1.7. Electron microscopy
Cells were prepared for electron microscopy according to standard procedures. Briefly,
they were fixed with 4 % paraformaldehyde and 2.5 % glutaraldehyde overnight at 4 oC
then washed in 0.1 M phosphate buffer (pH 7.4) and osmicated in phosphate buffer
containing 1 % OsO4 for 1 h. Following postfixation they were dehydrated and
embedded in Araldite. Ultrathin sections were stained with lead citrate and uranyl
acetate, then viewed with a Zeiss EM 902 electron microscope (Zeiss, Germany).
3.1.8. Statistics
All data are expressed as mean ± SD (standard deviation). Student’s paired t-test
(α = 0.05) with the Bonferroni adjustment was used to compare groups.

75
3.2. RESULTS
3.2.1. Selection of the critical concentrations of membrane
perturbers equipotent in fluidization with temperature
upshifts
It has been proposed that the membrane lipid phase plays a central role in the cellular
responses that take place during pathological states and acute HS (Carratù et al., 1996;
Horváth et al., 1998; Shigapova et al., 2005; Vigh and Maresca, 2002; Vigh et al.,
1998). However, direct correlation between the Hsp response and the membrane
fluidization of the lipid region has not been unambiguously established for mammalian
cells. By intercalating between membrane lipids the two structurally unrelated
membrane fluidizers (BA and HE) induced a disordering effect. This was due to
weakening the van der Vaals interactions between the lipid acyl chains (Shigapova et
al., 2005). As for HS, the initial fluidity elevations caused by these membrane
perturbants were followed by a rapid relaxation period in vivo (see Chapter 5 for more
details). Therefore, isolated membranes were used for detailed comparison and
assessment of the levels of the thermally- and chemically-induced primary alterations in
the membrane physical orders. As demonstrated in Figure 3.1A, the PM fraction of
K562 cells was labelled with DPH and the steady-state fluorescence anisotropy (Carratù
et al., 1996; Horváth et al., 1998; Shigapova et al., 2005) was recorded as a function of
temperature. In parallel, the fluidity changes were monitored at various concentrations
of the two alcohols (Figure 3.1B, C). In such a way, it was possible to determine the
critical concentrations of each of the two fluidizers at which their addition to membrane
isolates resulted in membrane fluidity enhancements identical to that found after a
temperature increase to 42 C. As highlighted by the arrows in Figure 3.1A–C, PM
hyperfluidization resulting from HS at 42 C (i.e. a reduction of the steady-state DPH
anisotropy value by ~ 0.015 units) can be achieved by the addition of 30 mM BA or 4.5
mM HE. The critical concentrations of the membrane perturbers proved to be
essentially equipotent in causing membrane hyperfluidization in vivo (Figure 3.2). The
decrease in the lipid order was monitored in the membrane interior of the K562 cells by
following the DPH anisotropy alteration. The fluidizing effects of the alcohols in the
glycerol and upper acyl regions were also determined using the charged (not membrane
permeable) derivative of DPH, TMA-DPH.

76
Figure 3.1. Heat stress- or membrane fluidizer-induced alterations in isolated PM
fluidity, measured with DPH. Isolated PMs were labelled with DPH and (A) the effects of
heat or (B) different concentrations of BA or HE on the steady-state fluorescence
anisotropy were detected. The arrows show the concentrations of the alcohols that exert a
fluidizing effect equivalent to that caused by exposure to 42 C. Mean ± SD, n = 4.
Figure 3.2. Membrane fluidity measurements in vivo. K562 cells were labelled with 0.2
μM DPH () for 30 min or TMA-DPH () for 5 min, and then further incubated with
various concentrations of BA or HE. The fluorescence steady-state anisotropy was
measured and the differences from the controls were calculated. The arrows indicate the
concentrations of the alcohols at which similar levels of Hsp70 synthesis were detected at
37 C. Mean ± SD, n = 6.
3.2.2. Membrane fluidizers lower the set-point temperature of
Hsp70 synthesis
K562 cells were treated at various temperatures in the presence or absence of different
concentrations of BA or HE for 60 min. After a 3-h recovery period at 37 C, the cells
were labelled with a 14C amino acid mixture for 60 min to follow the de novo

77
synthesized Hsp70 level. Co-treatment of the cells with BA or HE during HS resulted in
a temperature- and dose-dependent Hsp70 synthesis (Figure 3.3). Apparently, the
gradual temperature rise shifted the peak of HSR towards the lower alcohol
concentration range. It indicates a cooperative triggering mechanism in the induction of
Hsp70 synthesis. The maximum responses at 37 C were obtained by the administration
of 4.5 mM HE or 30 mM BA. These critical fluidizer concentrations were exactly those
that resulted in identical PM fluidization levels in vitro and in vivo (Figures 3.1 and 3.2).
In other words, the increase in the PM fluidity as a result either of heat treatment or of
chemical perturbations was followed equally by Hsp induction. Similarly to HS, higher
doses of BA or HE caused a complete inhibition of protein synthesis. Thus, at 42 C the
highest tolerable concentrations of BA and HE were only 10 and 2 mM, respectively.
Figure 3.3. Hsp70 induction in K562 cells treated with BA or HE and subjected to HS.
Cells were treated with different concentrations of BA or HE for 1 h at various
temperatures. After a 3 h recovery period, the cells were labelled for 1 h with L-[U-14C]-
labelled amino acid mixture and, after SDS-PAGE, prepared for fluorography. The Hsp70
lane of the fluorograph is shown. The arrows indicate the most effective concentrations of
the alcohols at 37 C.
3.2.3. Effects of heat and membrane fluidizers on the cellular
morphology and the cytosolic free Ca2+ level
It is known that HS induces distinct morphological alterations in mammalian cells
(Welch and Suhan, 1985). In the present study, by the use of electron microscopy, a
moderate membrane blebbing was revealed when K562 cells were incubated with 30
mm BA or 4.5 mm HE or heat shocked at 42 C for 1 h (Figure 3.4). However, no major
changes were observed in the ultrastructure of cells after these treatments (Figure 3.4.).

78
Figure 3.4. Representative transmission electron microscopy images of K562 cells
subjected to various stresses for 1 h (42 °C, 30 mM BA or 4.5 mM HE) or left untreated.
It is known that the [Ca2+]i concentration is a tightly regulated key signalling
element of the HSR in mammalian cells. Though it was found that an increase in [Ca2+]i
promoted the synthesis of Hsp70, the overexpression of Hsp70 attenuated [Ca2+]i
elevations (Kiang et al., 1994; Kiang et al., 1998). It was earlier documented that
membrane fluidizer anaesthetics may displace Ca2+ from external and internal binding
sites and modulate the functioning of different Ca2+ regulatory systems (Grant and
Acosta, 1994; Kültz, 2005). Therefore, changes in [Ca2+]i after the addition of the
membrane fluidizer alcohols were monitored in a dose-dependent manner in order to
compare the findings with the [Ca2+]i increase as a result of HS. Cells were treated with
these alcohols (at concentrations equipotent in membrane fluidization and in the
induction of Hsp70) and Fura-2 fluorescence was continuously monitored. It was found
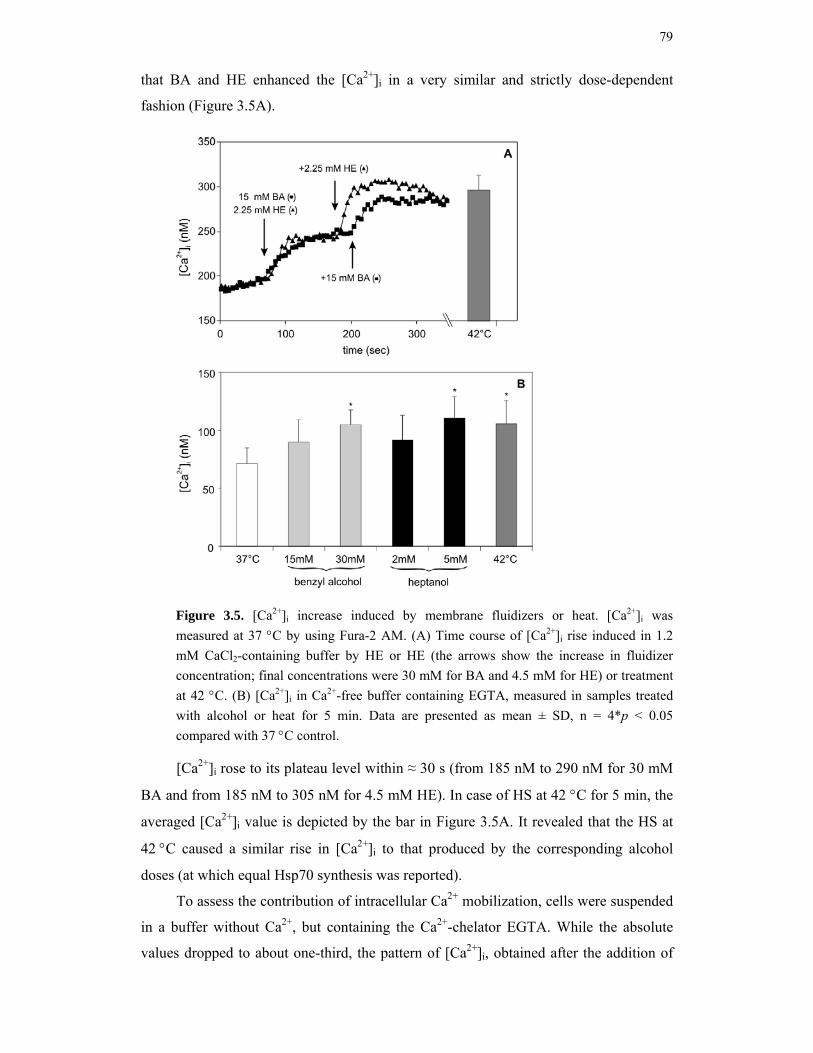
79
that BA and HE enhanced the [Ca2+]i in a very similar and strictly dose-dependent
fashion (Figure 3.5A).
Figure 3.5. [Ca2+]i increase induced by membrane fluidizers or heat. [Ca2+]i was
measured at 37 C by using Fura-2 AM. (A) Time course of [Ca2+]i rise induced in 1.2
mM CaCl2-containing buffer by HE or HE (the arrows show the increase in fluidizer
concentration; final concentrations were 30 mM for BA and 4.5 mM for HE) or treatment
at 42 C. (B) [Ca2+]i in Ca2+-free buffer containing EGTA, measured in samples treated
with alcohol or heat for 5 min. Data are presented as mean ± SD, n = 4*p < 0.05
compared with 37 C control.
[Ca2+]i rose to its plateau level within ≈ 30 s (from 185 nM to 290 nM for 30 mM
BA and from 185 nM to 305 nM for 4.5 mM HE). In case of HS at 42 C for 5 min, the
averaged [Ca2+]i value is depicted by the bar in Figure 3.5A. It revealed that the HS at
42 C caused a similar rise in [Ca2+]i to that produced by the corresponding alcohol
doses (at which equal Hsp70 synthesis was reported).
To assess the contribution of intracellular Ca2+ mobilization, cells were suspended
in a buffer without Ca2+, but containing the Ca2+-chelator EGTA. While the absolute
values dropped to about one-third, the pattern of [Ca2+]i, obtained after the addition of

80
membrane fluidizers or HS, was not affected by the depletion of external Ca2+ (Figure
3.5B).
3.2.4. The effects of membrane fluidizers and heat stress on
mitochondrial membrane potential (∆Ψm)
It is known that an [Ca2+]i overload (together with several other stimuli) is able to elicit
structural and functional alterations in the mitochondria. Therefore, it was examined
whether the strikingly similar alterations in [Ca2+]i – seen after membrane
hyperfluidization elicited either by HS or by equipotent membrane fluidizers – were
paralleled by similar tendencies in changes in ΔΨm. A two-dimensional display of JC-1
red vs. green fluorescence demonstrates the changes in ΔΨm that took place following
membrane perturbations (Figure 3.6A). A higher intensity of red fluorescence is
assumed to indicate a higher ΔΨm (hyperpolarization). Cells treated with CCCP served
as methodological control for mitochondrial depolarization. Figure 3.6B shows
histograms in which ΔΨm (detected via the J-aggregate fluorescence) is plotted against
the number of cells. For HS at 42 C and fluidizer treatments – besides the equal extent
of membrane hyperfluidization together with identical degrees of Hsp70 induction –,
very similar increases in ΔΨm were observed. The quantification of ΔΨm in response to
gradually increasing heat and increasing concentrations of membrane fluidizers is
displayed in Figure 3.7. Both membrane hyperfluidization with these alcohols and HS
led to the closely similar extent of mitochondrial hyperpolarization.

81
Figure 3.6. Analysis of mitochondrial membrane potential of K562 cells by flow
cytometry. Cells were left untreated or treated with BA, heat or CCCP for 1 h as
indicated. Cells were then stained with JC-1 and assayed by flow cytometry. (A) Dot
plots of JC-1 red fluorescence vs. green fluorescence. (B) Corresponding histograms in
which the J-aggregate fluorescence is plotted against the number of cells.

82
Figure 3.7. Quantitative changes in ΔΨm caused by gradually increasing HS or increasing
membrane fluidizer concentrations. Cell were treated with BA, HE or subjected to HS for
1 h as indicated. The samples were analyzed as in Figure 3.5. The mean fluorescence
intensity of J-aggregates was used to determine the ΔΨm. Mean ± SD, n = 4, *p < 0.05
compared with control.
3.2.5. The chemical membrane fluidizers exert no measurable
effect on protein denaturation
HS can inactivate the firefly luciferase when it is expressed in mammalian cells. The
loss of enzymatic activity correlates with the loss of its solubility and can be considered
as a direct evidence of protein denaturation. This method served as a sensitive tool for
testing the proteotoxicity of Hsp-inducing compounds (Török et al., 2003). In the
present study, HeLa cells expressing cytoplasmic firefly luciferase were used. The
presence of either 30 mM BA or 4.5 mM HE did not exert a significant effect on
luciferase activity when the cells were tested at their growth temperature. However, the
loss of enzyme activity was observed in cells exposed to 42 C (Figure 3.8). The same
tendency was noticed in an in vitro protein denaturation assay using lysates of K562
cells (Figure 3.9).

83
Figure 3.8. In vivo protein denaturation assay. The effects of BA, HE or HS treatment on
protein denaturation were followed by measurement of the cytosolic luciferase activity
expressed in HeLa cells. Cells were treated with 30 mM BA (), 4.5 mM HE () or
submitted to HS at 42 C (). At different time points cells were lysed and analyzed for
luciferase activity. Enzyme activity of cells before treatment was taken as 100 %. Data
are presented as mean ± SD, n = 3.
0
2
4
6
8
10
12
37 °C 30mM BA 4.5 mM HE 40 °C 42 °C 44 °C
den
atu
red
pro
tein
co
nte
nt
(a.u
.)
Figure 3.9. In vitro protein denaturation assay. The effects of BA, HE or HS on protein
denaturation were followed by measurement of insoluble protein content in the cytosolic
fraction of K562 cells. Cells were left untreated at 37 °C or treated with 30 mM BA, 4.5
mM HE or submitted to HS at 40 C, 42 C or 44 C for 1 h. The level of insoluble
proteins after treatments was normalized to the 37 °C control samples. Data are presented
as mean ± SD, n = 3.
3.3. DISCUSSION
In spite of that the importance of Hsps in the pathogenesis of several diseases is well
established, our knowledge about stress sensing and signalling that lead eventually to an
altered Hsp expression is still very limited (Pockley, 2001). According to an early

84
observation the majority of the stressors and agents with the ability to induce Hsps
proved to be proteotoxic. This finding gave rise to the suggestion that protein
denaturation may be the sole initiating signal for the activation of hsp genes (Hightower
and White, 1981).
In the course of the present study, K562 cells were treated with BA or HE at
concentrations that induce a HSR at the normal growth temperature, as highlighted by
monitoring of the synthesis of one of the major Hsps, Hsp70. The critical concentrations
of the membrane fluidizers were determined so that their addition to the cells resulted in
identical increases in the PM fluidity level as it was found after HS at 42 C. It has been
demonstrated that, independently on the origin of the membrane perturbations, the
formation of isofluid membrane states is accompanied by an essentially identical HSR
in K562 cells. HS at 42 C or the addition of 30 mM BA or 4.5 mM HE (which are
structurally distant compounds) proved equally effective in the up-regulation of Hsp70
production.
At the cellular level Ca2+ is derived from internal and external sources. It is
proposed that the mechanism by which the fluidizer alcohols and HS altered the Ca2+
homeostasis resulted from their action on Na+/Ca2+ exchangers and subsequent Ca2+
mobilization from different intracellular Ca2+ pools (Kiang et al., 1998). Furthermore,
lipid rearrangement can induce alterations in membrane permeability, and the altered
activity of mechanosensitive ion channels during stress may also promote Ca2+ influx
into the cytosol (Kültz, 2005). In parallel with the induction of Hsp synthesis, HS and
the membrane fluidizer treatments elicited nearly identical rises in [Ca2+]i both in Ca2+-
containing and in Ca2+-free media. It is suggested that the elevation in [Ca2+]i, that
occurs as a response to HS, is due to the release of the Ca2+-regulatory compound IP3
following phosphoinositide-specific PLC activation (Calderwood and Stevenson, 1993).
The co-stimulation of phospholipases such as PLA2 and PLC by HS and the resultant
release of lipid mediators could enhance the subsequent membrane association and
activation of PKC. In turn, PKC activation can drive the phosphorylation of HSFs (see
Chapter 1). In separate studies, elevation in [Ca2+]i not only stimulated HSF1
translocation into the nucleus, resulting in Hsp70 expression (Ding et al., 1996), but
proved to be essential for the multistep activation of HSFs (Price and Calderwood,
1991). Similarly to the results obtained in this study, a sudden [Ca2+]i rise and an in vivo
alteration in membrane lipid order after the addition of the calcium ionophore
ionomycin have been reported. It was paralleled with the activation of stress-activated

85
protein kinase, increased HSF–HSE interaction and elevated Hsp70 synthesis (Sreedhar
and Srinivas, 2002).
[Ca2+]i overload elicited by phospholipase activation (or by other mechanisms) is
known to cause structural and functional alterations in the mitochondria. In severe cases
these include swelling, the disruption of electron transport, mitochondrial
depolarization, and the opening of mitochondrial membrane permeability transition
pores (Qian et al., 2004). However, from recent papers it became clear that the change
in ΔΨm during cellular attack is not associated exclusively with apoptosis and exhibits a
severity-dependent biphasic profile. Instead, mitochondrial hyperpolarization may
represent an early and reversible switch in cellular signalling acting as one of the major
checkpoints of cell death pathway selection (Perl et al., 2004; Zaragoza et al., 2001). It
is important to note that mitochondrial hyperpolarization, when developed e.g. due to
the Ca2+overload-activated dephosphorylation of cytochrome c oxidase, was suggested
to be a cause of subsequent reactive oxygen species production (Perl et al., 2004). The
latter are required to promote the transcriptional activation of the NF-κB pathway
leading to a cellular adaptive response that includes proliferation and Bcl-xL-mediated
resistance to apoptosis. It was demonstrated recently that, after HS, NF-κB controls the
selective removal of misfolded or aggregated proteins via modulating the BAG3-HspB8
complex (Nivon et al., 2012). In accordance with these findings, it was documented in
this work that the increase in ΔΨm may serve as a key event in the stress signalling of
K562 cells without causing any sign of apoptosis. An example of the delicate
interrelationship between changes in ΔΨm and HSR is that, disruption of HSF1, while
resulting in a reduced Hsp expression, led to elevated ΔΨm in renal cells (Yan et al.,
2005). On the other hand, the overproduction of Hsp70 by HS prevented the H2O2-
induced decline in mitochondrial permeability transition and the swelling of the
mitochondria (Yan et al., 2005).
Previous reports on the regulation of the HSR in different prokaryotic model
systems showed that the threshold temperature for activation of the major hs genes was
significantly lowered by BA treatment (Horváth et al., 1998; Shigapova et al., 2005).
BA stress activated the entire set of hs genes when the solubility of the most
aggregation-prone protein homoserine trans-succinylase was tested, but it failed to
cause in vivo protein denaturation in Escherichia coli (Shigapova et al., 2005). The Hsp
co-inducer bimoclomol and its derivatives, just like other chaperone inducers and co-
inducers, appear to be non-proteotoxic (Qian et al., 2004; Sachidhanandam et al., 2003;
Vigh et al., 1997; Yan et al., 2004). It has been proposed that bimoclomol and related

86
compounds interact specifically with acidic membrane lipids, thereby modifying those
membrane domains where the thermally- or chemically-induced perturbation of the lipid
phase is sensed and transduced into a cellular signal, leading to elevated hsp gene
activation (Qian et al., 2004). In the present study, the effects of BA and HE on protein
stability at non-HS temperatures were tested via the heat-induced inactivation of
heterologously expressed cytoplasmic firefly luciferase in HeLa cells. Neither of the
fluidizers exerted measurable effect on protein denaturation. To summarise, the above
facts lend further support to the view that, in addition to the formation of denatured
proteins, changes in the lipid phase of cell membranes, alone or together with
consequent changes in [Ca2+]i and ΔΨm, may participate in the sensing and transduction
of environmental stress into a cellular signal.
It has been documented that shear stress-induced fluidity alterations in endothelial
cells are sufficient to initiate signal transduction (Butler et al., 2002), i.e. alterations in
PM lipid dynamics can serve as a link between chemical signalling and mechanical
force. Indeed, BA was able to mimic the effect of step-shear stress by enhancing ERK
and JNK activities. On the other hand, the membrane fluidity reduction by Chol
administration resulted in diminished activities of both MAPKs. This finding was
attributed to the effect of membrane rigidification on the dynamics of microdomains and
subsequent signalling events. Cell activation by shear stress is hypothesized to occur via
the lipid modification of integral and peripheral membrane proteins, or signalling
complexes organized in Chol-rich microdomains (rafts, focal adhesions, caveoli, etc.,
see Vereb et al., 2003). Moreover, the phospholipid bilayer was capable of mediating
shear stress-induced activation of membrane-bound G proteins, even in the absence of
G protein receptors, by changing the physical properties and composition of lipids
(Gudi et al., 1998).
The mechanisms highlighted above possibly operate in the present case as well.
The heat-induced activation of kinases such as Akt has been reported to increase HSF1
activity. Enhanced Ras maturation by HS was associated with an increase in ERK
activation, a key mediator of both mitogenic and stress signalling pathways in response
to subsequent growth factor stimulation (Shack et al., 1999). Due to the importance of
the PM in linking growth factor receptor activation to the signalling cascade, it is
conceivable that any modulation in surface membrane fluidity could significantly
influence ERK activation. Indeed, ERK activation in aged hepatocytes was reduced in
response to either stressful treatments or proliferative stimuli (Guyton et al., 1998). The
level of membrane-associated PKC was also diminished in elderly, hypertensive

87
subjects (Escribá et al., 2003). It is suggested that this effect is strictly controlled by
age-related fluidity changes and the polymorphic phase state of the membranes (Escribá
et al., 2003). Thus, strategies aimed at changing the membrane’s physical state can be
useful to elevate the stress responsiveness in aging cells or under disease conditions
such as diabetes, where reduced Hsp levels are causally linked to less fluid, stiffer
membranes (Hooper and Hooper, 2005).
Finally, heat and other types of stress are associated not only with changes in the
fluidity, permeability, tension or surface charges of membranes, and in protein and lipid
rearrangements, but are also coupled with the production of lipid peroxides and lipid
adducts (Garbe and Yukawa, 2001). It may be noted that 4-hydroxynonenal, a highly
reactive end-product of lipid peroxidation, is an Hsp inducer. It has been proposed to
play a significant role in the initial phase of stress-mediated signalling in K562 cells
(Cheng et al., 2001).
In conclusion, our results strongly indicate that mammalian cell membranes play a
critical role in thermal sensing as well as signalling. The exact mechanism of the
perception of membrane stress imposed on K562 cells by BA and HE, coupled with the
activation of Hsp expression, awaits further studies. It is reasonable to suggest that
changes in the compositions of particular lipid molecular species involved directly in
lipid–protein interactions (Vigh and Maresca, 2002; Vigh et al., 1998), the appearance
of specific microdomains (Vereb et al., 2003) with an abnormal hyperfluid state or
locally formed non-bilayer structures (Escribá et al., 2003), rather than the overall
changes in the physical state of membranes, are potentially all equally able to mediate a
stimuli for the activation of hs genes (Vigh et al., 2005). Very recently a new
technology was developed for the direct imaging of PMs of life cells by single molecule
microscopy. In the resting state, Chol-dependent homo-association of fluorescent raft
markers in the PM of intact CHO and Jurkat T cells was detected, thereby
demonstrating the existence of small, mobile, long-lived platforms containing these
probes. Furthermore, it was demonstrated that during fever-type HS, which caused
Hsp27 induction, the homo-association of the raft markers disappeared in the PM. It
revealed, in fact, the role of microdomain reorganization during HSR (Brameshuber et
al., 2010).

88
CHAPTER 4. MEMBRANE CHANGES DURING EARLY
STRESS RESPONSES IN A MURINE MELANOMA CELL
LINE
I would like to acknowledge the work performed by Enikő Nagy (under my supervision)
concerning the stress response of B16 cells (RT-PCR and domain size analysis together
with Imre Gombos). These experiments have been included within the introductory
section, and experimental details have been incorporated into the Materials and methods
section of this chapter. All experiments, evaluation and statistical analysis were
performed by myself, with the following exceptions: Cell culturing and stress treatments
were done in collaboration with Enikő Nagy and Andriy Maslyanko. Measurements for
GC-MS analysis and TLC lipid class separations were performed in collaboration with
Mária Péter. ESI-MS analysis was carried out with the help of Gerhard Liebisch in the
laboratory of Gerd Schmitz in Regensburg. Data evaluation was performed in
collaboration with Gerhard Liebisch and Mária Péter. Zsolt Török, Sándor Benkő and
Ibolya Horváth took valuable part in the interpretation of results. The paper published
from that research was written by myself and Mária Péter, and critically reviewed by
László Vígh, Ibolya Horváth and John L. Harwood. The contribution of all co-authors is
gratefully acknowledged.
Recent data show that most anticancer agents provoke apoptosis through changes of
membrane fluidity of tumour cells (Baritaki et al., 2007). Numerous potential
therapeutic applications, including hyperthermia, directed at such fluidity have been
suggested (Baritaki et al., 2007; Grimm et al., 2009; Issels, 2008). Hsps were first
identified as stress proteins that confer resistance to environmental stresses such as
temperature elevation in all cellular organisms. Elevated Hsp expression promotes
cancer by inhibiting the major known apoptosis pathways (Calderwood and Ciocca,
2008) or autophagy (Kirkegaard et al., 2010) and causes resistance to heat-
(thermotolerance) or chemotherapy. Therefore, it would be desirable not to increase the
intracellular level of Hsps in cancer cells when attempting different antitumour
treatments. In contrast, the upregulation of the surface expression of Hsps has been
demonstrated to enhance immunogenicity of tumour cells (Horváth et al., 2008). In
addition, mild HS may confer radiosensitization of cancer cells probably through effects
on membrane structure (Grimm et al., 2009). In this investigation B16(F10) cells (which
are a highly metastatic cancer cell line) were used, in order to clarify the role of
membrane lipids in this dichotomic feature of thermal stress.
It has been suggested that, during abrupt temperature fluctuations, membranes
represent the most thermally-sensitive macromolecular structures (Morenilla-Palao et
al., 2009; Yatvin and Cramp, 1993). Thus, alterations in the physical state of

89
membranes of Synechocystis, E. coli or yeast (Carratù et al., 1996; Horváth et al., 1998;
Shigapova et al., 2005) have been reported to affect essentially the temperature-induced
expression of hsp genes. Opposite alterations in membrane fluidity mimic HS or cold
activation of different plant MAPK pathways (Sangwan et al., 2002). When
Saccharomyces cerevisiae was exposed to increased temperatures in the presence of
alcohols, the amount of alcohol required decreased as its hydrophobicity increased and
the temperature needed for the maximal activation of the hsp promoter was diminished
(Curran and Khalawan, 1994). In the moss Physcomitrella patens it was published that
early sensing of mild temperature elevations took place at the PM independently on
cytosolic protein unfolding. The heat signal was translated into an effective HSR by a
specific membrane-regulated Ca2+ influx, and led to thermotolerance (Saidi et al.,
2009b). An abrupt H2O2 burst occurred in tobacco BY2 cells in response to membrane
fluidity increases. It could be triggered by treatment of cells with BA or by HS. This
induction of H2O2 production was required for the synthesis of sHsps in plants
(Königshofer et al., 2008).
In Chapter 3 it has been demonstrated that, irrespective of the origin of membrane
perturbations, the formation of isofluid membrane states was accompanied by an
essentially identical HSR in K562 cells. The addition of 30 mM BA or HS at 42 C was
found to be evenly effective in the up-regulation of Hsp70 production. The fluidity
increase of isolated membranes after BA treatment was identical to that seen during a
thermal upshift to 42 C. The different stressors induced a rapid rise in [Ca2+]i and
caused mitochondrial hyperpolarization to a similar extent as well (Balogh et al., 2005).
However, the precise mechanism of BA-induced stress protein signalling through
membrane perturbation remained unresolved.
It was shown that several membrane intercalators possessing a small polar
headgroup as a common denominator, such as Cer(18:1/16:0) or hexadecanol (Alanko
et al., 2005), not only gave rise to bulk membrane hyperfluidization but also possessed
the ability to displace Chol from pre-existing Chol/SM microdomains. It is noteworthy
that a membrane intercalator molecule such as deoxycholic acid was also found to
activate raft-associated growth factor receptors in a ligand-independent manner (Jean-
Louis et al., 2006). Overall, the importance of Chol as a key component of the
regulation of signal transduction through membrane lipid-ordered microdomains is well
established (Vigh et al., 2007a; Zeyda and Stulnig, 2006).
In order to learn more about the details of the mechanism of action of BA and HS,
the induction of hs genes due to stress treatments was followed in B16 cells. To assess

90
the initial expression changes, the mRNA levels of hsp70, hsp25, B-crystallin, hsp90,
and hsp105 were determined immediately after exposure of cells to increasing
concentrations of BA (35–46 mM) or subject to heat (41 °C or 42 °C) (Figure 4.1). BA
treatment resulted in elevation in the levels of hsp70 and hsp25 mRNAs, which peaked
at 40 mM. The hsp70 amount was higher than that of hsp25 in BA-treated cells. It was
in contrast to that seen after mild heat exposure at 41 °C (i.e., less hsp70 than hsp25).
Interestingly, the expressions of other hsp family members were not enhanced in the
BA-treated samples under the same conditions. Overall, the membrane fluidizer BA
induced a distinct HSR at the growth temperature, which manifested by increases of
mRNA levels of only two hsp classes.
Figure 4.1. Effects of BA on hsp gene mRNA levels. B16(F10) cells were left untreated
(37 °C) or treated with BA at the indicated concentrations or exposed to heat for 1 h. Hsp
mRNA levels were followed immediately after the treatments by quantitative real-time
RT-PCR. The amounts of hsp70, hsp25, hsp105, B-crystallin, and hsp90 mRNAs were
determined and normalized to 103 β-actin. The data are shown as mean ± SEM, n = 3–15,
*p < 0.05 compared with control as analyzed by Student’s unpaired t-test with the
Bonferroni adjustment.
In parallel, possible rearrangements of membrane microdomains were recorded. It
was recently shown that a non-toxic fluorescent probe, fluorescein ester of polyethylene
glycol-derivatized cholesterol (fPEG-Chol), specifically recognizes sterol-rich
membrane domains and is co-localized with various raft markers (Sato et al., 2004).
Unlike filipin and other Chol probes, this agent could be added as an aqueous dispersion
to various samples. When applied for intact mammalian cells, fPEG-Chol was
distributed only in the outer PM leaflet (Sato et al., 2004). Therefore, it was expected
that the monitoring of fPEG-Chol-labelled structures may provide information about the
alterations in the dynamics of Chol-rich domains in B16 cells due to different stress
conditions. B16(F10) cells treated with 40 mM BA, or exposed to HS (41 or 43 °C)
were incubated with fPEG-Chol, and the labelled ‘spots’ were visualized by confocal
microscopy. The detected domains were separated into six classes on a diameter basis
(Figure 4.2).

91
When the cells were exposed to heat, a characteristic rearrangement of the
membrane microdomains was observed (Figure 4.2). In response to more severe HS
(43 °C), the number of smaller domains decreased, while the larger domains piled up.
The amplitude of the effects observed was proportional to the temperature: the effect of
mild heat (41 °C) showed the same tendency, however, these changes were not
significant. A very similar result was seen after the addition of BA, with the exception
of a domain classified into the range 1100–1900 nm, where BA promoted an obviously
larger elevation. In other words, equally to severe HS, the Chol-rich surface membrane
microdomains fused into larger platforms upon the administration of BA.
0
5
10
15
20
25
30
<400 400-500 500-700 700-1100 1100-1900 >1900
domain size categories (nm)
% o
f to
tal d
om
ain
nu
mb
er
37 °C41 °C43 °CBA
Figure 4.2. Redistribution of Chol-rich membrane domains on the surface of B16(F10)
cells monitored by fluorescence microscopy. Cells were left untreated at 37 °C, heat-
stressed at 41 °C or 43 °C or treated with 40 mM BA for 1 h. They were then labelled
with fPEG-Chol for 20 min and imaged. The domain size distribution was determined.
The data shown are mean values ± SEM, n = 3. Samples treated at 43 °C and with BA
differed from the control (37 °C) significantly (p < 0.05) as analyzed by the Kolmogorov–
Smirnov test (for details see Materials and methods).
These results suggest that a distinct reorganization of Chol-rich microdomains
may also be required for the generation and transmission of sufficient stress signals to
activate hsp genes. Furthermore, it is reasonable to propose that the mode of action of
the Hsp inducer BA may be analogous to shear stress. Hemodynamic shear stress, an

92
important determinant of vascular remodelling and atherogenesis, was able to enhance
Hsp expression under isothermal conditions in response to balloon angioplasty, acute
hypertension or advanced lesions of atherosclerosis. The Hsp70 expression induced by
mechanical stress has been shown to be regulated by the small G proteins Ras and Rac
through PI3K (Xu et al., 2000). Active Rac1 can bind preferentially to Chol-rich
membranes. The binding step is determined specifically by the physical state and
composition of membrane lipids (del Pozo et al., 2004). Analogously, moderate HS
induced membrane translocation of Rac1 and membrane ruffling in a Rac1-dependent
manner, in parallel with the activation of HSF1 and an increased Hsp expression (Han et
al., 2001).
The above described data fully supported the paradigm shift toward the
“membrane sensor” hypothesis that membranes can act as temperature sensors (Escribá
et al., 2008; Vigh et al., 2005; Vigh et al., 2007a; Vigh et al., 2007b). It is well
established that numerous lipid mediators released following different stresses can serve
as stress-response modulating factors. Thus, HS induced elevations in inositol
phosphate levels which were comparable in magnitude to those achieved after
stimulation with growth factors. It indicates that HS might initiate transmembrane
signalling cascades with potential importance in cellular regulation (Calderwood and
Stevenson, 1993). Common cellular responses to growth factors and heat include
feedback modulation of PLC by its products and the parallel stimulation of PLA2
activity (Calderwood et al., 1993).
It was reported that extracellular exposure of HeLa cells to AA induced hs gene
transcription in a dose-dependent manner via acquisition of phosphorylation and DNA-
binding activity of HSF1. Moreover, addition of AA in low concentrations to the cells
lowered the temperature threshold for HSF1 activation showing that increased hs gene
expression can be a direct consequence of an AA-mediated cellular response (Jurivich et
al., 1994).
This part of my thesis work was aimed at systematically mapping the lipid
changes after membrane perturbation elicited by heat or fluidizer treatment in order to
identify any novel lipid alterations during the initial phase of the stress response. These
data can highlight the possible links between different microdomain reorganizational
and lipid compositional changes in membranes that lead to the generation of stress
signals.

93
4.1. MATERIALS AND METHODS
4.1.1. Materials
Methyl arachidonyl fluorophosphonate (MAFP), U-73122, tetrahydrolipstatin (THL,
also referred to as orlistat), RPMI-1640 medium and Hanks' balanced salt solution were
purchased from Sigma (Steinheim, Germany). Calcein AM was from Molecular Probes
(Eugene, OR, USA), 1-palmitoyl-2-[1-14C]oleoyl-phosphatidylcholine was from
DuPont NEN Research Products (Boston, USA) and the Flo Scint II scintillation
cocktail was from PerkinElmer (Waltham, Massachusetts, USA). Lipid standards were
obtained from Avanti Polar Lipids (Alabaster, AL, USA). fPEG-Chol (Sato et al., 2004)
was a generous gift from Toshihide Kobayashi (RIKEN Discovery Research Institute,
Saitama, Japan). The solvents used for extraction and for mass spectrometric analyses
were of gas or liquid chromatographic grade and BA of analytical grade was from
Merck (Darmstadt, Germany). All other chemicals were purchased from Sigma and
were of the best available grade.
4.1.2. Inhibitors
The inhibitors were dissolved in ethanol in the mM concentration range and kept at
−80 °C. Upon usage this solution was added to the serum-free medium so that the final
inhibitor concentrations were 10 μM for MAFP, 30 μM for THL and 5 μM for U-73122.
The final concentration of ethanol was 0.1 % or less and this concentration had no
detectable effect on growth or metabolism.
4.1.3. Cell culturing and treatments
B16(F10) (ATCC CRL-6475) mouse melanoma cells were cultured in RPMI-1640
medium supplemented with 10 % (v/v) fetal bovine serum and 4 mM L-glutamine at
37 ºC. Cells were plated in 3x10⁶ cell number/10 cm plate and grown additionally for 1
day. For ESI-MS studies, the cells were treated in the plates. Thus, for HS experiments,
the plates were immersed in a water bath set to the indicated temperature (0.1 °C). For
BA treatments, the growth medium was changed to fresh growth medium containing 40
mM BA. After 1 h, the cells were scraped into 2 mL ice-cold water and extracted. To

94
measure AA release, the cells were first scraped, resuspended in 12 mL serum-free
medium containing 0.5 % FA-free BSA and treated by BA or heat as above. At the
indicated time points, 2 mL aliquots (about 3x10⁶ cells) were taken out and immediately
extracted. For inhibitor studies, the cells were resuspended in a small amount of serum-
free medium, divided into equal parts (6x10⁶ cells/experiment), diluted to 2 mL with
serum-free medium containing the inhibitor at the appropriate concentration and
incubated at 37 ºC. After 20 min, 2 mL serum-free medium containing the inhibitor (at
the appropriate concentration with 1 % FA-free BSA) was added to the reaction flasks
to control and heat-shocked samples and, for BA treatments, the medium contained
additional BA to a final concentration of 40 mM. The treatments were applied for 60
min. The reactions were stopped by placing the flasks on ice and the reaction mixture
was immediately extracted for lipids.
Because it has been observed that culture conditions (e.g. serum quantity, cell
number) affect lipid metabolism and composition in B16 cells, very careful attention
was paid to the above conditions and cells were cultured only for a few passages.
Independently-grown samples were used as replicates.
4.1.4. Lipid extraction
Lipids were extracted according to a modified Folch procedure (Folch et al., 1957).
Briefly, to 2 mL portions of cell suspensions in water or serum-free medium, 5 mL
methanol (containing 0.001 % butylated hydroxytoluene as antioxidant) and 2.5 mL
chloroform were added to form one phase (chloroform:methanol:water (1:2:0.8, by
vol.)). The mixture was left at room temperature for 1 h with periodical vortexing. 7.5
mL chloroform and 1.75 mL 0.2 M KCl were then added for phase separation to occur
(final composition of chloroform:methanol:water (2:1:0.75, by vol.)). After vortexing,
the sample was centrifuged at 600 g for 10 min and the lower chloroform phase,
containing lipids, was evaporated and the residue was redissolved in
chloroform:methanol (2:1, by vol.).
4.1.5. GC-MS analysis of lipid classes
Qualitative and quantitative analyses of total lipid extracts for further ESI-MS studies
were carried out by a gas chromatography-mass spectrometry (GC-MS) system
(GCMS-QP2010, Shimadzu) equipped with a BPX-70 capillary column (10m x 0.1 mm

95
ID, 0.2 μm film thickness). One tenth of the extracts was methylated in 1 mL 5 % acetyl
chloride in methanol at 80 °C for 2 h in the presence of C15:0 fatty acid (FA) as internal
standard. The resulting fatty acid methyl esters (FAME) were extracted with hexane, the
solvent was evaporated and the residue redissolved in 50 µL benzene. A 1 µL aliquot
was injected onto the column maintained at 150 °C for 2 min, programmed at 6 °C/min
to 215 °C, then at 20 °C/min to 235 °C and maintained isothermally for 2 min.
Identification and calibration of FAMEs was made by comparison with authentic
standards and confirmed with NIST (National Institute of Standards and Technology,
Gaithersburg, MD 20899-8380 USA) MS library spectra.
For AA release and inhibitor studies, the extracted lipids were separated on
Kieselgel 60 silica gel TLC plates (20 x 20 cm, Merck) using hexane:diethylether:acetic
acid (50:50:2, by vol.). The main lipid classes were identified using authentic standards
and visualized with 8-anilino-naphtalene-1-sulfonate (0.05 % in methanol) under UV.
For the spots of interest (i.e. total polar lipid fraction (TPL), diacylglycerol (DAG),
monoacylglycerol (MAG) and free (non-esterified) fatty acid (FFA)), a known amount
of C15:0 FFA was added as an internal standard for quantitation. The spots were
scraped and the scrapings were directly methylated and analyzed as above. Phospholipid
class analyses were carried out similarly except that the lipids were separated using
chloroform:methanol:glacial acetic acid:water (60:40:2:2, by vol.).
Quantitative analysis of MAG was carried out by silylation in the presence of
C15:0 FFA as internal standard. MAG was recovered from the TLC plates by adding 1
mL chloroform:methanol (1:1, by vol.) to the scrapings. After centrifugation the
supernatant was evaporated, the residue redissolved in 50 µL benzene followed by
addition of 5 µL N,O-bis(trimethylsilyl)acetamide and kept at room temperature for an
hour. A 1 µL aliquot of the resulting trimethylsilyl ether derivative of MAG was
injected onto a BPX-1 capillary column (10m x 0.1mm x 0.1μm film thickness)
programmed at 15 °C/min from 150 to 320 °C, and maintained isothermally for 3 min.
Identification of MAG species was made on the base of spectra presented in (Isidorov et
al., 2007). Quantitation was calibrated in the presence of an authentic MAG (1-18:0-
MAG) standard.
Both the methyl esters and silyl ether derivatives were analyzed on GC-MS by
using the selected ion monitoring mode in order to obtain more precise and reliable
data. In this method, instead of detection of total ion chromatograms, a limited number
of fragment ions are recorded by the MS. For FAMEs, the fragment ion series was
selected to include the main fragments of the individual FA groups, but to exclude

96
known ions from the background main impurities. Based on this idea, fragment ions m/z
74, 87, 81, 67, 83, 79, and 91 for FAMEs, m/z 75 for dimethyl acetals (formed from
plasmalogen species) as well as m/z 73, 103, 129, 147 and 419 for trimethylsilyl ether
derivatives of MAG were chosen. This improvement led to two important advantages,
i.e. a ca. 10-fold increase in sensitivity as well as avoidance of overquantitation of a
given peak due to co-eluting impurities (Figure 4.3).
3.0 4.0 5.0 6.0 7.0 8.0 9.0 10.0 11.0 12.0
0.0
0.1
0.2
0.3
0.4
0.5
0.6
0.7
0.8
0.9
1.0
(x10,000,000)
SIM:TIC (2.35)Scan:TIC
3.85 3.90 3.95 4.00 4.05 4.10 4.15 4.20 4.25 4.30 4.35 4.40
0.0
0.5
1.0
1.5
2.0
2.5
3.0
3.5
4.0
(x1,000,000)
SIM:TIC (2.35)Scan:TIC
impurity
A
3.0 4.0 5.0 6.0 7.0 8.0 9.0 10.0 11.0 12.0
0.0
0.1
0.2
0.3
0.4
0.5
0.6
0.7
0.8
0.9
1.0
(x10,000,000)
SIM:TIC (2.35)Scan:TIC
3.85 3.90 3.95 4.00 4.05 4.10 4.15 4.20 4.25 4.30 4.35 4.40
0.0
0.5
1.0
1.5
2.0
2.5
3.0
3.5
4.0
(x1,000,000)
SIM:TIC (2.35)Scan:TIC
impurity
A
3.5 4.0 4.5 5.0 5.5 6.0 6.5 7.0 7.5 8.0 8.5 9.0 9.5
0.00
0.25
0.50
0.75
1.00
1.25
1.50
1.75(x1,000,000)
SIM:419.00 (100.00)SIM:TIC (7.62)Scan:TIC
S/N=5
S/N=325
Peak to be quantified
8.848.858.868.878.888.898.90 8.918.928.938.948.958.968.97 8.988.999.009.019.02
0.5
1.0
1.5
2.0
2.5
3.0
3.5(x100,000)
SIM:419.00 (1.00)SIM:TIC (7.62)Scan:TIC
8.848.858.868.878.888.898.908.918.928.938.948.958.968.978.988.999.009.019.02
0.1
0.2
0.3
0.4
0.5
0.6
0.7
0.8
0.9
1.0
1.1
1.2
(x1,000)
SIM:419.00 (1.00)SIM:TIC (7.62)Scan:TIC
B
Figure 4.3. Advantages of the application of selected ion monitoring mode in GC-MS.
Representative chromatograms are shown to demonstrate (A) avoiding overquantitation
caused by a co-eluting impurity peak and (B) increased sensitivity, i.e. signal-to-noise
ratio (S/N). Total ion chromatograms (Scan: TIC) are drawn in black, while selected ion
chromatograms (SIM: TIC) in pink and green.
4.1.6. Quantitative analysis of lipid classes using ESI-MS/MS
Lipid molecular species were analysed by electrospray ionization tandem mass
spectrometry (ESI-MS/MS) in positive ion mode (Brügger et al., 1997) applying a triple

97
quadrupole mass spectrometer (Quattro Ultima, Micromass, Manchester, UK). The
following lipid classes were measured: diacyl and 1-alkyl-2-acyl species of
phosphatidylcholine (PC and PC-O), lysophosphatidylcholine (LPC), diacyl
phosphatidylethanolamine (PE), 1-(1Z-alkenyl)-2-acyl species of PE (PE-P),
phosphatidylglycerol (PG), cardiolipin (CL), phosphatidylinositol (PI),
phosphatidylserine (PS), sphingomyelin (SM), ceramide (Cer), cholesterol (Chol) and
cholesteryl ester (CE). To quantify these lipid classes, specific lipid molecular species in
chloroform were added as internal standards to the total lipid extract as follows:
PC(14:0/14:0), PC(22:0/22:0), PE(14:0/14:0), PE(20:0/20:0) (di-phytanoyl),
PS(14:0/14:0), PS(20:0/20:0) (di-phytanoyl), PG(14:0/14:0), PG(20:0/20:0) (di-
phytanoyl), CL(14:0/14:0/14:0/14:0), PI(16:0/16:0), LPC(13:0), LPC(19:0),
Cer(d18:1/14:0), Cer(d18:1/17:0), deuterated D7-Chol, CE17:0 and CE22:0. The
mixture was dried under nitrogen and redissolved in methanol:chloroform (3:1, by vol.)
containing 10 mM ammonium acetate at a concentration of 40 µg FA/mL of the total
lipid extract. 20 µL of this solution was injected and data were acquired for 1.3 min.
Samples were quantified by direct flow injection using the analytical setup and the
data analysis algorithms as described previously (Liebisch et al., 2004). A precursor ion
scan of m/z 184 specific for phosphocholine-containing lipids was used for PC, SM
(Liebisch et al., 2004) and LPC (Liebisch et al., 2002). Neutral loss scans of m/z 141
and m/z 185 were used for PE and PS, respectively (Brügger et al., 1997). Fragment
ions of m/z 364, 380 and 382 were used for the plasmalogen PE species containing
16:0, 18:0 and 18:1 in the sn-1 position, respectively (Zemski Berry and Murphy, 2004).
Ammonium-adduct ions of PG and PI were analysed by neutral loss scans of m/z 189
and 277, respectively (Matyash et al., 2008). Chol and CE were quantified after
acetylation using a fragment ion of m/z 369 (Liebisch et al., 2006). Sphingosine
(d18:1)-based Cer were analyzed by product ion of m/z 264 similar to a previously
described method (Liebisch et al., 1999). After identification of relevant lipid species,
selected reaction monitoring analysis was performed to increase precision of the
analysis for the following lipid classes: PE, PE-P, PG, PI, PS, LPC, Cer, CE.
Quantification was achieved by calibration lines generated by the addition of
naturally-occurring lipid species to cell homogenates (Leidl et al., 2008). All lipid
classes were quantified with internal standards belonging to the same lipid class, except
SM (PC internal standard) and PE-based plasmalogens (PE internal standards).
Calibration lines were generated for the following naturally-occurring species:
PC(34:1), (36:2), (38:4), (40:0) and PC(O-16:0/20:4); SM(d18:1/16:0), (d18:1/18:1),

98
(d18:1/18:0); LPC(16:0), (18:1), (18:0); PE(34:1), (36:2), (38:4), (40:6) and PE(P-
16:0/20:4); PS(34:1), (36:2), (38:4), (40:6); Cer(d18:1/16:0), (d18:1/18:0), (d18:1/20:0),
(d18:1/24:1), (d18:1/24:0); Chol, CE 16:0, 18:2, 18:1, 18:0. These calibration lines were
also applied for uncalibrated species, as follows: concentrations of saturated,
monounsaturated and polyunsaturated species were calculated using the closest related
saturated, monounsaturated and polyunsaturated calibration line slope, respectively. For
example PE(36:2) calibration was used for, PE(36:3), PE(36:4); PE(38:4) calibration
was used for PE(38:3) and PE(38:5) and so on. Alkyl ether PC species were calibrated
using PC(O-16:0/20:4) and PE-based plasmalogens were quantified independent from
the length of the ether linked alkyl chain using PE(P-16:0/20:4).
4.1.7. Annotation of lipid species
Lipid species were annotated according to the updated comprehensive classification
system for lipids (Fahy et al., 2009). For glycerophospholipids, the “Headgroup(sn-1/sn-
2)” format specifies one or two radyl side chains where the structures of the side chains
are indicated within parentheses, e.g., PC(16:0/18:1). In cases where the
glycerophospholipid total composition was known, but side chain regiochemistry was
unknown, abbreviations, such as PE(36:1), were used to indicate total numbers of
carbons and double bonds for all chains. Presence of an alkyl ether linkage typically at
sn-1 of glycerol was represented by an “O-” identifier (also referred as plasmanyl
species), as in PC(O-34:1), whereas “P-” denotes a 1Z-alkenyl ether (vinyl ether)
linkage typically at the sn-1 position (also referred as plasmenyl species or
plasmalogens), as in PE(P-16:0/18:1). Lysophospholipids were specified with a letter
“L” in the abbreviation, for example, LPC(16:0).
For sphingolipids, first the number of hydroxyl groups (e.g., “d” for the two
hydroxyls of sphingosine and sphinganine), the number of carbon atoms and then the
number of double bonds are indicated followed by the N-acyl chain composition, such
as SM(d18:1/16:0).
4.1.8. Multidrug resistant (MDR) activity
Malignant cells are often resistant to a wide range of hydrophobic cytostatic chemicals
which may seriously impair the effectiveness of tumour chemotherapy. The main
feature of these multidrug resistant (MDR) cells is an energy-dependent outward

99
transport of drugs by multidrug transporter proteins such as MDR1. It was demonstrated
that hydrophobic acetoxymethyl ester (AM) derivatives of various fluorescent
indicators, such as Fura-2, Fluo-3 or calcein, are actively extruded from cells by MDR1
(Homolya et al., 1993).
Calcein AM, a non-fluorescent hydrophobic molecule, rapidly penetrates the cell
membrane. In the cytoplasm it is readily cleaved by non-specific endogenous esterases
into the fluorescent free acid form of the indicator, which becomes trapped due to its
hydrophilic character. In MDR1-expressing cells calcein AM is extruded by the
multidrug transporter before its intracellular conversion to the free calcein. However,
when this calcein AM extrusion is blocked by an agent that interferes with the MDR1
pump activity, the non-fluorescent calcein AM rapidly accumulates. Based on these
findings a calcein assay has been proposed to discriminate between drug resistant and
drug sensitive cells (Homolya et al., 1996). Furthermore, it was shown that the decrease
in dye accumulation rate correlates both with the level of MDR1 expression and drug
resistance (Homolya et al., 1996). It provided the opportunity for the quantitative
determination of the MDR1 function. If dye extrusion is entirely blocked by an MDR
inhibitor (e.g. verapamil), the difference between the dye uptake rates before and after
the addition of inhibitor reflects the MDR1 pumping activity. In order to avoid
alterations arising from different experimental conditions, the MDR1 activity factor
(MAF) was expressed as a dimensionless parameter: MAF = (F* -F)/F*, where F* and
F designates the dye accumulation rates in the presence and absence of an MDR1
inhibitor, respectively. Because calcein AM was found to be a high-affinity substrate of
the MDR1 transporter (Homolya et al., 1993), the calcein accumulation assay was
suggested to give an overall reflection of the cellular multidrug resistance. The
theoretical value of MAF ranges between 0 and 1. A MAF value <0.2 can be regarded
as MDR negative, while MAF value >0.25 is indicative of positive MDR activity
(according to several commercially available MDR Quantitation Kits, e.g. Sigma,
Chemicon).
To find out whether MDR activity could be responsible for the ineffectiveness of
certain phospholipase inhibitors (see in the Results section), calcein assay
measurements were performed according to Homolya et al. (1996). B16 cells were
trypsinized and then washed and resuspended in Hanks' balanced salt solution
containing 0.25 µM calcein AM at a concentration of 2x10⁵ cells/mL. As MDR
inhibitors sodium orthovanadate (500 µM) or verapamil (100 µM) were used. The
fluorescence signal was followed at 37 °C with gentle stirring in a PTI

100
spectrofluorometer (Photon Technology International, Inc., South Brunswick, NJ, USA)
with emission at 515 nm and excitation at 493 nm (slit width 5 nm). Calibration of dye
concentration was based on the measurement of free calcein fluorescence in the same
instrument under identical conditions. MAF was calculated from the dye accumulation
rates in the presence and absence of verapamil, respectively.
4.1.9. PLA2 activity in vitro
In order to prove the potency of MAFP as a PLA2 inhibitor, PLA2 in vitro activity was
assayed according to Hayakawa et al. (1993) with slight modifications.
4.1.9.1. Cell lysate preparation
B16 cells (5x10⁷) were mixed with 500 µL lysis buffer: 10 mM Hepes pH 7.5, 1 mM
EDTA, 0.34 M sucrose and protease inhibitors (1 mM benzamidine, 1 mM
phenylmethylsulphonyl fluoride, 1 mM caproic acid). The sample was vortexed and
sonicated at 0 C for three periods of 30 sec with a 30 sec pause between each period
and then centrifuged at 100,000 g (at 4 C), for 40 min. The supernatant was assayed for
PLA2 activity (see below).
4.1.9.2. Lipid preparation
1-Palmitoyl-2-[1-14C]oleoyl-phosphatidylcholine, PC(16:0/18:1[1-14C]), 28 nmol (1.5
µCi) in toluene:ethanol (1:1, by vol.)) was dried and resuspended in 2 mL PLA2 assay
buffer (400 µM Triton X-100, 100 mM Hepes pH 7.5, 1 mM CaCl2, 0.1 mg/mL fatty
acid-free BSA, 2 mM DTT) and mixed micelles were created by repeated vortexing and
heating in hot water until the solution clarified.
4.1.9.3. PLA2 assay conditions
The total volume of the assay was 560 µL (450 µL mixed micelles and 110 µL cell
lysate); for inhibitor experiment MAFP (final concentration 10 µM) was also added.
The cell lysate was incubated with substrate for 80 min at 40 C. Then the reaction
mixture was extracted and separated on Kieselgel 60 silica gel TLC plates (20 x 20 cm,
Merck) in hexane:diethylether:acetic acid (85:25:2, by vol.) as described above. It was
expected that the isolated PLA2 in the cell lysate supernatant should preferentially

101
hydrolyse the radioactive PC(16:0/18:1[1-14C]) in the sn-2 position resulting in the
formation of radioactive 18:1[1-14C] FFA and non-radioactive LPC(16:0), and –
depending on the conversion rate – non-reacted radioactive PC. Authentic FFA and PC
standards were run on both sides of the TLC plate. Sample spots at the height of these
standards were scraped and the scrapings were redissolved in 500 µL
hexane:isopropanol (3:2, by vol.) to recover the released FFA and unchanged PC (both
should possess radioactivity). 10 mL Flo Scint II scintillation cocktail was added to the
samples and the mixtures were counted in a Wallac 1409 Liquid Scintillation Counter
(Wallac, Turku, Finland) for 2 min. Inhibition was calculated by comparison of
radioactivity in the presence and absence of MAFP.
4.1.10. Quantitative real-time RT-PCR
RNA was isolated by using the NucleoSpin RNA II kit (Macherey-Nagel, Duren,
Germany). Two micrograms of RNA was reverse-transcribed through use of the
RevertAid H Minus First Strand cDNA Synthesis kit (Fermentas, St. Leon-Rot,
Germany). Hsp70 (Mm01159846s1), hsp25 (Mm00834384_g1), hsp90
(Mm00658568_gH), hsp105 (Mm00442865_m1), B-crystallin (Mm00515567_m1),
and β-actin (Mm00607939s1) primers with TaqMan probes were purchased from
Applied Biosystems (Foster City, CA). TaqMan Universal PCR Master Mix (Applied
Biosystems) was used to prepare the reaction mixtures. The PCR runs were performed
in a Rotor-Gene 3000 instrument (Corbett Research, Sydney, Australia). Relative
quantities of mRNAs were normalized to β-actin.
4.1.11. fPEG-Chol labelling, confocal microscopy, and domain
size analysis
B16(F10) cells were heat stressed at 41 °C or 43 °C or treated with 40 mM BA for 1 h.
They were then incubated with 0.2 μM fPEG-Chol for 20 min as in (Sato et al., 2004).
After fPEG-Chol staining, the cells were washed and imaged with an Olympus
Fluoview 1000 microscope (Melville, NY) by using the 488-nm argon ion laser line for
the excitation of fluorescein. Pictures were taken with a resolution of 1,600 x 1,600; the
final magnification was x300. The freeware ImageJ software (http://rsbweb.nih.gov/ij/)
was used for selecting areas of images for domain size analysis. Subsequently, a fast

102
Fourier transform (FFT) bandpass filter (5–100 pixel) was applied to get rid of noisy
background. CellProfiler (www.CellProfiler.org) was used for detecting, segmenting
and measuring objects which corresponded to fluorescently-labelled domains. The
analysed domains were sorted into classes according to diameter. The ranges were
selected by taking into account that the number of larger domains are less than that of
smaller ones. Therefore, the domain size intervals were determined on an exponential
basis by increasing the interval lengths by a factor of 2 to include sufficient number of
domains into the individual ranges. Diameters were calculated as 2X(Npix/π)−2, where X
is the size of a pixel in nanometres, and Npix is the number of pixels covering the actual
domain. A representative image of how the data was captured and processed is shown in
Figure 4.4.
Figure 4.4. Representative images of data processing for domain size distribution
analysis. (A) Original confocal image of a B16 cell labelled with fPEG-Chol. (B) A FFT
bandpass filter was applied on the previously selected area. (C) Domains detected and
outlined by CellProfiler software. (D) RGB identification of detected domains.

103
4.1.12. Statistics
Correction of isotopic overlap and quantification of lipid species were performed by self
programmed Excel Macros for all lipid classes according to the principles described
previously (Liebisch et al., 2004). For all lipid species those data are presented which
accounted for above 1 mol % of the corresponding lipid class for at least one treatment
group. ESI-MS results are shown as mean ± SD of four independent experiments. The
statistical analysis was performed according to Storey and Tibshirani (2003) measuring
statistical significance calculating the q values based on the concept of the false
discovery rate. The goal is to identify as many significant changes in lipidome as
possible, while keeping a relatively low proportion of false positives. The q value is
similar to the well-known p value, except it is a measure of significance in terms of the
false discovery rate rather than the false positive rate.
For enzyme inhibition studies, data obtained for individual lipids, such as AA or
20:4-MAG and 20:4-DAG were normalized to the TPL content. Results are presented as
means ± SD of five independent analyses. Student's t-test with the Bonferroni correction
was used for statistical analysis.
Principal Component Analysis (PCA) was performed by PAST software (Hammer
et al., 2001). Data for each molecular species were centred to the controls and
normalized with the geometric mean of the SD’s as follows:
yi,j = xi,j-mean(x37c,j)/SQRT((SD(x37c,j)2+SD(x41C,j)
2+SD(x43C.j)2+SD(xBA.j)
2)/4), where i is
the index of the individual experiments for the jth molecular species.
For PLA2 assay and MDR activity measurements, data are presented as means ±
SD of three independent analyses and compared with Student’s t-test.
For the analysis of hsp gene mRNA levels, data are expressed as mean ± SEM
(standard error of mean). Student’s paired t-test (α = 0.05) with the Bonferroni
adjustment was used to compare groups.
Because from the point of view of possible microdomain rearrangements
following various stresses, it is not the significance of the individual domain size
ranges, but far more the alterations in the domain size distribution that counts. In
statistics, the Kolmogorov–Smirnov test (K–S test) is a non-parametric test for the
equality of one-dimensional probability distributions that can be applied to compare two
samples (two-sample K–S test). Therefore, it was well suited for comparison of domain
size distributions under control and stress conditions. The two-sample K–S statistic is
one of the most useful and general non-parametric methods for comparing two samples,

104
as it is sensitive to differences in both location and shape of the empirical cumulative
distribution functions of the two samples.
4.2. RESULTS
4.2.1. Characterization of the B16 lipidome
For quantitative and comprehensive characterization of B16 cells’ lipidome, two mass
spectrometric methods were used. FA profiling of B16 cell total lipid extracts using GC-
MS (Table 4.1) showed a ratio of saturated:monounsaturated:polyunsaturated FAs
(SFA:MUFA:PUFA) of about 45:43:12. However, this ratio was essentially different for
the individual phosphoglyceride classes. Though PC, PI and PS contained high amounts
of SFA (ca. 45-55 %), in PC this was predominantly palmitic acid, while in PI and PS
stearic acid. The larger proportions of PUFAs in PE and PI (20 %) compared to PC and
PS were also remarkable. For PE, n-3 and n-6 PUFAs were fairly evenly distributed,
while the PUFAs in PI were dominated by AA. The n-3 PUFAs, docosapentaenoic and
docosahexaenoic acids, were significant in PS and PE but very low in PI and PC.
Although oleate was present in similar amount in all phosphoglyceride classes (about
27 %), PC contained significant levels of hexadecenoate also. Interestingly, in view of
their shared biosynthetic pathways, the acyl compositions of PC and PE were quite
different.
Lipid class analysis (Figure 4.6 and Table 4.2 (at the end of the Chapter))
demonstrated a ratio of PC to ethanolamine-containing PLs of around 2:1. Plasmalogens
accounted for about 40 mol % of PE species and they were almost exclusively detected
in PE in B16 cells. Anionic PLs represented ca. 15 mol %, with PI and PS being the
most predominant ones, whereas the total amount of detectable SL species was much
lower, at about 3 mol % of TPL fraction. The Chol/TPL ratio was 0.16.
Molecular species information about different lipid classes is presented in Table
4.2. Combining molecular species data with the FA profiles, the main species in PC was
34:1, probably mainly 16:0/18:1. In PE 36:2 (mainly 18:1/18:1), in PS 36:1 (mainly
18:0/18:1) and in PI 38:4 (mainly 18:0/20:4) dominated.

105
Table 4.1. Percentage composition of major FAs in B16 cells
Total FA PC PE PS PI
14:0 1.5 0.7 2.2 0.2 0.6 0.1 1.3 0.4 1.2 0.3
16:0 25.3 0.3 39.2 1.0 10.4 0.5 10.5 0.9 14.4 0.4
16:1 n-9 2.5 0.5 4.1 0.1 0.9 0.2 0.9 0.2 1.1 0.1
16:1 n-7 3.9 0.6 5.5 0.2 2.5 0.2 1.9 0.2 1.9 0.2
18:0 12.2 1.9 5.9 0.7 9.9 0.8 37.4 1.7 27.8 1.4
18:1 n-9 27.2 1.0 27.6 0.5 26.8 0.3 27.2 1.4 26.8 0.7
18:1 n-7 7.1 0.5 7.1 0.3 7.2 0.5 6.1 0.4 7.5 0.3
18:2 n-6 1.0 0.1 1.1 0.1 0.9 0.1 1.0 0.3 0.9 0.0
20:0 0.4 0.1 0.4 0.1 0.3 0.1 1.4 0.2 0.0 0.2
20:3 n-9 2.1 0.4 0.9 0.1 3.4 0.0 0.5 0.1 4.4 0.3
20:3 n-6 0.9 0.1 0.7 0.0 1.2 0.0 1.6 0.1 0.4 0.4
20:4 n-6 3.8 0.2 1.2 0.1 5.0 0.5 0.8 0.0 12.5 1.2
20:5 n-3 0.4 0.1 0.3 0.0 0.9 0.1 0.4 0.0 0.1 0.0
22:5 n-3 1.7 0.1 0.8 0.1 3.4 0.1 2.5 0.2 0.5 0.1
22:6 n-3 2.0 0.2 0.9 0.1 4.2 0.3 3.4 0.4 0.5 0.1
24:0 0.8 0.1 1.2 0.1 0.0 0.0 3.0 0.3 0.0 0.0
16:0 DMA 3.3 0.1 0.6 0.0 9.8 0.6 0.0 0.0 0.0 0.0
18:0 DMA 1.7 0.2 0.3 0.0 5.3 0.4 0.0 0.0 0.0 0.0
18:1 DMA 1.1 0.0 0.0 0.0 3.8 0.3 0.0 0.0 0.0 0.0
18:1 DMA 1.0 0.0 0.0 0.0 3.4 0.3 0.0 0.0 0.0 0.0
SFA:MUFA:PUFA 45:43:12 50:44:6 36:45:19 54:36:10 44:37:19
n-6:n-3 1.4 1.6 0.8 0.5 12.1
AA % in PUFA 32 21 27 8 65
FAs of untreated cells were quantified by GC-MS after methylation. DMA denotes dimethyl acetal from plasmalogen species. Values are expressed as weight % of total FA and expressed as means SD (n = 4).
4.2.2. Principal Component Analysis (PCA) shows that B16
cell lipidome is altered in a stimulus-specific manner due to
membrane stress
B16 cells were exposed to mild (fever-like, 41 °C) or severe (43 °C) temperatures or to
40 mM BA for 1 h. The lipid molecular species composition was determined by ESI-
MS/MS and a comprehensive analysis of lipid classes (PC, PC-O, LPC, PE, PE-P, PG,
PI, PS, SM, Cer, Chol and CE) was performed. The filtered data included 157 molecular
species, each of them accounted for more than 1 % within its lipid class (Table 4.2).

106
The results obtained and listed in Table 4.2 (i.e. 157 molecular species x 4
different treatments x 4 independent replicates) served as a base for PCA. PCA is an
unsupervised multivariate statistical method which is able to reveal the internal structure
of high-dimensional data explaining the variance in them. PCA produces linear
combinations of the original variables to generate the linearly uncorrelated principal
components. Each successive component displays a decreasing among of variance. With
other words, each component is orthogonal to each other and has the highest variance
possible (the first principal component (PC1) has the largest variance). Using only the
first few principal components (accounting for the most of the variance) result in the
reduction of dimensionality of multivariate dataset. This process simplifies the
visualization of complex data sets for exploratory analysis. By applying this method the
aim was to test for possible lipid alterations caused by the distinct treatments and also to
assess overall experimental variation. Projection of the resulting sample scores for the
first, second and third principal components (PC1, PC2 and PC3, respectively) clearly
separated the samples into four non-overlapping clusters corresponding to the individual
stresses (Figure 4.5). The analysis revealed that the three highest ranking components
PC1, PC2 and PC3 accounted for 58 %, 18 % and 6 % of the total variance (altogether
82 %), respectively. PC1 captured most of the variations between the control and
stressed samples, PC2 distinguished BA and heat treatments and PC3 separated the mild
heat from the severe heat stress. Therefore, PCA revealed that the individual stresses
resulted in marked and distinct alterations in the membrane lipid profiles.
Figure 4.5. Principal component analysis (PCA) score plots. Values for 4 independent
experiments are shown for PC1/PC2 (left) and PC2/PC3 (right) of the control and stressed
cells. B16 cells were left untreated at 37 °C (open circles), treated at 41 °C (filled circles),
43 °C (filled squares) or with 40 mM BA (filled triangles) for 1 h (n = 4). Lipids were
quantified by ESI-MS/MS. PCA data were filtered, centred to the average of the 37 °C
controls and normalized.

107
4.2.3. Stress-induced lipid remodelling
Because PCA had shown such obvious differences in the lipidomes of B16 cells
subjected to different stress conditions, these changes were analyzed in more detail.
Comparison of the molecular species patterns for control incubations (37 °C) with
individual stress conditions (heat or BA), demonstrated 116 statistically-significant
distinctions, which are shown in Table 4.2. In order to select appropriate changes with
explanatory relevance, results were grouped according to alterations in lipid class, fatty
acyl chain length and/or degree of unsaturation.
Lipid class analysis (Figure 4.6) revealed that both mild and severe heat and BA
stresses induced remarkably the level of Chol. The sphingolipid Cer displayed a similar
elevation (irrespective of its molecular species composition). SM, a potential source of
Cer, was diminished due to stress but not significantly so.
Figure 4.6. Lipid class compositional changes in B16 cells. B16 cells were left untreated
at 37 °C, treated at 41 °C, 43 °C or with 40 mM BA for 1 h. Lipids were quantified by
ESI-MS/MS. Data are expressed as mol % of analyzed lipids and presented as means ±
SD (n = 4), *q < 0.025 compared to 37 °C (q is based on false discovery rate, see (Storey
and Tibshirani, 2003).
The levels of the most abundant phospholipid, PC, (as well as PE and PG) were
no significantly altered by any of the stress conditions. In contrast, the enhanced amount

108
of LPC following BA addition may indicate a metabolic change in PC. PE-P levels were
lowered in the BA-treated samples, whereas PS increased after both mild and severe HS
(the alterations for the different PS molecular species were similar: see Table 4.2.) but
not with BA. CL was reduced remarkably by severe heat (43 °C) while the PI amount
depleted in response to both BA and 43 °C, but not upon 41 °C exposure.
Distinct alterations in the molecular species of individual PL classes were
visualised by grouping such species according to the total number of their double bonds
(Figure 4.7).
Figure 4.7. Effect of stress on the double bond composition of lipid classes (insert: sum
of double bond compositions). B16 cells were left untreated at 37 °C, treated at 41 °C, 43
°C or with 40 mM BA for 1 h. Lipids were quantified by ESI-MS/MS. Data are expressed
as mol % of analyzed lipids and presented as means ± SD (n = 4), *q < 0.025 compared to
37 °C.
In PC, the significant increase of disaturated species following heat and BA
stresses was paralleled by the decrease in polyunsaturated chains. Because disaturated
phosphoglycerides are known to play role in membrane raft formation and the latter
may be involved in stress responses, results for these molecular species were collected
in Figure 4.8. The data showed a large contribution of shorter chain FAs (PC(30:0),
PC(32:0)) to the elevated disaturated PC. Furthermore, an increase in the amounts of
PE-P species containing 16:0 or 18:0 was found as well. It is noteworthy that another
major raft component, Chol, was also significantly increased by heat or BA stress
(Figure 4.6).

109
Figure 4.8. Alterations in disaturated phospholipid molecular species elicited by stress.
B16 cells were left untreated at 37 °C, treated at 41 °C, 43 °C or with 40 mM BA for 1 h.
Lipids were quantified by ESI-MS/MS. Data are expressed as mol % of analyzed lipids
and presented as means ± SD (n = 4), *q < 0.025 compared to 37 °C.
Although a measurable portion of PC and ethanolamine plasmalogen contained
SFA moieties only, in diacyl PE, PS and PI only molecular species with at least one
double bond were detected (Figure 4.7). In PE the reduced level of highly unsaturated
polyenes (double bonds≥5) after BA treatment was counterbalanced by elevated
monoenoic species. Moreover, the reduction in total PI amount after severe heat (43 ºC)
or BA stress (Figure 4.6) occurred as a result of the depletion in unsaturated (double
bonds≥2) species (Figure 4.7).
From these data it can be concluded that BA and heat stresses (especially 43 ºC)
caused increased levels of saturated lipids and decreased amounts of polyenoic species
(Figure 4.7 insert). This demonstrated the concerted alterations in the lipidome which
take place after the applied stress treatments in B16 cells.
4.2.4. Proposed involvement of phospholipases
The above results, i.e. the overall polyene reduction, may point to the involvement of
phospholipases in stress-mediated lipid remodelling. Because AA is a known and potent

110
Hsp modulator among PUFAs, those molecular species were examined further that
contained AA. As shown in Figure 4.9, remarkable losses were observed, especially in
BA-treated samples, in PE(P-16:0/20:4), PC(36:4), PE(38:5) and, especially, in
PI(38:4). Based on the abundance of 16:0 among saturated and the high enrichment of
AA among the PUFAs of PC, the main species of PC(36:4) probably corresponds to
16:0/20:4. Due to the observed increase in LPC levels following BA addition (Figure
4.6), it is reasonable to suggest a PLA2 enzyme activation. This cleaves the ester bond in
sn-2 position of a PL leading to the production of the corresponding lyso derivative and
release of the sn-2 FA, in this case mainly AA. Although LPE was not analyzed, it is
known that PE species are also good substrates for mammalian PLA2 enzymes
(Balsinde et al., 2002). In PE-P the presence of 20:4-containing species was apparent. In
addition, the large contribution of the 18:1/20:4 species to the total composition of
PE(38:5) was suggested to be due to the high proportion of 18:1 in the monoene and the
abundance of AA in the polyene fraction of diacyl PE. This species (PE(38:5)) was
diminished significantly upon BA stress (Figure 4.9). The most striking alterations were
seen in PI(38:4) which accounts for, by far, the largest portion (about 30 %) among the
lipids depicted in Figure 4.5. The largest ratio of PI(38:4) can be mainly attributed to the
18:0/20:4 species, considering that in PI the FAs 18:0 and 20:4 are the dominant SFA
and PUFA, respectively (Table 4.1). When exposed to severe heat or, especially to BA
treatment, this molecular species was lowered very remarkably (in the case of BA
treatment by 30 %). It should also be noted, that the amount of PI(36:4) (most probably
16:0/20:4) enriched significantly following both heat stresses. However, the pronounced
depletion observed in PI and especially in the PI(38:4) species after severe membrane
stress (43 °C and 40 mM BA) may denote the involvement of a phosphoinositide-
specific PLA2 and/or PLC. In the latter case, PLC would cleave the phosphodiester
bond. The DAG produced so could then be hydrolysed in two sequential steps to form
first MAG and finally free AA.

111
Figure 4.9. Changes in phospholipid molecular species containing 4 or 5 double bonds in
response to stress. These species probably contained AA (see text). B16 cells were left
untreated at 37 °C, treated at 41 °C, 43 °C or with 40 mM BA for 1 h. Lipids were
quantified by ESI-MS/MS. Data are expressed as mol % of analyzed lipids and presented
as means ± SD (n = 4), *q < 0.025 compared to 37 °C.
To confirm the suggestion that in many cases the decrease found in AA-
containing lipids was due to phospholipase action, the level of FFAs were measured.
The FA compositional changes in the FFA fraction due to stress treatments are shown in
Figure 4.10. Among PUFAs AA was preferentially released by stress (Figure 4.10).
Therefore, time-course alterations are presented for this FA in Figure 4.11. At 37 C the
AA amount displayed a slight elevation during a 1 h incubation. Following mild HS
(41 C) no further significant increase was found as compared to the control, while at
43 C a remarkable 4-fold rise was detected, and BA treatment caused in the highest
increase of AA with a further 2.5-fold elevation compared to HS at 43º C (Figure 4.11).

112
FA composition of FFA fraction in B16
0.0
5.0
10.0
15.0
20.0
25.0
30.0
35.0
40.0
45.0
50.0
14:
0
16:
0
18:
0
18
:1 n
-9
18
:1 n
-7
18
:2 n
-6
20
:3 n
-9
20
:3 n
-6
20
:4 n
-6
22
:5 n
-3
22
:6 n
-3
37C
43C
BA
FA composition of FFA fraction in B16
0.0
5.0
10.0
15.0
20.0
25.0
30.0
35.0
40.0
45.0
50.0
14:
0
16:
0
18:
0
18
:1 n
-9
18
:1 n
-7
18
:2 n
-6
20
:3 n
-9
20
:3 n
-6
20
:4 n
-6
22
:5 n
-3
22
:6 n
-3
37C
43C
BA
0.0
0.5
1.0
1.5
2.0
2.5
3.0
3.5
4.0
4.5
5.0
20
:3 n
-9
20
:3 n
-6
20
:4 n
-6
22
:5 n
-3
22
:6 n
-3
Figure 4.10. FA compositional changes in the FFA fraction of B16 cells after stress. B16
cells were left untreated at 37 °C, treated at 43 °C or with 40 mM BA for 1 h. FAs were
quantified by GC-MS. Data are expressed as weight % of total and presented as
mean ± SD (n = 5).
Figure 4.11. Time-course changes in free AA levels after stress. B16 cells were left
untreated at 37 °C, treated at 43 °C or with 40 mM BA for 1 h. AA was quantified by
GC-MS. Data are expressed in pmol/µg TPL and presented as means ± SD (n = 5).

113
4.2.5. Inhibitor studies to uncover the mechanism of
arachidonate release
It is known from the literature that AA can be produced mainly by two types of
phospholipases, the above-mentioned PLA2 and/or PLC (Figure 4.12). In order to
determine the role and/or contribution of the different AA-producing pathways,
selective inhibitors were used and alterations in the amount of the relevant lipid
metabolites, i.e. arachidonate-containing DAG and MAG as well as AA were
determined (Figure 4.14).
Figure 4.12. Overview of the potential AA producing pathways, applied inhibitors and
analysed lipid metabolites (underlined). Note that DAG, AA and Ca2+ are known Hsp
modulators.
Different types of inhibitors were selected: U-73122, an effective PLC inhibitor
(Shimizu et al., 2007; Tang et al., 2006), THL, a selective DAG lipase inhibitor

114
(Bisogno et al., 2003; Bisogno et al., 2006) and MAFP, a pluripotent inhibitor with dual
activity against cPLA2/iPLA2 (Balsinde and Dennis, 1996; Balsinde et al., 1999;
Ghomashchi et al., 1999; Huang et al., 1996). In addition, MAFP was reported to be
very potent as a fatty acid amide hydrolase (FAAH) and MAG lipase inhibitor
(Goparaju et al., 1999; Shimizu and Yokotani, 2008).
Following a 20-min preincubation period with the inhibitors at 37 C, the samples
were exposed to stress treatments (43 C or 40 mM BA) for 1 h. Ethanol was used as
solvent for inhibitors; its final concentration did not exceed 0.1 %. This concentration
had no measurable effect on lipid mediator levels compared to the solvent-free controls
(Table 4.3).
Without inhibitors, the AA amount enhanced after treatment as noted above
(Figure 4.11). The 20:4-DAG level altered no significantly upon HS at 43 C, but
revealed a 6-fold elevation following the addition of BA. The 20:4-MAG level was very
remarkably risen by both stresses, as demonstrated by a 10-fold increase after HS and a
60-fold elevation upon BA treatment (insert in Figure 4.13).
Although the PLC inhibitor U-73122 (5 μM) was expected to diminish the amount
of all measured intermediates on the PLC pathway by acting upstream, it failed to do so
(Table 4.3). It occurred probably due to the presence of B16-specific multidrug resistant
(MDR) transporter proteins which can effectively pump out hydrophobic molecules
from cells (see Discussion).
The DAG lipase inhibitor THL (30 μM) was supposed to influence the PLC
pathway by increasing 20:4-DAG and decreasing AA levels. 20:4-MAG amounts were
no essentially altered by HS but reduced slightly after BA challenge in the presence of
THL (Figure 5.13).
MAFP (10 μM) as a combined PLA2 and MAG lipase inhibitor was expected to
decrease the free AA level. In parallel, it was supposed to elevate 20:4-MAG amounts,
due to its MAG lipase inhibitory potency. As depicted in Figure 4.13, MAFP resulted in
ca. 50 % reduction in AA levels in both heat-shocked and BA-treated cells.
Furthermore, it caused a spectacular (ca. 50-fold) increase in the level of 20:4-MAG for
all conditions tested (37 °C, 43 °C, BA) compared to the inhibitor-free experiments.
Unexpectedly, 20:4-DAG level was also slightly increased at 43 C and 1.5-fold with
BA due to MAFP addition. It could be a result of DAG lipase feed-back inhibition by
20:4-MAG, the reaction product of this enzyme.
In the following MAFP and THL were used in combination in order to decide
which inhibitor property of MAFP played determining role in the B16 cell system. The

115
co-application of the two inhibitors caused no further changes in the AA level, but led to
a striking drop in 20:4-MAG level (70 % at 43 ºC and 95 % with BA) as compared to
MAFP treatment alone. These findings revealed that MAFP acted exclusively as a
MAG lipase inhibitor and that the PLC pathway generated about half of the total AA
produced.
Figure 4.13. Effect of inhibitors on the levels of 20:4-DAG, 20:4-MAG and AA. B16
cells were preincubated without (w/o) or with inhibitor (MAFP 10 μM, THL 30 μM) for
20 min. Then they were left untreated at 37 °C, treated at 43 °C or with 40 mM BA for 1
h. Lipid intermediates were quantified by GC-MS and expressed in pmol/μg TPL as
means ± SD (n = 5), p < 0.05 (Student's t-test with the Bonferroni correction), * w/o vs.
with inhibitor, # MAFP vs. MAFP+THL, § w/o inhibitor at 37 C vs. w/o inhibitor upon
treatment.

116
Table 4.3. Percentage composition of major FAs in B16 cells
DAG MAG AA
Solvent-free 37 0.410 ± 0.110 0.003 ± 0.001 0.623 ± 0.015 43 0.515 ± 0.150 0.030 ± 0.015 2.480 ± 0.400
BA 2.413 ± 0.300 0.155 ± 0.012 5.611 ± 0.540
Ethanol only 37 0.400 ± 0.124 0.003 ± 0.001 0.650 ± 0.140 n.s.* (w/o inhibitor) 43 0.520 ± 0.154 0.026 ± 0.011 2.500 ± 0.430 n.s.*
BA 2.345 ± 0.340 0.156 ± 0.010 5.500 ± 0.566 n.s.*
U-73122 37 0.391 ± 0.102 0.003 ± 0.001 0.609 ± 0.014 n.s.$ 43 0.528 ± 0.149 0.021 ± 0.012 2.590 ± 0.520 n.s.$
BA 2.477 ± 0.260 0.160 ± 0.015 5.443 ± 0.630 n.s.$
B16 cells were incubated without (solvent-free) and with 0.1 % ethanol for 20 min. In further experiments they were preincubated without (ethanol only, i.e. w/o inhibitor) or with inhibitor (U-73122 5 μM) for 20 min. Then they were left untreated at 37 °C, treated at 43 °C or with 40 mM BA for 1 h. Lipid intermediates were quantified by GC-MS and expressed in pmol/μg TPL as means ± SD (n = 2 for ethanol vs. solvent-free, n = 3 for U-73122 vs. ethanol (w/o inhibitor)), p < 0.05 (Student's t-test), *ethanol-containing vs. solvent-free, $U-73122 vs. w/o inhibitor (i.e. ethanol only), n.s. not significant.
To find out why the PLC inhibitor U-73122 failed to exert any effect and why the
potency of MAFP against cPLA2 could not be predominated, it was suggested that they
did not achieve effective inhibitory concentrations in the cell. It is noted that these
agents are highly hydrophobic and, therefore, may serve as ligands for MDR
transporters, which could extrude them from the cell. To prove this idea, the calcein
assay developed by (Homolya et al., 1996) was applied (see Section xx). It revealed a
very high MDR activity factor in B16 cells (MAF = 0.81, Figure 4.14). Thus, it is
conceivable that a functional MDR in the cell membrane could be responsible for
decreasing intracellular levels and, consequently, the effectiveness of the inhibitors.
Indeed, in this study the inhibitors were used at 1-3x10⁻⁵ M concentrations. Those
agents where the documented IC50 values fell also in the µM range, i.e. U-73122 and
MAFP as a PLA2 inhibitor (IC50~0.5 µM), did not display inhibitory effect. However, in
cases when the documented IC50 values were 2-3 orders of magnitude lower (such as for
MAFP as a MAG lipase inhibitor (IC50~2-3 nM) and for THL as DAG-lipase inhibitor
(IC50~60 nM)), significant inhibition was observed.
To confirm the potency of MAFP as a PLA2 inhibitor, the supernatant of lysed
B16 cells were assayed for PLA2 activity. The assay revealed 85 % inhibition in the
presence of MAFP (10 µM), thereby unambiguously indicated the efficacy of MAFP
against B16 cell PLA2 enzymes under in vitro condition (Figure 4.15).

117
Figure 4.14. Measurement of MDR activity. Panel A, representative trace of calcein
accumulation in B16(F10) cells. The cells were incubated in the presence of 0.25 µM
calcein AM and fluorescence was monitored by spectrofluorometry (values in arbitrary
units, a.u.). After 5 min of incubation, sodium orthovanadate as a MDR inhibitor (final
concentration 500 µM) was added to the medium. Panel B, effect of the MDR inhibitor
verapamil (100 µM) on calcein AM uptake into B16(F10) cells. The incubation media
contained 0.25 µM calcein AM and the dye accumulation was recorded for 5 min at 37 °C
in the presence or absence of the inhibitor (as indicated). The rates were calculated by
linear regression and presented as means ± SD (n = 4), *p < 0.05.
Figure 4.15. Effect of PLA2 inhibitor on PLA2 activity in soluble fractions from B16
cells. MAFP was added in 10 µM final concentration. Enzymatic activity (high speed
supernatant) was measured as described in Materials and methods. Data are expressed as
relative % and presented as means ± SD (n = 3), *p < 0.05.

118
4.3. DISCUSSION
In addition to their roles in the structural organization of membranes, different
membrane lipids can be metabolized and generate numerous signalling molecules in
response to stimuli (such as sphingolipids or products of PLA2 activation). Growing
evidence links such signalling processes also to membrane microdomains. In turn, the
lipid signalling molecules can modify gene expression and, therefore, couple
environmental stress or other stimuli to energy metabolism, cellular aging, etc.
To observe lipid alterations due to HS and membrane fluidity modulation the ESI-
MS/MS molecular species results were evaluated using a data-mining PCA method
which revealed a clear distinction of the experiments into four non-overlapping clusters
according to the different stresses. The first component, accounted for almost 60 % of
variance, clearly distinguished the untreated and stress conditions raising the possibility
that common lipid metabolic pathways are involved in the stress-mediated lipid
changes. The second and third components displayed differences for the mild or severe
heat and the BA-induced membrane stresses, pointing to specific alterations in the
lipidome due to these membrane perturbations.
A key characteristic of the lipid remodelling after heat (both mild and severe) or
BA stress was the accumulation of Chol, Cer, saturated PC and PE-P species in B16
cells. These lipid species may support the generation of tightly-packed subdomains that
correspond to liquid-ordered phases biophysically characterized in raft domains in cells
and in model membranes (Mukherjee and Maxfield, 2004). It is known that elevated
Cer levels can displace Chol from membrane/lipid “Chol-rafts” and form large, Cer-
enriched membrane platforms “Cer-rafts” (Grassme et al., 2007; Patra, 2008). Since
both Chol and Cer - besides other raft-component lipids - piled up during stress in
whole B16 cells, it is conceivable that rafts are rearranged and contain different protein
components, thereby altering various signalling pathways, (such as phosphatidylinositol
3-kinase, Akt and glycogen synthase kinase 3) which may, in turn, transmit the stress
signal from the PM to the nucleus (Vigh et al., 2005; Vigh et al., 2007a). These findings
may explain the previous observations concerning heat- or BA-induced Chol-rich PM
microdomain condensation observed by fluorescence microscopy in B16 cells (Nagy et
al., 2007). The elevation in saturated lipids and the concomitant decrease in polyenes
was another clear consequence of stress. This may highlight common metabolic
processes which are involved in stress responses, while the lipid species- or lipid class-
dependent alterations may indicate stressor-specific changes.

119
In line with the commonly-accepted view in the literature (Balboa and Balsinde,
2006; Balsinde et al., 1999; Balsinde et al., 2002; Hirabayashi et al., 2004) it was
suggested that the depletion of PUFA-containing lipids (with special emphasis on 20:4-
containing species) following heat and BA treatments was a results of phospholipase
actions. Such enzymatic activity is thought to be affected by membrane
microheterogeneity and/or fluidity for both PLA2 (Hønger et al., 1996) and PLC
(Ahyayauch et al., 2005). These phospholipases can also be stimulated by HS and
chemical stressors (Calderwood and Stevenson, 1993; Samples et al., 1999).
The increased amount of LPC after the addition of BA, as observed by ESI-MS in
this study, supported the involvement of a PLA2 enzyme. Because AA can almost
exclusively be found in the sn-2 position, the decrease in PC(36:4) is consistent with the
elevation of the main LPC species LPC(16:0).
The lipid most altered by PUFA depletion was PI(38:4). PI can be metabolized
mainly by PLC or PI-specific PLA2 (Corda et al., 2009). The former hydrolyzes PIP2,
thereby releasing two second messengers, IP3 and DAG (Wymann and Schneiter, 2008).
Upon binding to IP3 receptors IP3 rapidly induces the release of Ca2+ from the
endoplasmic reticulum. Importantly, it has been published that heat induces IP3
production and polyphosphoinositide turnover in the initial stage of hyperthermia
(Calderwood et al., 1987). Furthermore, several publications report that HS leads to a
fast elevation in [Ca2+]i from internal stores and a massive Ca2+ influx from the
extracellular medium. Cell calcium seems to be critical for the transcriptional activation
of hs genes in B16 (Nagy et al., 2007) and other cell lines (Kiang and Tsokos, 1998) and
references therein).
Enhanced activity of phosphoinositide-specific PLC causes the formation of DAG
which is highly enriched in AA and therefore may act as second messenger (Wakelam,
1998). For example, it could increase, the membrane activation and association of
various isoforms of PKC which have been reported to drive the phosphorylation of
HSFs (Vigh et al., 2007a). This is in agreement with the Hsp70 induction that occurred
upon activation of PKC (Vigh et al., 2005). Additionally, the BA-induced increase in
DAG and the heat-induced enhancement of PS, recorded in the present study, may have
a positive regulatory role in PKC activation, because both DAG and PS are essential
cofactors of PKC (Escribá et al., 2008; Griner and Kazanietz, 2007), but can be
differently influenced by the different treatments.
The released 20:4-DAG can be further metabolized by DAG lipase to 20:4-MAG
(Shimizu and Yokotani, 2008; Tang et al., 2006). Subsequently, from 20:4-MAG AA

120
can be generated through the action of MAG lipase or FAAH (Chau and Tai, 1981). AA
produced by both PLA2 and PLC-mediated pathways can transmit signals, it can be
recycled via the Lands pathway, but a portion can be lost to β-oxidation. The Hsp
modulator ability of AA was proven by treatment of HeLa cells with AA which
stimulated HSF1–DNA binding, enhanced HSF1 phosphorylation and upregulated
transcription of the Hsp70 gene (Jurivich et al., 1996).
The time-course study of AA amounts displayed a pronounced increase after 1 h
treatment either with 40 mM BA or at 43 C. Thus, the loss in 20:4-containing lipids
was accompanied by the liberation of a sizable portion of AA after severe stresses.
However, as demonstrated by the elevated level of PI(36:4) upon both heat stresses, a
portion of the AA probably went through reacylation, showing again that the distinct
stresses can be distinguished by subtly altered species of the same lipid class or even by
modulation of a single lipid species in a stressor-dependent manner. Finally, it is
possible that a portion of the released AA may undergo oxidative metabolism by several
enzymes such as lipoxygenases and cyclooxygenases whose products are also potent
Hsp inducers (Köller and König, 1991; Santoro, 2000).
The accumulation of 20:4-DAG with BA and 20:4-MAG after both 43 °C and BA
treatments (vs. 37 °C) clearly demonstrated the participation of the PLC pathway in the
stress-induced lipid remodelling and AA generation. In addition, by far the highest rise
in all three possible intermediates (20:4-DAG, 20:4-MAG and AA) was observed
following BA treatment. This result is in accordance with literature data that
phospholipases can be controlled by membrane microviscosity (Ahyayauch et al.,
2005).
To determine the involvement of the possible phospholipases in AA release,
different inhibitors were used. The application of MAFP (applied at 10 µM), which is
widely considered in the literature as combined cPLA2/iPLA2 inhibitor (IC50~0.5 µM),
resulted in a marked decline in AA release after both 43 °C and BA stresses.
Importantly, MAFP has also been reported to be able to more efficiently inhibit FAAH
and MAG-lipase activities (IC50~2-3 nM) (Goparaju et al., 1999). This latter could
account for the elevated amounts of 20:4-MAG not only upon stresses but also under
non-stressed conditions at 37 °C (Figure 4.9). It indicates a high basal MAG lipase
activity in B16(F10), a cancer cell with strong metastatic capacity. It was reported
recently that MAG lipase is highly enhanced in aggressive tumour cells from multiple
tissues of origin (Nomura et al., 2010). The authors demonstrated that MAG lipase
regulates FFA levels in such cells. The induced MAG lipase−FFA pathway feeds into a

121
complex lipid network full with pro-tumourigenic signalling molecules and also
promotes survival, migration, and in vivo tumour growth. In this way aggressive tumour
cells couple lipogenesis with high lipolytic activity to produce a set of pro-tumourigenic
signals that support their malignant behaviour.
The DAG-lipase inhibitor THL (30 µM, IC50~60 nM) resulted in a significant
drop in 20:4-MAG level elevated by the MAG lipase inhibitor MAFP. These findings
proved the role of the PLC–DAG lipase–MAG lipase pathway in AA formation and
allowed some estimates for its quantitative contribution. Because both MAFP and THL
alone or in combination showed similar (ca. 40-50 %) inhibition in the level of AA, it
looks likely that, in our system, MAFP functioned exclusively as a MAG lipase
inhibitor and the PLC pathway released about half of the AA. It is conceivable to
suggest that the PLA2 pathway accounted for the other half as revealed by the decrease
in 20:4-containing PC and PE species and LPC elevation.
Recently, the question of how the membrane structural changes can be coupled to
the Janus-like characteristics of hyperthermia in cancer therapy (Calderwood and
Ciocca, 2008) was addressed in several publications (see e.g. (Grimm et al., 2009). The
findings with the B16(F10) cancer cell line showed the accumulation of lipids with raft-
forming properties. Mild hyperthermia (≤41 °C), which induces Hsps only to moderate
levels (Nagy et al., 2007), also displayed this membrane feature, which is known to be
linked to sensitivity to γ-irradiation (Bionda et al., 2007). Thus, these results may
facilitate the understanding how mild hyperthermia can be applied as an adjuvant for
chemotherapy, immunotherapy and radiotherapy by influencing membrane
microdomain organization. In contrast, severe stress, elicited by 43 °C or BA, harshly
activated phospholipases through robust membrane perturbation rendering the
membranes more saturated and resulting in the production of lipid mediators which may
contribute to Hsp synthesis. This membrane reorganization and the increased elevated
Hsp levels ultimately may cause tolerance against heat, chemo- or radiotherapy.
In summary, the above experiments indicate that alterations in membrane fluidity
and/or microheterogeneity after heat- or a fluidizing agent-induced stress resulted in
significant and highly-specific changes in membrane lipid composition. The elevated
amount of lipids with raft-forming properties (saturated lipid species, Chol and Cer)
under both mild and severe stress conditions may explain the condensation of ordered
PM domains previously observed by fluorescence microscopy (Nagy et al., 2007). The
depletion of PUFA-containing lipid molecular species with a parallel enhancement in
saturated species was found to be a result of the activation of phospholipases (mainly

122
PLA2 and PLC). Furthermore, the phospholipase CDAG lipaseMAG lipase pathway
was identified in B16 cells. It contributed significantly to the release of several lipid
mediators (including the potent HS modulator AA) following stress. Because different
stresses were found to lead to unique alterations in the lipid profile of B16 cells, this
work demonstrate that there are delicate perception mechanisms which can be
operational for individual stresses.
Table 4.2. Molecular species alterations of lipid classes after stress treatments in B16 cells 37C 41C 43C BA PC(30:0) 1.52 ± 0.07 1.61 ± 0.08 1.77 ± 0.08* 1.92 ± 0.05* PC(30:1) 0.47 ± 0.08 0.39 ± 0.02 0.41 ± 0.04 0.45 ± 0.02 PC(32:0) 1.58 ± 0.02 1.99 ± 0.14* 2.56 ± 0.20* 2.35 ± 0.16*PC(32:1) 6.14 ± 0.25 5.93 ± 0.18 5.69 ± 0.27 6.27 ± 0.17 PC(32:2) 0.49 ± 0.02 0.51 ± 0.06 0.48 ± 0.02 0.52 ± 0.02PC(34:1) 12.10 ± 0.47 11.46 ± 0.19 11.35 ± 0.31 11.99 ± 0.27 PC(34:2) 2.81 ± 0.06 2.56 ± 0.07* 2.48 ± 0.05* 2.79 ± 0.09 PC(36:1) 1.71 ± 0.05 1.57 ± 0.14 1.69 ± 0.19 1.76 ± 0.20 PC(36:2) 3.88 ± 0.10 3.66 ± 0.21 3.58 ± 0.33 3.88 ± 0.11 PC(36:3) 1.39 ± 0.05 1.14 ± 0.05* 1.16 ± 0.05* 1.20 ± 0.08* PC(36:4) 1.10 ± 0.10 0.96 ± 0.04 0.89 ± 0.05* 0.84 ± 0.05* PC(38:5) 0.73 ± 0.07 0.71 ± 0.08 0.68 ± 0.07 0.64 ± 0.03 PC(38:6) 0.81 ± 0.06 0.66 ± 0.03* 0.75 ± 0.10 0.65 ± 0.06* PC 34.73 ± 1.13 33.17 ± 0.83 33.50 ± 1.35 35.28 ± 1.13 PC(O-30:0) 0.16 ± 0.02 0.16 ± 0.02 0.20 ± 0.02 0.18 ± 0.03 PC(O-32:0) 0.72 ± 0.06 0.68 ± 0.07 0.76 ± 0.03 0.76 ± 0.04PC(O-32:1) 0.82 ± 0.12 0.81 ± 0.03 0.78 ± 0.04 0.88 ± 0.05 PC(O-32:2) 0.14 ± 0.01 0.14 ± 0.01 0.14 ± 0.01 0.15 ± 0.02PC(O-34:0) 0.26 ± 0.03 0.26 ± 0.06 0.29 ± 0.07 0.31 ± 0.05 PC(O-34:1) 2.28 ± 0.07 2.20 ± 0.08 2.27 ± 0.11 2.36 ± 0.17 PC(O-34:2) 0.69 ± 0.04 0.65 ± 0.02 0.63 ± 0.06 0.63 ± 0.03 PC(O-34:3) 0.08 ± 0.02 0.07 ± 0.01 0.07 ± 0.04 0.07 ± 0.02 PC(O-36:1) 0.51 ± 0.07 0.47 ± 0.04 0.47 ± 0.06 0.51 ± 0.02 PC(O-36:2) 0.60 ± 0.04 0.67 ± 0.04 0.63 ± 0.20 0.66 ± 0.08 PC(O-36:3) 0.28 ± 0.02 0.23 ± 0.03 0.24 ± 0.01* 0.23 ± 0.00* PC(O-36:4) 0.17 ± 0.03 0.13 ± 0.07 0.16 ± 0.01 0.13 ± 0.02 PC(O-36:5) 0.12 ± 0.02 0.09 ± 0.01* 0.08 ± 0.03 0.10 ± 0.01 PC(O-38:2) 0.09 ± 0.01 0.11 ± 0.03 0.08 ± 0.03 0.12 ± 0.01*PC(O-38:3) 0.09 ± 0.01 0.09 ± 0.01 0.09 ± 0.01 0.08 ± 0.01 PC(O-38:4) 0.14 ± 0.01 0.09 ± 0.00* 0.13 ± 0.02 0.10 ± 0.02PC(O-38:5) 0.28 ± 0.03 0.22 ± 0.02* 0.20 ± 0.01* 0.25 ± 0.03 PC(O-40:6) 0.11 ± 0.04 0.10 ± 0.01 0.09 ± 0.02 0.10 ± 0.03 PC-O 7.54 ± 0.37 7.19 ± 0.12 7.31 ± 0.41 7.64 ± 0.37 PE(32:1) 0.33 ± 0.02 0.33 ± 0.00 0.34 ± 0.02 0.35 ± 0.02 PE(34:2) 0.56 ± 0.03 0.54 ± 0.02 0.57 ± 0.02 0.53 ± 0.02 PE(34:1) 1.53 ± 0.05 1.53 ± 0.06 1.57 ± 0.05 1.63 ± 0.06 PE(36:1) 1.23 ± 0.05 1.25 ± 0.02 1.27 ± 0.05 1.34 ± 0.06 PE(36:2) 2.06 ± 0.05 2.04 ± 0.03 2.13 ± 0.06 2.02 ± 0.06 PE(36:3) 0.39 ± 0.02 0.39 ± 0.01 0.45 ± 0.01* 0.39 ± 0.01 PE(36:4) 0.39 ± 0.02 0.38 ± 0.01 0.39 ± 0.02 0.36 ± 0.01

123
PE(38:2) 0.39 ± 0.01 0.41 ± 0.03 0.42 ± 0.01* 0.41 ± 0.02 PE(38:3) 0.84 ± 0.00 0.82 ± 0.02 0.87 ± 0.07 0.81 ± 0.05 PE(38:4) 1.19 ± 0.01 1.16 ± 0.04 1.23 ± 0.01* 1.19 ± 0.03PE(38:5) 1.13 ± 0.08 1.08 ± 0.05 1.09 ± 0.05 0.98 ± 0.02* PE(38:6) 0.83 ± 0.03 0.78 ± 0.02 0.75 ± 0.06 0.74 ± 0.01*PE(40:5) 0.60 ± 0.03 0.53 ± 0.04 0.54 ± 0.01 0.57 ± 0.00 PE(40:6) 1.24 ± 0.02 1.15 ± 0.07 1.16 ± 0.05 1.30 ± 0.04 PE 12.73 ± 0.32 12.41 ± 0.07 12.79 ± 0.40 12.64 ± 0.35 PE(P-16:0/16:0) 0.10 ± 0.00 0.13 ± 0.01* 0.16 ± 0.01* 0.13 ± 0.01* PE(P-16:0/16:1) 0.16 ± 0.03 0.17 ± 0.02 0.16 ± 0.01 0.17 ± 0.01 PE(P-16:0/18:1) 1.15 ± 0.03 1.11 ± 0.04 1.12 ± 0.04 1.06 ± 0.04* PE(P-16:0/18:2) 0.09 ± 0.00 0.10 ± 0.01 0.09 ± 0.00 0.09 ± 0.01 PE(P-16:0/18:3) 0.03 ± 0.00 0.03 ± 0.00 0.02 ± 0.00 0.03 ± 0.01 PE(P-16:0/20:3) 0.47 ± 0.02 0.47 ± 0.02 0.48 ± 0.02 0.45 ± 0.02 PE(P-16:0/20:4) 0.84 ± 0.01 0.79 ± 0.03 0.79 ± 0.01* 0.74 ± 0.01* PE(P-16:0/20:5) 0.29 ± 0.03 0.27 ± 0.04 0.26 ± 0.03 0.25 ± 0.01PE(P-16:0/22:3) 0.07 ± 0.01 0.08 ± 0.00 0.08 ± 0.01 0.08 ± 0.00 PE(P-16:0/22:4) 0.09 ± 0.01 0.10 ± 0.01 0.09 ± 0.01 0.09 ± 0.00PE(P-16:0/22:5) 0.76 ± 0.02 0.75 ± 0.03 0.74 ± 0.03 0.68 ± 0.02* PE(P-16:0/22:6) 0.75 ± 0.00 0.72 ± 0.02 0.66 ± 0.02* 0.66 ± 0.03* PE(P-18:0/16:1) 0.11 ± 0.01 0.12 ± 0.01 0.12 ± 0.01 0.12 ± 0.01 PE(P-18:0/16:0) 0.10 ± 0.01 0.14 ± 0.01* 0.15 ± 0.01* 0.12 ± 0.02 PE(P-18:0/18:2) 0.04 ± 0.01 0.04 ± 0.01 0.04 ± 0.00 0.04 ± 0.00 PE(P-18:0/18:1) 0.44 ± 0.02 0.47 ± 0.01 0.46 ± 0.03 0.43 ± 0.01 PE(P-18:0/20:5) 0.11 ± 0.01 0.11 ± 0.00 0.11 ± 0.01 0.11 ± 0.01 PE(P-18:0/20:4) 0.37 ± 0.03 0.36 ± 0.02 0.37 ± 0.00 0.34 ± 0.01 PE(P-18:0/20:3) 0.20 ± 0.02 0.19 ± 0.01 0.21 ± 0.01 0.21 ± 0.01 PE(P-18:0/22:6) 0.30 ± 0.01 0.28 ± 0.02 0.26 ± 0.03 0.28 ± 0.01* PE(P-18:0/22:5) 0.26 ± 0.02 0.28 ± 0.02 0.26 ± 0.01 0.26 ± 0.00 PE(P-18:0/22:4) 0.03 ± 0.01 0.03 ± 0.00 0.02 ± 0.01 0.02 ± 0.00PE(P-18:0/22:3) 0.02 ± 0.00 0.01 ± 0.00* 0.02 ± 0.00 0.02 ± 0.01 PE(P-18:1/16:0) 0.69 ± 0.02 0.77 ± 0.03* 0.80 ± 0.01* 0.74 ± 0.02 PE(P-18:1/16:1) 0.21 ± 0.01 0.21 ± 0.01 0.21 ± 0.01 0.21 ± 0.03 PE(P-18:1/18:1) 0.67 ± 0.04 0.66 ± 0.02 0.65 ± 0.01 0.63 ± 0.02 PE(P-18:1/18:2) 0.06 ± 0.01 0.05 ± 0.01 0.05 ± 0.01 0.05 ± 0.00 PE(P-18:1/18:3) 0.02 ± 0.01 0.01 ± 0.00 0.02 ± 0.01 0.01 ± 0.00 PE(P-18:1/20:3) 0.25 ± 0.01 0.24 ± 0.02 0.24 ± 0.03 0.24 ± 0.01 PE(P-18:1/20:4) 0.46 ± 0.05 0.45 ± 0.01 0.44 ± 0.03 0.40 ± 0.03 PE(P-18:1/20:5) 0.14 ± 0.01 0.14 ± 0.00 0.14 ± 0.01 0.13 ± 0.01 PE(P-18:1/22:3) 0.02 ± 0.00 0.02 ± 0.00* 0.03 ± 0.01 0.02 ± 0.00 PE(P-18:1/22:4) 0.03 ± 0.00 0.03 ± 0.00 0.03 ± 0.00 0.03 ± 0.01 PE(P-18:1/22:5) 0.31 ± 0.01 0.32 ± 0.01 0.33 ± 0.03 0.30 ± 0.02PE(P-18:1/22:6) 0.36 ± 0.01 0.35 ± 0.02 0.35 ± 0.01 0.33 ± 0.02 PE-P 9.99 ± 0.22 10.01 ± 0.30 9.99 ± 0.21 9.48 ± 0.08* PS(32:1) 0.04 ± 0.00 0.06 ± 0.00* 0.04 ± 0.00* 0.03 ± 0.00 PS(34:1) 0.36 ± 0.02 0.41 ± 0.02* 0.40 ± 0.01 0.30 ± 0.02* PS(36:1) 1.35 ± 0.04 1.63 ± 0.09* 1.53 ± 0.09* 1.31 ± 0.09 PS(36:2) 0.33 ± 0.02 0.41 ± 0.01* 0.39 ± 0.04 0.27 ± 0.04 PS(38:1) 0.14 ± 0.01 0.17 ± 0.01* 0.15 ± 0.01 0.14 ± 0.01 PS(38:2) 0.22 ± 0.01 0.26 ± 0.01* 0.24 ± 0.02 0.22 ± 0.03 PS(38:3) 0.23 ± 0.01 0.30 ± 0.02* 0.26 ± 0.01* 0.22 ± 0.01 PS(38:4) 0.08 ± 0.01 0.09 ± 0.01 0.10 ± 0.01 0.05 ± 0.00* PS(38:5) 0.05 ± 0.01 0.05 ± 0.00 0.04 ± 0.01 0.04 ± 0.00 PS(38:6) 0.05 ± 0.01 0.04 ± 0.01 0.03 ± 0.00* 0.03 ± 0.00* PS(40:3) 0.05 ± 0.01 0.06 ± 0.00 0.06 ± 0.01 0.05 ± 0.00

124
PS(40:4) 0.08 ± 0.01 0.08 ± 0.02 0.08 ± 0.01 0.08 ± 0.02 PS(40:5) 0.45 ± 0.04 0.52 ± 0.05 0.52 ± 0.06 0.45 ± 0.06 PS(40:6) 0.62 ± 0.04 0.72 ± 0.05 0.68 ± 0.06 0.56 ± 0.02PS(40:7) 0.19 ± 0.02 0.21 ± 0.04 0.26 ± 0.01* 0.19 ± 0.03 PS 4.22 ± 0.14 5.00 ± 0.13* 4.78 ± 0.22* 3.93 ± 0.33 PI(32:1) 0.11 ± 0.01 0.13 ± 0.03 0.12 ± 0.02 0.23 ± 0.03* PI(34:1) 0.62 ± 0.03 0.71 ± 0.07 0.64 ± 0.08 0.87 ± 0.03* PI(34:2) 0.39 ± 0.03 0.38 ± 0.03 0.30 ± 0.01* 0.39 ± 0.08 PI(36:1) 0.71 ± 0.02 0.74 ± 0.07 0.58 ± 0.04* 0.63 ± 0.07 PI(36:2) 1.73 ± 0.07 1.71 ± 0.02 1.41 ± 0.11* 1.38 ± 0.12* PI(36:3) 0.32 ± 0.03 0.36 ± 0.03 0.30 ± 0.02 0.33 ± 0.02 PI(36:4) 0.46 ± 0.04 0.56 ± 0.02* 0.57 ± 0.02* 0.44 ± 0.04 PI(38:2) 0.34 ± 0.08 0.28 ± 0.03 0.24 ± 0.02 0.21 ± 0.04 PI(38:3) 1.16 ± 0.06 1.08 ± 0.02 0.90 ± 0.01* 0.84 ± 0.03* PI(38:4) 3.16 ± 0.10 3.39 ± 0.20 2.86 ± 0.10* 2.26 ± 0.12* PI(38:5) 1.06 ± 0.11 1.20 ± 0.10 1.27 ± 0.10 0.88 ± 0.03PI(38:6) 0.09 ± 0.03 0.11 ± 0.01 0.10 ± 0.01 0.09 ± 0.04 PI(40:5) 0.13 ± 0.03 0.12 ± 0.02 0.07 ± 0.04 0.09 ± 0.01PI(40:6) 0.12 ± 0.02 0.07 ± 0.02* 0.03 ± 0.04* 0.07 ± 0.03 PI 10.41 ± 0.36 10.84 ± 0.49 9.38 ± 0.24* 8.71 ± 0.48* PG(34:0) 0.19 ± 0.03 0.23 ± 0.01 0.19 ± 0.05 0.23 ± 0.04 PG(34:1) 0.60 ± 0.06 0.52 ± 0.01 0.54 ± 0.03 0.65 ± 0.06 PG(34:2) 0.18 ± 0.00 0.15 ± 0.02* 0.21 ± 0.02 0.17 ± 0.03 PG(36:1) 0.28 ± 0.04 0.26 ± 0.06 0.28 ± 0.06 0.34 ± 0.04 PG(36:2) 0.37 ± 0.03 0.40 ± 0.04 0.33 ± 0.04 0.47 ± 0.03* PG 1.63 ± 0.12 1.56 ± 0.05 1.55 ± 0.11 1.86 ± 0.15 CL68:4 0.26 ± 0.09 0.21 ± 0.02 0.11 ± 0.06 0.23 ± 0.03 CL70:4 0.20 ± 0.03 0.24 ± 0.09 0.17 ± 0.04 0.23 ± 0.03CL70:5 0.28 ± 0.05 0.18 ± 0.05 0.15 ± 0.08 0.34 ± 0.02 CL 0.74 ± 0.14 0.63 ± 0.06 0.43 ± 0.11* 0.79 ± 0.07 SM(d18:1/14:0) 0.04 ± 0.02 0.03 ± 0.01 0.02 ± 0.01 0.02 ± 0.01 SM(d18:0/16:0) 0.08 ± 0.04 0.05 ± 0.04 0.05 ± 0.02 0.05 ± 0.04 SM(d18:1/16:0) 0.76 ± 0.10 0.85 ± 0.13 0.80 ± 0.01 0.81 ± 0.09 SM(d18:1/16:1) 0.05 ± 0.03 0.04 ± 0.03 0.08 ± 0.03 0.05 ± 0.01 SM(d18:1/17:0) 0.03 ± 0.02 0.03 ± 0.01 0.00 ± 0.01 0.02 ± 0.01 SM(d18:1/18:0) 0.18 ± 0.05 0.13 ± 0.05 0.16 ± 0.04 0.11 ± 0.06 SM(d18:1/20:0) 0.20 ± 0.06 0.09 ± 0.02* 0.06 ± 0.05* 0.06 ± 0.05* SM(d18:1/22:1) 0.06 ± 0.03 0.05 ± 0.03 0.05 ± 0.01 0.10 ± 0.02 SM(d18:1/22:0) 0.24 ± 0.06 0.08 ± 0.05* 0.20 ± 0.15 0.17 ± 0.09SM(d18:1/24:0) 0.08 ± 0.01 0.10 ± 0.03 0.11 ± 0.03 0.12 ± 0.04 SM(d18:1/24:1) 0.35 ± 0.01 0.26 ± 0.04* 0.33 ± 0.04 0.35 ± 0.03SM 2.06 ± 0.07 1.70 ± 0.31 1.87 ± 0.16 1.86 ± 0.30 LPC(16:0) 0.41 ± 0.01 0.47 ± 0.04 0.36 ± 0.05 0.57 ± 0.05* LPC(16:1) 0.05 ± 0.01 0.05 ± 0.00 0.04 ± 0.01 0.06 ± 0.01 LPC(18:0) 0.12 ± 0.02 0.14 ± 0.02 0.14 ± 0.01 0.24 ± 0.02* LPC(18:1) 0.15 ± 0.01 0.13 ± 0.01 0.13 ± 0.01 0.20 ± 0.02* LPC(18:2) 0.01 ± 0.00 0.00 ± 0.00* 0.01 ± 0.01 0.01 ± 0.00 LPC 0.74 ± 0.03 0.80 ± 0.08 0.67 ± 0.08 1.08 ± 0.09* Cer(d18:1/16:0) 0.14 ± 0.00 0.16 ± 0.00* 0.17 ± 0.01* 0.17 ± 0.01* Cer(d18:1/18:0) 0.04 ± 0.00 0.05 ± 0.01 0.06 ± 0.00* 0.05 ± 0.00 Cer(d18:1/20:0) 0.04 ± 0.00 0.04 ± 0.00 0.05 ± 0.00* 0.04 ± 0.00

125
Cer(d18:1/22:0) 0.07 ± 0.01 0.09 ± 0.00* 0.11 ± 0.01* 0.09 ± 0.01 Cer(d18:1/23:0) 0.01 ± 0.00 0.01 ± 0.00 0.01 ± 0.00 0.01 ± 0.00 Cer(d18:1/24:0) 0.15 ± 0.00 0.17 ± 0.01* 0.21 ± 0.02* 0.19 ± 0.01*Cer(d18:1/24:1) 0.13 ± 0.01 0.15 ± 0.01* 0.16 ± 0.01* 0.16 ± 0.01* GluCer(d18:1/16:0) 0.14 ± 0.01 0.17 ± 0.00* 0.18 ± 0.02* 0.17 ± 0.01*GluCer(d18:1/24:1) 0.19 ± 0.01 0.20 ± 0.01 0.20 ± 0.02 0.20 ± 0.01 Cer 0.93 ± 0.03 1.06 ± 0.04* 1.16 ± 0.08* 1.08 ± 0.06* CE14:0 0.02 ± 0.00 0.02 ± 0.00 0.02 ± 0.00 0.02 ± 0.00 CE15:0 0.01 ± 0.00 0.01 ± 0.00 0.01 ± 0.01 0.01 ± 0.00 CE16:0 0.11 ± 0.02 0.10 ± 0.02 0.10 ± 0.00 0.13 ± 0.01 CE16:1 0.04 ± 0.00 0.04 ± 0.01 0.04 ± 0.01 0.04 ± 0.00 CE18:0 0.03 ± 0.00 0.03 ± 0.00 0.03 ± 0.00 0.03 ± 0.00 CE18:1 0.09 ± 0.00 0.07 ± 0.01* 0.08 ± 0.01 0.10 ± 0.00* CE18:2 0.01 ± 0.00 0.01 ± 0.00 0.01 ± 0.00 0.02 ± 0.00* CE18:3 0.01 ± 0.00 0.00 ± 0.00 0.00 ± 0.00 0.00 ± 0.00 CE20:0 0.03 ± 0.00 0.03 ± 0.00 0.04 ± 0.00 0.03 ± 0.01CE20:1 0.00 ± 0.00 0.00 ± 0.00 0.00 ± 0.00 0.00 ± 0.00 CE20:4 0.01 ± 0.00 0.01 ± 0.00 0.01 ± 0.00 0.02 ± 0.00CE20:5 0.00 ± 0.00 0.00 ± 0.00 0.00 ± 0.00* 0.00 ± 0.00 CE22:1 0.01 ± 0.00 0.00 ± 0.00 0.01 ± 0.00 0.00 ± 0.00 CE22:6 0.01 ± 0.00 0.01 ± 0.00 0.00 ± 0.00* 0.01 ± 0.00 CE 0.38 ± 0.03 0.35 ± 0.02 0.35 ± 0.03 0.41 ± 0.01 Chol 13.56 ± 0.04 14.93 ± 0.39* 15.77 ± 0.51* 14.84 ± 0.42*
B16 cells were left untreated at 37 °C, treated at 41 °C, 43 °C or with 40 mM BA for 1 h. Lipids were quantified by ESI-MS/MS. Data are expressed as mol % of analyzed lipids and presented as means ± SD (n = 4), *q < 0.025 compared to 37 °C. q < 0.025 corresponds ca. p < 0.015 and predicts 1 false positive result out of 40 significant as shown in Figure 4.16. It means that with 116 statistically-significant results, the expected number of false positive discoveries were less than 3. For further details of statistic see Materials and methods.
Figure 4.16. Statistical relationships between (A) p value and q value, (B) q value cut-off
and number of significant tests and (C) significant tests and expected false positive
results. The plots were generated by Q-value RGui in R statistical program (www.r-
project.org). The red lines depict the given p value, the number of significant tests and the
number of expected false positive results at q = 0.025.

126
CHAPTER 5. HEAT STRESS CAUSES SPATIALLY-
DISTINCT MEMBRANE RE-MODELLING IN K562
LEUKEMIA CELLS
All experiments, evaluation and statistical analysis were performed by myself, with the
following exceptions: DPH lifetime and Laurdan two-photon microscopy analyses were
performed in collaboration with Tiziana Parasassi and Giuseppe Maulucci, respectively,
in different laboratories in Rome. EPR spectroscopy measurements were run together
with Elfrieda Fodor, while DPH and LD540 microscopy were done together with Imre
Gombos. Data evaluations were performed in collaboration with Tiziana Parasassi,
Elfrieda Fodor and Giuseppe Maulucci. Zsolt Török, Sándor Benkő, Ibolya Horváth,
Tibor Páli, Mária Péter and Marco De Spirito took valuable part in the interpretation of
results. The paper published from this research was written by myself, Mária Péter, Ibolya
Horváth, Tiziana Parasassi and Tibor Páli, and critically reviewed by László Vígh, Ibolya
Horváth, Tiziana Parasassi and John L. Harwood. The contribution of all co-authors is
gratefully acknowledged.
Recently, there has been considerable interest in the application of hyperthermia in
cancer treatment. This is a promising therapy modality for tumours, especially in
combination with radiotherapy, because various tumours are often more thermally
sensitive than normal tissues (Grimm et al., 2009). However, the primary target of
cellular heat killing is still unknown. More than 30 years ago it was proposed that
tumour cell membranes are the primary targets for heat treatment and that the
effectiveness of hyperthermic cell killing is influenced strongly by the fluidity of
membranes (Yatvin et al., 1979). In agreement with this idea, the use of membrane
fluidizing agents (such as local anaesthetics) was shown to potentiate the therapeutic
effect of hyperthermia (Yatvin et al., 1979).
It has also been noticed that, cells exposed to non-lethal increased temperatures or
treated with a variety of compounds targeting membranes develop a stronger resistance
to a subsequent severe HS (Vigh et al., 2005) – a process known as acquired
thermotolerance. A major obstacle for many types of antitumour treatment is that they
induce a HSR thus causing tumours to be more resistant to later treatments. Amongst
other effects, the HSR restores the normal protein folding environment by upregulating
Hsps and altering their subcellular locations (Dempsey et al., 2010; Horváth et al., 2008;
Kirkegaard et al., 2010; Multhoff, 2007). This changes the pathways regulating cell
growth, metabolism and survival.
Several reviews recently have considered the question as to how membrane
structural alterations can be linked to the Janus-like properties of hyperthermia in cancer

127
therapy has been addressed in recent reviews (Calderwood and Ciocca, 2008; Grimm et
al., 2009). In addition, cellular membranes have been implicated as the primary heat
sensors (Vigh et al., 2007a; Vigh et al., 2007b) as well as in the decision-making for
thermal cell killing (Grimm et al., 2009; Moulin et al., 2007).
In earlier research it was demonstrated that membrane hyperfluidization acts as a
primary signal to initiate the Hsp response in prokaryotes (Horváth et al., 1998;
Shigapova et al., 2005), yeast (Carratù et al., 1996), K562 leukemia (Balogh et al.,
2005) and B16 melanoma cells (Nagy et al., 2007). In a similar fashion to HS, exposing
K562 cells to BA, which is a known membrane fluidizing agent (Kitagawa and Hirata,
1992; Maula et al., 2009), caused very similar increases in cytosolic Ca2+ concentration,
Hsp70 synthesis and mitochondrial hyperpolarization (Balogh et al., 2005). In addition,
the microdomain organization of PMs was revealed to be an important factor in the
detection and transduction of heat- or non-proteotoxic chemical agent-induced
membrane stress into signals that give rise to the transcriptional activation of hs genes in
B16 melanoma cells (Nagy et al., 2007). In recent reviews, the temporal and spatial
regulation of the membrane hyperfine structure have been discussed as being a hallmark
of sensing and signalling events following cellular stress (Horváth et al., 2008; Vigh et
al., 2007a).
An alteration in the physical state of membranes is caused in the post-heat phase
of HS (Dynlacht and Fox, 1992a; Dynlacht and Fox, 1992b; Revathi et al., 1994).
Furthermore, it is well known that phospholipases and sphingomyelinases are activated
during various stresses, therefore hydrolysing existing membrane lipids and giving rise
to lipid mediators (Balogh et al., 2010; Calderwood and Stevenson, 1993; Calderwood
et al., 1993; Escribá et al., 2008; Moulin et al., 2007). The metabolites which are
produced, such as lysoPLs, FFA, DAG, MAG or Cer, together with newly synthesized
lipid molecular species, may be produced at different membrane positions causing
formation, segregation or rearrangement of membrane microdomains. Moreover,
recently it was reported that alterations in membrane fluidity and/or microheterogeneity
achieved either by heat or a fluidizing agent caused marked and highly-specific changes
in the membrane lipid composition of B16 cells (Balogh et al., 2010). In addition, it can
be assumed that, together with the retailoring of certain lipid molecular species and
changes in lipases or certain members of PKC family (Escribá et al., 2008), some
preexisting subpopulations of Hsps may also become associated with membranes in
cells that had been exposed to hyperfluidization stress. Some Hsps are known to be
associated with the surface or located within intracellular membranes (Horváth et al.,

128
2008; Multhoff, 2009; Vigh et al., 2005; Vigh et al., 2007a; Vigh et al., 2007b) possibly
associated with ordered microdomains (“rafts”) (Broquet et al., 2003; Dempsey et al.,
2010; Stangl et al., 2011). In addition, Hsps have been shown to alter major properties
of the membrane lipid phase state such as the fluidity, permeability, or non-bilayer
propensity because of their specific interactions with membrane lipids (Tsvetkova et al.,
2002; Török et al., 1997).
In order to gain further information about the role of membranes during
hyperfluidization-induced stress, K562 cells were used. These were stressed by
increased heat and the resultant membrane organisation changes were monitored by
Laurdan, which can be regarded as the ideal probe to examine lateral structure of
membranes in living cells by two-photon excitation fluorescence microscopy (Parasassi
et al., 1997). Laurdan’s even distribution in membranes, and its lipid phase-dependent
emission spectral shift allowed the possibility of accumulating novel results compared
to those produced using fluorescent probes which mainly partition into specific
membrane regions but whose fluorescence intensities and spectral maxima are not
usually sensitive to the lipid phase state (Bagatolli, 2006). By using Laurdan-labelled
K562 cells, membrane lateral packing could be spatially resolved and/or domain
information could be directly accumulated from the fluorescent images. I compared
these results with those produced by “classical” approaches, which provide “bulk”
information such as anisotropy or fluorescence lifetime measurements using DPH
analogues and electron paramagnetic resonance (EPR) measurements with spin-labelled
probes. By using these methods in heat-primed vs. non-stressed cells or isolated PMs I
was able to gain important new insights about the various types of surface and
intracellular membrane events initiated by HS.
5.1. MATERIALS AND METHODS
5.1.1. Materials
DPH, TMA-DPH, DPH-PA and 6-dodecanoyl-2-dimethylaminonaphthalene (Laurdan)
were from Molecular Probes, Inc. (Eugene, Oregon, USA). RPMI-1640 medium and 5-
and 16-(4',4'-dimethyloxazolidine-N-oxyl) stearic acid spin labels (5- and 16-SASL)
were purchased from Sigma (Steinheim, Germany). BA of analytical grade was from
Merck (Darmstadt, Germany). The LD-specific dye LD540 was a generous gift from

129
Professor Christoph Thiele (Bonn, Germany). All other chemicals were purchased from
Sigma and were of the best available grade.
5.1.2. Cell culture
K562 cells (ATCC: CCL-243) were cultured in RPMI-1640 medium, supplemented
with 10 % FCS and 2 mM glutamine in a humidified 5 % CO2, 95 % air atmosphere at
37 °C and routinely subcultured in every three days for maximum four passages.
5.1.3. Fluorescence anisotropy
The PM fraction of K562 cells was isolated, labelled and membrane fluidity was
measured as detailed in Chapter 2.5. Isolated PMs were labelled with 0.2 µM DPH or its
derivatives, TMA-DPH and DPH-PA at a molar ratio of about 1:200 probe/phospholipid
for 5 min. For in vivo fluidity measurements, K562 cells were labelled with 0.2 µm
DPH for 30 min, or with DPH-PA and TMA-DPH for 5 min. Steady-state fluorescence
anisotropy was measured in a PTI spectrofluorometer.
In order to follow the temperature dependence of fluidity, the temperature was
maintained at 37 °C for 5 min, programmed at 0.4 °C/min from 37 °C to 42 °C,
maintained isothermally for 1 h, cooled down gradually (0.4 °C/min) to 37 °C and held
for 5 min. The time course of the fluorescence anisotropy upon addition of BA was
performed as follows: cells were incubated at 37 °C for 5 min and BA (30 mM) was
introduced into the cuvette. Anisotropy results were collected every 30 s for temperature
dependence for 120 and for 50 min in the case of BA treatment.
5.1.4. DPH lifetime distribution studies
Labelling of K562 cells was with 0.2 µM DPH for 30 min. Time-resolved emission was
measured using the K2 phase fluorometer (ISS Inc., Champaign, Illinois, USA) (Gratton
and Limkeman, 1983). The excitation source was a He-Cd laser ( = 325 nm). Phase
and modulation data were collected using 9 modulation frequencies ranging from 2 to
180 MHz. Lifetime measurements were performed using a reference solution of 1,4-
bis(5-phenyloxazol-2-yl)benzene in ethanol ( = 1.35 ns). Emission was observed
through a KV370 cutoff filter (Schott Glass Technologies Inc., Duryea, PA). Data were

130
analyzed using the Globals Unlimited software (Laboratory for Fluorescence Dynamics,
University of California at Irvine, USA).
5.1.5. EPR studies
EPR spectroscopy is a sensitive tool for the detection of paramagnetic species (e.g. free
radicals, transition metal ions). Except for rare cases, biomembranes are transparent to
EPR measurements unless stable free radicals are introduced (Berliner, 1976). Spin-
labelling is a technique of introducing stable nitroxide radicals into biological samples
at low, non-perturbing concentrations; in this study stearic acid spin labels (5- and 16-
SASL) were used. Spin-label EPR spectroscopy has become a very useful technique for
examining biological membranes, because it has an optimal time scale to study
membrane dynamics (Marsh and Horvath, 1989). The time window of conventional
EPR spectroscopy – when the spectrometer works in the so-called X-band (9 GHz)
region – is determined by the spectral anisotropy of the nitroxide group of the spin-label
and ranges between 10-11–10-7 s, which optimally matches the time scale of the
rotational motions of the lipids in membranes. The EPR spectra of these probes
comprises three hyperfine lines (assigned as high-field, center-field, and low-field
peaks). The hyperfine splitting results from the coupling of the nitrogen unpaired
electron spin with the nitrogen nuclear spin (see Figure 5.9). The spectra are sensitive –
among other factors – to molecular motions, and also to the nature of the medium in
which the probe is dissolved. Thus, information can be obtained regarding the physical
state and dynamic properties of the membrane and membrane constituents (e.g.
mobility, lipid order, polarity) (Boggs and Mason, 1986; Marsh, 2001). The sensitivity
of spin-label EPR spectroscopy to membrane dynamics has an additional valuable
consequence. In natural membranes or in lipid–protein complexes, two-component EPR
spectra are usually obtained indicating the presence of two lipid populations with
different mobilities (Marsh and Horvath, 1989). The lipids at the interface of the
proteins are immobilized, thus the corresponding bulk and protein-associated
components are well resolved in the EPR spectrum. Therefore, it is possible to
quantitate both the stoichiometry and the selectivity of the interactions of different spin-
labelled lipids with the protein, and to study the dynamics of the protein-associated
lipids (Horváth, 1994; Marsh and Horváth, 1998).
Cells were kept at 37 °C (control) or heat-shocked at 42 °C for 1 h and pelleted by
centrifugation at 400 g for 5 min and subsequently washed twice in excess volume of

131
phosphate buffered saline pH = 7.4 (PBS) at 37 °C. The final cell pellets were
resuspended in PBS at a concentration of 1.2 x 10⁷ cells/ml. For membrane samples, the
spin-labelled lipid probe is usually added exogenously to the aqueous membrane
dispersion as a small volume of concentrated solution in organic solvent (that is
harmless to the biomembrane). Ethanol-mediated labelling has the advantage that it can
be controlled very conveniently and quantitatively. Accordingly, for EPR measurements
2.5 μL of 5-SASL (2.5 mg/ml in ethanol) or 5 μL of 16-SASL (1 mg/ml in ethanol) spin
label was added to an aliquot of 400 μL cell suspension, the mixture was kept for 5 min
at room temperature and occasionally vortexed. In order to free the sample from
unincorporated spin label and the organic solvent, cells were pelleted by centrifugation
at 400 g for 5 min and the pellet introduced into 1 mm diameter EPR glass capillary.
Glass capillaries have the advantage that they can be easily flame-sealed, and their
background signal is usually very weak and broad, and does not disturb the spin label
spectrum. After sealing, the capillaries were further centrifuged in a bench top
centrifuge (400 g, 5 min) and the excess supernatant was removed to obtain a sample
length of 5 mm in each capillary. This was important, because water absorbs microwave
thereby leading to a weaker signal. In addition, in the case of single-chain spin-labelled
lipids, e.g. FAs, removal of excess supernatant is especially important, because these
type of labels, due to their partial solubility in water, may establish a partition
equilibrium. EPR spectra were measured in a Bruker (Rheinstetten, Germany) ECS 106
X-band spectrometer equipped with a TE102 cavity and a nitrogen gas flow temperature
regulator at 37 °C or 42 °C. Microwave power was 2 mW and 100 kHz field modulation
with an amplitude of 0.1 mT was used for first-harmonic detection. Spectra were
centred around 335 mT and scanned over a field width of 10 mT. For each sample, two
spectra were accumulated with 20.5 ms averaging at each of the 1024 field steps. The
time elapsed from labelling the sample and recording the spectra was marked and
comparisons were made between spectra recorded at the same time intervals, to avoid
any mismatch between the redistribution of the spin probe with time in the live cells.
The spectra were recorded within the time interval where the rate of reduction of the
doxylstearate due to internalization followed by mitochondrial reduction of the probe
was negligible (Duda et al., 1994). Peak heights and positions were measured using the
corresponding routines in the Bruker software as well as the numerical integration of the
spectra after baseline correction.

132
5.1.6. Laurdan two-photon microscopy
Laurdan displays a lipid phase-dependent emission spectral shift. This red shift due to
altered water penetration into the lipid bilayer allows the estimation of lipid packing
orders within the membranes of intact and living cells (Gaus et al., 2003). Originally,
the generalized polarization GP was defined analogous to the classical fluorescence
polarization P=(I1-I2)/I1+I2) where I1 and I2 represent two different (perpendicular)
orientations of the observation polarizer. For phospholipid vesicles Laurdan emission
wavelengths of 440 and 500 nm correspond to the emission maxima in the gel and in the
liquid crystalline phases, respectively; GP=(I440-I500)/I440+I500) (Parasassi et al., 1990).
In two-photon fluorescence microscopy (excitation at 800 nm) the two intensity images
between 400–460 nm and 470−530 nm are collected simultaneously. Thus, GP defined
as
, where G is a calibration factor for the instrument
response.
In order to study the membranes properties of K562 cells by Laurdan two-photon
microscopy the cells were labelled directly in the cell culture media. The stock Laurdan
solution concentration was 1 mM in dimethyl sulfoxide (DMSO), and it was replaced
every three weeks. 10 μL of Laurdan stock solution was added per mL of RPMI
medium. After 30 min of incubation in the dark at room temperature or at 42 °C, the
cells were centrifuged, resuspended in RPMI medium at 22 °C and mounted upon a
microscope slide.
An inverted confocal microscope (DMIRE2, Leica Microsystems, Germany) with
a 63X oil immersion objective (NA 1.4) under excitation at 800 nm with a mode-locked
Titanium-Sapphire laser (Chamaleon, Coherent, Santa Clara, California, USA) was used
to obtain Laurdan intensity images. Internal photon multiplier tubes collected images in
an eight bit, unsigned images at a 400 Hz scan speed. Simultaneous recordings with
emission in the range of 400–460 nm and 470–530 nm and imaging was performed at
22 °C to obtain the Laurdan intensity images. GP images was calculated for each pixel
using the intensity images. G was obtained from the measurement of GP values of
Laurdan solution in DMSO at 22 °C (GPexp) calculating with a known GP value of
GPDMSO = 0.207 as follows:
G = (GPDMSO + GPDMSOGPexp − 1 − GPexp)/(GPDMSOGPexp − GPDMSO + GPexp − 1).

133
The G factor had ~2 % variation across the imaging area. GP images (as eight-bit
unsigned images) were pseudocoloured in ImageJ. Background was determined from
areas without cells (it corresponded to intensities below 7 % of the maximum intensity),
were set to zero and coloured black. The histogram values for GP were determined
within multiple circular Regions-of-Interest (ROI) with 20 pixel diameter (Area 316
pixel) for different membrane regions. The ROI for PM were chosen along the contour
profile of the cell, the perinuclear ROI along the contour profiles of the nuclei, the ROI
for internal membranes (except the perinuclear region) in the rest of the cell. n = 10 ROI
were measured for each membrane region within one cell. 3 control and 3 heat-stressed
cells were analysed.
Analysis and line profiles of acquired images were performed with ImageJ
(http://rsbweb.nih.gov/ij/).
5.1.7. Fluorescence microscopy
Using suspensions of K562 cells in PBS, labelling was with 2 µM DPH-PA, TMA-DPH
or DPH for 5 min or 30 min at 37 °C or 42 °C as indicated. For experiments with
double-labelling, cells were labelled with a mixture containing 2 µM DPH and 30 nM
LD540 for 30 min. Images were taken with a CytoScout fluorescent microscope (Upper
Austrian Research GmbH, Linz, Austria) using a 100x objective, D365/10 and D405/30
filter for excitation and emission of DPH and HQ532/70 and HQ 600/40 filters for
excitation and emission of the LD540 probe.
5.1.8. Statistics
Results are presented as means ± SD and compared for significance using Student’s t-
test (paired or unpaired; details are given in the Figures).

134
5.2. RESULTS
5.2.1. Laurdan two-photon microscopy shows that heat stress
gives rise to spatially-distinct membrane re-organisation in
vivo
In order to examine alterations in the physical state of cell membranes following a short
HS (42 °C, 1 h), Laurdan fluorescence using two-photon microscopy were measured.
Laurdan is an environmentally-sensitive fluorescence probe that gives a spectral shift of
emission which depends on the lipid phase state, i.e., bluish in ordered, gel phases and
greenish in disordered, liquid-crystalline phases. The probe distributes itself equally in
lipid phases and does not associate preferentially with phospholipid headgroups or
specific fatty acids. As a normalized ratio of the intensity at the two emission
wavelengths regions, the generalized polarization (GP) provides a measure of
membrane order, in the range between +1 (gel) and −1 (liquid-crystalline) (Bagatolli,
2006; Parasassi et al., 1991).
GP images of Laurdan-labelled K562 cells revealed high-GP regions at the PM
while low-GP regions were mainly found at perinuclear and internal membranes (Figure
5.1A). This was in agreement with previous findings using various cell types (Yu et al.,
1996). When cells were treated at 42 °C for 1 h and afterwards cooled down to 22 °C
for the fluorescence analysis, in general the membranes showed more disorder than in
the non-stressed controls (Figure 5.1B). This caused an average shift towards lower GP
values (Figure 5.1C).
Detailed examination also revealed that the endomembranes and the PM of the
K562 cells subjected to HS displayed contrasting behaviour. Moreover, the findings by
Region-of-Interest (ROI) analysis showed that the PM became more rigid, while the
internal membranes, especially the perinuclear region became more fluid following HS.
The GP profiles of high resolution pictures clearly show the condensed cell surface and
disordered inner membrane region in post-heat cells when compared to non-stressed
cells (Figure 5.2).

135
Figure 5.1. Heat shock induces membrane changes as visualised by Laurdan two-photon
microscopy. K562 cells in RPMI medium were treated at 42 °C for 1 h and imaged (A)
before and (B) after HS at room temperature (21 °C). The colour chart in Panel A
represents Laurdan GP values as indicated. Bars in A and B, 6 m. (C) Histogram of GP
changes observed in whole cell and in subcellular (perinuclear, internal and plasma
membrane) regions. An example set of ROIs used for quantification of subcellular GP
distribution is given in panel A. Data are expressed as means ± SD, n = 30, *p<0.05
compared to the control, unpaired t-test.

136
Figure 5.2. High resolution images of the cell border showing the general polarisation
distribution. K562 cells in RPMI medium were treated at 42 °C for 1 h and imaged (A)
before and (B) after HS at room temperature (21 °C). Bars in A and B, 1 m. (C) GP
profile along blue lines shown in panels A and B. For other details see Figure 5.1.
5.2.2. Fluorescent polarisation revealed the usual fluidity
changes in isolated membranes but unusual alterations in
cells
Different probes were used in order to examine the heat-induced membrane
rearrangements in more detail. DPH fluorescent probes with negatively or positively
charged surface anchors (DPH-PA or TMA-DPH, respectively) as well as DPH itself
were employed. K562 cells were treated for 1 h at 42 °C. After harvesting, they were
labelled at 37 °C for 30 min (DPH) or 5 min (TMA-DPH, DPH-PA). These times had
been shown to be appropriate for the individual probes (Balogh et al., 2005). Alterations
in fluorescence anisotropy revealed a fluidity decrease with DPH-PA as well as with
DPH. However, a fluidity increase was found with TMA-DPH (Figure 5.3).
The time course of heat-induced membrane rearrangements was followed by
measuring alterations in membrane fluidity in living cells. These were compared with
results from PM isolates which represented non-responding controls. In both cases a
heating/cooling cycle was used. For isolated PMs, as expected, a fluidity increase

137
during the heating period was found with all three labels. The fluidity returned
completely to its starting value on return to 37 °C (Figure 5.4).
A different pattern was found with cells. In contrast to the “normal” fluidity–
temperature profile of PMs, membrane fluidity measurements conducted on living cells
displayed an anomalous response to HS. The negatively charged probe DPH-PA did not
detect any change in lipid order during heating. However, an anisotropy increase was
found as soon as the temperature was returned back to 37 ºC when it became constant.
When TMA-DPH was used it revealed a strong membrane fluidization upon
temperature increase and a further slow, steady increase of membrane disordering
during 1 h exposure to 42 °C. When cells were returned to normal (37 °C) growth
temperature an ordering effect was observed, although anisotropy did not reach the
initial value. A prompt fluidization following shift to 42 °C was found for the DPH
probe after which a slight rigidization took place gradually at this temperature. The
DPH anisotropy value detected in cells on restoration of the normal 37 °C growth
temperature was higher than that measured prior to treatment (Figure 5.4).
Figure 5.3. Alterations in anisotropy as revealed by different fluorescent probes. K562
cells in RPMI medium were heat-treated at 42 °C for 1 h or left at 37 °C, harvested and
labelled with DPH-PA, TMA-DPH or DPH. The fluorescence steady-state anisotropy
measurement was performed at 37 °C and 5 min of trace was averaged. The anisotropy
differences were calculated relative to the 37 °C control values. Data are represented as
means SD, n = 4, *p< 0.05, paired t-test.

138
Figure 5.4. Fluorescence changes during heat treatment are different in isolated PMs
compared to intact cells. K562 cells or PM fractions isolated from untreated cells were
labelled with DPH-PA, TMA-DPH or DPH and the fluorescence steady-state anisotropy
(blue) was followed (representative traces are shown from n = 4 independent
experiments). Cyclic temperature shift was applied (red). The arrows indicate the
anisotropy difference at 37 °C before and after 42 °C HS.
5.2.3. Benzyl alcohol-induced fluidization also shows distinct
differences between isolated plasma membranes and cells
in vivo
In order to learn more about the kinetics of hyperfluidization-induced membrane
rearrangements, the action of the chemical membrane fluidizer BA was studied. This
was used at a previously selected concentration (30 mM), which showed various effects
that were found for 42 °C heat treatment (Balogh et al., 2005). Temporary fluidization
was observed in living cells as a result of BA addition. This was followed by an
exponential compensatory decay observed with DPH-PA and, to much smaller extent,
by DPH. When TMA-DPH was used as a probe only fluidization was detected and this
was almost stable after about 20 min. For isolated PMs, BA addition caused a very
pronounced fluidization, as expected, with all three probes (Figure 5.5).
Importantly, the in vivo heat cycling experiments using DPH and its analogues
were repeated using B16 mouse melanoma, L929 mouse fibroblastoid, WEHI164
mouse fibrosarcoma, HeLa human epithelial carcinoma and freshly isolated mouse
spleen cells with strikingly similar changes in the fluidity profiles observed upon heat or

139
BA treatment (Table 5.1). This indicates that the data with K562 cells can be applied to
other cell types.
Figure 5.5. Cells and isolated PMs show different changes in anisotropy upon benzyl
alcohol addition. K562 cells or PM fractions isolated from untreated cells were labelled
with DPH-PA, TMA-DPH or DPH and the fluorescence steady-state anisotropy was
followed at 37C (representative traces are shown from n = 4 independent experiments).
BA was administered as indicated (blue arrows).
Table 5.1. Fluorescence anisotropy changes during and after HS in different cell lines.
DPH-PA TMA-DPH DPH
HS 1h Post heat HS 1h Post heat HS 1h Post heat
B16 n=2
-0.001 ±0.0006
0.005 ±0.0017
-0.012 ±0.0043
-0.003 ±0.0014
-0.017 ±0.006
0.003 ±0.0017
L929 n=5
0.018 ±0.0022
0.025 ±0.0043
-0.011 ±0.0021
-0.004 ±0.0017
-0.013 ±0.0018
0.002 ±0.0016
WEHI164 n=2
-0.004 ±0.0019
0.002 ±0.0014
-0.009 ±0.0033
-0.003 ±0.0024
-0.006 ±0.0018
-0.004 ±0.0014
HeLa n=2
0.002 ±0.0008
0.008 ±0.0011
-0.013 ±0.0037
-0.006 ±0.0031
-0.008 ±0.0023
0.006 ±0.0023
mouse spleen cells n=2
0.009 ±0.0026
0.017 ±0.0033
-0.023 ±0.0061
-0.008 ±0.0047
0.002 ±0.0014
0.011 ±0.0048
B16, L929, WEHI169 and HeLa cells were cultured in DMEM supplemented with 10 % FCS, harvested by trypsinisation, washed twice and labelled as described in chapter 2.5. Freshly isolated mouse spleen cells were a generous gift from Duda laboratory BRC Szeged. HS was followed as in Figure 5.4. The anisotropy values were measured for 1 h at 42 °C for B16, L929, WEHI169 and HeLa cells and at 40 °C for mouse spleen cells (in order to keep the viability of spleen cells over 90 %). Thereafter the cuvette was cooled to 37 °C and after 5 min the post heat values were recorded. The anisotropy differences were calculated relative to the 37 °C control values. All measurements are expressed as the average of 5 min trace and presented as mean ± SD.

140
5.2.4. Changes in membrane heterogeneity, as detected by
lifetime distribution, are caused by heat stress
The membrane’s physical state can be evaluated by the DPH lifetime value, because the
membrane’s state causes a change in the dielectric constant of the probe’s environment
itself. Moreover, the dielectric constant is the particular property to which DPH
fluorescence lifetime responds (Parasassi et al., 1992). In a continuous distribution of
DPH lifetime values, the centre value gives information about the average polarity of
the entire fluorophore environment, while the full width at half maximum (abbreviated
to ‘width’, in the following text) yields a measure of the heterogeneity of this
environment. The DPH lifetime distribution was measured before, during and after 1 h
of HS at 42 °C in K562 cells (Figure 5.6).
Figure 5.6. DPH lifetime distribution in K562 cells reveals heat-induced membrane
heterogeneity changes. Cells were labelled with DPH. Phase and modulation data were
collected using 9 modulation frequencies ranging from 2 to 180 MHz. Measurements
were performed at 37 °C, during 1 h HS at 42 °C and in the post-heat phase after
returning to 37 °C (representative results are shown from two independent experiments).

141
While the centre values remained constant during the heating/cooling cycle, the width
altered with the different conditions when compared to the starting values. Thus, the
width decreased with heating, but increased, to values higher than initial ones, in the
post-heating phase (cells at 37 °C after HS). These data indicate a temporary relative
decrease in membrane heterogeneity during HS, followed by a return to a significantly
higher membrane heterogeneity in the post-heating phase.
5.2.5. DPH analogues distribute differently within cells
Information about the subcellular distribution of the probes is somewhat controversial in
the literature (see Discussion). Thus, in order to determine which subcellular
compartments were labelled by the probes, a fluorescence microscopic study was
carried out. After 5 and 30 min labelling periods at different temperatures with DPH and
its derivatives images were collected (Figure 5.7). It can be concluded from these results
that individual DPH analogues label different cellular compartments to varying extents.
DPH-PA showed a bright PM staining, but the nuclear membrane and an internal
lamellar structure (probably ER) were labelled as well. The fluorescence signal for the
PM was the most distinct with TMA-DPH which also revealed fainter, diffuse and
vesicular internal structures. Labelling was less intense with DPH for all the cellular
membranes which was unexpected. In fact, the brightest signals originated from discrete
spots, which were assumed to be lipid droplets (LD). The latter conclusion was tested
by a colabelling experiment. Cells were labelled with a LD-specific dye LD540 (Spandl
et al., 2009) and with DPH. Merging of the images showed that the spots stained with
DPH were almost completely colocalized with LDs stained with LD540 (Figure 5.8).
this provided conformation that the structures were most probably LDs.

142
Figure 5.7. Different fluorescent probes show different patterns of localization in K562
cells. Cells were incubated with different DPH analogues at 37 °C or 42 °C for 5 or 30
min as indicated. Fluorescence video microscopic images were recorded within 2 min
following the incubation (similar results were found in 3 independent experiments). Bar,
6 m.
Figure 5.8. Colocalization of DPH with lipid droplets in K562 cells. Cells were double-
stained with DPH and LD540 (which stains LDs) and examined with a CytoScout
fluorescence microscope. Bar, 6 m.

143
5.2.6. EPR studies provide confirmation that heat stress
causes re-arrangements of membrane structure
Spin-label EPR spectra can provide data on the membrane environment of nitroxide-
labelled stearic acids (Marsh, 1981; Páli et al., 2003). The stearic acid spin labels (5-
and 16-SASL) partition from the aqueous phase into membranes with high affinity with
their paramagnetic nitroxyl group located close to the lipid headgroup and near the
centre of the bilayer, respectively (see e.g., Páli et al., 1999). EPR spectra of K562 cells
labelled with 5- or 16-SASL were measured before, during and after HS (Figure 5.9).
These were then compared.
Figure 5.9. Spin-labelling of K562 cells reveals changes in membrane rigidization
following HS. EPR spectra of K562 cells labelled with 5- (top) and 16-SASL (bottom)
are shown. Spectra were recorded at 37 °C (blue lines, control), during 1 h HS at 42 °C
(black lines, HS) and after returning to 37 °C (red lines, after HS). The spectra are
normalised so that they represent the same number of spins. Total scan range is 10 mT.
The corresponding bar graphs show the normalized amplitudes of the center-field 14N
hyperfine EPR lines (mI = 0). Data are expressed as means ± SD, n = 3 (independent
preparations), *p < 0.05 compared to 37 C control, unpaired t-test.

144
There were no large alterations in hyperfine splitting, but significant alterations in the
line widths at both vertical locations, probed by 5- and 16-SASL, respectively were
observed (Figure 5.9). Increasing the temperature from 37 °C (blue lines) to 42 °C
(black lines) increased the amplitude of the EPR lines in a depth-dependent manner due
to motional line-narrowing (Figure 5.9). In the post-heat state when, after 1 h HS at 42
°C the measurements were carried out at 37 °C (red lines), however, a line-broadening
effect and a decrease in the line heights, indicating rigidization, compared to the pre-
heat state for both 5- and 16-SASL spin labels were found. To have an estimate of this
line broadening, the normalized amplitude values (maximum line height normalised to
the total spin label intensity, Dixon et al., 2004) were calculated and a similar relative
change was found between the pre- and post-heat state for both labels (ratios of 0.76 and
of 0.83 for 5- and 16-SASL (pre-heat:post-heat) center-field peaks, respectively, Figure
6.9, bar graphs).
5.3. DISCUSSION
5.3.1. Different probes reveal different aspects of membrane
organisation
It had been shown previously that non-proteotoxic membrane perturbants are able to
lower the temperature threshold for the HSR, i.e. to increase the expression of the Hsps
in mammalian cells (Balogh et al., 2005; Nagy et al., 2007). To examine membrane
alterations as a consequence of hyperfluidization stress, changes in membrane
organisation were followed by different methods. Each of the fluorescence and
paramagnetic probes used in this study were able to reveal membrane changes upon
heat and/or BA stress. However, it is intriguing to question why the membrane order
imaged by Laurdan and the membrane fluidity detected by different DPH analogues or
spin-labelled probes were rather different (Table 5.2). One can suggest many reasons for
environmental heterogeneity in relation to the properties of probes in specific
environments. For example, the distribution of probes among cellular membranes and
LDs, preference for the different leaflets of the PM, localization in a defined position
(depth), attraction to or repulsion from charged environments or partition into specific
lipid-lipid or lipid-protein organizations (domains or clusters) (Sklar, 1984). Thus, any
conclusions from experiments in which only a single probe has been utilised must be

145
made with great care and, indeed, general interpretations of membrane fluidity should
not be drawn.
Table 5.2. Characteristics of different probes used
Membrane localization Charge Effect seen at post-stress state*
Laurdan PM (confocal microscopy) no rigidization
Laurdan endomembranes (confocal microscopy)
no fluidization
Laurdan whole cell membrane no overall fluidization
DPH mainly LDs no rigidization
TMA-DPH
PM and PM-like endocytic compartments
positive fluidization
DPH-PA PM and endomembranes negative rigidization
5-SASL PM endomembranes? (not in mitochondria)
negative rigidization
16-SASL PM endomembranes? (not in mitochondria)
negative rigidization
* compared to the initial pre-stress state (control at 37 ºC). PM, plasma membrane; LD, lipid droplet.
5.3.2. Contrasting temperature-induced alterations in fluidity
in different cellular membranes were shown with Laurdan
Laurdan two-photon microscopy revealed clearly an increased order (or a decreased
fluidity) in PMs. This contrasted with a decreased membrane order (or an increased
fluidity) in the intracellular membranes (particularly perinuclear) when cells were pre-
exposed to HS. This conclusion was made possible because of the spatial resolution of
Laurdan GP microscopy images. Moreover, in whole cells, when the GP values were
averaged over all cell membrane compartments, a decreased order was obtained. This
overall fluidization effect after HS clearly did not reveal the subtle nature of the
subcellular alterations.

146
5.3.3. Depending on their chemical structure DPH analogues
distribute differently in cells
The intramembrane and subcellular localization of DPH analogues has been widely
studied. It has been proposed that they report, at least in part, from the PM (Revathi et
al., 1994). Thus, TMA-DPH strongly incorporates into PM within 5 min (Figure 5.7).
The internalization of this probe may be indicative of endocytosis, because the absence
of TMA-DPH from non-endocytic compartments has been reported (Coupin et al.,
1999). Moreover, using TMA-DPH fluorescence anisotropy assays it was concluded
that membrane fluidity remains the same in the endocytic and the PM compartments
(Illinger et al., 1995). When the microscopic images obtained were compared with those
from the Kuhry-group and bearing in mind the constant nature of the anisotropy during
the first 20 min trace at 37 °C (Figure 5.4), the above-mentioned view could be
corroborated. The data obtained with TMA-DPH showed an increased fluidity in PM
(and PM-like endocytic compartments) after HS. Post-heat fluidization of PM as
monitored with TMA-DPH was also found in liver cells after 42 °C heating by (Revathi
et al., 1994) and in several other cell lines following a severe 45 °C thermal challenge
(Dynlacht and Fox, 1992b). The negatively charged DPH-PA reporting from PM and
endomembranes (including the perinuclear region as well) (Figure 5.7) displayed a less
fluid environment after HS (Figures 5.3, 5.4) compared to TMA-DPH. Interestingly, the
anisotropy values in the post-stress relaxation period at 37 °C (Figure 5.4) showed the
same characteristics as were found with post-heat labelling (Figure 5.3). Thus,
anisotropy increased with DPH-PA and decreased with TMA-DPH. Therefore, it seems
that the different labelling periods (short - 5 min or long - 60 min) did not influence the
outcome of anisotropy values with these probes.
In addition to their different localization, positively or negatively charged probes
are thought to show leaflet specificity. However, several partly conflicting conclusions
are reported in the literature. Kitagawa et al. (1991) concluded that the quaternary
ammonium cation TMA-DPH binds first to the outer leaflet of the PM and then
gradually moves into the cytoplasmic side, distributing in both membrane leaflets but
mainly to the inner leaflet. In contrast, the fluorescence anisotropy of anionic DPH-PA,
according to these authors, reflects the fluidity of outer leaflet of the PM because of
electric repulsion from the region, due to the presence of acidic phospholipids. On the
other hand, the Schroeder group drew the opposite conclusion to explain their findings
by the “charge similarity” principle: TMA-DPH appears to selectively localize in the

147
outer leaflet, while the negatively charged DPH-PA appears to localize to the inner
leaflet of the PM (Gallegos et al., 2004). The Kurhy group (Coupin et al., 1999)
reported that TMA-DPH, once incorporated into the peripheral membranes, was
retained in the external leaflet of the bilayer. It is certainly possible, whatever the leaflet
specificity of these probes is, that they prefer different lipid microenvironments due to
their electric charge. In this vein, the FFA derivative (i.e. negatively charged) EPR
probes may partition in a similar fashion to DPH-PA in membranes reporting most
probably from the same charge-specific microenvironments. The localization of EPR
probes cannot be studied directly but the observed line broadening effects were not
dependent on the depth of the reporter moiety because it was seen that a similar relative
change in the normalised amplitude as a result of HS for both spin labels (Figure 5.9).
The line broadening was too small to determine which possible factors (e.g. changes in
rotational dynamics or spin-spin interaction) contributed significantly, but some
structural rearrangements, such as lateral reorganisation of membrane domains or an
overall decrease in membrane fluidity (Kota et al., 2002) could explain the observed
spectral effects. To summarise, I conclude that, the negatively charged fluorescent and
EPR probes (regardless of their vertical localization in the bilayer) reported a less fluid
environment in the post-heat state.
5.3.4. DPH itself partitions into lipid droplets
DPH was not strictly localized in the cellular membranes unlike its analogues. Instead it
appeared to partition into LDs with high efficacy as well (Figures 5.7 and 5.8). This
finding has been largely ignored in other studies reported in the literature despite some
data showing the masking effect of TAGs on whole cell membrane anisotropy
measurements with DPH (Collard and De Wildt, 1978; Pessin et al., 1978; Rodes et al.,
1995; Storch et al., 1989). Up until recently, LDs, which occur in most mammalian
cells, were considered inert storage sites for energy rich fats. However, LDs are
increasingly considered nowadays as dynamic functional organelles involved in many
intracellular processes like lipid metabolism, cell signalling, and vesicle trafficking
(Meex et al., 2009). DPH revealed a fluidity decrease in the post-heat state of K562
cells (Figure 5.4) in agreement with the results of Revathi et al. (1994) using liver cells.
However, I suggest that this is not attributable to the PM changes, but rather to the
rearrangement of intracellular membranes and/or LDs. Examination of the DPH
fluorescence lifetime measurement did not reveal any change in the center value.

148
Therefore, the average polarity of the entire fluorophore environment remained
unaltered by HS. In contrast, a much broadened lifetime distribution was found in
samples derived from the post-heating phase which suggested a more heterogeneous
microenvironment for the probe. The data suggest that LDs may also undergo heat-
induced remodelling.
5.3.5. Cells modify the fluidization seen in isolated
membranes
In addition to the heat-induced membrane rearrangements detected in the post-heat state
by DPH and its analogues, the time course of the reorganization revealed anomalous
(and probe-dependent) responses of K562 cells to hyperfluidity stress. As well as the
unchanged fluidity observed by DPH-PA upon HS, addition of the chemical fluidizer
BA showed two-phase kinetics consisting of a rapid fluidization followed by an
exponential fluidity compensation. This indicates that BA enters the membranes rapidly,
while warming the cuvette takes a longer time which is long enough to maintain the
anisotropy constant by continuous compensation during heating. Changes revealed by
TMA-DPH showed an instantaneous membrane disordering upon both BA and heat
stresses followed by a further decrease in anisotropy. A similar time-dependent gradual
reduction in the TMA-DPH anisotropy was found during heat or alcohol treatment of
Jurcat cells (Moulin et al., 2007). The different behaviour of living cells is in sharp
contrast to the fluidity–temperature profile of isolated PM. This strongly indicates an
active process, such as upregulated lipid enzyme function and/or protein translocation or
transport for the membranes in live cells. In addition, the very similar alterations in the
fluidity profiles following hyperfluidity treatment which were observed in several other
cell lines in vivo suggest that the membrane rearrangement induced by a rapid
membrane perturbation is a general phenomenon. This may, therefore, allow discussion
and interpretation associated biochemical and biophysical phenomena to be placed in a
more general context.

149
5.3.6. The probes detect stress-induced changes in membrane
rafts
Laurdan microscopy has been shown by various laboratories to be capable of
visualizing lipid structure and raft domains in living cells (Gaus et al., 2003) and
showing the coalescence of ordered domains in specific membrane morphologies, such
as macrophage filopodia (Gaus et al., 2003), neutrophil lamellipodia (Kindzelskii et al.,
2004) or immunological synapses in T lymphocytes (Gaus et al., 2005). Moreover, the
higher GP values reported from PM of K562 cells in my thesis can be attributed to
coalescence and/or de novo production of ordered, raft-like domains as a result of stress.
The data are in full agreement with previous data obtained in B16 cells using fPEG-
Chol, which specifically recognizes sterol-rich membrane domains and colocalizes with
various raft markers. When B16 cells were exposed to heat or BA treatment, the Chol-
rich surface membrane microdomains fused into larger platforms following both
treatments and this alteration persisted for hours after ceasing the stress (Nagy et al.,
2007). Moreover, Ca2+ loading of erythrocytes has been reported to be coupled to an
elevated lipid order (Vest et al., 2006). It was demonstrated previously in K562 cells
(Balogh et al., 2005), that the intracellular Ca2+ level was ubiquitously upregulated as it
was generally in heat-stressed cells (Kiang and Tsokos, 1998). Therefore, intracellular
Ca2+-rise may play a role in the ordering of PM as shown by Laurdan in response to HS
(Figure 5.1).
It has been shown that elevated Cer levels can rapidly displace Chol from
membrane/lipid “Chol-rafts” to form “Cer-rafts” (Grassme et al., 2007; Gulbins and
Kolesnick, 2003; Patra, 2008). Increased Cer production was reported by Moulin et al.
(2007) in a variety of cell types (HL60, U937, Jurkat and Jurkat A3 cells). Moreover, a
key feature of the lipid remodelling due to heat or BA-induced membrane perturbation
was also the increase in Cer in B16 cells (Chapter 4). Moreover, Al-Makdissy et al.
(2003) measured DPH and TMA-DPH anisotropy during the sphingomyelinase
treatment of PM. They reported that DPH and TMA-DPH anisotropy was reduced when
Cer was produced. Thus, the probes was present in a more disordered lipid environment
following Cer generation. Megha and London (2004) showed that this reduction in
anisotropy was due to displacement of DPH, and probably TMA-DPH, from the ordered
ceramide-rich rafts to the disordered lipid regions of the bilayer. The fluidity of PM and
detergent-free raft fractions isolated from murine L-cells were compared using TMA-
DPH and DPH-PA probes (Gallegos et al., 2004). Interestingly, TMA-DPH reported the

150
isolated raft to be more fluid than the PM, while DPH-PA suggested the opposite. In
this thesis I have shown unambiguously that the microenvironmental changes may be
sensed in a different way or even oppositely by structurally different probes, i.e.
fluidization of PM was measured by TMA-DPH as opposed to the increased packing
observed by Laurdan. However, the two phenomena could be linked to the extrusion of
TMA-DPH from the newly formed or restructured ordered PM domains with stress,
resulting in an overall increase in TMA-DPH fluidity. DPH-PA and the EPR probes,
despite the differences in the depth of the probe location, reported an overall rigidization
of the cellular membranes after HS, while Laurdan displayed an average fluidization.
One explanation could be that the negatively charged probes are more sensitive to a
rigidization which comes from the stress-induced ordered domain formation. This idea
is supported by the fact that the acidic derivative of Laurdan, C-laurdan has been
suggested to be a better sensor of membrane compared to Laurdan itself (Kaiser et al.,
2009; Kim et al., 2007).
5.3.7. Thermosensitivity or tolerance can be influenced by
membrane heterogeneity
The membrane changes described in this chapter can also be interpreted in relation to
thermosensitivity or thermotolerance. Thus, in a comparative study heat-resistant and -
sensitive mutants of CHO cells, mouse fibrosarcoma variants and Crandall feline kidney
cells were stressed at 45 °C (Dynlacht and Fox, 1992b). They found that the level of
post-heat fluidization as detected by TMA-DPH could be a marker to evaluate the heat
sensitivity of the cells.
Cell membranes can be rapidly remodelled following mild membrane fluidization
and this can directly contribute to the acquisition of stress tolerance (Shigapova et al.,
2005) or indirectly can be involved in the upregulation of Hsp synthesis (Chapter 4 and
(Nagy et al., 2007). The increased formation of rigid domains in surface membranes and
the simultaneous increase in molecular disorder within the internal membranes, as
shown in this chapter for K562 cells preexposed to mild HS, is also known to be
accompanied by a massive formation of Hsps without any detectable loss of cell
survival (Chapter 3). The localization of Hsp72 and Hsp60 was also affected by certain
membrane fluidizing and HS treatments, thus causing a decrease in intracellular Hsps
with a simultaneous increase in surface-located Hsps as reported recently by Dempsey
et al. (2010). In addition, it was shown that membrane fluidizing treatments, like

151
hyperthermia can either increase or reduce the cytotoxicity of specific apoptosis
inducers depending on cell used, type of drug or the stage of drug treatment at which the
fluidizing treatment is applied (Dempsey et al., 2010). Therefore, decision-making
between cell protection and cell death may involve similar processes. However, the
contribution of individual elements can differ in these two phenomena thus leading to
the reorganisation of plasma and intracellular membranes to different extents.
Microscopic imaging of fluidization-induced membrane remodelling together with
simultaneous measurement of signal transduction events originating from membranes,
Hsp synthesis and protein translocation has broad application in the understanding of
the molecular mechanisms of cell killing and survival. In turn, this could have an
important application in developing better therapies for the medical treatment of
diseases such as cancer.

152
CHAPTER 6. GENERAL DISCUSSION
Both acute and chronic stresses are able to disturb cellular homeostasis and to cause
deleterious effects on cellular infrastructure. Therefore, organisms have developed a
number of adaptive cellular response pathways. The cellular stress response is a
universal mechanism of extraordinary physiological/pathophysiological significance.
The HSR, an important subclass of CSR, can be activated by diverse
environmental and physiological stressors that result in the immediate induction of
stress genes encoding molecular chaperones, proteases, and other proteins (Kültz,
2005). According to the denatured protein sensor hypothesis, a common cell sensory
element might be misfolded or aggregated proteins disturbing the protein homeostasis
(Morimoto, 1998). However, earlier studies on prokaryotes and yeast, as detailed in
Chapter 1, clearly suggested that, during abrupt temperature fluctuations, membranes
represent the most thermally sensitive macromolecular structures. These studies led to
the formulation of the membrane sensor hypothesis which postulates that membranes
can sense environmental changes and, as a consequence of changes in their phase state
and microdomain organisation, transmit HS signals that activate hsp transcription (Vigh
et al., 1998).
In this thesis I aimed to probe the validity of the membrane sensor theory in
mammalian cells and to explore the mechanisms behind lipid signals and membrane
lipid structural reorganizations leading to HSR and adaptation.
In Chapter 3 two structurally distinct membrane fluidizers, the local anaesthetic
BA and HE were applied (see Balogh et al., 2005). These were used at concentrations so
that their addition to K562 erythroleukemic cells caused similar increases in the level of
PM fluidity as tested by DPH anisotropy. Thus, the level of membrane fluidization
induced by the chemical agents on isolated membranes at such concentrations
corresponded to the membrane fluidity increase seen during a thermal shift to 42 C.
The formation of isofluid membrane states in response to the administration of BA or
HE resulted in an increase in the expression of Hsp70 at the physiological temperature
and almost identical downshifts in the temperature thresholds of the HSR. Similarly to
HS, the exposure of the cells to such membrane fluidizers elicited nearly identical
increases of cytosolic Ca2+ concentration in both Ca2+-containing and Ca2+-free media
and also closely similar increases in mitochondrial hyperpolarization. Very importantly,
evidence was obtained that the activation of Hsp expression by membrane fluidizers
was not induced by a protein unfolding signal.

153
In line with these results, the membrane sensor hypothesis was extended to
B16(F10) mouse melanoma cells by applying BA and heat as stressors (Nagy et al.,
2007). From these experiments it was concluded that a subset of hsp genes was
upregulated as a result of stress. Moreover, through the in vivo labelling of melanoma
cells with fPEG-Chol that inserts into Chol-rich membrane domains, it was found that
similarly to HS, BA initiates profound redistribution of Chol-rich PM domains by
increasing the number of larger, while decreasing the number of smaller domains.
In Chapter 4 I then went on to explore heat- and BA-induced stresses further by
characterizing stress-induced membrane lipid changes in B16(F10) cells (see Balogh et
al. 2010). Lipidomic fingerprints revealed that membrane stress achieved either by heat
or BA resulted in pronounced and highly specific alterations in lipid composition. The
loss in polyenes with the concomitant increase in saturated lipid species was shown to
be a consequence of the activation of phospholipases (mainly PLA2 and PLC). A PLC–
DAG lipase–MAG lipase pathway was identified in B16(F10) cells and contributed
significantly to the production of several lipid mediators upon stress including the
potent HS modulator AA. Additionally, the accumulation of Chol, Cer and saturated PL
species with raft-forming properties was observed upon both heat and BA treatments.
In Chapter 5 (see Balogh et al., 2011) heat-induced membrane changes were
examined in more detail using several visualisation methods. With Laurdan two-photon
microscopy it could be shown that, in contrast to the enhanced formation of ordered
domains in surface membranes, the molecular disorder is significantly elevated within
the internal membranes of cells preexposed to mild HS. These results were compared
with those obtained by anisotropy, fluorescence lifetime and electron paramagnetic
resonance measurements. All probes detected membrane changes upon HS. However,
the structurally different probes revealed substantially distinct alterations in membrane
heterogeneity. These data call attention to the careful interpretation of results obtained
with only a single label.
Taken together, the accumulation of Chol, Cer and saturated PL species with raft-
forming properties (Chapter 4) may explain the condensation of ordered PM domains in
the B16(F10) melanoma model (Nagy et al., 2007) and presumably a similar mechanism
can be responsible for PM ordering in K562 cells (Chapter 5). Additionally, these raft
formations can be coupled with a modulation of the activities of certain hsp genes
(Nagy et al., 2007). Thus, it has been shown that the membrane sensor hypothesis has a
strong rationale. Ongoing studies further support this theory. Lipidomic analysis of
B16(F10) cells cultured with different initial cell densities or with variant serum content

154
was carried out (Peter et al., 2012). Profound losses of polyene-containing lipid
molecular species with a concomitant monoene production were found in conjunction
with increasing cell number or decreasing serum content. AA content of PLs was 7.5 %
and 3.4 % at 0.75 and 6 million cells/10 cm plate, respectively. Parallel investigations
on the induction of selected hsp genes revealed that the lipid molecular species
remodelling, initiated by variation in cell culture conditions, refines both the amplitude
and profile of Hsp response upon HS, i.e. positive correlation was found between HSR
(42 °C, 1 h) and cellular AA content (Peter et al., 2012). Importantly, parallel with the
reduction of HSR, the total membrane area covered by fPEG-Chol-positive raft domains
in high cell number cultures decreased by more than 50 % compared with those
measured in low cell number counterparts (Gombos et al., 2011). It was demonstrated
previously that membrane Chol profoundly affects the targeting of the small GTP-
binding protein Rac1 to membranes (del Pozo et al., 2004). It was also suggested, that
stress-stimulated, PI3K-driven conversion of PIP2 to PIP3 activates Rac1 under mild,
non-denaturing HS conditions (Kültz, 2005), and Rac 1 may be required in HS-induced
Hsp expression (Han et al., 2001). Therefore, the redistribution of Chol-rich membrane
domains (also documented in Chapter 4) may alter the stress response via Rac1-
dependent mechanism. Indeed, Rac1 inhibition by a specific inhibitor (NSC233766)
diminished HS-induced hsp25 expression by approximately 50 % at 41.5 °C (Gombos
et al., 2011).
On the whole, by the results shown above, strong evidence has been provided for
the membrane sensor hypothesis in mammalian cells. Combining my own data with
literature findings allowed me to summarise the membrane-originated/associated lipid
signals in the context of stress responses as depicted in Figure 6.1. This figure is a
combination and extension of previous figures in Chapter 1 and 4, originally based on
(Akhavan et al., 2010; Balogh et al., 2010; Escribá et al., 2008; Park et al., 2005; Vigh
et al., 2005). The evidence for the summary diagram is as follows:
An early study by Calderwood et al. emphasized the importance of inositol lipid
metabolism in HS, when the heat-induced initial falls in PIP2 and PIP levels were
shown to be due to the action of PLC enzyme(s) (Calderwood et al., 1987). It is known
that the different families of mammalian PLCs can be activated by several stimuli.
During activation, interactions with regulatory proteins (receptor and non-receptor
tyrosine kinases, subunits of heterotrimeric G proteins or small GTPases from the Ras
and Rho family) could influence PLC conformation directly or, as suggested by recent

155
studies, bring PLC molecules within proximity of the membrane where the local
environment could lead to interfacial activation (Bunney and Katan, 2011).
Figure 6.1. Membrane-controlled signal pathways in stress response. Akt, protein kinase
B; CaMKII, calcium/calmodulin-dependent protein kinase II; Cer, ceramide; Chol,
cholesterol; DAG lipase, diacylglycerol lipase; DAG, diacylglycerol; GFR, growth factor
receptor; GSK3, glycogen synthase kinase-3; HSF1, heat shock factor 1; IP3, inositol
triphosphate; MAG lipase, monoacylglycerol lipase; MAPK, mitogen-activated protein
kinase; PI3K, phosphoinositide 3-kinase; PIP2, phosphatidylinositol-4,5-biphosphate;
PIP3, phosphatidylinositol-3,4,5-triphosphate; PKC, protein kinase C; PLA2,
phospholipase A2; PLC, phospholipase C; PTEN, phosphatase and tensin homologue
protein; Rac1, Ras-related C3 botulinum toxin substrate 1; S1P, sphingosine-1-phosphate;
SM, sphingomyelin; SMase, sphingomyelinase; SPC, sphingosyl phosphorylcholine. The
figure is not intended to show the exact localisation of all components.
It is therefore conceivable that, in response to HS, the ligand-independent
activation of growth factor receptors (Lambert et al., 2006) or the activation of small
GTPases (e.g. Rac1) (together with membrane lipid environmental changes) lead to the
initiation of PLC action. The best documented consequence of this reaction, and a major
cell signalling response, is the generation of two second messengers: IP3, a common
Ca2+-mobilizing second messenger, and DAG, an activator of several types of effector
proteins including PKC isoforms (Bunney and Katan, 2011). HS is known to stimulate

156
rapid release of inositol phosphates (Calderwood et al., 1987). These results showed that
inositol phosphate signals were generated within minutes and their turnover was very
rapid. The concomitantly fast Ca2+-rise (Chapter 3) is a prerequisite for the hsp
transcription (Price and Calderwood, 1991). In addition, CaMKII mediates the HS
response triggered by increases in [Ca2+]i, activation by the binding of Ca2+/calmodulin
and through the ability to undergo autophosphorylation (Holmberg et al., 2001). DAG
can be further metabolised by DAG lipase–MAG lipase producing AA. AA together
with lysoPLs can also be generated by PLA2 enzymes. Elevations in [Ca2+]i, PKC
phosphorylation, or protein–protein interactions (e.g. calmodulin) can regulate PLA2
activity (van Rossum and Patterson, 2009). Moreover, the generation of cis-unsaturated
FAs by PLA2 is key to the activation of PKC, and may stabilize PKC in an activated
state (Huang et al., 1997). It has been proposed that AA may serve to direct Ca2+-
sensitive and Ca2+-insensitive PKC isoforms to proper membrane targets and feedback
modulation of Ca2+ signals (O'Flaherty et al., 2001).
The above-mentioned Ca2+ signalling network is very complex. Based on a
mathematical simulation, the EGFR signal flows through two interconnected pathways,
the PLC–PKC pathway and the MAPK pathway which interact at two points. PKC
activates MAPK, while MAPK can phosphorylate and activate cPLA2. After this, the
AA produced by cPLA2 acts synergistically with DAG to activate PKC (Bhalla and
Iyengar, 1999). AA can be further metabolized to eicosanoids, which can act through G
protein coupled receptors. They can cross cell membranes to act on neighbouring cells
or act within the cell and they function to stimulate enzymes such as PKC (van Rossum
and Patterson, 2009). Certain eicosanoids and also the precursor AA alone are also able
to induce HSR (Santoro, 2000).
PIP2 is a substrate of PI3K to produce PIP3, which is another lipid with key
signalling functions and a major role in the control of cell survival (e.g. stress response),
growth and proliferation. The components of the PI3K pathway include upstream
regulators of PI3K enzymes (such as EGFR and Ras), PTEN, and several Ser/Thr
kinases and transcription factors (Bunney and Katan, 2010). Several proteins propagate
different cellular signals following binding to PIP3, and these include Akt and Rac1 (see
above), important players of membrane-derived stress signal pathways. Moreover, it has
been demonstrated that depolarization of myotubes increased the expression for Hsp70.
In this model inhibition of IP3-dependent Ca2+ signals or Ca2+-dependent PKC and
importantly, inhibition of PI3K activity all decreased Hsp70 induction (Jorquera et al.,
2009).

157
Besides Hsp generation driven by the signal pathways in Figure 6.1, other
membrane-protecting defence mechanisms should be taken into account. The increased
formation of rigid domains in surface membranes and the parallel elevation of
molecular disorder within the internal membranes, demonstrated in Chapter 6 for K562
cells pre-exposed to mild HS, strongly indicate an active process, e.g. upregulated lipid
enzyme function and/or protein translocation or transport targeting the membranes in
intact cells. The question arises as to whether these processes can contribute to cell
survival. It has been documented that a subpopulation of Hsps is present either on the
surface or within cellular membranes and certain Hsps remodel the pre-existing
architecture and physical order of membranes (Horváth et al., 2008; Nakamoto and
Vigh, 2007; Vigh et al., 2005; Vigh et al., 2007c). The roles of sHsps in controlling the
physical state, bilayer stability and integrity of membranes via specific lipid interactions
have basically been established in the case of the sHsp from Synechocystis PCC 6803,
where most of the heat-induced Hsp17 is associated with thylakoid membranes
(Horváth et al., 1998). The interactions between purified Hsp17 and large unilamellar
vesicles consisting of synthetic or cyanobacterial lipids strongly increase the membrane
microviscosity (Török et al., 2001). GroEL chaperonin also associates with thylakoid
and lipid membranes (Kovacs et al., 1994; Török et al., 1997) increasing the membrane
physical order, especially in the polar headgroup region of the lipid. Therefore, GroEL
chaperonins are not only able to assist the folding of both soluble and membrane-
associated proteins, but also to rigidify and therefore stabilize lipid membranes during
HS (Török et al., 1997). In mammalian cells most of the Hsp60 is localized in the
matrix compartment of the mitochondria. A membrane localization for Hsp70, the
major stress-inducible chaperon of mammalian cells, and Hsp60 was induced by certain
membrane fluidizing and HS treatments (Dempsey et al., 2010). Moreover, it was
earlier suggested that Hsp70 might associate directly with PM lipids (Hightower and
Guidon, 1989). Furthermore, different Hsps have been found to associate to a variable
extent with detergent-resistant microdomains, and the association of the Hsps with these
microdomains can be modulated by stress (Broquet et al., 2003). In conclusion, besides
other proteins, such as members of Ras/Rac small GTPases, which become prenylated
and membrane-associated during stress (see above and in (Escribá et al., 2008; Vigh et
al., 2005), the pre-existing Hsps could be important for the general membrane defence
mechanism. On the other hand, a key feature of the lipid remodelling due to heat- (both
mild and severe) or BA-induced membrane perturbation was the accumulation of Chol,
Cer, saturated PC and PE-P species in B16(F10) cells. These lipid species support the

158
formation of tightly-packed subdomains in model membranes and raft domains in cells.
In addition, the lipid chain saturation itself or the elevated Chol level are able to
stabilize the membranes during HS (Quinn et al., 1989).
Membrane alterations, signal pathways from membranes to hsp genes and Hsps
themselves play fundamental roles in the aetiology of several human diseases, such as
cancer or type 2 diabetes (Escribá et al., 2008). Insulin and the insulin-like growth
factors (IGFs) control many aspects of metabolism, growth and survival in a wide range
of mammalian tissues. Insulin/IGF signalling also contributes to regulation of lifespan
(Narasimhan et al., 2009), while dysregulation of signalling has been implicated in
cancer (Pollak, 2008). Although insulin and IGFs play distinct physiological roles, they
utilise the same signalling pathways, involving PI3K and Akt or Ras and MAPK, which
mediate responses to many other cellular stimuli (Siddle, 2011). Activation of Akt
mediates insulin-stimulated translocation of GLUT4 glucose transporters to PM in
muscle and adipose tissue (Whiteman et al., 2002), while downregulation of this
pathway may contribute to diabetes-associated insulin resistance. On the other hand,
several human tumours have mutations that elevate signalling through PI3K pathway
that is induced by insulin and a number of growth factors (Pollak, 2008). In addition, the
MAG lipase–FFA network regulates a host of secondary lipid metabolites that include
key signalling molecules, such as LPA and PGE2, known to support cancer malignancy.
Therefore, MAG lipase serves as key metabolic hub in aggressive cancer cells, where
the enzyme regulates a FA network that feeds into a number of pro-tumourigenic
signalling pathways (Nomura et al., 2010). Moreover, the aberrant function of the
above-mentioned pathways in disease states leads to downregulated or enhanced Hsp
formation. Decreased expression of stress proteins in patients with type 2 diabetes
correlates with reduced insulin sensitivity; activation of Hsp70 with heat therapy is
known to improve clinical parameters in these patients (Chung et al., 2008; Hooper and
Hooper, 2005). Conversely, aberrantly high levels of either the overall array of Hsps or
certain Hsp classes are characteristic of different cancer cells (Escribá et al., 2008).
Collectively, the presented data in this thesis point beyond the initial goal of the
thesis. The integrated view of lipid-controlled signalling pathways in Figure 6.1 may
help to better understand the complex network of lipids and regulatory proteins and
their roles in stress response. It should be noted, however, that the mechanism(s) for the
transmission of a stress signal from the cell surface to hs genes with the involvement of
the activation of lipases, receptors or receptor-like molecules is far from clear. Further
investigations of the network of these pathways that trigger or attenuate survival,

159
proliferation or energy metabolism, is essential in order to understand the
pathomechanism of numerous diseases and for identifying of new therapeutic targets.
Although Selye’s vision on the protective nature of stress responses in diseases
was formulated more than 60 years ago, his legacy of empiric research remains
extremely influential today: “Disease consists of two components-damage and defence.
Up to now medicine attempted to attack almost only the damaging pathogen (to kill the
germs, to excise tumours, to neutralize poisons). As regards defence, hitherto medicine
limited itself to such vague advice as the usefulness of rest, wholesome food, etc. A
study of the general adaptation syndrome suggests that henceforth we will be able to
rely upon much more effective means of aiding adaptation to non-specific local or
systemic injury by supplementing the natural defensive measures of the general
adaptation syndrome whenever these are suboptimal.” (Selye, 1950).

160
BIBLIOGRAPHY
Ahn S, Thiele DJ (2003) Redox regulation of mammalian heat shock factor 1 is essential for Hsp gene activation and protection from stress. Genes Dev 17: 516-528.
Ahyayauch H, Villar AV, Alonso A, Goñi FM (2005) Modulation of PI-specific phospholipase C by membrane curvature and molecular order. Biochemistry 44: 11592-11600.
Akerfelt M, Morimoto RI, Sistonen L (2010) Heat shock factors: integrators of cell stress, development and lifespan. Nat Rev Mol Cell Biol 11: 545-555.
Akhavan D, Cloughesy TF, Mischel PS (2010) mTOR signaling in glioblastoma: lessons learned from bench to bedside. Neuro Oncol 12: 882-889.
Al-Makdissy N, Younsi M, Pierre S, Ziegler O, Donner M (2003) Sphingomyelin/cholesterol ratio: an important determinant of glucose transport mediated by GLUT-1 in 3T3-L1 preadipocytes. Cell Signal 15: 1019-1030.
Alanko SMK, Halling KK, Maunula S, Slotte JP, Ramstedt B (2005) Displacement of sterols from sterol/sphingomyelin domains in fluid bilayer membranes by competing molecules. Biochim Biophys Acta 1715: 111-121.
Amici C, Palamara AT, Santoro MG (1993) Induction of thermotolerance by prostaglandin A in human cells. Exp Cell Res 207: 230-234.
Amici C, Sistonen L, Santoro MG, Morimoto RI (1992) Antiproliferative prostaglandins activate heat shock transcription factor. Proc Natl Acad Sci U S A 89: 6227-6231.
Ananthan J, Goldberg AL, Voellmy R (1986) Abnormal proteins serve as eukaryotic stress signals and trigger the activation of heat shock genes. Science 232: 522-524.
Anckar J, Sistonen L (2011) Regulation of HSF1 function in the heat stress response: implications in aging and disease. Annu Rev Biochem 80: 1089-1115.
Azem A, Diamant S, Kessel M, Weiss C, Goloubinoff P (1995) The protein-folding activity of chaperonins correlates with the symmetric GroEL14(GroES7)2 heterooligomer. Proc Natl Acad Sci U S A 92: 12021-12025.
Bagatolli LA (2006) To see or not to see: lateral organization of biological membranes and fluorescence microscopy. Biochim Biophys Acta 1758: 1541-1556.
Baginski ES, Foà PP, Zak B (1967) Microdetermination of inorganic phosphate, phospholipids, and total phosphate in biologic materials. Clin Chem 13: 326-332.
Balboa MA, Balsinde J (2006) Oxidative stress and arachidonic acid mobilization. Biochim Biophys Acta 1761: 385-391.
Balogh G, Horváth I, Nagy E, Hoyk Z, Benkõ S, et al. (2005) The hyperfluidization of mammalian cell membranes acts as a signal to initiate the heat shock protein response. FEBS J 272: 6077-6086.
Balogh G, Maulucci G, Gombos I, Horváth I, Török Z, et al. (2011) Heat stress causes spatially-distinct membrane re-modelling in K562 leukemia cells. PLoS One 6: e21182.
Balogh G, Péter M, Liebisch G, Horváth I, Török Z, et al. (2010) Lipidomics reveals membrane lipid remodelling and release of potential lipid mediators during early stress responses in a murine melanoma cell line. Biochim Biophys Acta 1801: 1036-1047.

161
Balsinde J, Balboa MA, Insel PA, Dennis EA (1999) Regulation and inhibition of phospholipase A2. Annu Rev Pharmacol Toxicol 39: 175-189.
Balsinde J, Dennis EA (1996) Distinct roles in signal transduction for each of the phospholipase A2 enzymes present in P388D1 macrophages. J Biol Chem 271: 6758-6765.
Balsinde J, Winstead MV, Dennis EA (2002) Phospholipase A(2) regulation of arachidonic acid mobilization. FEBS Lett 531: 2-6.
Bang OS, Ha BG, Park EK, Kang SS (2000) Activation of Akt is induced by heat shock and involved in suppression of heat-shock-induced apoptosis of NIH3T3 cells. Biochem Biophys Res Commun 278: 306-311.
Baritaki S, Apostolakis S, Kanellou P, Dimanche-Boitrel M, Spandidos DA, et al. (2007) Reversal of tumor resistance to apoptotic stimuli by alteration of membrane fluidity: therapeutic implications. Adv Cancer Res 98: 149-190.
Berliner L (1976) Spin Labeling: Theory and Applications, Academic Press, New York.
Bevers EM, Williamson PL (2010) Phospholipid scramblase: an update. FEBS Lett 584: 2724-2730.
Bhalla US, Iyengar R (1999) Emergent properties of networks of biological signaling pathways. Science 283: 381-387.
Bijur GN, Jope RS (2000) Opposing actions of phosphatidylinositol 3-kinase and glycogen synthase kinase-3beta in the regulation of HSF-1 activity. J Neurochem 75: 2401-2408.
Bionda C, Hadchity E, Alphonse G, Chapet O, Rousson R, et al. (2007) Radioresistance of human carcinoma cells is correlated to a defect in raft membrane clustering. Free Radic Biol Med 43: 681-694.
Bisogno T, Cascio MG, Saha B, Mahadevan A, Urbani P, et al. (2006) Development of the first potent and specific inhibitors of endocannabinoid biosynthesis. Biochim Biophys Acta 1761: 205-212.
Bisogno T, Howell F, Williams G, Minassi A, Cascio MG, et al. (2003) Cloning of the first sn1-DAG lipases points to the spatial and temporal regulation of endocannabinoid signaling in the brain. J Cell Biol 163: 463-468.
Björk JK, Sistonen L (2010) Regulation of the members of the mammalian heat shock factor family. FEBS J 277: 4126-4139.
Boggs JM, Mason JT (1986) Calorimetric and fatty acid spin label study of subgel and interdigitated gel phases formed by asymmetric phosphatidylcholines. Biochim Biophys Acta 863: 231-242.
Boon JM, Smith BD (2002) Chemical control of phospholipid distribution across bilayer membranes. Med Res Rev 22: 251-281.
Borkan SC, Gullans SR (2002) Molecular chaperones in the kidney. Annu Rev Physiol 64: 503-527.
Bosco EE, Mulloy JC, Zheng Y (2009) Rac1 GTPase: a "Rac" of all trades. Cell Mol Life Sci 66: 370-374.
Brameshuber M, Weghuber J, Ruprecht V, Gombos I, Horváth I, et al. (2010) Imaging of mobile long-lived nanoplatforms in the live cell plasma membrane. J Biol Chem 285: 41765-41771.

162
Bretscher MS (1971) The proteins of erythrocyte membranes: where are they?. Biochem J 122: 40P.
Brites P, Waterham HR, Wanders RJA (2004) Functions and biosynthesis of plasmalogens in health and disease. Biochim Biophys Acta 1636: 219-231.
Broquet AH, Thomas G, Masliah J, Trugnan G, Bachelet M (2003) Expression of the molecular chaperone Hsp70 in detergent-resistant microdomains correlates with its membrane delivery and release. J Biol Chem 278: 21601-21606.
Brown DA, Rose JK (1992) Sorting of GPI-anchored proteins to glycolipid-enriched membrane subdomains during transport to the apical cell surface. Cell 68: 533-544.
Brügger B, Erben G, Sandhoff R, Wieland FT, Lehmann WD (1997) Quantitative analysis of biological membrane lipids at the low picomole level by nano-electrospray ionization tandem mass spectrometry. Proc Natl Acad Sci U S A 94: 2339-2344.
Buchan JR, Parker R (2009) Eukaryotic stress granules: the ins and outs of translation. Mol Cell 36: 932-941.
Bukau B, Horwich AL (1998) The Hsp70 and Hsp60 chaperone machines. Cell 92: 351-366.
Bunney TD, Katan M (2010) Phosphoinositide signalling in cancer: beyond PI3K and PTEN. Nat Rev Cancer 10: 342-352.
Bunney TD, Katan M (2011) PLC regulation: emerging pictures for molecular mechanisms. Trends Biochem Sci 36: 88-96.
Burke JE, Dennis EA (2009) Phospholipase A2 structure/function, mechanism, and signaling. J Lipid Res 50 Suppl: S237-42.
Butler PJ, Tsou T, Li JY, Usami S, Chien S (2002) Rate sensitivity of shear-induced changes in the lateral diffusion of endothelial cell membrane lipids: a role for membrane perturbation in shear-induced MAPK activation. FASEB J 16: 216-218.
Calderwood SK, Bornstein B, Farnum EK, Stevenson MA (1989) Heat shock stimulates the release of arachidonic acid and the synthesis of prostaglandins and leukotriene B4 in mammalian cells. J Cell Physiol 141: 325-333.
Calderwood SK, Ciocca DR (2008) Heat shock proteins: stress proteins with Janus-like properties in cancer. Int J Hyperthermia 24: 31-39.
Calderwood SK, Stevenson MA (1993) Inducers of the heat shock response stimulate phospholipase C and phospholipase A2 activity in mammalian cells. J Cell Physiol 155: 248-256.
Calderwood SK, Stevenson MA, Hahn GM (1987) Heat stress stimulates inositol trisphosphate release and phosphorylation of phosphoinositides in CHO and Balb C 3T3 cells. J Cell Physiol 130: 369-376.
Calderwood SK, Stevenson MA, Hahn GM (1988) Effects of heat on cell calcium and inositol lipid metabolism. Radiat Res 113: 414-425.
Calderwood SK, Stevenson MA, Price BD (1993) Activation of phospholipase C by heat shock requires GTP analogs and is resistant to pertussis toxin. J Cell Physiol 156: 153-159.
Calderwood SK, Xie Y, Wang X, Khaleque MA, Chou SD, et al. (2010) Signal transduction pathways leading to heat shock transcription. Sign Transduct Insights 2: 13-24.

163
Carrasco S, Mérida I (2007) Diacylglycerol, when simplicity becomes complex. Trends Biochem Sci 32: 27-36.
Carratù L, Franceschelli S, Pardini CL, Kobayashi GS, Horvath I, et al. (1996) Membrane lipid perturbation modifies the set point of the temperature of heat shock response in yeast. Proc Natl Acad Sci U S A 93: 3870-3875.
Catalá A (2010) A synopsis of the process of lipid peroxidation since the discovery of the essential fatty acids. Biochem Biophys Res Commun 399: 318-323.
Chang Y, Abe A, Shayman JA (1995) Ceramide formation during heat shock: a potential mediator of alpha B-crystallin transcription. Proc Natl Acad Sci U S A 92: 12275-12279.
Chau LY, Tai HH (1981) Release of arachidonate from diglyceride in human platelets requires the sequential action of a diglyceride lipase and a monoglyceride lipase. Biochem Biophys Res Commun 100: 1688-1695.
Cheng JZ, Sharma R, Yang Y, Singhal SS, Sharma A, et al. (2001) Accelerated metabolism and exclusion of 4-hydroxynonenal through induction of RLIP76 and hGST5.8 is an early adaptive response of cells to heat and oxidative stress. J Biol Chem 276: 41213-41223.
Christie WW, Han X (2010) Lipid analysis - Isolation, Separation, Identification and Lipidomic Analysis, The Oily Press, Bridgwater.
Chung J, Nguyen A, Henstridge DC, Holmes AG, Chan MHS, et al. (2008) HSP72 protects against obesity-induced insulin resistance. Proc Natl Acad Sci U S A 105: 1739-1744.
Collard JG, De Wildt A (1978) Localization of the lipid probe 1,6-diphenyl-1,3,5 hexatriene (DPH) in intact cells by fluorescence microscopy. Exp Cell Res 116: 447-450.
Cook H, McMaster C (2004) Fatty acid desaturation and chain elongation in eukaryotes. In: Vance D and Vance J (Eds.), Biochemistry of Lipids, Lipoproteins and Membranes. Elsevier, Amsterdam. pp 181-204.
Corda D, Zizza P, Varone A, Filippi BM, Mariggiò S (2009) The glycerophosphoinositols: cellular metabolism and biological functions. Cell Mol Life Sci 66: 3449-3467.
Cottet-Rousselle C, Ronot X, Leverve X, Mayol J (2011) Cytometric assessment of mitochondria using fluorescent probes. Cytometry A 79: 405-425.
Coupin GT, Muller CD, Rémy-Kristensen A, Kuhry JG (1999) Cell surface membrane homeostasis and intracellular membrane traffic balance in mouse L929 cells. J Cell Sci 112 ( Pt 14): 2431-2440.
Csermely P, Schnaider T, Soti C, Prohászka Z, Nardai G (1998) The 90-kDa molecular chaperone family: structure, function, and clinical applications. A comprehensive review. Pharmacol Ther 79: 129-168.
Csont T, Balogh G, Csonka C, Boros I, Horváth I, et al. (2002) Hyperlipidemia induced by high cholesterol diet inhibits heat shock response in rat hearts. Biochem Biophys Res Commun 290: 1535-1538.
Curran BP, Khalawan SA (1994) Alcohols lower the threshold temperature for the maximal activation of a heat shock expression vector in the yeast Saccharomyces cerevisiae. Microbiology 140: 2225-2228.

164
de Marco A, Vigh L, Diamant S, Goloubinoff P (2005) Native folding of aggregation-prone recombinant proteins in Escherichia coli by osmolytes, plasmid- or benzyl alcohol-overexpressed molecular chaperones. Cell Stress Chaperones 10: 329-339.
Demchenko AP, Mély Y, Duportail G, Klymchenko AS (2009) Monitoring biophysical properties of lipid membranes by environment-sensitive fluorescent probes. Biophys J 96: 3461-3470.
Dempsey NC, Ireland HE, Smith CM, Hoyle CF, Williams JHH (2010) Heat shock protein translocation induced by membrane fluidization increases tumor-cell sensitivity to chemotherapeutic drugs. Cancer Lett 296: 257-267.
del Pozo MA, Alderson NB, Kiosses WB, Chiang H, Anderson RGW, et al. (2004) Integrins regulate Rac targeting by internalization of membrane domains. Science 303: 839-842.
Dietz TJ, Somero GN (1992) The threshold induction temperature of the 90-kDa heat shock protein is subject to acclimatization in eurythermal goby fishes (genus Gillichthys). Proc Natl Acad Sci U S A 89: 3389-3393.
Ding XZ, Smallridge RC, Galloway RJ, Kiang JG (1996) Increases in HSF1 translocation and synthesis in human epidermoid A-431 cells: role of protein kinase C and [Ca2+]i. J Investig Med 44: 144-153.
Dixon N, Pali T, Kee TP, Marsh D (2004) Spin-labelled vacuolar-ATPase inhibitors in lipid membranes. Biochim Biophys Acta 1665: 177-183.
Dragovic Z, Broadley SA, Shomura Y, Bracher A, Hartl FU (2006) Molecular chaperones of the Hsp110 family act as nucleotide exchange factors of Hsp70s. EMBO J 25: 2519-2528.
Duda E, Benko S, Galiba E, Horvath I, Pali T, et al. (1994) Lipid saturation in the target cells plasma membrane blocks tumor necrosis factor mediated cell killing. In: Berczi, I. and Szelenyi, J. (Eds.), Advances in Psychoneuroimmunology. Plenum Press, New York. pp 181-190.
Dynlacht JR, Fox MH (1992a) Heat-induced changes in the membrane fluidity of Chinese hamster ovary cells measured by flow cytometry. Radiat Res 130: 48-54.
Dynlacht JR, Fox MH (1992b) The effect of 45 degrees C hyperthermia on the membrane fluidity of cells of several lines. Radiat Res 130: 55-60.
Elmquist JK, Scammell TE, Saper CB (1997) Mechanisms of CNS response to systemic immune challenge: the febrile response. Trends Neurosci 20: 565-570.
Engblom D, Ek M, Saha S, Ericsson-Dahlstrand A, Jakobsson P, et al. (2002) Prostaglandins as inflammatory messengers across the blood-brain barrier. J Mol Med (Berl) 80: 5-15.
Escribá PV, González-Ros JM, Goñi FM, Kinnunen PKJ, Vigh L, et al. (2008) Membranes: a meeting point for lipids, proteins and therapies. J Cell Mol Med 12: 829-875.
Escribá PV, Sánchez-Dominguez JM, Alemany R, Perona JS, Ruiz-Gutiérrez V (2003) Alteration of lipids, G proteins, and PKC in cell membranes of elderly hypertensives. Hypertension 41: 176-182.
Fadeel B, Xue D (2009) The ins and outs of phospholipid asymmetry in the plasma membrane: roles in health and disease. Crit Rev Biochem Mol Biol 44: 264-277.

165
Fahy E, Subramaniam S, Brown HA, Glass CK, Merrill AHJ, et al. (2005) A comprehensive classification system for lipids. J Lipid Res 46: 839-861.
Fahy E, Subramaniam S, Murphy RC, Nishijima M, Raetz CRH, et al. (2009) Update of the LIPID MAPS comprehensive classification system for lipids. J Lipid Res 50 Suppl: S9-14.
Farrer BT, Pecoraro VL (2002) Heavy-metal complexation by de novo peptide design. Curr Opin Drug Discov Devel 5: 937-943.
Finka A, Mattoo RUH, Goloubinoff P (2011) Meta-analysis of heat- and chemically upregulated chaperone genes in plant and human cells. Cell Stress Chaperones 16: 15-31.
Folch J, Lees M, Sloane Stanley GH (1957) A simple method for the isolation and purification of total lipides from animal tissues. J Biol Chem 226: 497-509.
Futai M, Sternweis PC, Heppel LA (1974) Purification and properties of reconstitutively active and inactive adenosinetriphosphatase from Escherichia coli. Proc Natl Acad Sci U S A 71: 2725-2729.
Gallegos AM, McIntosh AL, Atshaves BP, Schroeder F (2004) Structure and cholesterol domain dynamics of an enriched caveolae/raft isolate. Biochem J 382: 451-461.
Galloway SM, Deasy DA, Bean CL, Kraynak AR, Armstrong MJ, et al. (1987) Effects of high osmotic strength on chromosome aberrations, sister-chromatid exchanges and DNA strand breaks, and the relation to toxicity. Mutat Res 189: 15-25.
Garbe TR, Yukawa H (2001) Common solvent toxicity: autoxidation of respiratory redox-cyclers enforced by membrane derangement. Z Naturforsch C 56: 483-491.
Gaus K, Chklovskaia E, Fazekas de St Groth B, Jessup W, Harder T (2005) Condensation of the plasma membrane at the site of T lymphocyte activation. J Cell Biol 171: 121-131.
Gaus K, Gratton E, Kable EPW, Jones AS, Gelissen I, et al. (2003) Visualizing lipid structure and raft domains in living cells with two-photon microscopy. Proc Natl Acad Sci U S A 100: 15554-15559.
Ghomashchi F, Loo R, Balsinde J, Bartoli F, Apitz-Castro R, et al. (1999) Trifluoromethyl ketones and methyl fluorophosphonates as inhibitors of group IV and VI phospholipases A(2): structure-function studies with vesicle, micelle, and membrane assays. Biochim Biophys Acta 1420: 45-56.
Goloubinoff P, Christeller JT, Gatenby AA, Lorimer GH (1989) Reconstitution of active dimeric ribulose bisphosphate carboxylase from an unfoleded state depends on two chaperonin proteins and Mg-ATP. Nature 342: 884-889.
Gombos I, Crul T, Piotto S, Güngör B, Török Z, et al. (2011) Membrane-lipid therapy in operation: The HSP co-inducer BGP-15 activates stress signal transduction pathways by remodeling plasma membrane rafts. Plos One accepted: .
Gomez-Cambronero J (2010) New concepts in phospholipase D signaling in inflammation and cancer. ScientificWorldJournal 10: 1356-1369.
Goparaju SK, Ueda N, Taniguchi K, Yamamoto S (1999) Enzymes of porcine brain hydrolyzing 2-arachidonoylglycerol, an endogenous ligand of cannabinoid receptors. Biochem Pharmacol 57: 417-423.

166
Grant RL, Acosta DJ (1994) A digitized fluorescence imaging study on the effects of local anesthetics on cytosolic calcium and mitochondrial membrane potential in cultured rabbit corneal epithelial cells. Toxicol Appl Pharmacol 129: 23-35.
Grassme H, Riethmuller J, Gulbins E (2007) Biological aspects of ceramide-enriched membrane domains. Prog Lipid Res 46: 161-170.
Gratton E, Limkeman M (1983) A continuously variable frequency cross-correlation phase fluorometer with picosecond resolution. Biophys J 44: 315-324.
Grimm MJ, Zynda ER, Repasky EA (2009) Temperature matters: cellular targets of hyperthermia in cancer biology and immunology. In: Pockley AG, Calderwood SK and Santoro MG (Eds.), Prokaryotic and Eukaryotic Heat Shock Proteins in Infectious Disease. Springer, Dordrecht. pp 267-306.
Griner EM, Kazanietz MG (2007) Protein kinase C and other diacylglycerol effectors in cancer. Nat Rev Cancer 7: 281-294.
Grynkiewicz G, Poenie M, Tsien RY (1985) A new generation of Ca2+ indicators with greatly improved fluorescence properties. J Biol Chem 260: 3440-3450.
Gudi S, Nolan JP, Frangos JA (1998) Modulation of GTPase activity of G proteins by fluid shear stress and phospholipid composition. Proc Natl Acad Sci U S A 95: 2515-2519.
Gulbins E, Kolesnick R (2003) Raft ceramide in molecular medicine. Oncogene 22: 7070-7077.
Gupta SC, Sharma A, Mishra M, Mishra RK, Chowdhuri DK (2010) Heat shock proteins in toxicology: how close and how far? Life Sci 86: 377-384.
Gurr MI, Harwood JL, Frayn KN (2002) Lipid Biochemistry, Blackwell Science, Oxford.
Guschina IA, Harwood JL (2006) Mechanisms of temperature adaptation in poikilotherms. FEBS Lett 580: 5477-5483.
Guyton KZ, Gorospe M, Wang X, Mock YD, Kokkonen GC, et al. (1998) Age-related changes in activation of mitogen-activated protein kinase cascades by oxidative stress. J Investig Dermatol Symp Proc 3: 23-27.
Hahn J (2009) The Hsp90 chaperone machinery: from structure to drug development. BMB Rep 42: 623-630.
Hammer Ø, Harper DA, Ryan PD (2001) PAST: paleontological statistics software package for education and data analysis. Palaeontologia Electronica 4: 9pp.
Han SI, Oh SY, Jeon WJ, Kim JM, Lee JH, et al. (2002) Mild heat shock induces cyclin D1 synthesis through multiple Ras signal pathways. FEBS Lett 515: 141-145.
Han SI, Oh SY, Woo SH, Kim KH, Kim JH, et al. (2001) Implication of a small GTPase Rac1 in the activation of c-Jun N-terminal kinase and heat shock factor in response to heat shock. J Biol Chem 276: 1889-1895.
Hannun YA, Obeid LM (2008) Principles of bioactive lipid signalling: lessons from sphingolipids. Nat Rev Mol Cell Biol 9: 139-150.
Hargitai J, Lewis H, Boros I, Rácz T, Fiser A, et al. (2003) Bimoclomol, a heat shock protein co-inducer, acts by the prolonged activation of heat shock factor-1. Biochem Biophys Res Commun 307: 689-695.
Hartl FU (1996) Molecular chaperones in cellular protein folding. Nature 381: 571-579.

167
Harwood J, Evans M, Ramji D, Murphy D, Dodds P (2007) Medical and agricultural aspects of lipids. In: Gunstone F, Harwood J and Dijkstra A (Eds.), The Lipid Handbook. CRC Press, Boca Raton. pp 703-782.
Hasday JD, Singh IS (2000) Fever and the heat shock response: distinct, partially overlapping processes. Cell Stress Chaperones 5: 471-480.
Hayakawa M, Ishida N, Takeuchi K, Shibamoto S, Hori T, et al. (1993) Arachidonic acid-selective cytosolic phospholipase A2 is crucial in the cytotoxic action of tumor necrosis factor. J Biol Chem 268: 11290-11295.
Heads RJ, Yellon DM, Latchman DS (1995) Differential cytoprotection against heat stress or hypoxia following expression of specific stress protein genes in myogenic cells. J Mol Cell Cardiol 27: 1669-1678.
Hexeberg S, Willumsen N, Rotevatn S, Hexeberg E, Berge RK (1993) Cholesterol induced lipid accumulation in myocardial cells of rats. Cardiovasc Res 27: 442-446.
Heyn MP (1979) Determination of lipid order parameters and rotational correlation times from fluorescence depolarization experiments. FEBS Lett 108: 359-364.
Hightower LE, Guidon PTJ (1989) Selective release from cultured mammalian cells of heat-shock (stress) proteins that resemble glia-axon transfer proteins. J Cell Physiol 138: 257-266.
Hightower LE, White FP (1981) Cellular responses to stress: comparison of a family of 71--73-kilodalton proteins rapidly synthesized in rat tissue slices and canavanine-treated cells in culture. J Cell Physiol 108: 261-275.
Hino Y, Minakami S (1982) Hexose-6-phosphate dehydrogenase of rat liver microsomes. Isolation by affinity chromatography and properties. J Biol Chem 257: 2563-2568.
Hirabayashi T, Murayama T, Shimizu T (2004) Regulatory mechanism and physiological role of cytosolic phospholipase A2. Biol Pharm Bull 27: 1168-1173.
Hochachka P, Somero G (2002) Biochemical Adaptation: Mechanism and Process in Physiological Evolution, University Press, Oxford.
Holmberg CI, Hietakangas V, Mikhailov A, Rantanen JO, Kallio M, et al. (2001) Phosphorylation of serine 230 promotes inducible transcriptional activity of heat shock factor 1. EMBO J 20: 3800-3810.
Homolya L, Holló M, Müller M, Mechetner EB, Sarkadi B (1996) A new method for a quantitative assessment of P-glycoprotein-related multidrug resistance in tumour cells. Br J Cancer 73: 849-855.
Homolya L, Holló Z, Germann UA, Pastan I, Gottesman MM, et al. (1993) Fluorescent cellular indicators are extruded by the multidrug resistance protein. J Biol Chem 268: 21493-21496.
Hooper PL, Hooper JJ (2005) Loss of defense against stress: diabetes and heat shock proteins. Diabetes Technol Ther 7: 204-208.
Horváth I, Glatz A, Varvasovszki V, Török Z, Páli T, et al. (1998) Membrane physical state controls the signaling mechanism of the heat shock response in Synechocystis PCC 6803: identification of hsp17 as a "fluidity gene". Proc Natl Acad Sci U S A 95: 3513-3518.
Horváth I, Multhoff G, Sonnleitner A, Vígh L (2008) Membrane-associated stress proteins: more than simply chaperones. Biochim Biophys Acta 1778: 1653-1664.

168
Horváth LI (1994) Spin-label ESR study of molecular dynamics of lipid/protein association in membranes. Subcell Biochem 23: 205-245.
Huang XP, Pi Y, Lokuta AJ, Greaser ML, Walker JW (1997) Arachidonic acid stimulates protein kinase C-epsilon redistribution in heart cells. J Cell Sci 110 ( Pt 14): 1625-1634.
Huang Z, Payette P, Abdullah K, Cromlish WA, Kennedy BP (1996) Functional identification of the active-site nucleophile of the human 85-kDa cytosolic phospholipase A2. Biochemistry 35: 3712-3721.
Hønger T, Jørgensen K, Biltonen RL, Mouritsen OG (1996) Systematic relationship between phospholipase A2 activity and dynamic lipid bilayer microheterogeneity. Biochemistry 35: 9003-9006.
Ianaro A, Ialenti A, Maffia P, Di Meglio P, Di Rosa M, et al. (2003) Anti-inflammatory activity of 15-deoxy-delta12,14-PGJ2 and 2-cyclopenten-1-one: role of the heat shock response. Mol Pharmacol 64: 85-93.
Illinger D, Duportail G, Mely Y, Poirel-Morales N, Gerard D, et al. (1995) A comparison of the fluorescence properties of TMA-DPH as a probe for plasma membrane and for endocytic membrane. Biochim Biophys Acta 1239: 58-66.
Ishikura S, Koshkina A, Klip A (2008) Small G proteins in insulin action: Rab and Rho families at the crossroads of signal transduction and GLUT4 vesicle traffic. Acta Physiol (Oxf) 192: 61-74.
Isidorov VA, Rusak M, Szczepaniak L, Witkowski S (2007) Gas chromatographic retention indices of trimethylsilyl derivatives of mono- and diglycerides on capillary columns with non-polar stationary phases. J Chromatogr A 1166: 207-211.
Israelachvili JN (1978) The packing of lipids and proteins in membranes. In: Deamer DW (Eds.), Light Transducing Membranes: Structure, Function and Evolution. Academic Press, New York. pp 91-107.
Issels RD (2008) Hyperthermia adds to chemotherapy. Eur J Cancer 44: 2546-2554.
Ivanov AI, Romanovsky AA (2004) Prostaglandin E2 as a mediator of fever: synthesis and catabolism. Front Biosci 9: 1977-1993.
Jacobson K, Sheets ED, Simson R (1995) Revisiting the fluid mosaic model of membranes. Science 268: 1441-1442.
Jean-Louis S, Akare S, Ali MA, Mash EAJ, Meuillet E, et al. (2006) Deoxycholic acid induces intracellular signaling through membrane perturbations. J Biol Chem 281: 14948-14960.
Jednákovits A, Ferdinándy P, Jaszlits L, Bányász T, Magyar J, et al. (2000) In vivo and in vitro acute cardiovascular effects of bimoclomol. Gen Pharmacol 34: 363-369.
Jenkins GM, Cowart LA, Signorelli P, Pettus BJ, Chalfant CE, et al. (2002) Acute activation of de novo sphingolipid biosynthesis upon heat shock causes an accumulation of ceramide and subsequent dephosphorylation of SR proteins. J Biol Chem 277: 42572-42578.
Johansson J, Mandin P, Renzoni A, Chiaruttini C, Springer M, et al. (2002) An RNA thermosensor controls expression of virulence genes in Listeria monocytogenes. Cell 110: 551-561.
Johnson FH, Eyring H, Steblay R, Chaplin H, Huber C, et al. (1945) The nature and control of reactions in bioluminescence: with special reference to the mechanism of

169
reversible and irreversible inhibitions by hydrogen and hydroxyl ions, temperature, pressure, alcohol, urethane, and sulfanilamide in bacteria. J Gen Physiol 28: 463-537.
Jorquera G, Juretić N, Jaimovich E, Riveros N (2009) Membrane depolarization induces calcium-dependent upregulation of Hsp70 and Hmox-1 in skeletal muscle cells. Am J Physiol Cell Physiol 297: C581-90.
Jurivich DA, Pangas S, Qiu L, Welk JF (1996) Phospholipase A2 triggers the first phase of the thermal stress response and exhibits cell-type specificity. J Immunol 157: 1669-1677.
Jurivich DA, Sistonen L, Kroes RA, Morimoto RI (1992) Effect of sodium salicylate on the human heat shock response. Science 255: 1243-1245.
Jurivich DA, Sistonen L, Sarge KD, Morimoto RI (1994) Arachidonate is a potent modulator of human heat shock gene transcription. Proc Natl Acad Sci U S A 91: 2280-2284.
Kabayama K, Sato T, Saito K, Loberto N, Prinetti A, et al. (2007) Dissociation of the insulin receptor and caveolin-1 complex by ganglioside GM3 in the state of insulin resistance. Proc Natl Acad Sci U S A 104: 13678-13683.
Kaiser H, Lingwood D, Levental I, Sampaio JL, Kalvodova L, et al. (2009) Order of lipid phases in model and plasma membranes. Proc Natl Acad Sci U S A 106: 16645-16650.
Kampinga HH, Craig EA (2010) The HSP70 chaperone machinery: J proteins as drivers of functional specificity. Nat Rev Mol Cell Biol 11: 579-592.
Kampinga HH, Hageman J, Vos MJ, Kubota H, Tanguay RM, et al. (2009) Guidelines for the nomenclature of the human heat shock proteins. Cell Stress Chaperones 14: 105-111.
Kasprzak KS (2002) Oxidative DNA and protein damage in metal-induced toxicity and carcinogenesis. Free Radic Biol Med 32: 958-967.
Kempner ES (1993) Damage to proteins due to the direct action of ionizing radiation. Q Rev Biophys 26: 27-48.
Khaled AR, Reynolds DA, Young HA, Thompson CB, Muegge K, et al. (2001) Interleukin-3 withdrawal induces an early increase in mitochondrial membrane potential unrelated to the Bcl-2 family. Roles of intracellular pH, ADP transport, and F(0)F(1)-ATPase. J Biol Chem 276: 6453-6462.
Khaleque MA, Bharti A, Sawyer D, Gong J, Benjamin IJ, et al. (2005) Induction of heat shock proteins by heregulin beta1 leads to protection from apoptosis and anchorage-independent growth. Oncogene 24: 6564-6573.
Khanna A, Aten RF, Behrman HR (1995) Physiological and pharmacological inhibitors of luteinizing hormone-dependent steroidogenesis induce heat shock protein-70 in rat luteal cells. Endocrinology 136: 1775-1781.
Kiang JG, Carr FE, Burns MR, McClain DE (1994) HSP-72 synthesis is promoted by increase in [Ca2+]i or activation of G proteins but not pHi or cAMP. Am J Physiol 267: C104-14.
Kiang JG, Ding XZ, McClain DE (1998) Overexpression of HSP-70 attenuates increases in [Ca2+]i and protects human epidermoid A-431 cells after chemical hypoxia. Toxicol Appl Pharmacol 149: 185-194.

170
Kiang JG, Koenig ML, Smallridge RC (1992) Heat shock increases cytosolic free Ca2+ concentration via Na(+)-Ca2+ exchange in human epidermoid A 431 cells. Am J Physiol 263: C30-8.
Kiang JG, McClain DE (1993) Effect of heat shock, [Ca2+]i, and cAMP on inositol trisphosphate in human epidermoid A-431 cells. Am J Physiol 264: C1561-9.
Kiang JG, Tsokos GC (1998) Heat shock protein 70 kDa: molecular biology, biochemistry, and physiology. Pharmacol Ther 80: 183-201.
Kieran D, Kalmar B, Dick JRT, Riddoch-Contreras J, Burnstock G, et al. (2004) Treatment with arimoclomol, a coinducer of heat shock proteins, delays disease progression in ALS mice. Nat Med 10: 402-405.
Kim HM, Choo H, Jung S, Ko Y, Park W, et al. (2007) A two-photon fluorescent probe for lipid raft imaging: C-laurdan. Chembiochem 8: 553-559.
Kimelberg HK, Papahadjopoulos D (1974) Effects of phospholipid acyl chain fluidity, phase transitions, and cholesterol on (Na+ + K+)-stimulated adenosine triphosphatase. J Biol Chem 249: 1071-1080.
Kindzelskii AL, Sitrin RG, Petty HR (2004) Cutting edge: optical microspectrophotometry supports the existence of gel phase lipid rafts at the lamellipodium of neutrophils: apparent role in calcium signaling. J Immunol 172: 4681-4685.
Kirkegaard T, Roth AG, Petersen NHT, Mahalka AK, Olsen OD, et al. (2010) Hsp70 stabilizes lysosomes and reverts Niemann-Pick disease-associated lysosomal pathology. Nature 463: 549-553.
Kitagawa S, Hirata H (1992) Effects of alcohols on fluorescence anisotropies of diphenylhexatriene and its derivatives in bovine blood platelets: relationships of the depth-dependent change in membrane fluidity by alcohols with their effects on platelet aggregation and adenylate cyclase activity. Biochim Biophys Acta 1112: 14-18.
Kitagawa S, Matsubayashi M, Kotani K, Usui K, Kametani F (1991) Asymmetry of membrane fluidity in the lipid bilayer of blood platelets: fluorescence study with diphenylhexatriene and analogs. J Membr Biol 119: 221-227.
Kota Z, Horvath LI, Droppa M, Horvath G, Farkas T, et al. (2002) Protein assembly and heat stability in developing thylakoid membranes during greening. Proc Natl Acad Sci U S A 99: 12149-12154.
Kovacs E, Torok Z, Horvath I, Vigh L (1994) Heat-stress induces association of the groel-analog chaperonin with thylakoid membranes in cyanobacterium, Synechocystis PCC-6803. Plant Physiol Biochem 32: 285-293.
Kozawa O, Niwa M, Matsuno H, Tokuda H, Miwa M, et al. (1999b) Sphingosine 1-phosphate induces heat shock protein 27 via p38 mitogen-activated protein kinase activation in osteoblasts. J Bone Miner Res 14: 1761-1767.
Kozawa O, Tanabe K, Ito H, Matsuno H, Niwa M, et al. (1999a) Sphingosine 1-phosphate regulates heat shock protein 27 induction by a p38 MAP kinase-dependent mechanism in aortic smooth muscle cells. Exp Cell Res 250: 376-380.
Kunimoto S, Kobayashi T, Kobayashi S, Murakami-Murofushi K (2000) Expression of cholesteryl glucoside by heat shock in human fibroblasts. Cell Stress Chaperones 5: 3-7.
Kunimoto S, Murofushi W, Kai H, Ishida Y, Uchiyama A, et al. (2002) Steryl glucoside is a lipid mediator in stress-responsive signal transduction. Cell Struct Funct 27: 157-162.

171
Kyriakis JM, Avruch J (2001) Mammalian mitogen-activated protein kinase signal transduction pathways activated by stress and inflammation. Physiol Rev 81: 807-869.
Köller M, König W (1991) 12-Hydroxyeicosatetraenoic acid (12-HETE) induces heat shock proteins in human leukocytes. Biochem Biophys Res Commun 175: 804-809.
Königshofer H, Tromballa H, Löppert H (2008) Early events in signalling high-temperature stress in tobacco BY2 cells involve alterations in membrane fluidity and enhanced hydrogen peroxide production. Plant Cell Environ 31: 1771-1780.
Kültz D (2003) Evolution of the cellular stress proteome: from monophyletic origin to ubiquitous function. J Exp Biol 206: 3119-3124.
Kültz D (2005) Molecular and evolutionary basis of the cellular stress response. Annu Rev Physiol 67: 225-257.
Kültz D, Chakravarty D (2001) Maintenance of genomic integrity in mammalian kidney cells exposed to hyperosmotic stress. Comp Biochem Physiol A Mol Integr Physiol 130: 421-428.
Kürthy M, Mogyorósi T, Nagy K, Kukorelli T, Jednákovits A, et al. (2002) Effect of BRX-220 against peripheral neuropathy and insulin resistance in diabetic rat models. Ann N Y Acad Sci 967: 482-489.
Lakowicz J (2006) Fluorescence anisotropy. In: Lakowicz J, Principles of Fluorescence Spectroscopy. Springer, New York. pp 353-382.
Lambert S, Vind-Kezunovic D, Karvinen S, Gniadecki R (2006) Ligand-independent activation of the EGFR by lipid raft disruption. J Invest Dermatol 126: 954-962.
Lee BS, Chen J, Angelidis C, Jurivich DA, Morimoto RI (1995) Pharmacological modulation of heat shock factor 1 by antiinflammatory drugs results in protection against stress-induced cellular damage. Proc Natl Acad Sci U S A 92: 7207-7211.
Leidl K, Liebisch G, Richter D, Schmitz G (2008) Mass spectrometric analysis of lipid species of human circulating blood cells. Biochim Biophys Acta 1781: 655-664.
Lepore DA, Knight KR, Anderson RL, Morrison WA (2001) Role of priming stresses and Hsp70 in protection from ischemia-reperfusion injury in cardiac and skeletal muscle. Cell Stress Chaperones 6: 93-96.
Liebisch G, Binder M, Schifferer R, Langmann T, Schulz B, et al. (2006) High throughput quantification of cholesterol and cholesteryl ester by electrospray ionization tandem mass spectrometry (ESI-MS/MS). Biochim Biophys Acta 1761: 121-128.
Liebisch G, Drobnik W, Lieser B, Schmitz G (2002) High-throughput quantification of lysophosphatidylcholine by electrospray ionization tandem mass spectrometry. Clin Chem 48: 2217-2224.
Liebisch G, Drobnik W, Reil M, Trümbach B, Arnecke R, et al. (1999) Quantitative measurement of different ceramide species from crude cellular extracts by electrospray ionization tandem mass spectrometry (ESI-MS/MS). J Lipid Res 40: 1539-1546.
Liebisch G, Lieser B, Rathenberg J, Drobnik W, Schmitz G (2004) High-throughput quantification of phosphatidylcholine and sphingomyelin by electrospray ionization tandem mass spectrometry coupled with isotope correction algorithm. Biochim Biophys Acta 1686: 108-117.
Lin RZ, Hu ZW, Chin JH, Hoffman BB (1997) Heat shock activates c-Src tyrosine kinases and phosphatidylinositol 3-kinase in NIH3T3 fibroblasts. J Biol Chem 272: 31196-31202.

172
Lindquist S (1986) The heat-shock response. Annu Rev Biochem 55: 1151-1191.
Lingwood D, Ries J, Schwille P, Simons K (2008) Plasma membranes are poised for activation of raft phase coalescence at physiological temperature. Proc Natl Acad Sci U S A 105: 10005-10010.
Lingwood D, Simons K (2010) Lipid rafts as a membrane-organizing principle. Science 327: 46-50.
Liscum L (2004) Cholesterol bisynthesis. In: Vance D and Vance JE (Eds.), Biochemistry of Lipids, Lipoproteins and Membranes. Elsevier, Amsterdam. pp 409-432.
Liu PK (2001) DNA damage and repair in the brain after cerebral ischemia. Curr Top Med Chem 1: 483-495.
Maeda M, Doi O, Akamatsu Y (1980) Behavior of vesicular stomatitis virus glycoprotein in mouse LM cells with modified membrane-phospholipids. Biochim Biophys Acta 597: 552-563.
Maroni P, Bendinelli P, Zuccorononno C, Schiaffonati L, Piccoletti R (2000) Cellular signalling after in vivo heat shock in the liver. Cell Biol Int 24: 145-152.
Marsh D (1981) Electron spin resonance: spin labels. Mol Biol Biochem Biophys 31: 51-142.
Marsh D (2001) Polarity and permeation profiles in lipid membranes. Proc Natl Acad Sci U S A 98: 7777-7782.
Marsh D, Horvath L (1989) Spin label studies of the structure and dynamics of lipids and proteins in membranes. In: Hoff A (Eds.), Advanced EPR. Applications in Biology and Biochemistry. Elsevier, Amsterdam. pp 707-752.
Marsh D, Horváth LI (1998) Structure, dynamics and composition of the lipid-protein interface. Perspectives from spin-labelling. Biochim Biophys Acta 1376: 267-296.
Mathieson FA, Nixon GF (2006) Sphingolipids differentially regulate mitogen-activated protein kinases and intracellular Ca2+ in vascular smooth muscle: effects on CREB activation. Br J Pharmacol 147: 351-359.
Matyash V, Liebisch G, Kurzchalia TV, Shevchenko A, Schwudke D (2008) Lipid extraction by methyl-tert-butyl ether for high-throughput lipidomics. J Lipid Res 49: 1137-1146.
Maula T, Westerlund B, Slotte JP (2009) Differential ability of cholesterol-enriched and gel phase domains to resist benzyl alcohol-induced fluidization in multilamellar lipid vesicles. Biochim Biophys Acta 1788: 2454-2461.
Maxfield FR, van Meer G (2010) Cholesterol, the central lipid of mammalian cells. Curr Opin Cell Biol 22: 422-429.
Mayer MP, Bukau B (2005) Hsp70 chaperones: cellular functions and molecular mechanism. Cell Mol Life Sci 62: 670-684.
Meex RCR, Schrauwen P, Hesselink MKC (2009) Modulation of myocellular fat stores: lipid droplet dynamics in health and disease. Am J Physiol Regul Integr Comp Physiol 297: R913-24.
Megha, London E (2004) Ceramide selectively displaces cholesterol from ordered lipid domains (rafts): implications for lipid raft structure and function. J Biol Chem 279: 9997-10004.

173
Merrill A (2008) Sphingolipids. In: Vance D and Vance JE (Eds.), Biochemistry of Lipids, Lipoproteins and Membranes. Elsevier, Amsterdam. pp 363-397.
Milton AS, Wendlandt S (1970) A possible role for prostaglandin E1 as a modulator for temperature regulation in the central nervous system of the cat. J Physiol 207: 76P-77P.
Mondal M, Mesmin B, Mukherjee S, Maxfield FR (2009) Sterols are mainly in the cytoplasmic leaflet of the plasma membrane and the endocytic recycling compartment in CHO cells. Mol Biol Cell 20: 581-588.
Morenilla-Palao C, Pertusa M, Meseguer V, Cabedo H, Viana F (2009) Lipid raft segregation modulates TRPM8 channel activity. J Biol Chem 284: 9215-9224.
Morimoto RI (1998) Regulation of the heat shock transcriptional response: cross talk between a family of heat shock factors, molecular chaperones, and negative regulators. Genes Dev 12: 3788-3796.
Morita MT, Tanaka Y, Kodama TS, Kyogoku Y, Yanagi H, et al. (1999) Translational induction of heat shock transcription factor sigma32: evidence for a built-in RNA thermosensor. Genes Dev 13: 655-665.
Mosser DD, Kotzbauer PT, Sarge KD, Morimoto RI (1990) In vitro activation of heat shock transcription factor DNA-binding by calcium and biochemical conditions that affect protein conformation. Proc Natl Acad Sci U S A 87: 3748-3752.
Moulin M, Carpentier S, Levade T, Arrigo A (2007) Potential roles of membrane fluidity and ceramide in hyperthermia and alcohol stimulation of TRAIL apoptosis. Apoptosis 12: 1703-1720.
Mukherjee S, Maxfield FR (2004) Membrane domains. Annu Rev Cell Dev Biol 20: 839-866.
Multhoff G (2007) Heat shock protein 70 (Hsp70): membrane location, export and immunological relevance. Methods 43: 229-237.
Multhoff G (2009) Activation of natural killer cells by heat shock protein 70. 2002. Int J Hyperthermia 25: 169-175.
Murshid A, Chou S, Prince T, Zhang Y, Bharti A, et al. (2010) Protein kinase A binds and activates heat shock factor 1. PLoS One 5: e13830.
Nadeau SI, Landry J (2007) Mechanisms of activation and regulation of the heat shock-sensitive signaling pathways. Adv Exp Med Biol 594: 100-113.
Nagarsekar A, Hasday JD, Singh IS (2005) CXC chemokines: a new family of heat-shock proteins? Immunol Invest 34: 381-398.
Nagy E, Balogi Z, Gombos I, Akerfelt M, Björkbom A, et al. (2007) Hyperfluidization-coupled membrane microdomain reorganization is linked to activation of the heat shock response in a murine melanoma cell line. Proc Natl Acad Sci U S A 104: 7945-7950.
Nakamoto H, Vigh L (2007) The small heat shock proteins and their clients. Cell Mol Life Sci 64: 294-306.
Narasimhan SD, Yen K, Tissenbaum HA (2009) Converging pathways in lifespan regulation. Curr Biol 19: R657-66.
Nguyen VT, Bensaude O (1994) Increased thermal aggregation of proteins in ATP-depleted mammalian cells. Eur J Biochem 220: 239-246.

174
Nguyen VT, Morange M, Bensaude O (1989) Protein denaturation during heat shock and related stress. Escherichia coli beta-galactosidase and Photinus pyralis luciferase inactivation in mouse cells. J Biol Chem 264: 10487-10492.
Nivon M, Abou-Samra M, Richet E, Guyot B, Arrigo A, et al. (2012) NF-κB regulates protein quality control after heat stress through modulation of the BAG3-HspB8 complex. J Cell Sci 125: 1141-1151.
Nomura DK, Long JZ, Niessen S, Hoover HS, Ng S, et al. (2010) Monoacylglycerol lipase regulates a fatty acid network that promotes cancer pathogenesis. Cell 140: 49-61.
O'Flaherty JT, Chadwell BA, Kearns MW, Sergeant S, Daniel LW (2001) Protein kinases C translocation responses to low concentrations of arachidonic acid. J Biol Chem 276: 24743-24750.
Ohno K, Fukushima M, Fujiwara M, Narumiya S (1988) Induction of 68,000-dalton heat shock proteins by cyclopentenone prostaglandins. Its association with prostaglandin-induced G1 block in cell cycle progression. J Biol Chem 263: 19764-19770.
Parasassi T, De Stasio G, Ravagnan G, Rusch RM, Gratton E (1991) Quantitation of lipid phases in phospholipid vesicles by the generalized polarization of Laurdan fluorescence. Biophys J 60: 179-189.
Parasassi T, De Stasio G, d'Ubaldo A, Gratton E (1990) Phase fluctuation in phospholipid membranes revealed by Laurdan fluorescence. Biophys J 57: 1179-1186.
Parasassi T, Gratton E, Yu WM, Wilson P, Levi M (1997) Two-photon fluorescence microscopy of laurdan generalized polarization domains in model and natural membranes. Biophys J 72: 2413-2429.
Parasassi T, Ravagnan G, Sapora O, Gratton E (1992) Membrane oxidative damage induced by ionizing radiation detected by diphenylhexatriene fluorescence lifetime distributions. Int J Radiat Biol 61: 791-796.
Park HG, Han SI, Oh SY, Kang HS (2005) Cellular responses to mild heat stress. Cell Mol Life Sci 62: 10-23.
Parsell DA, Taulien J, Lindquist S (1993) The role of heat-shock proteins in thermotolerance. Philos Trans R Soc Lond B Biol Sci 339: 279-86.
Patra SK (2008) Dissecting lipid raft facilitated cell signaling pathways in cancer. Biochim Biophys Acta 1785: 182-206.
Patriarca EJ, Kobayashi GS, Maresca B (1992) Mitochondrial activity and heat-shock response during morphogenesis in the pathogenic fungus Histoplasma capsulatum. Biochem Cell Biol 70: 207-214.
Pearl LH, Prodromou C, Workman P (2008) The Hsp90 molecular chaperone: an open and shut case for treatment. Biochem J 410: 439-453.
Peer AJ, Grimm MJ, Zynda ER, Repasky EA (2010) Diverse immune mechanisms may contribute to the survival benefit seen in cancer patients receiving hyperthermia. Immunol Res 46: 137-154.
Perl A, Gergely PJ, Nagy G, Koncz A, Banki K (2004) Mitochondrial hyperpolarization: a checkpoint of T-cell life, death and autoimmunity. Trends Immunol 25: 360-367.
Perrin M (1926) Polarisation de la Lumiere de Fluorescence. Vie Moyenne des Molecule dans L'etat excite. J Phys Radium 7: 390-393.

175
Pessin JE, Salter DW, Glaser M (1978) Use of a fluorescent probe to compare the plasma membrane properties in normal and transformed cells. Evaluation of the interference by triacylglycerols and alkyldiacylglycerols. Biochemistry 17: 1997-2004.
Peter M, Balogh G, Gombos I, Liebisch G, Horvath I, et al. (2012) Nutritional lipid supply can control the heat shock response of B16 melanoma cells in culture. Mol Memb Biol Early Online: 1-16.
Piazza JR, Almeida DM, Dmitrieva NO, Klein LC (2010) Frontiers in the use of biomarkers of health in research on stress and aging. J Gerontol B Psychol Sci Soc Sci 65: 513-525.
Pike LJ (2006) Rafts defined: a report on the Keystone Symposium on Lipid Rafts and Cell Function. J Lipid Res 47: 1597-1598.
Pike LJ (2009) The challenge of lipid rafts. J Lipid Res 50 Suppl: S323-8.
Pike LJ, Han X, Chung K, Gross RW (2002) Lipid rafts are enriched in arachidonic acid and plasmenylethanolamine and their composition is independent of caveolin-1 expression: a quantitative electrospray ionization/mass spectrometric analysis. Biochemistry 41: 2075-2088.
Pike LJ, Han X, Gross RW (2005) Epidermal growth factor receptors are localized to lipid rafts that contain a balance of inner and outer leaflet lipids: a shotgun lipidomics study. J Biol Chem 280: 26796-26804.
Piper PW (1995) The heat shock and ethanol stress responses of yeast exhibit extensive similarity and functional overlap. FEMS Microbiol Lett 134: 121-127.
Pockley AG (2001) Heat shock proteins in health and disease: therapeutic targets or therapeutic agents? Expert Rev Mol Med 3: 1-21.
Pockley AG, Muthana M, Calderwood SK (2008) The dual immunoregulatory roles of stress proteins. Trends Biochem Sci 33: 71-79.
Pollak M (2008) Insulin and insulin-like growth factor signalling in neoplasia. Nat Rev Cancer 8: 915-928.
Pomorski T, Menon AK (2006) Lipid flippases and their biological functions. Cell Mol Life Sci 63: 2908-2921.
Pratt WB, Morishima Y, Osawa Y (2008) The Hsp90 chaperone machinery regulates signaling by modulating ligand binding clefts. J Biol Chem 283: 22885-22889.
Pratt WB, Toft DO (2003) Regulation of signaling protein function and trafficking by the hsp90/hsp70-based chaperone machinery. Exp Biol Med (Maywood) 228: 111-133.
Price BD, Calderwood SK (1991) Ca2+ is essential for multistep activation of the heat shock factor in permeabilized cells. Mol Cell Biol 11: 3365-3368.
Pruett ST, Bushnev A, Hagedorn K, Adiga M, Haynes CA, et al. (2008) Biodiversity of sphingoid bases ("sphingosines") and related amino alcohols. J Lipid Res 49: 1621-1639.
Páli T, Finbow ME, Marsh D (1999) Membrane assembly of the 16-kDa proteolipid channel from Nephrops norvegicus studied by relaxation enhancements in spin-label ESR. Biochemistry 38: 14311-14319.
Páli T, Garab G, Horváth LI, Kóta Z (2003) Functional significance of the lipid-protein interface in photosynthetic membranes. Cell Mol Life Sci 60: 1591-1606.

176
Qian L, Song X, Ren H, Gong J, Cheng S (2004) Mitochondrial mechanism of heat stress-induced injury in rat cardiomyocyte. Cell Stress Chaperones 9: 281-293.
Quinn PJ (1981) The fluidity of cell membranes and its regulation. Prog Biophys Mol Biol 38: 1-104.
Quinn PJ (2010) A lipid matrix model of membrane raft structure. Prog Lipid Res 49: 390-406.
Quinn PJ, Joo F, Vigh L (1989) The role of unsaturated lipids in membrane structure and stability. Prog Biophys Mol Biol 53: 71-103.
Raviol H, Sadlish H, Rodriguez F, Mayer MP, Bukau B (2006) Chaperone network in the yeast cytosol: Hsp110 is revealed as an Hsp70 nucleotide exchange factor. EMBO J 25: 2510-2518.
Reers M, Smith TW, Chen LB (1991) J-aggregate formation of a carbocyanine as a quantitative fluorescent indicator of membrane potential. Biochemistry 30: 4480-4486.
Revathi CJ, Chattopadhyay A, Srinivas UK (1994) Change in membrane organization induced by heat shock. Biochem Mol Biol Int 32: 941-950.
Richter K, Haslbeck M, Buchner J (2010) The heat shock response: life on the verge of death. Mol Cell 40: 253-266.
Ritossa F (1962) A new puffing pattern induced by temperature shock and DNP in Drosophila. Experimentia 18: 351-366.
Rodes JF, Berreur-Bonnenfant J, Trémolières A, Brown SC (1995) Modulation of membrane fluidity and lipidic metabolism in transformed rat fibroblasts induced by the sesquiterpenic hormone farnesylacetone. Cytometry 19: 217-225.
Roshchupkin DI, Murina MA (1998) Free-radical and cyclooxygenase-catalyzed lipid peroxidation in membranes of blood cells under UV irradiation. Membr Cell Biol 12: 279-286.
Roussou I, Nguyen VT, Pagoulatos GN, Bensaude O (2000) Enhanced protein denaturation in indomethacin-treated cells. Cell Stress Chaperones 5: 8-13.
Rydberg B (2001) Radiation-induced DNA damage and chromatin structure. Acta Oncol 40: 682-685.
Sachidhanandam SB, Lu J, Low KSY, Moochhala SM (2003) Herbimycin A attenuates apoptosis during heat stress in rats. Eur J Pharmacol 474: 121-128.
Saidi Y, Domini M, Choy F, Zryd J, Schwitzguebel J, et al. (2007) Activation of the heat shock response in plants by chlorophenols: transgenic Physcomitrella patens as a sensitive biosensor for organic pollutants. Plant Cell Environ 30: 753-763.
Saidi Y, Finka A, Muriset M, Bromberg Z, Weiss YG, et al. (2009b) The heat shock response in moss plants is regulated by specific calcium-permeable channels in the plasma membrane. Plant Cell 21: 2829-2843.
Saidi Y, Muriset M, Bromberg Z, Weiss YG, Maathuis FJM, et al. (2009a) The heat shock response in moss plants is regulated by specific calcium-permeable channels in the plasma membrane. The Plant Cell 21: 1-15.
Saidi Y, Peter M, Finka A, Cicekli C, Vigh L, et al. (2010) Membrane lipid composition affects plant heat sensing and modulates Ca(2+)-dependent heat shock response. Plant Signal Behav 5: 1530-1533.

177
Samples BL, Pool GL, Lumb RH (1999) Polyunsaturated fatty acids enhance the heat induced stress response in rainbow trout (Oncorhynchus mykiss) leukocytes. Comp Biochem Physiol B Biochem Mol Biol 123: 389-397.
Sangwan V, Orvar BL, Beyerly J, Hirt H, Dhindsa RS (2002) Opposite changes in membrane fluidity mimic cold and heat stress activation of distinct plant MAP kinase pathways. Plant J 31: 629-638.
Santoro MG (2000) Heat shock factors and the control of the stress response. Biochem Pharmacol 59: 55-63.
Sarge KD (1995) Male germ cell-specific alteration in temperature set point of the cellular stress response. J Biol Chem 270: 18745-18748.
Sarge KD, Bray AE, Goodson ML (1995) Altered stress response in testis. Nature 374: 126.
Sarge KD, Murphy SP, Morimoto RI (1993) Activation of heat shock gene transcription by heat shock factor 1 involves oligomerization, acquisition of DNA-binding activity, and nuclear localization and can occur in the absence of stress. Mol Cell Biol 13: 1392-1407.
Sato SB, Ishii K, Makino A, Iwabuchi K, Yamaji-Hasegawa A, et al. (2004) Distribution and transport of cholesterol-rich membrane domains monitored by a membrane-impermeant fluorescent polyethylene glycol-derivatized cholesterol. J Biol Chem 279: 23790-23796.
Schroeder F, Nemecz G, Wood WG, Joiner C, Morrot G, et al. (1991) Transmembrane distribution of sterol in the human erythrocyte. Biochim Biophys Acta 1066: 183-192.
Selye H (1936) A syndrome produced by diverse nocuous agents. Nature 138: 32.
Selye H (1950) Stress and the general adaptation syndrome. British Medical Journal 1: 1383-1392.
Shack S, Gorospe M, Fawcett TW, Hudgins WR, Holbrook NJ (1999) Activation of the cholesterol pathway and Ras maturation in response to stress. Oncogene 18: 6021-6028.
Shamovsky I, Ivannikov M, Kandel ES, Gershon D, Nudler E (2006) RNA-mediated response to heat shock in mammalian cells. Nature 440: 556-560.
Shamovsky I, Nudler E (2008) New insights into the mechanism of heat shock response activation. Cell Mol Life Sci 65: 855-861.
Shigapova N, Török Z, Balogh G, Goloubinoff P, Vígh L, et al. (2005) Membrane fluidization triggers membrane remodeling which affects the thermotolerance in Escherichia coli. Biochem Biophys Res Commun 328: 1216-1223.
Shimizu T, Yamaguchi N, Okada S, Lu L, Sasaki T, et al. (2007) Roles of brain phosphatidylinositol-specific phospholipase C and diacylglycerol lipase in centrally administered histamine-induced adrenomedullary outflow in rats. Eur J Pharmacol 571: 138-144.
Shimizu T, Yokotani K (2008) Bidirectional roles of the brain 2-arachidonoyl-sn-glycerol in the centrally administered vasopressin-induced adrenomedullary outflow in rats. Eur J Pharmacol 582: 62-69.
Shinitzky M (1984) Membrane fluidity in malignancy. Adversative and recuperative. Biochim Biophys Acta 738: 251-261.
Shinitzky M, Barenholz Y (1978) Fluidity parameters of lipid regions determined by fluorescence polarization. Biochim Biophys Acta 515: 367-394.

178
Siddle K (2011) Signalling by insulin and IGF receptors: supporting acts and new players. J Mol Endocrinol 47: R1-10.
Simons K, Sampaio JL (2011) Membrane Organization and Lipid Rafts. Cold Spring Harb Perspect Biol 3: a004697.
Singer SJ, Nicolson GL (1972) The fluid mosaic model of the structure of cell membranes. Science 175: 720-731.
Singh IS, Viscardi RM, Kalvakolanu I, Calderwood S, Hasday JD (2000) Inhibition of tumor necrosis factor-alpha transcription in macrophages exposed to febrile range temperature. A possible role for heat shock factor-1 as a negative transcriptional regulator. J Biol Chem 275: 9841-9848.
Skinner MK, Griswold MD (1983) Fluorographic detection of radioactivity in polyacrylamide gels with 2,5-diphenyloxazole in acetic acid and its comparison with existing procedures. Biochem J 209: 281-284.
Sklar LA (1984) Fluorescence polarization studies of membrane fluidity: where do we go from here? In: Kates MM and Lionel A (Eds.), Membrane Fluidity. Plenum Publishing Corp, New York. pp 99-131.
Smith WL, Marnett LJ (1991) Prostaglandin endoperoxide synthase: structure and catalysis. Biochim Biophys Acta 1083: 1-17.
Snyder F, Lee T, Wykle R (2004) Ether-linked lipids and their bioactive species. In: Vance D and Vance J (Eds.), Biochemistry of Lipids, Lipoproteins and Membranes. Elsevier, Amsterdam. pp 233-262.
Somero GN (1992) Adaptations to high hydrostatic pressure. Annu Rev Physiol 54: 557-577.
Spandl J, White DJ, Peychl J, Thiele C (2009) Live cell multicolor imaging of lipid droplets with a new dye, LD540. Traffic 10: 1579-1584.
Sreedhar AS, Srinivas UK (2002) Activation of stress response by ionomycin in rat hepatoma cells. J Cell Biochem 86: 154-161.
Stangl S, Gehrmann M, Riegger J, Kuhs K, Riederer I, et al. (2011) Targeting membrane heat-shock protein 70 (Hsp70) on tumors by cmHsp70.1 antibody. Proc Natl Acad Sci U S A 108: 733-738.
Stevenson MA, Calderwood SK, Hahn GM (1987) Effect of hyperthermia (45 degrees C) on calcium flux in Chinese hamster ovary HA-1 fibroblasts and its potential role in cytotoxicity and heat resistance. Cancer Res 47: 3712-3717.
Storch J, Shulman SL, Kleinfeld AM (1989) Plasma membrane lipid order and composition during adipocyte differentiation of 3T3F442A cells. Studies in intact cells with 1-[4-(trimethylamino)phenyl]-6-phenylhexatriene. J Biol Chem 264: 10527-10533.
Storey JD, Tibshirani R (2003) Statistical significance for genomewide studies. Proc Natl Acad Sci U S A 100: 9440-9445.
Söti C, Csermely P (2000) Molecular chaperones and the aging process. Biogerontology 1: 225-233.
Söti C, Csermely P (2007) Protein stress and stress proteins: implications in aging and disease. J Biosci 32: 511-515.
Söti C, Nagy E, Giricz Z, Vígh L, Csermely P, et al. (2005) Heat shock proteins as emerging therapeutic targets. Br J Pharmacol 146: 769-780.

179
Taipale M, Jarosz DF, Lindquist S (2010) HSP90 at the hub of protein homeostasis: emerging mechanistic insights. Nat Rev Mol Cell Biol 11: 515-528.
Takai S, Tokuda H, Matsushima-Nishiwaki R, Hanai Y, Kato K, et al. (2006) Phosphatidylinositol 3-kinase/Akt plays a role in sphingosine 1-phosphate-stimulated HSP27 induction in osteoblasts. J Cell Biochem 98: 1249-1256.
Tang X, Edwards EM, Holmes BB, Falck JR, Campbell WB (2006) Role of phospholipase C and diacylglyceride lipase pathway in arachidonic acid release and acetylcholine-induced vascular relaxation in rabbit aorta. Am J Physiol Heart Circ Physiol 290: H37-45.
Tissières A, Mitchell HK, Tracy UM (1974) Protein synthesis in salivary glands of Drosophila melanogaster: relation to chromosome puffs. J Mol Biol 84: 389-398.
Tsvetkova NM, Horváth I, Török Z, Wolkers WF, Balogi Z, et al. (2002) Small heat-shock proteins regulate membrane lipid polymorphism. Proc Natl Acad Sci U S A 99: 13504-13509.
Török Z, Goloubinoff P, Horváth I, Tsvetkova NM, Glatz A, et al. (2001) Synechocystis HSP17 is an amphitropic protein that stabilizes heat-stressed membranes and binds denatured proteins for subsequent chaperone-mediated refolding. Proc Natl Acad Sci U S A 98: 3098-3103.
Török Z, Horváth I, Goloubinoff P, Kovács E, Glatz A, et al. (1997) Evidence for a lipochaperonin: association of active protein-folding GroESL oligomers with lipids can stabilize membranes under heat shock conditions. Proc Natl Acad Sci U S A 94: 2192-2197.
Török Z, Tsvetkova NM, Balogh G, Horváth I, Nagy E, et al. (2003) Heat shock protein coinducers with no effect on protein denaturation specifically modulate the membrane lipid phase. Proc Natl Acad Sci U S A 100: 3131-3136.
Van Blitterswijk WJ, Van Hoeven RP, Van der Meer BW (1981) Lipid structural order parameters (reciprocal of fluidity) in biomembranes derived from steady-state fluorescence polarization measurements. Biochim Biophys Acta 644: 323-332.
Vance D (2004) Phospholipid biosynthesis in eukaryotes. In: Vance D and Vance J (Eds.), Biochemistry of Lipids, Lipoproteins and Membranes. Elsevier, Amsterdam. pp 205-231.
Vane JR (1971) Inhibition of prostaglandin synthesis as a mechanism of action for aspirin-like drugs. Nat New Biol 231: 232-235.
van Meer G (2011) Dynamic transbilayer lipid asymmetry. Cold Spring Harb Perspect Biol 3: a004671.
van Meer G, Voelker DR, Feigenson GW (2008) Membrane lipids: where they are and how they behave. Nat Rev Mol Cell Biol 9: 112-124.
van Meer G, de Kroon AIPM (2011) Lipid map of the mammalian cell. J Cell Sci 124: 5-8.
van Rossum DB, Patterson RL (2009) PKC and PLA2: probing the complexities of the calcium network. Cell Calcium 45: 535-545.
Vereb G, Szöllosi J, Matkó J, Nagy P, Farkas T, et al. (2003) Dynamic, yet structured: The cell membrane three decades after the Singer-Nicolson model. Proc Natl Acad Sci U S A 100: 8053-8058.

180
Vest R, Wallis R, Jensen LB, Haws AC, Callister J, et al. (2006) Use of steady-state laurdan fluorescence to detect changes in liquid ordered phases in human erythrocyte membranes. J Membr Biol 211: 15-25.
Vigh L, Escribá PV, Sonnleitner A, Sonnleitner M, Piotto S, et al. (2005) The significance of lipid composition for membrane activity: new concepts and ways of assessing function. Prog Lipid Res 44: 303-344.
Vigh L, Horváth I, Maresca B, Harwood JL (2007a) Can the stress protein response be controlled by 'membrane-lipid therapy'? Trends Biochem Sci 32: 357-363.
Vigh L, Literáti PN, Horváth I, Török Z, Balogh G, et al. (1997) Bimoclomol: a nontoxic, hydroxylamine derivative with stress protein-inducing activity and cytoprotective effects. Nat Med 3: 1150-1154.
Vigh L, Los DA, Horváth I, Murata N (1993) The primary signal in the biological perception of temperature: Pd-catalyzed hydrogenation of membrane lipids stimulated the expression of the desA gene in Synechocystis PCC6803. Proc Natl Acad Sci U S A 90: 9090-9094.
Vigh L, Maresca B (2002) Dual role of membranes in heat stress: as thermosensors they modulate the expression of stress genes and, by interacting with stress proteins, re-organize their own lipid order and functionality. In: Storey K and Storey J (Eds.), Sensing, Signaling and Cell Adaptation. Elsevier, Amsterdam. pp 173-187.
Vigh L, Maresca B, Harwood JL (1998) Does the membrane's physical state control the expression of heat shock and other genes? Trends Biochem Sci 23: 369-374.
Vigh L, Nakamoto H, Landry J, Gomez-Munoz A, Harwood JL, et al. (2007b) Membrane regulation of the stress response from prokaryotic models to mammalian cells. Ann N Y Acad Sci 1113: 40-51.
Vigh L, Török Z, Balogh G, Glatz A, Piotto S, et al. (2007c) Membrane-regulated stress response: a theoretical and practical approach. Adv Exp Med Biol 594: 114-131.
Voellmy R, Boellmann F (2007) Chaperone regulation of the heat shock protein response. Adv Exp Med Biol 594: 89-99.
Vos MJ, Hageman J, Carra S, Kampinga HH (2008) Structural and functional diversities between members of the human HSPB, HSPH, HSPA, and DNAJ chaperone families. Biochemistry 47: 7001-7011.
Wakelam MJ (1998) Diacylglycerol--when is it an intracellular messenger? Biochim Biophys Acta 1436: 117-126.
Welch WJ, Suhan JP (1985) Morphological study of the mammalian stress response: characterization of changes in cytoplasmic organelles, cytoskeleton, and nucleoli, and appearance of intranuclear actin filaments in rat fibroblasts after heat-shock treatment. J Cell Biol 101: 1198-1211.
Welch WJ, Suhan JP (1986) Cellular and biochemical events in mammalian cells during and after recovery from physiological stress. J Cell Biol 103: 2035-2052.
Wenk MR (2010) Lipidomics: new tools and applications. Cell 143: 888-895.
Westerheide SD, Morimoto RI (2005) Heat shock response modulators as therapeutic tools for diseases of protein conformation. J Biol Chem 280: 33097-33100.
Whiteman EL, Cho H, Birnbaum MJ (2002) Role of Akt/protein kinase B in metabolism. Trends Endocrinol Metab 13: 444-451.

181
Wilton D, Waite M (2004) Phospholipases. In: Vance D and Vance JE (Eds.), Biochemistry of Lipids, Lipoproteins and Membranes . Elsevier, Amsterdam. pp 291-314.
Wu KK (1998) Biochemical pharmacology of nonsteroidal anti-inflammatory drugs. Biochem Pharmacol 55: 543-547.
Wymann MP, Schneiter R (2008) Lipid signalling in disease. Nat Rev Mol Cell Biol 9: 162-176.
Xu Q, Schett G, Li C, Hu Y, Wick G (2000) Mechanical stress-induced heat shock protein 70 expression in vascular smooth muscle cells is regulated by Rac and Ras small G proteins but not mitogen-activated protein kinases. Circ Res 86: 1122-1128.
Yamamoto N, Smith MW, Maki A, Berezesky IK, Trump BF (1994) Role of cytosolic Ca2+ and protein kinases in the induction of the hsp70 gene. Kidney Int 45: 1093-1104.
Yamashita A, Sugiura T, Waku K (1997) Acyltransferases and transacylases involved in fatty acid remodeling of phospholipids and metabolism of bioactive lipids in mammalian cells. J Biochem 122: 1-16.
Yan D, Saito K, Ohmi Y, Fujie N, Ohtsuka K (2004) Paeoniflorin, a novel heat shock protein-inducing compound. Cell Stress Chaperones 9: 378-389.
Yan L, Rajasekaran NS, Sathyanarayanan S, Benjamin IJ (2005) Mouse HSF1 disruption perturbs redox state and increases mitochondrial oxidative stress in kidney. Antioxid Redox Signal 7: 465-471.
Yatvin MB, Clifton KH, Dennis WH (1979) Hyperthermia and local anesthetics: potentiation of survival of tumor-bearing mice. Science 205: 195-196.
Yatvin MB, Cramp WA (1993) Role of cellular membranes in hyperthermia: some observations and theories reviewed. Int J Hyperthermia 9: 165-185.
Young JC (2010) Mechanisms of the Hsp70 chaperone system. Biochem Cell Biol 88: 291-300.
Young JC, Agashe VR, Siegers K, Hartl FU (2004) Pathways of chaperone-mediated protein folding in the cytosol. Nat Rev Mol Cell Biol 5: 781-791.
Yu W, So PT, French T, Gratton E (1996) Fluorescence generalized polarization of cell membranes: a two-photon scanning microscopy approach. Biophys J 70: 626-636.
Yukawa O, Nakajima T, Miura Y, Ueda J, Ozawa T (2005) Induction of radical scavenging ability and suppression of lipid peroxidation in rat liver microsomes following whole-body, low-dose X-irradiation. Int J Radiat Biol 81: 681-688.
Zaragoza A, Díez-Fernández C, Alvarez AM, Andrés D, Cascales M (2001) Mitochondrial involvement in cocaine-treated rat hepatocytes: effect of N-acetylcysteine and deferoxamine. Br J Pharmacol 132: 1063-1070.
Zemski Berry KA, Murphy RC (2004) Electrospray ionization tandem mass spectrometry of glycerophosphoethanolamine plasmalogen phospholipids. J Am Soc Mass Spectrom 15: 1499-1508.
Zeyda M, Stulnig TM (2006) Lipid Rafts & Co.: an integrated model of membrane organization in T cell activation. Prog Lipid Res 45: 187-202.
Zhang Y, Li X, Becker KA, Gulbins E (2009) Ceramide-enriched membrane domains--structure and function. Biochim Biophys Acta 1788: 178-183.

182
Zhou YN, Kusukawa N, Erickson JW, Gross CA, Yura T (1988) Isolation and characterization of Escherichia coli mutants that lack the heat shock sigma factor sigma 32. J Bacteriol 170: 3640-3649.

183
APPENDIX 1 – PUBLICATION LIST
Publications related to the thesis
1. Balogh G, Maulucci G, Gombos I, Horvath I, Torok Z, Peter M, Fodor E, Pali T, Benko S, Parasassi T, De Spirito M, Harwood JL, Vigh L (2011) Heat stress causes spatially-distinct membrane re-modelling in K562 leukemia cells. Plos One 6: e2182.
2. Balogh G, Peter M, Liebisch G, Horvath I, Torok Z, Nagy E, Maslyanko A, Benko S, Schmitz G, Harwood JL, Vigh L (2010) Lipidomics reveals membrane lipid remodelling and release of potential lipid mediators during early stress responses in a murine melanoma cell line. Biochim Biophys Acta 1801: 1036-1047.
3. Nagy E, Balogi Z, Gombos I, Akerfelt M, Bjorkbom A, Balogh G, Torok Z, Maslyanko A, Fiszer-Kierzkowska A, Lisowska K, Slotte PJ, Sistonen L, Horvath I, Vigh L (2007) Hyperfluidization-coupled membrane microdomain reorganization is linked to activation of the heat shock response in a murine melanoma cell line. Proc Natl Acad Sci U S A 104: 7945-7950.
4. Balogh G, Horvath I, Nagy E, Hoyk Z, Benko S, Bensaude O, Vigh L (2005) The hyperfluidization of mammalian cell membranes acts as a signal to initiate the heat shock protein response. FEBS J 272: 6077-6086.
Other publications
5. Gombos I, Crul T, Piotto S, Burcin G, Torok Z, Balogh G, Peter M, Slotte JP, Campana F, Pilbat A, Toth N, Literati-Nagy Z, Vigh L Jr., Glatz A, Brameshuber M, Schutz G, Hevener A, Febbraio MA, Horvath I, Vigh L (2011) Membrane-lipid therapy in operation: The HSP co-inducer BGP-15 activates stress signal transduction pathways by remodeling plasma membrane rafts. Plos One (accepted).
6. Sipos E, Kurunczi A, Feher A, Penke Z, Fulop L, Kasza A, Horvath J, Horvat S, Veszelka S, Balogh G, Kurti L, Eros I, Szabo-Revesz P, Parducz A, Penke B, Deli MA (2010) Intranasal delivery of human beta-amyloid peptide in rats: effective brain targeting. Cell Mol Neurobiol 30: 405-413.
7. Brunelli R, Balogh G, Costa G, De Spirito M, Greco G, Mei G, Nicolai E, Vigh L, Ursini F, Parasassi T (2010) Estradiol binding prevents apob-100 misfolding in electronegative ldl(-). Biochemistry 49: 7297-7302.
8. Balogh G, Peter M, Torok Z, Horvath I, Vigh L (2010) Lipidomika. Magyar Tudomány 171: 1078-1082.
9. Horvát S, Fehér A, Wolburg H, Sipos P, Veszelka S, Tóth A, Kis L, Kurunczi A, Balogh G, Kürti L, Eros I, Szabó-Révész P, Deli MA (2009) Sodium hyaluronate as a mucoadhesive component in nasal formulation enhances delivery of molecules to brain tissue. Eur J Pharm Biopharm 72: 252-259.
10. Greco G, Balogh G, Brunelli R, Costa G, De Spirito M, Lenzi L, Mei G, Ursini F Parasassi T (2009) Generation in Human Plasma of Misfolded, Aggregation-Prone Electronegative Low Density Lipoprotein. Biophys J 97: 628-635.
11. Eder K, Vizler C, Kusz E, Karcagi I, Glavinas H, Balogh GE, Vigh L, Duda E, Gyorfy Z (2009) The role of lipopolysaccharide moieties in macrophage response to Escherichia coli. Biochem Biophys Res Commun 389: 46-51.

184
12. De Palma M., Grillo S, Massarelli I, Costa A, Balogh G, Vigh L, Leone A (2008) Regulation of desaturase gene expression, changes in membrane lipid composition and freezing tolerance in potato plants. Mol Breeding 21: 15–26.
13. Vigh L, Torok Z, Balogh G, Glatz A, Piotto S, Horvath I (2007) Membrane-regulated stress response: a theoretical and practical approach. Adv Exp Med Biol 594: 114-131.
14. Balogi Z, Torok Z, Balogh G, Josvay K, Shigapova N, Vierling E, Vigh L, Horvath I (2005) "Heat shock lipid" in cyanobacteria during heat/light-acclimation. Arch Biochem Biophys 436: 346-354.
15. Shigapova N, Torok Z, Balogh G, Goloubinoff P, Vigh L, Horvath I (2005) Membrane fluidization triggers membrane remodeling which affects the thermotolerance in Escherichia coli. Biochem Biophys Res Commun 328: 1216-1223.
16. Cinege G, Kereszt A, Kertész S, Balogh G, Dusha I (2004) The roles of different regions of the CycH protein in c-type cytochrome biogenesis in Sinorhizobium meliloti. Mol Genet Genomics 271: 171-179.
17. Török Z, Tsvetkova NM, Balogh G, Horváth I, Nagy E, Pénzes Z, Hargitai J, Bensaude O, Csermely P, Crowe JH, Maresca B, Vígh L (2003) Heat shock protein co-inducers with no effect on protein denaturation specifically modulate the membrane lipid phase. Proc Natl Acad Sci U S A 100: 3131-3136.
18. Csont T, Balogh G, Csonka Cs, Horváth I, Vígh L, Ferdinándy P (2002) Hyperlipidemia induced by high cholesterol diet inhibits heat-shock response after ischemic and heat stress in rat hearts. Biochem Biophys Res Comm 290: 1535-1538.
19. Török Z, Goloubinoff P, Horváth I, Tsvetkova NM, Glatz A, Balogh G, Varvasovszki V, Los DA, Vierling E, Crowe JH, Vígh L (2001) Synechocystis HSP17 is an amphitropic protein that stabilizes heat-stressed membranes and binds denatured proteins for subsequent chaperone-mediated refolding. Proc Natl Acad Sci U S A 98: 3098-3103.
20. Lahdes E, Balogh G, Fodor E, Farkas T (2001) Adaptation of composition and biophysical properties of phospholipids to temperature by the Crustacean, Gammarus spp. Lipids 35: 1093-1098.
21. Horváth I, Glatz A, Varvasovszki V, Török Z, Pali T, Balogh G, Kovacs E, Nadasdi L, Benko S, Joo F, Vígh L (1998) Membrane physical state controls the signaling mechanism of the heat shock response in Synechocystis PCC 6803: identification of hsp17 as a "fluidity gene". Proc Natl Acad Sci U S A 95: 3513-3518.
22. Pataricza J, Penke B, Balogh GE, Papp JG (1998) Polarographic detection of nitric oxide released from cardiovascular compounds in aqueous solutions. J Pharmacol Toxicol Methods 39: 91-95.
23. Torday LL, Pataricza J, Balogh GE, Zarándi M, Penke B, Papp JG (1998) Endothelium-dependent vasorelaxant and anti-aggregatory effect and mechanism of action of some antifibrinogen RGD (Arg-Gly-Asp-containing) peptides. J Pharm Pharmacol 50: 667-671.
24. Győrfy Z, Horváth I, Balogh G, Domonkos A, Duda E, Maresca B, Vígh L (1997) Modulation of lipid unsaturation and membrane fluid state in mammalian cells by

185
stable transformation with the delta9-desaturase gene of Saccharomyces cerevisiae. Biochem Biophys Res Commun 237: 362-366.
25. Török Z, Horváth I, Goloubinoff P, Kovács E, Glatz A, Balogh G, Vígh L (1997) Evidence for a lipochaperonin: association of active protein-folding GroESL oligomers with lipids can stabilize membranes under heat shock conditions. Proc Natl Acad Sci U S A 94: 2192-2197.
26. Vígh L, Literáti PN, Horváth I, Török Z, Balogh G, Glatz A, Kovács E, Boros I, Ferdinandy P, Farkas B, Jaszlits L, Jednákovits A, Korányi L, Maresca B (1997) Bimoclomol: a nontoxic, hydroxylamine derivative with stress protein- inducing activity and cytoprotective effects. Nat Med 3: 1150-1154.
27. Szabó AC, Balogh EG, Pataricza J, Papp JG (1994) Nitroglycerin induced acute "desenzitisation" is inhibited by ATP-sensitive potassium channel openers in isolated rabbit aorta. Polish J Pharmacol 46: 247-248.
Abstracts in journals
28. Vigh L, Balogh G, Torok Z, Gombos I, Peter M, Gungor B, Crul T, Toth N, Hunya A, Pilbat A, Vigh Jr. L, Glatz A, Horvath I (2011) Membranes in stress management: How membranes control the expression and cellular distribution of stress proteins. Chem Phys Lipids 164: S10.
29. Horvath I, Balogh G, Peter M, Gombos I, Glatz A, Crul T, Burcin G, Torok Z, Vigh, L (2010) Interrelationship between lipid droplet (LD) biogenesis and heat shock protein (Hsp) response. Chem Phys Lipids 163:S60.
30. Balogh G, Peter M, Liebisch G, Maslyanko A, Nagy E, Horvath I, Schmitz G, Harwood JL, Vigh L (2009) Membrane origin of stress response in B16 cells: a lipidomic approach. Chem Phys Lipids 160: S18-S19.
31. Balogh G, Liebisch G, Szilvassy Z, Peidl B, Nagy ZL, Tory K, Peter M, Torok Z, Benko S, Horvath I, Schmitz G, Vigh, L (2008) Membrane lipids as drug targets: lipidomic fingerprint of antidiabetic treatment. Chem Phys Lipids 154: S43.
32. Vigh L, Torok Z, Balogh G, et al. (2008) Membranes as stress sensors fine-tune the stress protein expression. Chem Phys Lipids 154: S18.
33. Benko S, Balogh G, Horvath I, Liebisch G, Maslyanko A, Schmitz G, Harwood JL, Vigh L (2007) Variations in culture conditions profoundly alter the lipid composition of mammalian cells: implications for the stress response modulation. Blodd Reviews 21: S94.
34. Balogh G, Horvath I, Liebisch G, Maslyanko A, Nagy E, Schmitz G, Harwood JL, Vigh L (2006) Variations in culture conditions profoundly alter the lipid composition of mammalian cells: Implications for the stress response modulation. Chem Phys Lipids 143: S67.
35. Horvath I, Torok Z, Balogh G, Maslyanko A, Nagy E, Balogi Z, Gombos I, Vigh L (2006) Stress protein responses in mammalian cells under the control of lipid composition and microdomain organization of membranes. Chem Phys Lipids 143: S46.
36. Balogh G, Horvath I, Nagy E, Torok Z, Parasassi T, Vigh L (2004) Rapid plasma membrane reorganisation in response to heat and membrane perturbation. Chem Phys Lipids 130: S46.

186
37. Horvath I, Glatz A, Balogi Z, Balogh G, Puskas L, Josvay K, Liberek K, Debreczeny M, Hunyadi-Gulyas M, Medzihradszky E, Goloubinoff P, Vigh L (2004) The emerging role for small heat shock proteins in the regulation of composition and dynamics of cell membranes. Chem Phys Lipids 130: S29.
38. Balogh G, Horváth I, Nagy E, Török Z, Parasassi T, Vígh L (2004) Rapid plasma membrane reorganisation in response to heat and membrane perturbation. Chem Phys Lipids 130: S46.
39. Horváth I, Glatz A, Balogi Z, Balogh G, Puskás L, Jósvai K, Liberek K, Debreczeny M, Hunyadi-Gulyás É, Medzihradszky K, Goloubinoff P, Vígh L (2004) The emerging role for small heat shock proteins in the regulation of composition and dynamics of cell membranes. Chem Phys Lipids 130: S29.
40. Balogh G, Horváth I, Nagy E, Török Z, Győrfy Z, Hoyk Z, Benkő S, Bensaude O, Vígh L (2002) Membrane as thermosensor modulate the expression of stress genes. Chem Phys Lipids 118: S84.
41. Horváth I, Török Z, Tsvetkova NM, Balogi Z, Balogh G, Vierling E, Crowe JH, Vígh L (2002) Small heat-shock proteins regulate membrane lipid polymorphism. Chem Phys Lipids 118: S15.
42. Győrfy Z, Horváth I, Balogh EG, Vígh L, Maresca B, Duda E (1996) Alteration of TNF sensitivity and membrane viscosity of target cells. Eur Cytokine Netw 7: 173.
43. Győrfy Z, Galiba E, Balogh EG, Horváth I, Vígh L, Duda E, Maresca B (1996) Increased sensitivity of target cells to cytotoxic cells and cytokines after expression of fungal desaturase gene. Cell Biol Intl 20: 222.
44. Pataricza J, Balogh EG, Papp JG (1996) Effect of selective inhibitors of cyclic nucleotide phosphodiesterase isoenzymes on platelet aggregation. J Mol Cell Cardiol 28: A98.
45. Pataricza J, Penke B, Balogh EG, Papp JG (1995) Polarographic measurement of nitric oxide released by "NO-donor" compounds in aqueous solutions. J Mol Cell Cardiol 27: A102.
46. Torday L, Pataricza J, Balogh EG, Penke B, Zarándi M, Papp JG (1994) Vasorelaxant properties and mechanism of action of some RGD- (Arg-Gly-Asp-containing) peptides. J Mol Cell Cardiol 26: 339.
47. Balogh EG, Pataricza J, Papp JG (1993): Kinetic analysis of the effects of vinpocetine, zaprinast and 8-bromo-cGMP on agonist induced endothelium dependent relaxation. J Mol Cell Cardiol 25: S93.
48. Pataricza J, Balogh G, Jakab I, Papp JG (1993) Interaction of vinpocetine and acetylcholine on endothelium dependent relaxation and cyclic GMP content in isolated rabbit aorta. J Mol Cell Cardiol 25: S93.
49. Pataricza J, Balogh G, Papp JG (1993) Vinpocetine prolongs endothelium dependent vascular relaxation induced by thrombin stimulated platelets in vitro. J Mol Cell Cardiol 25: S94.
50. Torday L, Balogh EG, Pataricza J, Zarándi M, Papp JG, Penke B (1993): The vasodilator property and mechanism of action of GRGDS an Arg-Gly-Asp(RGD)-containing peptide. J Mol Cell Cardiol 25: S93.

187
APPENDIX 2 – COPYRIGHT PERMISSIONS
Re-used material
Adapted from Copyright holder Permission received or not required*
Figure 1.1 Richter et al., 2010 Elsevier
Figure 1.2 Finka et al., 2011 Springer Science+Business Media
Tables 1.1–1.5 Kampinga et al., 2009 Springer Science+Business Media
Figure 1.3 Kampinga and Craig, 2010
Nature Publishing Group
Table 1.6 Vos et al., 2008 ACS
Figure 1.4 Björk and Sistonen, 2010
John Wiley & Sons, Inc.
Figure 1.6 Vigh et al., 2007a Elsevier
Figure 1.7 Morimoto, 1998 CSH Laboratory Press
Figure 1.8 Shamovsky et al., 2006
Nature Publishing Group
Figure 1.17 Pomorski and Menon, 2006
Springer Science+Business Media
Figure 1.18 Simons and Sampaio, 2011
CSH Perspectives
Figure 1.19 Horváth et al., 1998 National Academy of Sciences
Figure 1.20 Escribá et al., 2008 John Wiley & Sons, Inc.
Figures 3.1–3.8 Balogh et al., 2005 John Wiley & Sons, Inc.
Figure 4.1 Nagy et al., 2007 National Academy of Sciences
Figure 4.5–4.15 Balogh et al., 2010 Elsevier Tables 4.1–4.2 Balogh et al., 2010 Elsevier
Figures 5.1–5.9 Balogh et al., 2011 Creative Commons Attribution License
Table 5.2 Balogh et al., 2011 Creative Commons Attribution License
*: The list was made according to “THE STM PERMISSIONS GUIDELINES (2012)” (www.stm-assoc.org) through the Copyright Clearance Center and/or according to the copyright holder instructions.