Embed Size (px)
Citation preview

1
Role of oxidative stress mediated by glutathione-S-transferase in thiopurines toxic
effects
Marco Pelin†, Sara De Iudicibus‡, Laura Fusco†, Eleonora Taboga†, Giulia Pellizzari†, Cristina
Lagatolla†, Stefano Martelossi‡, Alessandro Ventura‡,§, Giuliana Decorti†*, Gabriele Stocco†
† Department of Life Sciences, University of Trieste, 34127 Trieste, Italy
‡ Institute for Maternal and Child Health IRCCS Burlo Garofolo, 34137 Trieste, Italy
§ Department of Medical, Surgical and Health Sciences, University of Trieste, 34127 Trieste,
Italy
*Corresponding author
Prof. Giuliana Decorti, Department of Life Sciences, University of Trieste, Via Fleming 22,
34127 Trieste, Italy; email: [email protected]; tel. +39 040 5588777
Keywords
Thiopurines; ROS; glutathione; glutathione-S-transferase; transfections
Page 1 of 35
ACS Paragon Plus Environment
Chemical Research in Toxicology
123456789101112131415161718192021222324252627282930313233343536373839404142434445464748495051525354555657585960
2
Abstract
Azathioprine (AZA), 6-mercaptopurine (6-MP) and 6-thioguanine (6-TG) are antimetabolite
drugs, widely used as immunosuppressants and anticancer agents. Despite their proven
efficacy, high incidence of toxic effects in patients during the standard-dose therapy is
recorded. The aim of this study is to explain, from a mechanistic point of view, the clinical
evidence showing a significant role of glutathione-S-transferase (GST)-M1 genotype on AZA
toxicity in inflammatory bowel disease patients.
To this aim, the human non-tumor IHH and HCEC cell lines were chosen as predictive
models of the hepatic and intestinal tissues, respectively. AZA, but not 6-MP and 6-TG,
induced a concentration-dependent superoxide anion production that seemed dependent on
GSH depletion. N-acetyl-cysteine reduced AZA anti-proliferative effect in both cell lines and
GST-M1 overexpression increased both superoxide anion production and cytotoxicity,
especially in transfected HCEC cells.
In this study, an in vitro model to study thiopurines metabolism has been set up and helped us
to demonstrate, for the first time, a clear role of GST-M1 in modulating AZA cytotoxicity,
with a close dependency on superoxide anion production. These results provide the molecular
basis to shed light on the clinical evidence suggesting a role of GST-M1 genotype in
influencing the toxic effects of AZA treatment.
Page 2 of 35
ACS Paragon Plus Environment
Chemical Research in Toxicology
123456789101112131415161718192021222324252627282930313233343536373839404142434445464748495051525354555657585960

3
1 Introduction
Thiopurines, azathioprine (AZA), 6-mercaptopurine (6-MP) and 6-thioguanine (6-TG), are
antimetabolite drugs, thio-analogues of purine bases, widely used as effective
immunosuppressants; 6-MP and 6-TG are also employed as antileukemic drugs.1 AZA is the
pro-drug of 6-MP, commonly used as an immunosuppressant for the treatment of various
chronic inflammatory diseases, such as inflammatory bowel disease (IBD), and following
organ transplantation.2, 3 Thiopurine antimetabolites are inactive pro-drugs and, in order to
exert their cytotoxic action, must be converted into the active metabolites 6-thioguanine
nucleotides (6-TGNs), which are substrates for incorporation into DNA.4 Despite the proven
efficacy of these drugs, adverse reactions to thiopurines occur in a high percentage of patients,
during the standard-dose therapy, while some patients do not respond to therapy at all.5 The
inter-individual variability in the response to thiopurines is in part linked to the complexity of
their intracellular metabolism that is mediated by several enzymes. The presence of
polymorphisms in genes encoding for these enzymes, that induces alterations in their activity,
can be responsible of this variability. One of the most studied examples is that of thiopurine-
S-methyltransferase (TPMT) polymorphisms.6 Given the enzymes involved in thiopurines
metabolism, oxidative stress could have a role in their effects at the cellular level; this seems
likely especially for AZA, that is activated to 6-MP through a conjugation reaction with
reduced glutathione (GSH), which can lead to the depletion of the cytosolic pool of GSH.7
This conversion can occur spontaneously1 but in vitro studies have indicated a relevant role of
the enzymes glutathione-S-transferase (GST)8 and in particular of the isoforms GST-A1/2 and
GST-M1.9 Moreover, in recent studies conducted by our group in young subjects with IBD,
we found that patients with reduced levels of GST-M1, due to genetic deletion, present
decreased sensitivity to the effects of AZA10 and a decreased amount of active 6-TGNs,11
putatively because of a reduced GST-catalyzed biotransformation of AZA to 6-MP.12 GSTs
Page 3 of 35
ACS Paragon Plus Environment
Chemical Research in Toxicology
123456789101112131415161718192021222324252627282930313233343536373839404142434445464748495051525354555657585960

4
may contribute to AZA effects not only by increasing the activation of AZA to 6-MP but also
modulating GSH consumption and oxidative stress which is more evident in cells with high
GST activity compared with those with low or absent activity, leading to higher cellular and
tissue damage.13, 14 Because GSH is the main antioxidant system in the cell, its depletion
induces significant reactive oxygen species (ROS) accumulation, as demonstrated in several
systems.15, 16 Production of ROS during treatment with thiopurines could be related also to
xanthine oxidase (XO), a known ROS producing enzyme which, in the liver, plays an
important role in the first-pass metabolism of these drugs after oral administration,
catabolizing 6-MP to the inactive thiouric acid. Indeed, in primary cultures of rat hepatocytes
incubated with thiopurines, metabolism of these drugs by XO may generate ROS.17, 18
Allopurinol is a powerful XO inhibitor which improves response to thiopurines by increasing
the concentration of active 6-TGNs.19
Drug activation and some severe adverse effects of thiopurines occur in the intestinal and
hepatic tissues and elucidation of molecular events specific of these tissues may be of interest
to improve efficacy and safety of the treatment with these agents.20 To this end, we
investigated in vitro the sensitivity to thiopurines in stabilized non tumor human cell lines of
hepatic and intestinal origin evaluating the contribution of oxidative stress in the mechanism
of action of these drugs.
Page 4 of 35
ACS Paragon Plus Environment
Chemical Research in Toxicology
123456789101112131415161718192021222324252627282930313233343536373839404142434445464748495051525354555657585960
5
2 Experimental procedures
2.1 Materials
Thiopurines and all reagents for cell culture were purchased from Sigma-Aldrich (Milan,
Italy). The empty pCMV6 plasmids (PS100001), the pCMV6 plasmids carrying the cDNA
sequence encoding for GSTM-1 and DDK (RC223332) and anti-DDK antibodies were
obtained from Origene (Milan, Italy). Rabbit anti-actin was from Millipore (Milan, Italy),
secondary anti-rabbit and anti-mouse HRP-conjugated antibodies from Cell Signaling
Technology (Milan, Italy) and the LiteAblot® TURBO kit was from Euroclone (Milan, Italy).
The X-TremeGENE 9 DNA Transfection Reagent was from Roche (Milan, Italy) and the
restriction enzyme AanI from Thermo Scientific (Milan, Italy). All the other reagents of
analytic grade were purchased from Sigma-Aldrich (Milan, Italy).
2.2 Cell cultures
The immortalized human hepatic IHH cell line was maintained in Dulbecco’s modified
Eagle’s medium (DMEM) high glucose with the addition of 10% fetal bovine serum (FBS),
1.25% L-glutamine 200 mM, 1% penicillin 10000 UI/ml, streptomycin 10 mg/ml, 1% Hepes
buffer 1 M, 0.01 % human insulin 10-4 M and 0.04% dexamethasone 1 mg/ml. The non-tumor
intestinal human colon epithelium HCEC cell line was maintained in DMEM low glucose
with the addition of 10% FBS, 1% L-glutamine 200 mM, 1% penicillin 10000 UI/ml,
streptomycin 10 mg/ml, 2% Hepes buffer 1 M, 1% sodium pyruvate 100 mM, 1.5% bovine
serum albumin 200 mg/ml, 0.03% ethanolamine 0.166 M, 0.7% O-phosphatidyl-ethanolamine
7x10⁻⁵ M. Cell cultures were maintained according to standard procedures in humidified
incubator at 37°C and with 5% CO2 and cell passage was performed once a week.
2.3 3-(4,5-dimethylthiazol-2-yl)-2,5-diphenyltetrazolium (MTT) assay
Page 5 of 35
ACS Paragon Plus Environment
Chemical Research in Toxicology
123456789101112131415161718192021222324252627282930313233343536373839404142434445464748495051525354555657585960

6
IHH and HCEC cells (5x10³ cells/well) were exposed for 96 h to AZA and 6-MP (1.9x10⁻⁶ –
8.0x10⁻³ M) and 6-TG (3.1x10⁻⁸ – 1.3x10⁻⁴ M). Exposure time was chosen on the basis of
previously published results.20 In the last 4 h of treatment, a solution of MTT was added (final
concentration 0.5 mg/mL) and the crystals solubilized by 100 µL of DMSO. The absorbance
was read by an Automated Microplate Reader EL 311s (Bio-Tek Instruments, Winooski,
USA) at 540/630 nm. Data are the means ± SE of at least three independent experiments
performed in triplicate and are reported as % of untreated control (absorbance
treated/absorbance untreated control*100).
2.4 Nitro blue tetrazolium (NBT) assay
IHH and HCEC cells (1x10⁴ cells/well) were exposed for 8 and 24 h to AZA, 6-MP and 6-TG
as described above. ROS production, as superoxide anion, was evaluated by NBT reduction
assay as previously described.21 Briefly, in the last 2 h of treatment, a solution of NBT was
added (final concentration 0.5 mg/mL) and the crystals solubilized by 140 µL of DMSO and
120 µL of KOH 2M. The absorbance was read by an Automated Microplate Reader EL 311s
(Bio-Tek Instruments, Winooski, USA) at 630 nm. Data are the means ± SE of at least three
independent experiments performed in triplicate and are reported as % increase with respect
to untreated controls [(absorbance treated-absorbance controls)/absorbance controls)*100].
2.5 Cell proliferation
The effect of AZA, 6-MP and 6-TG on proliferation of IHH and HCEC cells was determined
by labeling metabolically active cells with [methyl-3H] thymidine. Cells were seeded into a
96-well plate (5×10⁴ cells/well) in the presence of AZA, 6-MP and 6-TG at the same
concentration range used for MTT assay. After 91 h of incubation, cells were pulsed with
[methyl-3H] thymidine (2.5 µCi/ml), and the incubation was continued for additional 5 hours.
Page 6 of 35
ACS Paragon Plus Environment
Chemical Research in Toxicology
123456789101112131415161718192021222324252627282930313233343536373839404142434445464748495051525354555657585960
7
Cells were than washed with PBS, trypsinized, collected and the radioactivity of the samples
was determined by a Liquid Scintillation Analyzer (Wallac 1450 Microbeta liquid
scintillation counter, Perkin Elmer, Milan, Italy). Raw count per minute (cpm) data were
converted and normalized to percent of maximal proliferation for each experimental condition
(cpm treated/cpm untreated control *100).
2.6 Glutathione depletion
IHH and HCEC cells (1x10⁵ cells/well) were seeded in 6-wells plates and exposed for 96 h to
AZA at a concentration equal to the EC50 (concentration giving the 50% of the effect) and
EC95 (concentration giving the 95% of the effect) values obtained by the MTT assay. After
treatment, survived cells were collected in ice-cold PBS, lysed, sonicated and protein content
measured using a NanoDrop 2000 spectrophotometer (Euroclone, Milan, Italy). In a 96-wells
plate, 10 µl of each cell lysate were added to 10 µl of o-phthalaldehyde 1 mg/ml and 180 µl
phosphate buffer (K3PO4 0.1 M and EDTA 0.005 M, pH 8) and incubated for 15 minutes.
Samples were then read by a Fluorocount microplate Fluorometer (Packard, Germany) using
a λex=350 nm and a λem=420 nm. Data obtained by three experiments performed in duplicate
were normalized on protein content and expressed as % of GSH with respect to the untreated
controls.
2.7 GST-M1 stable transfection
Overexpression of GST-M1 was performed using the X-tremeGENE 9 Transfection Reagent,
according to the manufacturer’s instructions and using a commercial plasmid pCMV6
carrying the cDNA sequence encoding for GSTM-1 and for the tag DDK and an empty vector
plasmid as control (MOCK). In order to increase the efficiency of integration, plasmid vectors
were linearized by digestion with the restriction enzyme AanI, using a ratio of 1.5 U of AanI
Page 7 of 35
ACS Paragon Plus Environment
Chemical Research in Toxicology
123456789101112131415161718192021222324252627282930313233343536373839404142434445464748495051525354555657585960
8
for 1 µg of plasmid DNA and incubating for 3 h at 37°C. IHH and HCEC cells (5x10⁴
cells/well) were seeded in 96-wells plates 24 h before transfection. On 200 µl of each serum-
free cell media, 2 µg of linearized plasmid and 6 µl of XtremeGENE were added, yielding a
ratio plasmidic DNA:transfection reagent of 1:3. The mix was incubated for 30 min at room
temperature and then 10 µl of the mix were added dropwise to each well. Transfected cells
were maintained in the incubator at 37°C for 48 h. Cell media were then changed and
transfected cells kept in culture with fresh media containing G-418, as selection agent, at final
concentrations of 0.25 mg/ml and 1 mg/ml for IHH and HCEC cells, respectively.
2.8 Western blot
Cells (1x10⁷) were cultured as reported above, collected, washed in cold PBS and lysed using
a lysis buffer composed by Tris-HCl 10 mM pH 7.4, EDTA 100 mM, NaCl 100 mM, SDS
0.1%, Protease inhibitor cocktail 1%. Samples were then run on 10% acrylamide gels in a
Trys-Glycine buffer in a PAGErTM Mini-gel Chamber (Lonza, Milan, Italy) and then semi-dry
blotted for 2 h with 50 mA current on PVDF membrane. Membranes were blocked for 1 h
with 5% not-fat milk in Tween/tris-buffered salt solution (TTBS) and incubated overnight at
4°C with primary antibodies (rabbit anti-actin 1:20000 and mouse anti-DDK 1:1000).
Membranes were then washed twice with TTBS and incubated for 1 h at 37°C with secondary
anti-rabbit and anti-mouse HRP-conjugated antibodies, at 1:50000 and 1:25000 dilutions,
respectively. Chemiluminescence was developed using LiteAblot® TURBO kit following
manufacturer’s instructions and exposed on Kodak Biomax light film.
2.9 Statistical analysis
Results are presented as mean ± SE from at least three independent experiments and nonlinear
regression of concentration-response data was performed for computing EC50 values using
Page 8 of 35
ACS Paragon Plus Environment
Chemical Research in Toxicology
123456789101112131415161718192021222324252627282930313233343536373839404142434445464748495051525354555657585960
9
GraphPad Prism version 4.00 (Prism GraphPad, Inc.; San Diego, CA, USA). Data were
analyzed by one-way and two-way ANOVA followed by Bonferroni’s post test (Prism
GraphPad, Inc.; San Diego, CA, USA) and significant differences were considered at p <
0.05.
Western blot protein expression was quantified on three different western blots using the
ImageJ software version 1.45s and the means analyzed by one-way ANOVA and
Bonferroni’s post test as described above.
Page 9 of 35
ACS Paragon Plus Environment
Chemical Research in Toxicology
123456789101112131415161718192021222324252627282930313233343536373839404142434445464748495051525354555657585960
10
3 Results
3.1 Superoxide anion production induced by thiopurine drugs
To investigate the role of oxidative stress, the effects of AZA, 6-MP and 6-TG on ROS
production, as superoxide anion, were evaluated in IHH and HCEC cells by the NBT
reduction assay. As shown in figure 1, a significant superoxide anion production was detected
only after AZA exposure in both cell lines, both after 8 and 24 h, exposure times after which
no cytotoxic effect was observed. In particular, AZA induced a concentration-dependent
superoxide anion increase starting from the concentration of 1.25 x 10⁻⁴ M. At the highest
concentration of AZA (8.0x10⁻³ M), a 24 h treatment induced a release of superoxide anion
equal to 82.7±6.8% and 64.4±5.7%, in IHH (Panel A) and HCEC cells (Panel B), respectively.
On the contrary, 6-MP and 6-TG did not induce significant effects on superoxide anion
production.
3.2 Effect of allopurinol on thiopurines cytotoxicity
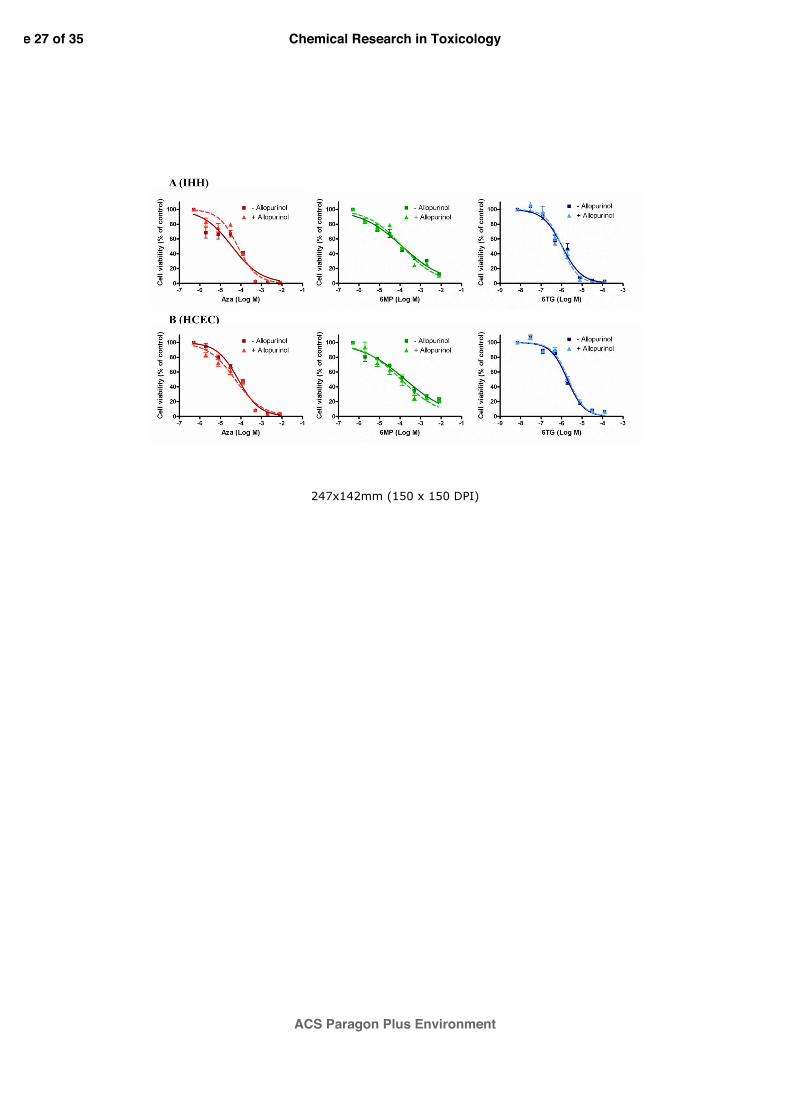
As shown in figure 2, thiopurines induced concentration-dependent cytotoxic effects after 96
h with EC50 values of 4.4x10⁻⁵ M (95% confidence intervals, CI=2.8-7.0x10⁻⁵ M), 1.1x10⁻⁴ M
(95% CI=0.8-1.5x10⁻⁴ M) and 1.2x10⁻⁶ M (95% CI=1.0-1.5x10⁻⁶ M) for AZA, 6-MP and 6-
TG, respectively, in IHH cells (Panel A). Similar results were obtained in HCEC cells (Panel
B), in which 96 h treatment with thiopurines induced a concentration-dependent cytotoxic
effect, with EC50 values of 7.4x10⁻⁵ M (95% CI=5.8-9.4x10⁻⁵ M), 1.8x10⁻⁴ M (95% CI=1.2-
2.5x10⁻⁴ M) and 1.9x10⁻⁶ M (95% CI=1.6-2.4x10⁻⁶ M) for AZA, 6-MP and 6-TG, respectively.
To evaluate the role of oxidative stress in thiopurines cytotoxicity, AZA, 6-MP and 6-TG were
used in co-treatment with allopurinol, a well-known inhibitor of XO. IHH and HCEC cells
Page 10 of 35
ACS Paragon Plus Environment
Chemical Research in Toxicology
123456789101112131415161718192021222324252627282930313233343536373839404142434445464748495051525354555657585960

11
were pre-treated for 1 h with allopurinol 100 µM and then exposed for 96 h to thiopurines.
However, allopurinol co-exposure did not affect thiopurines cytotoxic effects.
3.3 Effect of allopurinol on thiopurines anti-proliferative effects
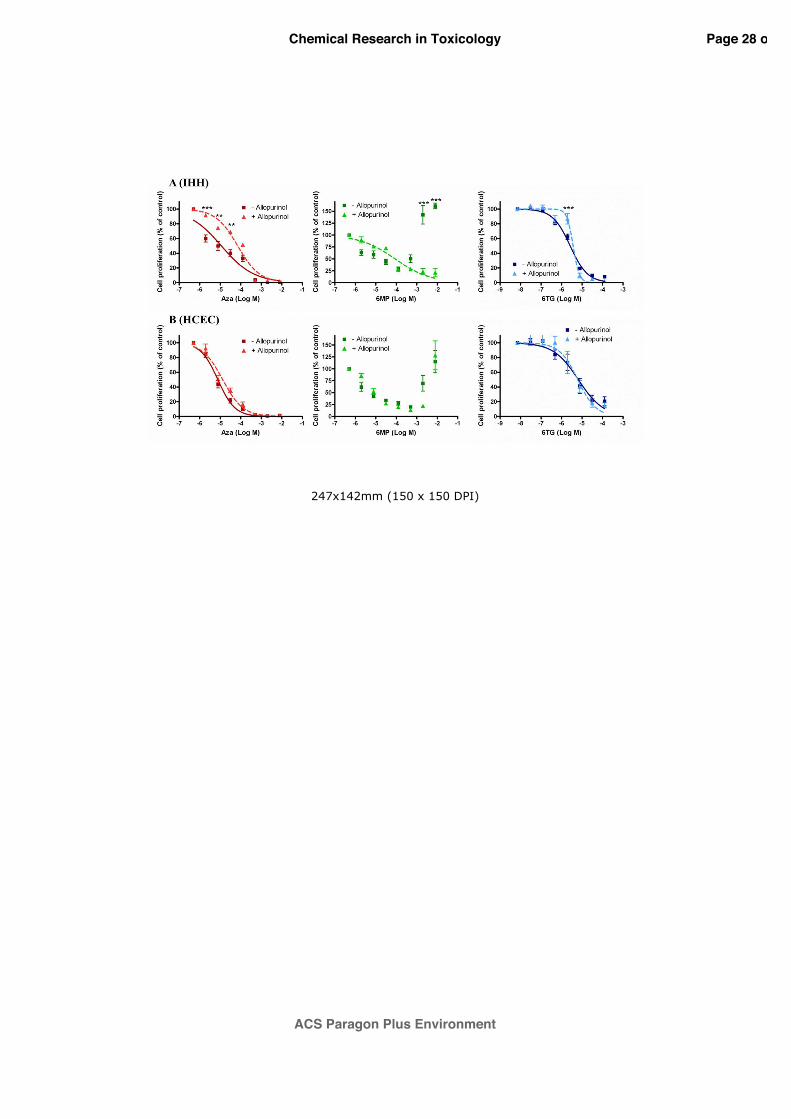
As shown in figure 3, only AZA and 6-TG induced a concentration dependent reduction of
cell proliferation after 96 h exposure. In particular, in IHH cells (Panel A), cell proliferation
was reduced with EC50 values of 1.1x10⁻⁵ M (95% CI=0.8-1.7x10⁻⁵ M) and 2.6x10⁻⁶ M (95%
CI=2.3-3.1x10⁻⁶ M) for AZA and 6-TG, respectively. Similarly, in HCEC cells (Panel B), cell
proliferation was reduced with EC50 values of 7.7x10⁻⁶ M (95% CI=6.5-9.0x10⁻⁶ M) and
6.8x10⁻⁶ M (95% CI=4.0-11.3x10⁻⁶ M) for AZA and 6-TG, respectively. To investigate the role
of oxidative stress on thiopurines’ anti-proliferative effects, IHH and HCEC cells were pre-
exposed for 1 h to allopurinol 100 µM and then exposed for 96 h to thiopurines. However,
allopurinol co-treatment was able to reduce the anti-proliferative effect only of AZA in IHH
cells, significantly increasing the EC50 value, equal to 7.1x10⁻⁵ M (95% CI=4.6-10.9x10⁻⁵ M),
by almost 7 times with respect to AZA alone (p<0.001). Considering 6-MP, in both cell lines a
concentration-dependent effect was not obtained and therefore it was not possible to calculate
an EC50 value. However, allopurinol co-treatment was able to restore a concentration-
dependent anti-proliferative effect induced by 6-MP only in IHH cells. Considering 6-TG, no
inhibitory effect was observed in presence of allopurinol in both IHH (EC50=3.6x10⁻⁶ M; 95%
CI=2.9-4.7x10⁻⁶ M) and HCEC cells (EC50=6.2x10⁻⁶ M; 95% CI=3.8-9.9x10⁻⁶ M).
3.4 Effect of N-acetyl cysteine on thiopurines cytotoxicity
Page 11 of 35
ACS Paragon Plus Environment
Chemical Research in Toxicology
123456789101112131415161718192021222324252627282930313233343536373839404142434445464748495051525354555657585960
12
To evaluate the role of GSH depletion in thiopurines cytotoxicity, AZA, 6-MP and 6-TG were
used in co-treatment with N-acetyl cysteine (NAC), a synthetic precursor of GSH. IHH and
HCEC cells were pre-treated for 1 h with NAC 1 mM and then exposed for 96 h to
thiopurines. As shown in figure 4, NAC co-exposure did not affect thiopurines cytotoxic
effects evaluated by MTT assay in both IHH (Panel A) and HCEC (Panel B) cells.
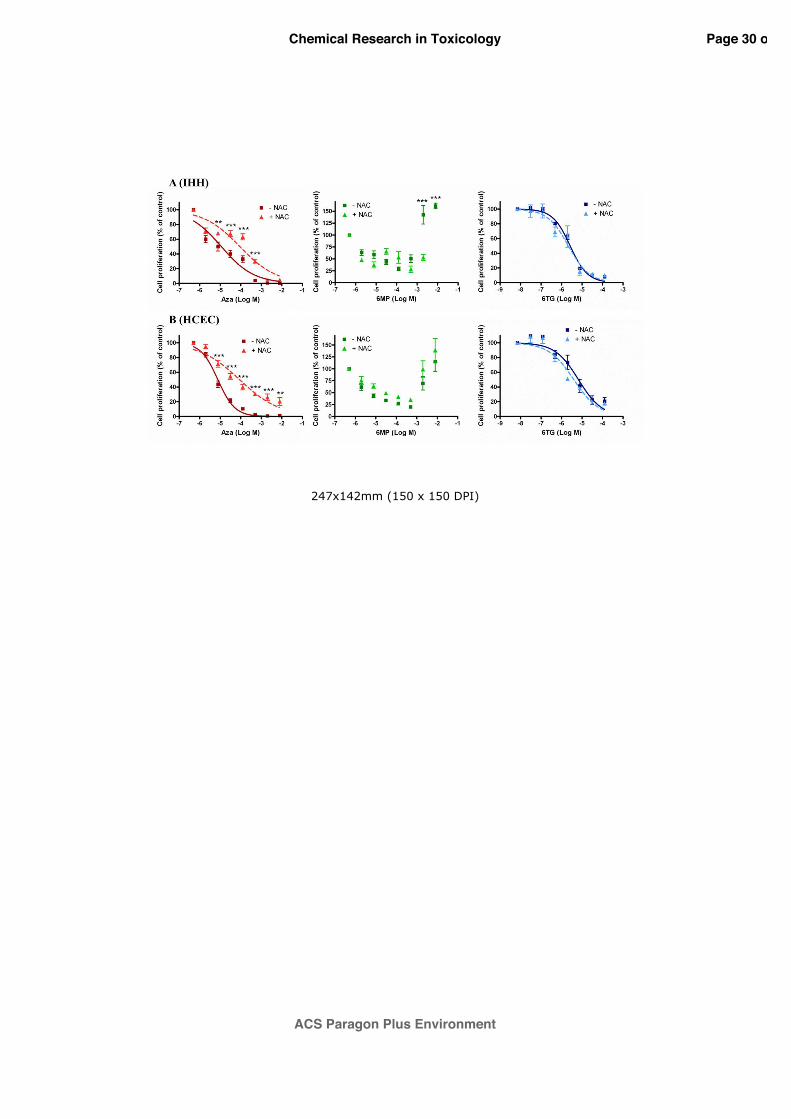
3.5 Effect of N-acetyl cysteine on thiopurines anti-proliferative effects
To investigate the role of GSH depletion on thiopurines’ anti-proliferative effects, IHH and
HCEC cells were pre-exposed for 1 h to NAC 1 mM and then exposed for 96 h to thiopurines.
As shown in figure 5, only the antiproliferative effect of AZA, evaluated by 3H-thymidine
incorporation assay, was specifically reduced in presence of NAC. In particular, in IHH cells
(Panel A), the co-exposure with NAC significantly (p<0.001) increased the EC50 value, equal
to 9.0x10⁻⁵ M (95% CI=5.4-15.0x10⁻⁵ M), about 8 times with respect to AZA alone. Similarly,
in HCEC cells (Panel B), the co-exposure with NAC significantly (p<0.001) increased the
EC50 value, equal to 8.8x10⁻⁵ M (95% CI=5.6-13.6x10⁻⁵ M), about 11 times with respect to
AZA alone. On the contrary, in both cell lines, the co-treatment with NAC did not show
significant change in response to 6-TG in terms of an antiproliferative effect. Again,
considering 6-MP, in both cell lines a concentration-dependent response was not obtained.
3.6 Effects of azathioprine on glutathione depletion
To further investigate the role of GSH in AZA’s effects, GSH was fluorimetrically quantified.
Figure 6 shows the amount of GSH (expressed as a percentage of total GSH with respect to
the untreated controls) in IHH (Panel A) and HCEC (Panel B) cells survived after AZA
Page 12 of 35
ACS Paragon Plus Environment
Chemical Research in Toxicology
123456789101112131415161718192021222324252627282930313233343536373839404142434445464748495051525354555657585960
13
exposure. Cells were exposed for 96 h to concentrations equal to the EC50 and EC95 values,
corresponding respectively to 4.4x10⁻⁵ and 5.0x10⁻⁴ M for IHH cells and 7.4x10⁻⁵ and 5.0x10-
4 M for HCEC cells. In both cell lines, 96 h exposure to AZA at a concentration equal to the
EC95 value significantly reduced the amount of GSH. As a negative control, 6-MP did not
affect GSH content after 96 h exposure (data not shown).
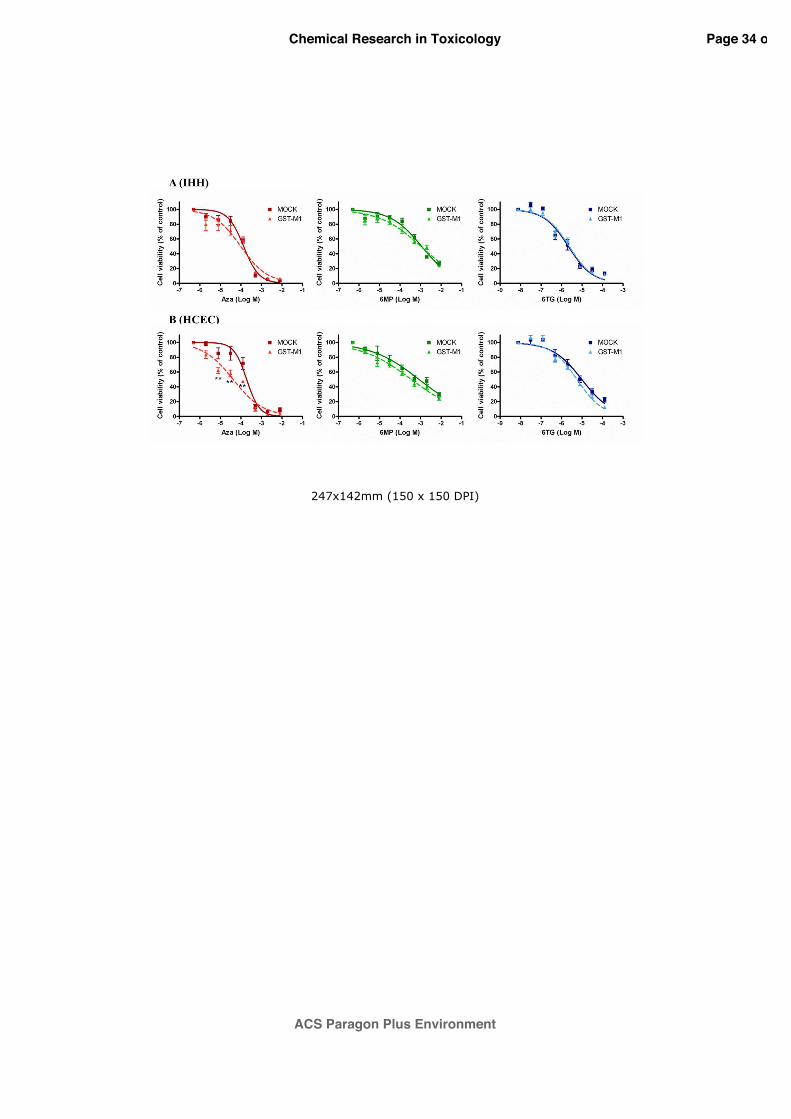
3.7 Effects of GST-M1 overexpression on thiopurines sensitivity
Both cell lines have been stable transfected with plasmids encoding for GST-M1. Once stably
selected, cells were collected and lysed in order to extract the respective protein lysates. The
transfection efficiency of the stable expression (Figure 7) was assessed by western blotting
analysis, using anti-DDK antibodies on cellular extracts (Panel A), and quantification by
densitometry analysis (Panel B). Both IHH and HCEC cell lines were transfected
successfully, in particular the amount of protein expression, in terms of percentage of β-actin
signal, was equal to 41.0±3.9% and 59.2±4.3% in IHH and HCEC cells, respectively.
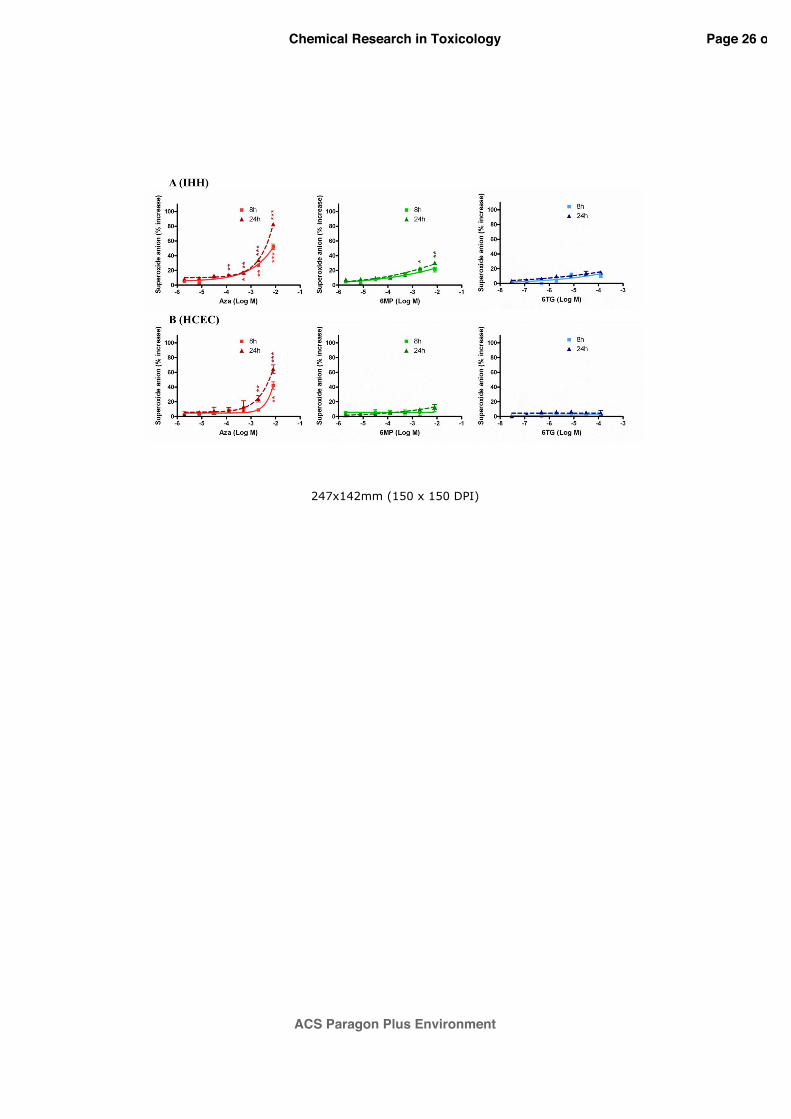
The effect of GST-M1 overexpression on thiopurines-induced ROS production, as superoxide
anion, after 24 h of treatment was evalued in IHH and HCEC stably transfected cells. As
shown in figure 8, in IHH cells (Panel A) AZA induced a concentration-dependent superoxide
anion increase starting from the concentration of 8.0x10⁻⁶ M and, at the highest concentration
of AZA (8.0x10⁻³ M), the treatment induced a release of superoxide anion equal to 78.7±8.3%,
almost two times higher (p<0.001) compared to that observed in cells transfected with the
empty vector (46.1±2.5%). In HCEC cells (Panel B) AZA induced a concentration-dependent
superoxide anion increase starting from the concentration of 5.0x10⁻⁴ M and, at the highest
concentration of AZA (8.0x10⁻³ M), the treatment induced a release of superoxide anion equal
Page 13 of 35
ACS Paragon Plus Environment
Chemical Research in Toxicology
123456789101112131415161718192021222324252627282930313233343536373839404142434445464748495051525354555657585960
14
to 96.4±5.3%, almost two times higher (p<0.001) compared to that observed in cells
transfected with the empty vector (54%±0.9%).
Subsequently, the effect of GST-M1 over-expression on IHH and HCEC cells sensitivity to
thiopurines has been assessed (figure 9). In IHH cells (Panel A) no significant difference was
observed between the GST-M1 over-expressing and the empty-vector lines. On the contrary,
in HCEC cells (Panel B) the forced expression of GST-M1 increased the sensitivity
specifically to AZA. In particular, the EC50 value calculated in the GST-M1 transfected cells,
equal to 4.2x10⁻⁵ M (95% CI=2.9-6.0x10⁻⁵ M), was about 5 times lower (p<0.001) with
respect to cells transfected with the empty vector (EC50=1.9x10⁻⁴ M; 95% CI=1.4-2.8x10⁻⁴ M).
For 6-MP and 6-TG no significant differences were observed.
Page 14 of 35
ACS Paragon Plus Environment
Chemical Research in Toxicology
123456789101112131415161718192021222324252627282930313233343536373839404142434445464748495051525354555657585960

15
4 Discussion and Conclusions
This study was carried out with the aim to explain, from a mechanistic point of view, the
clinical evidence that our group recently highlighted in young IBD patients demonstrating, for
the first time, relevant effects of GST-M1 genotype on AZA effects. Indeed, GST-M1
deletion was associated with lower incidence of adverse events during AZA treatment,10
lower TGN/dose ratio and higher AZA dose requirement.11 To this aim, the human non-tumor
IHH and HCEC cell lines were chosen as predictive cell models of the hepatic and intestinal
tissues, respectively, in which drug activation and some severe adverse effects of thiopurines
occur.
Given the enzymes involved in thiopurines metabolism (GST, XO), it is reasonable to
hypothesize that these drugs are able to induce oxidative stress conditions at the cellular level.
This seems to be proven especially for AZA due to the GST-mediated depletion of GSH
induced by its conversion to 6-MP,12, 17 possibly allowing the accumulation of significant
amounts of ROS.15, 16 To oxidative stress, even 6-MP biotransformation by XO, a well-known
ROS producer enzyme, as assessed on primary cultures of rat hepatocytes,18 could contribute.
In our model, AZA, but not 6-MP and 6-TG, induced a concentration-dependent ROS
production, measured as superoxide anion, in the hepatic IHH and intestinal HCEC cell lines,
after exposure times (i.e. 8 and 24 h) not inducing significant cytotoxic effects. This ROS
increase was significative particularly at the highest concentrations of AZA, within the
millimolar range. However, given the doses of thiopurines administered to patients and
estimated volumes of intestinal and hepatic tissues, where they are well absorbed and undergo
important biotransformations,4 it is likely that in these tissues thiopurines concentrations reach
even the millimolar range.22 Intact AZA is undetectable in plasma after oral administration
because of this extensive first pass metabolism, while for 6-MP, peak concentrations reach the
Page 15 of 35
ACS Paragon Plus Environment
Chemical Research in Toxicology
123456789101112131415161718192021222324252627282930313233343536373839404142434445464748495051525354555657585960

16
micromolar range.23 The ability of AZA to induce oxidative stress is in line with previous
studies demonstrating that thiopurines can generate directly ROS in cells exposed to
biological doses of ultra violet light.24, 25 To understand the ROS contribution on the toxic
effects of thiopurines, in particular of AZA, the effects of allopurinol, a selective inhibitor of
XO, on thiopurines’ cytotoxic and anti-proliferative effects were initially evaluated.
Allopurinol has been shown to restore thiopurines response in IBD patients by increasing the
concentration of active TGNs and decreasing that of the methylated nucleotides.26 However, a
relevant role for XO in mediating AZA-induced ROS production seems unlikely. Indeed,
AZA cytotoxic effects were not reduced in presence of allopurinol at a concentration
inhibiting XO activity.27 An effect was observed on the anti-proliferative action induced only
on IHH cells, probably because of a higher expression of XO with respect to the intestinal cell
line. In particular, allopurinol co-treatment significantly increased the EC50 value by almost 7
times with respect to AZA alone and, interestingly, was able to restore the concentration-
dependency of the effect induced by 6-MP. Indeed, in both cell lines, 6-MP was unable to
induce a proper concentration-dependent anti-proliferative effect since at the highest
concentrations (10-3 – 10-2 M), a proliferation increase was observed. Even if a complete
study to explain this aberrant response was not carried out, we can hypothesize that the
reasons could reside in some effects on the regulation of cell cycle. As previously
demonstrated in other cell models, 6-MP concentrations higher than 0.5x10⁻³ M seem able to
modulate a drug-induced block of cell cycle that could tentatively result in hindering 6-MP in
vitro effects.28 In accordance with the fact that 6-TG is not a direct substrate for XO,29 no
difference in the EC50 were observed for 6-TG in presence of allopurinol.
Since the contribution of XO seems only partial, our attention was focused on the role of GSH
depletion involved in the metabolic conversion of AZA into 6-MP. To this aim, the effects of
the GSH precursor NAC co-exposure were studied. Our results demonstrated that NAC co-
Page 16 of 35
ACS Paragon Plus Environment
Chemical Research in Toxicology
123456789101112131415161718192021222324252627282930313233343536373839404142434445464748495051525354555657585960

17
exposure was able to reduce the anti-proliferative, but not the cytotoxic effects, specifically of
AZA. On the contrary, no significant effects of NAC co-treatment were found for 6-MP and
6-TG in both cell lines. This result is in line with the ability of AZA, but not of the other
thiopurines, to reduce the amount of GSH and to induce a concentration-dependent ROS
production in both cell lines. On the whole, these results are in good agreement with a very
recent study carried out on primary cultures of rat hepatocytes.30 In our model, the
contribution of oxidative stress appears to be greater on the anti-proliferative effects of AZA
compared to cytotoxicity. This is probably due to the ability of ROS to modulate cell cycle.31,
32 Alternatively, the anti-proliferative effect may be a sign of an early cellular toxicity and
therefore still reversible by NAC co-treatment.
Finally, to corroborate the role of GST-mediated GSH depletion in AZA mechanism of
action, a stable over-expression of GST-M1 was carried out. Our focus was directed on M1
isoform because of the clinical evidence that GST-M1 deletion is associated to a reduced
sensitivity to therapy in IBD patients.10, 11 In our model, the increased expression of GST-M1
increased AZA cytotoxicity in HCEC cells, while no effects were observed for 6-MP and 6-
TG, in line with the fact that GST enzymes seem to have a significant role on AZA’s, but not
other thiopurine’s, toxicity. This effect could be due to the increased rate of conversion of
AZA to 6-MP in HCEC cells over-expressing GST-M1, which, hypothetically, leads to
increased concentrations of the active thioguanine metabolites. Interestingly, in the GST-M1
over-expressing cell line an increased superoxide anion production was observed with respect
to the native cell line, corroborating the role of ROS due to the greater activation of AZA by
GST-M1. In the IHH cell line, however, the increased expression of GST-M1 does not
determine a greater cytotoxicity for any of the thiopurines, although an increase of oxidative
stress induced by AZA was observed. The lack of effects of the GST-M1 over-expression on
the cytotoxicity of AZA in transfected IHH cells could be due to the high levels of this
Page 17 of 35
ACS Paragon Plus Environment
Chemical Research in Toxicology
123456789101112131415161718192021222324252627282930313233343536373839404142434445464748495051525354555657585960

18
enzyme already in the native line, while it is absent, both in terms of mRNA and protein, in
the HCEC cell line (data not shown). The native level of GST-M1 could be sufficient to
determine the rapid conversion of AZA into 6-MP, and consequently, the increase in enzyme
levels induced by the forced expression of GST-M1 could be irrelevant. Notwithstanding, in
this study an in vitro model has been set up to to study AZA metabolism and could be further
supported by silencing of GST-M1 activity. However, this model seems to be more
informative for AZA with respect to the other thiopurines, given the more prominent role of
GSH in AZA toxic effects. This in vitro model helped us to demonstrate, for the first time, a
clear role of GST-M1 in modulating AZA cytotoxicity with a close dependency on ROS
production. On the contrary, this study demonstrates that GST-M1 doesn’t have a significant
role in modulating the other thiopurines (6-MP and 6-TG) cytotoxicity, for which ROS
production doesn’t seem to be involved in their mechanism of cytotoxicity.
In conclusion, in this study it has been demonstrated the contribution of oxidative stress to the
anti-proliferative effects of AZA in the human IHH and HCEC cell lines, derived respectively
from the liver and intestinal tissues. This ROS production seems to be mediated by GSH
depletion occurring during the conversion of AZA to 6-MP catalyzed by GST enzymes and,
only in part, by XO enzymes during 6-MP metabolism. A prominent role of GST, isoform
M1, was clearly demonstrated in stably increased GST-M1 expression, especially in the
intestinal HCEC cell line, lacking this enzyme in its native form, where GST-M1 over-
expression increased AZA cytotoxicity as well as ROS production (figure 10). Even if the
amount of active metabolites should be evaluated to investigate if the increased sensitivity is
due also to an enhanced metabolism, besides to an enhanced ROS production, this study
provides the molecular basis to explain the clinical evidence suggesting a prominent role of
GST-M1 genotype in influencing AZA clinical effects.
Page 18 of 35
ACS Paragon Plus Environment
Chemical Research in Toxicology
123456789101112131415161718192021222324252627282930313233343536373839404142434445464748495051525354555657585960

19
Funding sources
The work was supported by a grant of the Italian Ministry of Health, No. 44/GR-2010-
2300447 and by a grant of the University of Trieste (Università degli Studi di Trieste -
Finanziamento di Ateneo per progetti di ricerca scientifica-FRA/2011). Sara De Iudicibus is
recipient of a postdoctoral fellowship from IRCCS "Burlo Garofolo".
Notes
The authors declare no competing financial interest.
Abbreviations
6-MP (6-mercaptopurine), 6-TG (6-thioguanine), 6-TGNs (thioguanine nucleotides), AZA
(azathioprine), IBD (inflammatory bowel disease), GSH (glutathione), GST (glutathione-S-
transferase), NAC (N-acetyl cysteine), ROS (reactive oxygen species), TPMT (thiopurine-S-
methyltransferase), XO (xanthine oxidase)
Page 19 of 35
ACS Paragon Plus Environment
Chemical Research in Toxicology
123456789101112131415161718192021222324252627282930313233343536373839404142434445464748495051525354555657585960
20
References
(1) Elion, G. B. (1989) The purine path to chemotherapy. Science 244, 41-47. (2) Aberra, F. N., and Lichtenstein, G. R. (2005) Review article: monitoring of
immunomodulators in inflammatory bowel disease. Aliment. Pharmacol. Ther. 21, 307-319.
(3) Barabino, A., Torrente, F., Ventura, A., Cucchiara, S., Castro, M., and Barbera, C. (2002) Azathioprine in paediatric inflammatory bowel disease: an Italian multicentre survey. Aliment. Pharmacol. Ther. 16, 1125-1130.
(4) Lennard, L. (1992) The clinical pharmacology of 6-mercaptopurine. Eur. J. Clin. Pharmacol. 43, 329-339.
(5) Chouchana, L., Narjoz, C., Beaune, P., Loriot, M. A., and Roblin, X. (2012) Review article: the benefits of pharmacogenetics for improving thiopurine therapy in inflammatory bowel disease. Aliment. Pharmacol. Ther. 35, 15-36.
(6) Relling, M. V., Gardner, E. E., Sandborn, W. J., Schmiegelow, K., Pui, C. H., Yee, S. W., Stein, C. M., Carrillo, M., Evans, W. E., Hicks, J. K., Schwab, M., and Klein, T. E. (2013) Clinical pharmacogenetics implementation consortium guidelines for thiopurine methyltransferase genotype and thiopurine dosing: 2013 update. Clin. Pharmacol. Ther. 93, 324-325.
(7) Menor, C., Fernandez-Moreno, M. D., Fueyo, J. A., Escribano, O., Olleros, T., Arriaza, E., Cara, C., Lorusso, M., Di Paola, M., Roman, I. D., and Guijarro, L. G. (2004) Azathioprine acts upon rat hepatocyte mitochondria and stress-activated protein kinases leading to necrosis: protective role of N-acetyl-L-cysteine. J. Pharmacol. Exp. Ther. 311, 668-676.
(8) Kaplowitz, N. (1976) Enzymatic thiolysis of azathioprine in vitro. Biochem. Pharmacol. 25, 2421-2426.
(9) Eklund, B. I., Moberg, M., Bergquist, J., and Mannervik, B. (2006) Divergent activities of human glutathione transferases in the bioactivation of azathioprine. Mol. Pharmacol. 70, 747-754.
(10) Stocco, G., Martelossi, S., Barabino, A., Decorti, G., Bartoli, F., Montico, M., Gotti, A., and Ventura, A. (2007) Glutathione-S-transferase genotypes and the adverse effects of azathioprine in young patients with inflammatory bowel disease. Inflamm. Bowel. Dis. 13, 57-64.
(11) Stocco, G., Cuzzoni, E., De Iudicibus, S., Franca, R., Favretto, D., Malusa, N., Londero, M., Cont, G., Bartoli, F., Martelossi, S., Ventura, A., and Decorti, G. (2014) Deletion of glutathione-s-transferase m1 reduces azathioprine metabolite concentrations in young patients with inflammatory bowel disease. J. Clin. Gastroenterol. 48, 43-51.
(12) Stocco, G., Pelin, M., Franca, R., De Iudicibus, S., Cuzzoni, E., Favretto, D., Martelossi, S., Ventura, A., and Decorti, G. (2014) Pharmacogenetics of azathioprine in inflammatory bowel disease: a role for glutathione-S-transferase? World. J. Gastroenterol. 20, 3534-3541.
(13) Kraus, P., and Kloft, H. D. (1980) The activity of glutathione-S-transferases in various organs of the rat. Enzyme 25, 158-160.
(14) Rahman, S. H., Ibrahim, K., Larvin, M., Kingsnorth, A., and McMahon, M. J. (2004) Association of antioxidant enzyme gene polymorphisms and glutathione status with severe acute pancreatitis. Gastroenterology 126, 1312-1322.
(15) Armstrong, J. S., Steinauer, K. K., Hornung, B., Irish, J. M., Lecane, P., Birrell, G. W., Peehl, D. M., and Knox, S. J. (2002) Role of glutathione depletion and reactive
Page 20 of 35
ACS Paragon Plus Environment
Chemical Research in Toxicology
123456789101112131415161718192021222324252627282930313233343536373839404142434445464748495051525354555657585960
21
oxygen species generation in apoptotic signaling in a human B lymphoma cell line. Cell. Death Differ. 9, 252-263.
(16) Markovic, J., Mora, N. J., Broseta, A. M., Gimeno, A., de-la-Concepcion, N., Vina, J., and Pallardo, F. V. (2009) The depletion of nuclear glutathione impairs cell proliferation in 3t3 fibroblasts. PLoS One 4, e6413.
(17) Lee, A. U., and Farrell, G. C. (2001) Mechanism of azathioprine-induced injury to hepatocytes: roles of glutathione depletion and mitochondrial injury. J. Hepatol. 35, 756-764.
(18) Tapner, M. J., Jones, B. E., Wu, W. M., and Farrell, G. C. (2004) Toxicity of low dose azathioprine and 6-mercaptopurine in rat hepatocytes. Roles of xanthine oxidase and mitochondrial injury. J. Hepatol. 40, 454-463.
(19) Sparrow, M. P. (2008) Use of allopurinol to optimize thiopurine immunomodulator efficacy in inflammatory bowel disease. Gastroenterology & Hepatology 4, 505-511.
(20) Petit, E., Langouet, S., Akhdar, H., Nicolas-Nicolaz, C., Guillouzo, A., and Morel, F. (2008) Differential toxic effects of azathioprine, 6-mercaptopurine and 6-thioguanine on human hepatocytes. Toxicol. In Vitro 22, 632-642.
(21) Pelin, M., Ponti, C., Sosa, S., Gibellini, D., Florio, C., and Tubaro, A. (2013) Oxidative stress induced by palytoxin in human keratinocytes is mediated by a H+-dependent mitochondrial pathway. Toxicol. Appl. Pharmacol. 266, 1-8.
(22) Lin, J. H., Chiba, M., and Baillie, T. A. (1999) Is the role of the small intestine in first-pass metabolism overemphasized? Pharmacol. Rev. 51, 135-158.
(23) Lin, S. N., Jessup, K., Floyd, M., Wang, T. P., van Buren, C. T., Caprioli, R. M., and Kahan, B. D. (1980) Quantitation of plasma azathioprine and 6-mercaptopurine levels in renal transplant patients. Transplantation 29, 290-294.
(24) Hemmens, V. J., and Moore, D. E. (1986) Photochemical sensitization by azathioprine and its metabolites--I. 6-Mercaptopurine. Photochem. Photobiol. 43, 247-255.
(25) O'Donovan, P., Perrett, C. M., Zhang, X., Montaner, B., Xu, Y. Z., Harwood, C. A., McGregor, J. M., Walker, S. L., Hanaoka, F., and Karran, P. (2005) Azathioprine and UVA light generate mutagenic oxidative DNA damage. Science 309, 1871-1874.
(26) Blaker, P. A., Arenas-Hernandez, M., Smith, M. A., Shobowale-Bakre, E. A., Fairbanks, L., Irving, P. M., Sanderson, J. D., and Marinaki, A. M. (2013) Mechanism of allopurinol induced TPMT inhibition. Biochem. Pharmacol. 86, 539-547.
(27) Jezewska, M. M. (1974) Effect of allopurinol (4-hydroxyprazolo(3,4-d)pyrimidine) on xanthine accumulation by milk xanthine oxidase in vitro. Eur. J. Biochem. 46, 361-365.
(28) Matsumura, S., Hoshino, T., Weizsaecker, M., and Deen, D. F. (1983) Paradoxical behavior of 6-mercaptopurine as a cytotoxic agent: decreasing cell kill with increasing drug dose. Cancer. Treat. Rep. 67, 475-480.
(29) Krenitsky, T. A., Neil, S. M., Elion, G. B., and Hitchings, G. H. (1972) A comparison of the specificities of xanthine oxidase and aldehyde oxidase. Arch. Biochem. Biophys. 150, 585-599.
(30) Maruf, A. A., Wan, L., and O'Brien, P. J. (2014) Evaluation of azathioprine-induced cytotoxicity in an in vitro rat hepatocyte system. Biomed. Res. Int. 2014, 379748.
(31) Conour, J. E., Graham, W. V., and Gaskins, H. R. (2004) A combined in vitro/bioinformatic investigation of redox regulatory mechanisms governing cell cycle progression. Physiol. Genomics 18, 196-205.
(32) Irwin, M. E., Rivera-Del Valle, N., and Chandra, J. (2013) Redox control of leukemia: from molecular mechanisms to therapeutic opportunities. Antioxid. Redox Signaling 18, 1349-1383.
Page 21 of 35
ACS Paragon Plus Environment
Chemical Research in Toxicology
123456789101112131415161718192021222324252627282930313233343536373839404142434445464748495051525354555657585960
22
Figure legends
Fig. 1. Effect of AZA, 6-MP and 6-TG on superoxide anion production. IHH (Panel A) and
HCEC cells (Panel B) were exposed for 8 and 24 h to scalar concentrations of AZA, 6-MP
and 6-TG before performing the NBT assay. The data are reported as % increase of
superoxide anion with respect to negative controls (untreated cells) and are the means ± SE of
5 independent experiments performed in triplicate. Statistical difference: *, p < 0.05; **, p <
0.01; ***, p < 0.001 (treated vs untreated cells, one-way ANOVA and Bonferroni’s post test).
Fig. 2. Effect of allopurinol on AZA, 6-MP and 6-TG cytotoxicity in IHH (Panel A) and
HCEC (Panel B) cells. Cells were exposed for 1 h to allopurinol 100 µM followed by 96 h to
thiopurines and cytotoxicity evaluated by MTT assay. The data are reported as means ± SE of
4 independent experiments performed in triplicate.
Fig. 3. Effect of allopurinol on AZA, 6-MP and 6-TG anti-proliferative effects in IHH (Panel
A) and HCEC (Panel B) cells. Cells were exposed for 1 h to allopurinol 100 µM followed by
96 h to thiopurines and cell proliferation evaluated by the 3H-thymidine incorporation assay.
The data are reported as means ± SE of 4 independent experiments performed in triplicate.
Statistical difference: **, p < 0.01; ***, p < 0.001 (with vs without allopurinol, two-way
ANOVA and Bonferroni’s post test).
Fig. 4. Effect of N-acetyl-cysteine (NAC) on AZA, 6-MP and 6-TG cytotoxicity in IHH
(Panel A) and HCEC (Panel B) cells. Cells were exposed for 1 h to NAC 1 mM followed by
96 h to thiopurines and cytotoxicity evaluated by MTT assay. The data are reported as means
± SE of 4 independent experiments performed in triplicate.
Fig. 5. Effect of N-acetyl-cysteine (NAC) on AZA, 6-MP and 6-TG anti-proliferative effect in
the IHH (Panel A) and HCEC (Panel B) cells. Cells were exposed for 1 h to NAC 1 mM
followed by 96 h to thiopurines and cell proliferation evaluated by the 3H-thymidine
Page 22 of 35
ACS Paragon Plus Environment
Chemical Research in Toxicology
123456789101112131415161718192021222324252627282930313233343536373839404142434445464748495051525354555657585960
23
incorporation assay. The data are reported as means ± SE of 4 independent experiments
performed in triplicate. Statistical difference: **, p < 0.01; ***, p < 0.001 (with vs without
NAC, two-way ANOVA and Bonferroni’s post test).
Fig. 6. Effect of AZA on GSH depletion. IHH (Panel A) and HCEC (Panel B) cells were
exposed for 96 h to AZA and the amount of GSH measured fluorimetrically in the survived
cells. Data are presented as percentage of total GSH with respect to the untreated controls and
are the mean ± SE of 3 experiments performed in duplicate. Statistical difference: **, p < 0.01
(treated vs untreated cells, two-way ANOVA and Bonferroni’s post test).
Fig. 7. IHH and HCEC cell lines have been stable transfected with plasmids encoding for
GST-M1. Western blot using anti-DDK antibodies on cellular extract (Panel A) and
quantification by densitometry analysis (Panel B) has been assessed. The results were
compared to those obtained in cells transfected with the empty vector (MOCK) and DDK
expression is reported as a percentage with respect to β-actin. The data are reported as means
± SE of 3 independent experiments.
Fig. 8. Effect of GST-M1 overexpression on superoxide anion production induced by AZA, 6-
MP and 6-TG in IHH (Panel A) and HCEC (Panel B) stably transfected cells. Cells were
exposed for 24 h to scalar concentrations of AZA, 6-MP and 6-TG before performing the
NBT assay. The results were compared to those obtained in cells transfected with the empty
vector (MOCK). The data are reported as % increase of superoxide anion with respect to
negative controls (untreated cells) and are the means ± SE of 4 independent experiments
performed in triplicate. Statistical difference: *, p<0.05; ***, p<0.001 (GST-M1 vs MOCK,
two-way ANOVA and Bonferroni’s post test).
Fig. 9. Effect of GST-M1 overexpression on AZA, 6-MP and 6-TG cytotoxicity in IHH (Panel
A) and HCEC (Panel B) stably transfected cells. Cells were exposed for 96 h to scalar
Page 23 of 35
ACS Paragon Plus Environment
Chemical Research in Toxicology
123456789101112131415161718192021222324252627282930313233343536373839404142434445464748495051525354555657585960

24
concentrations of AZA, 6-MP and 6-TG and cytotoxicity evaluated by MTT assay. The results
were compared to those obtained in cells transfected with the empty vector (MOCK). The
data are reported as means ± SE of 4 independent experiments performed in triplicate.
Statistical difference: **, p<0.01 (GST-M1 vs MOCK, two-way ANOVA and Bonferroni’s
post test).
Fig. 10. Proposed mechanism of ROS production induced by thiopurines metabolism. ROS
production seems to be mediated by GSH depletion occurring during the conversion of AZA
to 6-MP catalyzed by GST enzymes and, only in part, by XO enzymes during 6-MP
metabolism. In our study we focused on GST-M1 isoform. (6-MMP=6-methyl-
mercaptopurine; 6-MP=6-mercaptopurine; 6-TG=6-thioguanine; 6-TGDP=6-thioguanine-
diphosphate; 6-TGMP=6-thioguanine-monophosphate; 6-TGN=6-thioguanine nucleotide; 6-
TGTP=6-thioguanine-triphopshate; 6-TU=6-thiouric; AZA=azathioprine; GST-
M1=glutathione-S-transferase M1; K=kinase; TPMT=thiopurine-S-methyl-transferase;
XO=xanthine-oxidase)
Page 24 of 35
ACS Paragon Plus Environment
Chemical Research in Toxicology
123456789101112131415161718192021222324252627282930313233343536373839404142434445464748495051525354555657585960

238x116mm (150 x 150 DPI)
Page 25 of 35
ACS Paragon Plus Environment
Chemical Research in Toxicology
123456789101112131415161718192021222324252627282930313233343536373839404142434445464748495051525354555657585960
247x142mm (150 x 150 DPI)
Page 26 of 35
ACS Paragon Plus Environment
Chemical Research in Toxicology
123456789101112131415161718192021222324252627282930313233343536373839404142434445464748495051525354555657585960
247x142mm (150 x 150 DPI)
Page 27 of 35
ACS Paragon Plus Environment
Chemical Research in Toxicology
123456789101112131415161718192021222324252627282930313233343536373839404142434445464748495051525354555657585960
247x142mm (150 x 150 DPI)
Page 28 of 35
ACS Paragon Plus Environment
Chemical Research in Toxicology
123456789101112131415161718192021222324252627282930313233343536373839404142434445464748495051525354555657585960

247x142mm (150 x 150 DPI)
Page 29 of 35
ACS Paragon Plus Environment
Chemical Research in Toxicology
123456789101112131415161718192021222324252627282930313233343536373839404142434445464748495051525354555657585960
247x142mm (150 x 150 DPI)
Page 30 of 35
ACS Paragon Plus Environment
Chemical Research in Toxicology
123456789101112131415161718192021222324252627282930313233343536373839404142434445464748495051525354555657585960

108x154mm (150 x 150 DPI)
Page 31 of 35
ACS Paragon Plus Environment
Chemical Research in Toxicology
123456789101112131415161718192021222324252627282930313233343536373839404142434445464748495051525354555657585960

104x144mm (150 x 150 DPI)
Page 32 of 35
ACS Paragon Plus Environment
Chemical Research in Toxicology
123456789101112131415161718192021222324252627282930313233343536373839404142434445464748495051525354555657585960

247x142mm (150 x 150 DPI)
Page 33 of 35
ACS Paragon Plus Environment
Chemical Research in Toxicology
123456789101112131415161718192021222324252627282930313233343536373839404142434445464748495051525354555657585960
247x142mm (150 x 150 DPI)
Page 34 of 35
ACS Paragon Plus Environment
Chemical Research in Toxicology
123456789101112131415161718192021222324252627282930313233343536373839404142434445464748495051525354555657585960

145x158mm (150 x 150 DPI)
Page 35 of 35
ACS Paragon Plus Environment
Chemical Research in Toxicology
123456789101112131415161718192021222324252627282930313233343536373839404142434445464748495051525354555657585960

![Iron Overload Disorders and Iron Chelation Therapy - … or glutamine (glutathione precursor), may, therefore, be beneficial [14]. ... Courtesy of Antonio Piga, MD, University of](https://img.pdfslide.net/doc/110x75/5b0cd8867f8b9a685a8d46ca/iron-overload-disorders-and-iron-chelation-therapy-or-glutamine-glutathione-precursor.jpg)


![The Roles of Glutamine in the Intestine and Its ...€¦ · utilize large amounts of glutamine, exceeding the endogenous glutamine production [12,13], and that plasma and muscle glutamine](https://img.pdfslide.net/doc/110x75/5fd64d48c22ac35b4b7b6b55/the-roles-of-glutamine-in-the-intestine-and-its-utilize-large-amounts-of-glutamine.jpg)