Embed Size (px)
Citation preview
HAL Id: pastel-00772440https://pastel.archives-ouvertes.fr/pastel-00772440
Submitted on 10 Jan 2013
HAL is a multi-disciplinary open accessarchive for the deposit and dissemination of sci-entific research documents, whether they are pub-lished or not. The documents may come fromteaching and research institutions in France orabroad, or from public or private research centers.
L’archive ouverte pluridisciplinaire HAL, estdestinée au dépôt et à la diffusion de documentsscientifiques de niveau recherche, publiés ou non,émanant des établissements d’enseignement et derecherche français ou étrangers, des laboratoirespublics ou privés.
Role of plant rhizosphere across multiple species,grassland management and temperature on microbial
communities and long term soil organic matter dynamicsTanvir Shahzad
To cite this version:Tanvir Shahzad. Role of plant rhizosphere across multiple species, grassland management and tem-perature on microbial communities and long term soil organic matter dynamics. Agricultural sciences.AgroParisTech, 2012. English. �NNT : 2012AGPT0032�. �pastel-00772440�
INSTITUT NATIONAL DE LA RECHERCHE AGRONOMIQUE
Unité de Recherche sur l’Ecosystème Prairial
234-Avenue du Brézet 63100, Clermont Ferrand, France
Doctorat ParisTech
T H È S E
pour obtenir le grade de docteur délivré par
L’Institut des Sciences et Industries du Vivant et de l’Environnement
(AgroParisTech)
Spécialités : Ecologie, Biogéochimie, Agronomie
Présentée et soutenue publiquement par
Tanvir SHAHZAD
le 30 Mars 2012
Role of plant rhizosphere across multiple species, grassland
management and temperature on microbial communities
and long term soil organic matter dynamics
Directeurs de thèse
Claire CHENU et Sébastien FONTAINE
Jury Mme. Evgenia Blagodatskaya Pr. Georg-August-Universität Göttingen Germany Rapporteur
M. Sébastien BAROT DR. UMR 7618 Bioemco IRD, CNRS, UPMC, ENS Paris Rapporteur
Mme. Sylvie Recous DR, UMR614 INRA-URCA Reims Présidente
M. Pierre Barré CR. Laboratoire de Géologie, UMR8538 ENS CNRS, Paris Examinateur
Mme. Claire CHENU Pr. AgroParisTech UMR Bioemco Thiverval Grignon Directrice de thèse M. Sébastien FONTAINE CR. INRA UR Ecosystème Prairial Clermont Ferrand Directeur de thèse

Dedicated to
Waniya
Amna
Ammi
A CK N O W LE D G E M E N TA CK N O W LE D G E M E N TA CK N O W LE D G E M E N TA CK N O W LE D G E M E N T
Foremost, I am heartily grateful to the jury members who accepted to dedicate their precious
time to evaluate this work: Evgenia (Jane) Blagodatskaya, Sébastien Barot, Sylvie Recous,
Pierre Barré, Claire Chenu and Sébastien Fontaine.
My sincere thanks go to Jean-François Soussana who welcomed me in INRA-Unité de
Recherche sur l’Ecosystème Prairial and also to Pascal Carrère who helped me through
various administrative issues during this long project.
I am indebted to Higher Education Commission of Pakistan for providing me the
financial assistance in the first place to come and realize the PhD in France.
My sincere and cordial gratitude to my PhD advisor Sébastien Fontaine for his
continuous support, trust, patience, rich and mostly scientific and some times unscientific
discussions, passion of research that he wittingly or unwittingly imparted to me and quiet and
loud encouragement. He strives for originality in research and I thank him for making me to
believe the value of this trait. Over the years, I was impressed by his capacity of combining
the critique with immediate empathy and commitment to his co-workers, especially students.
I am equally thankful to Claire Chenu, also my PhD advisor, who, despite some
geographical distance was always there to help me whenever I needed. Her contribution in
formulating the scientific questions was very constructive. Her productive comments on the
earlier drafts of main chapters contributed a lot to their objectivity and clarity.
This work would not have seen accomplishment without the regular and rigorous
isotopic analyses carried out by Olivier Delfosse from INRA-Reims. I am highly indebted to
his cooperation during this work. Thanks to Robert Falcimagne for making the labelling
system function, Maurice Crocombette and Patrick Pichon for constructing and putting in
place the mesocosm. I am grateful to Jean-Luc Ollier for analyses on inorganic C. Thanks also
to Laurence (VetAgroSup, Clermont Ferrand) for mineral N analyses. Thanks to Cédric and
Rachid for providing me opportunity of PLFA analyses.
A big thanks to all at INRA-UREP who transform the workplace into a convivial
setting: Vincent with whom I shared had a lot of discussions on science and geopolitics,
Raphaël a witty being against whom I played some high class tennis, Sandrine my office mate
an Auvergnate who helped me in my experiments and who tried her hard but in vain over the
years to make me learn some Auvergnat expressions, Anne-Isabelle, Juliette, Rémi, Katja,
Hythem, Romain, Frank, Marine, Antoine, Alex, Mathilde, Olivier, Lionel, Mickael and lastly
Gaël whose intellectual inquisitiveness is just admirable. Thank you les amis!
Memories of my stay at Clermont Ferrand will remain a treasure for my life. Thanks to
Umar, Ayesha, Gills, Suha, Sameer, Muneeb, Mudassir, and Nazia who turned the time into
nonchalant and pleasant ride.
Thanks to my brothers Aamir and Abrar and my sisters Samina and Nabeela for their
love and moral support.
I would not be able to thank enough Amna, for the love and care she gives me. Love to
my little daughter, Waniya, whose joyfulness used to lessen the fatigue of the write up.
My sincere gratitude to Abbu and Ammi whose encouragement and prayers kept me
going through this adventure.
Tanvir Shahzad
Sommaire
CHAPTER 1 ............................................................................................................................. 3
GENERAL INTRODUCTION ............................................................................................... 3
I. CONTEXT OF STUDY ....................................................................................................... 3
I.1. GLOBAL CARBON CYCLE ................................................................................................... 3
I.2. SOIL ORGANIC CARBON ..................................................................................................... 3
I.3. INTERACTION OF C CYCLE WITH OTHER CYCLES ............................................................... 3
II. STATE OF THE ART ........................................................................................................ 3
II.1. INTRODUCTION TO PRIMING EFFECT ................................................................................. 3
II.2. MEASURING PRIMING EFFECT .......................................................................................... 3
II.3. WHY PRIMING EFFECT IS IMPORTANT ............................................................................... 3
II.4. KNOWLEDGE GAPS........................................................................................................... 3
III. OBJECTIVES OF THESIS.............................................................................................. 3
III.1. HYPOTHESES OF THESIS .................................................................................................. 3
III.2. APPROACHES OF THE STUDY ........................................................................................... 3
IV. THESIS LAYOUT............................................................................................................. 3
V. REFERENCES .................................................................................................................... 3
CHAPTER 2 ............................................................................................................................. 3
PLANT CLIPPING DECELERATES THE MINERALIZATION OF
RECALCITRANT SOIL ORGANIC MATTER UNDER MULTIPLE GRASSLAND
SPECIES ................................................................................................................................... 3
I. SUMMARY ........................................................................................................................... 3
II. INTRODUCTION............................................................................................................... 3
III. MATERIALS & METHODS:.......................................................................................... 3
III.1. SOIL SAMPLING AND PLANT SOWING............................................................................... 3
III.2. LABELLING SYSTEM & MESOCOSM ................................................................................. 3
III.3. RESPIRATION MEASUREMENT ......................................................................................... 3
III.4. SOIL AND PLANT ANALYSES............................................................................................ 3
III.5. PLFA MEASUREMENTS................................................................................................... 3
III.6. STATISTICAL ANALYSES................................................................................................. 3
IV. RESULTS ........................................................................................................................... 3
IV.1. PLANT BIOMASS AND ISOTOPIC COMPOSITION ................................................................ 3
IV.2. RESPIRATION FLUXES ..................................................................................................... 3
IV.3. SOLUBLE C & MINERAL NITROGEN IN SOIL..................................................................... 3
IV.4. MICROBIAL BIOMASS & COMMUNITY COMPOSITION....................................................... 3
V. DISCUSSION....................................................................................................................... 3
VI. REFERENCES................................................................................................................... 3
CHAPTER 3 ............................................................................................................................. 3
LIVING ROOTS INDUCE THE MINERALIZATION OF 15, 000 YEARS OLD
ORGANIC C FROM DEEP SOIL OF A TEMPERATE GRASSLAND........................... 3
I. SUMMARY ........................................................................................................................... 3
II. INTRODUCTION............................................................................................................... 3
III. MATERIALS & METHODS ........................................................................................... 3
III.1. SOIL SAMPLING AND PLANT SOWING............................................................................... 3
III.2. RESPIRATION MEASURES ................................................................................................ 3
III.3. SOIL CARBON FRACTIONS ............................................................................................... 3
III.4. SOIL NITROGEN............................................................................................................... 3
III.5. PLFA MEASUREMENTS................................................................................................... 3
III.6. STATISTICAL ANALYSES ................................................................................................. 3
IV. RESULTS ........................................................................................................................... 3
IV.1. SOM MINERALIZATION & RHIZOSPHERE PRIMING EFFECT.............................................. 3
IV.2. MINERAL NITROGEN IN SOIL........................................................................................... 3
IV.3. ROOT LITTER AND SOIL ORGANIC C................................................................................ 3
IV.4. MICROBIAL BIOMASS & COMMUNITY COMPOSITION....................................................... 3
V. DISCUSSION....................................................................................................................... 3
VI. CONCLUSION .................................................................................................................. 3
VII. REFERENCES ................................................................................................................. 3
CHAPTER 4 ............................................................................................................................. 3
TEMPERATURE RESPONSE OF ORGANIC C MINERALIZATION: A NEW
EXPERIMENTALLY TESTED THEORY BASED ON ENZYME INACTIVATION
AND MICROBIAL ENERGY LIMITATION RECONCILES THE RESULTS OF LAB
AND ECOSYSTEM EXPERIMENTS................................................................................... 3
I. SUMMARY ........................................................................................................................... 3
II. INTRODUCTION................................................................................................................ 3
III. THEORY............................................................................................................................ 3
IV. EXPERIMENTAL TEST.................................................................................................. 3
V. MATERIALS AND METHODS........................................................................................ 3
V.1. SOIL SAMPLING AND EXPERIMENTAL DESIGN................................................................... 3
V.2. LABELLING SYSTEM & MESOCOSM .................................................................................. 3
V.3. RESPIRATION MEASUREMENT .......................................................................................... 3
V.4. STATISTICAL ANALYSIS ................................................................................................... 3
VI. RESULTS ........................................................................................................................... 3
VI.1. EFFECT OF PLANT ON SOIL RESPIRATION......................................................................... 3
VI.2. EFFECT OF TEMPERATURE ON FRESH C RESPIRATION ..................................................... 3
VI.3. TESTING THE THEORY: EFFECT OF TEMPERATURE ON RECALCITRANT C MINERALIZATION
IN PLANTED AND BARE SOILS ................................................................................................... 3
VII. CONCLUSION................................................................................................................. 3
VIII. REFERENCES ............................................................................................................... 3
CHAPTER 5 ............................................................................................................................. 3
ARTICLES IN PREPARATION............................................................................................ 3
PART 1: THE EFFECT OF SIX GRAMINEAE AND ONE LEGUMINOUS SPECIES
ON SOIL ORGANIC MATTER DYNAMICS IN TEMPERATE GRASSLAND............ 3
PART 2: DOES HIGHER AVAILABILITY OF N DECREASE SOIL ORGANIC C
MINERALIZATION AND STORE MORE ORGANIC C? ............................................... 3
PART 3: DECOUPLING THE EFFECT OF ROOT EXUDATES, MYCORRHIZAE
AND ROOTS ON SOIL C PROCESSES IN THREE TEMPERATE GRASSLAND
SPECIES ................................................................................................................................... 3
REFERENCES ......................................................................................................................... 3
CHAPTER 6 ............................................................................................................................. 3
ROLE OF PLANT RHIZOSPHERE ACROSS MULTIPLE SPECIES, GRASSLAND
MANAGEMENT AND TEMPERATURE ON MICROBIAL COMMUNITIES AND
LONG-TERM SOIL ORGANIC MATTER DYNAMICS .................................................. 3
I. GENERAL DISCUSSION ................................................................................................... 3
II. PERSPECTIVES................................................................................................................. 3
III. REFERENCES: ................................................................................................................. 3
ANNEX OF THE THESIS ..................................................................................................... 3
ACELLULAR RESPIRATION: RECONSTITUTION OF AN OXIDATIVE
METABOLISM BY ENZYMES RELEASED FROM DEAD CELLS .............................. 3
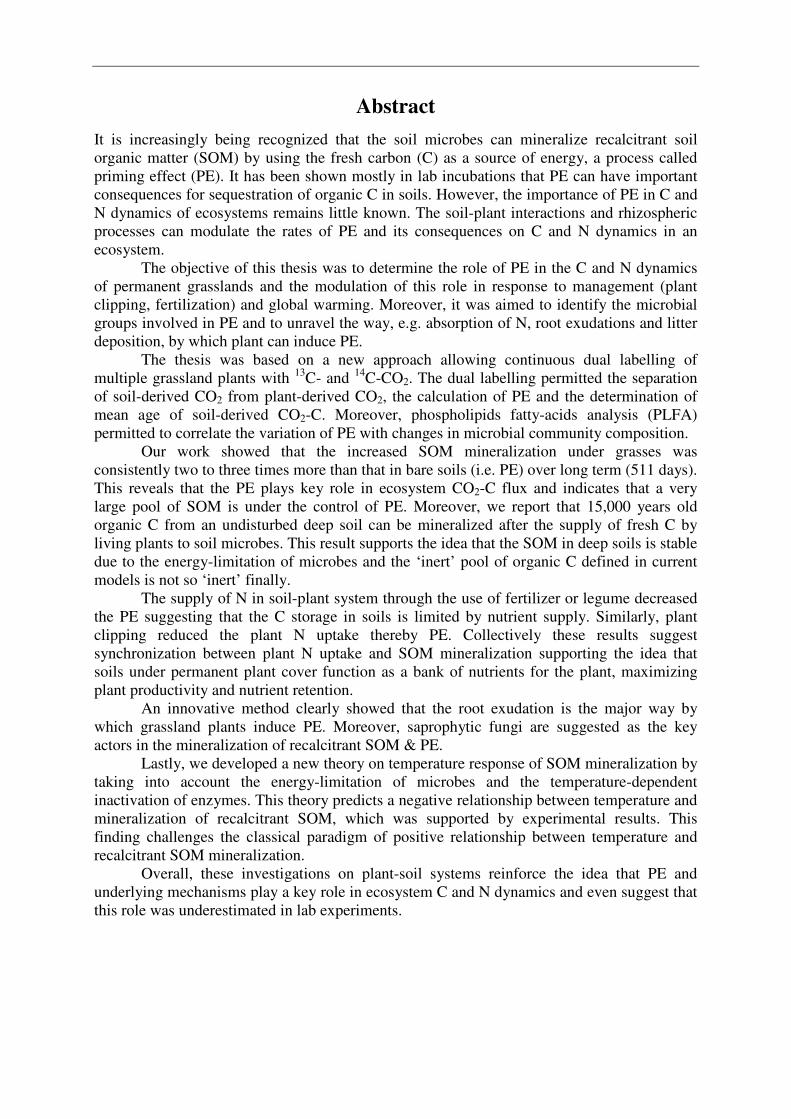
Abstract
It is increasingly being recognized that the soil microbes can mineralize recalcitrant soil organic matter (SOM) by using the fresh carbon (C) as a source of energy, a process called priming effect (PE). It has been shown mostly in lab incubations that PE can have important consequences for sequestration of organic C in soils. However, the importance of PE in C and N dynamics of ecosystems remains little known. The soil-plant interactions and rhizospheric processes can modulate the rates of PE and its consequences on C and N dynamics in an ecosystem. The objective of this thesis was to determine the role of PE in the C and N dynamics of permanent grasslands and the modulation of this role in response to management (plant clipping, fertilization) and global warming. Moreover, it was aimed to identify the microbial groups involved in PE and to unravel the way, e.g. absorption of N, root exudations and litter deposition, by which plant can induce PE. The thesis was based on a new approach allowing continuous dual labelling of multiple grassland plants with 13C- and 14C-CO2. The dual labelling permitted the separation of soil-derived CO2 from plant-derived CO2, the calculation of PE and the determination of mean age of soil-derived CO2-C. Moreover, phospholipids fatty-acids analysis (PLFA) permitted to correlate the variation of PE with changes in microbial community composition.
Our work showed that the increased SOM mineralization under grasses was consistently two to three times more than that in bare soils (i.e. PE) over long term (511 days). This reveals that the PE plays key role in ecosystem CO2-C flux and indicates that a very large pool of SOM is under the control of PE. Moreover, we report that 15,000 years old organic C from an undisturbed deep soil can be mineralized after the supply of fresh C by living plants to soil microbes. This result supports the idea that the SOM in deep soils is stable due to the energy-limitation of microbes and the ‘inert’ pool of organic C defined in current models is not so ‘inert’ finally. The supply of N in soil-plant system through the use of fertilizer or legume decreased the PE suggesting that the C storage in soils is limited by nutrient supply. Similarly, plant clipping reduced the plant N uptake thereby PE. Collectively these results suggest synchronization between plant N uptake and SOM mineralization supporting the idea that soils under permanent plant cover function as a bank of nutrients for the plant, maximizing plant productivity and nutrient retention. An innovative method clearly showed that the root exudation is the major way by which grassland plants induce PE. Moreover, saprophytic fungi are suggested as the key actors in the mineralization of recalcitrant SOM & PE.
Lastly, we developed a new theory on temperature response of SOM mineralization by taking into account the energy-limitation of microbes and the temperature-dependent inactivation of enzymes. This theory predicts a negative relationship between temperature and mineralization of recalcitrant SOM, which was supported by experimental results. This finding challenges the classical paradigm of positive relationship between temperature and recalcitrant SOM mineralization.
Overall, these investigations on plant-soil systems reinforce the idea that PE and underlying mechanisms play a key role in ecosystem C and N dynamics and even suggest that this role was underestimated in lab experiments.
1
CHAPTER 1
General Introduction
CHAPTER 1
2
GENERAL INTRODUCTION
I. Context of study
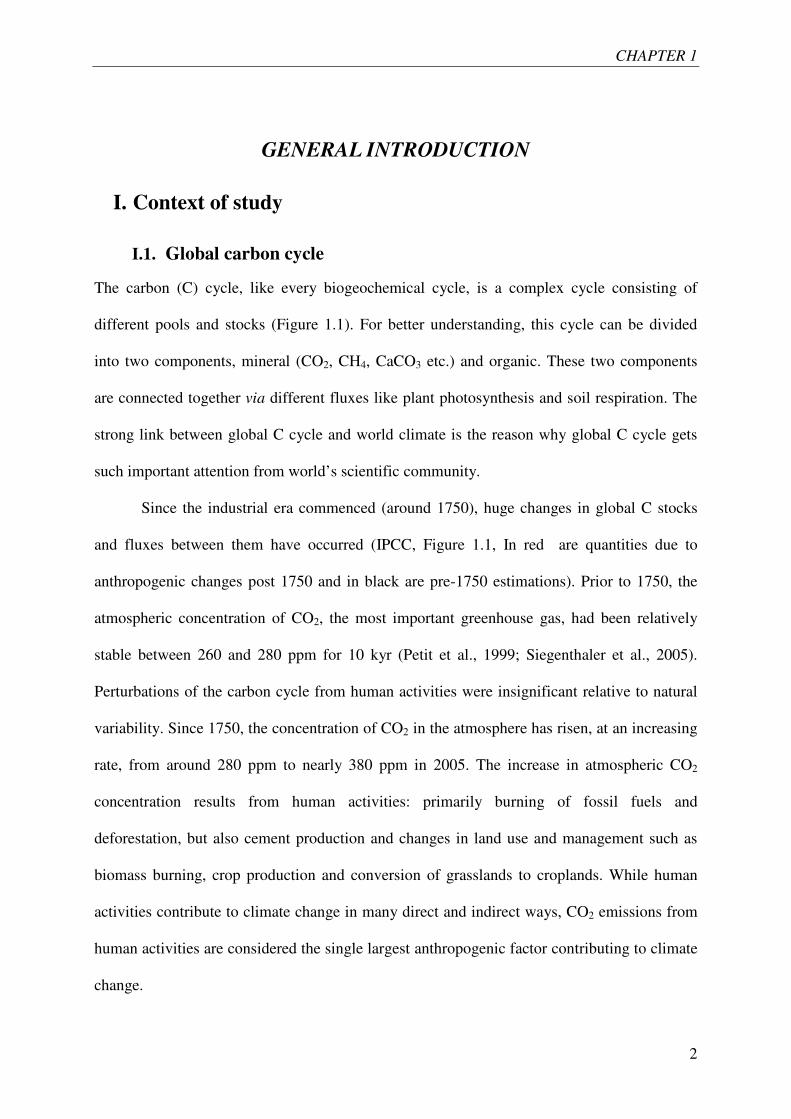
I.1. Global carbon cycle
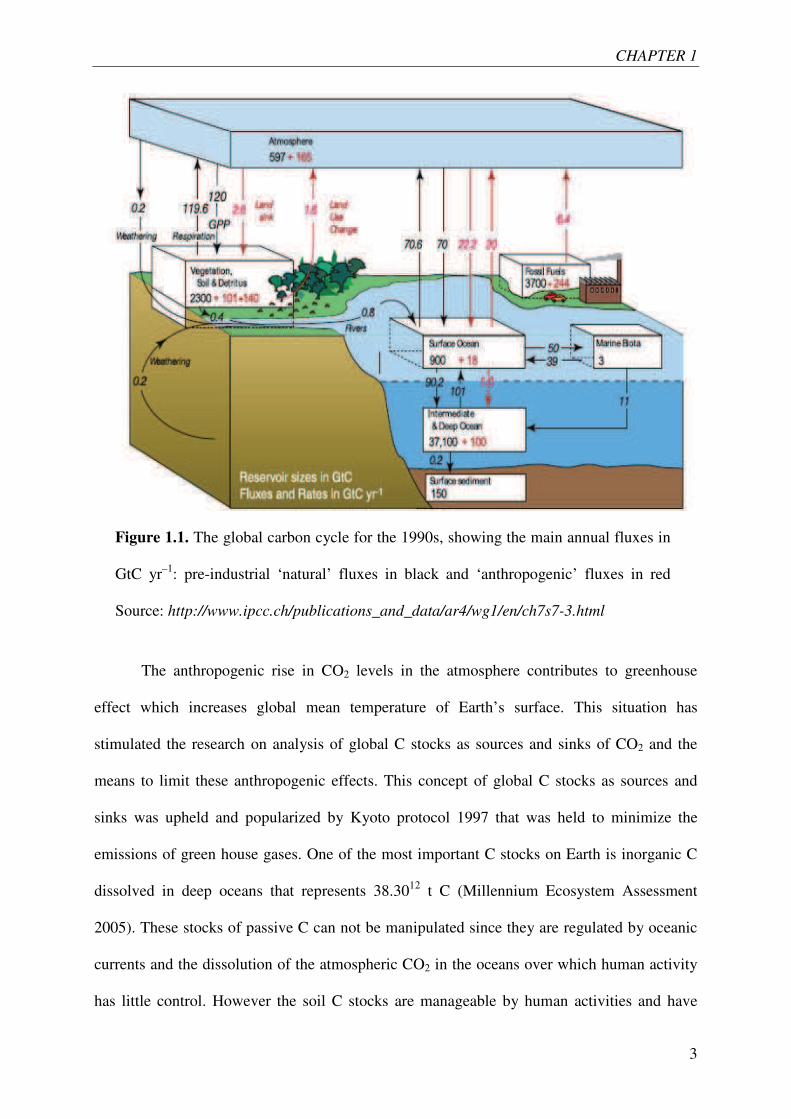
The carbon (C) cycle, like every biogeochemical cycle, is a complex cycle consisting of
different pools and stocks (Figure 1.1). For better understanding, this cycle can be divided
into two components, mineral (CO2, CH4, CaCO3 etc.) and organic. These two components
are connected together via different fluxes like plant photosynthesis and soil respiration. The
strong link between global C cycle and world climate is the reason why global C cycle gets
such important attention from world’s scientific community.
Since the industrial era commenced (around 1750), huge changes in global C stocks
and fluxes between them have occurred (IPCC, Figure 1.1, In red are quantities due to
anthropogenic changes post 1750 and in black are pre-1750 estimations). Prior to 1750, the
atmospheric concentration of CO2, the most important greenhouse gas, had been relatively
stable between 260 and 280 ppm for 10 kyr (Petit et al., 1999; Siegenthaler et al., 2005).
Perturbations of the carbon cycle from human activities were insignificant relative to natural
variability. Since 1750, the concentration of CO2 in the atmosphere has risen, at an increasing
rate, from around 280 ppm to nearly 380 ppm in 2005. The increase in atmospheric CO2
concentration results from human activities: primarily burning of fossil fuels and
deforestation, but also cement production and changes in land use and management such as
biomass burning, crop production and conversion of grasslands to croplands. While human
activities contribute to climate change in many direct and indirect ways, CO2 emissions from
human activities are considered the single largest anthropogenic factor contributing to climate
change.
CHAPTER 1
3
The anthropogenic rise in CO2 levels in the atmosphere contributes to greenhouse
effect which increases global mean temperature of Earth’s surface. This situation has
stimulated the research on analysis of global C stocks as sources and sinks of CO2 and the
means to limit these anthropogenic effects. This concept of global C stocks as sources and
sinks was upheld and popularized by Kyoto protocol 1997 that was held to minimize the
emissions of green house gases. One of the most important C stocks on Earth is inorganic C
dissolved in deep oceans that represents 38.3012 t C (Millennium Ecosystem Assessment
2005). These stocks of passive C can not be manipulated since they are regulated by oceanic
currents and the dissolution of the atmospheric CO2 in the oceans over which human activity
has little control. However the soil C stocks are manageable by human activities and have
Figure 1.1. The global carbon cycle for the 1990s, showing the main annual fluxes in
GtC yr–1: pre-industrial ‘natural’ fluxes in black and ‘anthropogenic’ fluxes in red
Source: http://www.ipcc.ch/publications_and_data/ar4/wg1/en/ch7s7-3.html
CHAPTER 1
4
been identified as important potential sinks in Kyoto protocol. Moreover, the important
quantities of soil C stocks and respiration from them being the largest flux in global C cycle
make these stocks of high stakes in the context of global climate change.
I.2. Soil organic carbon
The global mass of soil organic carbon (SOC) is at least ~ 2300 Pg C (Jobbàgy and Jackson
2000). It represents ~ 75% of the total land biosphere C reservoir given that the litter and
vegetation C stocks amount to 850 Pg C (Houghton 2005). A small change in soil C stocks
may cause important changes in global C cycle and potential feedbacks to climate change
(Schlesinger and Andrews 2000) underpinning their potential role as important source or sink
of CO2.
The stocks of organic matter in soils are the result of balance between the inputs and
outputs of C within the belowground environment. The inputs are products of net primary
productivity like root exudates, plant litter, crop stubbles etc. The outputs are the release of C
from soil principally as CO2 although CH4 efflux and hydrologic leaching of dissolved and
particulate C compounds can also be important. The CO2 release consists of microbial
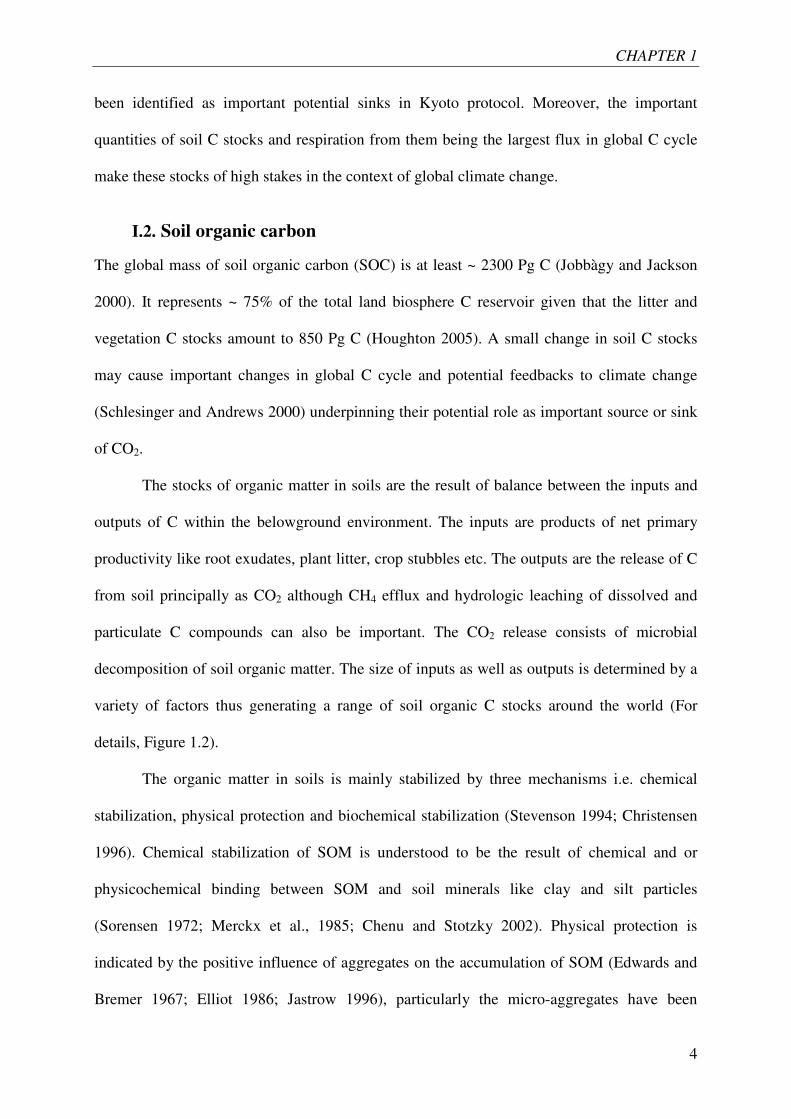
decomposition of soil organic matter. The size of inputs as well as outputs is determined by a
variety of factors thus generating a range of soil organic C stocks around the world (For
details, Figure 1.2).
The organic matter in soils is mainly stabilized by three mechanisms i.e. chemical
stabilization, physical protection and biochemical stabilization (Stevenson 1994; Christensen
1996). Chemical stabilization of SOM is understood to be the result of chemical and or
physicochemical binding between SOM and soil minerals like clay and silt particles
(Sorensen 1972; Merckx et al., 1985; Chenu and Stotzky 2002). Physical protection is
indicated by the positive influence of aggregates on the accumulation of SOM (Edwards and
Bremer 1967; Elliot 1986; Jastrow 1996), particularly the micro-aggregates have been
CHAPTER 1
5
proposed as the major sites of organic matter stabilization (Chenu and Plante 2006). The
aggregates protect SOM from decomposition by entrapping and making it inaccessible to
microbes. Biochemical stabilization of SOM occurs due to the
complex chemical composition of the organic materials. The complex chemical composition
can be an inherent property of the plant material (like lignin, polyphenols) or can be attained
during decomposition through the condensation and complexation of decomposition residues,
rendering them more resistant to subsequent decomposition. The microbes must invest energy
to produce high concentrations of enzymes to break the high number of chemical bonds in
such compounds. However, the metabolites acquired as a result of decomposition of such
Figure 1.2. Factors controlling the main inputs and outputs of soil C, superimposed over
a global map of soil organic C stocks (Miller projection; 1 : 100,000,000 for background
map). Taken from Davidson & Janssens (2006).
CHAPTER 1
6
compounds are not economically viable for microbes (Fontaine et al., 2007).That is why
chemically complex organic compounds may remain stable.
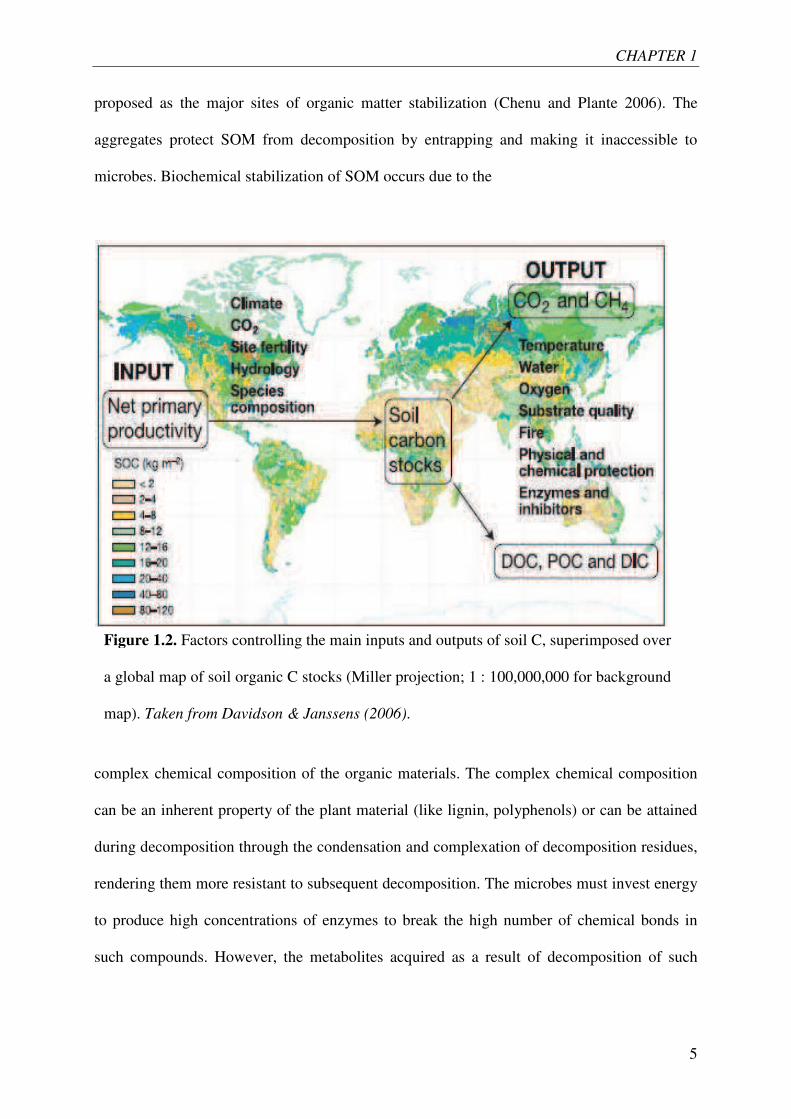
Although SOM is a continuum of biochemical complexity, for the purpose of
understanding it has been divided into three pools depending on their turnover rates (Figure
1.3, and Parton et al., 1987; Coleman et al., 1997; Wutzler and Reichstein 2008). The ‘fast’
pool turnovers within hours to weeks, the ‘slow’ pool turnovers within some years to decades
and the ‘passive’ pool turnovers in centuries to millennia (Lützow et al., 2006). A recent
evidence has shown that the ‘passiveness’ of the ‘passive’ pool is due to energy-limitation
faced by soil microbes (Fontaine et al., 2007). If microbes are provided with an energy-rich
substrate they can co-metabolize the millennia old C from ‘passive’ pool.
Figure 1.3. Simplified quality-wise fractions of soil organic C
Source: http://www.fao.org/docrep/007/y5738e/y5738e05.htm
CHAPTER 1
7
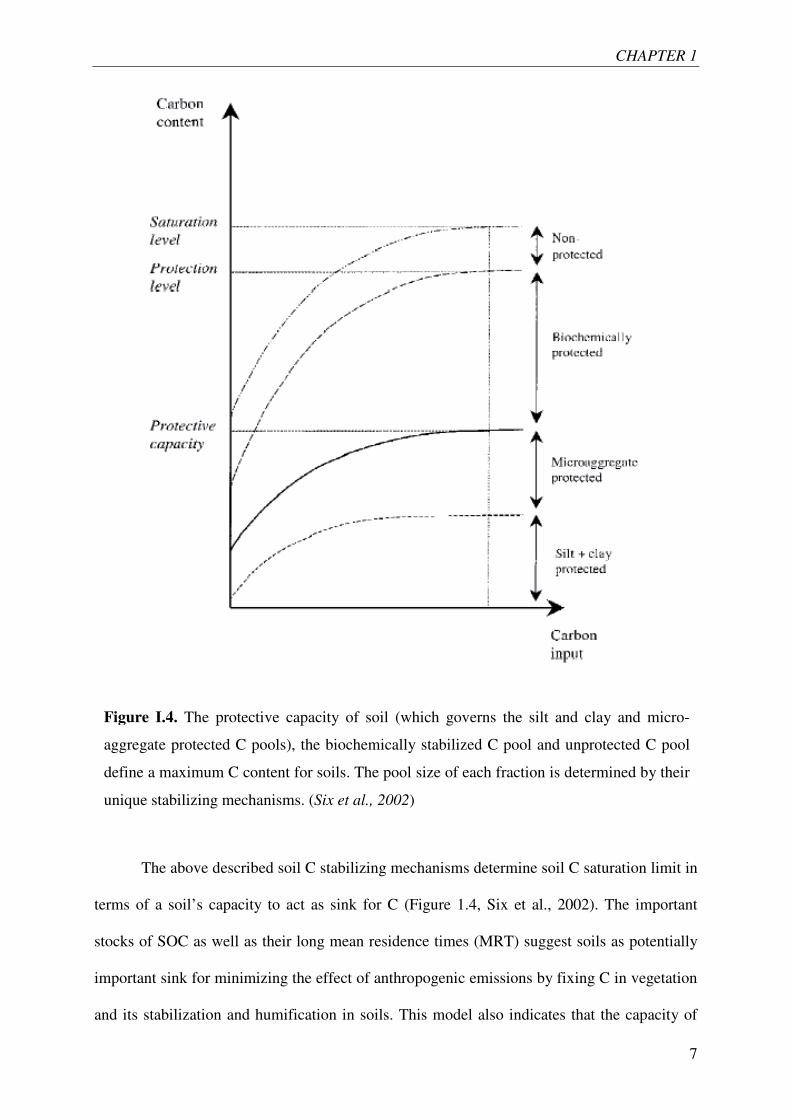
The above described soil C stabilizing mechanisms determine soil C saturation limit in
terms of a soil’s capacity to act as sink for C (Figure 1.4, Six et al., 2002). The important
stocks of SOC as well as their long mean residence times (MRT) suggest soils as potentially
important sink for minimizing the effect of anthropogenic emissions by fixing C in vegetation
and its stabilization and humification in soils. This model also indicates that the capacity of
Figure I.4. The protective capacity of soil (which governs the silt and clay and micro-
aggregate protected C pools), the biochemically stabilized C pool and unprotected C pool
define a maximum C content for soils. The pool size of each fraction is determined by their
unique stabilizing mechanisms. (Six et al., 2002)
CHAPTER 1
8
soils to raise their C stocks is limited (Six et al., 2002; Jastrow et al., 2005; Hungate et al.,
2009). However, the chronosequence studies have shown that the soils have unlimited
capacity of soil C sequestration (Syers et al., 1970; Schlesinger 1990).
The soil microbes performing the mineralization of SOM use C as energy as well as
assimilate it along with other nutrients as their DNA. The stabilization and mineralization of
SOM is thus not exclusively dependent on inputs and outputs of C but on the availability of
other nutrients as well.
I.3. Interaction of C cycle with other cycles
Six major elements-H, C, N, O, S and P- constitute the major building blocks for all
biological macromolecules (Schlesinger WH, 1997). As a result of constitutional needs of
organisms for these elements to build their tissues, the elemental cycles of C, N and other
elements are interlinked at the molecular level (Sterner RW & Elser JJ 2002). For example the
anthropogenic additions of N in atmosphere are deposited back on ground in the forms that
are readily available to plants thereby stimulating productivity and enhancing the uptake of
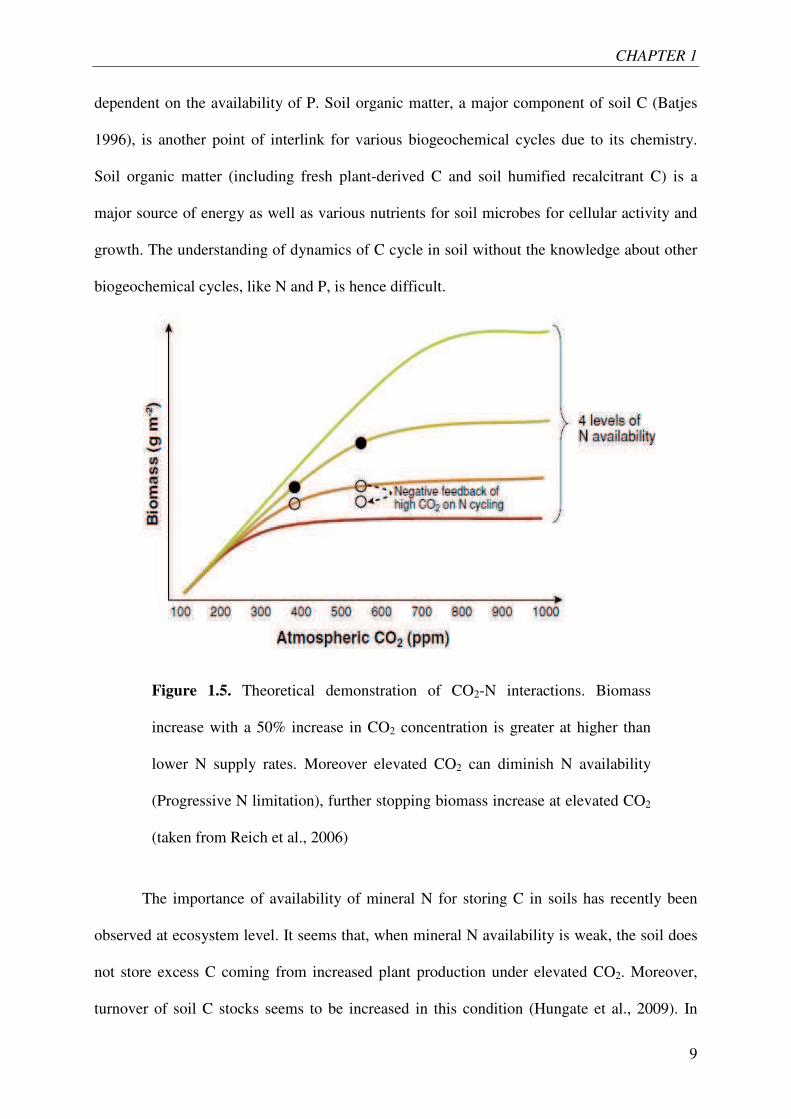
CO2 from the atmosphere. In contrast, the increase in plant biomass production under elevated
CO2 strongly depends on the availability of mineral N i.e. more the N is available; higher
would be the production of plant biomass (Figure 1.5). Moreover, the stimulation of plant
growth by elevated CO2 should lead to sequestration of soil available nutrients and hence to
progressive N limitation. The progressive N limitation hypothesis suggests that the increased
plant biomass and plant fixation of CO2 under elevated CO2 subsides in the long term.
Similarly in soils, one of the reasons of difficulty to understand and theorize the dynamics of
biogeochemical cycles is the inter-dependence of these cycles through soil organisms. The
presence of P and N in important quantities in DNA, RNA, ATP and proteins underlines its
key role in soil micro-organisms (Fagerbakke et al., 1996). Any increase in microbial biomass
in soil due to additional availability of C for example under living roots, will strongly be
CHAPTER 1
9
dependent on the availability of P. Soil organic matter, a major component of soil C (Batjes
1996), is another point of interlink for various biogeochemical cycles due to its chemistry.
Soil organic matter (including fresh plant-derived C and soil humified recalcitrant C) is a
major source of energy as well as various nutrients for soil microbes for cellular activity and
growth. The understanding of dynamics of C cycle in soil without the knowledge about other
biogeochemical cycles, like N and P, is hence difficult.
The importance of availability of mineral N for storing C in soils has recently been
observed at ecosystem level. It seems that, when mineral N availability is weak, the soil does
not store excess C coming from increased plant production under elevated CO2. Moreover,
turnover of soil C stocks seems to be increased in this condition (Hungate et al., 2009). In
Figure 1.5. Theoretical demonstration of CO2-N interactions. Biomass
increase with a 50% increase in CO2 concentration is greater at higher than
lower N supply rates. Moreover elevated CO2 can diminish N availability
(Progressive N limitation), further stopping biomass increase at elevated CO2
(taken from Reich et al., 2006)
CHAPTER 1
10
contrast, when mineral N is relatively high in availability, the total stock of C appears to go
up due to reduced turnover of soil C stocks (van Groenigen et al., 2006; Hungate et al., 2009).
The fact that the amount of organic C stored in the soil does not necessarily increase,
and can even decrease, after an input of fresh organic matter had been demonstrated in lab
incubations (Fontaine et al, 2004a and b). These incubation experiments show that certain
microbial species (Fontaine et al., 2003; Blagodatskaya et al., 2007) are able to degrade
recalcitrant soil organic matter by using energy-rich substrates present in the fresh organic
matter, a co-metabolism named priming effect in soil science (Blagodatskaya and Kuzyakov
2008). Although the mechanisms at play are not understood, the availability of nutrients for
soil microbes controls the intensity of the priming effect. When the availability of nutrient is
high, the priming effect is relatively low and the supply of fresh organic matter increase the
reserve of C in soil. When the availability of nutrients is low, the priming effect may be so
high that the reserve of C in soil decrease with the supply of fresh organic matter. Therefore,
priming effect provides another good example of how C cycle in soil is interlinked with
cycles of other nutrients.
II. State of the art
The acceleration in mineralization of recalcitrant SOM after the supply of fresh (labile) C i.e.
priming effect is the cornerstone of this thesis. Thus it would be pertinent to understand in
detail what this phenomenon is, its historical background, its precise definition in the context
of this study, its importance for SOM mineralization and the methods to measure.
II.1. Introduction to priming effect
The extra release of soil-derived C as CO2 or soil nitrogen as NH4+ or as NO3- from soils
amended with substrates in comparison to non-amended soils was termed as ‘priming effect’
(PE). Löhnis (1926) first suggested the PE by studying the N input-output balance of fields
CHAPTER 1
11
amended with green manure of legumes. He showed that the N balance could only be
explained by considering a significant acceleration of native soil organic matter
mineralization induced by the green manure. No progress was made on the subject until 1946
when isotopic techniques source partitioning of CO2 evolution from soil and Broadbent and
Norman (1946) showed that the CO2 evolution from the soil can increase from 4 to 11 fold
after addition of 13C labelled plant residues. The term “priming effect” was however
introduced by Bingemann et al. (1953). Since its introduction by Bingemann et al. in 1953,
the term priming effect has also been used in other context and for describing other processes
(Jenkinson et al., 1985; Dalenberg and Jager 1989). The focus of this thesis is SOM
mineralization we refer to the original definition of priming effect given by by Bingeman et
al. (1953), “the extra decomposition of native soil organic matter in a soil receiving an
organic matter amendment” in this manuscript. Since priming effect in this work was studied
in the presence of living roots (i.e. rhizosphere), it will be termed as rhizosphere priming
effect (RPE).
What is the rationale behind this priming effect induced by soil microorganisms?
According to energy limitation theory (Fontaine et al., 2005; 2007), despite the presence of
large soil organic carbon stocks in most soils, the soil microbes are unable to use it for
assimilation and growth because the direct and indirect (cell maintenance) cost on
synthesizing extracellular enzymes that mineralize SOM exceeds the return the microbes
could get in terms of energy and nutrients. However, some microbial species mineralize
recalcitrant SOM in co-metabolism using the fresh organic matter as a source of energy
(Fontaine et al., 2003; Blagodatskaya et al., 2007). This degradation of recalcitrant SOM
would permit microorganisms to access to the large reserve of nutrients that were held up
SOM.
CHAPTER 1
12
II.2. Measuring priming effect
The isotopic labelling, which permit separating soil C and fresh C mineralization, is the sole
current reliable technique to quantify the priming effect.. Other approaches have been
proposed to estimate the priming effect when the labelling approach is not possible but the
results are highly disputable (Kuzyakov 2010).
In lab incubation studies, C labelled simple components of root exudates like glucose,
fructose, alanine etc. (Hamer and Marschner 2005) or the extraction of labelled plant material
like cellulose (Fontaine et al., 2007) or labelled plant litter (Conde et al., 2005) is added to
unlabelled soil. The CO2 efflux from such soils as well as controls are measured and
separated into soil-derived (unlabelled) and added-substrate derived (labelled) by isotopic
mass-balance equations. The difference of soil-derived CO2 between treated (substrate-added)
and control soil is the amount of priming effect. This is very excellent method, easy to control
the conditions but it excludes the living roots thus neglecting the rhizospheric processes like
rhizodeposition, root absorption of N and root-induced breaking of aggregates.
The measurement of priming in living soil-plant systems is measured by continuous or
pulse labelling of plants by exposing them to an atmosphere with constant ratios of 14C- or
13C- CO2 to total CO2 over a certain period (Kuzyakov et al., 2001; Dijkstra et al., 2007). The
root-derived (labelled) and soil-derived (unlabelled) CO2-C is separated from total soil (soil
plus roots) CO2 efflux using isotopic mass balance equations. The difference of soil-derived
CO2 between treated (planted) and control soil is the amount of priming effect.
Another method to separate soil-derived and root-derived CO2 efflux is by using the
natural 13C abundance of soils and plants. The 13C natural abundance method is based on the
differential discrimination of the heavier 13C isotope during CO2 assimilation by plants with
different types of photosynthesis i.e. C3 or C4 plants. The soils developed under C3 or C4
vegetation contain SOM with �13C of -27 or 13 ‰ respectively (Cheng 1996). The natural
CHAPTER 1
13
abundance method is based on cultivation of C4 on a C3 or vice versa and estimation of the
contribution of root-derived CO2 according the �13C value in the CO2 evolved.
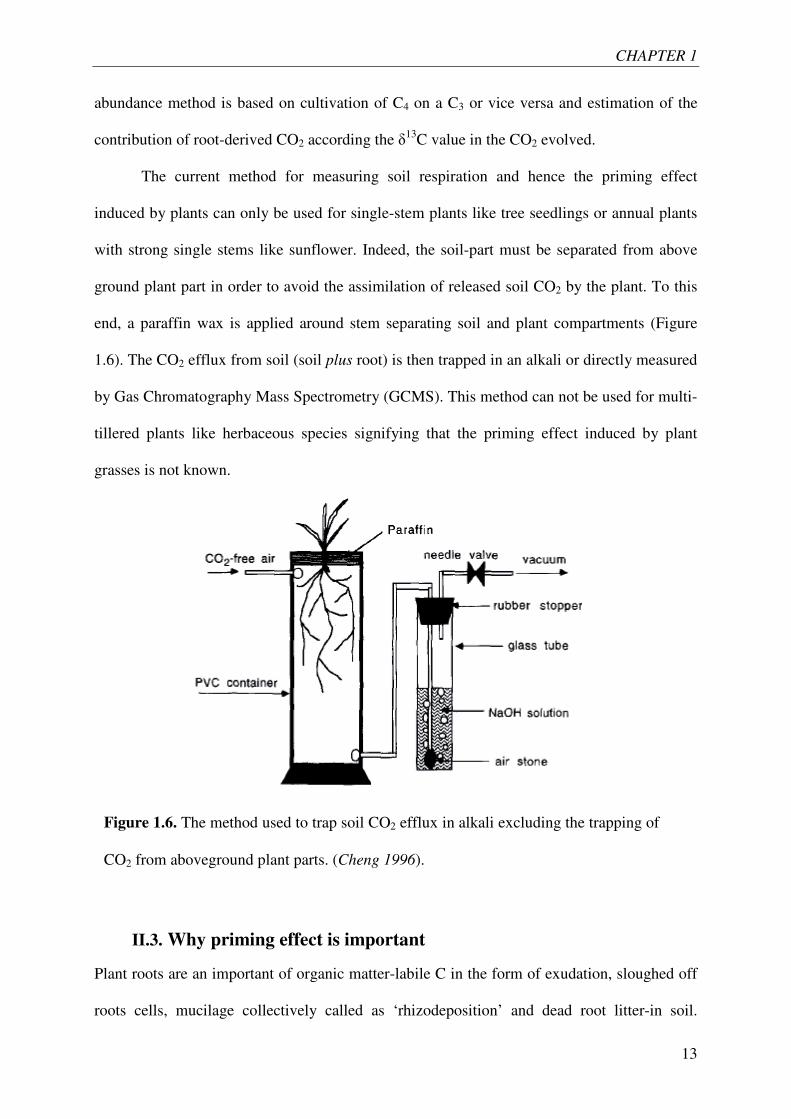
The current method for measuring soil respiration and hence the priming effect
induced by plants can only be used for single-stem plants like tree seedlings or annual plants
with strong single stems like sunflower. Indeed, the soil-part must be separated from above
ground plant part in order to avoid the assimilation of released soil CO2 by the plant. To this
end, a paraffin wax is applied around stem separating soil and plant compartments (Figure
1.6). The CO2 efflux from soil (soil plus root) is then trapped in an alkali or directly measured
by Gas Chromatography Mass Spectrometry (GCMS). This method can not be used for multi-
tillered plants like herbaceous species signifying that the priming effect induced by plant
grasses is not known.
II.3. Why priming effect is important
Plant roots are an important of organic matter-labile C in the form of exudation, sloughed off
roots cells, mucilage collectively called as ‘rhizodeposition’ and dead root litter-in soil.
Figure 1.6. The method used to trap soil CO2 efflux in alkali excluding the trapping of
CO2 from aboveground plant parts. (Cheng 1996).
CHAPTER 1
14
Living roots, being a source of labile C, have been found to induce rhizosphere priming
effects. The importance of this effect can be gauged from the fact that the increase in SOM
mineralization in planted soils can reach to three-fold of SOM mineralization in bare soils
under similar temperature and moisture conditions (Zhu and Cheng 2011). RPE have also
been shown to induce net C loss from a soil (Fontaine et al., 2004; Dijkstra et al., 2007).
Moreover, various biotic and abiotic factors that have been shown to modulate the rate of
RPE suggest the importance of studying this phenomenon to devise future strategies for
favouring net positive sequestration under living plants and not the net positive SOM
mineralization.
Among biotic factors, plant biomass (Dijkstra et al., 2006), photosynthesis (Kuzyakov
and Cheng 2001), plant phenology (Fu and Cheng 2002) have been related with rate of RPE.
Plant biomass and photosynthesis have been linked with RPE suggesting that the increased
rate of rhizodeposition under increased plant biomass or photosynthesis increases the rate of
RPE (Kuzyakov and Cheng 2001; Dijkstra et al., 2006). For annual plants, it has been shown
that the RPE is higher during vegetative growth stages of plant in comparison to reproductive
(or later) stages presumably due to high amount of exudation from young roots during early
age of plant (Fu and Cheng 2002).
Abiotic factors like soil nutrient status, especially the availability of mineral N has
also been found to influence the magnitude of RPE. Under high availability of mineral N,
lesser amount of priming effect was observed and vice versa (Fontaine et al., 2004a). High
availability of N reduces the N limitation and the competition for N between microbial
biomass and plant roots. Under high soil fertility the microbes are more adapted to assimilate
root exudates as they are less inclined to mineralize high-cost recalcitrant SOM for nutrients
when the later are available almost free of cost.
CHAPTER 1
15
The atmospheric CO2 levels, soil and air temperature and moisture are expected to
change in future climates (IPCC 2007) and all of them have been found to modulate the
magnitude of RPE. For example, in low fertility soils the sustained growth responses of forest
to elevated CO2 are maintained by enhanced rates of N cycling fuelled by inputs of root-
derived exudates and enhanced RPE (Phillips et al., 2011). The increased temperature has
been found to increase RPE suggesting the increased temperature sensitivity of SOM
mineralization due to RPE (Zhu and Cheng 2011). Higher soil moisture contents (not
anaerobic conditions) also facilitate the RPE presumably by increased root exudation
(Dijkstra and Cheng 2007).
In summary, the future climatic changes that can influence RPE directly or indirectly
by changing soil nutrient status, soil moisture, biomass production etc. underscore the
importance of rhizosphere priming effect and the need to study it.
II.4. Knowledge gaps
The importance of rhizosphere priming effect (RPE) vis-à-vis C and N cycles in grasslands is
not clear owing perhaps to the absence of a method to directly measure RPE induced by
grasses. After detailed literature review, six knowledge gaps were identified to work on for
this thesis:
What is the effect of grazing on RPE? Grazing is central to the management of
grasslands and has been shown to accelerate the decomposition of plant litter present in soil
(Klumpp et al., 2009). However, the effect of grazing on mineralization of SOM is unclear.
The increased availability of soluble C, higher net N mineralization and increased microbial
biomass in soil after clipping the plant leaves were considered an evidence to suggest that the
plant clipping could accelerate SOM mineralization i.e. increased RPE thereby releasing
mineral N from recalcitrant SOM for plant uptake (Hamilton and Frank 2001). If this
hypothesis is true, then clipping (a simulation of mowing or grazing minus animal excreta)
CHAPTER 1
16
could decrease soil C stocks on two fronts i.e. first, due to reduced overall C input into soil
due to reduced aboveground production and rhizodeposits and second, by stimulating the
mineralization of already existing soil C (SOM). However, the studies where soil CO2 efflux
was measured after plant clipping do not support the hypothesis of increased RPE after plant
clipping. In contrast, these studies have shown that the plant clipping can reduce soil CO2
efflux by 20-50 % (Craine et al., 1999; Bahn et al., 2006). Thus, the impact of grazing on
recalcitrant soil organic matter must be studied though a direct approach.
Are plants with deep roots able to reactivate deep ancient C and N cycle trough a
priming effect? The SOM mineralization has been found to accelerate in the presence of
living roots of annual plants and tree seedlings (Cheng et al., 2003; Dijkstra et al., 2007) and
in some cases to result in net soil C loss (Dijkstra et al., 2007). Most of the studies aiming to
find out the effect of living roots on soil C stocks and soil-derived CO2 efflux are limited to
upper 20 or 30 cm of soil. However, of the 1600 Gt of organic C held in the top meter of
world soils, about half is in the 25-100 cm layer (Jobbàgy and Jackson 2000). Moreover,
some recent studies focussing on C sequestration in soils have suggested that deep soils may
not be sequestering C or even losing some of it (Carter 2005). The C loss from deep soils
suggests that the labile C deposition may be accelerating the mineralization of deep soil C. A
recent study in lab conditions (Fontaine et al., 2007) have actually shown that the labile C
addition to soil sampled from deep soil (80 cm depth) could accelerate SOM mineralization
and destabilize ~ 2500 years old C. The SOM dynamics in deep soils in the presence of living
roots is an important question to study to predict its feedbacks as well as viability of deep soil
for C sequestration in future climates in which temperatures have been predicted to rise.
Is global warming going to intensify the priming effect leading to soil C losses? The
SOM mineralization being an enzymatic reaction is supposed to be influenced by temperature
and its relationship with temperature has been described using Arrhenius equation by a
CHAPTER 1
17
number of studies. According to Arrhenius (1889) most of chemical reactions need a ‘little
push’ in the form of exogenous energy to proceed, which he called activation energy. In a
reaction, higher the fraction of reactants having required activation energy or more, the higher
will be the rate of that reaction. Moreover, higher the activation energy of a reaction higher
will be the temperature response of that reaction. For example, chemically more recalcitrant
organic compounds need higher activation energy to proceed for mineralization thus will
show stronger temperature response as compared to relatively labile organic compounds
(Bosatta and Agren 1999). A lot of lab incubation studies have shown the increase in SOM
mineralization with increasing temperature as predicted in Arrhenius equation (Kirschbaum
1995; Waldrop and Firestone 2004; Knorr et al., 2005). However, the results of long term soil
warming field experiments (in the presence of plants) do not always support this theoretical
prediction and the results of lab incubations. They show that the mineralization of recalcitrant
SOM may acclimatize to temperature increase in the long term (Luo et al., 2001; Melillo et
al., 2002; Eliasson et al. 2005; Bradford et al., 2008). One reason for this discrepancy between
lab and field experiments’ results may lie in the omission of rhizospheric processes, i.e.
consistent supply of labile C substrate and rhizosphere priming effect, in lab incubation
studies. It should be noted that the effect of priming effect on SOM mineralization is known
to be higher than the effect of temperature (Hoosbeek et al., 2004). Moreover, the warm
temperatures (for example summer season) stimulate photosynthesis, plant biomass
production and C inputs into the soil with possibility of increasing RPE. However, to date the
reports on the direct effects of temperature on RPE are scarce.
How do plant growth strategies affect plant-soil interactions and the priming effect?
Various plant species varying with respect to the quantity of rhizodeposits have been shown
to modify soil C stocks in varying amounts (Dijkstra et al., 2006 b). The chemistry of root
litter has also been linked to the dynamics of SOM. Specifically, root N concentration across
CHAPTER 1
18
species was significantly negatively related to decomposition of soil C. Moreover various
plant species, especially grassland species, vary in nitrogen uptake and the duration for which
they conserve this nitrogen in their biomass by controlling the amount of rhizodeposits
thereby imposing certain negative mineral N balance in soil. The quantity and quality of
rhizodeposits and the duration for which negative mineral N balance is induced in soil by
various species could induce varying amounts of RPEs thereby altering soil C stocks.
Can legumes foster C storage in soils by lowering the priming effect? The
availability of mineral N can modify the interaction between incoming labile organic matter
and recalcitrant SOM (Section 1.1.3, 1.2.3). In lab conditions, it has been shown that under
higher availability of mineral N the amount of RPE was less as compared to that under lower
N availability for similar supplies of labile organic matter. Moreover high fertility stabilized
more added-C than low fertility. Could the similar results be produced under living plants
where high N availability will stimulate higher production of plant biomass and
rhizodeposits? Moreover, is the natural availability of mineral nitrogen under N-fixing plants
capable of stabilizing more C deposited by N-fixing as well as a co-occurring non N-fixing
plant? The inter-play of amount and quality of rhizodeposits and soil fertility is yet to be
determined vis-à-vis RPE and soil C stocks.
What is the relative contribution of root exudates, mycorrhizae and root litter
depositions in the priming effect induced by plants? The rhizodeposits can loosely be
divided into three major components: root exudates, mycorrhizae and root litter. Among them
root litter has been shown to induce the RPE. The mycorrhizae have been shown to accelerate
the mineralization of labelled plant litter and obtain mineral N for their host plant (Hodge et
al., 2001). However, we do not know if they can induce SOM mineralization as well. For root
exudates, it is assumed that they can induce RPE based on lab incubations where various
components of root exudates singly or in combinations were added in a soil and priming
CHAPTER 1
19
effect determined (Hamer and Marschner 2005). However, certain components of root
exudates do not accelerate the mineralization of SOM (Dalenberg, 1981, 1989; Hamer and
Marschner 2005) in these experiments and no evidence of RPE under living plants
exclusively by exudates is available. Actually, it is uncertain if they can stimulate SOM
mineralizing microbes or they are readily used up by that group of microbes which is capable
of mineralizing the ‘too’ labile organic C only.
Soil microbes, the drivers of RPE are perhaps the least known component of the RPE
phenomenon. We shall discuss briefly our knowledge or lack thereof about the microbes
involved in RPE in succeeding section.
Which soil microbes ‘prime’ the SOM mineralization? The question as to which microbes
are responsible for mineralization of recalcitrant SOM is still an open one and closely linked
with priming effect mechanisms. Fontaine et al. (2003) suggested that microbial groups are
specialized in using organic substrate on the basis of their ability to acquire mineral nutrients
and can be divided into two groups: r-strategists and k-strategists. While both of them are
energy limited in soil and can use the labile C, r-strategists are quicker to assimilate labile
substrates than their competitors. However, k-strategists boosted by the energy obtained from
labile C can mine recalcitrant SOM for mineral nutrients and more C thereby inducing the
RPE. Recently it has been suggested that it is fungi are the main actors in priming effect
(Fontaine et al., 2011). It has been suggested that the fungi specialize in accessing and
degrading substrates that are poorly available to most bacteria and, in contrast to bacteria, can
grow through low nutrient zones to the distantly located substrates using their hyphae (Otten
et al., 2001). However, as shown by 13C-PLFA, Gram-negative bacteria may also contribute
to priming effect (Nottingham et al., 2009). Most of priming studies are short term (a few
weeks to couple of months) and only a very few (Blagodatskaya et al., 2007; Marx et al.,
2007) have examined the dynamics and activity of microbial groups over an extended period.
CHAPTER 1
20
We know that RPE can last for over a year (Dijkstra et al., 2007) however we do not know
which microbial groups are involved in RPE. A large number of microbial groups may be
involved. Nevertheless, the study of microbial communities in a soil-plant system adopting a
correlative approach could help identify the microbial groups that play key role in priming
effect.
III. Objectives of thesis
The principal objective of this thesis is to contribute to the knowledge of mechanisms
controlling the priming effect and hence the long-term soil organic matter dynamics in
grasslands. From an applied perspective, this work aims at identifying key biological
mechanisms that could be used to increase the C storage and the efficiency of forage
production (more primary production with less mineral fertilizers) in permanent grasslands.
On the basis of contradictions and knowledge gaps found in literature (Section 1.2), we
formulated some hypotheses which provided the base for the research work carried for this
thesis.
III.1. Hypotheses of thesis
In the first experiment, we wanted to test the effect of plant clipping on SOM mineralization.
We hypothesized that the plant clipping would decrease rhizosphere priming effect by
decreasing the supply of labile C to mycorrhizae and soil microbes. We also assumed that
clipping would reduce total plant N uptake due to curtailed photosynthesis thereby increasing
mineral N quantity in soil. Moreover, reduced photosynthesis and decreased labile C supply
after clipping was expected to change microbial community structure with the relative
abundance of saprophytic fungi expected to follow the change in RPE.
In the second experiment, we tested the effect of a deep-rooted plant on the SOM
dynamics in deep soil. We assumed that the deep soil microbes are energy limited like their
CHAPTER 1
21
counterparts in surface soils and are capable of accelerating SOM mineralization i.e. inducing
RPE in the presence of living roots by using labile C coming from roots. Moreover, the
accelerated SOM mineralization in the presence of living roots was expected to increase
nitrogen mineralization. Microbial community structure especially relative abundance of
saprophytic fungi was expected to correspond with the amount of RPE.
For the question of effect of temperature on RPE, we theorized that when specific
enzyme activity, time and temperature dependent enzyme inactivation and microbial
production of enzyme in the presence of fresh supply of labile C (e.g. in the presence of living
roots) is taken into account, SOM mineralization would have a negative relationship with
temperature. This theoretical framework was then validated by measuring short term (24
hours) temperature treatments as well as seasonal temperature response of RPE under living
plants in a mesocosm.
To test the effect of different grassland species producing varying quantity and quality
of rhizodeposits and the mineral nitrogen balance in soil they impose, six gramineae and one
legume commonly found in temperate grasslands were selected. It was hypothesized that the
quick growing species would induce strong amounts of RPEs in early periods while slow
growing species would induce lower amounts of RPEs early on and strong RPEs in the later
stages. Moreover, the leguminous species would induce important amounts of RPEs though it
would stock more C than it would mineralize.
In another experiment, the possibility of high C stocks and lower RPE under high
availability of nitrogen, through mineral fertilizers or natural N fixation by an N-fixing plant,
was tested. It was hypothesized that under high availability of mineral N the microbial
mineralization of SOM would decrease since the microbial need to acquire N from SOM
would lessen due to supply of mineral N.
CHAPTER 1
22
Lastly, the hypothesis that root exudates from living roots are capable of stimulating
the soil microbes and accelerating SOM mineralization thereby inducing RPE was tested. In
addition, the contribution of each component of rhizodeposition i.e. roots, mycorrhizae and
root exudates in inducing RPE was estimated.
III.2. Approaches of the study
The most original part of approaches developed in the thesis are presented here:.
a. Experimental approach
A dual labelling (13C and 14C) of fresh material is needed for quantifying the priming effect
and the age of soil C released by this priming (Fontaine et al., 2007). Therefore, we set up a
labelling system permitting a continuous dual labelling of grassland plants in a mesocosm
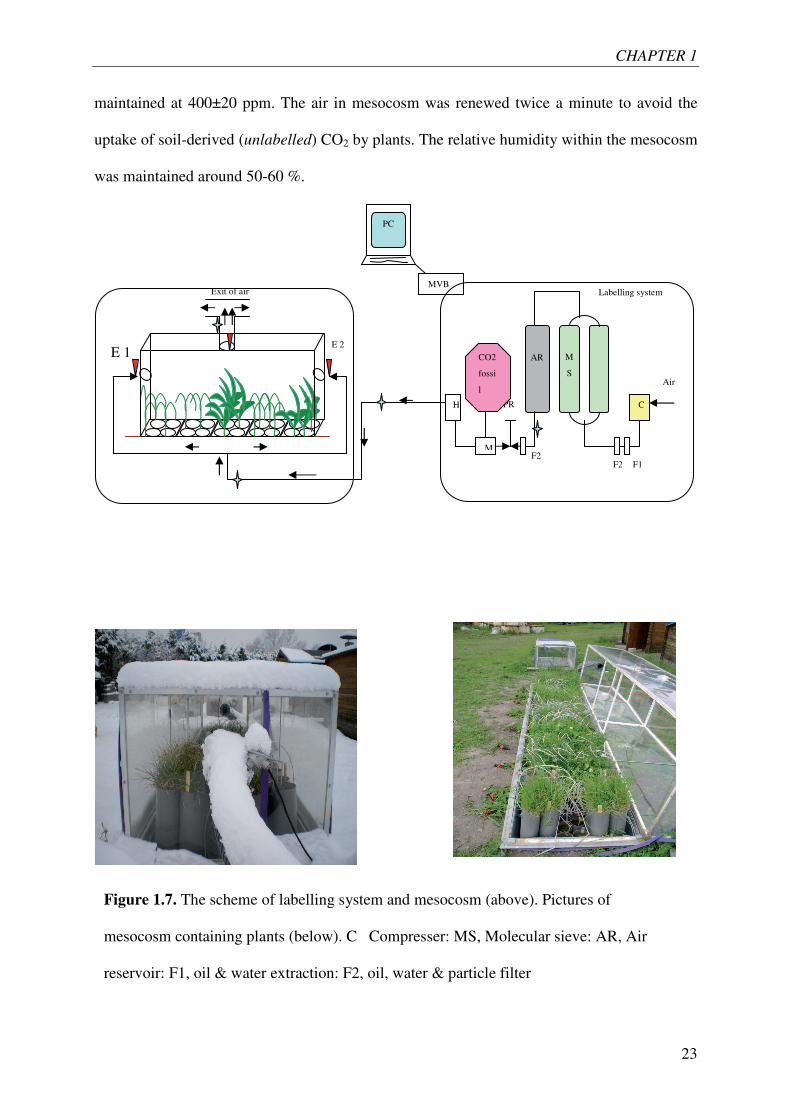
where plants benefited from natural light and temperature. A schematic diagram of the
labelling system and picture of the mesocosm containing the planted and unplanted pots are
shown in Figure 1.7. A screw compressor, a self-regenerating adsorption dryer capable of
generating decarbonised air at a rate of up to 5000 standard liters per minute (SLPM) and
residual CO2 below 1µmol CO2 mol-1 air, an air reservoir, gas cylinders containing fossil fuel
derived CO2 and a humidifier (1m3:1m2 cross corrugated cellulose pads) constitute the main
parts of the labeling system. Ambient air was taken into the system by a compressor, its CO2
and H2O contents and all other particles were scrubbed by a molecular sieve. This
decarbonised air was then mixed with fossil-originated CO2 which is naturally depleted in
13C and 14C. A mass flow meter served to control the CO2 injection rate. Flow rate of the
whole system was controlled by pressure regulators. During daytime, around 30 % of
decarbonised dry air was diverted to one of the two molecular sieves in order to regenerate it.
Therein, regeneration of molecular sieve was done every six minutes. There was no labeling
during nighttime. Planted and bare soil pots were placed in mesocosm on April 1, 2009
and remained there till the end of experiment. The concentration of CO2 in the mesocosm was
CHAPTER 1
23
maintained at 400±20 ppm. The air in mesocosm was renewed twice a minute to avoid the
uptake of soil-derived (unlabelled) CO2 by plants. The relative humidity within the mesocosm
was maintained around 50-60 %.
PC
MVB
Exit of air
C
Air
F2 F1
M
S
AR
PR
M
CO2
fossi
l
H
F
Labelling system
F2
E 2
E 1
Figure 1.7. The scheme of labelling system and mesocosm (above). Pictures of
mesocosm containing plants (below). C Compresser: MS, Molecular sieve: AR, Air
reservoir: F1, oil & water extraction: F2, oil, water & particle filter
CHAPTER 1
24
As discussed earlier (section 1.2.2, Figure 1.6), the current method for measuring soil
respiration and hence the priming effect induced by plants can only be used for single-stem
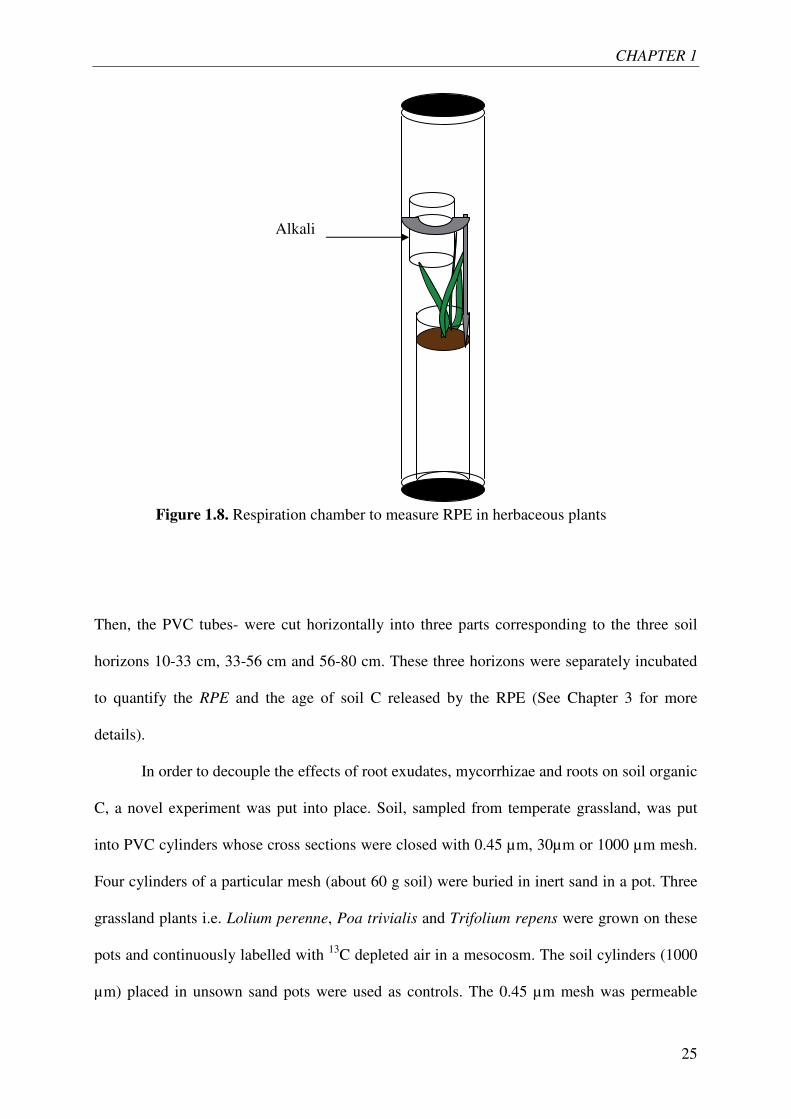
plants. Therefore, we conceived a novel method to measure RPE induced by herbaceous
plant. To this end, planted soil pot as well as bare-soil pots (40 cm height, Ø 9.8 cm) were put
into opaque respiration chambers (100 cm height, Ø 15 cm) (Figure 1.8). The absence of light
in respiration chambers stopped the photosynthesis and avoided re-assimilation of soil-
derived CO2 (unlabelled) by plants. The respiration chambers were tightly sealed and placed
under shade for 24 hours. An alkali solution (200 ml of 1M NaOH) was placed into
respiration chambers to trap the CO2 released by the plant-soil system. Preliminary tests
showed that 99% of CO2 respired by soil-plant system is trapped by the alkali solution. The
CO2 trapped in NaOH was measured with a total inorganic-C analyzer. The 13C abundance of
trapped CO2 was analyzed with an Isotope-Ratio Mass Spectrometer (IRMS) after
precipitating the carbonates with excess BaCl2 and filtration. Isotopic labeling allowed the
separation of soil-derived CO2-C from plant-derived CO2-C using classical balance mass
equations (See chapters 2 for details). In order to calculate the rhizosphere priming effect
(RPE), CO2-C released by bare soils was subtracted from soil-derived CO2-C released by
planted soils.
To determine the effect of living roots on SOM mineralization in deep soil layers, intact soil
columns were sampled from 10-80 cm soil depth and placed into PVC pots (Height 70 cm, Ø
9.8 cm) without disturbing their structure. A grassland species, Festuca arundinacea, known
for producing deep roots was sown and cultivated under dual labelled CO2. The 13C labelling
permitted separation of soil-derived CO2 from plant-derived CO2 whereas 14C labelling
allowed calculating the age of CO2-C. The RPE was measured for whole soil-plant system for
almost one and half year.
CHAPTER 1
25
Then, the PVC tubes- were cut horizontally into three parts corresponding to the three soil
horizons 10-33 cm, 33-56 cm and 56-80 cm. These three horizons were separately incubated
to quantify the RPE and the age of soil C released by the RPE (See Chapter 3 for more
details).
In order to decouple the effects of root exudates, mycorrhizae and roots on soil organic
C, a novel experiment was put into place. Soil, sampled from temperate grassland, was put
into PVC cylinders whose cross sections were closed with 0.45 µm, 30µm or 1000 µm mesh.
Four cylinders of a particular mesh (about 60 g soil) were buried in inert sand in a pot. Three
grassland plants i.e. Lolium perenne, Poa trivialis and Trifolium repens were grown on these
pots and continuously labelled with 13C depleted air in a mesocosm. The soil cylinders (1000
µm) placed in unsown sand pots were used as controls. The 0.45 µm mesh was permeable
Alkali
Figure 1.8. Respiration chamber to measure RPE in herbaceous plants
CHAPTER 1
26
only to root exudates thus corresponding to the effect of root exudates on SOC (RE
treatment), 30µm mesh was permeable to root exudates and mycorrhizae representing the
effect of root exudates and mycorrhizae (RE+Myc treatment) and 1000 µm mesh being
permeable to root exudates, mycorrhizae and roots represented the combined effect of all of
them (Whole-root treatment). The respiration from plant-soil system was measured
periodically as described earlier.
b) Theoretical approach
The relationship between temperature and SOM mineralization was explored by
developing a novel theoretical framework and then validating the prediction of the theory
with experiment results. The model includes two key processes that are usually omitted which
are often overlooked while modeling or describing the experimental results of effect of
temperature on enzymatic activities and organic matter mineralization. First, microbial
decomposers are limited by fresh energy-rich C which controls their enzyme production
capability to mineralize recalcitrant C in soil. Second, enzyme inactivation, occurring due to
loss of three dimensional structures of enzymes induced by the Brownian movement,
accelerates with warming. The analysis of the model in dynamic and at steady state stress on
the need of separating non steady-state-system like incubated bare soil wherein there is a
continuous decrease in enzymatic pool, from a steady-state-system where the enzymatic pool
is maintained by microbes which are supplied with fresh C like in soil-plant system. The
model predicts that soil C mineralization should increase with temperature till an optimum in
bare soil whereas it should continuously decrease with temperature in planted soil. These
predictions were confirmed by an experiment on planted soil and bare soil systems submitted
to seasonal temperature variation for 479 days.
CHAPTER 1
27
IV. Thesis layout
During the experiment phase of this thesis, six hypotheses were made and consequently tested
with six experiments. However in this manuscript three are presented in the form of finished
articles and three others, for which only preliminary results are available at this stage, have
been assembled in chapter 5 under the heading ‘articles in preparation’.
This chapter of introduction is preceded by four chapters discussing the results of
original research work.
First finished article describes the effect of plant clipping on SOM mineralization,
mineral N availability, soil microbial biomass and microbial community structure (Chapter 2,
pages 37-66). This article has already been accepted in ‘Soil Biology & Biochemistry’ with
minor corrections.
Second article describes the effect of rhizodeposition by living roots on mineralization
of SOM in deep soils and microbial community along the soil profile. Moreover, this study
aims to identify the microbes involved in SOM mineralization and rhizosphere priming effect
(Chapter 3, pages 67-97).
Third article is about the relationship of temperature with SOM mineralization
(Chapter 4, pages 98-129).
Fifth chapter assembles the preliminary results of three experiments under the heading
‘Articles in presparation’ (pages 130-146).
A general discussion and perspectives emanating from the thesis make up the last
chapter of this work (pages 147-160).
An annexe containing a novel work on acellular respiration in soils in which this
doctorate student participated is attached in the end.
CHAPTER 1
28
V. References
Arrhenius, S. 1889. Uber die Reakionsgeschwindigkeit bei der Inversion von Rohrzucker
durch Sauren. Zeitschrift fuer physikalische Chemie 4, 226-248.
Bahn, M., Knapp, M., Garajova, Z., Pfahringer, N., Cernusca, A., 2006. Root respiration
in temperate mountain grasslands differing in land use. Global Change Biology 12,
995-1006.
Batjes, N.H., 1996. Total carbon and nitrogen in the soils of the world. European Journal
of Soil Science 47, 151-163.
Bingeman, C.W., Varner, J.E., Martin, W.P., 1953. The effect of the addition of organic
materials on the decomposition of an organic soil. Soil Science Society of America
Journal 17, 34-38.
Blagodatskaya, E.V., Blagodatsky, S.A., Anderson, T.H., Kuzyakov, Y., 2007. Priming
effects in Chernozem induced by glucose and N in relation to microbial growth
strategies. Applied Soil Ecology 37, 95-105.
Blagodatskaya, �., Kuzyakov, Y., 2008. Mechanisms of real and apparent priming effects
and their dependence on soil microbial biomass and community structure: critical
review. Biology and Fertility of Soils 45, 115-131.
Bosatta, E., Ågren, G.I., 1999. Soil organic matter quality interpreted thermodynamically.
Soil Biology and Biochemistry 31, 1889-1891.
Bradford, M.A., Davies, C.A., Frey, S.D., Maddox, T.R., Melillo, J.M., Mohan, J.E.,
Reynolds, J.F., Treseder, K.K., Wallenstein, M.D., 2008. Thermal adaptation of soil
microbial respiration to elevated temperature. Ecology Letters 11, 1316-1327.
Broadbent, F.E. and Norman, A.G. 1946. Some factors affecting the availability of the
organic nitrogen in soil-A preliminary report. Soil science society of America
Journal. DOI: 10.2136/sssaj1947.036159950011000C0050x.
CHAPTER 1
29
Carter, M.R., Gregorich, E.G., Carbon and nitrogen storage by deep-rooted tall fescue
(Lolium arundinaceum) in the surface and subsurface soil of a fine sandy loam in
eastern Canada. Agriculture, Ecosystems & Environment 136, 125-132.
Cheng, W., 1996. Measurement of rhizosphere respiration and organic matter
decomposition using natural 13C. Plant and Soil 183, 263- 268.
Cheng, W., Johnson, D.W., Fu, S., 2003. Rhizosphere effects on decomposition: controls of
plant species, phenology, and fertilizationRhizosphere Effects on Decomposition. Soil
Science Society of America Journal 67, 1418-1427.
Chenu, C., Plante, A.F., 2006. Clay-sized organo-mineral complexes in a cultivation
chronosequence: revisiting the concept of the ‘primary organo-mineral complex’.
European Journal of Soil Science 57, 596-607.
Chenu, C. and Stotzky, G. 2002. Interactions between microorganisms and soil particles:
an overview. In Interactions Between Soil Particles and Microorganisms. Eds.
Huang, P.M. Bollag, J.M. and Senesi, N. pp. 3-40. Wiley and Sons, New York.
Coleman, K., Jenkinson, D.S., Crocker, G.J., Grace, P.R., Klir, J., Körschens, M.,
Poulton, P.R., Richter, D.D., 1997. Simulating trends in soil organic carbon in long-
term experiments using RothC-26.3. Geoderma 81, 29-44.
Conde, E., Cardenas, M., Ponce-Mendoza, A., Luna-Guido, M.L., Cruz-Mondragón, C.,
Dendooven, L., 2005. The impacts of inorganic nitrogen application on
mineralization of 14C-labelled maize and glucose, and on priming effect in saline
alkaline soil. Soil Biology and Biochemistry 37, 681-691.
Craine, J., Wedin, D., Chapin, F., 1999. Predominance of ecophysiological controls on soil
CO2 flux in a Minnesota grassland. Plant and Soil 207, 77-86.
CHAPTER 1
30
Christensen, B.T., 1996. Carbon in primary and secondary organomineral complexes. In
Structure and Organic Matter storage in Agricultural Soils. Eds. M.R. Carter and
B.A.Stewart, page 97-165. CRC Press, Inc. Boca Raton, FL.
Dalenberg, J.W., Jager, G., 1981. Priming effect of small glucose additions to 14C-
labelled soil. Soil Biology and Biochemistry 13, 219-223.
Dalenberg, J.W., Jager, G., 1989. Priming effect of some organic additions to 14C-
labelled soil. Soil Biology and Biochemistry 21, 443-448.
Davidson, E.A., Janssens, I.A., 2006. Temperature sensitivity of soil carbon
decomposition and feedbacks to climate change. Nature 440, 165-173.
Dijkstra, F.A., Cheng, W., 2007a. Interactions between soil and tree roots accelerate long-
term soil carbon decomposition. Ecology Letters 10, 1046-1053.
Dijkstra, F.A., Cheng, W., 2007b. Moisture modulates rhizosphere effects on C
decomposition in two different soil types. Soil Biology and Biochemistry 39, 2264-
2274.
Dijkstra, F.A., Cheng, W., Johnson, D.W., 2006a. Plant biomass influences rhizosphere
priming effects on soil organic matter decomposition in two differently managed
soils. Soil Biology and Biochemistry 38, 2519-2526.
Dijkstra, F.A., Hobbie, S.E., Reich, P.B., 2006b. Soil Processes Affected by Sixteen
Grassland Species Grown under Different Environmental Conditions. Soil Science
Society of America Journal. 70, 770-777.
Edwards, A.P., Bremner, J.M., 1967. Microaggregates in soils-1. Journal of Soil Science 18,
64-73.
Eliasson, P.E., McMurtrie, R.E., Pepper, D.A., Strömgren, M., Linder, S., Ågren, G.I., 2005.
The response of heterotrophic CO2 flux to soil warming. Global Change Biology 11,
167-181.
CHAPTER 1
31
Elliott, E.T., Aggregate structure and carbon, nitrogen, and phosphorus in native and
cultivated soils. Soil Science Society of America Journal 50, 627-633.
Fagerbakke, K.M., Heldal, M., Norland, S., 1996. Content of carbon, nitrogen, oxygen, sulfur
and phosphorus in native aquatic and cultured bacteria. Aquatic Microbial
Ecology 10, 15-27.
Fontaine, S., Bardoux, G., Abbadie, L., Mariotti, A., 2004a. Carbon input to soil may
decrease soil carbon content. Ecology Letters 7, 314-320.
Fontaine, S., Bardoux, G., Benest, D., Verdier, B., Mariotti, A., Abbadie, L., 2004b.
Mechanisms of the Priming Effect in a Savannah Soil Amended with Cellulose. Soil
Science Society of America Journal 68, 125-131.
Fontaine, S., Barot, S., 2005. Size and functional diversity of microbe populations control
plant persistence and long-term soil carbon accumulation. Ecology Letters 8, 1075-
1087.
Fontaine, S., Barot, S., Barre, P., Bdioui, N., Mary, B., Rumpel, C., 2007. Stability of
organic carbon in deep soil layers controlled by fresh carbon supply. Nature 450,
277-280.
Fontaine, S., Henault, C., Aamor, A., Bdioui, N., Bloor, J.M.G., Maire, V., Mary, B.,
Revaillot, S., Maron, P.A., 2011. Fungi mediate long term sequestration of carbon
and nitrogen in soil through their priming effect. Soil Biology and Biochemistry 43,
86-96.
Fontaine, S., Mariotti, A., Abbadie, L., 2003. The priming effect of organic matter: a
question of microbial competition? Soil Biology and Biochemistry 35, 837-843.
Fu, S., Cheng, W., 2002. Rhizosphere priming effects on the decomposition of soil
organic matter in C4 and C3 grassland soils. Plant and Soil 238, 289-294.
CHAPTER 1
32
Hamer, U., Marschner, B., 2005. Priming effects in different soil types induced by
fructose, alanine, oxalic acid and catechol additions. Soil Biology and
Biochemistry 37, 445-454.
Hamilton, E.W., Frank, D.A., 2001. Can plants stimulate soil microbes and their own
nutrient supply? Evidence from a grazing tolerant grass. Ecology 82, 2397-2402.
Hodge, A., Campbell, C.D., Fitter, A.H., 2001. An arbuscular mycorrhizal fungus
accelerates decomposition and acquires nitrogen directly from organic material.
Nature 413, 297-299.
Hoosbeek, M.R., Lukac, M., van Dam, D., Godbold, D.L., Velthorst, E.J., Biondi, F.A.,
Peressotti, A., Cotrufo, M.F., de Angelis, P., Scarascia-Mugnozza, G., 2004. More
new carbon in the mineral soil of a poplar plantation under Free Air Carbon
Enrichment (POPFACE): Cause of increased priming effect? Global Biogeochemical
Cycles 18, GB1040.
Houghton, R.A., 2005. Aboveground forest biomass and the global carbon balance.
Global Change Biology 11, 945-958.
Hungate, B.A., Van Groenigen, K.-J., Six, J., Jastrow, J.D., Luo, Y., De Graaff, M.-A., Van
Kessel, C., Osenberg, C.W., 2009. Assessing the effect of elevated carbon
dioxide on soil carbon: a comparison of four meta-analyses. Global Change
Biology 15, 2020-2034.
IPCC, 2007. Climate Change 2007 : Synthesis Report. Contributions of working groups I,
II and III to the Fourth Assessment Report of the Intergovernmental Panel on
Climate Change. In, IPCC, Geneva.
Jastrow, J.D., 1996. Soil aggregate formation and the accrual of particulate and mineral-
associated organic matter. Soil Biology and Biochemistry 28, 665-676.
CHAPTER 1
33
Jastrow, J.D., Michael Miller, R., Matamala, R., Norby, R.J., Boutton, T.W., Rice, C.W.,
Owensby, C.E., 2005. Elevated atmospheric carbon dioxide increases soil carbon.
Global Change Biology 11, 2057-2064.
Jenkinson, D.S., Fox, R.H., Rayner, J.H., 1985. Interactions between fertilizer nitrogen and
soil nitrogen—the so-called ‘priming’ effect. Journal of Soil Science 36, 425-444.
Jobbagy, E.G., Jackson, R.B., 2000. The vertical distribution of soil organic carbon and its
relation to climate and vegetation. Ecological Applications 10, 423-436.
Kirschbaum, M.U.F., 1995. The temperature dependence of soil organic matter
decomposition, and the effect of global warming on soil organic C storage. Soil
Biology and Biochemistry 27, 753-760.
Kirschbaum, M.U.F., 2004. Soil respiration under prolonged soil warming: are rate
reductions caused by acclimation or substrate loss? Global Change Biology 10, 1870-
1877.
Klumpp, K., Fontaine, S., Attard, E., Le Roux, X., Gleixner, G., Soussana, J.-F., 2009.
Grazing triggers soil carbon loss by altering plant roots and their control on soil
microbial community. Journal of Ecology 97, 876-885.
Knorr, W., Prentice, I.C., House, J.I., Holland, E.A., 2005. Long-term sensitivity of soil
carbon turnover to warming. Nature 433, 298-301.
Kuzyakov, Y., Cheng, W., 2001. Photosynthesis controls of rhizosphere respiration and
organic matter decomposition. Soil Bilogy & Biochemestry 32, 1915-1925.
Kuzyakov, Y., Ehrensberger, H., Stahr, K., 2001. Carbon partitioning and below-ground
translocation by Lolium perenne. Soil Biology & Biochemistry 33, 61-74.
Kuzyakov, Y., 2010. Priming effects: Interactions between living and dead organic matter.
Soil Biology and Biochemistry 42, 1363-1371.
Löhnis, F., 1926. Nitrogen Availability of Green Manures. Soil Science 22, 253-290.
CHAPTER 1
34
Luo, Y., Wan, S., Hui, D., Wallace, L.L., 2001. Acclimatization of soil respiration to
warming in a tall grass prairie. Nature 413, 622-625.
Lützow, M.v., Kögel-Knabner, I., Ekschmitt, K., Matzner, E., Guggenberger, G., Marschner,
B., Flessa, H., 2006. Stabilization of organic matter in temperate soils: mechanisms
and their relevance under different soil conditions – a review. European Journal of
Soil Science 57, 426-445.
Marx, M., Buegger, F., Gattinger, A., Marschner, B., Zsolnay, Á., Munch, J.C., 2007.
Determination of the fate of 13C labelled maize and wheat rhizodeposit-C in two
agricultural soils in a greenhouse experiment under 13C-CO2-enriched atmosphere.
Soil Biology and Biochemistry 39, 3043-3055.
Melillo, J.M., Steudler, P.A., Aber, J.D., Newkirk, K., Lux, H., Bowles, F.P., Catricala, C.,
Magill, A., Ahrens, T., Morrisseau, S., 2002. Soil warming and carbon-cycle
feedbacks to the climate system. Science 298, 2173-2176.
Merckx, R., den Hartog, A., van Veen, J.A., 1985. Turnover of root-derived material and
related microbial biomass formation in soils of different texture. Soil Biology and
Biochemistry 17, 565-569.
MEA, Millennium Ecosystem Assessment-Nutrient Cycling. World Resource Institute,
Washington DC (2005).
Nottingham, A.T., Griffiths, H., Chamberlain, P.M., Stott, A.W., Tanner, E.V.J., 2009. Soil
priming by sugar and leaf-litter substrates: A link to microbial groups. Applied Soil
Ecology 42, 183-190.
Otten, W., Hall, D., Harris, K., Ritz, K., Young, I.M., Gilligan, C.A., 2001. Soil physics,
fungal epidemiology and the spread of Rhizoctonia solani. New Phytologist 151,
459-468.
CHAPTER 1
35
Parton, W.J., Schimel, D.S., Cole, C.V., Ojima, D.S., 1987. Analysis of factors controlling
soil organic-matter levels in great-plains grasslands. Soil Science Society of
America Journal 51, 1173-1179.
Petit, J.R., Jouzel, J., Raynaud, D., Barkov, N.I., Barnola, J.M., Basile, I., Bender, M.,
Chappellaz, J., Davis, M., Delaygue, G., Delmotte, M., Kotlyakov, V.M.,
Legrand, M., Lipenkov, V.Y., Lorius, C., Pepin, L., Ritz, C., Saltzman, E.,
Stievenard, M., 1999. Climate and atmospheric history of the past 420,000 years
from the Vostok ice core, Antarctica. Nature 399, 429-436.
Phillips, R.P., Finzi, A.C., Bernhardt, E.S., 2011. Enhanced root exudation induces
microbial feedbacks to N cycling in a pine forest under long-term CO2 fumigation.
Ecology Letters 14, 187-194.
Reich, P.B., Hobbie, S.E., Lee, T., Ellsworth, D.S., West, J.B., Tilman, D., Knops,
J.M.H., Naeem, S., Trost, J., 2006. Nitrogen limitation constrains sustainability of
ecosystem response to CO2. Nature 440, 922-925.
Schlesinger, W.H., 1990. Evidence from chronosequence studies for a low carbon-
storage potential of soils. Nature 348, 232-234.
Schlesinger, W.H. 1997. Biogeochemistry: An Analysis of Global Change. Academic Press,
New York, ed. 2)
Schlesinger, W.H., Andrews, J.A., 2000. Soil respiration and the global carbon cycle.
Biogeochemistry 48, 7-20.
Siegenthaler, U., Stocker, T.F., Monnin, E., Lüthi, D., Schwander, J., Stauffer, B.,
Raynaud, D., Barnola, J.-M., Fischer, H., Masson-Delmotte, V.r., Jouzel, J., 2005.
Stable Carbon Cycle–Climate Relationship During the Late Pleistocene. Science 310,
1313-1317.
CHAPTER 1
36
Six, J., Conant, R.T., Paul, E.A., Paustian, K., 2002. Stabilization mechanisms of soil
organic matter: Implications for C-saturation of soils. Plant and Soil 241, 155-176.
Sorensen, L.H., 1972. Stabilization of newly formed amino acid metabolites in soil by clay
minerals. Soil Science 114, 5-11.
Sterner, W.R. and Elser J.J. 2002. Ecological Stoichiometry: The Biology of Elements From
Molecules to the Biosphere. Princeton University Press, 41, William Street,
Princeton, New Jersey.
Stevenson, F.J., 1994. Humus Chemistry: Genesis, Composition, Reactions. John Wiley
& Sons, New York.
Syers, J.K., Adams, J.A., Walker, T.W., 1970. Accumulation of organic matter in a
chronosequences of soils developed on wind-blown sand in New Zealand. Journal of
Soil Science 21, 146- 153.
van Groenigen, K.-J., Six, J., Hungate, B.A., de Graaff, M.-A., van Breemen, N., van
Kessel, C., 2006. Element interactions limit soil carbon storage. Proceedings of the
National Academy of Sciences 103, 6571-6574.
Waldrop, M.P., Firestone, M.K., 2004. Altered utilization patterns of young and old soil
C by microorganisms caused by temperature shifts and N additions.
Biogeochemistry 67, 235-248.
Wutzler, T., Reichstein, M., 2008. Co-limitation of decomposition by substrate and
decomposers - a comparison of model formulations. Biogeosciences 5, 749-759.
Zhu, B., Cheng, W., 2011. Rhizosphere priming effect increases the temperature sensitivity of
soil organic matter decomposition. Global Change Biology 17, 2172-2183.
Chapter 2
37
CHAPTER 2
Plant clipping decelerates the mineralization of recalcitrant soil
organic matter under multiple grassland species
Note: This article has been accepted in Soil Biology & Biochemistry.
Chapter 2
38
PLANT CLIPPING DECELERATES THE MINERALIZATION
OF RECALCITRANT SOIL ORGANIC MATTER UNDER
MULTIPLE GRASSLAND SPECIES
Tanvir Shahzad a*, Claire Chenu b, Cédric Repinçay c, Christian Mougin c, Jean-Luc Ollier a,
and Sébastien Fontaine a
a INRA, UR 874 Unité de Recherche sur l’Ecosystème prairial, 234-Avenue du Brézet F-
63100 Clermont Ferrand, France.
b AgroParisTech, UMR 7618 Bioemco, Bâtiment EGER, 78850 Thiverval Grignon, France
c INRA, UR 251 PESSAC (Physicochimie et écotoxicologie des sols d’agrosystèmes
contaminés), Route de Saint-Cyr, 78026 Versailles, France
*Author for correspondence
Tanvir SHAHZAD
Email: [email protected]
Chapter 2
39
I. Summary
Grazing or mowing is central to the management of grasslands and may alter mineralization
of soil organic matter (SOM) and soil carbon (C) stocks. Some studies have shown grazing-
induced reductions in total soil respiration suggesting decreases in SOM mineralization.
However, it has also been suggested that grazing may increase SOM mineralization, based on
observations of increased soluble C, microbial biomass and mineral nitrogen (N) in soil after
clipping. No studies to date have directly measured SOM mineralization to determine the
effects of grazing on SOM mineralization and the underlying mechanisms. We examined the
effect of clipping on soil-derived CO2 efflux (Rs) for six gramineae and one leguminous
species typical of temperate grasslands. Continuous 13C labeling of monocultures coupled
with a new method of directly measuring Rs and the rhizosphere priming effect (RPE i.e. Rs
from planted soils minus respiration from bare soils) in perennial herbaceous plants was used.
For a model species, Lolium perenne, the clipping effects on aboveground biomass
production, mineral N and soluble C in soil, microbial biomass and microbial community
composition were also quantified. We found that clipping decreased the RPE and Rs (SOM
mineralization) within 48 hours for all the studied species. For Lolium perenne, this reduced
SOM mineralization persisted for one month after clipping. Moreover, clipping reduced the
production of aboveground biomass and the total N assimilated by the plants. These changes
increased N availability in soil and induced shifts in the soil microbial community structure
favoring gram positive bacteria (i16:0) over saprophytic fungi (18:2�6). The strong
correlation of fungi (18:2�6) with Rs across treatments suggests that saprophytic fungi play a
key role in SOM mineralization. In conclusion, our study shows that plant clipping
decelerates SOM mineralization and induces shifts in microbial community structure, most
likely as an indirect effect of clipping on plant N uptake.
Keywords:

Chapter 2
40
Priming effect, grazing, soil respiration, 13C labeling, PLFA, temperate grassland, microbial
community composition.
Chapter 2
41
II. Introduction
Grassland ecosystems contain almost 12% of earth’s organic matter (Schlesinger 1977), 90%
of which is estimated to be concentrated belowground in the form of roots and soil organic
matter (SOM) (Parton et al., 1993). Grasslands are considered potential carbon (C) sinks in
the context of increasing CO2 levels in the atmosphere provided that they are properly
managed (Lal et al., 2007; Li et al., 2008). Managed grasslands cover about 20% of the global
terrestrial ice-free surface. Grazing or mowing is central to their management and has been
reported to modify plant-litter decomposition (Bardgett et al., 1998; Reeder and Schuman
2002; Klumpp et al., 2009), nutrient cycling (Bardgett et al., 1998; Mikola and Kytoviita
2002) and biodiversity of plants (Collins et al., 1998; Ward et al., 2007) and soil decomposers
(Bardgett et al., 2001).
There is disagreement on how plant tissue removal via grazing (or any practice
analogous to it like clipping, mowing or defoliation) modifies soil C stocks and fluxes. For
example, it has been reported that mowing reduces total soil CO2 efflux (CO2 as a result of
root respiration and mineralization of plant litter and recalcitrant SOM) by 20-50% despite
mowing-induced increases in soil temperature (Bremer et al., 1998; Wan and Luo 2003; Bahn
et al., 2006). It has been suggested that this decrease in CO2 efflux is due to decreased canopy
photosynthesis and reduced C supply from aboveground plant parts to roots, mycorrhizae and
rhizosphere microorganisms (Bremer et al., 1998; Craine et al., 1999; Bahn et al., 2006). On
the other hand, it has been shown that mowing/defoliation can result in increased soluble C,
microbial biomass and nitrogen availability in soil (Hamilton and Frank 2001; Henry et al.,
2008). Based on these results, Hamilton and Frank (2001) suggested that grazing triggers
plant exudation thereby stimulating microbial mineralization of SOM and liberating mineral
nitrogen. Although grazing has been shown to accelerate the mineralization of plant litter
(Klumpp et al., 2009), increased microbial biomass and availability of soluble C does not
Chapter 2
42
necessarily imply concurrent increases in mineralization of recalcitrant SOM because
different microbial groups are specialized in mineralizing different types of organic
substrates. The acceleration in mineralization of recalcitrant SOM should only occur if those
microbes that specialize in this process are stimulated in the event of increased labile C
availability (Fontaine et al., 2003). Thus, the effect of grazing on the mineralization of
recalcitrant SOM remains uncertain.
The supply of fresh energy-rich C to soil (e.g. under living roots) stimulates SOM
mineralization and soil-derived CO2 efflux (Rs) (Broadbent 1947; Bingeman et al., 1953; Wu
et al., 1993; Cheng et al., 2003)- a process termed the rhizosphere priming effect (RPE). As a
result, fresh C supply by plants and RPE are generally positively linked (Dijkstra and Cheng
2007). For example, increased rates of fresh C inputs in soil by plants exposed to elevated
atmospheric CO2 levels have been shown to accelerate SOM mineralization compared with
plant-soil systems under ambient CO2 (Drake et al., 2011; Phillips et al., 2011). In order to
quantify the RPE induced by plants, current methods are based on a physical separation of
soil and plant compartments during the measurement of respiration fluxes. This separation
allows the measurement of CO2 released from the soil compartment and avoids any plant
uptake of soil-originated CO2 through photosynthesis. As a consequence of this separation,
the current method is only applicable to single-stem plant and trees, and the RPE induced by
perennial herbaceous plants, which produce numerous small-statured tillers, has not yet been
quantified. Developing a new method for quantifying the RPE under such plants is critical to
determine grazing effects on recalcitrant SOM mineralization.
In addition to impacts on microbial biomass, grazing has been shown to cause changes
in microbial community composition. For example, an increasing intensity of grazing has
been shown to decrease the fungi: bacteria ratio in grasslands (Bardgett et al., 2001; Klumpp
et al., 2009). This microbial shift can result in important biogeochemical changes because soil
Chapter 2
43
microbial groups have distinct preferences in terms of organic matter sources (van der
Heijden et al., 2008; De Deyn et al., 2008). For example, the decrease in abundance of fungi
relative to bacteria due to an intensified grazing regime has been postulated to cause increased
rates of nutrient cycling and decreased retention of C and N in the litter pool (Bardgett et al.,
2005). However, this decrease in fungal abundance could decelerate SOM mineralization
since fungi have been identified as actors of the priming effect in soil incubation studies
(Fontaine et al., 2011). Linking grazing-induced changes in SOM mineralization with
microbial community composition could verify the key role of fungi in SOM mineralization
in a real plant-soil system.
Here we use Lolium perenne as a model species to test if plant clipping causes any
change in soil-derived CO2 efflux (i.e. SOM mineralization) in the short term (within 48
hours) and in the longer term (after one month). Continuous 13C labelling of plants was used
to distinguish soil-derived (Rs) and plant-derived respiration (Rp). The rhizosphere priming
effect was calculated as the difference between Rs from planted soils and from control bare
soil. As the separation of soil and plant compartments is not possible for perennial herbaceous
plants, we developed a new method for quantifying the RPE that avoids any plant uptake of
soil-originated CO2 through photosynthesis. To stop photosynthesis, plants were placed in
sealed respiration chambers in the absence of light during respiration measurements.
Phospholipid-fatty-acid (PLFA) analyses were used to determine changes in microbial
community composition induced by clipping. The possible generalization of clipping effects
on SOM mineralization was tested for six gramineae and one legume species common to
temperate grasslands. This study focuses on the short-term effects of grazing-induced changes
in plant physiology on SOM mineralization. The effects of modified plant community
composition and soil processes after years of grazing management (Ward et al., 2007) is
outside of the scope of the present work.
Chapter 2
44
III. Materials & Methods:
III.1. Soil sampling and plant sowing
The soil used in this experiment was sampled from an upland grassland located in the
environmental research observatory (SOERE) established by the French National Institute for
Agricultural Research (INRA) in central France in 2003 (Theix, 45°43'N, 03°01'E). The local
climate is semi-continental, with a mean annual temperature of 9°C and an average annual
rainfall of 760mm. Prior to 2003; the site was managed as permanent grassland for more than
50 years (Fontaine et al., 2007). The soil is a drained Cambisol developed from granitic rock.
For sampling, the upper 10 cm of the soil profile was removed because it is rich in fresh C.
Given that respiration of this pre-existing fresh C cannot be separated from that of recalcitrant
soil carbon and that the presence of plants can also modify fresh C decomposition (Personeni
and Loiseau 2004), it is advisable to use a soil with a lower proportion of fresh C in order to
determine the effects of plants on recalcitrant SOM. Thus, soil was taken from 10-40 cm soil
profile. The fresh soil was sieved at 5 mm and used to fill PVC pots (40 cm high, 9.8 cm
internal diameter, content 2.87 kg of dry soil). The soil properties were: pH 6.1±0.21; clay
(%) 27±1.3; soil organic carbon (g kg-1 soil) 26.7±0.37 and soil organic carbon � 13C (‰) -
26.7±0.02. In April 2009, eight pots were sown with Lolium perenne (Lp) at a density of 2000
seeds m-2 and four pots were kept bare as control soil (S). Automated drip irrigation methods
were used for water supply and all pots were water-saturated whenever the soil moisture
decreased to 75±5% of the soil field capacity. For better handling of the plants in the
mesocosm, plants were clipped (non-experimental clipping) 122 days after germination.
After non-experimental clipping, all planted pots were fertilized with nitrogen
(NH4NO3, 70 kg N ha-1), phosphorus (KH2PO4, 100 kg P2O5 ha-1) and potassium (KNO3, 200
kg K2O ha-1). The control soils (S) were not fertilized. Plants were allowed to fully develop
their root system during 190 days before the experimental clipping was administered. Four
Chapter 2
45
planted pots were clipped 5 cm above the soil surface (clipped treatment, CP). Four planted
pots were left intact as an unclipped plant control (P). Carbon dioxide and its isotopic
composition released by the plant-soil system were measured for all treatments (S, P and CP)
immediately and 30 days after experimental clipping. The effect of clipping on SOM
mineralization was determined by comparing respiration from P and CP. Plant biomass, plant
C and N content, soluble soil organic C, mineral nitrogen, microbial biomass and PLFA were
measured following destructive harvesting of pots 30 days after clipping.
To determine whether clipping has similar effect on SOM mineralization across
grassland, monocultures of six species namely Trisetum flavescens (Tf), Poa trivialis (Pt),
Festuca arundinacea (Fa), Bromus erectus (Be), Brachypodium pinnatum (Bp) and Trifolium
repens (Tr) were also established. These species were sown and cultivated in exactly the same
conditions as the model species Lolium perenne. However, the effect of clipping on SOM
mineralization was determined by measuring soil respiration in the same pot before and 24
hours after plant clipping. This approach was adopted to reduce the variation.
III.2. Labelling system & mesocosm
The experimental set-up used is shown in figure 1 (Supplementary information). It consisted
of two parts: a labelled-air production system and a mesocosm containing planted and bare-
soil pots. Details on production of labeled air are available in Supplementary Information.
Briefly, ambient air was taken into the system by a compressor and scrubbed by a molecular
sieve, removing CO2 , H2O and all other particles. The decarbonised air was then mixed with
13C-depleted CO2 of fossil-fuel origin (� 13C: -38.55 ± 0.07 ‰) and passed through a
humidifier (1m3:1m2 cross corrugated cellulose pads). The water flow in the humidifier was
regulated such that the relative humidity of labeled air reaching the mesocosm was
maintained around 50-60%. This moistened air had a CO2 concentration of 400 ± 20 ppm
before entering the mesocosm.
Chapter 2
46
The mesocosm comprised an iron box with a plexiglass screen mounted on it
(mesocosm dimensions: 350 × 140 × 140 cm). The advantage of using plexiglass is that it
does not change the wavelength of sunlight entering the mesocosm. All planted and bare-soil
pots were placed in mesocosm, and continuously ventilated with air produced by the labeling
system. The volume of air in the mesocosm was renewed twice a minute so that the
unlabelled air respired by soil would not change the labeling signature of air present in the
mesocosm. We verified with a smoke apparatus that turbulences in the mesocosm were
sufficient to ensure complete mixing of air. The ventilation of the mesocosm also maintained
a temperature difference of 1-2°C between the inside and the outside of the mesocosm.
III.3. Respiration measurement
All pots with plants were put back in the mesocosm for 24 hours after clipping to permit the
clipping treatment to take effect on the soil processes through changes in plant photosynthetic
and transpiration rates. Pots were then taken out of the mesocosm and sealed in air-tight PVC
chambers (height 100 cm, diameter 15 cm) for 24 hrs. The absence of light stopped
photosynthesis and stopped the plant absorption of soil-respired CO2. Carbon dioxide released
by the plant-soil system was trapped in 200 ml of 1M NaOH, soda lime traps placed in the
respiration chambers. By conducting additional measurements in the respiration chambers
using gas chromatography, we established that more than 99% of the CO2 respired by the pot
(soil + plant) over 24 hours was trapped successfully in the NaOH solution. Total carbon
trapped in NaOH was measured with a total inorganic-C analyzer. The 13C abundance of
trapped CO2 was analyzed with an Isotope-Ratio Mass Spectrometer (IRMS) after
precipitating the carbonates with excess BaCl2 and filtration. The soil-derived CO2-C (Rs, mg
CO2-C kg-1 dry soil day-1) was separated from plant-derived CO2-C (Rp, mg CO2-C kg-1 dry
soil day-1) using mass balance equations:
Chapter 2
47
131313tps ARtARpARs
RtRpRs
×=×+×
=+
where As13 is the 13C abundance (dimensionless) of soil carbon, Ap
13 the 13C abundance of
plant, Rt the total CO2 emitted by the pot (soil plus plant) and At13 its 13C abundance. Rp
corresponds to CO2-C coming out from whole plant respiration, mycorrhizae and microbial
respiration of rhizodeposits and plant litter.
The rhizosphere priming effect (RPE, mg CO2-C kg-1 dry soil day-1) induced by plants was
calculated as:
RPE = (Rs, planted soil) – (Rs, control soil)
III.4. Soil and plant analyses
Plant roots were washed to remove soil attached to them. Roots and shoots were then dried
for 48h at 60°C and finely ground. Dried plant material was analyzed with an elemental
analyzer attached to an Isotope-Ratio Mass Spectrometer (IRMS) for total C and N content
and 13C abundance. In order to quantify soil mineral nitrogen, 10 g fresh soil was extracted
with 40 ml of 1M KCl for 45 minutes. The extract was filtered and analyzed by continuous
flow colorimetry. Microbial biomass and the microbial C/N ratio were measured by the
fumigation-extraction technique (Vance et al, 1987). The extraction of soluble C with K2SO4
(30mM) from soil before the fumigation was used to determine soluble organic carbon in soil.
III.5. PLFA measurements
At the end of the experiment, soil from each pot was removed and a subsample of
homogenized soil was sieved at 2 mm to remove remaining plant materials before freeze-
drying. Phospholipidic fatty acids (PLFAs) were extracted using a modified method of Bligh
and Dyer (1959) (Frostegård et al. 1991). Briefly, fatty acids were extracted in a single-phase
mixture of chloroform methanol: citrate buffer (1: 2:0,8, v:v:v, pH 4,0) shaken at 300 rpm for
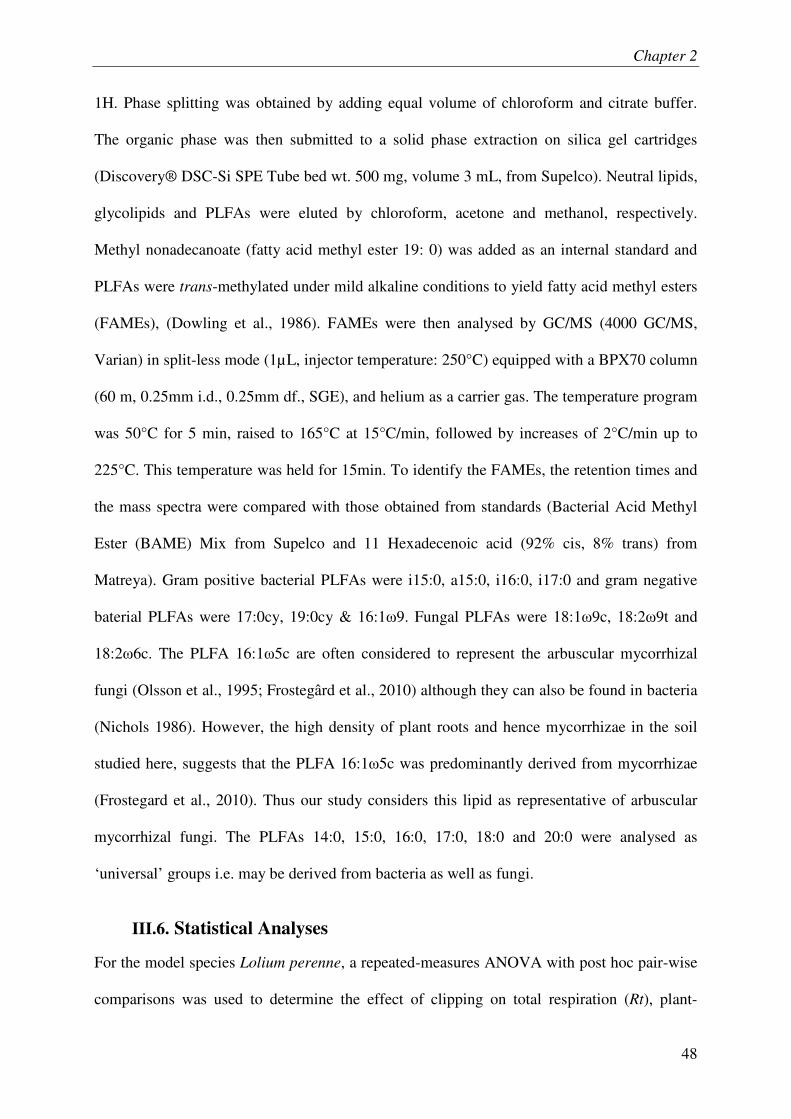
Chapter 2
48
1H. Phase splitting was obtained by adding equal volume of chloroform and citrate buffer.
The organic phase was then submitted to a solid phase extraction on silica gel cartridges
(Discovery® DSC-Si SPE Tube bed wt. 500 mg, volume 3 mL, from Supelco). Neutral lipids,
glycolipids and PLFAs were eluted by chloroform, acetone and methanol, respectively.
Methyl nonadecanoate (fatty acid methyl ester 19: 0) was added as an internal standard and
PLFAs were trans-methylated under mild alkaline conditions to yield fatty acid methyl esters
(FAMEs), (Dowling et al., 1986). FAMEs were then analysed by GC/MS (4000 GC/MS,
Varian) in split-less mode (1µL, injector temperature: 250°C) equipped with a BPX70 column
(60 m, 0.25mm i.d., 0.25mm df., SGE), and helium as a carrier gas. The temperature program
was 50°C for 5 min, raised to 165°C at 15°C/min, followed by increases of 2°C/min up to
225°C. This temperature was held for 15min. To identify the FAMEs, the retention times and
the mass spectra were compared with those obtained from standards (Bacterial Acid Methyl
Ester (BAME) Mix from Supelco and 11 Hexadecenoic acid (92% cis, 8% trans) from
Matreya). Gram positive bacterial PLFAs were i15:0, a15:0, i16:0, i17:0 and gram negative
baterial PLFAs were 17:0cy, 19:0cy & 16:1�9. Fungal PLFAs were 18:1�9c, 18:2�9t and
18:2�6c. The PLFA 16:1�5c are often considered to represent the arbuscular mycorrhizal
fungi (Olsson et al., 1995; Frostegârd et al., 2010) although they can also be found in bacteria
(Nichols 1986). However, the high density of plant roots and hence mycorrhizae in the soil
studied here, suggests that the PLFA 16:1�5c was predominantly derived from mycorrhizae
(Frostegard et al., 2010). Thus our study considers this lipid as representative of arbuscular
mycorrhizal fungi. The PLFAs 14:0, 15:0, 16:0, 17:0, 18:0 and 20:0 were analysed as
‘universal’ groups i.e. may be derived from bacteria as well as fungi.
III.6. Statistical Analyses
For the model species Lolium perenne, a repeated-measures ANOVA with post hoc pair-wise
comparisons was used to determine the effect of clipping on total respiration (Rt), plant-
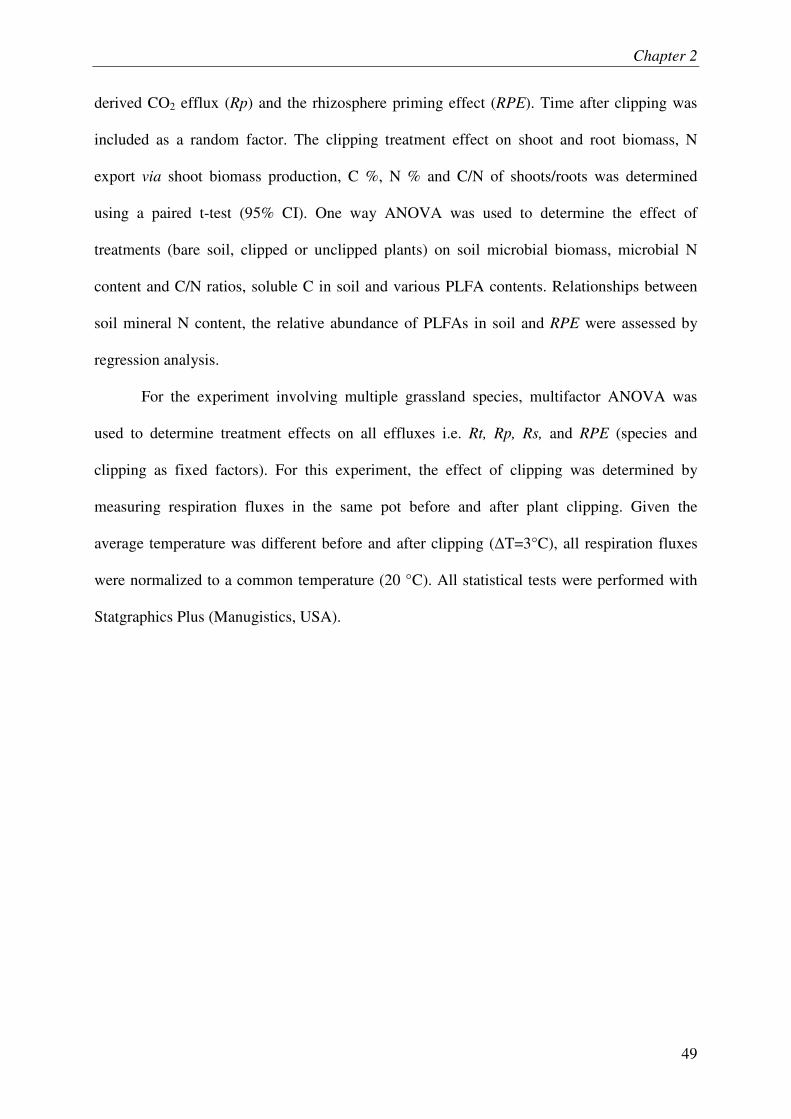
Chapter 2
49
derived CO2 efflux (Rp) and the rhizosphere priming effect (RPE). Time after clipping was
included as a random factor. The clipping treatment effect on shoot and root biomass, N
export via shoot biomass production, C %, N % and C/N of shoots/roots was determined
using a paired t-test (95% CI). One way ANOVA was used to determine the effect of
treatments (bare soil, clipped or unclipped plants) on soil microbial biomass, microbial N
content and C/N ratios, soluble C in soil and various PLFA contents. Relationships between
soil mineral N content, the relative abundance of PLFAs in soil and RPE were assessed by
regression analysis.
For the experiment involving multiple grassland species, multifactor ANOVA was
used to determine treatment effects on all effluxes i.e. Rt, Rp, Rs, and RPE (species and
clipping as fixed factors). For this experiment, the effect of clipping was determined by
measuring respiration fluxes in the same pot before and after plant clipping. Given the
average temperature was different before and after clipping (�T=3°C), all respiration fluxes
were normalized to a common temperature (20 °C). All statistical tests were performed with
Statgraphics Plus (Manugistics, USA).
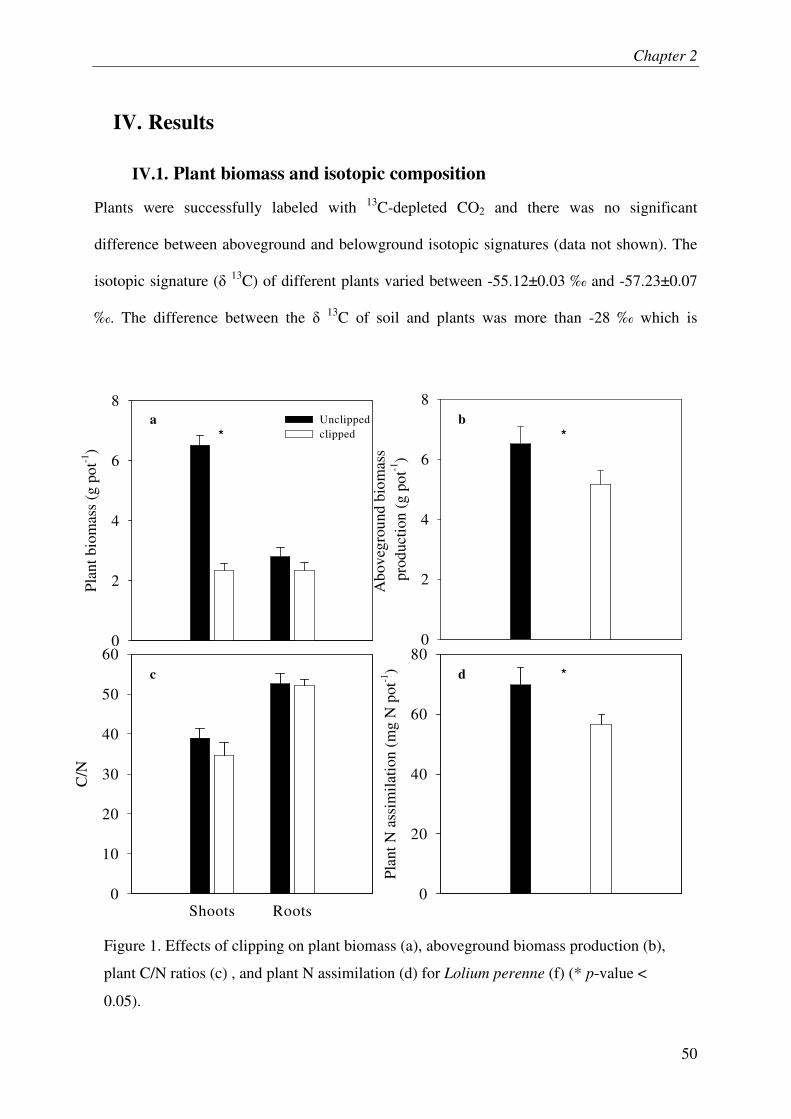
Chapter 2
50
IV. Results
IV.1. Plant biomass and isotopic composition
Plants were successfully labeled with 13C-depleted CO2 and there was no significant
difference between aboveground and belowground isotopic signatures (data not shown). The
isotopic signature (� 13C) of different plants varied between -55.12±0.03 ‰ and -57.23±0.07
‰. The difference between the � 13C of soil and plants was more than -28 ‰ which is
Shoots Roots
C/N
0
10
20
30
40
50
60
Plan
t bio
mas
s (g
pot
-1)
0
2
4
6
8Unclipped clipped
Plan
t N a
ssim
ilatio
n (m
g N
pot
-1)
0
20
40
60
80
Abo
vegr
ound
bio
mas
s pr
oduc
tion
(g p
ot-1
)
0
2
4
6
8a b
c d
*
*
*
Figure 1. Effects of clipping on plant biomass (a), aboveground biomass production (b),
plant C/N ratios (c) , and plant N assimilation (d) for Lolium perenne (f) (* p-value <
0.05).
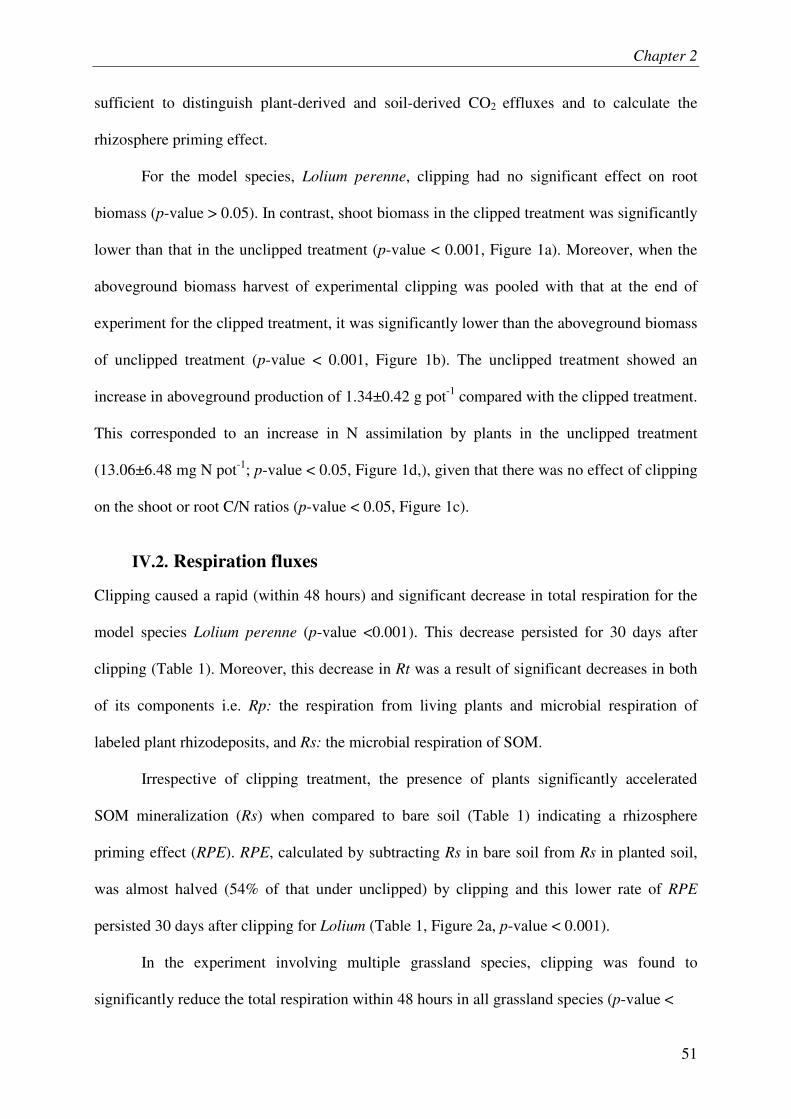
Chapter 2
51
sufficient to distinguish plant-derived and soil-derived CO2 effluxes and to calculate the
rhizosphere priming effect.
For the model species, Lolium perenne, clipping had no significant effect on root
biomass (p-value > 0.05). In contrast, shoot biomass in the clipped treatment was significantly
lower than that in the unclipped treatment (p-value < 0.001, Figure 1a). Moreover, when the
aboveground biomass harvest of experimental clipping was pooled with that at the end of
experiment for the clipped treatment, it was significantly lower than the aboveground biomass
of unclipped treatment (p-value < 0.001, Figure 1b). The unclipped treatment showed an
increase in aboveground production of 1.34±0.42 g pot-1 compared with the clipped treatment.
This corresponded to an increase in N assimilation by plants in the unclipped treatment
(13.06±6.48 mg N pot-1; p-value < 0.05, Figure 1d,), given that there was no effect of clipping
on the shoot or root C/N ratios (p-value < 0.05, Figure 1c).
IV.2. Respiration fluxes
Clipping caused a rapid (within 48 hours) and significant decrease in total respiration for the
model species Lolium perenne (p-value <0.001). This decrease persisted for 30 days after
clipping (Table 1). Moreover, this decrease in Rt was a result of significant decreases in both
of its components i.e. Rp: the respiration from living plants and microbial respiration of
labeled plant rhizodeposits, and Rs: the microbial respiration of SOM.
Irrespective of clipping treatment, the presence of plants significantly accelerated
SOM mineralization (Rs) when compared to bare soil (Table 1) indicating a rhizosphere
priming effect (RPE). RPE, calculated by subtracting Rs in bare soil from Rs in planted soil,
was almost halved (54% of that under unclipped) by clipping and this lower rate of RPE
persisted 30 days after clipping for Lolium (Table 1, Figure 2a, p-value < 0.001).
In the experiment involving multiple grassland species, clipping was found to
significantly reduce the total respiration within 48 hours in all grassland species (p-value <
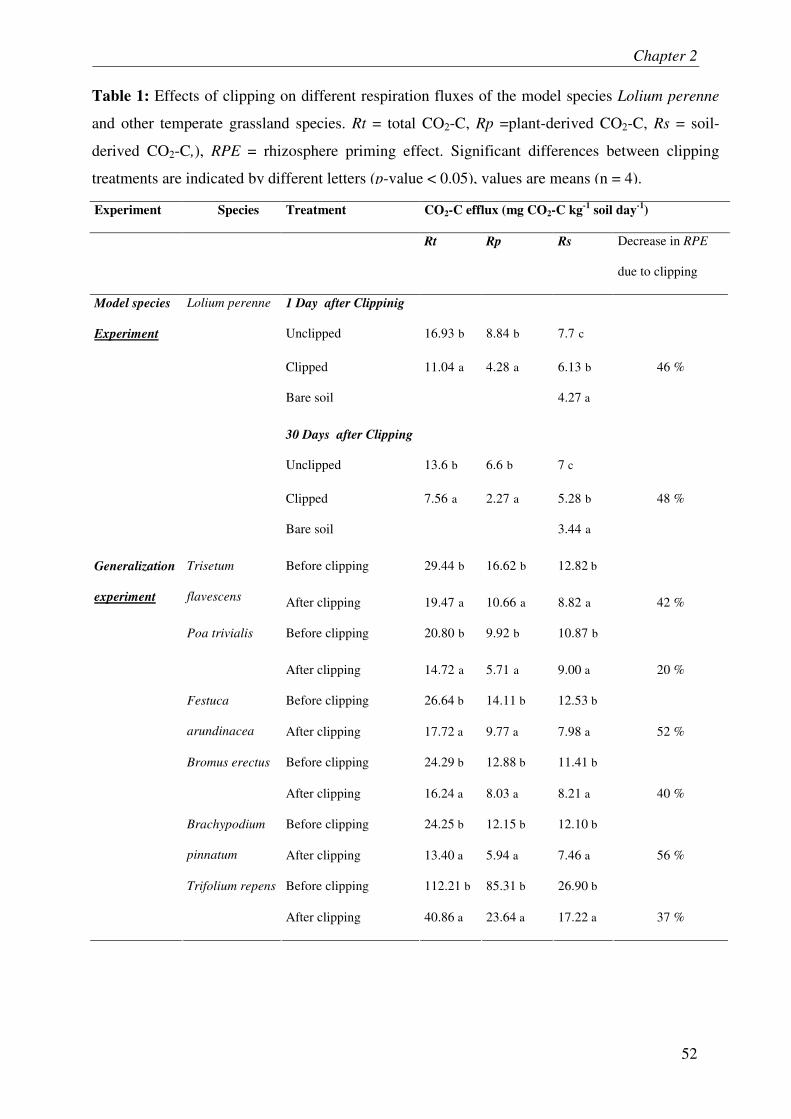
Chapter 2
52
Experiment Species Treatment CO2-C efflux (mg CO2-C kg-1 soil day-1)
Rt Rp Rs Decrease in RPE
due to clipping
1 Day after Clippinig
Unclipped
16.93 b
8.84 b
7.7 c
Clipped 11.04 a 4.28 a 6.13 b 46 %
Bare soil 4.27 a
30 Days after Clipping
Unclipped
13.6 b
6.6 b
7 c
Clipped 7.56 a 2.27 a 5.28 b 48 %
Model species
Experiment
Lolium perenne
Bare soil 3.44 a
Before clipping 29.44 b 16.62 b 12.82 b Trisetum
flavescens After clipping 19.47 a 10.66 a 8.82 a 42 %
Before clipping 20.80 b 9.92 b 10.87 b Poa trivialis
After clipping 14.72 a 5.71 a 9.00 a 20 %
Before clipping 26.64 b 14.11 b 12.53 b Festuca
arundinacea After clipping 17.72 a 9.77 a 7.98 a 52 %
Before clipping 24.29 b 12.88 b 11.41 b Bromus erectus
After clipping 16.24 a 8.03 a 8.21 a 40 %
Before clipping 24.25 b 12.15 b 12.10 b Brachypodium
pinnatum After clipping 13.40 a 5.94 a 7.46 a 56 %
Before clipping 112.21 b 85.31 b 26.90 b
Generalization
experiment
Trifolium repens
After clipping 40.86 a 23.64 a 17.22 a 37 %
Table 1: Effects of clipping on different respiration fluxes of the model species Lolium perenne
and other temperate grassland species. Rt = total CO2-C, Rp =plant-derived CO2-C, Rs = soil-
derived CO2-C,), RPE = rhizosphere priming effect. Significant differences between clipping
treatments are indicated by different letters (p-value < 0.05), values are means (n = 4).
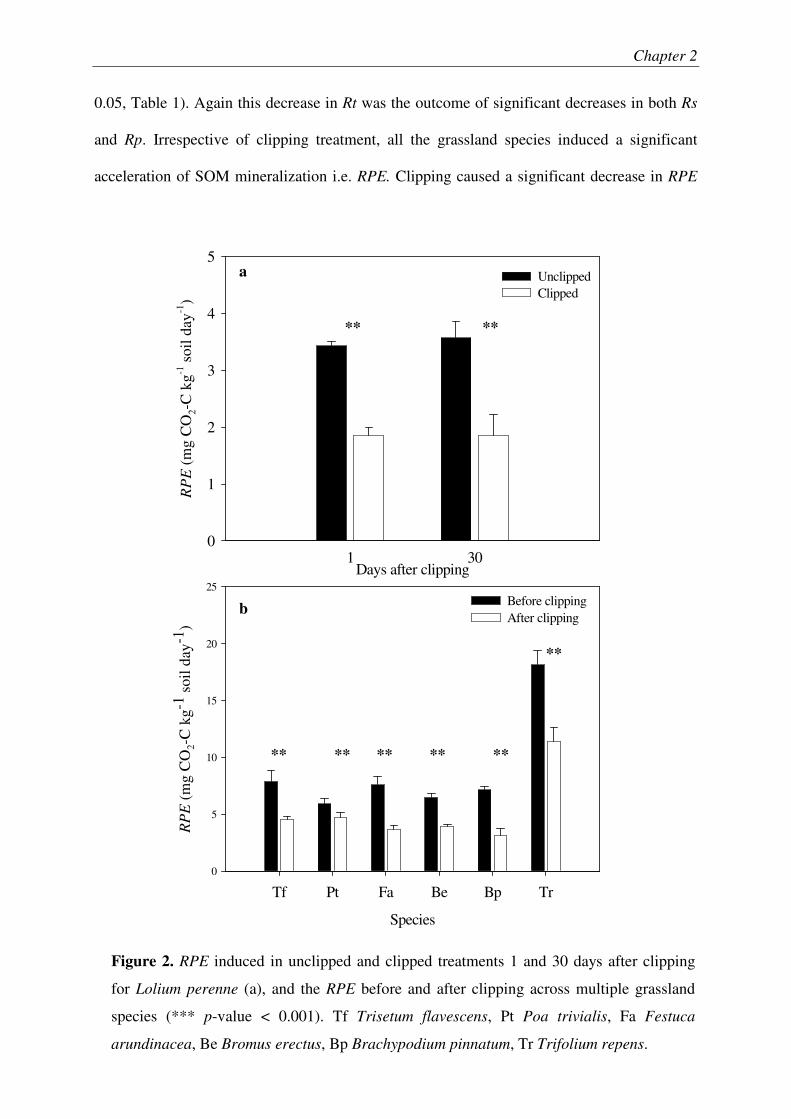
Chapter 2
53
Figure 2. RPE induced in unclipped and clipped treatments 1 and 30 days after clipping
for Lolium perenne (a), and the RPE before and after clipping across multiple grassland
species (*** p-value < 0.001). Tf Trisetum flavescens, Pt Poa trivialis, Fa Festuca
arundinacea, Be Bromus erectus, Bp Brachypodium pinnatum, Tr Trifolium repens.
0.05, Table 1). Again this decrease in Rt was the outcome of significant decreases in both Rs
and Rp. Irrespective of clipping treatment, all the grassland species induced a significant
acceleration of SOM mineralization i.e. RPE. Clipping caused a significant decrease in RPE
Species
Tf Pt Fa Be Bp Tr
RP
E (
mg
CO
2-C
kg-1
soi
l day
-1)
0
5
10
15
20
25Before clippingAfter clipping
Days after clipping1 30
RP
E (
mg
CO
2-C
kg-1
soi
l day
-1)
0
1
2
3
4
5UnclippedClipped
a
b
** **
** ** ** ** **
**
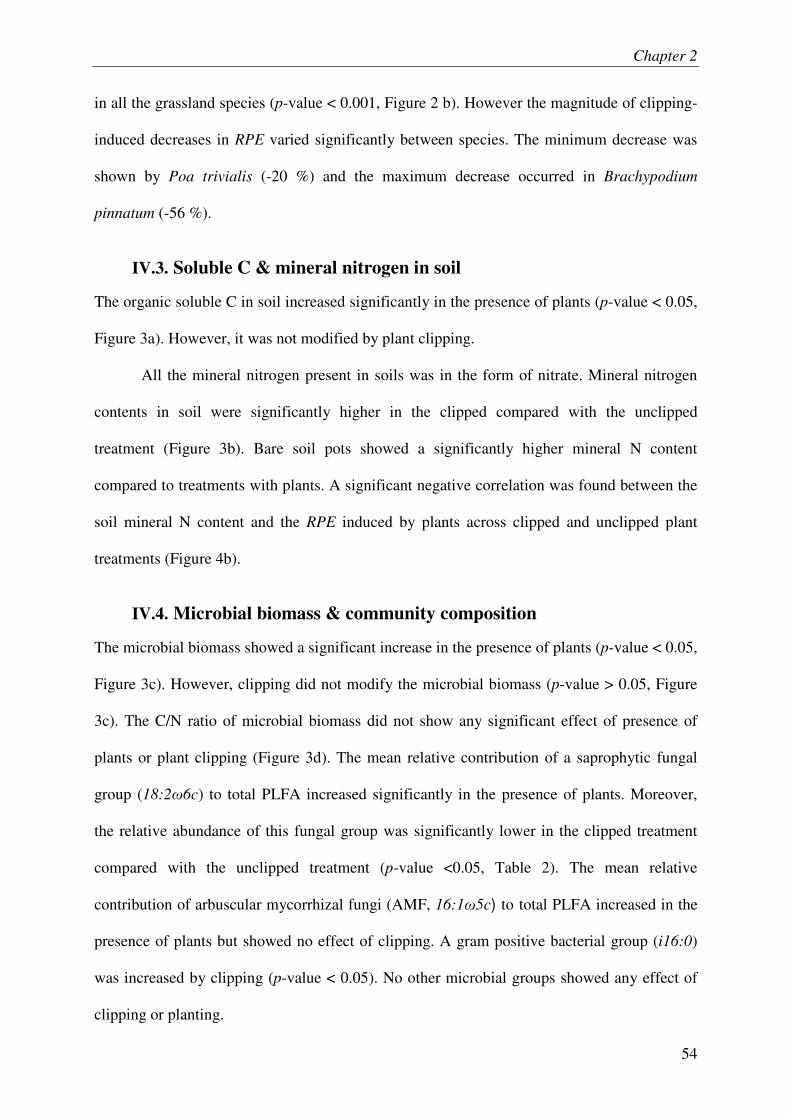
Chapter 2
54
in all the grassland species (p-value < 0.001, Figure 2 b). However the magnitude of clipping-
induced decreases in RPE varied significantly between species. The minimum decrease was
shown by Poa trivialis (-20 %) and the maximum decrease occurred in Brachypodium
pinnatum (-56 %).
IV.3. Soluble C & mineral nitrogen in soil
The organic soluble C in soil increased significantly in the presence of plants (p-value < 0.05,
Figure 3a). However, it was not modified by plant clipping.
All the mineral nitrogen present in soils was in the form of nitrate. Mineral nitrogen
contents in soil were significantly higher in the clipped compared with the unclipped
treatment (Figure 3b). Bare soil pots showed a significantly higher mineral N content
compared to treatments with plants. A significant negative correlation was found between the
soil mineral N content and the RPE induced by plants across clipped and unclipped plant
treatments (Figure 4b).
IV.4. Microbial biomass & community composition
The microbial biomass showed a significant increase in the presence of plants (p-value < 0.05,
Figure 3c). However, clipping did not modify the microbial biomass (p-value > 0.05, Figure
3c). The C/N ratio of microbial biomass did not show any significant effect of presence of
plants or plant clipping (Figure 3d). The mean relative contribution of a saprophytic fungal
group (18:2�6c) to total PLFA increased significantly in the presence of plants. Moreover,
the relative abundance of this fungal group was significantly lower in the clipped treatment
compared with the unclipped treatment (p-value <0.05, Table 2). The mean relative
contribution of arbuscular mycorrhizal fungi (AMF, 16:1�5c) to total PLFA increased in the
presence of plants but showed no effect of clipping. A gram positive bacterial group (i16:0)
was increased by clipping (p-value < 0.05). No other microbial groups showed any effect of
clipping or planting.
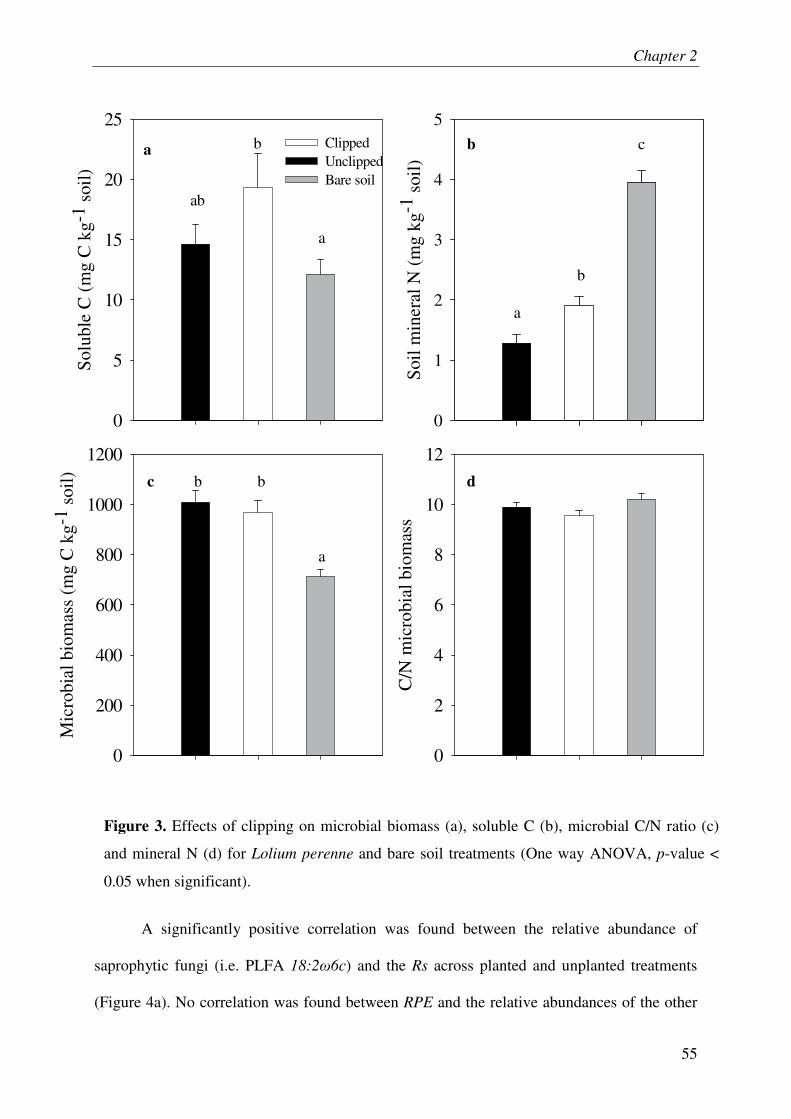
Chapter 2
55
A significantly positive correlation was found between the relative abundance of
saprophytic fungi (i.e. PLFA 18:2�6c) and the Rs across planted and unplanted treatments
(Figure 4a). No correlation was found between RPE and the relative abundances of the other
Soil
min
eral
N (
mg
kg-1
soi
l)0
1
2
3
4
5
C/N
mic
robi
al b
iom
ass
0
2
4
6
8
10
12
Solu
ble
C (
mg
C k
g-1
soil)
0
5
10
15
20
25
Mic
robi
al b
iom
ass
(mg
C k
g-1
soil)
0
200
400
600
800
1000
1200
ClippedUnclippedBare soil
a b
c d
ab
b
a
a
b
c
b b
a
Figure 3. Effects of clipping on microbial biomass (a), soluble C (b), microbial C/N ratio (c)
and mineral N (d) for Lolium perenne and bare soil treatments (One way ANOVA, p-value <
0.05 when significant).
Chapter 2
56
PLFA that varied across clipping treatments (i.e. 16:1�5c and i16:0, data not shown).
Moreover, a significant negative correlation was found between the soil mineral N content
and the relative abundance of the PLFA 18:2�6c across clipped and unclipped plant
treatments (Figure 4c).
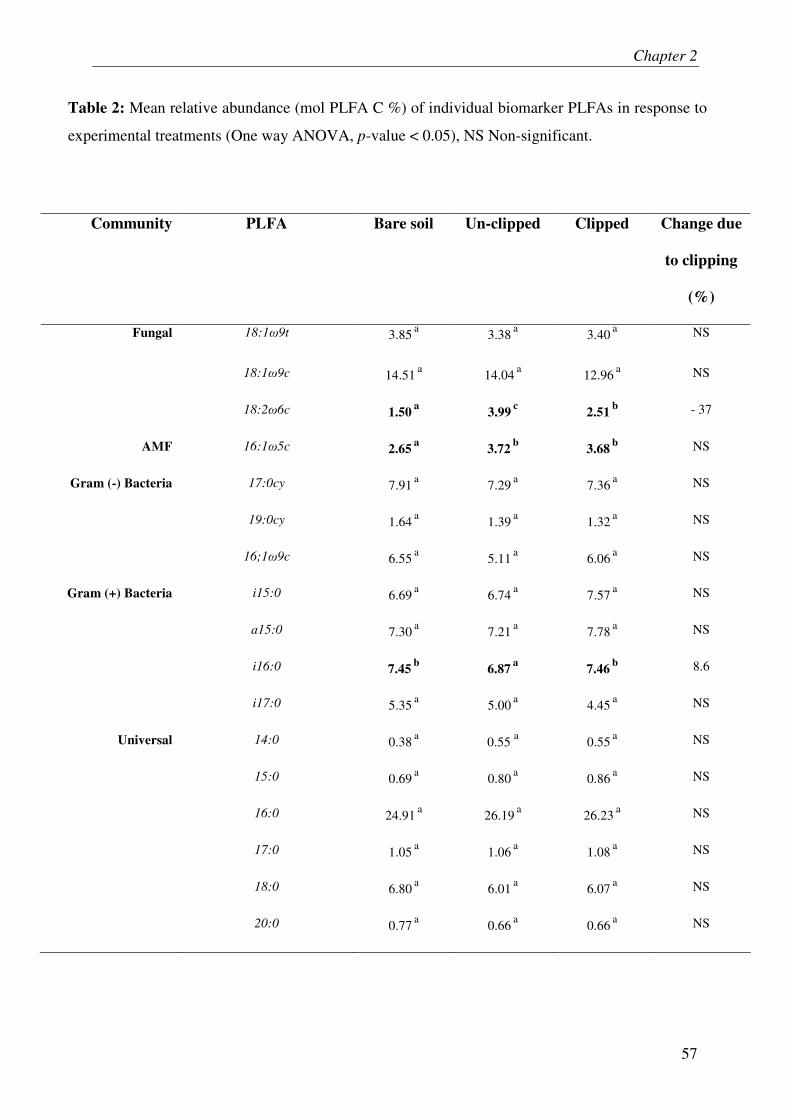
Chapter 2
57
Community PLFA Bare soil Un-clipped Clipped Change due
to clipping
(%)
Fungal 18:1�9t 3.85 a 3.38 a 3.40 a NS
18:1�9c 14.51 a 14.04 a 12.96 a NS
18:2�6c 1.50 a 3.99 c 2.51 b - 37
AMF 16:1�5c 2.65 a 3.72 b 3.68 b NS
Gram (-) Bacteria 17:0cy 7.91 a 7.29 a 7.36 a NS
19:0cy 1.64 a 1.39 a 1.32 a NS
16;1�9c 6.55 a 5.11 a 6.06 a NS
Gram (+) Bacteria i15:0 6.69 a 6.74 a 7.57 a NS
a15:0 7.30 a 7.21 a 7.78 a NS
i16:0 7.45 b 6.87 a 7.46 b 8.6
i17:0 5.35 a 5.00 a 4.45 a NS
Universal 14:0 0.38 a 0.55 a 0.55 a NS
15:0 0.69 a 0.80 a 0.86 a NS
16:0 24.91 a 26.19 a 26.23 a NS
17:0 1.05 a 1.06 a 1.08 a NS
18:0 6.80 a 6.01 a 6.07 a NS
20:0 0.77 a 0.66 a 0.66 a NS
Table 2: Mean relative abundance (mol PLFA C %) of individual biomarker PLFAs in response to
experimental treatments (One way ANOVA, p-value < 0.05), NS Non-significant.
Chapter 2
58
V. Discussion
Using an original method that allowed us to quantify the rhizosphere priming effect induced
by grassland species, we show that clipping reduces recalcitrant SOM mineralization and total
respiration in the soil-plant system. This result is common to six gramineae and one
leguminous species commonly found in temperate grasslands (Figure 2). The decrease in
SOM mineralization after plant clipping can explain significant reductions in total soil
respiration from ecosystems exposed to clipping and grazing (Bremer et al., 1998; Craine et
al., 1999, Wan & Luo, 2003; Cao et al., 2004; Bahn et al., 2006) despite increases in plant
litter decomposition (Klumpp et al., 2009). Hamilton & Frank (2001) suggested an increased
SOM mineralization after clipping based on increased microbial biomass, soluble C and soil
mineral N in their study. They suggested that the increased mineral N after clipping was
released from increased SOM mineralization. In agreement with Hamilton & Frank (2001),
we found increased soil mineral N following clipping. However, our results do not support the
idea that clipping accelerates SOM mineralization. Thus our findings reconcile the apparent
contradiction between the results of experiments measuring gas emissions which suggest a
decrease in SOM mineralization after clipping (e.g. Bahn et al., 2006) and the results of the
experiments measuring soluble C, microbial biomass and mineral N in soil which suggest an
increase in SOM mineralization after clipping (e.g. Hamilton and Frank., 2001).
The presence of plants stimulated both the abundance of mycorrhizal and saprophytic
fungi and the RPE (Table 2). Moreover, clipping induced a strong decrease in the RPE (SOM
mineralization) and reduced the abundance of specific fungal biomarkers (18:2�6c) with no
effect on mycorrhizae. Overall, SOM mineralization was significantly correlated with the
abundance of saprophytic fungi (PLFA 18:2�6c, Figure 4a). These results support the idea
that fungi play a key role in recalcitrant SOM mineralization and the RPE (Fontaine et al.,
2011). Moreover, clipping increased the abundance of gram positive bacteria in agreement
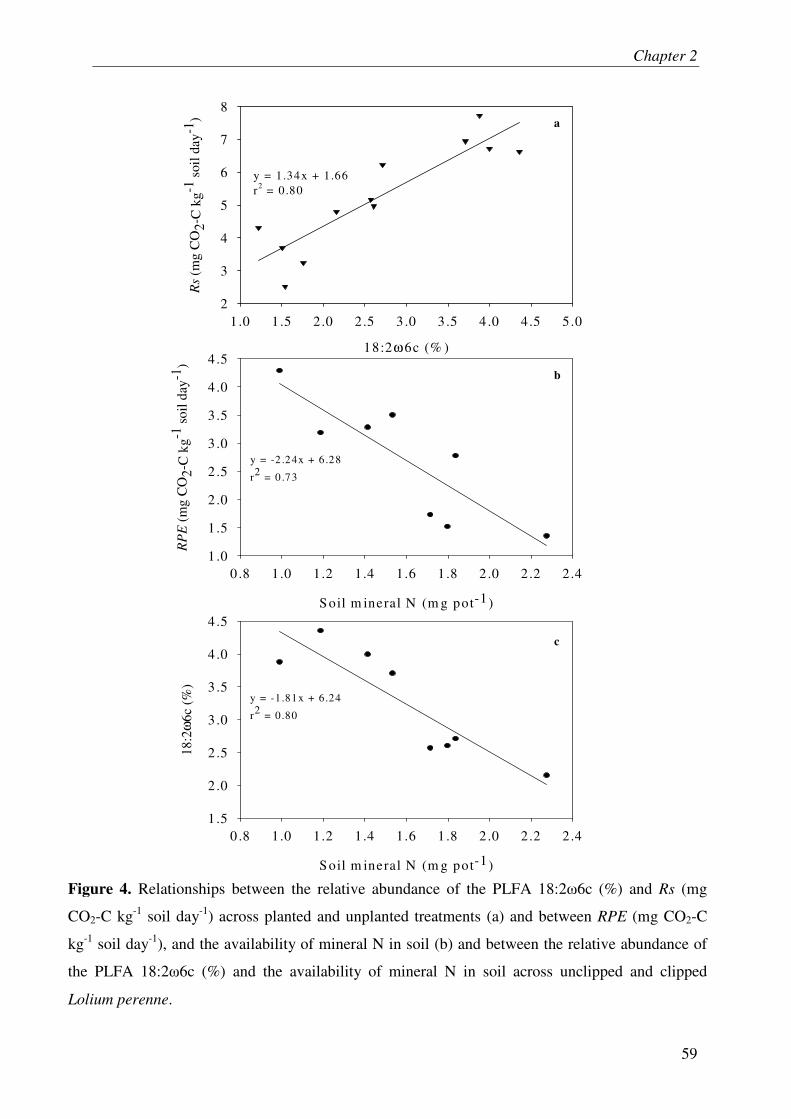
Chapter 2
59
Soil m ineral N (m g pot-1)
0 .8 1.0 1.2 1.4 1.6 1 .8 2 .0 2.2 2.4
18:2
ω6c
(%
)
1 .5
2 .0
2 .5
3 .0
3 .5
4 .0
4 .5
18:2ω6c (% )
1 .0 1.5 2.0 2.5 3 .0 3 .5 4 .0 4.5 5.0
Rs
(mg
CO
2-C
kg-1
soi
l day
-1)
2
3
4
5
6
7
8
y = -1.81x + 6.24
r2 = 0.80
a
y = 1.34x + 1 .66r2 = 0 .80
Soil m ineral N (m g pot-1)
0 .8 1.0 1.2 1.4 1.6 1 .8 2 .0 2.2 2.4
RP
E (
mg
CO
2-C
kg-1
soi
l day
-1)
1 .0
1 .5
2 .0
2 .5
3 .0
3 .5
4 .0
4 .5
y = -2 .24x + 6 .28
r2 = 0 .73
b
c
Figure 4. Relationships between the relative abundance of the PLFA 18:2�6c (%) and Rs (mg
CO2-C kg-1 soil day-1) across planted and unplanted treatments (a) and between RPE (mg CO2-C
kg-1 soil day-1), and the availability of mineral N in soil (b) and between the relative abundance of
the PLFA 18:2�6c (%) and the availability of mineral N in soil across unclipped and clipped
Lolium perenne.
Chapter 2
60
with other studies (Bardgett et al., 2001; Klumpp et al., 2009). Previous work has shown that
the proliferation of gram positive bacteria after clipping induces an acceleration of plant litter
decomposition (Klumpp et al., 2009). Our results combined with those of Bardgett et al.,
(2001) and Klumpp et al. (2009) suggest that clipping modifies the competition between
saprophytic fungi and gram positive bacteria for plant C and favors the preservation of
recalcitrant SOM.
What are the underlying mechanisms for the clipping-induced decrease in the RPE and
changes in microbial community structure observed in the model species Lolium perenne?
Our results suggest that clipping induces a cascade of effects on plant functioning, soil
processes and the microbial community. Clipping reduced the production of aboveground
biomass and plant N assimilation (Figure 1). This is consistent with the reduced leaf area after
clipping which in turn curtails total plant photosynthesis, transpiration and thereby uptake of
mineral nitrogen (Macduff 1992). The reduced N uptake by plants led to an increase in
mineral N availability (Fig 1) for the soil microbial community. The higher availability of
mineral N strongly reduced the priming effect as shown by the negative correlation between
the mineral N and RPE (Figure 4b). This result supports the results of previous studies carried
out in the absence of plants (Fontaine et al., 2004; 2011). The higher availability of N reduces
the RPE presumably due to two reasons. First, SOM decomposers i.e. fungi could reduce their
mining of nutrients in SOM and hence the RPE, when availability of mineral N is high
(Fontaine et al., 2011). Second, increased availability of mineral N could favor bacteria over
fungi in the competition for fresh C acquisition (Bardgett and McAlister 1999). The
concomitant decrease in the abundance of the key players in RPE i.e. saprophytic fungi,
which is negatively linked with mineral N availability (Figure 4c), and the increase in the
abundance of gram positive bacteria supports the second idea.
Chapter 2
61
Clipping reduced the RPE induced by all seven grassland species studied in our
experiment (Figure 2b). However, different species varied in terms of their quantitative
response to clipping (Table 1). Interspecific differences in rates of photosynthesis and plant N
uptake could underlie the variation in RPE responses observed. Therefore, we encourage
further research to quantify the impact of clipping on plant N uptake, soil N availability and
microbial community structure under various plant species.
Overall, our study shows a strong link between aboveground biomass, plant N uptake and
SOM mineralization, suggesting synchrony between plant photosynthesis and soil N
availability in grasslands. When plants with high biomass have high photosynthetic rates in
favorable conditions (e.g. summer), plant N demand may exceed the soil N offer resulting in
decreased soil N availability and increased fungi: bacteria ratios. These changes accelerate
SOM mineralization which could liberate N from SOM, stabilizing soil N availability.
Alternatively, when plant photosynthesis is reduced due to clipping or low light intensity,
plant N uptake may be lower than the soil N offer. The accumulation of mineral N in soil
decreases SOM mineralization, which could lead to sequestration of mineral N in SOM.
Unless this excess in nutrients is sequestered in the soil, nutrient loss will occur via leaching
or denitrification. Management of such synchrony between plant photosynthesis and soil N
availability may maximize plant productivity, nutrient retention and thereby C sequestration
in grasslands. Future studies are required to verify the existence of the link between SOM
mineralization and the consequent release of mineral nitrogen from SOM.
Acknowledgement
We thank S. Revaillot and O. Delfosse for chemical and isotopic analyses. Maurice
Crocombette and Patrick Pichon are thanked for their valuable help in mesocosm construction
and experiment establishment respectively. The research received funding from the European
Community's 6th and 7th Framework Programs (FP6 and FP7) under grant agreement n°

Chapter 2
62
017841 (Nitro-Europe) and n° 226701 (CARBO-Extreme). The funding from National
Research Agency’s project BIOMOS is also acknowledged. TS has been funded by Higher
Education Commission of Pakistan (HEC) and European Community’s 7th framework under
grant agreement n° 226701 (CARBO-EXTREME).
Chapter 2
63
VI. References
Bahn, M., Knapp, M., Garajova, Z., Pfahringer, N., Cernusca, A., 2006. Root respiration in
temperate mountain grasslands differing in land use. Global Change Biology 12, 995-
1006.
Bardgett, R.D., Bowman, W.D., Kaufmann, R., Schmidt, S.K., 2005. A temporal approach to
linking aboveground and belowground ecology. Trends in Ecology & Evolution 20,
634-641.
Bardgett, R.D., Jones, A.C., Jones, D.L., Kemmitt, S.J., Cook, R., Hobbs, P.J., 2001. Soil
microbial community patterns related to the history and intensity of grazing in sub-
montane ecosystems. Soil Biology and Biochemistry 33, 1653-1664.
Bardgett, R.D., McAlister, E., 1999. The measurement of soil fungal: bacterial biomass ratios
as an indicator of ecosystem self-regulation in temperate meadow grasslands. Biology
and Fertility of Soils 29, 282-290.
Bardgett, R.D., Wardle, D.A., Yeates, G.W., 1998. Linking above-ground and below-ground
interactions: how plant responses to foliar herbivory influence soil organisms. Soil
Biology and Biochemistry 30, 1867-1878.
Bingeman, C.W., Varner, J.E., Martin, W.P., 1953. The effect of the addition of organic
materials on the decomposition of an organic soil. Soil Science Society of America
Journal. 17, 34-38.
Bligh, E.G., Dyer, W.J., 1959. A rapid method of total lipid extraction and purification.
Canadian Journal of Biochemistry and Physiology 37, 911-917.
Bremer, D.J., Ham, J.M., Owensby, C.E., Knapp, A.K., 1998. Responses of soil respiration to
clipping and grazing in a tallgrass prairie. Journal of Environmental Quality 27, 1539-
1548.
Chapter 2
64
Broadbent, 1947 F.E. Broadbent, Nitrogen release and carbon loss from soil organic matter
during decomposition of added plant residues. Soil Science Society of America
Proceedings, 12 (1947), pp. 246–249.
Cao, G., Tang, Y., Mo, W., Wang, Y., Li, Y., Zhao, X., 2004. Grazing intensity alters soil
respiration in an alpine meadow on the Tibetan plateau. Soil Biology and
Biochemistry 36, 237-243.
Cheng, W., Johnson, D.W., Fu, S., 2003. Rhizosphere effects on decomposition: controls of
plant species, phenology, and fertilization. Soil Science Socety American Journal. 67,
1418-1427.
Collins, S.L., Knapp, A.K., Briggs, J.M., Blair, J.M., Steinauer, E.M., 1998. Modulation of
Diversity by Grazing and Mowing in Native Tallgrass Prairie. Science 280, 745-747.
Craine, J., Wedin, D., Chapin, F., 1999. Predominance of ecophysiological controls on soil
CO2 flux in a Minnesota grassland. Plant and Soil 207, 77-86.
De Deyn, G.B., Cornelissen, J.H.C., Bardgett, R.D., 2008. Plant functional traits and soil
carbon sequestration in contrasting biomes. Ecology Letters 11, 516-531.
Dijkstra, F.A., Cheng, W., 2007. Interactions between soil and tree roots accelerate long-term
soil carbon decomposition. Ecology Letters 10, 1046-1053.
Dowling, N.J.E., Widdel, F., White, D.C., 1986. Phospholipid ester-linked fatty acid
biomarkers of acetate-oxidizing sulphate-reducers and other sulphide-forming
bacteria. Journal of General Microbiology 132, 1815-1825.
Drake, J.E., Gallet-Budynek, A., Hofmockel, K.S., Bernhardt, E.S., Billings, S.A., Jackson,
R.B., Johnsen, K.S., Lichter, J., McCarthy, H.R., McCormack, M.L., Moore, D.J.P.,
Oren, R., Palmroth, S., Phillips, R.P., Pippen, J.S., Pritchard, S.G., Treseder, K.K.,
Schlesinger, W.H., DeLucia, E.H., Finzi, A.C., 2011. Increases in the flux of carbon
Chapter 2
65
belowground stimulate nitrogen uptake and sustain the long-term enhancement of
forest productivity under elevated CO2. Ecology Letters 14, 349-357.
Fontaine, S., Bardoux, G., Abbadie, L., Mariotti, A., 2004. Carbon input to soil may decrease
soil carbon content. Ecology Letters 7, 314-320.
Fontaine, S., Barot, S., 2005. Size and functional diversity of microbe populations control
plant persistence and long-term soil carbon accumulation. Ecology Letters 8, 1075-
1087.
Fontaine, S., Barot, S., Barre, P., Bdioui, N., Mary, B., Rumpel, C., 2007. Stability of organic
carbon in deep soil layers controlled by fresh carbon supply. Nature 450, 277-280.
Fontaine, S., Henault, C., Aamor, A., Bdioui, N., Bloor, J.M.G., Maire, V., Mary, B.,
Revaillot, S., Maron, P.A., 2011. Fungi mediate long term sequestration of carbon and
nitrogen in soil through their priming effect. Soil Biology and Biochemistry 43, 86-96.
Fontaine, S., Mariotti, A., Abbadie, L., 2003. The priming effect of organic matter: a question
of microbial competition? Soil Biology and Biochemistry 35, 837-843.
Frostegard, A., Tunlid, A., Baath, E., 1991. Microbial biomass measured as total lipid
phosphate in soils of different organic content. Journal of Microbiological Methods
14, 151-163.
Frostegard, A., Tunlid, A., Bââth, E., 2010. Use and misuse of PLFA measurements in soils.
Soil Biology and Biochemistry 43, 1621-1625.
Hamilton, E.W., Frank, D.A., 2001. Can plants stimulate soil microbes and their own nutrient
supply? Evidence from a grazing tolerant grass. Ecology 82, 2397-2402.
Henry, F., Vestergård, M., Christensen, S., 2008. Evidence for a transient increase of
rhizodeposition within one and a half day after a severe defoliation of Plantago
arenaria grown in soil. Soil Biology and Biochemistry 40, 1264-1267.
Chapter 2
66
Klumpp, K., Fontaine, S., Attard, E., Le Roux, X., Gleixner, G., Soussana, J.-F., 2009.
Grazing triggers soil carbon loss by altering plant roots and their control on soil
microbial community. Journal of Ecology 97, 876-885.
Lal, R., Follett, F., Stewart, B.A., Kimble, J.M., 2007. Soil carbon sequestration to mitigate
climate change and advance food security. Soil Science 172, 943-956.
Li, X.D., Fu, H., Li, X.D., Guo, D., Dong, X.Y., Wan, C.G., 2008. Effects of land-use
regimes on carbon sequestration in the Loess Plateau, northern China. New Zealand
Journal of Agricultural Research 51, 45-52.
Macduff, J.H., Jackson, S.B., 1992. Influx and efflux of nitrate and ammonium in Italian
ryegrass and white clover roots - comparisons between effects of darkness and
defoliation. Journal of Experimental Botany 43, 525-535.
Mikola, J., Kytöviita, M.-M., 2002. Defoliation and the availability of currently assimilated
carbon in the Phleum pratense rhizosphere. Soil Biology and Biochemistry 34, 1869-
1874.
Nichols, P., Stulp, B.K., Jones, J.G., White, D.C., 1986. Comparison of fatty acid content and
DNA homology of the filamentous gliding bacteria Vitreoscilla, Flexibacter,
Filibacter. Archives of Microbiology 146, 1-6.
Olsson, P.l.A., Bååth, E., Jakobsen, I., Söderström, B., 1995. The use of phospholipid and
neutral lipid fatty acids to estimate biomass of arbuscular mycorrhizal fungi in soil.
Mycological Research 99, 623-629.
Parton, W.J., Scurlock, J.M.O., Ojima, D.S., Gilmanov, T.G., Scholes, R.J., Schimel, D.S.,
Kirchner, T., Menaut, J.C., Seastedt, T., Moya, E.G., Kamnalrut, A., Kinyamario, J.I.,
1993. Observations and modeling of biomass and soil organic-matter dynamics for the
grassland biome worldwide. Global Biogeochemical Cycles 7, 785-809.
Chapter 2
67
Personeni, E., Loiseau, P., 2004. How does the nature of living and dead roots affect the
residence time of carbon in the root litter continuum? Plant and Soil 267, 129-141.
Phillips, R.P., Finzi, A.C., Bernhardt, E.S., 2011. Enhanced root exudation induces microbial
feedbacks to N cycling in a pine forest under long-term CO2 fumigation. Ecology
Letters 14, 187-194.
Reeder, J.D., Schuman, G.E., 2002. Influence of livestock grazing on C sequestration in semi-
arid mixed-grass and short-grass rangelands. Environmental Pollution 116, 457-463.
Schlesinger, W.H., 1977. Carbon balance in terrestrial detritus. Annual Review of Ecology
and Systematics 8, 51-81.
Van Der Heijden, M.G.A., Bardgett, R.D., Van Straalen, N.M., 2008. The unseen majority:
soil microbes as drivers of plant diversity and productivity in terrestrial ecosystems.
Ecology Letters 11, 296-310.
Vance, E.D., Brookes, P.C., Jenkinson, D.S., 1987. An extraction method for measuring soil
microbial biomass-C. Soil Biology & Biochemistry 19, 703-707.
Wan, S.Q., Luo, Y., 2003. Substrate regulation of soil respiration in a tallgrass prairie: results
of a clipping and shading experiment. Global Biogeochemical Cycles 17, 1054.
Ward, S., Bardgett, R., McNamara, N., Adamson, J., Ostle, N., 2007. Long-term
consequences of grazing and burning on northern peatland carbon dynamics.
Ecosystems 10, 1069-1083.
Wu, J., Brookes, P.C., Jenkinson, D.S., 1993. Formation and destruction of microbial
biomass during the decomposition of glucose and ryegrass in soil. Soil Biology &
Biochemistry 25, 1435-1441.
68
CHAPTER 3
Living roots induce the mineralization of 15, 000 years old organic
C from deep soil of a temperate grassland
Chapter 3
69
LIVING ROOTS INDUCE THE MINERALIZATION OF 15, 000
YEARS OLD ORGANIC C FROM DEEP SOIL OF A
TEMPERATE GRASSLAND
Tanvir SHAHZADa*, Claire Chenu b and Sébastien FONTAINE a
a INRA, UR 874 Unité Recherche d’Ecosystème prairial, 234-Avenue du Brézet 63100
Clermont Ferrand, France.
b AgroParisTech, UMR BIOEMCO (Biogéochimie et Ecologie des Milieux Continentaux)
AgroParisTech Grignon, 78850 Thiveral Grignon, France
*Author for correspondence
Tanvir SHAHZAD
Email: [email protected]
Telephone: +33 981 468 197
Fax: +33 473 62 44 57
Chapter 3
70
I. Summary
The main focus of studies concerning dynamics of soil carbon has been the first 20 cm of soil.
However, it has been shown that more than fifty percent of soil C (relative to 1m depth)
resides in 20-100 cm of soil depth for centuries to millennia. The fate of this ancient deep soil
C will be crucial under changed climates and associated land use changes. However, the
mechanisms controlling the stability of deep soil C remain unclear. We demonstrate that
rhizodeposition in deep soil layers by a deep-rooted grassland plant, Festuca arundinaceae,
induced the microbial mineralization of about 15,000 years old deep soil C. This rhizosphere
priming effect was maintained during 511 days of experiment and was strongly correlated
with fresh C respired. The soil C mineralization was strongly correlated with a saprophytic
fungal biomarker (18:2�6c) suggesting that fungi are key actors in the mineralization of
recalcitrant organic C in deep soil. Collectively, these results support the idea that the energy-
limitation faced by deep soil microbes due to limited supply of fresh C is the reason for the
stability of deep soil C over centuries to millennia. Moreover, the saprophytic fungi
represented by 18:2�6c biomarker are suggested to be involved in SOM mineralization and
rhizosphere priming effect. The vulnerability of ancient soil C to microbial mineralization
after the supply of fresh C supply warrants further research on the proposals of sequestering
organic matter in deep soils expecting its long term stabilization there.
Keywords:
Deep soil carbon, rhizosphere priming effect, soil organic matter, 14C dating, 13C labelling,
PLFA
Chapter 3
71
II. Introduction
The world soils are largest reservoir of soil organic matter (SOM) containing more carbon (C)
than is present either in vegetation or the atmosphere (Jobbàgy and Jackson 2000). The
estimates of organic C stocks in 1m depth of world soils range from 1220 Pg (Sombroeck et
al., 1993) to about 1550 Pg (Batjes 1996; Jobbàgy and Jackson 2000) or even up to 2000 Pg
(Janzen 2005). The main focus of the scientists studying the mechanisms of stabilization and
mineralization of SOM has remained the 0 to 20 or 30 cm upper soil layer although the
percentage of SOM present in 20-100 cm soil depth (relative to first meter of soil) has been
estimated as 67%, 58% and 50% for shrublands, grasslands and forests respectively (Jobbàgy
and Jackson 2000). The deep soil C was generally neglected because the 14C dating showed
that this is thousands of years old suggesting that the deep soil C is inert i.e. chemically
recalcitrant or protected by soil minerals (Trumbore 2000). However, the respiration of
centuries old C in response to drying-rewetting cycles (Schimel et al., 2011) and millennia old
carbon after labile C additions (Fontaine et al., 2007) from deep soil indicates that the deep
soil C, or significant part of it, is vulnerable to microbial decomposition. Thus it is important
to better understand the mechanisms controlling the stability of deep soil C in order to
determine its vulnerability to climate change. The knowledge of these mechanisms could also
lead to developing strategies to store C in deep soil layers over long term.
It has been argued that high spatial heterogeneity of SOM and microbial distributions
and limited diffusion of soil C to active microbes in deep soil horizons in comparison to
surface soil are the possible causes of slow mineralization of deep soil C (Rumpel and Kögel-
Knaber 2011). Schimel et al. (2011) showed that the alternating drying and rewetting cycles
induced the mineralization of 850 years old C from 1m deep horizon of an annual grassland.
They argued that the mass flow of water associated with rewetting overcame the limited
diffusion of old C to active microbes and thus promoted its release as CO2. Similarly, the
Chapter 3
72
increase in SOM mineralization after disrupting the structure of deep soil (Salomé et al.,
2010) supported this theory of spatial heterogeneity between C and microbial communities. In
addition of the mechanism of spatial heterogeneity between SOM and microbial biomass,
Fontaine et al. (2007) hypothesized that the deep soil microbes are more limited by the
availability of energy-rich substrates than their counterparts in surface soil because the
rhizodeposition in deep soil layers is many orders less than that in surface soil. The
mineralization of humified recalcitrant SOM can only operate in the presence of fresh energy-
rich rhizodeposits because the acquisition of energy from SOM is not sufficient to sustain
biological activity. This energy-limitation hypothesis was supported by a lab incubation
experiment where the supply of cellulose reactivated the mineralization of 2500 years’ old
organic carbon from deep soil.(Fontaine et al., 2007). The experiment of Fontaine et al.,
(2007) was a lab incubation where soil structure was disrupted and the substrate was a pure
organic compound. To determine if energy-limitation is the reason behind deep soil C
stability in ecosystems, it remains to test the vulnerability of deep soil C to rhizodeposition in
deep soil layers by deep rooted plants.
It has been shown that the living roots of annual plants, young trees and perennial
grasses can accelerate the mineralization of recalcitrant SOM in surface soils by stimulating
the soil decomposer community with energy-rich labile C substrates i.e. induce priming effect
(Cheng et al., 2003; Dijkstra and Cheng 2007; Chapter 1 of this thesis). Moreover, the
increased input of labile C in surface soils can also cause net C loss (Fontaine et al., 2004;
Dijkstra and Cheng 2007) and increase gross N mineralization (Dijkstra et al., 2011). The
response of deep soil C to the presence of living roots in terms of SOM mineralization, soil C
stocks and gross N mineralization can be expected to be similar to that of surface soils given
that the living roots could stimulate soil microorganisms with the input of fresh C (labile
organic C).
Chapter 3
73
It is not clear yet which microbes or microbial groups are involved in the
mineralization of soil organic matter and thus priming effect. The saprophytic fungi have been
suggested to mediate priming effect (Fontaine et al., 2011) due to their ability to reach the
stabilized SOM as well as labile C through their hyphae. The correlation of a lipidic fungal
biomarker (18:2�6c) with priming effect and mineralization of SOM in a lab experiment
(Fontaine et al., 2011) and in mesocosm study involving grasses (Chapter 1 of this thesis)
supports the idea that the fungi play key role in recalcitrant SOM mineralization. However,
some bacterial species have also been shown to contribute to priming effect after the supply
of fresh C to soil microbes (Bernard et al., 2007; Nottingham et al., 2009).
This study aims to determine if the stability of deep soil C is due to energy-limitation
of deep soil microbes by testing if the supply of rhizodeposits from living plant into deep soil
can induce the reactivation of mineralization of ancient SOM. A grassland species, Festuca
arundinacea, capable of producing deep roots was used to ensure the supply of fresh C in
deep soil layers. A continuous dual C labelling (13C & 14C) of Festuca arundinacea allowed
the separation of plant-derived CO2-C from soil-derived CO2-C, calculation of rhizosphere
priming effect and 14C dating of soil C released by priming. The consequence of accelerated
SOM mineralization for soil N availability was quantified by measuring gross N
mineralization and long term net N mineralization. Phospholipids fatty-acid (PLFA) of soil
were analysed to determine the microbial groups potentially contributing to SOM
mineralization
Chapter 3
74
III. Materials & Methods
III.1. Soil sampling and plant sowing
The soil used in this experiment was sampled from an upland grassland located in the
environmental research observatory (ORE) established by the French National Institute for
Agricultural Research (INRA) in central France in 2003 (Theix, 45°43'N, 03°01'E). The local
climate is semi-continental, with a mean annual temperature of 9°C and an average annual
rainfall of 760mm. Before 2003, the site had been under grassland for more than 50 years and
was covered with forests of chestnut and hornbeam 2000 years ago (Boivin et al., 2004). The
soil is a drained Cambisol developed from granitic rock. In March 2009, eight intact soil cores
up to 80 cm deep were taken within 1 m distance to each other. These cores were taken within
2-5 m distance of soil profiled studied by Fontaine et al. (2007). The top 10 cm of each profile
was removed for all cores because it was rich in root litter and fresh soil C. Given that the
respiration of this pre-existing fresh C cannot be separated from that of old soil carbon and
that the presence of plants can also modify fresh C decomposition (Personeni and Loiseau
2004), it is advisable to use a soil with a low proportion of fresh C in order to determine the
effect of plants on recalcitrant SOM. The cores were then carefully inserted in PVC tubes (80
cm long, 9.8 cm internal diameter) without disturbing soil structure. On 25 March 2009, four
of these pots containing intact soil cores were sown with Festuca arundinacea at density of
2000 seeds m-2 and four were kept bare for comparison with planted ones. Immediately after
germination all planted and bare soil pots were placed in a dual labelling (13C & 14C)
mesocosm (see chapter 1 of this thesis) for whole duration of experiment (511 days). Plants
were fertilized with nitrogen (70 kg N ha-1), phosphorus (100 kg P2O5 ha-1) and potassium
(200 kg K2O ha-1) 122 and 364 days after sowing. During first application of fertilizer, sulfur
(20 kg S ha-1) and magnesium (60 kg MgO ha-1) were also applied. Before sowing, all pots
containing soil cores were immersed in water till the soil cores were water saturated. The
Chapter 3
75
weight of soil pots at field capacity was then determined by weighing them after water
percolation from the base of pots stopped. This estimation was used to keep the soil moisture
around 75±5% of field capacity of soil using automated drip irrigation method and adjusting
the water gravimetrically. The plants were clipped thrice to 5cm from ground 122, 189 and
413 days after sowing.
III.2. Respiration measures
The plant roots grew quickly reaching the base of pots (80 cm soil depth) within three
months. The effect of plants presence on mineralization of recalcitrant SOM was determined
for the whole profile throughout the experiment. For measuring respiration, the pots were
taken out periodically from the labelling mesocosm and were sealed in air-tight PVC
chambers (height 100 cm, diameter 15 cm) for 24 hrs. The absence of light stopped
photosynthesis and avoided the plant absorption of soil respired CO2. Carbon dioxide released
by the plant-soil system was trapped in 200 ml of 1M NaOH that was placed in respiration
chambers. By conducting additional measurement on respiration chambers by gas
chromatography, we quantified that more than 99% of CO2 respired by the pot (soil + plant)
over 24 hours was trapped successfully into NaOH. Total carbon trapped in NaOH was
measured with a total inorganic-C analyzer. The 13C abundance of trapped CO2 was analysed
with an Isotope-Ratio Mass Spectrometer (IRMS) after precipitating the carbonates with
excess BaCl2 and filtration. The soil-derived CO2-C (Rs, mg CO2-C kg-1 dry soil day-1) was
separated from plant-derived CO2-C (Rp, mg CO2-C kg-1 dry soil day-1) using mass balance
equations:
131313tps ARtARpARs
RtRpRs
×=×+×
=+
where As13 is the 13C abundance (dimensionless) of soil carbon, Ap
13 the 13C abundance of
plant, Rt the total CO2 emitted by the pot (soil plus plant) and At13 its 13C abundance. Rp
Chapter 3
76
corresponds to CO2-C coming out from whole plant respiration, mycorrhizae and microbial
respiration of rhizodeposits and plant litter.
The rhizosphere priming effect (RPE, mg CO2-C kg-1 dry soil day-1) induced by the plant was
calculated as:
RPE = (Rs, planted soil) – (Rs, control soil)
After 511 days, plants were clipped to base. Afterwards each planted and bare soil pot was
cut horizontally into three parts in order to quantify the priming effect induced in different
horizons due to rhizodeposits as well as to determine the 14C age of released soil C. From top
to bottom, they represented surface (10-33 cm), middle (33-56 cm) and deep soil (56-80 cm)
horizons in field. The soil was maintained within PVC tubes to preserve the soil structure.
These soil horizons were placed in respiration chambers for seven days with 200 ml 1.5M
NaOH. The fixed C in NaOH was analysed and separated into different components similar to
those for whole profile measures.
Then, we calculated the 14C content (expressed in pMC) of SOC released as CO2 ( 14SA ) with
the equation
141414 ... TTppSS ARARAR =+
where 14pA is the 14C content of plant-derived C and 14
TA the 14C content of the total CO2
emitted by planted soil. 14SA was converted into age BP using the Libby half-life of 14C.
The priming effect (RPE, mg C-CO2 kg-1 soil) induced by the addition of labile C from roots
was calculated as
)()( soilbareRsoilplantedRPE SS −=
We calculated the 14C content of the pool of SOC decomposed via the priming effect ( 14peA ) as
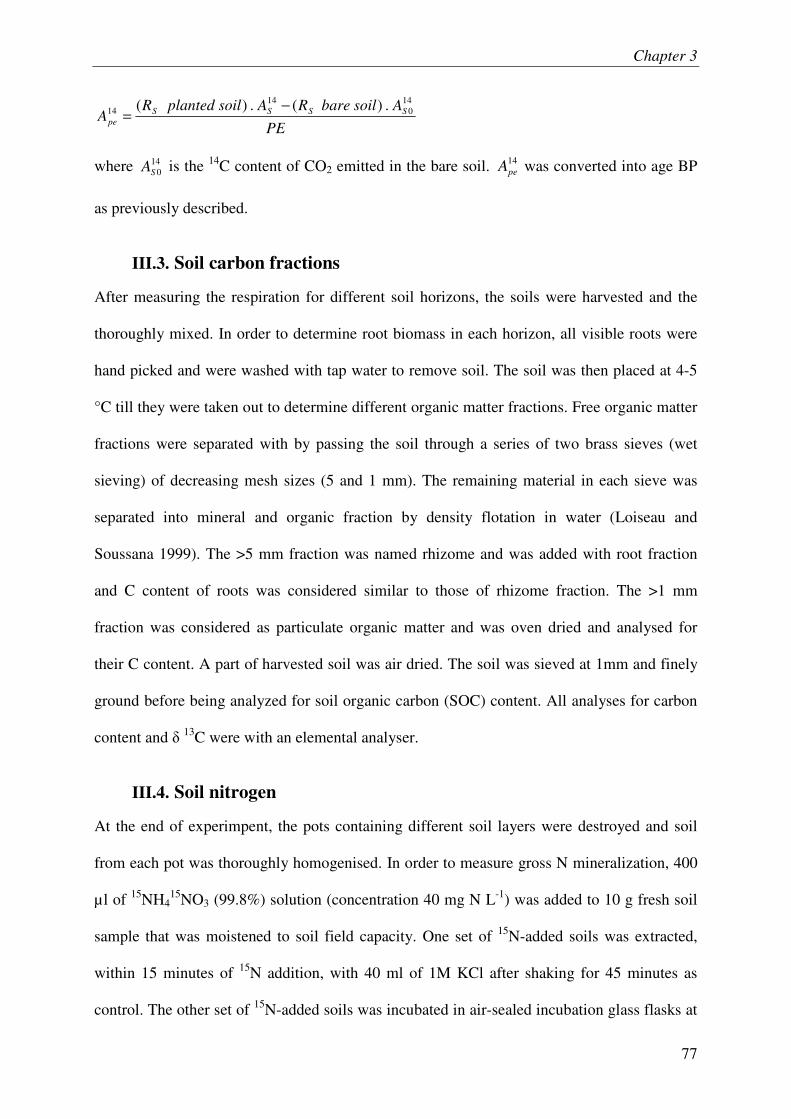
Chapter 3
77
PE
AsoilbareRAsoilplantedRA SSSS
pe
140
1414 .)(.)( −
=
where 140SA is the 14C content of CO2 emitted in the bare soil. 14
peA was converted into age BP
as previously described.
III.3. Soil carbon fractions
After measuring the respiration for different soil horizons, the soils were harvested and the
thoroughly mixed. In order to determine root biomass in each horizon, all visible roots were
hand picked and were washed with tap water to remove soil. The soil was then placed at 4-5
°C till they were taken out to determine different organic matter fractions. Free organic matter
fractions were separated with by passing the soil through a series of two brass sieves (wet
sieving) of decreasing mesh sizes (5 and 1 mm). The remaining material in each sieve was
separated into mineral and organic fraction by density flotation in water (Loiseau and
Soussana 1999). The >5 mm fraction was named rhizome and was added with root fraction
and C content of roots was considered similar to those of rhizome fraction. The >1 mm
fraction was considered as particulate organic matter and was oven dried and analysed for
their C content. A part of harvested soil was air dried. The soil was sieved at 1mm and finely
ground before being analyzed for soil organic carbon (SOC) content. All analyses for carbon
content and � 13C were with an elemental analyser.
III.4. Soil nitrogen
At the end of experimpent, the pots containing different soil layers were destroyed and soil
from each pot was thoroughly homogenised. In order to measure gross N mineralization, 400
µl of 15NH415NO3 (99.8%) solution (concentration 40 mg N L-1) was added to 10 g fresh soil
sample that was moistened to soil field capacity. One set of 15N-added soils was extracted,
within 15 minutes of 15N addition, with 40 ml of 1M KCl after shaking for 45 minutes as
control. The other set of 15N-added soils was incubated in air-sealed incubation glass flasks at
Chapter 3
78
20 °C. After 24 hours, they were extracted for N with 1M KCl after shaking for 45 minutes. A
set of replicates of both extracts i.e. control and those incubated for 24 hours, were analysed
using continuous flow colorimeter
Net nitrogen mineralization was determined for all soil layers for 79 days. A 10 g fresh
soil sample, moistened to field capacity, for each replicate was incubated in air-sealed
incubation glass flasks at 20 °C. Four independent sets flasks were prepared in order to
measure mineral nitrogen content after 0 8, 21, 51 and 79 days of incubation. In order to
quantify soil mineral nitrogen, the soil was extracted with 40 ml of 1M KCl after shaking for
45 minutes. The extract was filtered and analysed by continuous flow colorimeter.
III.5. PLFA measurements
A 2 g sample from each sample was freeze-dried, sieved at 2 mm and the remaining plant
debris were removed. Phospholipidic fatty acids (PLFAs) were extracted using a modified
method of Bligh and Dyer (1959) (Frostegård et al., 1991). Briefly, fatty acids were extracted
in a single-phase mixture of chloroform: methanol: citrate buffer (1:2:0.8, vIvlv, pH 4.0)
shaken at 300 rpm for 1H. Phase splitting was obtained by adding equal volume of
chloroform and citrate buffer. The organic phase was then submitted to solid phase extraction
on silica gel cartridge (Discovery® DSC-Si SPE Tube bed wt. 500 mg, volume 3 mL, from
Supelco). Neutral lipids, glycolipids and PLFAs were eluted by chloroform, acetone and
methanol, respectively. Methyl nonadecanoate (fatty acid methyl ester 19: 0) was added as an
internal standard and PLFAs were trans-methylated under mild alkaline condition to yield
fatty acid methyl esters (FAMEs), (Dowling et al., 1986). FAMEs were then analysed by
GC/MS (4000 GC/MS, Varian) in split-less mode (1µL, injector temperature: 250°C)
equipped with a BPX70 column (60 m, 0.25mm i.d., 0.25mm df. , SGE), and helium as a
carrier gas. The temperature program was 50 �C for 5 min, raised to 165°C at 15°C/min,
followed by a gradient of 2°C/min up to 225°C. This temperature was held for 15min. To
Chapter 3
79
identify the FAMEs, the retention times and the mass spectra were compared with those
obtained from standards (Bacterial Acid Methyl Ester (BAME) Mix from Supelco and 11
Hexadecenoic acid (92% cis, 8% trans) from Matreya). Gram positive bacterial PLFAs were
i15:0, a15:0, i16:0, i17:0 and gram negative baterial PLFAs were 17:0cy, 19:0cy & 16:1�9.
Saprophytic fungal PLFAs were 18:1�9c, 18:2�9t and 18:2�6c whereas mycorrhizal PLFA
was 16:1�5c.
III.6. Statistical analyses
Multifactor analysis of variance (ANOVA) was used to assess the difference between SOM
mineralization in planted and bare soils (whole profile) by assuming plant presence, date of
measurement and plant × date as fixed factors. Similarly multifactor ANOVA was used to
differentiate between SOM mineralization in soil layers obtained from planted and bare soil
profiles. Plant presence, soil depth and plant × soil depth were used as fixed factors. Linear
regression was carried to determine relation between plant-derived 13C respiration and
rhizosphere priming effect. Multifactor ANOVA was used to determine the effect of plants,
soil depth, days after incubation and their interactions on net N mineralization. To determine
the effect of plants, soil depth and their interaction on relative abundances of PLFA,
multifactor ANOVA was used. All statistical tests were performed with Statgraphics Plus
(Manugistics, USA)
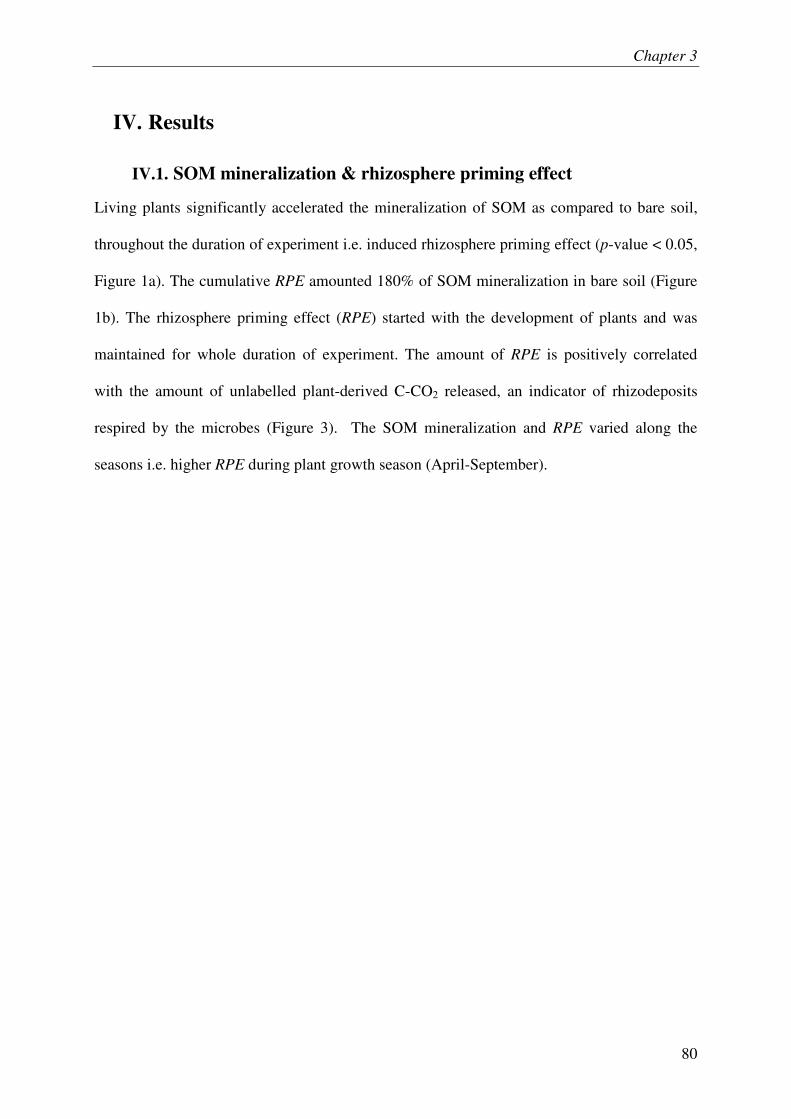
Chapter 3
80
IV. Results
IV.1. SOM mineralization & rhizosphere priming effect
Living plants significantly accelerated the mineralization of SOM as compared to bare soil,
throughout the duration of experiment i.e. induced rhizosphere priming effect (p-value < 0.05,
Figure 1a). The cumulative RPE amounted 180% of SOM mineralization in bare soil (Figure
1b). The rhizosphere priming effect (RPE) started with the development of plants and was
maintained for whole duration of experiment. The amount of RPE is positively correlated
with the amount of unlabelled plant-derived C-CO2 released, an indicator of rhizodeposits
respired by the microbes (Figure 3). The SOM mineralization and RPE varied along the
seasons i.e. higher RPE during plant growth season (April-September).
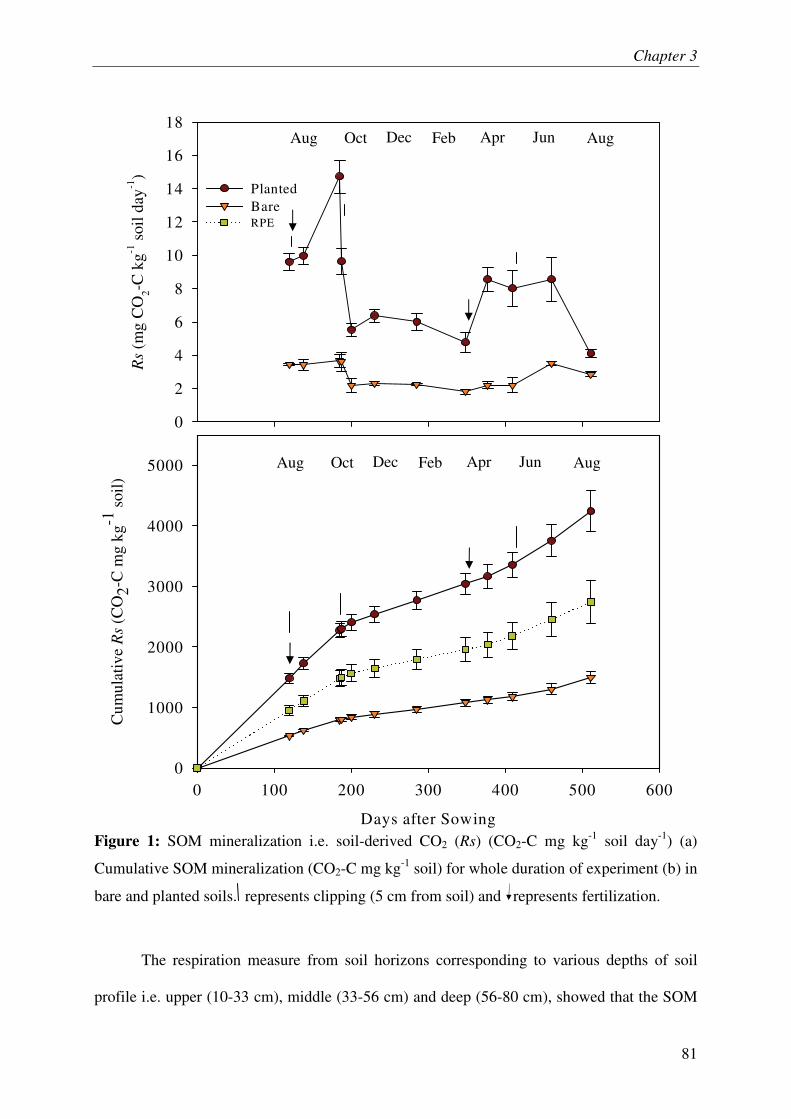
Chapter 3
81
Figure 1: SOM mineralization i.e. soil-derived CO2 (Rs) (CO2-C mg kg-1 soil day-1) (a)
Cumulative SOM mineralization (CO2-C mg kg-1 soil) for whole duration of experiment (b) in
bare and planted soils. represents clipping (5 cm from soil) and represents fertilization.
The respiration measure from soil horizons corresponding to various depths of soil
profile i.e. upper (10-33 cm), middle (33-56 cm) and deep (56-80 cm), showed that the SOM
Rs
(mg
CO
2-C k
g-1 s
oil d
ay-1
)
0
2
4
6
8
10
12
14
16
18
Days after Sowing
0 100 200 300 400 500 600
Cum
ulat
ive
Rs
(CO
2-C
mg
kg-1
soi
l)
0
1000
2000
3000
4000
5000
PlantedBareRPE
Aug Oct Dec Feb Apr Jun Aug
Aug Oct Dec Feb Apr Jun Aug
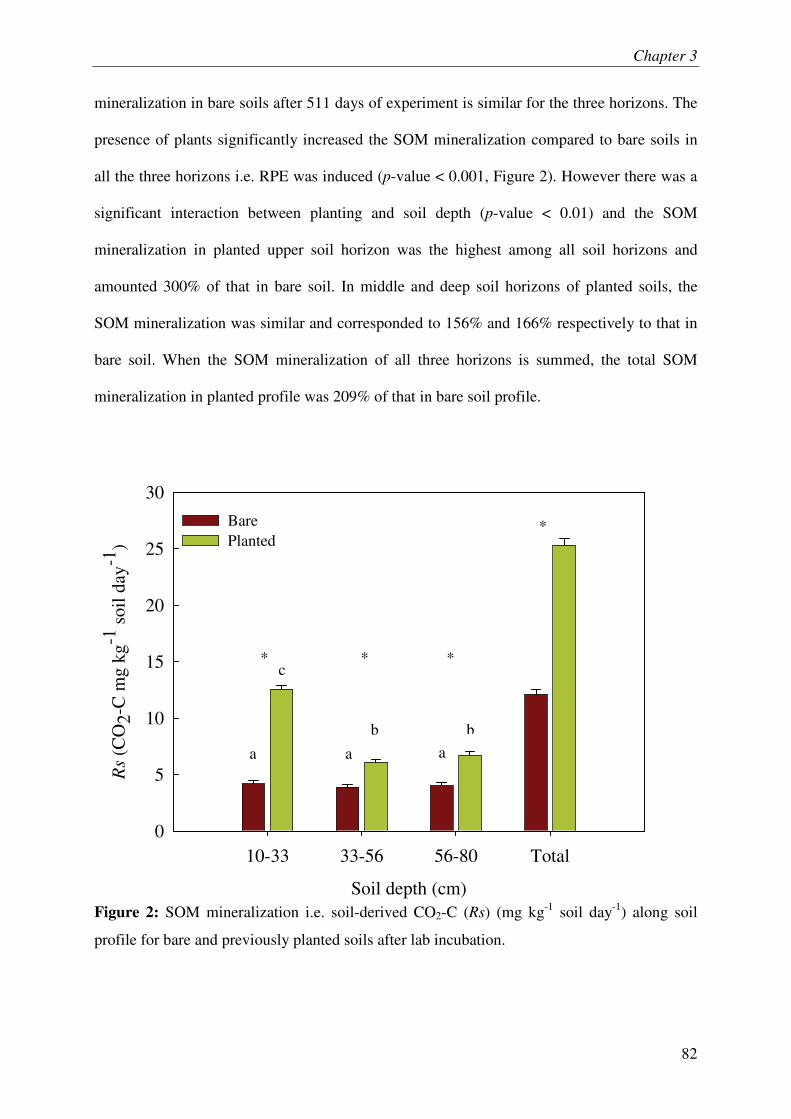
Chapter 3
82
mineralization in bare soils after 511 days of experiment is similar for the three horizons. The
presence of plants significantly increased the SOM mineralization compared to bare soils in
all the three horizons i.e. RPE was induced (p-value < 0.001, Figure 2). However there was a
significant interaction between planting and soil depth (p-value < 0.01) and the SOM
mineralization in planted upper soil horizon was the highest among all soil horizons and
amounted 300% of that in bare soil. In middle and deep soil horizons of planted soils, the
SOM mineralization was similar and corresponded to 156% and 166% respectively to that in
bare soil. When the SOM mineralization of all three horizons is summed, the total SOM
mineralization in planted profile was 209% of that in bare soil profile.
Figure 2: SOM mineralization i.e. soil-derived CO2-C (Rs) (mg kg-1 soil day-1) along soil
profile for bare and previously planted soils after lab incubation.
Soil depth (cm)
10-33 33-56 56-80 Total
Rs
(CO
2-C
mg
kg-1
soi
l day
-1)
0
5
10
15
20
25
30
Bare Planted
*
* * *
a
c
a
b
a
b
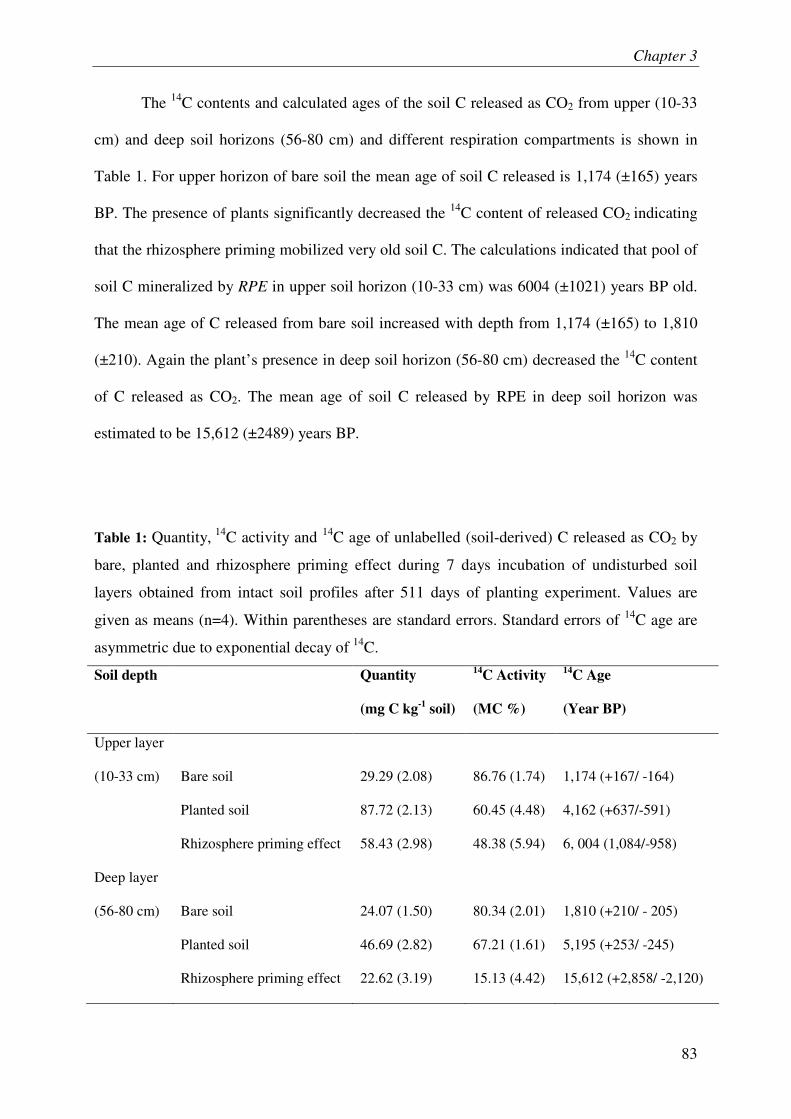
Chapter 3
83
The 14C contents and calculated ages of the soil C released as CO2 from upper (10-33
cm) and deep soil horizons (56-80 cm) and different respiration compartments is shown in
Table 1. For upper horizon of bare soil the mean age of soil C released is 1,174 (±165) years
BP. The presence of plants significantly decreased the 14C content of released CO2 indicating
that the rhizosphere priming mobilized very old soil C. The calculations indicated that pool of
soil C mineralized by RPE in upper soil horizon (10-33 cm) was 6004 (±1021) years BP old.
The mean age of C released from bare soil increased with depth from 1,174 (±165) to 1,810
(±210). Again the plant’s presence in deep soil horizon (56-80 cm) decreased the 14C content
of C released as CO2. The mean age of soil C released by RPE in deep soil horizon was
estimated to be 15,612 (±2489) years BP.
Table 1: Quantity, 14C activity and 14C age of unlabelled (soil-derived) C released as CO2 by
bare, planted and rhizosphere priming effect during 7 days incubation of undisturbed soil
layers obtained from intact soil profiles after 511 days of planting experiment. Values are
given as means (n=4). Within parentheses are standard errors. Standard errors of 14C age are
asymmetric due to exponential decay of 14C.
Soil depth Quantity
(mg C kg-1 soil)
14C Activity
(MC %)
14C Age
(Year BP)
Upper layer
(10-33 cm)
Bare soil
29.29 (2.08)
86.76 (1.74)
1,174 (+167/ -164)
Planted soil 87.72 (2.13) 60.45 (4.48) 4,162 (+637/-591)
Rhizosphere priming effect 58.43 (2.98) 48.38 (5.94) 6, 004 (1,084/-958)
Deep layer
(56-80 cm)
Bare soil
24.07 (1.50)
80.34 (2.01)
1,810 (+210/ - 205)
Planted soil 46.69 (2.82) 67.21 (1.61) 5,195 (+253/ -245)
Rhizosphere priming effect 22.62 (3.19) 15.13 (4.42) 15,612 (+2,858/ -2,120)
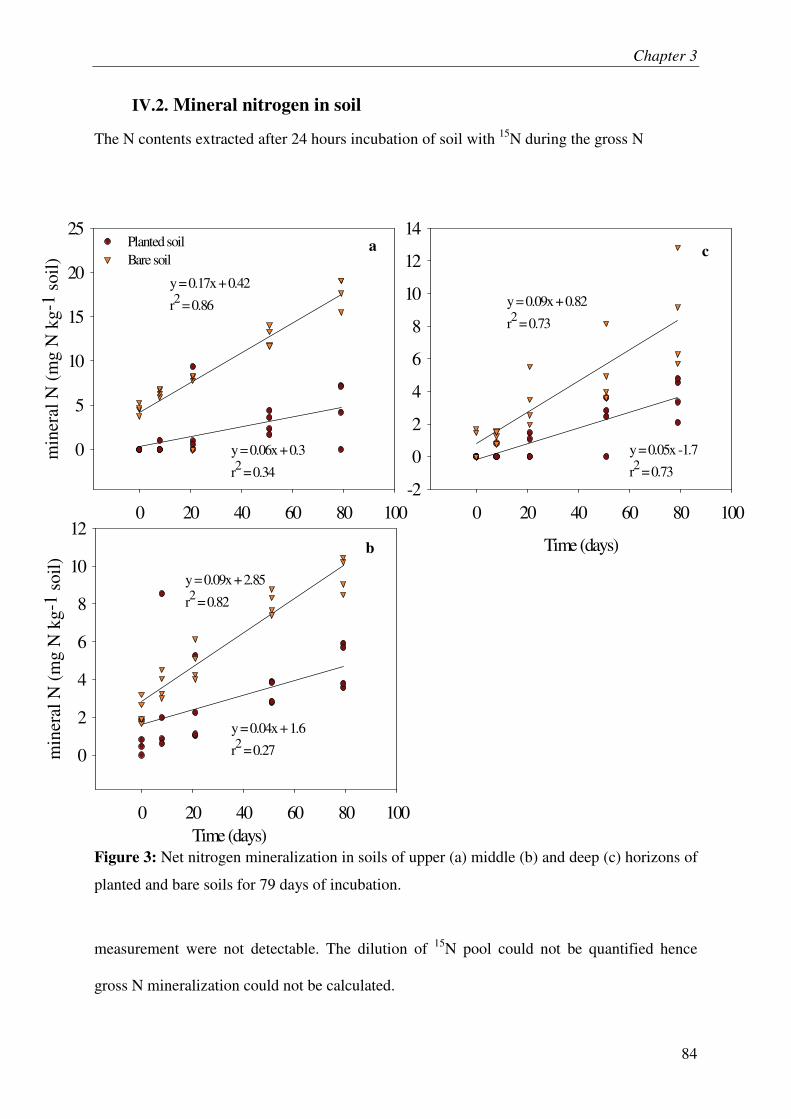
Chapter 3
84
IV.2. Mineral nitrogen in soil
The N contents extracted after 24 hours incubation of soil with 15N during the gross N
Figure 3: Net nitrogen mineralization in soils of upper (a) middle (b) and deep (c) horizons of
planted and bare soils for 79 days of incubation.
measurement were not detectable. The dilution of 15N pool could not be quantified hence
gross N mineralization could not be calculated.
0 20 40 60 80 100
min
eral
N (
mg
N k
g-1
soil)
0
5
10
15
20
25Planted soilBare soil
0 20 40 60 80 100
min
eral
N (
mg
N k
g-1
soil)
0
2
4
6
8
10
12Time (days)
0 20 40 60 80 100-2
0
2
4
6
8
10
12
14
Time (days)
y = 0.17x + 0.42
r2 = 0.86
y = 0.06x + 0.3
r2 = 0.34
y = 0.09x + 2.85
r2 = 0.82
y = 0.04x + 1.6
r2 = 0.27
y = 0.09x + 0.82
r2 = 0.73
y = 0.05x -1.7
r2 = 0.73
a
b
c
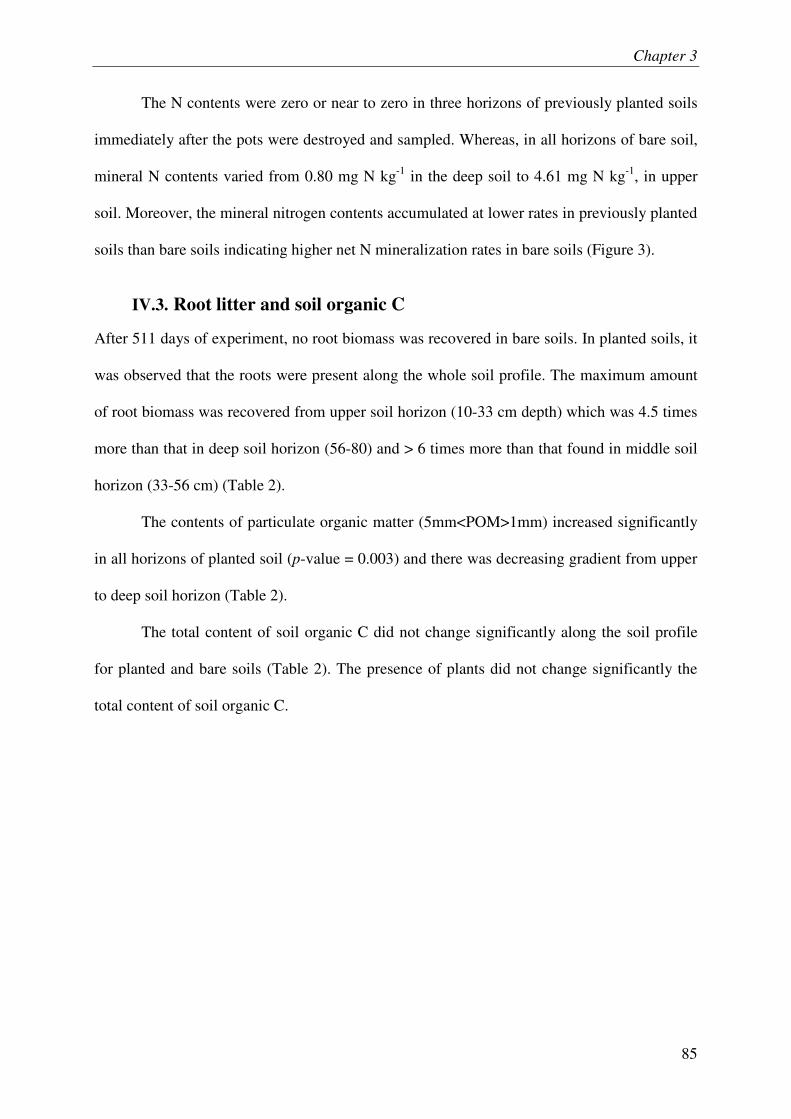
Chapter 3
85
The N contents were zero or near to zero in three horizons of previously planted soils
immediately after the pots were destroyed and sampled. Whereas, in all horizons of bare soil,
mineral N contents varied from 0.80 mg N kg-1 in the deep soil to 4.61 mg N kg-1, in upper
soil. Moreover, the mineral nitrogen contents accumulated at lower rates in previously planted
soils than bare soils indicating higher net N mineralization rates in bare soils (Figure 3).
IV.3. Root litter and soil organic C
After 511 days of experiment, no root biomass was recovered in bare soils. In planted soils, it
was observed that the roots were present along the whole soil profile. The maximum amount
of root biomass was recovered from upper soil horizon (10-33 cm depth) which was 4.5 times
more than that in deep soil horizon (56-80) and > 6 times more than that found in middle soil
horizon (33-56 cm) (Table 2).
The contents of particulate organic matter (5mm<POM>1mm) increased significantly
in all horizons of planted soil (p-value = 0.003) and there was decreasing gradient from upper
to deep soil horizon (Table 2).
The total content of soil organic C did not change significantly along the soil profile
for planted and bare soils (Table 2). The presence of plants did not change significantly the
total content of soil organic C.
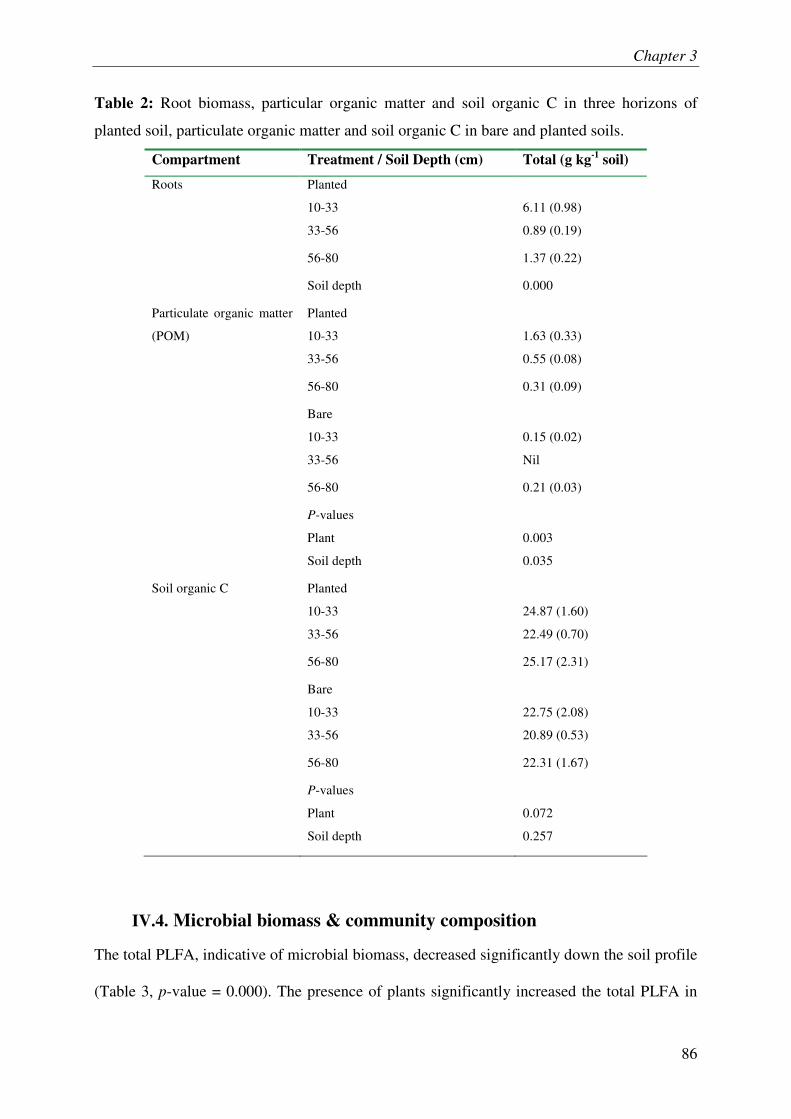
Chapter 3
86
Table 2: Root biomass, particular organic matter and soil organic C in three horizons of
planted soil, particulate organic matter and soil organic C in bare and planted soils.
Compartment Treatment / Soil Depth (cm) Total (g kg-1 soil)
Roots Planted
10-33
6.11 (0.98)
33-56 0.89 (0.19)
56-80 1.37 (0.22)
Soil depth 0.000
Particulate organic matter
(POM)
Planted
10-33
1.63 (0.33)
33-56 0.55 (0.08)
56-80 0.31 (0.09)
Bare
10-33
0.15 (0.02)
33-56 Nil
56-80 0.21 (0.03)
P-values
Plant
0.003
Soil depth 0.035
Soil organic C Planted
10-33
24.87 (1.60)
33-56 22.49 (0.70)
56-80 25.17 (2.31)
Bare
10-33
22.75 (2.08)
33-56 20.89 (0.53)
56-80 22.31 (1.67)
P-values
Plant
0.072
Soil depth 0.257
IV.4. Microbial biomass & community composition
The total PLFA, indicative of microbial biomass, decreased significantly down the soil profile
(Table 3, p-value = 0.000). The presence of plants significantly increased the total PLFA in
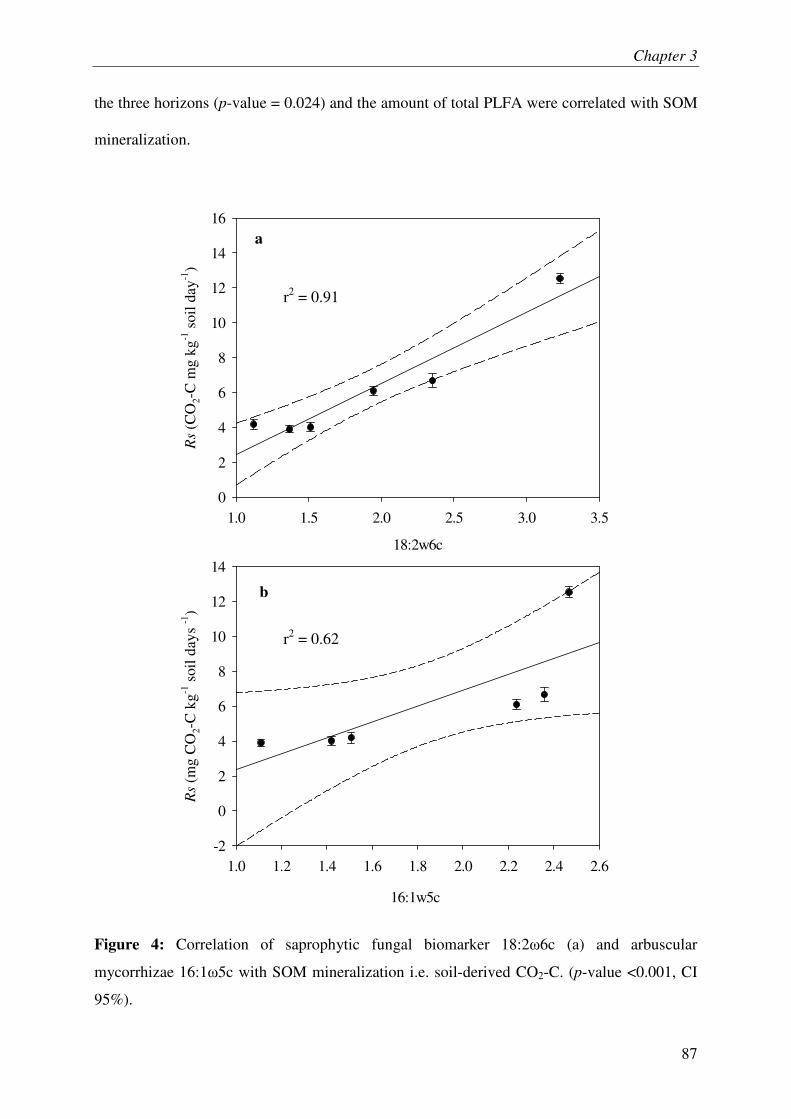
Chapter 3
87
the three horizons (p-value = 0.024) and the amount of total PLFA were correlated with SOM
mineralization.
Figure 4: Correlation of saprophytic fungal biomarker 18:2�6c (a) and arbuscular
mycorrhizae 16:1�5c with SOM mineralization i.e. soil-derived CO2-C. (p-value <0.001, CI
95%).
18:2w6c
1.0 1.5 2.0 2.5 3.0 3.5
Rs
(CO
2-C
mg
kg-1
soi
l day
-1)
0
2
4
6
8
10
12
14
16
16:1w5c
1.0 1.2 1.4 1.6 1.8 2.0 2.2 2.4 2.6
Rs
(mg
CO
2-C
kg-1
soi
l day
s -1
)
-2
0
2
4
6
8
10
12
14
a
b
r2 = 0.91
r2 = 0.62
Chapter 3
88
Generally, the relative abundance of Gram positive and Gram negative bacteria increased
down the soil profile (Table 3). In contrast the relative abundance of fungi decreased
significantly down the soil profile except 18:2�6c whose relative abundance remains constant
along the profile of bare soil. The relative abundance of arbuscular mycorrhizal fungi
(16:1�5c) did not change significantly along soil depth (p-value = 0.252).
Plants significantly increased the relative abundance of saprophytic fungal biomarker
i.e. 18:2�6c as well as biomarker of arbuscular mycorrhizae i.e. 16:1�5c (Table 3). The
relative abundances of saprophytic fungi and arbuscular mycorrhizae correlated with the
mineralization of SOM. However, the correlation involving saprophytic fungi was stronger
than that involving mycorrhizae (Figure 4).
Planting did not alter significantly the relative abundance of any biomarker of Gram
negative bacteria determined in this study i.e. 17:0cy, 19:0cy and 16:1�9c (Table 3).
However, the relative abundance of all Gram positive bacteria significantly increased under
planting except that of i17:0 which decreased significantly in planted soils. There was no
correlation between abundance of any of Gram positive bacteria and SOM mineralization.
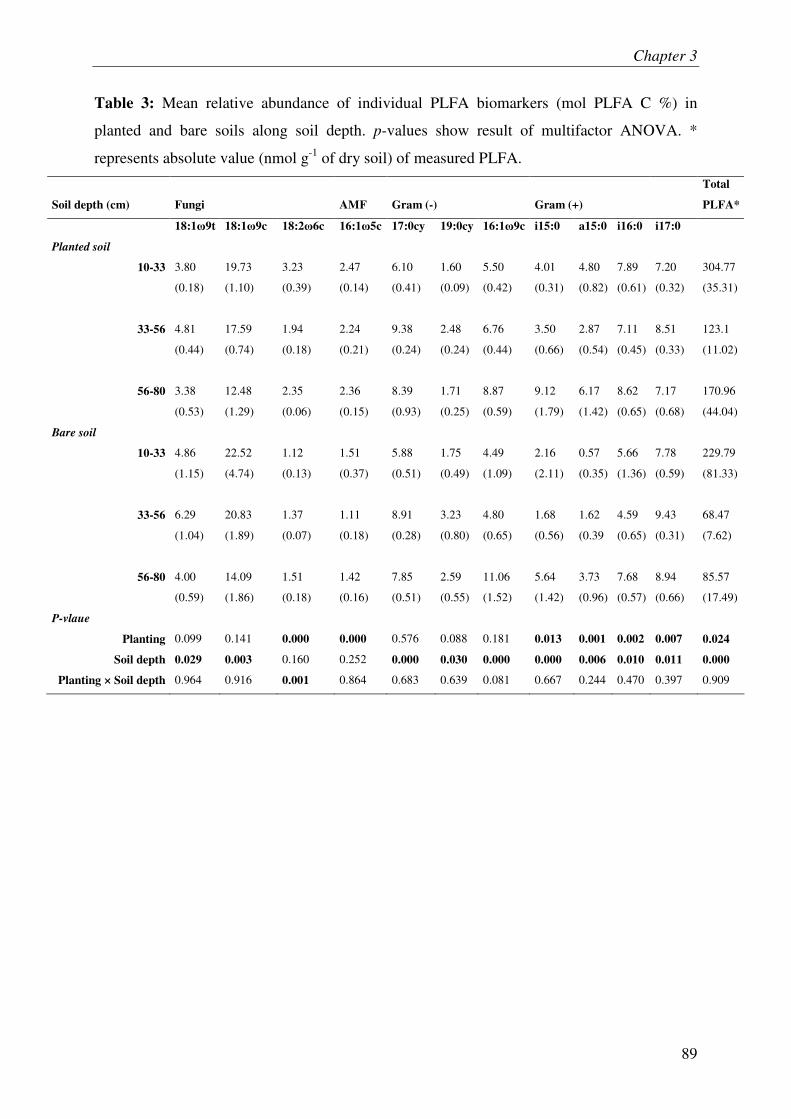
Chapter 3
89
Table 3: Mean relative abundance of individual PLFA biomarkers (mol PLFA C %) in
planted and bare soils along soil depth. p-values show result of multifactor ANOVA. *
represents absolute value (nmol g-1 of dry soil) of measured PLFA.
Soil depth (cm) Fungi AMF Gram (-) Gram (+)
Total
PLFA*
18:1�9t 18:1�9c 18:2�6c 16:1�5c 17:0cy 19:0cy 16:1�9c i15:0 a15:0 i16:0 i17:0
Planted soil
10-33
3.80
(0.18)
19.73
(1.10)
3.23
(0.39)
2.47
(0.14)
6.10
(0.41)
1.60
(0.09)
5.50
(0.42)
4.01
(0.31)
4.80
(0.82)
7.89
(0.61)
7.20
(0.32)
304.77
(35.31)
33-56
4.81
(0.44)
17.59
(0.74)
1.94
(0.18)
2.24
(0.21)
9.38
(0.24)
2.48
(0.24)
6.76
(0.44)
3.50
(0.66)
2.87
(0.54)
7.11
(0.45)
8.51
(0.33)
123.1
(11.02)
56-80
3.38
(0.53)
12.48
(1.29)
2.35
(0.06)
2.36
(0.15)
8.39
(0.93)
1.71
(0.25)
8.87
(0.59)
9.12
(1.79)
6.17
(1.42)
8.62
(0.65)
7.17
(0.68)
170.96
(44.04)
Bare soil
10-33
4.86
(1.15)
22.52
(4.74)
1.12
(0.13)
1.51
(0.37)
5.88
(0.51)
1.75
(0.49)
4.49
(1.09)
2.16
(2.11)
0.57
(0.35)
5.66
(1.36)
7.78
(0.59)
229.79
(81.33)
33-56
6.29
(1.04)
20.83
(1.89)
1.37
(0.07)
1.11
(0.18)
8.91
(0.28)
3.23
(0.80)
4.80
(0.65)
1.68
(0.56)
1.62
(0.39
4.59
(0.65)
9.43
(0.31)
68.47
(7.62)
56-80
4.00
(0.59)
14.09
(1.86)
1.51
(0.18)
1.42
(0.16)
7.85
(0.51)
2.59
(0.55)
11.06
(1.52)
5.64
(1.42)
3.73
(0.96)
7.68
(0.57)
8.94
(0.66)
85.57
(17.49)
P-vlaue
Planting 0.099 0.141 0.000 0.000 0.576 0.088 0.181 0.013 0.001 0.002 0.007
0.024
Soil depth 0.029 0.003 0.160 0.252 0.000 0.030 0.000 0.000 0.006 0.010 0.011 0.000
Planting × Soil depth 0.964 0.916 0.001 0.864 0.683 0.639 0.081 0.667 0.244 0.470 0.397 0.909
Chapter 3
90
V. Discussion
Rhizosphere priming effect reveals instability of deep soil C
Our results confirm that deep rooted plants are capable of accelerating the mineralization of
deep SOM. The rhizosphere priming effect RPE thus induced by deep roots mobilized soil
organic C that was stabilized for more than 15,000 years (Figure 2, Table 1). This indicates
that in the presence of energy, the mineralization capability of deep soil microbes is very
important and perhaps no form of C can resist microbial oxidation i.e. the inert or passive
pools defined in soil C models are degradable.
Our results support the hypothesis of Fontaine et al., (2007) that the stability of deep
soil C is due to the energy limitation of microbes. They suggested that in the absence of fresh
C the microbes can not mineralize humified recalcitrant SOM for long term because the
energetic expense to synthesize the extra cellular enzymes and maintain cellular activity is
more than the return they could get from SOM mineralization. This strong dependence of
microbial mineralization of SOM on the supply of fresh C is shown in our experiment (Figure
5) with strong correlation between RPE and fresh C (labelled) respired from planted soils.
This dependence could explain the seasonal fluctuation of RPE with plant growth seasons
resulting in production of higher biomass and RPE (Figure 1a, Dijkstra et al., 2006).
Accelerated SOM mineralization in planted soils shows that herbaceous plants are
capable of inducing rhizosphere priming effect in unperturbed soil profiles as in shallower
and perturbed soils (Shahzad et al. unpublished, First chapter of this thesis). Moreover, this
RPE was maintained for more than 500 days and occurred in all soil horizons. Collectively,
these results indicate that a substantial part of soil C, comprising even the C that is considered
inert, is vulnerable to RPE. They signify that priming effect and its mechanisms
(mineralization rate driven by microbial activity and diversity, energy availability etc.) should
be included in models in order to predict consequences of global vegetation changes,
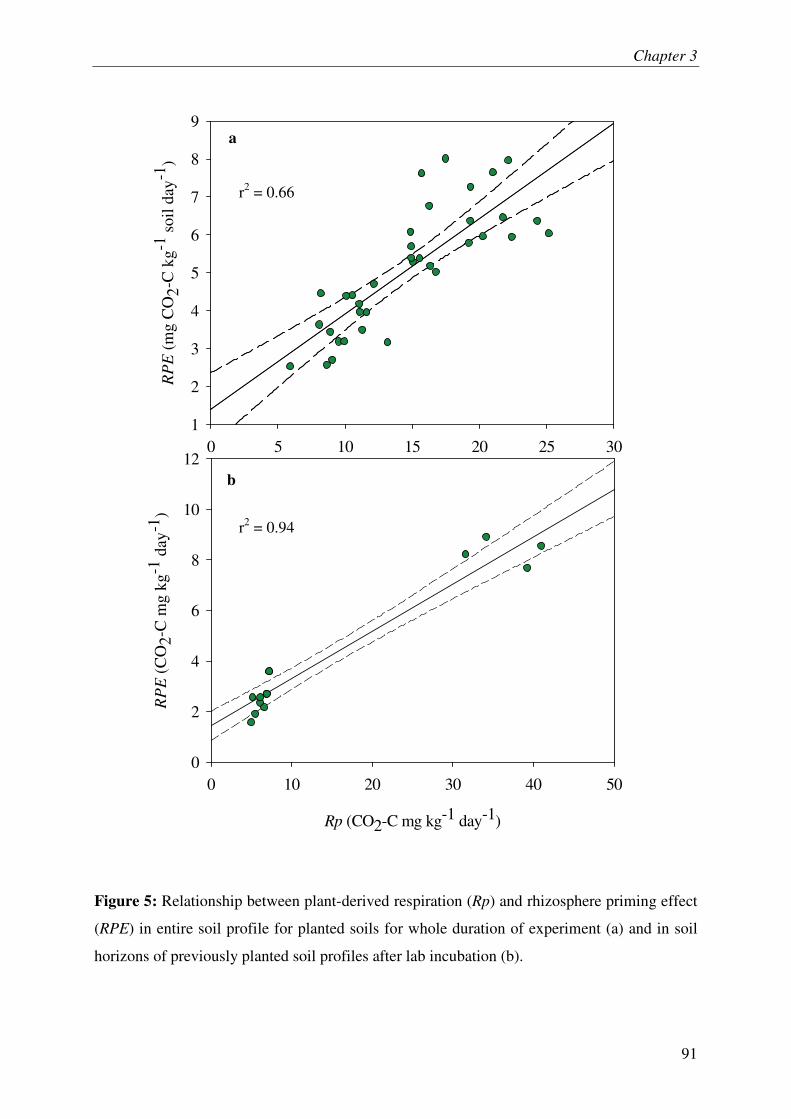
Chapter 3
91
Figure 5: Relationship between plant-derived respiration (Rp) and rhizosphere priming effect
(RPE) in entire soil profile for planted soils for whole duration of experiment (a) and in soil
horizons of previously planted soil profiles after lab incubation (b).
0 5 10 15 20 25 30
RP
E (
mg
CO
2-C
kg-1
soi
l day
-1)
1
2
3
4
5
6
7
8
9
Rp (CO2-C mg kg-1 day-1)
0 10 20 30 40 50
RP
E (
CO
2-C
mg
kg-1
day
-1)
0
2
4
6
8
10
12
a
b
r2 = 0.66
r2 = 0.94
Chapter 3
92
specifically the associated change in plant rooting depths, on soil C storage.
The 14C age of CO2-C released from upper horizon (10-33 cm) of bare soil (1,174
±165 years BP) is older than that reported by Fontaine et al. (2007) on same site (< 50 yrs).
However our study used 10-33 cm horizon of soil whereas Fontaine et al., (2007) used 0-20
cm. Given that the most of root biomass is concentrated in first 10 cm of soil profile, the entry
of recent fresh C in 10-33 cm horizon is relatively lower than in the 0-20 horizon studied by
Fontaine et al., (2007). Moreover, the 14C dating on CO2-C released from bare soils in our
study was done after 511 days of incubation in the absence of fresh C supply. These two
reasons explain why the recent fresh C content in the 10-33 cm horizon used in this study is
ten times less than in the 0-20 cm horizon studied by Fontaine et al., (2007). As a result, the
contribution of recent fresh C in total soil respiration is higher in the study of Fontaine et al.,
(2007) than our study contributing to the observed difference in mean age.
Our experiment was not able to determine whether the increased SOM mineralization
in planted soils could result in higher release of N from SOM. Indeed, the added 15N was
completely immobilized in previously planted soil after 24 hours of incubation and it was
impossible to measure gross N mineralization. The deposition of fresh C in planted soils
could have accelerated the immobilization of mineral N by increased microbial biomass in
planted soils (Jonasson et al., 1996; Schmidt et al., 1997; Dijkstra et al., 2006). Moreover, the
high immobilization of nitrogen in planted soils induced significantly lower net N
mineralization as compared to that in bare soils (Figure 4). Therefore, our study encourages
future research on whether the RPE induced by deep plant roots in deep soil layers could
increase the mineral N availability from ancient SOM and its uptake by plant. This research
should apply larger quantity of 15N labelled mineral N than previously suggested
(Barraclough 1991) in order to quantify gross N mineralization in grasslands. Moreover, the
Chapter 3
93
resins can be used to simulate plant N uptake during soil incubation with fresh C and quantify
the N release from SOM due to priming effect.
The strong correlation between the saprophytic fungal biomarker (18:2�6c) and SOM
mineralization (Figure 5) concurs with previous lab incubations (Fontaine et al., 2011) and
experiment with plants (First chapter of this thesis) showing that this is the only biomarker
that is positively linked to priming effect. Collectively, these results suggest that the fungi
represented by this biomarker are key actors in mineralization of SOM and RPE. It is
interesting to note that this biomarker is present in deep soil horizons and is stimulated by the
rhizodeposition of deep roots of Festuca arundinaceae. Thus, the stability of deep soil C is
mainly due to limitation of energy for microbial activity and not due to a lack of SOM
mineralizing microbes in deep soil. Moreover, the fact the priming effect is induced by the
fungi which have hyphae structures signify that two distinct theories for explaining the
stability of deep soil C, i.e. energy limitation of microbes (Fontaine et al., 2007) and spatial
separation between microbial and soil C distributions (Salomé et al., 2010, Schimel et al.,
2011), can be merged. Indeed, the spatial separation between deep soil C and microbial
biomass is due to the lack of energy for the fungi to construct their hyphae which allow them
to colonize soil volumes and access thinly dispersed SOM reserves.
Our results also show positive correlation between mycorrhizae (16:1�5c) and SOM
mineralization (Figure 5). It is commonly believed that the enzymatic and degradation
capabilities of mycorrhizae are limited suggesting this correlation could not have cause-and-
effect link. For example, mycorrhizae depend on root biomass which also determines the
amount of fresh C supplied in soil and thereby the RPE intensity. However, Hodge et al.
(2001) have suggested that the ability of some arbuscular mycorrhizal fungus to accelerate
decomposition and acquire nitrogen directly from organic material. We therefore encourage
Chapter 3
94
new investigation to test directly test the role of mycorrhizae in recalcitrant SOM
mineralization.
VI. Conclusion
Our study showed conclusively that the organic carbon in deep soil layers of a Cambisol is
stable due to energy limitation (limited supply of labile C) of microbes. A deep rooted
grassland plant, Festuca arundinacea, has been shown to induce the mineralization of almost
15,000 years old C from deep soil by stimulating and changing the microbial community
through rhizodeposition. Moreover, our study supports the previous idea that the saprophytic
fungi represented by 18:2�6c biomarker are key actors in SOM mineralization and RPE. The
vulnerability of deep soil C to rhizosphere priming effect in response to labile C supply
warrants further research on the proposals of incorporation of organic matter in deep soils for
its sequestration there implying its long term stabilization (Lorenz and Lal 2005). We suggest
long term field experiments to assess net balance of deep soil C between emissions from and
sequestration in deep soil under deep rooted plants
Chapter 3
95
VII. References
Barraclough, D., 1991. The use of mean pool abundances to interpret 15N tracer experiments
I. Theory. Plant and Soil 131, 89-96.
Batjes, N.H., 1996. Total carbon and nitrogen in the soils of the world. European Journal of
Soil Science 47, 151-163.
Bernard, L., Mougel, C., Maron, P.-A., Nowak, V., Lévêque, J., Henault, C., Haichar, F.e.Z.,
Berge, O., Marol, C., Balesdent, J., Gibiat, F., Lemanceau, P., Ranjard, L., 2007.
Dynamics and identification of soil microbial populations actively assimilating carbon
from 13C-labelled wheat residue as estimated by DNA- and RNA-SIP techniques.
Environmental Microbiology 9, 752-764.
Bligh, E.G., Dyer, W.J., 1959. A rapid method of total lipid extraction and purification.
Canadian Journal of Biochemistry and Physiology 37, 911-917.
Boivin, P. et al., 2004. Volcanologie de la Chaîne des Puys. Parc naturel régional de la chaîne
des puys, Clermont Ferrand.
Cheng, W., Johnson, D.W., Fu, S., 2003. Rhizosphere effects on decomposition: controls of
plant species, phenology, and fertilization. Soil Science Sciety of America Journal.
67, 1418-1427.
Dijkstra, F.A., Cheng, W., 2007. Interactions between soil and tree roots accelerate long-term
soil carbon decomposition. Ecology Letters 10, 1046-1053.
Dijkstra, F.A., Cheng, W., Johnson, D.W., 2006. Plant biomass influences rhizosphere
priming effects on soil organic matter decomposition in two differently managed soils.
Soil Biology and Biochemistry 38, 2519-2526.
Dijkstra, F.A., Hutchinson, G.L., Reeder, J.D., LeCain, D.R., Morgan, J.A., 2011. Elevated
CO2, but not defoliation, enhances N cycling and increases short-term soil N
Chapter 3
96
immobilization regardless of N addition in a semiarid grassland. Soil Biology and
Biochemistry 43, 2247-2256.
Dowling, N.J.E., Widdel, F., White, D.C., 1986. Phospholipid ester-linked fatty acid
biomarkers of acetate-oxidizing sulphate-reducers and other sulphide-forming
bacteria. Journal of General Microbiology 132, 1815-1825.
Fontaine, S., Barot, S., Barre, P., Bdioui, N., Mary, B., Rumpel, C., 2007. Stability of organic
carbon in deep soil layers controlled by fresh carbon supply. Nature 450, 277-280.
Fontaine, S., Henault, C., Aamor, A., Bdioui, N., Bloor, J.M.G., Maire, V., Mary, B.,
Revaillot, S., Maron, P.A., 2011. Fungi mediate long term sequestration of carbon and
nitrogen in soil through their priming effect. Soil Biology and Biochemistry 43, 86-96.
Frostegard, A., Tunlid, A., Baath, E., 1991. Microbial biomass measured as total lipid
phosphate in soils of different organic content. Journal of Microbiological Methods
14, 151-163.
Hodge, A., Campbell, C.D., Fitter, A.H., 2001. An arbuscular mycorrhizal fungus accelerates
decomposition and acquires nitrogen directly from organic material. Nature 413, 297-
299.
Jobbagy, E.G., Jackson, R.B., 2000. The vertical distribution of soil organic carbon and its
relation to climate and vegetation. Ecological Applications 10, 423-436.
Jonasson, S., Michelsen, A., Schmidt, I.K., Nielsen, E.V., Callaghan, T.V., 1996. Microbial
biomass C, N and P in two arctic soils and responses to addition of NPK fertilizer and
sugar: implications for plant nutrient uptake. Oecologia 106, 507-515.
Lorenz, K., Lal, R., Donald, L.S., 2005. The depth distribution of soil organic carbon in
relation to land use and management and the potential of carbon sequestration in
subsoil horizons. Advances in Agronomy. Academic Press, pp. 35-66.
Chapter 3
97
Loiseau, P., Soussana, J.F., 1999. Elevated [CO2], temperature increase and N supply effects
on the turnover of below-ground carbon in a temperate grassland ecosystem. Plant and
Soil 210, 233-247.
Nottingham, A.T., Griffiths, H., Chamberlain, P.M., Stott, A.W., Tanner, E.V.J., 2009. Soil
priming by sugar and leaf-litter substrates: A link to microbial groups. Applied Soil
Ecology 42, 183-190.
Personeni, E., Loiseau, P., 2004. How does the nature of living and dead roots affect the
residence time of carbon in the root litter continuum? Plant and Soil 267, 129-141.
Rumpel, C., Kögel-Knabner, I., 2011. Deep soil organic matter- a key but poorly understood
component of terrestrial C cycle. Plant and Soil 338, 143-158.
Salomé, C., Naoise, N., ValéRie, P., Thomas Z, L., Claire, C., 2009. Carbon dynamics in
topsoil and in subsoil may be controlled by different regulatory mechanisms. Global
Change Biology 16, 416-426.
Schimel, J.P., Wetterstedt, J.Ã.M., Holden, P.A., Trumbore, S.E., 2011. Drying/rewetting
cycles mobilize old C from deep soils from a California annual grassland. Soil
Biology and Biochemistry 43, 1101-1103.
Schmidt, I.K., Michelsen, A., Jonasson, S., 1997. Effects of labile soil carbon on nutrient
partitioning between an arctic graminoid and microbes. Oecologia 112, 557-565.
Sombroeck, W.G., Nachtergaele, F.O., Hebel, A., 1993. Amounts, dynamics and sequestering
of carbon in tropical and subtropical soils. Ambio 22, 417-426.
Trumbore, S., 2000. Age of soil organic matter and soil respiration: radiocarbon constraints
on belowground C dynamics. Ecological Applications 10, 399-411.
98
CHAPTER 4
Temperature response of organic C mineralization: a new
experimentally tested theory based on enzyme inactivation and
microbial energy limitation reconciles the results of lab and
ecosystem experiments
Chapter 4
99
TEMPERATURE RESPONSE OF ORGANIC C
MINERALIZATION: A NEW EXPERIMENTALLY TESTED
THEORY BASED ON ENZYME INACTIVATION AND
MICROBIAL ENERGY LIMITATION RECONCILES THE
RESULTS OF LAB AND ECOSYSTEM EXPERIMENTS
Tanvir SHAHZADa, Gaël ALVAREZa,c, Claire CHENUb, Vincent MAIREa, Nazia
PERVEENa, Sébastien FONTAINEa*
Postal address:
aUR 874, INRA-UREP. 234- Avenue du Brézet 63100 Clermont Ferrand, France.
bUMR BIOEMCO (Biogéochimie et Ecologie des Milieux Continentaux) AgroParisTech
Grignon 78850 Thiverval Grignon France.
cClermont Université, VetAgro Sup, 63000, Clermont-Ferrand, France.
Email Address:
*Author for correspondence
Tanvir SHAHZAD
Email: [email protected]
Telephone: +33 626 93 81 82
Fax: +33 473 62 44 57
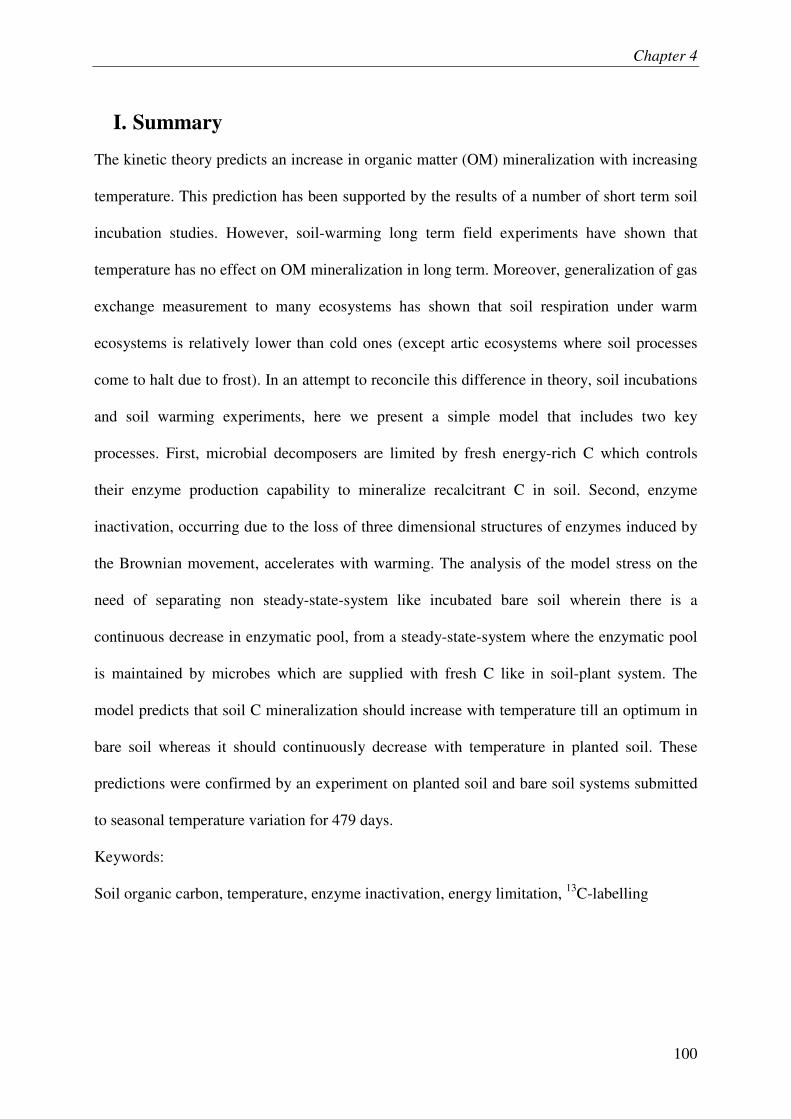
Chapter 4
100
I. Summary
The kinetic theory predicts an increase in organic matter (OM) mineralization with increasing
temperature. This prediction has been supported by the results of a number of short term soil
incubation studies. However, soil-warming long term field experiments have shown that
temperature has no effect on OM mineralization in long term. Moreover, generalization of gas
exchange measurement to many ecosystems has shown that soil respiration under warm
ecosystems is relatively lower than cold ones (except artic ecosystems where soil processes
come to halt due to frost). In an attempt to reconcile this difference in theory, soil incubations
and soil warming experiments, here we present a simple model that includes two key
processes. First, microbial decomposers are limited by fresh energy-rich C which controls
their enzyme production capability to mineralize recalcitrant C in soil. Second, enzyme
inactivation, occurring due to the loss of three dimensional structures of enzymes induced by
the Brownian movement, accelerates with warming. The analysis of the model stress on the
need of separating non steady-state-system like incubated bare soil wherein there is a
continuous decrease in enzymatic pool, from a steady-state-system where the enzymatic pool
is maintained by microbes which are supplied with fresh C like in soil-plant system. The
model predicts that soil C mineralization should increase with temperature till an optimum in
bare soil whereas it should continuously decrease with temperature in planted soil. These
predictions were confirmed by an experiment on planted soil and bare soil systems submitted
to seasonal temperature variation for 479 days.
Keywords:
Soil organic carbon, temperature, enzyme inactivation, energy limitation, 13C-labelling
Chapter 4
101
II. Introduction
Arrhenius equation (Arrhenius, 1889) has been used to describe the relationship of the
velocity of a reaction with temperature either in its original form (Thierron and Laudelout,
1996) or in modified forms (Eyring 1935; Lloyd and Taylor, 1994). This equation is given as:
)/(. RTEAeak
−=
(1)
where k is the reaction rate, a is a pre-exponential factor, corresponding to the theoretical
reaction rate in the absence of activation energy, EA is the required activation energy to start a
reaction; R is the gas constant and T is temperature (K). This equation predicts an increase in
organic matter mineralization with increasing temperature. It also predicts that the
temperature response of organic matter mineralization increases with its recalcitrance (i.e.
higher EA values). The predictions of this equation are supported by short term enzyme
assays (Daniel and Danson 2010) and soil incubations (Kirschbaum, 1995; Waldrop and
Firestone, 2004; Knorr et al., 2005) which show a positive relationship between temperatures,
enzymatic activities and soil respiration till an optimum temperature. They are also supported
by the general positive relationship between daily fluctuations of temperature and those of
ecosystem respiration fluxes measured in ecosystems by eddy covariance (Pilegaard et al.,
2001). However, a meta-analysis on twenty ecosystems along latitudinal gradient showed that
the mean annual temperature is positively related to the annual net ecosystem productivity
(i.e. annual C fixation by ecosystem) suggesting that soil respiration under warm ecosystems
is relatively lower than cold ones (Sanderman et al., 2003). It must be noted that this study
does not include artic ecosystems (Tundra, Taiga) where soil and plant processes are stopped
by the frost for most of the year. Moreover, soil warming field experiments have shown that
the temperature-induced acceleration in soil respiration only occurs for few years and the
Chapter 4
102
effect of temperature on soil respiration subsides in the long term (Melillo et al., 2002;
Eliasson et al., 2005). These results suggested that mineralization of the large pool of
recalcitrant C present in soils is not accelerated by warming (Giardina and Ryan 2000).
To reconcile these differences between theory, results of soil incubations and field
experiments, here we present an alternative theory to explain the effect of temperature on
velocity of enzymatic reactions and recalcitrant organic matter mineralization. This theory
was tested in a soil-plant experiment quantifying the effect of temperature on recalcitrant soil
organic carbon (Cr) mineralization.
III. Theory
In this alternative theory, we take into account two key processes which are often overlooked
while modeling or describing the experimental results of effect of temperature on enzymatic
activities and organic matter mineralization.
1) Energy limitation of microbial decomposers: the availability of fresh energy-rich
substrates supplied by autotrophs (plant, phytoplankton) is low and limiting for decomposer
communities in terrestrial and aquatic ecosystems (Paul and Clark, 1989; Guenet et al., 2010).
Moreover, the recalcitrant organic matters, which constitute major form of C present in
terrestrial and aquatic ecosystems, are too poor in available energy to sustain biological
activity (Fontaine et al., 2007; Guenet et al., 2010). The decomposers degrade recalcitrant
organic matters through co-metabolism with fresh energy-rich substrates (Bingeman et al.,
1953; Kuzyakov 2000). This energy limitation of decomposers that produce enzymes must be
taken into account to predict the effect of temperature on enzymatic reactions.
2) Temperature dependent inactivation of enzymes: the enzymes undergo inactivation
along the course of time due to loss of their three dimensional structure induced by Brownian
movement (Massey et al., 1966). The temperature increase accelerates the Brownian
movement and hence the inactivation of enzymes. Although this inactivation of enzymes is
Chapter 4
103
taken into account in enzymology, this process is not considered to explain the response of
ecosystems to temperature changes.
The mineralization of recalcitrant soil organic C (Cr) can be modelled as an enzymatic
reaction where the substrate (Cr) is not limiting (Fontaine and Barot 2005) and the rate of
reaction (Vmax) depends on the concentration of active enzyme (E) and the temperature-
dependent specific catalytic activity of enzymes (kcat):
[ ]
[ ]Ekdt
CdV cat
r .max == (1)
The concentration of active enzymes in soil can be determined as the difference between
microbial production of new enzymes and inactivation of enzymes. The production of
enzymes is limited by the flux of fresh energy-rich substrates (�f) and the inactivation rate of
enzymes (kinact) is temperature dependent:
[ ] [ ]Ekdt
Edinactf .. −Φ= ω (2)
where � is the fraction of fresh substrates that microbes allocate to synthesize enzymes.
The specific catalytic activity (kcat) and the inactivation rate of enzymes (kinact) can be
determined using Arrhenius equation:
RTEAcat
cateAk/. −
= (3)
RTEAinact
inacteAk/. −
= (4)
The integration of these equations with respect to time gives:
[ ] ��
���
�+−
Φ=
−− tktk
inact
f
catinactinact eEe
kktV
.0
.max .)1(
..)(
ω
(5)
where [E0] is the concentration of enzymes at time zero.
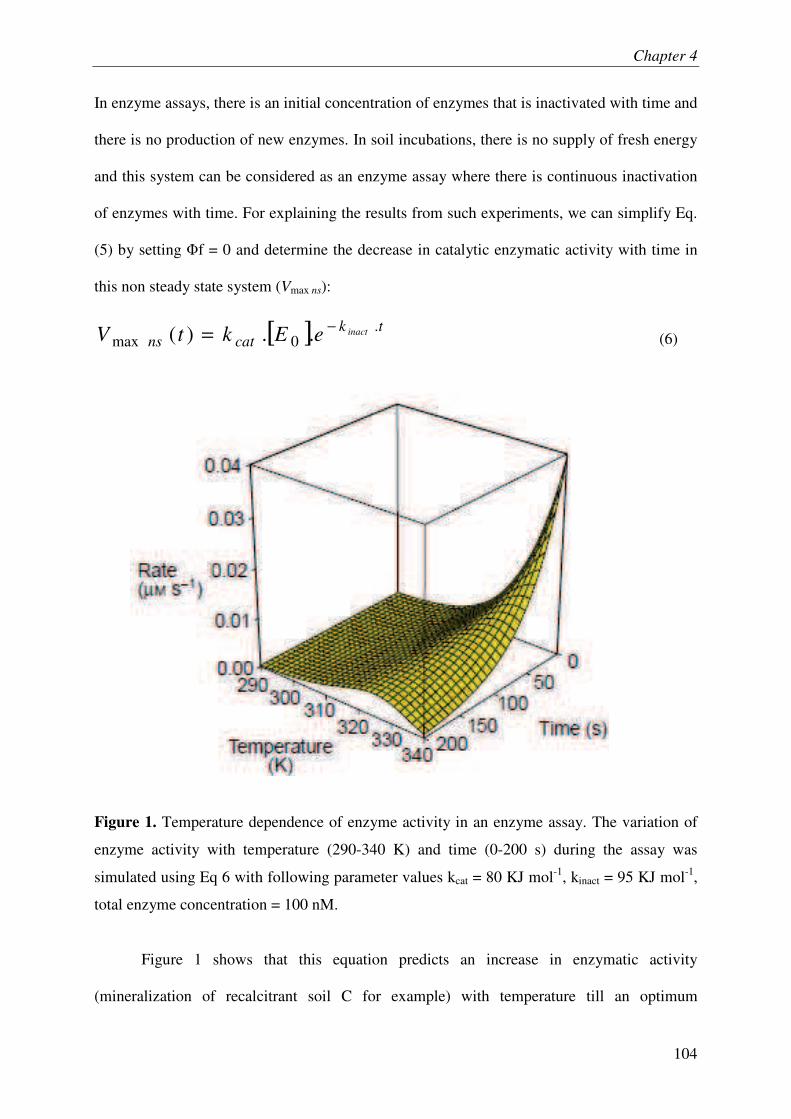
Chapter 4
104
In enzyme assays, there is an initial concentration of enzymes that is inactivated with time and
there is no production of new enzymes. In soil incubations, there is no supply of fresh energy
and this system can be considered as an enzyme assay where there is continuous inactivation
of enzymes with time. For explaining the results from such experiments, we can simplify Eq.
(5) by setting �f = 0 and determine the decrease in catalytic enzymatic activity with time in
this non steady state system (Vmax ns):
[ ] tkcatns
inacteEktV.
0max ..)( −= (6)
Figure 1. Temperature dependence of enzyme activity in an enzyme assay. The variation of
enzyme activity with temperature (290-340 K) and time (0-200 s) during the assay was
simulated using Eq 6 with following parameter values kcat = 80 KJ mol-1, kinact = 95 KJ mol-1,
total enzyme concentration = 100 nM.
Figure 1 shows that this equation predicts an increase in enzymatic activity
(mineralization of recalcitrant soil C for example) with temperature till an optimum
Chapter 4
105
temperature beyond which temperature-induced inactivation of enzymes is greater than
temperature-induced stimulation of specific enzymatic activity. It is interesting to note that
Eq. 6 corresponds to the classical equation used by enzymologists to depict the variation of
enzymatic activity with temperature and time (Copeland 2000).
In ecosystems, there is continuous production of new enzymes by soil microorganisms
that compensates for the fraction of enzymes that is being inactivated. In such ecosystems, the
enzymatic pool is maintained over long term thanks to generations of microorganisms that
succeed. Mathematically, this maintenance of enzymatic pool over long term can be
assimilated to a system at steady state. Therefore, the equations 1 & 2 were set to zero in
order to calculate size of enzymatic pool (E*) and velocity of enzymatic reaction (Vmax*)
when the system is at steady state:
inact
f
kE
Φ=
.*
ω (7)
inact
f
catk
kVΦ
=.
.*max
ω (8)
)(
max ..* RT
EAEA
f
catinact
eV
−
Φ= ω (9)
According to Eq. 9, the effect of temperature on velocity of an enzymatic reaction at steady
state is thus determined by difference between energies of activation required for enzyme
inactivation (EAinact) and specific enzyme activity (EAcat). As shown by Figure 2, model
analyzed at steady state does not predict an optimum temperature for enzyme activity. In
contrast, enzymatic reaction decreases or increases continuously with temperature depending
on the difference between energies of activation i.e. EAinact & EAcat. In literature, EAinact has
always been found higher than EAcat (Peterson et al., 2007; Daniel and Danson 2010)
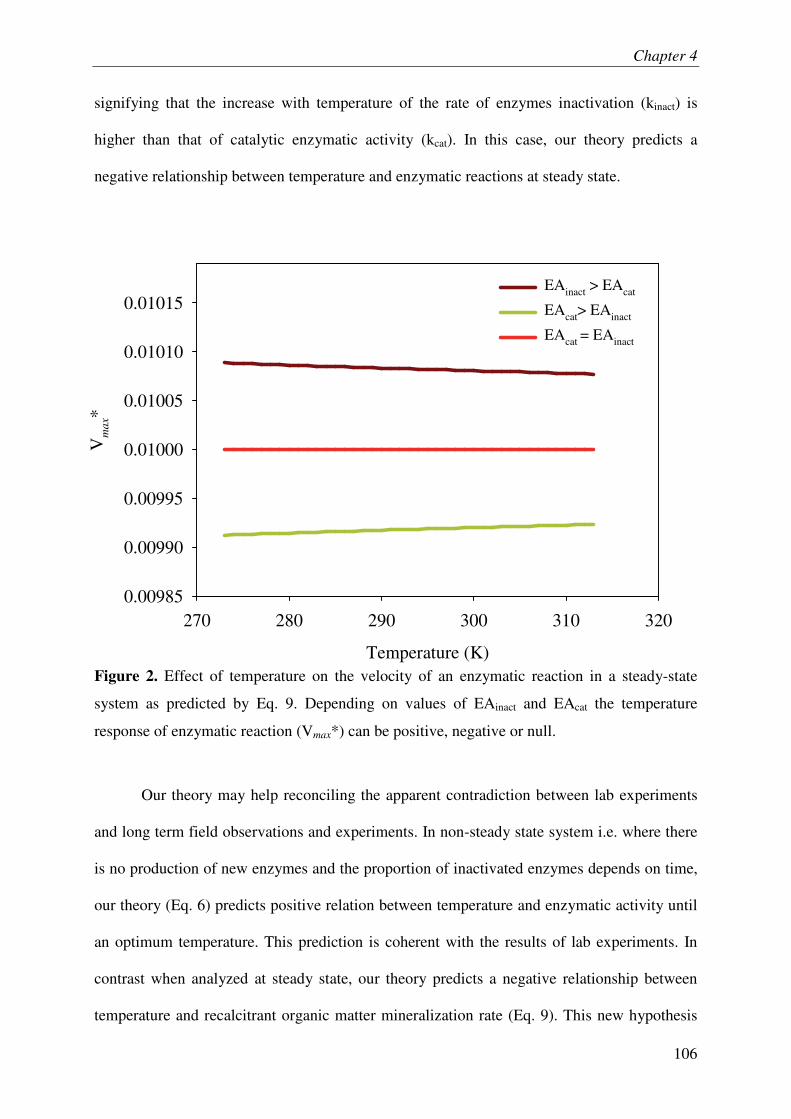
Chapter 4
106
signifying that the increase with temperature of the rate of enzymes inactivation (kinact) is
higher than that of catalytic enzymatic activity (kcat). In this case, our theory predicts a
negative relationship between temperature and enzymatic reactions at steady state.
Figure 2. Effect of temperature on the velocity of an enzymatic reaction in a steady-state
system as predicted by Eq. 9. Depending on values of EAinact and EAcat the temperature
response of enzymatic reaction (Vmax*) can be positive, negative or null.
Our theory may help reconciling the apparent contradiction between lab experiments
and long term field observations and experiments. In non-steady state system i.e. where there
is no production of new enzymes and the proportion of inactivated enzymes depends on time,
our theory (Eq. 6) predicts positive relation between temperature and enzymatic activity until
an optimum temperature. This prediction is coherent with the results of lab experiments. In
contrast when analyzed at steady state, our theory predicts a negative relationship between
temperature and recalcitrant organic matter mineralization rate (Eq. 9). This new hypothesis
Temperature (K)
270 280 290 300 310 320
Vm
ax*
0.00985
0.00990
0.00995
0.01000
0.01005
0.01010
0.01015EAinact > EAcat
EAcat> EAinact
EAcat = EAinact
Chapter 4
107
may explain the positive relationship between mean annual temperatures along a latitudinal
gradient with net ecosystem productivity. It may also explain why soil warming in field
experiment does not induce long term loss of soil organic matter.
IV. Experimental test
Using experimental approach, we aimed to determining the relationship between temperature
and recalcitrant organic C mineralization in a plant-soil system near to steady state i.e. a
system where there is a continuous supply of fresh substrate and microbial production of new
enzymes. Plant-soil system consisted of a grassland species, Lolium perenne, was grown on
subsoil where major form of C is recalcitrant. The soil-plant system was placed in a
mesocosm for 479 days where plants benefited from natural light and temperature and were
continuously exposed to 13C labelled CO2. The continuous 13C labelling of plants permitted to
separate soil-derived recalcitrant C from soil-plant derived fresh C (13C) during measurement
of respiration of plant-soil system. Systems with bare soil were also prepared in order to
determine the response of non-steady-state system to temperature. The seasonal temperature
variation was used to determine the effect of temperature on recalcitrant C mineralisation.
Given that the mean residence time of enzymes in soil solution is relatively short (hours-
days), we considered that the pool of enzymes (E*) and hence the mineralization rate (Vmax*)
at a given time i are in equilibrium at the temperature (Ti) and the flux of fresh C (�fi) of the
moment. Thus for each equilibrium (i), we calculate the mineralization of recalcitrant soil C
(Vmax i*) as:
)(
max ..* i
catinact
RT
EAEA
fiieV
−
Φ= ω (10)
In order to determine the effect of temperature independently of the flux of fresh C, the
mineralization of recalcitrant soil C (Vmax i*) was expressed per unit of flux of fresh C:
Chapter 4
108
)(max .
*i
catinact
RT
EAEA
fi
i eV
−
=Φ
ω (11)
The effect of temperature on mineralization of recalcitrant soil C was quantified on six other
grassland species using the same approach in order to generalize the results of our theory at
steady state. On the basis of model predictions, we hypothesized that the recalcitrant soil
organic C mineralization should increase with temperature in bare soil whereas it should
decrease with temperature in planted soil.
V. Materials and methods
V.1. Soil sampling and experimental design
The soil used in this experiment was sampled from an upland grassland located in the
environmental research observatory (ORE) established by the French National Institute for
Agricultural Research (INRA) in central France in 2003 (Theix, 45°43'N, 03°01'E). The local
climate is semi-continental, with a mean annual temperature of 9°C and an average annual
rainfall of 760mm. Before 2003, the site was managed as permanent grassland for more than
50 years (Fontaine et al., 2007). The soil is a drained Cambisol developed from granitic rock.
For sampling, the upper 10 cm of soil profile were removed because it is rich in fresh C
(Fontaine et al, 2007). Soil was taken from 10-40 cm soil profile where the humified
recalcitrant organic matter is the major form of C. The fresh soil was sieved at 5 mm and was
filled in PVC pots. Each pot was of 40 cm height and 9.8 cm internal diameter and contained
2.87 kg of dry soil. The soil properties were: pH 6.1+0.21; clay (%) 27+1.3; soil organic
carbon (g kg-1 soil) 26.7+0.37 and soil organic carbon � 13C (‰) -26.7+0.02.In April 2009,
twelve pots were sown with ryegrass (Lolium perenne) at 2000 grains m-2 density while
twelve were kept bare. All these planted and bare soil pots were placed in a mesocosm under
13C-depleted continuous labelling system for the whole duration of experiment. Automated
Chapter 4
109
drip irrigation was used to maintain the soil moisture around 75+5% of field capacity of the
soil. All planted pots were fertilized with nitrogen (70 kg N ha-1), phosphorus (100 kg P2O5
ha-1) and potassium (200 kg K2O ha-1) after their first clipping carried out 122 days after their
germination. Two other clippings were carried out 210 and 319 days after germination.
V.2. Labelling system & mesocosm
The scheme of experimental set-up is shown in Supplementary material I. It consisted of two
parts: a labelling air production system and a mesocosm containing planted and bare pots.
Details on production of labelled air are available in Supplementary Information. Briefly,
ambient air was taken into the system by a compressor and its CO2 and H2O contents and all
other particles were scrubbed by a molecular sieve. The decarbonised air was then mixed with
13C depleted CO2 of fossil-fuel origin (� 13C: -38.55 + 0.07 ‰) and conducted through a
humidifier (1m3:1m2 cross corrugated cellulose pads). The water flow in the humidifier was
regulated such that the relative humidity of labelled air reaching to mesocosm was maintained
around 50-60%. This moistened air had CO2 concentration of 400 + 20 ppm before entering
into mesocosm.
The mesocosm was made-up of an iron box with a plexiglass mounted on it. It had
dimensions of 350 × 140 × 140 cm. The advantage of using plexiglass is that it does not
change the wavelength of sunlight entering into mesocosm. All planted and bare soil pots
were placed in mesocosm that was continuously ventilated with air produced by the labelling
system. The volume of air in mesocosm was renewed twice a minute so that the unlabelled air
respired by soil did not change the labelling signature of air present in the mesocosm. We
verified with a smoke apparatus that turbulences in mesocosm were sufficient to ensure the
mixing of air. The ventilation of mesocosm also allowed keeping a temperature difference to
1-2°C between inside and outside of mesocosm.
Chapter 4
110
The labelling of whole plants with 13-C depleted CO2 was successful. The measured
�13C label of shoots and roots were statistically similar and amounted -56.83+0.20‰ and -
57.75+0.14 ‰ for shoots and roots respectively.
V.3. Respiration measurement
We waited for 155 days before taking the first respiration measure to permit the plants to
colonize the entire soil present in the pot. For respiration measurements, pots were taken out
from labelling mesocosm and were sealed in air-tight PVC chambers (height 100 cm,
diameter 15 cm) for 24 hrs. The absence of light stopped photosynthesis and avoided the plant
absorption of soil respired CO2. Carbon dioxide released by the plant-soil system was trapped
in 200 ml of 1M NaOH that was placed in respiration chambers. By conducting additional
measurement on respiration chambers by gas chromatography, we quantified that more than
99% of CO2 respired by the pot (soil + plant) over 24 hours was trapped successfully into
NaOH. Total carbon trapped in NaOH was measured with a total inorganic-C analyzer. The
13C abundance of trapped CO2 was analysed with an Isotope-Ratio Mass Spectrometer
(IRMS) after precipitating the carbonates with excess BaCl2 and filtration. The recalcitrant
soil C-derived CO2-C (Rr, mg CO2-C kg-1 dry soil day-1) was separated from plant-derived
fresh CO2-C (Rf, mg CO2-C kg-1 dry soil day-1) using mass balance equations:
131313ttffrr
tfr
ARARAR
RRR
×=×+×
=+
(12)
where Rr is flux of respiration from recalcitrant soil C (mg CO2-C kg-1 soil day-1)
corresponding to Vmax in our model, Rf is flux of fresh C (mg CO2-C kg-1 soil day-1) respired
by soil-plant system corresponding to �f in our model and Rt is sum of these fluxes. Ar13, Af
13
and At13 are 13C isotopic abundances of soil C, plant C and total CO2 respired from soil-plant
system respectively.
Chapter 4
111
V.4. Statistical analysis
To test the effect of plant presence on the mineralization of recalcitrant soil organic C (Rr),
we applied a repeated measures ANOVA on Rr with ‘date of measurement’ as a random
factor and ‘plant cover’ as fixed factor. Linear regression was applied to determine the
correlation between fresh C flux from soil-plant system (�f) and mineralization of recalcitrant
soil organic C (Rr). Repeated measures ANOVA were used to determine the effect of
temperature on fresh C flux (�f) from plant-soil systems and recalcitrant soil organic C
mineralization from bare soils. Similarly, a repeated measures ANOVA was used to
determine the effect of temperature on recalcitrant soil organic C mineralization from planted
soils (with and without normalization with fresh C flux). The equation predicting the effect of
temperature on a steady-state system (Eq. 11) was log transformed before fitting to
experimental data. All statistical analyses were realized with Statgraphics Plus (Manugistics,
USA).
VI. Results
VI.1. Effect of plant on soil respiration
The presence of Lolium perenne plants significantly increased the mineralization of
recalcitrant soil C throughout experiment (Figure 3a, p-value = 0.000). The increase in
mineralization of recalcitrant soil C represented on the average 202 % of that in bare soils.
Consistent our Eq. 2, the mineralization of recalcitrant soil C was linearly related with fresh C
respired by soil-plant system for a given temperature (Figure 3b). This energy dependence of
mineralization of recalcitrant soil C is also supported by an independent incubation
experiment on the same soil (Supplementary material II).
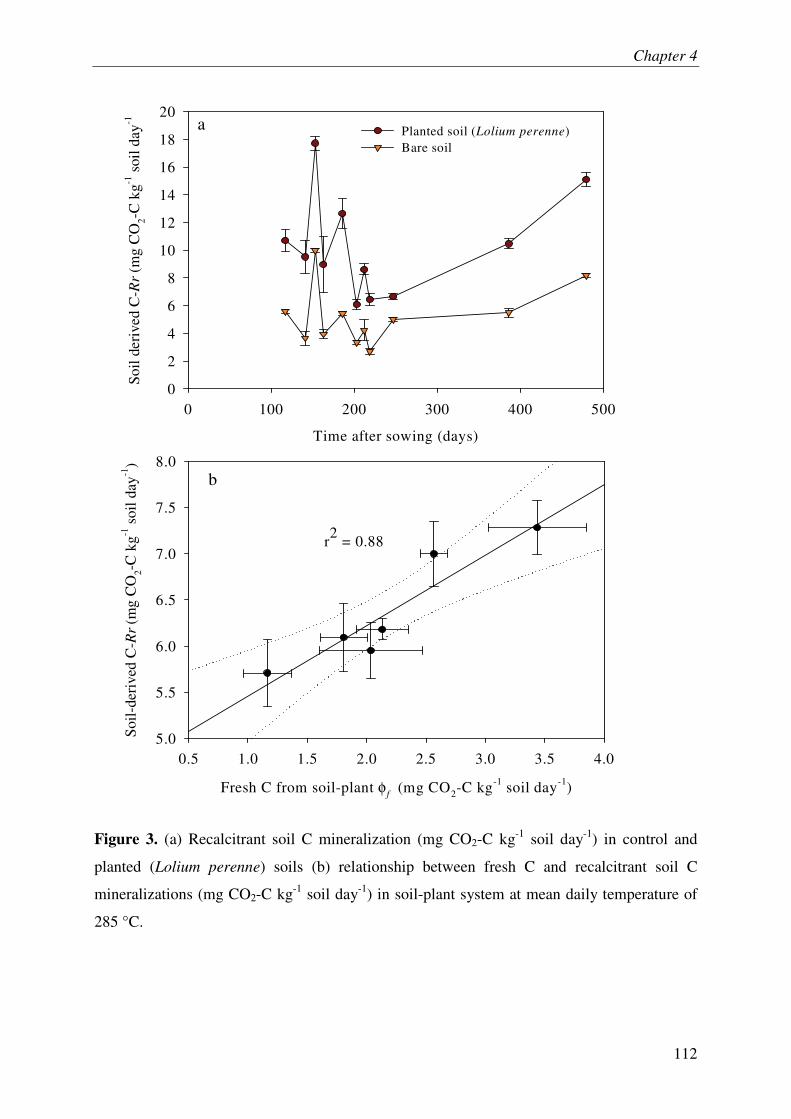
Chapter 4
112
Figure 3. (a) Recalcitrant soil C mineralization (mg CO2-C kg-1 soil day-1) in control and
planted (Lolium perenne) soils (b) relationship between fresh C and recalcitrant soil C
mineralizations (mg CO2-C kg-1 soil day-1) in soil-plant system at mean daily temperature of
285 °C.
Time after sowing (days)
0 100 200 300 400 500
Soil
deri
ved
C-R
r (m
g C
O2-C
kg-1
soi
l day
-1
0
2
4
6
8
10
12
14
16
18
20Planted soil (Lolium perenne)Bare soil
a
Fresh C from soil-plant φf (mg CO2-C kg-1 soil day-1)
0.5 1.0 1.5 2.0 2.5 3.0 3.5 4.0
Soil-
deri
ved
C-R
r (m
g C
O2-C
kg-1
soi
l day
-1)
5.0
5.5
6.0
6.5
7.0
7.5
8.0
r2
= 0.88
b
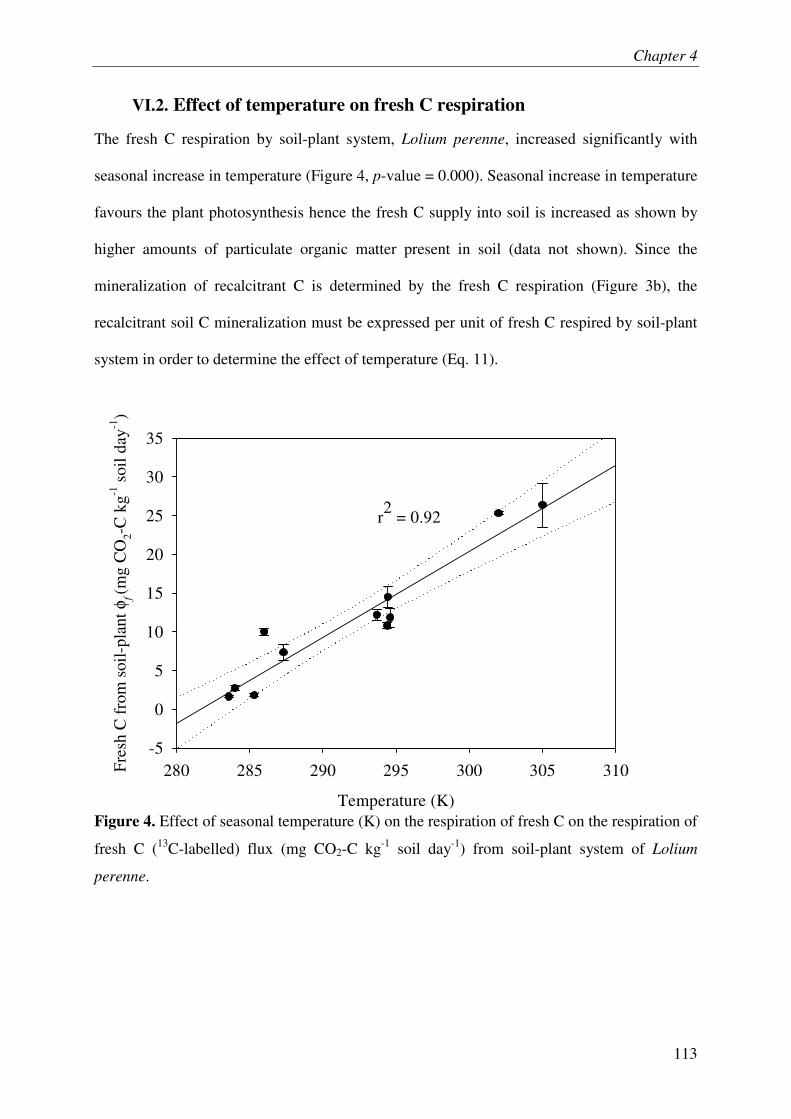
Chapter 4
113
VI.2. Effect of temperature on fresh C respiration
The fresh C respiration by soil-plant system, Lolium perenne, increased significantly with
seasonal increase in temperature (Figure 4, p-value = 0.000). Seasonal increase in temperature
favours the plant photosynthesis hence the fresh C supply into soil is increased as shown by
higher amounts of particulate organic matter present in soil (data not shown). Since the
mineralization of recalcitrant C is determined by the fresh C respiration (Figure 3b), the
recalcitrant soil C mineralization must be expressed per unit of fresh C respired by soil-plant
system in order to determine the effect of temperature (Eq. 11).
Figure 4. Effect of seasonal temperature (K) on the respiration of fresh C on the respiration of
fresh C (13C-labelled) flux (mg CO2-C kg-1 soil day-1) from soil-plant system of Lolium
perenne.
Temperature (K)
280 285 290 295 300 305 310Fres
h C
fro
m s
oil-
plan
t φf (m
g C
O2-
C k
g-1 s
oil d
ay-1
)
-5
0
5
10
15
20
25
30
35
r2
= 0.92
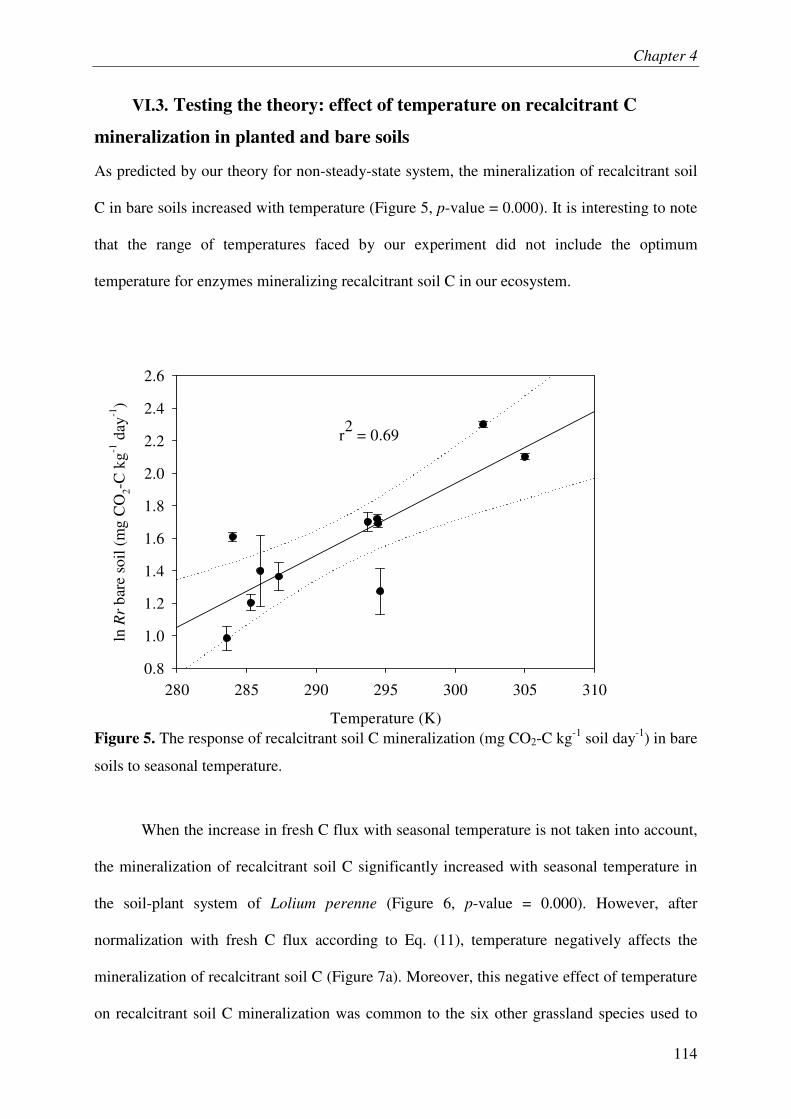
Chapter 4
114
VI.3. Testing the theory: effect of temperature on recalcitrant C
mineralization in planted and bare soils
As predicted by our theory for non-steady-state system, the mineralization of recalcitrant soil
C in bare soils increased with temperature (Figure 5, p-value = 0.000). It is interesting to note
that the range of temperatures faced by our experiment did not include the optimum
temperature for enzymes mineralizing recalcitrant soil C in our ecosystem.
Figure 5. The response of recalcitrant soil C mineralization (mg CO2-C kg-1 soil day-1) in bare
soils to seasonal temperature.
When the increase in fresh C flux with seasonal temperature is not taken into account,
the mineralization of recalcitrant soil C significantly increased with seasonal temperature in
the soil-plant system of Lolium perenne (Figure 6, p-value = 0.000). However, after
normalization with fresh C flux according to Eq. (11), temperature negatively affects the
mineralization of recalcitrant soil C (Figure 7a). Moreover, this negative effect of temperature
on recalcitrant soil C mineralization was common to the six other grassland species used to
Temperature (K)
280 285 290 295 300 305 310
ln R
r ba
re s
oil (
mg
CO
2-C
kg-1
day
-1)
0.8
1.0
1.2
1.4
1.6
1.8
2.0
2.2
2.4
2.6
r2
= 0.69
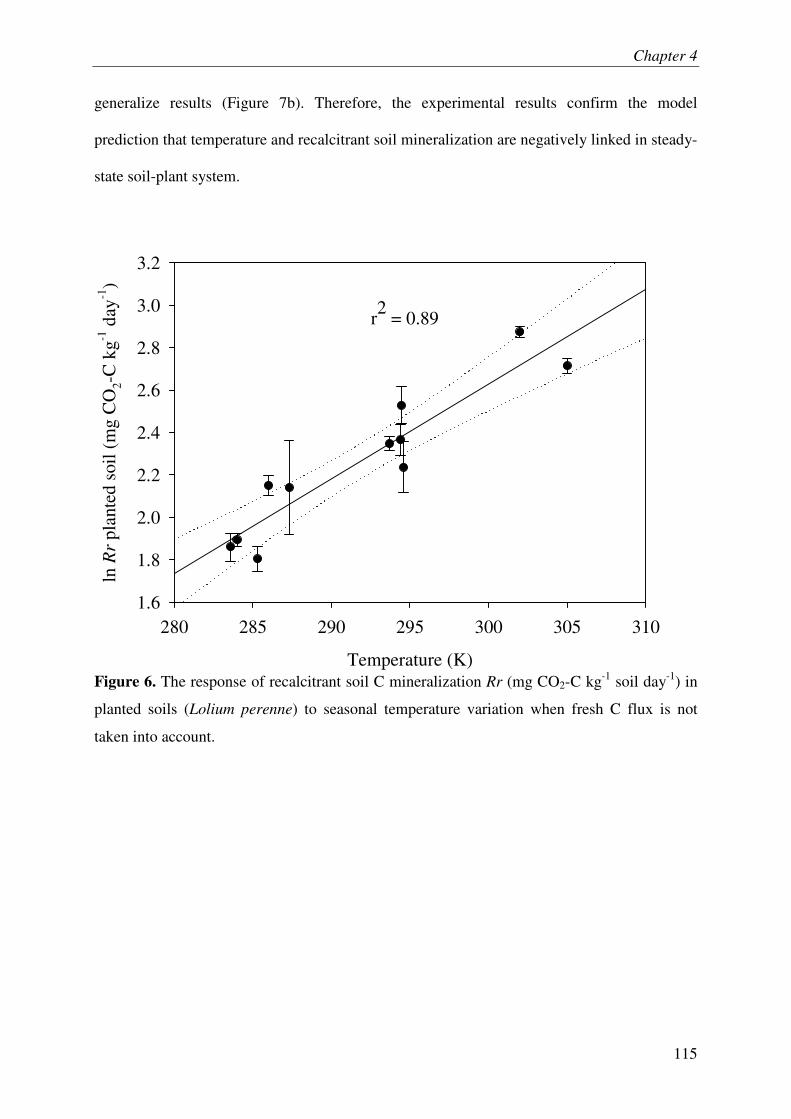
Chapter 4
115
generalize results (Figure 7b). Therefore, the experimental results confirm the model
prediction that temperature and recalcitrant soil mineralization are negatively linked in steady-
state soil-plant system.
Figure 6. The response of recalcitrant soil C mineralization Rr (mg CO2-C kg-1 soil day-1) in
planted soils (Lolium perenne) to seasonal temperature variation when fresh C flux is not
taken into account.
Temperature (K)
280 285 290 295 300 305 310
ln R
r pl
ante
d so
il (m
g C
O2-
C k
g-1 d
ay-1
)
1.6
1.8
2.0
2.2
2.4
2.6
2.8
3.0
3.2
r2 = 0.89
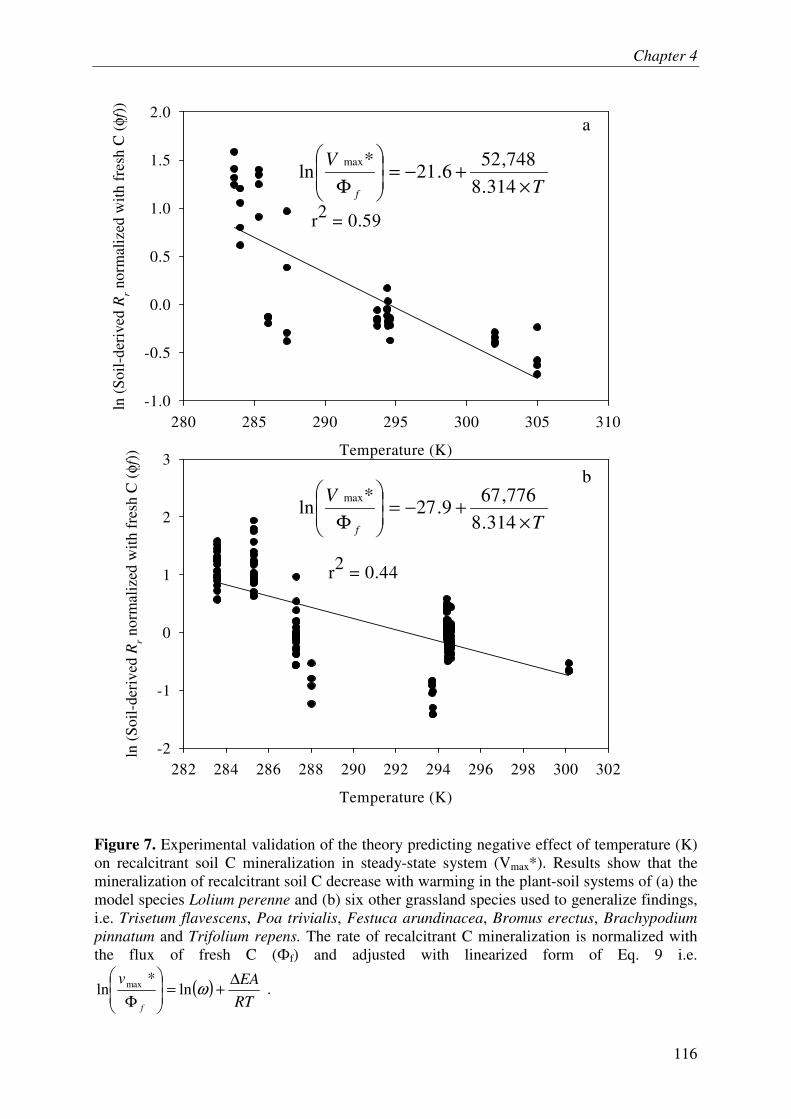
Chapter 4
116
Figure 7. Experimental validation of the theory predicting negative effect of temperature (K) on recalcitrant soil C mineralization in steady-state system (Vmax*). Results show that the mineralization of recalcitrant soil C decrease with warming in the plant-soil systems of (a) the model species Lolium perenne and (b) six other grassland species used to generalize findings, i.e. Trisetum flavescens, Poa trivialis, Festuca arundinacea, Bromus erectus, Brachypodium
pinnatum and Trifolium repens. The rate of recalcitrant C mineralization is normalized with the flux of fresh C (�f) and adjusted with linearized form of Eq. 9 i.e.
( )RT
EAv
f
∆+=
��
�
�
�
Φωln
*ln max .
Temperature (K)
282 284 286 288 290 292 294 296 298 300 302
ln (
Soil-
deri
ved
Rr n
orm
aliz
ed w
ith f
resh
C (
φf)
)
-2
-1
0
1
2
3Temperature (K)
280 285 290 295 300 305 310
ln (
Soil-
deri
ved
Rr n
orm
aliz
ed w
ith f
resh
C (
φf)
)
-1.0
-0.5
0.0
0.5
1.0
1.5
2.0
b
a
r2 = 0.59
r2 = 0.44
T
V
f ×+−=
��
�
�
�
Φ 314.8776,67
9.27*
lnmax
T
V
f ×+−=
��
�
�
�
Φ 314.8
748,526.21
*ln
max
Chapter 4
117
VII. Conclusion
Our findings show that, when the temperature-dependent inactivation of enzymes and
the energy limitation of microbial decomposers are considered explicitly in models, the
prediction regarding the effect of temperature on soil C mineralization is not as simple as
suggested by the Arrhenius equation. In contrast to the prediction of Arrhenius’s equation, our
results show that the temperature negatively affects the mineralization rate of recalcitrant soil
C when the flux of fresh C supplying soil microbes in energy is taken into account. Our model
indicates that this negative temperature effect arises from an intensification of enzyme
inactivation when temperature increases. These results can explain why long-term soil
warming in field experiment does not induce loss of soil organic matter (Melillo et al., 2002;
Eliasson et al., 2005) as predicted by Arrhenius equation. These results also concur with the
fact that the annual net ecosystem productivity (i.e. annual C fixation by ecosystem) of
ecosystems is positively related with the annual mean temperature (Sanderman et al., 2003).
Overall, our results also suggest that the increase in mean temperature at global scale due to
the global warming will not necessary induce the large losses of soil C predicted by current
models (Jones et al., 2004). It is important to mention here that our predictions do not apply
for artic ecosystems where the frost blocks the diffusion of substrates and enzymes and hence
the soil carbon mineralization most of the year. In these ecosystems, an increase in
temperature will probably induce the mineralization of large reserve of fresh un-decomposed
plant litter (Jorgenson et al., 2006).
Our results show a linear positive relationship between the respiration of fresh C by
the soil plant system and the mineralization rate of recalcitrant soil C. These results are
coherent with the idea that soil decomposers degrade recalcitrant soil C compounds through a
co-metabolism using fresh plant-derived C as a source of available energy (Bingeman et al.,
Chapter 4
118
1953; Kuzyakov 2000). Interestingly, our results show that the increase in temperature and
respiration of fresh C is concomitant in ecosystems. This concomitance is likely due to the
fact that the elevation of temperature follows the solar activity which in turn determines the
photosynthetic fixation of carbon and hence the availability of fresh C in the soil-plant
system. Therefore, in order to determine the specific effect of temperature on recalcitrant soil
C mineralization the latter must be expressed per unit of fresh C respired by the soil-plant
system. This separation of the effect of fresh C and temperature increase is also important to
predict the consequence of global warming on ecosystem C storage. Indeed, contrary to
temperature increase, the supply of fresh C to soil microbes not only stimulates mineralization
of pre-existent recalcitrant soil C but also permits the formation of new recalcitrant C through
humification of fresh C.
Historical lab experiments demonstrated a rule of thumb widely accepted in the
biological research community i.e. the rate of soil C respiration, like any other enzymatic
reaction rate, tends to double for every 10° rise in temperature. On this basis, it has been
proposed to use the Arrhenius equation in plant-soil models in order to introduce the thermo-
dependence of enzymatic reactions and predict the response of the ecosystem fluxes to global
warming. However, our results support the idea that such extrapolation of lab experiment
results to ecosystem functioning is an error. Indeed, warming not only increases the specific
activity of enzymes (kcat) but also the inactivation rate of enzymes (kinact). In short-term
incubation experiment (Eq 6, time�0), the amount of inactivated enzymes remains low and
hence the temperature response of the global enzymatic activity (Vmax ns (t)) is mainly
determined by the increase of the specific activity of enzymes (kcat). In this case, our model
predicts a positive relationship between temperature and the global catalytic activity until an
optimum temperature beyond which the rate of enzyme inactivation (kinact) becomes so high
that the catalytic activity decreases (Eq 6, Fig 1). The fact that these optimum temperatures
Chapter 4
119
are rarely reached in ecosystems probably explains why classical models do not represent
enzyme inactivation process (McGill, 1996). In ecosystems, simultaneous microbial
production of new enzymes and thermo-dependent enzyme inactivation determine the pool of
active enzymes and hence the mineralization of recalcitrant C (Eqs. 7 & 8). In this case, our
model predicts that the temperature response of recalcitrant soil C mineralization is
determined by the relative response of catalytic activity (kcat) and enzyme inactivation (kinact)
to temperature (Eqs. 8 and 9). Since the inactivation of enzymes is typically more thermo-
sensible than the catalytic activity of enzymes, our model predicts that the temperature should
negatively affect the rate of SOM mineralization which is supported by our experimental
results.
Our theory has some limitations as well. It does not take into account the microbial
physiology in response to temperature. Complex models involving microbes are needed to
take into account the physiological functioning of microbes in response to varying
temperatures. For a system at equilibrium (an ecosystem), our model predicts negative effect
of temperature on recalcitrant soil C mineralization after taking into account enzyme
inactivation and flux of fresh C input. The next step would be to measure inactivation and
catalysis constants at equilibrium for the enzymes extracted from soil.
Acknowledgment:
We thank S. Revaillot, O. Delfosse and J.-L. Ollier for chemical and isotopic analyses.
Maurice Crocombette and Patrick Pichon are thanked for their mesocosm construction and
experiment establishment respectively. The research leading to these results has received
funding from the European Community's 6th and 7th Framework Programs (FP6 and FP7)
under grant agreement n° 017841 (Nitro-Europe) and n° 226701 (CARBO-Extreme). TS has

Chapter 4
120
been funded by Higher Education Commission of Pakistan and European Community’s 7th
framework under grant agreement n° 226701 (CARBO-EXTREME).
Chapter 4
121
VIII. References
Arrhenius, S. 1889. Uber die Reakionsgeschwindigkeit bei der Inversion von Rohrzucker
durch Sauren. Zeitschrift fuer physikalische Chemie 4, 226-248.
Bingeman, C.W., Varner, J.E., Martin, W.P., 1953. The effect of the addition of organic
materials on the decomposition of an organic soil. Soil Science Society of America
Journal. 17, 34-38.
Blagodatskaya, �., Kuzyakov, Y., 2008. Mechanisms of real and apparent priming effects and
their dependence on soil microbial biomass and community structure: critical review.
Biology and Fertility of Soils 45, 115-131.
Copeland, R.A., 2000. Enzymes: A practical introduction to structure, mechanism and data
analysis, Wiley-VCH.
Daniel, R.M., Danson, M.J., 2010. A new understanding of how temperature affects the
catalytic activity of enzymes. Trends in Biochemical Sciences 35, 584-591.
Eliasson, P.E., McMurtrie, R.E., Pepper, D.A., Strömgren, M., Linder, S., Ågren, G.I., 2005.
The response of heterotrophic CO2 flux to soil warming. Global Change Biology 11,
167-181.
Eyring, H., 1935. The Activated Complex in Chemical Reactions. The Journal of Chemical
Physics 3, 107-115.
Fontaine, S., Barot, S., 2005. Size and functional diversity of microbe populations control
plant persistence and long-term soil carbon accumulation. Ecology Letters 8, 1075-
1087.
Fontaine, S., Barot, S., Barre, P., Bdioui, N., Mary, B., Rumpel, C., 2007. Stability of organic
carbon in deep soil layers controlled by fresh carbon supply. Nature 450, 277-280.
Giardina, C.P., Ryan, M.G., 2000. Evidence that decomposition rates of organic carbon in
mineral soil do not vary with temperature. Nature 404, 858-861.
Chapter 4
122
Guenet, B., Danger, M., Abbadie, L., Lacroix, G., 2010. Priming effect: bridging the gap
between terrestrial and aquatic ecology. Ecology 91, 2850-2861.
Jones, C., McConnell, C., Coleman, K., Cox, P., Falloon, P., Jenkinson, D., Powlson, D.,
2005. Global climate change and soil carbon stocks; predictions from two contrasting
models for the turnover of organic carbon in soil. Global Change Biology 11, 154-166.
Jorgenson, M.T., Shur, Y.L., Pullman, E.R., 2006. Abrupt increase in permafrost degradation
in Arctic Alaska. Geophys. Res. Lett. 33, L02503.
Kirschbaum, M.U.F., 1995. The temperature dependence of soil organic matter
decomposition, and the effect of global warming on soil organic C storage. Soil
Biology and Biochemistry 27, 753-760.
Knorr, W., Prentice, I.C., House, J.I., Holland, E.A., 2005. Long-term sensitivity of soil
carbon turnover to warming. Nature 433, 298-301.
Kuzyakov, Y., Friedel, J.K., Stahr, K., 2000. Review of mechanisms and quantification of
priming effects. Soil Biology & Biochemistry 32, 1485-1498.
Lloyd, J., Taylor, J.A., 1994. On the temperature dependence of soil respiration. Functional
ecology. 8, 315-323.
Massey, V., Curti, B., Ganther, H., 1966. A Temperature-dependent conformational change in
d-amino acid oxidase and Its Effect on catalysis. Journal of Biological Chemistry 241,
2347-2357.
Melillo, J.M., Steudler, P.A., Aber, J.D., Newkirk, K., Lux, H., Bowles, F.P., Catricala, C.,
Magill, A., Ahrens, T., Morrisseau, S., 2002. Soil warming and carbon-cycle
feedbacks to the climate system. Science 298, 2173-2176.
Paul, E.A., Clark, F.E., 1989. Soil microbiology and biochemistry. Academic Press, USA.
Chapter 4
123
Peterson, M.E., Daniel, R.M., Danson, M.J., Eisenthal, R., 2007. The dependence of enzyme
activity on temperature: determination and validation of parameters. Biochemical
Journal 402, 331-337.
Pilegaard, K., Hummelshøj, P., Jensen, N.O., Chen, Z., 2001. Two years of continuous CO2
eddy-flux measurements over a Danish beech forest. Agricultural and Forest
Meteorology 107, 29-41.
Sanderman, J., Amundson, R.G., Baldocchi, D.D., 2003. Application of eddy covariance
measurements to the temperature dependence of soil organic matter mean residence
time. Global Biogeochemical Cycles 17.
Thierron, V., Laudelout, H., 1996. Contribution of root respiration to total CO2 efflux from
the soil of a deciduous forest. Canadian Journal of Forest Research-Revue Canadienne
De Recherche Forestiere 26, 1142-1148.
Waldrop, M.P., Firestone, M.K., 2004. Altered utilization patterns of young and old soil C by
microorganisms caused by temperature shifts and N additions. Biogeochemistry 67,
235-248.
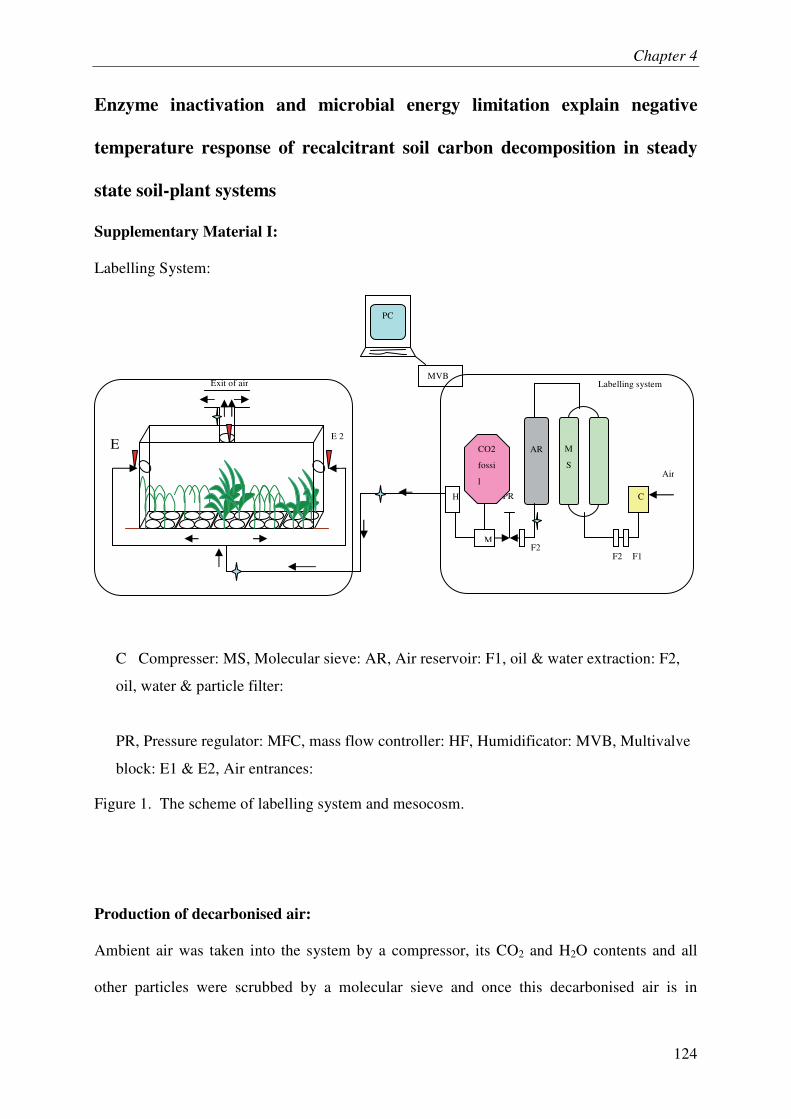
Chapter 4
124
Enzyme inactivation and microbial energy limitation explain negative
temperature response of recalcitrant soil carbon decomposition in steady
state soil-plant systems
Supplementary Material I:
Labelling System:
Figure 1. The scheme of labelling system and mesocosm.
Production of decarbonised air:
Ambient air was taken into the system by a compressor, its CO2 and H2O contents and all
other particles were scrubbed by a molecular sieve and once this decarbonised air is in
PC
MVB
Exit of air
C
Air
F2 F1
M
S
AR
PR
M
CO2
fossi
l
H
F
Labelling system
F2
E 2
E
C Compresser: MS, Molecular sieve: AR, Air reservoir: F1, oil & water extraction: F2,
oil, water & particle filter:
PR, Pressure regulator: MFC, mass flow controller: HF, Humidificator: MVB, Multivalve
block: E1 & E2, Air entrances:
Chapter 4
125
distribution tube 13C depleted CO2 of fossil-fuel origin was mixed with it. A screw
compressor, a self-regenerating adsorption dryer capable of generating decarbonised air at a
rate of up to 5000 standard litres per minute (SLPM) and residual CO2 below 1µmol CO2 mol-
1 air, an air reservoir, gas cylinders containing fossil fuel derived CO2 and a humidifier
(1m3:1m2 cross corrugated cellulose pads) constitute the main parts of the labelling system. A
mass flow meter served to control the CO2 injection rate and flow rate of the whole system
was controlled by pressure regulators. During daytime, around 30 % of decarbonised dry was
diverted to adsorber chamber to regenerate the molecular sieve of adsorption. Therein, drying
and regeneration alternated in six minute cycles. There was no supply of decarbonised air
during night (from one hour after sunset till one hour before sunrise) which permitted a full
regeneration of the adsorption dryer cycles.
Supplementary Material II:
TESTING THE RELATIONSHIP BETWEEN PRIMING EFFECT AND FRESH ORGANIC MATTER
SUBSTRATE
A number of studies have shown that soil organic matter (SOM) decomposition is accelerated
after the introduction of fresh organic matter like glucose, cellulose or plant litter (see
Blagodatskaya & Kuzyakov 2008 for a review). This acceleration of SOM decomposition is
known as priming effect (PE) and can be explained mechanistically according to a co-
limitation theory (Fontaine et al. 2011). Micro-organisms, which are co-limited by energy and
by nutrients, used this fresh substrate as a source of energy to produce enzymes that are able
to degrade recalcitrant SOM, rich in nutrients. However, if the PE mechanism begins to be
well studied, little is known about the relationship which links PE intensity with the provided
quantity of substrate or the biomass of microbes that is stimulated by this substrate. Is this
relationship linear or more complex with a saturation phenomenon, as suggested by modeling
studies (Wutzler & Reichstein 2008)?
An incubation experiment was conducted testing the intensity of PE induced by
varying the initial mass of fresh organic matter. In our experiment, cellulose was chosen as
fresh organic matter, limiting the apparent priming effect (turnover of microbial tissue,
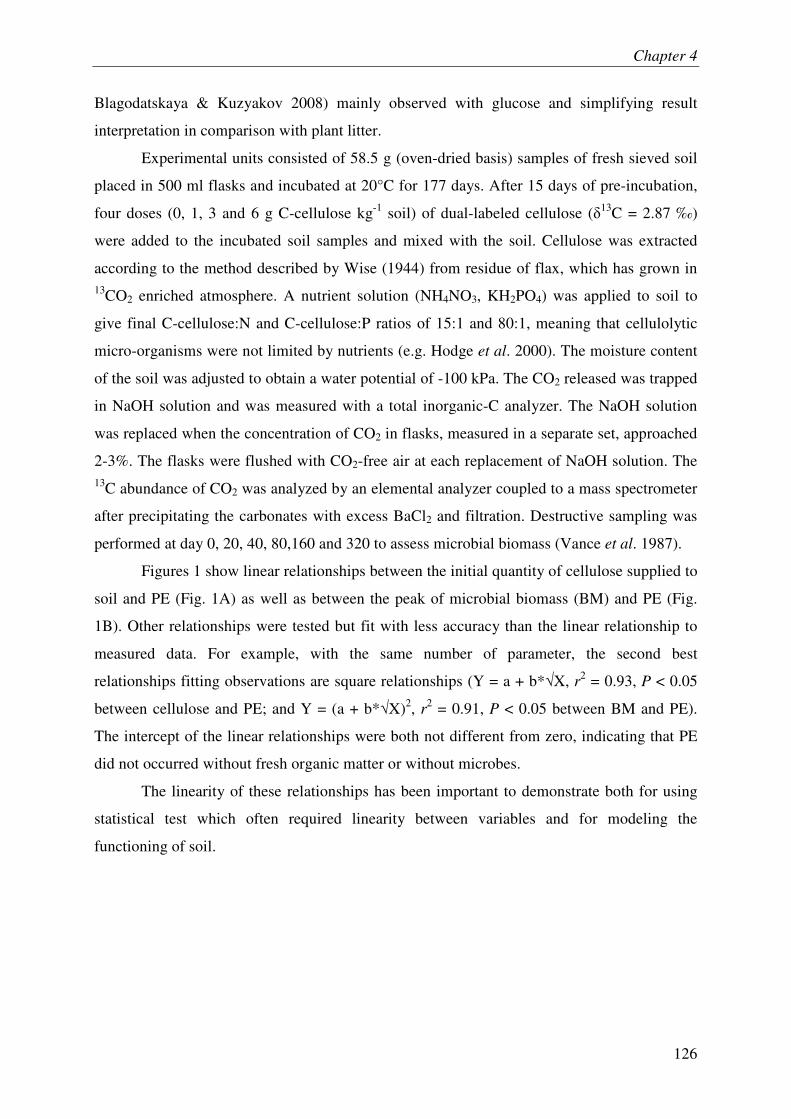
Chapter 4
126
Blagodatskaya & Kuzyakov 2008) mainly observed with glucose and simplifying result
interpretation in comparison with plant litter.
Experimental units consisted of 58.5 g (oven-dried basis) samples of fresh sieved soil
placed in 500 ml flasks and incubated at 20°C for 177 days. After 15 days of pre-incubation,
four doses (0, 1, 3 and 6 g C-cellulose kg-1 soil) of dual-labeled cellulose (�13C = 2.87 ‰)
were added to the incubated soil samples and mixed with the soil. Cellulose was extracted
according to the method described by Wise (1944) from residue of flax, which has grown in 13CO2 enriched atmosphere. A nutrient solution (NH4NO3, KH2PO4) was applied to soil to
give final C-cellulose:N and C-cellulose:P ratios of 15:1 and 80:1, meaning that cellulolytic
micro-organisms were not limited by nutrients (e.g. Hodge et al. 2000). The moisture content
of the soil was adjusted to obtain a water potential of -100 kPa. The CO2 released was trapped
in NaOH solution and was measured with a total inorganic-C analyzer. The NaOH solution
was replaced when the concentration of CO2 in flasks, measured in a separate set, approached
2-3%. The flasks were flushed with CO2-free air at each replacement of NaOH solution. The 13C abundance of CO2 was analyzed by an elemental analyzer coupled to a mass spectrometer
after precipitating the carbonates with excess BaCl2 and filtration. Destructive sampling was
performed at day 0, 20, 40, 80,160 and 320 to assess microbial biomass (Vance et al. 1987).
Figures 1 show linear relationships between the initial quantity of cellulose supplied to
soil and PE (Fig. 1A) as well as between the peak of microbial biomass (BM) and PE (Fig.
1B). Other relationships were tested but fit with less accuracy than the linear relationship to
measured data. For example, with the same number of parameter, the second best
relationships fitting observations are square relationships (Y = a + b*X, r2 = 0.93, P < 0.05
between cellulose and PE; and Y = (a + b*X)2, r2 = 0.91, P < 0.05 between BM and PE).
The intercept of the linear relationships were both not different from zero, indicating that PE
did not occurred without fresh organic matter or without microbes.
The linearity of these relationships has been important to demonstrate both for using
statistical test which often required linearity between variables and for modeling the
functioning of soil.
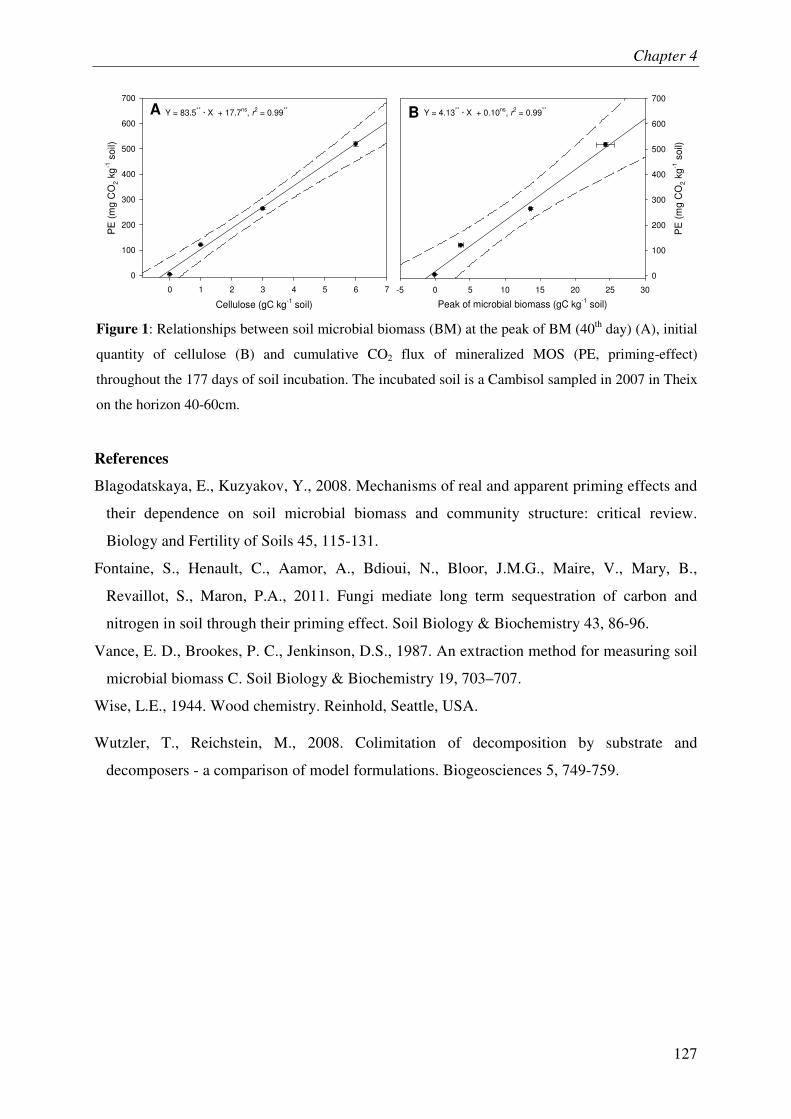
Chapter 4
127
Cellulose (gC kg-1
soil)
0 1 2 3 4 5 6 7
PE
(m
g C
O2 k
g-1
so
il)
0
100
200
300
400
500
600
700
Peak of microbial biomass (gC kg-1
soil)
-5 0 5 10 15 20 25 30
PE
(m
g C
O2 k
g-1
so
il)
0
100
200
300
400
500
600
700
Y = 4.13** · X + 0.10
ns, r
2 = 0.99
**A BY = 83.5** · X + 17.7
ns, r
2 = 0.99
**
Figure 1: Relationships between soil microbial biomass (BM) at the peak of BM (40th day) (A), initial
quantity of cellulose (B) and cumulative CO2 flux of mineralized MOS (PE, priming-effect)
throughout the 177 days of soil incubation. The incubated soil is a Cambisol sampled in 2007 in Theix
on the horizon 40-60cm.
References
Blagodatskaya, E., Kuzyakov, Y., 2008. Mechanisms of real and apparent priming effects and
their dependence on soil microbial biomass and community structure: critical review.
Biology and Fertility of Soils 45, 115-131.
Fontaine, S., Henault, C., Aamor, A., Bdioui, N., Bloor, J.M.G., Maire, V., Mary, B.,
Revaillot, S., Maron, P.A., 2011. Fungi mediate long term sequestration of carbon and
nitrogen in soil through their priming effect. Soil Biology & Biochemistry 43, 86-96.
Vance, E. D., Brookes, P. C., Jenkinson, D.S., 1987. An extraction method for measuring soil
microbial biomass C. Soil Biology & Biochemistry 19, 703–707.
Wise, L.E., 1944. Wood chemistry. Reinhold, Seattle, USA.
Wutzler, T., Reichstein, M., 2008. Colimitation of decomposition by substrate and
decomposers - a comparison of model formulations. Biogeosciences 5, 749-759.

128
CHAPTER 5
Articles in Preparation
Chapter 5
129
ARTICLES IN PREPARATION
In addition to the three experiments discussed in detail in the form of finished articles in
previous chapters (2 to 4), we tested three other hypotheses. However, we do not have
complete data available at present for these experiments. That is why; the preliminary results
that were available have been assembled in this chapter and are presented below as three parts
of the current chapter:
PART 1: THE EFFECT OF SIX GRAMINEAE AND ONE
LEGUMINOUS SPECIES ON SOIL ORGANIC MATTER
DYNAMICS IN TEMPERATE GRASSLAND
Differences among and changes in plant communities have been shown to affect soil organic
matter pools and dynamics through inter-specific differences in rhizodeposition of labile C
compounds (Fu and Cheng et al., 2002; Cheng et al., 2003; Dijkstra et al., 2006). Similarly
inter-specific differences in root litter and labile C production through rhizodeposition play an
important role in soil N dynamics (Wedin and Tilman 1990; Eviner 2004). Moreover, plant
species have been shown to differ in terms of duration for which to retain mineral N in their
biomass by controlling the amount of C inputs into soil (and hence N in biomass) i.e.
conservative, tall statured and exploitative, short statured plants (Personeni and Loiseau
2005). The plants are thus susceptible to affect the soil organic matter (SOM) processes by
two ways: by controlling the amount and chemistry of C inputs in soil and by imposing a
certain N balance in soil through N uptake and its return in soil (via C input). These two
mechanisms by which plants can affect organic C processes not clear to date.
To determine the effect of varying amounts of C inputs of different qualities and N
balance induced by grassland plants, we selected six gramineae species i.e. Trisetum
Chapter 5
130
flavescenes (Tf), Poa trivialis (Pt), Lolium perenne (Lp), Festuca arundinacea (Fa), Bromus
erectus (Be) and Brachypodium pinnatum (Bp). A leguminous species i.e. Trifolium repens
(Tr) that can fix atmospheric N and thus impose positive or the least negative N balance in
soil was also included in the experiment. It was hypothesized that the plants depositing higher
amounts of fresh C will induce higher mineralization of SOC and more C will be stocked
under the plants which impose least negative N balance in soil. All the plants were grown in
monocultures in pots whereas bare soils were used as controls. The planted and bare pots
were placed in a mesocosm for continuous 13C labelling for whole duration of experiment.
The continuous 13C labelling allowed distinguishing soil-derived CO2 efflux from plant-
derived CO2 one. The respiration measures were carried out for planted as well as bare soils
using the method described earlier (Chapter 1). After 120 days of sowing, one set of pots was
destructively sampled for soil. Particulate organic matter (POM) fractions were separated with
by passing the soil through a series of two brass sieves (wet sieving) of decreasing mesh sizes
(1 mm and 200 µm). The remaining material in each sieve was separated into mineral and
organic fraction by density flotation in water (Loiseau and Soussana 1999). The organic
fraction remaining in 1 mm sieve was named as coarse POM and that remaining in 200 µm
sieve was named as fine POM.
The presence of plants accelerated the SOM mineralization significantly i.e.
rhizosphere priming effect (RPE, difference between SOM mineralization in planted and
control soils) was induced (Figure 5.1). All the gramineae species induced ~ 2 times whereas
the legume induced ~ 4 times the SOM mineralization as compared to that in control soil. The
rhizosphere priming effect, when expressed per unit of fresh C respired from soil-plant
system, varied across species and remained lowest for the legume (Figure 5.2). Fine and
coarse POM contents were significantly highest in legume treatment (Figure 5.3).
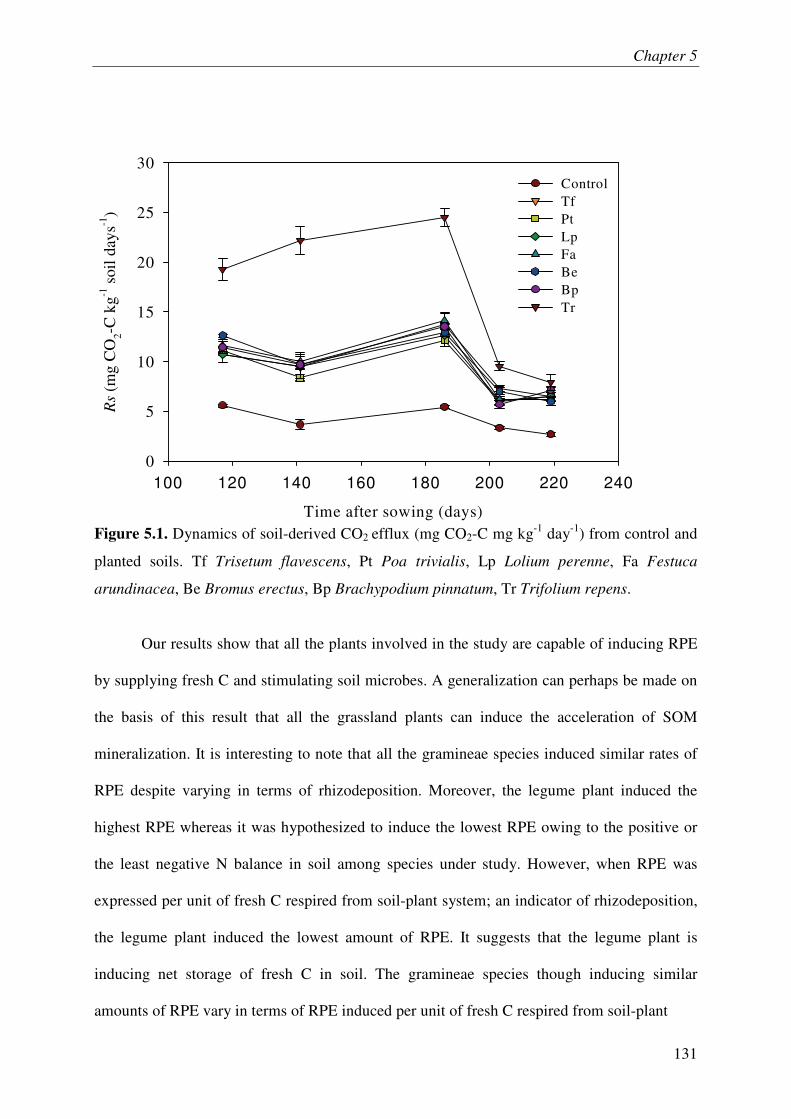
Chapter 5
131
Figure 5.1. Dynamics of soil-derived CO2 efflux (mg CO2-C mg kg-1 day-1) from control and
planted soils. Tf Trisetum flavescens, Pt Poa trivialis, Lp Lolium perenne, Fa Festuca
arundinacea, Be Bromus erectus, Bp Brachypodium pinnatum, Tr Trifolium repens.
Our results show that all the plants involved in the study are capable of inducing RPE
by supplying fresh C and stimulating soil microbes. A generalization can perhaps be made on
the basis of this result that all the grassland plants can induce the acceleration of SOM
mineralization. It is interesting to note that all the gramineae species induced similar rates of
RPE despite varying in terms of rhizodeposition. Moreover, the legume plant induced the
highest RPE whereas it was hypothesized to induce the lowest RPE owing to the positive or
the least negative N balance in soil among species under study. However, when RPE was
expressed per unit of fresh C respired from soil-plant system; an indicator of rhizodeposition,
the legume plant induced the lowest amount of RPE. It suggests that the legume plant is
inducing net storage of fresh C in soil. The gramineae species though inducing similar
amounts of RPE vary in terms of RPE induced per unit of fresh C respired from soil-plant
Time after sowing (days)
100 120 140 160 180 200 220 240
Rs
(mg
CO
2-C k
g-1 s
oil d
ays-1
)
0
5
10
15
20
25
30ControlTfPtLpFa Be Bp Tr
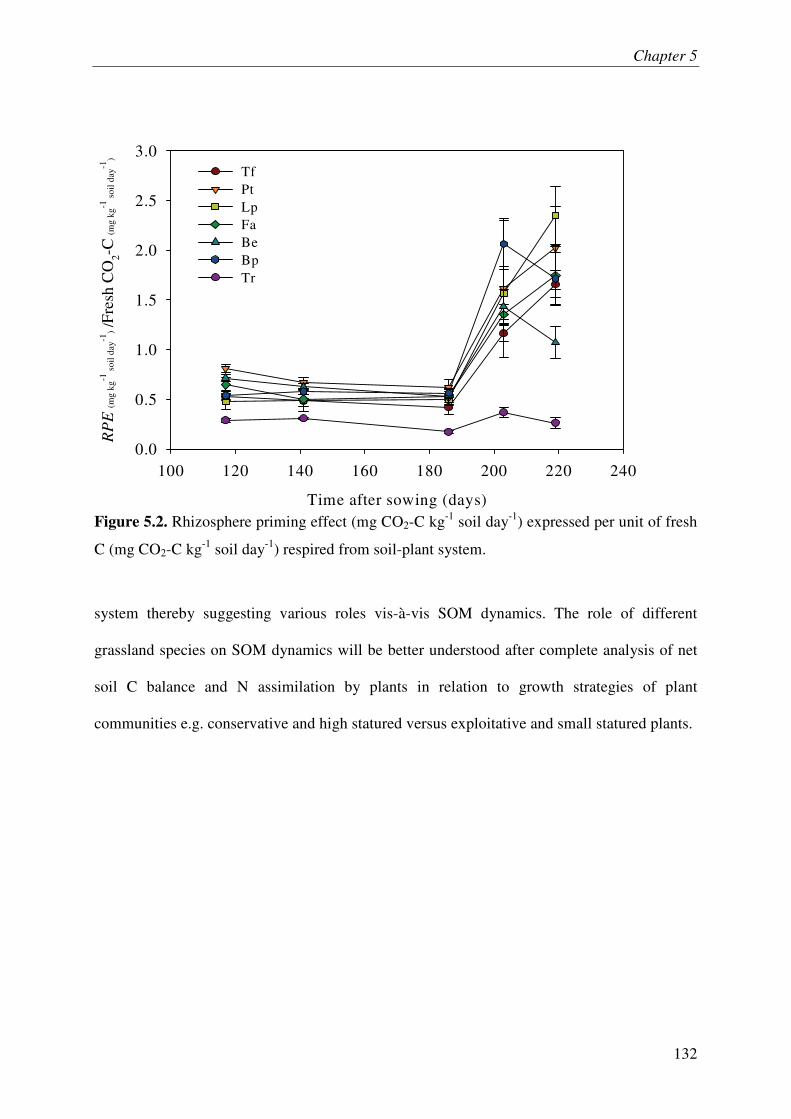
Chapter 5
132
Figure 5.2. Rhizosphere priming effect (mg CO2-C kg-1 soil day-1) expressed per unit of fresh
C (mg CO2-C kg-1 soil day-1) respired from soil-plant system.
system thereby suggesting various roles vis-à-vis SOM dynamics. The role of different
grassland species on SOM dynamics will be better understood after complete analysis of net
soil C balance and N assimilation by plants in relation to growth strategies of plant
communities e.g. conservative and high statured versus exploitative and small statured plants.
Time after sowing (days)
100 120 140 160 180 200 220 240
RP
E (m
g kg
-1 s
oil d
ay-1
) /Fr
esh
CO
2-C (m
g kg
-1 s
oil d
ay-1
)
0.0
0.5
1.0
1.5
2.0
2.5
3.0TfPtLp Fa Be Bp Tr
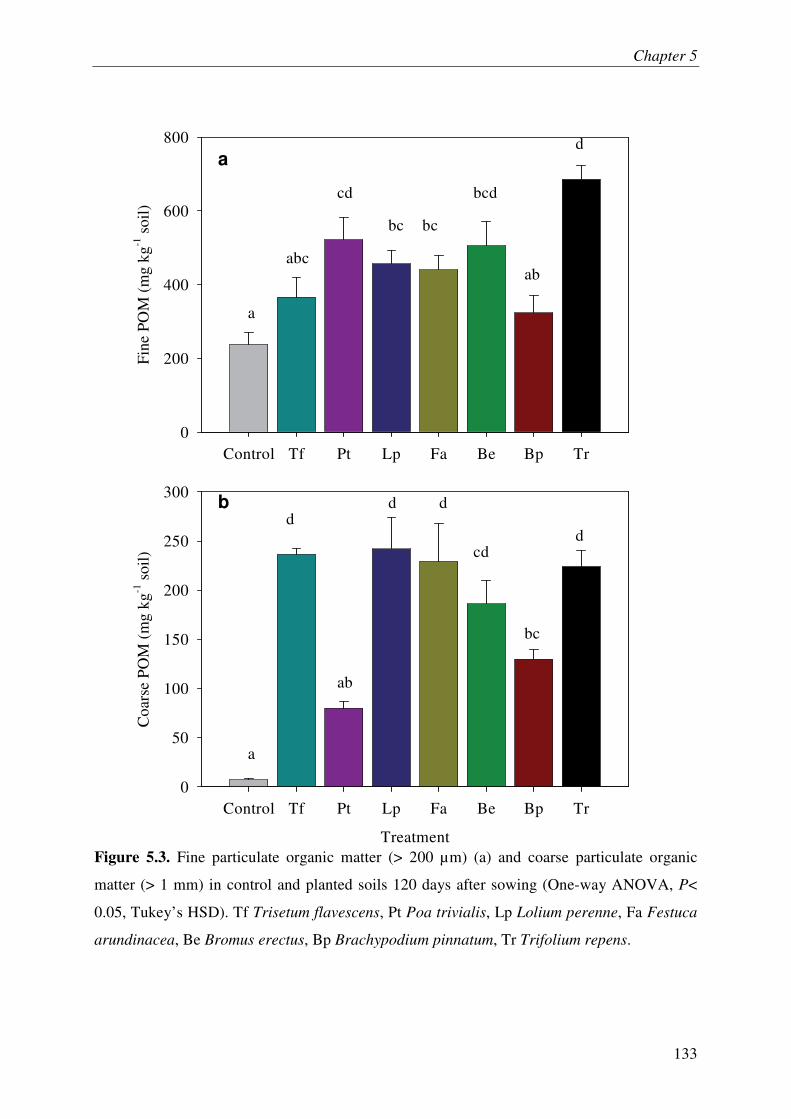
Chapter 5
133
Figure 5.3. Fine particulate organic matter (> 200 µm) (a) and coarse particulate organic
matter (> 1 mm) in control and planted soils 120 days after sowing (One-way ANOVA, P<
0.05, Tukey’s HSD). Tf Trisetum flavescens, Pt Poa trivialis, Lp Lolium perenne, Fa Festuca
arundinacea, Be Bromus erectus, Bp Brachypodium pinnatum, Tr Trifolium repens.
Control Tf Pt Lp Fa Be Bp Tr
Fine
PO
M (
mg
kg-1
soi
l)
0
200
400
600
800
Treatment
Control Tf Pt Lp Fa Be Bp Tr
Coa
rse
POM
(m
g kg
-1 s
oil)
0
50
100
150
200
250
300
a
ababc
bcbc
bcdcd
d
a
ab
bc
cd
dd d
d
a
b
Chapter 5
134
PART 2: DOES HIGHER AVAILABILITY OF N DECREASE SOIL
ORGANIC C MINERALIZATION AND STORE MORE ORGANIC
C?
A large percentage of the Earth’s active carbon (C) is found in soil organic matter (SOM) and
its cycling is strongly linked to nitrogen (N) availability. Although appreciation of the
importance of soil C and N interactions for predicting the impacts of climate change has
certainly increased, but we still lack full understanding and quantification of the drivers
(Gruber and Galloway 2008).
It has been shown in lab conditions that in a fresh C amended soil, higher availability
of mineral N decreases soil organic matter (SOM) mineralization as well as increases storage
of the added C (fresh C) (Fontaine et al., 2004). The authors suggested that the decreased
SOC mineralization under high fertility conditions after the addition of fresh C can be
explained by competition between microbial groups for N. They suggested that under higher
availability of N fresh organic matter (FOM) decomposers could fully express their rapid
growth potential by using fresh C thereby surpassing the SOC decomposers who, unlike FOM
decomposers, can mineralize SOM to acquire mineral nutrients under low N availability after
supply of fresh C. It is not clear yet whether the N supply to a living plant would check the
otherwise accelerated SOC mineralization because plant itself is a competitor for N in
addition to various microbial groups.
In order to determine the effect of varying direct supplies of mineral N and indirect
supply via an N-fixing plant on SOM dynamics under living plants, we established Lolium
perenne and Trifolium repens in pots in April 2009. Lolium perenne was either grown in
monocultures with two supplies of mineral N (Lp N++, Lp N+ treatments) or in mixed culture
with legume plant Trifolium repens (Lp + Tr) where it could benefit from N fixed by the
legume. The legume was also grown in monoculture (Tr) as a control for mixed culture (Lp +
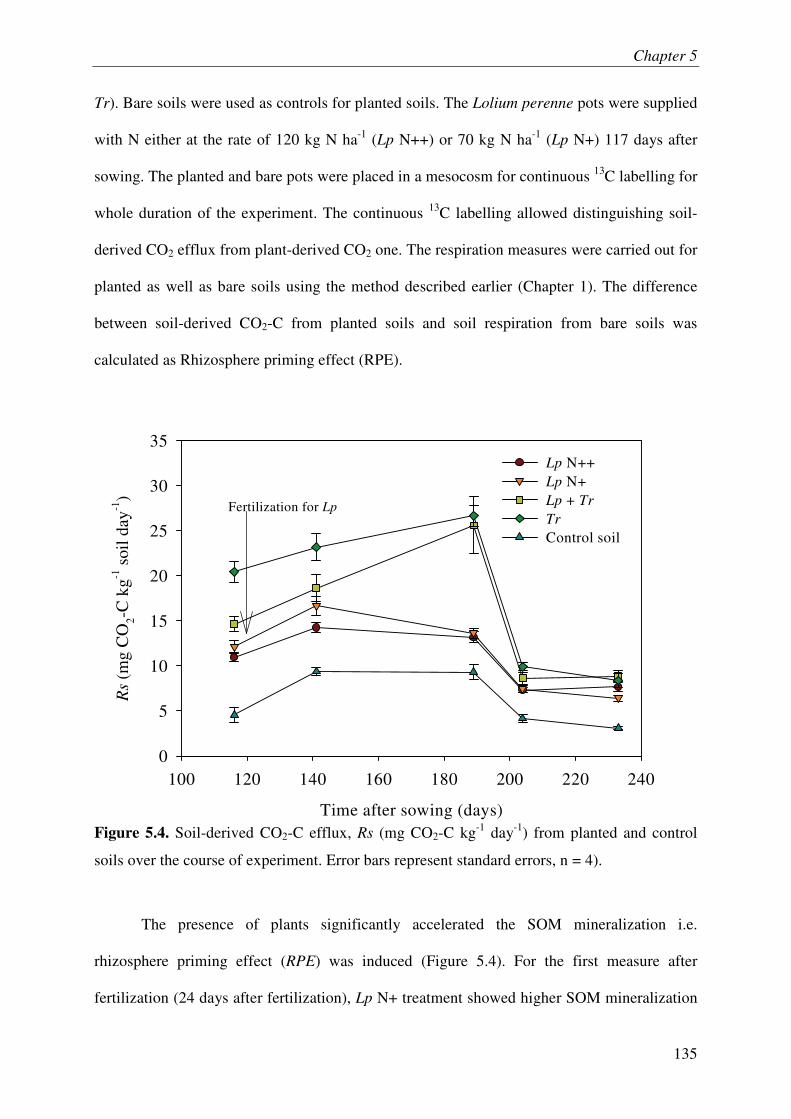
Chapter 5
135
Tr). Bare soils were used as controls for planted soils. The Lolium perenne pots were supplied
with N either at the rate of 120 kg N ha-1 (Lp N++) or 70 kg N ha-1 (Lp N+) 117 days after
sowing. The planted and bare pots were placed in a mesocosm for continuous 13C labelling for
whole duration of the experiment. The continuous 13C labelling allowed distinguishing soil-
derived CO2 efflux from plant-derived CO2 one. The respiration measures were carried out for
planted as well as bare soils using the method described earlier (Chapter 1). The difference
between soil-derived CO2-C from planted soils and soil respiration from bare soils was
calculated as Rhizosphere priming effect (RPE).
Figure 5.4. Soil-derived CO2-C efflux, Rs (mg CO2-C kg-1 day-1) from planted and control
soils over the course of experiment. Error bars represent standard errors, n = 4).
The presence of plants significantly accelerated the SOM mineralization i.e.
rhizosphere priming effect (RPE) was induced (Figure 5.4). For the first measure after
fertilization (24 days after fertilization), Lp N+ treatment showed higher SOM mineralization
Time after sowing (days)
100 120 140 160 180 200 220 240
Rs
(mg
CO
2-C
kg-1
soi
l day
-1)
0
5
10
15
20
25
30
35Lp N++ Lp N+ Lp + Tr
Tr
Control soil
Fertilization for Lp
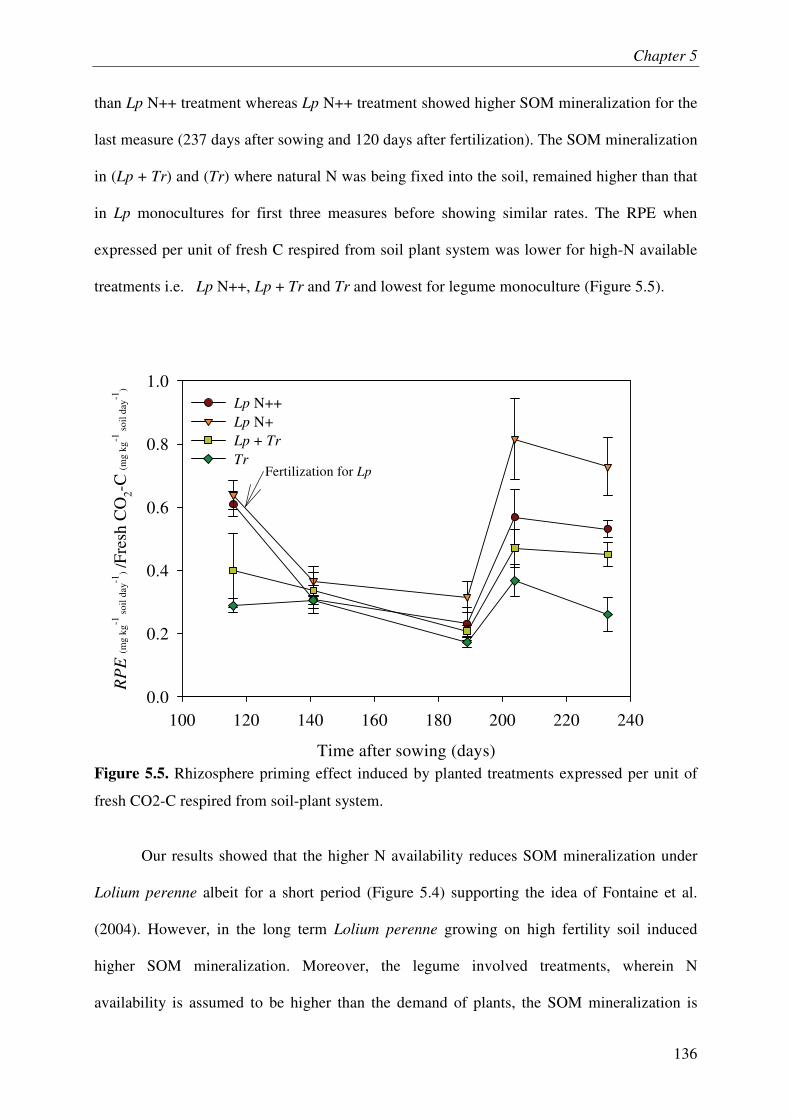
Chapter 5
136
than Lp N++ treatment whereas Lp N++ treatment showed higher SOM mineralization for the
last measure (237 days after sowing and 120 days after fertilization). The SOM mineralization
in (Lp + Tr) and (Tr) where natural N was being fixed into the soil, remained higher than that
in Lp monocultures for first three measures before showing similar rates. The RPE when
expressed per unit of fresh C respired from soil plant system was lower for high-N available
treatments i.e. Lp N++, Lp + Tr and Tr and lowest for legume monoculture (Figure 5.5).
Figure 5.5. Rhizosphere priming effect induced by planted treatments expressed per unit of
fresh CO2-C respired from soil-plant system.
Our results showed that the higher N availability reduces SOM mineralization under
Lolium perenne albeit for a short period (Figure 5.4) supporting the idea of Fontaine et al.
(2004). However, in the long term Lolium perenne growing on high fertility soil induced
higher SOM mineralization. Moreover, the legume involved treatments, wherein N
availability is assumed to be higher than the demand of plants, the SOM mineralization is
Time after sowing (days)
100 120 140 160 180 200 220 240
RP
E (m
g kg
-1 s
oil d
ay-1
) /Fr
esh
CO
2-C
(mg
kg-1
soi
l day
-1)
0.0
0.2
0.4
0.6
0.8
1.0Lp N++ Lp N+ Lp + Tr
TrFertilization for Lp
Chapter 5
137
higher. This is in apparent contradiction to our hypothesis. However, the lower RPE values
when normalized with fresh C in high-N available treatments i.e. Lp N++, Lp + Tr and Tr ,
suggest that the higher availability of N stimulated the plant biomass, photosynthetic rates and
N uptake from the soil. Higher N uptake could have caused N limitation in soil thus favouring
SOM decomposers who are better adapted to assimilate fresh C under N limited conditions by
mineralizing SOM and acquiring nitrogen and other nutrients from it. This result also
indicates the possibility of net storage of C under high N availability. The analysis of
supplementary data on soil organic C stocks will allow determining if the lower RPE in high
N treatments leads to net storage of SOM.
Chapter 5
138
PART 3: DECOUPLING THE EFFECT OF ROOT EXUDATES,
MYCORRHIZAE AND ROOTS ON SOIL C PROCESSES IN
THREE TEMPERATE GRASSLAND SPECIES
The mineralization of soil organic matter (SOM) is accelerated in the presence of living roots
(Cheng et al., 2003; Dijkstra et al., 2007). However, the mechanisms developed by the plant
in order to stimulate the mineralization of SOM remain poorly understood. Whether the fresh
C supply to rhizosphere microbes only in form of root litter can stimulate them to increase the
SOM mineralization? Do the root exudates stimulate enough to soil microbes to increase the
mineralization of SOM. The results from lab incubations where soils have been amended with
simple organic components of root exudates, like sugars and amino acids, are contradictory
(Hamer and Marschner 2005). Moreover, the role of mycorrhizae in SOC mineralization is
not clear as well though they have been shown to mineralize plant litter (Hodge et al., 2001).
In order to decouple the effects of root exudates, mycorrhizae and roots on SOM, a
novel experiment was put into place. Soil, sampled from temperate grassland, was put into
PVC cylinders whose cross sections were closed with 0.45 µm, 30µm or 1000 µm mesh. Four
cylinders of a particular mesh (about 60 g dry soil) were placed in inert sand in a pot. Three
grassland plants i.e. Lolium perenne, Poa trivialis and Trifolium repens were grown on these
pots and continuously labelled with 13C depleted air in a mesocosm. Bare sand pots with soil
cylinders (1000 µm) placed in them were used as controls. The 0.45 µm mesh was permeable
only to root exudates thus corresponding to the effect of root exudates on SOM (RE
treatment), 30µm mesh was permeable to root exudates and mycorrhizae representing the
effect of root exudates and mycorrhizae (RE+Myc treatment) and 1000 µm mesh being
permeable to root exudates, mycorrhizae and roots represented the combined effect of all of
them (whole-root treatment). The respiration from plant-soil system was measured
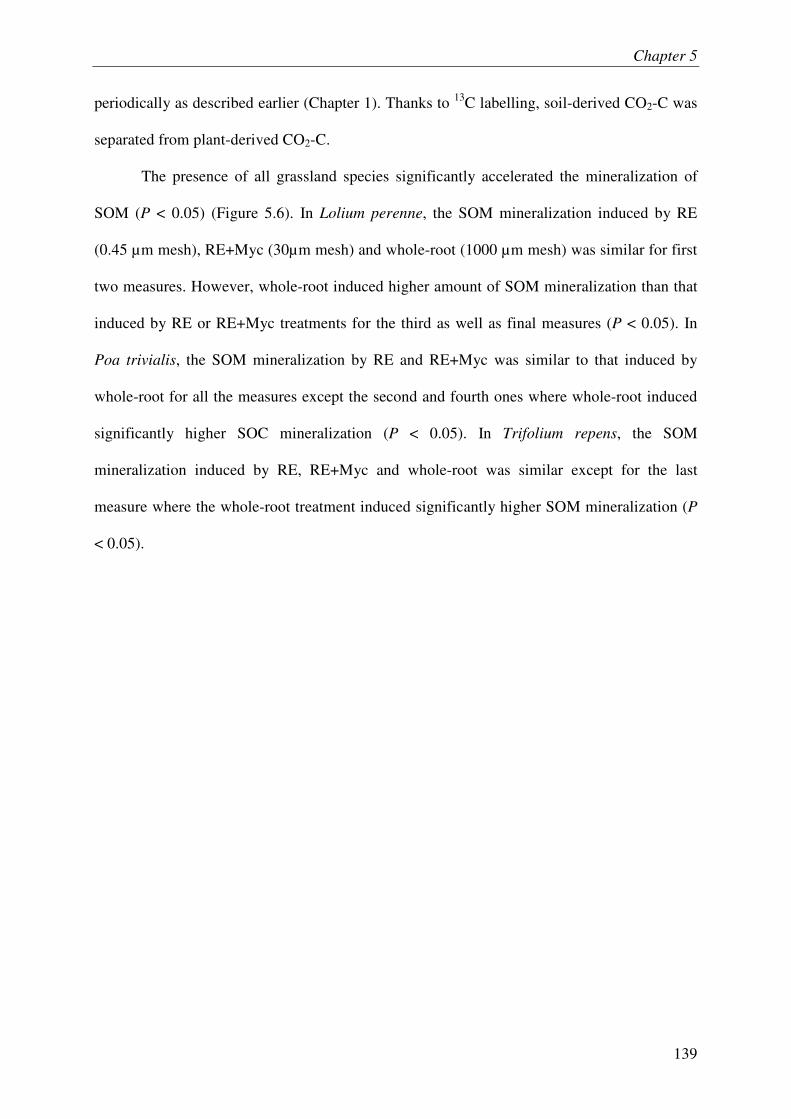
Chapter 5
139
periodically as described earlier (Chapter 1). Thanks to 13C labelling, soil-derived CO2-C was
separated from plant-derived CO2-C.
The presence of all grassland species significantly accelerated the mineralization of
SOM (P < 0.05) (Figure 5.6). In Lolium perenne, the SOM mineralization induced by RE
(0.45 µm mesh), RE+Myc (30µm mesh) and whole-root (1000 µm mesh) was similar for first
two measures. However, whole-root induced higher amount of SOM mineralization than that
induced by RE or RE+Myc treatments for the third as well as final measures (P < 0.05). In
Poa trivialis, the SOM mineralization by RE and RE+Myc was similar to that induced by
whole-root for all the measures except the second and fourth ones where whole-root induced
significantly higher SOC mineralization (P < 0.05). In Trifolium repens, the SOM
mineralization induced by RE, RE+Myc and whole-root was similar except for the last
measure where the whole-root treatment induced significantly higher SOM mineralization (P
< 0.05).
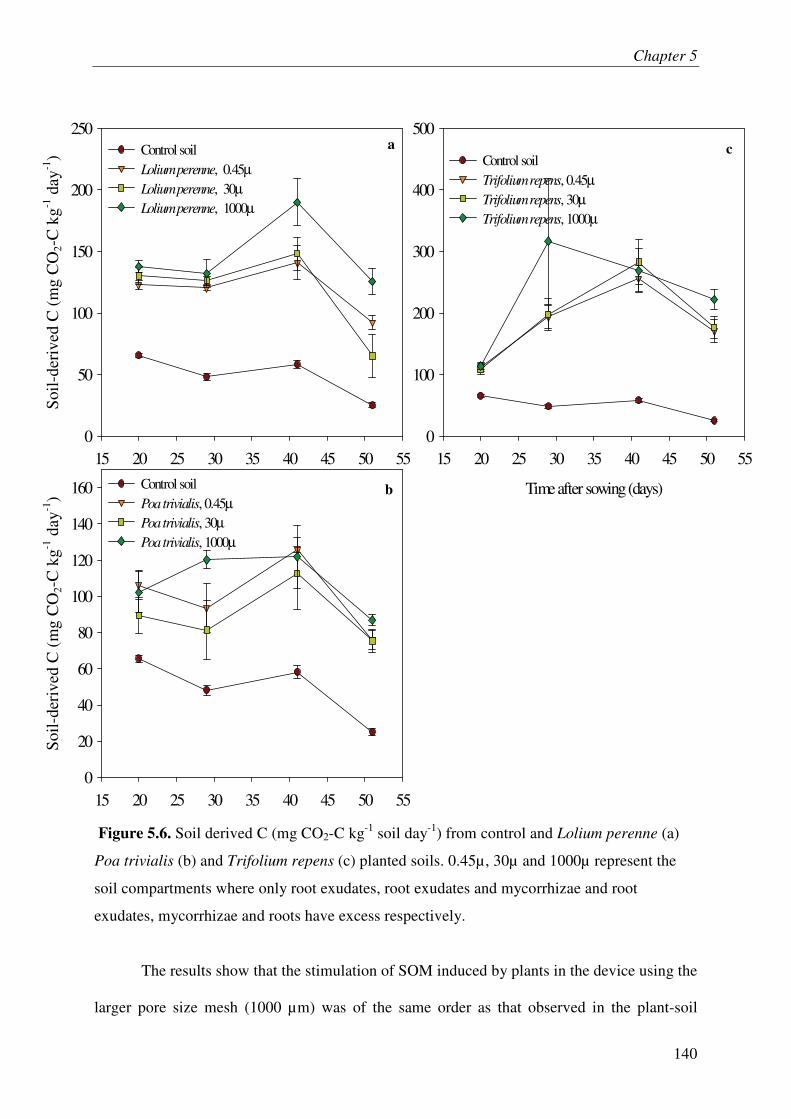
Chapter 5
140
Figure 5.6. Soil derived C (mg CO2-C kg-1 soil day-1) from control and Lolium perenne (a)
Poa trivialis (b) and Trifolium repens (c) planted soils. 0.45µ, 30µ and 1000µ represent the
soil compartments where only root exudates, root exudates and mycorrhizae and root
exudates, mycorrhizae and roots have excess respectively.
The results show that the stimulation of SOM induced by plants in the device using the
larger pore size mesh (1000 µm) was of the same order as that observed in the plant-soil
15 20 25 30 35 40 45 50 55
Soil-
deri
ved
C (
mg
CO
2-C
kg-1
day
-1)
0
50
100
150
200
250Control soilLolium perenne, 0.45µ
Lolium perenne, 30µ
Lolium perenne, 1000µ
15 20 25 30 35 40 45 50 55
Soil-
deri
ved
C (
mg
CO
2-C
kg-1
day
-1)
0
20
40
60
80
100
120
140
160 Control soilPoa trivialis, 0.45µ
Poa trivialis, 30µ
Poa trivialis, 1000µ
Time after sowing (days)
15 20 25 30 35 40 45 50 550
100
200
300
400
500
Control soilTrifolium repens, 0.45µ
Trifolium repens, 30µ
Trifolium repens, 1000µ
a
b
c
Chapter 5
141
systems without mesh (Chapter 1-3), i.e., a two to three fold increase in SOM mineralization.
This indicates that our device did not disturb plant-soil interactions and hence was adapted to
quantify the role of rhizosphere processes on SOM mineralization. Moreover, it clearly shows
in three grassland species that root exudates induce the important acceleration (on the average
twice than that in control soils) in SOM mineralization i.e. RPE was induced after of the
supply of root exudates. The additive effect of mycorrhizae on RPE was inexistent throughout
the experiment across three plant species suggesting that the mycorrhizae are not involved in
SOM mineralization. The additional effect of roots (1000 µm mesh) on SOM mineralization
was absent initially but present towards the end of the experiment in all the species tested in
the experiment. The absence of root effect initially may have been due to the fact that the
roots were very young (30 days) and the root mortality did not commence hence the only
fresh C supply from roots was in the form of root exudates. However, in the later stages fine
roots mortality may have started supplying additional fresh C to the SOM decomposers.
Therefore, our findings indicate that root exudation and deposition of root litters are the two
principal ways by which plant stimulate SOM.
Chapter 5
142
REFERENCES
Cheng, W., Johnson, D.W., Fu, S., 2003. Rhizosphere effects on decomposition: controls of
plant species, phenology, and fertilization. Soil Science Society of America Journal.
67, 1418-1427.
Dijkstra, F.A., Cheng, W., 2007. Interactions between soil and tree roots accelerate long-term
soil carbon decomposition. Ecology Letters 10, 1046-1053.
Dijkstra, F.A., Hobbie, S.E., Reich, P.B., 2006. Soil Processes affected by sixteen grassland
species grown under different environmental conditions. Soil Science Society of
America Journal. 70, 770-777.
Eviner, V.T., 2004. Plant traits that influence ecosystem processes vary independently among
species. Ecology 85, 2215-2229.
Fontaine, S., Bardoux, G., Abbadie, L., Mariotti, A., 2004. Carbon input to soil may decrease
soil carbon content. Ecology Letters 7, 314-320.
Fu, S., Cheng, W., Susfalk, R., 2002. Rhizosphere respiration varies with plant species and
phenology: A greenhouse pot experiment. Plant and Soil 239, 133-140.
Gruber, N., Galloway, J.N., 2008. An earth-system perspective of the global nitrogen cycle.
Nature 451, 293-296.
Hamer, U., Marschner, B., 2005. Priming effects in different soil types induced by fructose,
alanine, oxalic acid and catechol additions. Soil Biology and Biochemistry 37, 445-
454.
Hodge, A., Campbell, C.D., Fitter, A.H., 2001. An arbuscular mycorrhizal fungus accelerates
decomposition and acquires nitrogen directly from organic material. Nature 413, 297-
299.
Chapter 5
143
Loiseau, P., Soussana, J.F., 1999. Elevated [CO2], temperature increase and N supply effects
on the turnover of below-ground carbon in a temperate grassland ecosystem. Plant and
Soil 210, 233-247.
Personeni, E., Loiseau, P., 2005. Species strategy and N fluxes in grassland soil: A question
of root litter quality or rhizosphere activity? European Journal of Agronomy 22, 217-
229.
Wedin, D.A., Tilman, D., 1990. Species effects on nitrogen cycling: a test with perennial
grasses. Oecologia 84, 433-441.
144
CHAPTER 6
General Discussion and Perspectives
Chapter 6
145
ROLE OF PLANT RHIZOSPHERE ACROSS MULTIPLE
SPECIES, GRASSLAND MANAGEMENT AND TEMPERATURE
ON MICROBIAL COMMUNITIES AND LONG-TERM SOIL
ORGANIC MATTER DYNAMICS
I. General discussion
This research work allowed bringing into light the importance of rhizospheric processes in
soil C cycle through measurement of rhizosphere priming effect across multiple temperate-
grassland species in an experimental system reconstituting conditions close to those
encountered in ecosystems (natural light and temperature, undisturbed deep soil). Generally,
the amount of soil organic matter mineralized and released as soil-derived CO2-C from
planted soils remained twice or more than twice as compared to that released from bare soils.
In case of Trifolium repens, it reached four times than that in bare soils (Chapter 5, part 1).
Moreover, the persistence of RPE for 511 days (Chapter 2) shows that this is a continuously
occurring long term soil process under living plants. The amounts as well as the duration of
RPE revealed by our work emphasize the significance of studying the dynamics of soil C
cycle by taking into account the interaction between the supply of fresh C to soil microbes
and the mineralization of recalcitrant SOM. Moreover, our work revealed the effect of various
biotic (plant and microbial species) and abiotic factors (plant clipping, temperature, seasonal
plant photosynthesis) on RPE intensity and hence SOM dynamics in grasslands.
The direct measurement of RPE revealed that the plant clipping slows down the
mineralization of SOM (Chapter 2). The detailed study was carried out on Lolium perenne
nevertheless the results from another experiment (Chapter 5, part 1) allowed generalizing the
Chapter 6
146
finding across seven grassland species. Earlier, it has been suggested that the plant defoliation
may increase the mineralization of SOM owing to increased exudation thereby liberating
nutrients held up in it and hence serving for plants’ re-growth (Hamilton and Frank 2001;
Bardgett and Wardle 2003). This would mean the C loss for soil on two fronts: decreased
plant C input due to reduced aboveground biomass after defoliation and increased
mineralization of existing SOM. However, our findings suggest that the plant clipping induces
cascade of effects leading to decreased SOM mineralization. Clipping reduced leaf area which
in turn curtails total plant photosynthesis, transpiration and uptake of mineral nitrogen
(Macduff 1992). The reduced N uptake by plant led to an increase in mineral N availability
for soil microorganisms, especially for soil bacteria which are typically limited by nitrogen.
Given bacteria and fungi are in competition for plant C acquisition, the nitrogen-induced
stimulation of bacteria suppresses fungal populations and thereby RPE.
As explained in Chapter 2, this strong link between above ground biomass, plant N
uptake and SOM mineralization may explain the remarkable synchronization between the
plant photosynthesis and the availability of mineral N in grassland soils. When plant is
carrying out high amounts photosynthesis in the presence of favorable light intensity (e.g.
summer season in temperate grasslands), its N uptake exceeds than the soil offer in terms of
mineral N resulting in decreased availability of soil mineral N and increased fungi : bacteria
ratio. These changes accelerate SOM mineralization which liberates N held up in the
recalcitrant SOM stocks. On the other hand, when total photosynthesis by plant is reduced due
to clipping or low light intensity, its N uptake is less than the soil offer in terms of N. The
accumulation of mineral N in soil decreases SOM mineralization leading to sequestration of
mineral N in SOM stocks. If this excess of nutrients is not sequestered, they would be leached
or denitrified. Therefore, our study supports the idea that soil ecosystem works as a bank of
Chapter 6
147
nutrients for the plant maximizing plant productivity, nutrient retention and C sequestration in
the long term.
The dual labelling (13C and 14C) of plants developed in this thesis allowed to
demonstrate that plants with deep roots are able to reactivate the mineralization of as old
recalcitrant soil C as 15,000 years by supplying soil microbes present in deep soil layers
with fresh C (Chapter 3). Therefore, our results confirm, in soil-plant systems near to field
conditions, the hypothesis of Fontaine et al., (2007) that the stability of deep soil C is due to
the energy limitation of microbes. Briefly, in the absence of fresh C the microbes can not
mineralize humified recalcitrant SOM for long term because the energetic expense to
synthesize the extra cellular enzymes and maintain cellular activity is more than the return
they could get from SOM mineralization. The deep soil microbes receive fresh C in lower
quantities and on less regular intervals as compared to their counterparts in surface soils
thereby limiting their SOM mineralizing capacity and explaining the longer mean residence
times of soil organic C in deep soils than surface soils.
As discussed in the introduction of the thesis, the knowledge about which microbes
are involved in SOM mineralization and RPE, is scarce. The technical difficulties in
identifying the microbial groups specialized in utilizing different C sources i.e. fresh C or
recalcitrant soil organic C is the reason behind this lack of information. The correlative
approach between the abundance of microbial groups and SOM mineralization used in our
work (Chapter 3) suggests that the saprophytic fungi (18:2�6c) are key players in SOM
mineralization. This idea is supported by results of Chapter 2 showing a simultaneous
decrease in RPE and abundance of saprophytic fungi (18:2�6c) after plant clipping.
Some studies (Bernard et al., 2007; Nottingham et al., 2009,) have suggested that other
microbial groups like Gram negative bacteria can also induce a priming effect. However, the
strong correlation between the abundance of microbial groups and SOM mineralization
Chapter 6
148
found in this thesis combined to results of Fontaine et al.(2011) suggest that the contribution
of fungi to the priming may be very large compared to the other groups. The dominance of
soil fungi in the priming effect may be explained by their ability to grow as mycelium which
confer them a unique capacity to access the energy contained in fresh C and to explore soil
space, mine large reserve of SOM and reallocate (Frey et al., 2000; 2003) energy and
nutrients from different parts of the soil.
The energy limitation of microbes to produce new enzymes and carrying out
enzymatic process of mineralization of SOM (Fontaine et al., 2007) has never been
considered in determining the effect of temperature on SOM mineralization. Moreover, the
enzyme inactivation that occurs at all temperatures and is more sensible to temperature than
specific enzymatic activity has been overlooked. By taking into account two key processes
hitherto overlooked i.e. the energy limitation of microbes and the enzyme inactivation, we
predicted theoretically and validated by experimental results the negative relationship of
temperature and SOM mineralization in steady-state systems (ecosystems) (Chapter 4).
The results also demonstrate the need of separating non steady-state-system like incubated
bare soil wherein there is a continuous decrease in enzymatic pool, from a steady-state-system
where the enzymatic pool is maintained by microbes which are supplied with fresh C like in
soil-plant system. Indeed, the results show that soil C mineralization increases with
temperature till an optimum in bare soil whereas it decreases with temperature in planted soil.
Therefore, our findings allow to reconcile results from lab and field and to include them in a
new theory describing the effect of temperature on recalcitrant soil C mineralization. They
also suggest that the increase in mean temperature at global scale due to the global warming
will not necessary induce the large losses of soil C predicted by current models (Jones et al.,
2005).
Chapter 6
149
The preliminary results of three experiments described in Chapter 5 are briefly
discussed below:
Results from our experiments (Chapter 1 to 3) show that the presence of plant grasses
strongly stimulates the mineralization of SOM, confirming the results obtained with other
plants types (Cheng et al., 2003; Dijkstra et al., 2007). However, the mechanisms developed
by the plant in order to stimulate the mineralization of SOM remain poorly understood. Some
studies have suggested that the root exudation of energy-rich substrates like soluble sugars
and amino acids could a way by which plants accelerate the microbial loop and the
mineralization of soil N into plant rhizosphere (Clarholm, 1987, Bonkowski 2004), but the
results are contradictory (Fontaine et al., 2003; Hamer and Marschner 2005). Other studies
have suggested that vascular arbuscular mycorrhizae associated to herbaceous plants could
directly participate in the decomposition of organic matter (Hodge et al., 2001). However, this
result contradicts many observations suggesting that the enzymatic and degradation capability
of vascular arbuscular mycorrhizae is highly limited. The root litters, on the other hand, are
suggested to induce the acceleration in SOM mineralization (Personeni and Loiseau 2004).
Therefore, a novel experiment based on the use of meshes with various pore sizes was
designed in order to determine the contribution of root exudates, mycorrhizae and roots to
SOM mineralization. First results show that the stimulation of SOM induced by plant grasses
in the device using the larger pore size mesh (1000 µm) was of the same order as that
observed in the plant-soil systems without mesh (Chapter 1-3), that is, a two to three fold
increase in SOM mineralization. This indicates that our device did not disturb plant-soil
interactions and hence was adapted to quantify the role of rhizosphere processes on SOM
mineralization. The results also show that the RPE induced by plant grasses was almost
exclusively the results of root exudates effect. The additive effect of mycorrhizae on RPE was
inexistent throughout the experiment across the three plant species. The presence of roots in
Chapter 6
150
soil compartments, which permitted the supply of root litter and the breaking soil aggregates,
induced significantly higher RPE than that due to root exudates towards the end of the
experiment (50 days after sowing). This effect only represents between 30 and 50% of that
induced by root exudates. However, plants were relatively young during the experiment (52
days old) signifying the root mortality and the deposition of root litter were low during our
experiment. Therefore, our findings indicate that root exudation and deposition of root litters
are the two principal ways by which plant stimulate SOM.
It has been proposed that soil may function as a bank of nutrients for ecosystems
(Fontaine et al., 2011). Fungal degradation of SOM is low when nutrient availability is high,
and when plant demand is low, allowing sequestration of nutrients and carbon; in contrast,
fungal degradation of SOM releases nutrients and carbon from soil organic matter when
nutrient availability is low. This biological adjustment of soil mineral nutrients to plant uptake
of nutrients may contribute to reducing N limitation of plants, minimizing nutrients loss
through leaching and denitrification and building organic reserve of nutrients and carbon
(Fontaine et al., 2011). To test this hypothesis, we set up an experiment where the availability
of nutrients for soil microorganisms is manipulated directly through supply of mineral
fertilizers to Lolium perenne monocultures (Lp) and indirectly by growing Lolium perenne in
mix with a legume Trifolium repens (Lp + Tr) where legume would fix the atmospheric
nitrogen and supply it into soil. When RPE was normalized with fresh C flux respired from
soil plant system, high-N supplied Lp, mixed culture (Lp + Tr) and legume monoculture,
showed the lower amounts of RPE than low N supplied Lp monoculture in the long term. This
indicated the preliminary results from this experiment support the bank mechanism
hypothesis i.e. higher availability of nitrogen reduces RPE and favours the storage of fresh C.
The analysis of supplementary data on soil organic C stocks will allow determining if the
lower RPE in high N treatments leads to net storage of SOM.
Chapter 6
151
The plant species differ in terms of quantity and quality of rhizodeposition in soil.
Moreover, they differ in terms of net N balance they induce in soil by taking up varying
quantities of N and retaining it in their biomass for varying durations. In our work, we
determined the SOM dynamics under six gramineae and one legume grassland species
(Chapter 5, part 1). The preliminary results showed that when RPE was expressed per unit of
fresh C respired from soil-plant system; legume induced the lowest RPE (< 1) suggesting the
net storage of fresh C. Moreover, the gramineae species also varied in terms of RPE induced
per unit of fresh C respired from soil-plant system thereby suggesting various roles vis-à-vis
SOM dynamics. The role of different grassland species on SOM dynamics will be better
understood after complete analysis of net soil C balance and N assimilation by plants in
relation to growth strategies of plant communities e.g. conservative and high statured versus
exploitative and small statured plants
II. Perspectives
A number of perspectives emerge from this work. The most important are presented below:
Our work show that the saprophytic fungi represented by the PLFA 18:2�6c is
linearly correlated to the priming effect induced by distinct plant species and across different
soil layers. We cannot be certain that this correlation detected here and in the work of
Fontaine et al. (2011), will also be observed in other soil types and ecosystems including the
aquatic systems where the priming effect seems to play role in biochemical cycles as well
(Guenet et al., 2010). We therefore encourage research in other ecosystems to verify the
generality of this correlation at global scale. However, if this correlation is confirmed, the
PLFA 18:2�6c could be used as an indicator of the intensity of priming effect in soils. This
biomarker will also be indicative of the quality of soils since the priming effect has a key role
in the “bank functioning” of soils which naturally synchronizes the availability of mineral
nutrients in soils to plant uptake of nutrients. As explained in the discussion section of the
Chapter 6
152
thesis, this synchronization bring many agricultural and ecological services like minimizing
nutrients loss through leaching and denitrification, maximizing primary production and
building organic reserve of nutrients and carbon. Finally, the identification of micro-
organisms involved in the priming effect at the species level can lead to the commercial
cultures of RPE-inducing microbes. These cultures can then be used for de-polluting the soils
polluted by hydrocarbons given the chemical composition of soil organic matter and
hydrocarbons show similarities. Moreover the microbes playing the key role in priming effect
in aquatic systems can be investigated with specifically targeting this fungal group.
The persistence of strong RPE during the 511 days of experiment releasing millennia
old C from deep soil horizons (Chapter 3) suggests that the pool of soil C under the control of
the priming effect is very large. The future models predicting the mean residence times and
turnover rates of soil organic matter in response to global change and managements should
absolutely take this important soil process into account otherwise their predictions can be
misleading. Our results also indicate that the ‘inert’ pool of soil organic C is not so ‘inert’ and
its mineralization can be reactivated. For example, changes in land use and agricultural
practices (for example, deep ploughing versus conservation tillage, use of drought resistant
crops with deep root systems) that increase the distribution of fresh C at depth could stimulate
loss of this ancient buried carbon. Similarly, it has been proposed that organic matter can be
incorporated into deeper soil horizons by growing plants with deeper root systems and by
manipulating faunal activities to transport surface organic matter to deeper horizons (Lorenz
and Lal 2005). The hypothesis behind this proposal is that the organic matter deposited in
deep soils is stabilized and do not interact with the pre-existent SOM, which is not supported
by our results. Therefore, future proposal using deep root plants to inject organic C in deep
soil layers should consider the interactions between the incorporated organic C and the pre-
existent SOM and build long-term soil C balance. From an ecological perspective, it would be
Chapter 6
153
interesting to test whether certain plant species have developed a strategy to reactivate deep
ancient nutrients cycles in order to escape from the strong competition for nutrient acquisition
in surface soil (Tilman, 1982).
It has been suggested that the increased SOM mineralization under living plants could
increase the release of N from SOM (Dijkstra et al., 2008). Our experiment using Festuca
arundinaceae to reactivate SOM mineralization in subsoil (Chapter 3) was not able to
quantify the concomitant extra release of N from SOM mineralization along with RPE due to
methodological problems. However, we are hopeful that we would be able to determine the
consequence of the RPE on gross N mineralization in the experiment on multiple species
(Chapter 5, part 1). Moreover, we encourage future research to quantify the extra release of
mineral N from SOM as a result of RPE across ecosystems and soil types. If the evidence of
enhanced mineral N availability due to RPE is found, the science would be one step closer to
developing high performing agricultural systems which will be used to exploit the bank
mechanism of soils.
Finally, the negative relationship between temperature and recalcitrant soil C mineralization
identified in Chapter 4 should be confirmed in future studies by directly manipulating the
temperature. This approach will facilitate the decoupling of the effect of photosynthesis and
temperature since these two key controls of the priming effect co-vary in ecosystems as
shown in our study. Moreover, the decrease in mineralization induced by temperature should
be studied in long term to see if the decrease is maintained. Moreover, the long term effect of
temperature should also be determined in long-term soil C balance that will take into account
the effect of temperature on decomposition and formation (humification) of SOM. Our model
could be validated under controlled conditions in an enzymatic assay with the objective to
directly determine if the enzyme pool and velocity of enzyme reaction at equilibrium
decreases with temperature. The lab experiment can also be used to determine the enzymatic

Chapter 6
154
parameters of our model i ;e. energy of activation (EA) of specific enzyme activity and
enzyme inactivation, a prerequisite to its inclusion in models of SOM dynamics.
Chapter 6
155
III. References:
Bardgett, R.D., Wardle, D.A., 2003. Herbivore-mediated linkages between aboveground and
belowground communities. Ecology 84, 2258-2268.
Bernard, L., Mougel, C., Maron, P.-A., Nowak, V., Lévêque, J., Henault, C., Haichar, F.e.Z.,
Berge, O., Marol, C., Balesdent, J., Gibiat, F., Lemanceau, P., Ranjard, L., 2007.
Dynamics and identification of soil microbial populations actively assimilating carbon
from 13C-labelled wheat residue as estimated by DNA- and RNA-SIP techniques.
Environmental Microbiology 9, 752-764.
Bonkowski, M., 2004. Protozoa and plant growth: the microbial loop in soil revisited. New
Phytologist 162, 617-631.
Cheng, W., Johnson, D.W., Fu, S., 2003. Rhizosphere effects on decomposition: controls of
plant species, phenology, and fertilization. Soil Sci. Soc. Am. J. 67, 1418-1427.
Clarholm, M., 1985. Interactions of bacteria, protozoa and plants leading to mineralization of
soil nitrogen. Soil Biology and Biochemistry 17, 181-187.
Dijkstra, F.A., Cheng, W., 2007. Interactions between soil and tree roots accelerate long-term
soil carbon decomposition. Ecology Letters 10, 1046-1053.
Dijkstra, F.A., Pendall, E., Mosier, A.R., King, J.Y., Milchunas, D.G., Morgan, J.A., 2008.
Long-term enhancement of N availability and plant growth under elevated CO2 in a
semi-arid grassland. Functional Ecology 22, 975-982.
Fontaine, S., Barot, S., Barre, P., Bdioui, N., Mary, B., Rumpel, C., 2007. Stability of organic
carbon in deep soil layers controlled by fresh carbon supply. Nature 450, 277-280.
Fontaine, S., Henault, C., Aamor, A., Bdioui, N., Bloor, J.M.G., Maire, V., Mary, B.,
Revaillot, S., Maron, P.A., 2011. Fungi mediate long term sequestration of carbon and
nitrogen in soil through their priming effect. Soil Biology and Biochemistry 43, 86-96.
Chapter 6
156
Fontaine, S., Mariotti, A., Abbadie, L., 2003. The priming effect of organic matter: a question
of microbial competition? Soil Biology and Biochemistry 35, 837-843.
Frey, S.D., Elliott, E.T., Paustian, K., Peterson, G.A., 2000. Fungal translocation as a
mechanism for soil nitrogen inputs to surface residue decomposition in a no-tillage
agroecosystem. Soil Biology and Biochemistry 32, 689-698.
Frey, S.D., Six, J., Elliott, E.T., 2003. Reciprocal transfer of carbon and nitrogen by
decomposer fungi at the soil-litter interface. Soil Biology and Biochemistry 35, 1001-
1004.
Guenet, B., Danger, M., Abbadie, L., Lacroix, G., 2010. Priming effect: bridging the gap
between terrestrial and aquatic ecology. Ecology 91, 2850-2861.
Hamer, U., Marschner, B., 2005. Priming effects in different soil types induced by fructose,
alanine, oxalic acid and catechol additions. Soil Biology and Biochemistry 37, 445-
454.
Hamilton, E.W., Frank, D.A., 2001. Can plants stimulate soil microbes and their own nutrient
supply? Evidence from a grazing tolerant grass. Ecology 82, 2397-2402.
Hodge, A., Campbell, C.D., Fitter, A.H., 2001. An arbuscular mycorrhizal fungus accelerates
decomposition and acquires nitrogen directly from organic material. Nature 413, 297-
299.
Jones, C., McConnell, C., Coleman, K., Cox, P., Falloon, P., Jenkinson, D., Powlson, D.,
2005. Global climate change and soil carbon stocks; predictions from two contrasting
models for the turnover of organic carbon in soil. Global Change Biology 11, 154-166.
Lorenz, K., Lal, R., Donald, L.S., 2005. The Depth distribution of soil organic carbon in
relation to land use and management and the potential of carbon sequestration in
subsoil horizons, Advances in Agronomy. Academic Press, pp. 35-66.
Chapter 6
157
Macduff, J.H., Jackson, S.B., 1992. Influx and efflux of nitrate and ammonium in Italian
ryegrass and white Clover Roots- comparisons between effects of darkness and
defoliation. Journal of Experimental Botany 43, 525-535.
Nottingham, A.T., Griffiths, H., Chamberlain, P.M., Stott, A.W., Tanner, E.V.J., 2009. Soil
priming by sugar and leaf-litter substrates: A link to microbial groups. Applied Soil
Ecology 42, 183-190.
Personeni, E., Loiseau, P., 2004. How does the nature of living and dead roots affect the
residence time of carbon in the root litter continuum? Plant and Soil 267, 129-141.
Tilman, D. (1982) Resource competition and community structure (Princeton Univ. Press,
Princeton).
158
APPENDIX OF THE THESIS
Acellular respiration: reconstitution of an oxidative metabolism by enzymes released
from dead cells
Appendix of the Thesis
159
Annex of the Thesis
ACELLULAR RESPIRATION: RECONSTITUTION OF AN
OXIDATIVE METABOLISM BY ENZYMES RELEASED FROM
DEAD CELLS
Vincent Maire1, Gaël Alvarez1,2, Jonathan Colombet3, Aurélie Comby1, Romain Despinasse4,
Eric Dubreucq5, Muriel Joly1, Anne-Catherine Lehours3, Véronique Perrier5, Tanvir Shahzad1
and Sébastien Fontaine1
1. INRA, UR 874 UREP, 63100 Clermont-Ferrand, France
2. Clermont Université, VetAgro Sup, 63000, Clermont-Ferrand, France
3. University of Clermont Ferrand, UMR 6023 LMGE, 63177 Aubière, France
4. INRA, UMR 1095 UBP, 63100 Clermont-Ferrand, France
5. Montpellier SupAgro, UMR 1208 IATE, 34060 Montpellier, France
*Authors for correspondence (phone +33 473 62 48 72; fax +33 473 62 44 57; e-mail,
Email: [email protected]; [email protected]; [email protected];
[email protected]; [email protected]; [email protected]; [email protected];
[email protected]; [email protected]; [email protected]
Abstract 124 words; Total word count: 4148
Figure: 4; Supplementary online material: 9
Key Words: cellular respiration; enzyme activity; soil enzyme stability; oxidative
metabolism; fermentative metabolism; life origin; soil memory, biotechnology.
Appendix of the Thesis
160
Almost all the life is fuelled by energy released from cellular respiration, also known as
oxidative metabolism. This metabolism implies a high number of biochemical reactions
requiring many enzymes, co-factors and strict physico-chemical conditions. Given this
complexity, it is believed that only a living cell is able to organize the cascade of
reactions leading to respiration. Here we show that enzymes released from dead cells
reconstitute an oxidative metabolism in water and soil without cellular organization.
This acellular respiration can contribute to 16-48% of soil respiration. These results
indicate that, when all relevant organic molecules are present, complex biochemical
reactions underpinning bioenergetics of life can occur spontaneously without living
structure. The first ancestral oxidative metabolism may have occurred in soil before the
first cells.
The cellular respiration involves the coupled oxidation of one organic molecule (e.g.
glucose) with the reduction of another (e.g. O2), which generally leads to the release of CO2.
Outside the cell catalytic environment, the organic molecules are generally highly stable. For
instance, the oxidation of one molecule of glucose through the combustion process requires a
temperature greater than 500°C. Consequently, the oxidation of organic molecules by
heterotrophic organisms involves a range of intracellular enzymes that decrease the activation
energy of this reaction. It is commonly accepted that these enzymes cannot function outside
the cell because they depend on various co-factors (e.g. NAD+), on being located adjacent to
other enzymes for exchanges of substrates and products, and on some physiological properties
of the cell (e.g. redox potential) (1-3). However, some studies have shown persistence of CO2
production in soils where microbial life had been removed or at least strongly reduced, by
exposition to toxics (ClCH3, orange acridine) or irradiation (4-7). It is well known that many
enzymes secreted by microorganisms and released from dead cells are present in soil (3), but
it is generally considered that respiration is associated with living cells only. The origin of this
CO2 production in the absence of living microorganisms remains largely unknown and
challenges our basic knowledge of biology.
Origin of CO2 production in soil deprived of life. We investigated this origin in five
top soils (0-20 cm) sampled in 2010 in different regions of the world. The soils of Bugac
(Hungary), Laqueuille (France), Ponta Grossa (Brasil), Soro (Denmark) and Theix (France)
presented textures from sandy-silted to silty-clay soils, pH from 4.3 to 8.6 and two different
vegetation covers (grassland and forest) (8, SI1). The soil of Theix, which is a cambisol, was
used for all investigations whereas the other soils were only used to generalize the key
findings of this study. Soils were exposed to -irradiation (45kGy) to kill soil organisms.
Appendix of the Thesis
161
Typically, -irradiation at 20 kGy eliminates cultivable bacteria, actinomycetes and fungi (9).
The -irradiated soil was then incubated under sterile conditions at 30°C to quantify the
production of CO2. Non-irradiated living soil was also incubated as a control. The effect of -
irradiation on soil microorganisms and the sterility of microcosms were investigated using
four complementary methods applied to incubated soils: i) quantifying the changes in
microbial biomass (10); ii) enumerating morphological intact cells by transmission electron
microscopy (11, SI2); iii) searching for the presence of -resistant cultivable microorganisms
(e.g. Deinococcus radiodurans (12-13)); and iv) counting functional RNA-producing
microorganisms in soils by using fluorescence in-situ hybridization (TSA FISH (14)). Finally,
in order to check that our methods were able to detect the presence of functional living
microorganisms in low density, we determined the sensibility of TSA-FISH method (SI2) and
experimentally simulated a contamination of irradiated soil microcosms by inoculating them
with soil inoculum. The microbial biomass brought by this inoculation represented 1/1900 of
the microbial biomass present in the non-irradiated soil.
In spite of their exposure to -irradiation, the five tested soils still released large
quantities of CO2, corresponding to 20-100% of the CO2 released by the non-irradiated soils
after two days of incubation (Fig. 1A). This proportion decreased during the first part of the
incubation (0-6 days) and stabilized at 20-60% depending significantly on soil type at the end
of incubation (21 days). The incubation duration for the Theix soil was extended to test
whether CO2 production endured in the long term. Significant CO2 production was measured
during 332 days and 50% of the initial production rate was only reached after 165 days (Fig.
1B). Although the release of CO2 from soil inorganic carbon reserve (e.g. CaCO3) may have
partly contributed to the production of CO2 in the alkaline soil of Bugac (15), this chemical
process cannot explain the release of CO2 in the other soils. We therefore tested the
hypothesis that this production of CO2 resulted from an oxidative metabolism by incubating
the irradiated soil of Theix with 13C-labeled glucose. Figure 1C shows that added glucose was
oxidized in 13CO2, while figure 1D shows that the accumulation of CO2 mirrored the
consumption of O2 leading to a respiratory quotient (CO2/O2) of 0.96, which is typical of the
respiratory activity of cells.
What was the effect of -irradiation on soil microorganisms? Irradiation strongly
reduced the microbial biomass measured in the soil of Theix, from 1000 in the non-irradiated
soil to 200 mgC kg-1 in the irradiated soil at the beginning of incubation (Fig. 2A). Moreover,
transmission electron microscopy showed that irradiation caused many damages to cells such
as membrane disruption and loss of cell turgescence (Fig. 2E). After irradiation of Theix soil,
Appendix of the Thesis
162
number of morphological intact cells was divided by 16 (Fig 2D) whereas the respiration rate
was only divided by 1.25 after two days of incubation (Fig 1A). Our results also showed that
the remaining cells were not viable or functional. Indeed, microbial biomass continuously
decreased during the incubation reaching undetectable value at day 13 (Fig. 2A), indicating
that this microbial biomass was not viable and lyzed. Furthermore, no culture from any soil
revealed the presence of viable and cultivable microbes (SI1). Finally, functional RNA-
producing cells were not detected in the irradiated soil of Theix irrespective of sampling date
(Fig. 2B). This showed that the cells remaining after irradiation did not provide RNA and
thereby respiratory enzymes anymore. Of course, we cannot exclude the possibility that some
functional RNA-producing cells remained in irradiated soil and were undetected by our
method. However, based on the specific respiratory activity of soil microorganisms calculated
in the living soil (respiration per unit cell, Fig 1E and 2B incubation period 0-2 days), we
calculated that respiration in the irradiated soil corresponded at least to an activity of 4.109
cells g-1 soil. Given that the TSA-FISH method was able detecting the presence of 105 cells g-1
soil (SI2), we quantified that the potential contribution of undetectable cells to the respiration
observed in irradiated soil cannot exceed 1/10,000. Consistently, the simulated contamination
of irradiated soil was immediately detected by the TSA-FISH method (Fig. 2B). This
contamination was followed by a flush of respiration and growth of microorganisms using the
soluble C released by the killed biomass (Fig. 1E; 2A-C). Collectively, these results strongly
suggest that respiration fluxes recorded after irradiation cannot be attributed to cellular
activities.
Respiration as an acellular metabolism. Given that an oxidative metabolism could
be maintained in environment deprived of life, we propose the idea that respiration can be an
acellular process. We suggest that even in the absence of living cells, an oxidative metabolism
can be carried out by enzymes released from dead cells. At the end of the respiratory chain,
the transfer of electrons to O2 could be supported by microbial membrane debris and soil
particles due to their electric charge (16) allowing a regeneration of co-factors (e.g. NAD+).
To test the hypothesis of an acellular respiration (AR), a fresh cell-free extract of yeast
(Pichia pastoris) containing enzymes of glycolysis and Krebs cycle was produced (SI3).
Immediately after production (17), the yeast cell-free extract was incubated with 13C labeled
glucose in water and in irradiated soil of Theix (W+G+YE and S+G+YE treatments). Water
with glucose, irradiated soil with and without glucose were also incubated as controls (W+G,
S and S+G treatments, respectively). The ability of enzymes present in the yeast extract to
carry out an acellular respiration was tested by quantifying fluxes of CO2, 13CO2 and O2 in
Appendix of the Thesis
163
water and soil microcosms. Second glucose supply was applied after 20 days of incubation in
order to determine the long term respiratory capabilities of enzymes. Sterility of microcosms
was verified after 0, 2 and 53 days of incubation through direct microscopic observations
(water microcosms) and TSA-FISH method.
Microscopic observations and TSA-FISH measurements indicated that there was no
microbial contamination throughout the experiment. The production of CO2 was null in water
with glucose (W+G, data not shown) and low in the two control soils (S and S+G, Fig 3A-B).
The supply of glucose had no effect on soil respiration (S versus S+G) indicating that C-
substrate availability was not a limiting factor for respiration in irradiated soil. In contrast, the
supply of yeast extract to water and soil microcosms (W+G+YE and S+G+YE, respectively)
triggered enormous respiration fluxes. Respiration from W+G+YE and S+G+YE respectively
represented 725 and 72 times the flux observed in control soils (Day 0.75, Fig. 3A-B). This
over-respiration was maintained in water and soil microcosms over the 53 days of incubation
though significantly decreased in intensity with time (Fig. 3A-B). The respired C originated
from added labeled glucose and unlabelled substrates present in yeast extract and soil (SI4).
Thus, an equivalent of glycolysis and Krebs cycle was reconstituted by enzymes of yeast
extract. These results confirm the idea that respiration can be acellular. Interestingly, the
production of CO2 systematically mirrored the consumption of O2 in any treatments and dates,
unless in the W+G+YE treatment at day 0.75 (respiratory quotient = 2, Fig. 3A). In this case,
the availability of O2 was reduced, metabolic activity was intense and the pressure into
microcosms rose to 1.25 atm, which indicated the presence of fermentative metabolism (Fig.
3A-B). These results suggest that without any cellular regulation, enzymes were able to
switch between oxidative and fermentative metabolisms in function to the redox condition of
microcosms. At short term, acellular respiration was significantly higher in water than soil
microcosms, which can be explained by various toxic and inhibiting molecules present in soil
and some interactions with soil minerals that can affect enzyme activity (3). After 20 days of
incubation, acellular respiration in W+G+YE treatment was very low representing 17% of
control soil respiration while it was stabilized in S+G+YE treatment at a rate representing
247% of control soil respiration. The lower respiration in water than in soil microcosms after
20 days was due to an inactivation of enzymes and not to an exhaustion of C-substrate since
the second glucose supply had no effect on respiration rate (SI5). These results suggest that
part of added enzymes was protected from inactivation in soil allowing persistence of
acellular respiration over long term.
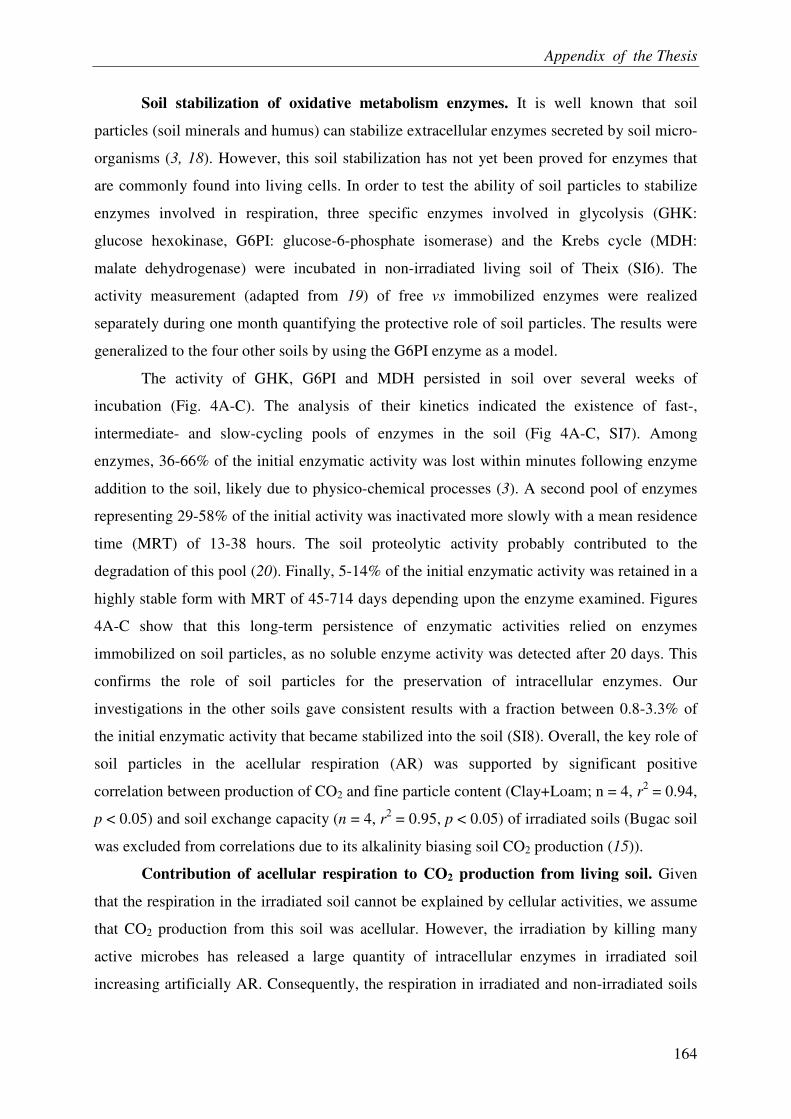
Appendix of the Thesis
164
Soil stabilization of oxidative metabolism enzymes. It is well known that soil
particles (soil minerals and humus) can stabilize extracellular enzymes secreted by soil micro-
organisms (3, 18). However, this soil stabilization has not yet been proved for enzymes that
are commonly found into living cells. In order to test the ability of soil particles to stabilize
enzymes involved in respiration, three specific enzymes involved in glycolysis (GHK:
glucose hexokinase, G6PI: glucose-6-phosphate isomerase) and the Krebs cycle (MDH:
malate dehydrogenase) were incubated in non-irradiated living soil of Theix (SI6). The
activity measurement (adapted from 19) of free vs immobilized enzymes were realized
separately during one month quantifying the protective role of soil particles. The results were
generalized to the four other soils by using the G6PI enzyme as a model.
The activity of GHK, G6PI and MDH persisted in soil over several weeks of
incubation (Fig. 4A-C). The analysis of their kinetics indicated the existence of fast-,
intermediate- and slow-cycling pools of enzymes in the soil (Fig 4A-C, SI7). Among
enzymes, 36-66% of the initial enzymatic activity was lost within minutes following enzyme
addition to the soil, likely due to physico-chemical processes (3). A second pool of enzymes
representing 29-58% of the initial activity was inactivated more slowly with a mean residence
time (MRT) of 13-38 hours. The soil proteolytic activity probably contributed to the
degradation of this pool (20). Finally, 5-14% of the initial enzymatic activity was retained in a
highly stable form with MRT of 45-714 days depending upon the enzyme examined. Figures
4A-C show that this long-term persistence of enzymatic activities relied on enzymes
immobilized on soil particles, as no soluble enzyme activity was detected after 20 days. This
confirms the role of soil particles for the preservation of intracellular enzymes. Our
investigations in the other soils gave consistent results with a fraction between 0.8-3.3% of
the initial enzymatic activity that became stabilized into the soil (SI8). Overall, the key role of
soil particles in the acellular respiration (AR) was supported by significant positive
correlation between production of CO2 and fine particle content (Clay+Loam; n = 4, r2 = 0.94,
p < 0.05) and soil exchange capacity (n = 4, r2 = 0.95, p < 0.05) of irradiated soils (Bugac soil
was excluded from correlations due to its alkalinity biasing soil CO2 production (15)).
Contribution of acellular respiration to CO2 production from living soil. Given
that the respiration in the irradiated soil cannot be explained by cellular activities, we assume
that CO2 production from this soil was acellular. However, the irradiation by killing many
active microbes has released a large quantity of intracellular enzymes in irradiated soil
increasing artificially AR. Consequently, the respiration in irradiated and non-irradiated soils
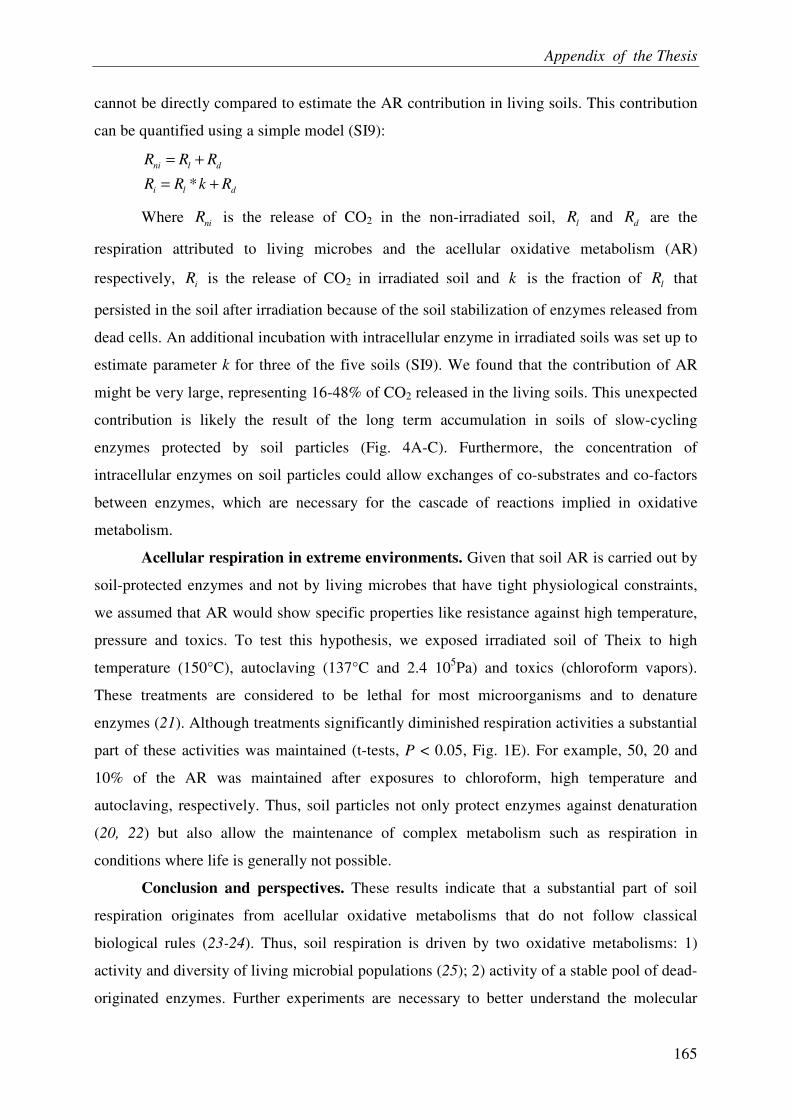
Appendix of the Thesis
165
cannot be directly compared to estimate the AR contribution in living soils. This contribution
can be quantified using a simple model (SI9):
*ni l d
i l d
R R R
R R k R
= +
= +
Where niR is the release of CO2 in the non-irradiated soil, lR and dR are the
respiration attributed to living microbes and the acellular oxidative metabolism (AR)
respectively, iR is the release of CO2 in irradiated soil and k is the fraction of lR that
persisted in the soil after irradiation because of the soil stabilization of enzymes released from
dead cells. An additional incubation with intracellular enzyme in irradiated soils was set up to
estimate parameter k for three of the five soils (SI9). We found that the contribution of AR
might be very large, representing 16-48% of CO2 released in the living soils. This unexpected
contribution is likely the result of the long term accumulation in soils of slow-cycling
enzymes protected by soil particles (Fig. 4A-C). Furthermore, the concentration of
intracellular enzymes on soil particles could allow exchanges of co-substrates and co-factors
between enzymes, which are necessary for the cascade of reactions implied in oxidative
metabolism.
Acellular respiration in extreme environments. Given that soil AR is carried out by
soil-protected enzymes and not by living microbes that have tight physiological constraints,
we assumed that AR would show specific properties like resistance against high temperature,
pressure and toxics. To test this hypothesis, we exposed irradiated soil of Theix to high
temperature (150°C), autoclaving (137°C and 2.4 105Pa) and toxics (chloroform vapors).
These treatments are considered to be lethal for most microorganisms and to denature
enzymes (21). Although treatments significantly diminished respiration activities a substantial
part of these activities was maintained (t-tests, P < 0.05, Fig. 1E). For example, 50, 20 and
10% of the AR was maintained after exposures to chloroform, high temperature and
autoclaving, respectively. Thus, soil particles not only protect enzymes against denaturation
(20, 22) but also allow the maintenance of complex metabolism such as respiration in
conditions where life is generally not possible.
Conclusion and perspectives. These results indicate that a substantial part of soil
respiration originates from acellular oxidative metabolisms that do not follow classical
biological rules (23-24). Thus, soil respiration is driven by two oxidative metabolisms: 1)
activity and diversity of living microbial populations (25); 2) activity of a stable pool of dead-
originated enzymes. Further experiments are necessary to better understand the molecular
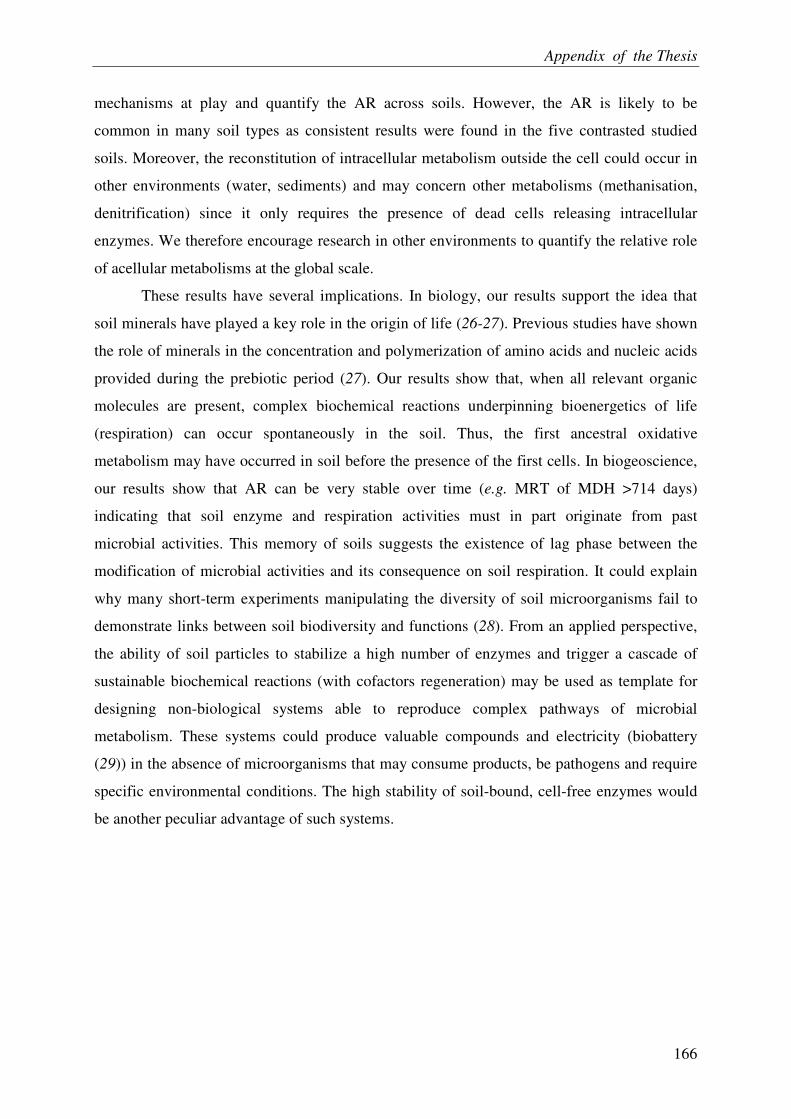
Appendix of the Thesis
166
mechanisms at play and quantify the AR across soils. However, the AR is likely to be
common in many soil types as consistent results were found in the five contrasted studied
soils. Moreover, the reconstitution of intracellular metabolism outside the cell could occur in
other environments (water, sediments) and may concern other metabolisms (methanisation,
denitrification) since it only requires the presence of dead cells releasing intracellular
enzymes. We therefore encourage research in other environments to quantify the relative role
of acellular metabolisms at the global scale.
These results have several implications. In biology, our results support the idea that
soil minerals have played a key role in the origin of life (26-27). Previous studies have shown
the role of minerals in the concentration and polymerization of amino acids and nucleic acids
provided during the prebiotic period (27). Our results show that, when all relevant organic
molecules are present, complex biochemical reactions underpinning bioenergetics of life
(respiration) can occur spontaneously in the soil. Thus, the first ancestral oxidative
metabolism may have occurred in soil before the presence of the first cells. In biogeoscience,
our results show that AR can be very stable over time (e.g. MRT of MDH >714 days)
indicating that soil enzyme and respiration activities must in part originate from past
microbial activities. This memory of soils suggests the existence of lag phase between the
modification of microbial activities and its consequence on soil respiration. It could explain
why many short-term experiments manipulating the diversity of soil microorganisms fail to
demonstrate links between soil biodiversity and functions (28). From an applied perspective,
the ability of soil particles to stabilize a high number of enzymes and trigger a cascade of
sustainable biochemical reactions (with cofactors regeneration) may be used as template for
designing non-biological systems able to reproduce complex pathways of microbial
metabolism. These systems could produce valuable compounds and electricity (biobattery
(29)) in the absence of microorganisms that may consume products, be pathogens and require
specific environmental conditions. The high stability of soil-bound, cell-free enzymes would
be another peculiar advantage of such systems.
Appendix of the Thesis
167
REFERENCES
1. H. Krebs, Philos. T. R. Soc. B. 293, 3 (1981).
2. P. R. Rich, Biochem. Soc. T. 31, 1095 (2003).
3. R. G. Burns, Soil Biol. Biochem. 14, 423 (1982).
4. G. H. Peterson, Soil Science 94, 71-74 (1962).
5. A. J. Ramsay, A. D. Bawden, Soil Biol. Biochem. 15, 263 (1983).
6. R. Lensi, C. Lescure, C. Steinberg, J.M. Savoie, G. Faurie, Soil Biol. Biochem. 23, 367
(1991).
7. J.T. Trevors, J. Microbiol. Meth. 26, 53 (1996).
8. D. Baldocchi, Aust. J. Bot. 56, 1 (2008).
9. N. P. McNamara, H. I. J. Black, N. A. Beresford, N. R. Parekh, Appl. Soil Ecol. 24, 117
(2003).
10. E. D. Vance, P. C. Brookes, D. S. Jenkinson, Soil Biol. Biochem. 19, 703 (1987).
11. J. Colombet, et al., App. Environ. Microbiol. 72, 4440 (2006).
12. F. A. Rainey, et al., Appl. Environ. Microbiol. 71, 5225 (2005).
13. J. H. Warcup, T. Brit. Mycol. Soc. 34, 376 (1950).
14. I. C. Biegala, F. Not, D. Vaulot, N. Simon, Appl. Environ. Microbiol. 69, 5519 (2003).
15. I. Bertrand, O. Delfosse, B. Mary, Soil Biol. Biochem. 39, 276 (2007).
16. J. T. Trevors, C. I. Mayfield, W. E. Inniss, Microb. Ecol. 8, 163 (1982).
17. G. J. Vanderheiden, A. C. Fairchild, G. R. Jago, Appl Microbiol 19, 875 (1970).
18. R. L. Sinsabaugh, M. J. Klug, H. P. Collins, P. E. Yeager, S. O. Petersen, Characterising
soil microbial communities, in G. P. Robertson, D. C. Coleman, C. S. Bledsoe, P.
Sollins, Eds. Standard soil methods for long term ecological research.(Oxford
University Press, New York, 1999) pp. 318-348.
19. S. Nardi, et al., Soil Biol. Biochem. 39, 3138 (2007).
20. J. M. Sarkar, A. Leonowicz, J. M. Bollag, Soil Biol. Biochem. 21: 223 (1989).
21. K. Kashefi, D. R. Lovley, Science 301, 934 (2003).
22. P. Lähdesmäki, R. Pnspanen, Soil Biol. Biochem. 24, 1173 (1992).
23. H. Koffler, G. E. Mallett, J. Adye, P. Natl. Acad. Sci. Biol. 43, 464 (1957).
24. P. Lopez-Garcia, Adv. Astrobio. Biogeop. 2, 221 (2007)
25. S. Fontaine, S. Barot, Ecol. Lett. 8, 1075 (2005).
26. R. M. Hazen, Am. Mineral. 91, 1715 (2006).
27. J. D. Bernal, Proc. Phys. Soc. B62, 597 (1949).
28. B. S. Griffiths, et al., Soil Biol. Biochem. 33, 1713 (2001).
Appendix of the Thesis
168
29. S. Kerzenmacher, J. Ducrée, R. Zengerle, F. von Stetten, J Power Sources 182, 1 (2008).
SUPPORTING ONLINE MATERIAL
Materials and Methods
SI1: Physical and chemical properties of five studied soils and counting of -resistant
cultivable microbes.
SI2: Detailed methods for the transmission electron microscopy and the TSA-FISH.
SI3: Detailed method for the yeast extract production.
SI4: Unlabelled and labeled carbon released as CO2 in water and soil microcosms.
SI5: Effect of the second glucose supply on microcosm respiration.
SI6: Detailed method for the measurement of enzymatic activities involved in glycolysis and
the Krebs cycle in soil.
SI7: Analysis of the three cycling pools of intracellular enzymes in the soil of Theix.
SI8: Generalization of result on intracellular enzyme stabilization to the five studied soils.
SI9: Estimation of acellular respiration in living soil.
References (30-36)
Appendix of the Thesis
169
FIGURE LEGEND
Figure 1: Gas flux exchanges during incubations of soil and water microcosms.
(A) Ratio between the CO2 produced in the irradiated and the non-irradiated soil for the five
studied soils incubated in aerobic conditions. Symbols are labeled as: red D2, incubation day
2; orange D6, incubation day 6; clear green D13, incubation day 13; dark green D21,
incubation day 21. Letters indicate the differences at 5% P-level between measurements over
time (lower case) and across soils (upper case) based on repeated–measures analysis of
variance. (B) Exponential decrease of CO2 production rate in the irradiated soil of Theix
incubated during 48 week. The half-life (t1/2) and mean residence (MRT) times were
calculated from the exponential model Y(t)=A0e-kt where Y(t) is the production rate of CO2
with time, A0 the initial production rate and k the rate decay. (C) Isotopic composition (in ‰
delta 13C) of CO2 released by the irradiated soil of Theix after addition of 13C labeled glucose.
(D) Cumulated production of CO2 and consumption of O2 induced by incubation of the
irradiated soil of Theix. Full and dashed lines represent the fit of linear regressions and their
error intervals at 5% P-level, respectively. (E) Cumulated CO2 production in response to
different treatments applied to soil of Theix. Symbols are labeled as follows: brown �, non-
irradiated control soil; orange �, irradiation; clear green �, irradiation + 150°C; dark green
, irradiation + fumigation; clear blue �, irradiation + autoclaving; dark blue �, irradiation +
re-inoculation with a soil inoculum to simulate a contamination.
Figure 2: Tests for the presence / absence of microbes in the soil of Theix.
Dynamics of (A) microbial biomass, (B) count of TSA-FISH stained cells and (C) Soluble C
in irradiated soil (black bars), living control soil (white bars), irradiated and re-inoculated soil
(grey bars). Differences from zero of different variables were tested with t-test at 5% P-level.
Abbreviation: ns, non significant. (D) Count of morphological intact cells by transmission
electron microscopy in living control soil (white bars) and in irradiated soil (black bars) after
0 and 190 days of incubation. Differences between living control and irradiated soils were
tested with t-tests at 5% P-level. Number of cells in the two irradiated soils was not
significantly different from zero (t-test, 5% P-level). (E) Transmission electron micrographs
of injured (graphs 1 to 5) and morphological intact cells (graphs 6 to 7). The arrow on graphs
4 indicates a membrane disruption. The scale black bar corresponds to 500 nm length.
Figure 3: Acellular respiration induced by cell-free yeast extract incubated in water and soil
microcosms.
Appendix of the Thesis
170
(A) Production of CO2 and consumption of O2 by soil and water microcosms from the yeast
extract incubation for four periods of incubation. Symbols are labeled as follows: orange S,
irradiated soil; clear green S+G, irradiated soil + labeled glucose; dark green S+G+YE,
irradiated soil + labeled glucose + yeast extract; brown W+G+YE, water + labeled glucose +
yeast extract. Water with labeled glucose was also incubated as control, but the production of
CO2 from this control was null and not reported into the figure. Letters indicate at each
sampling date the differences at 5% P-level among treatments based on an ANOVA. (B)
Production rate of CO2 released by water and soil microcosms. Symbols are same to Fig. 3B.
Figure 4: Activity of oxidative metabolism enzymes in the soil of Theix.
Fate of the activity of three specific enzymes (Aj) involved in glycolysis and the Krebs cycle
following their incorporation into the living control soil. Enzyme activity is expressed as % of
the activity of enzymatic solution incorporated into the soil. The activity of enzymes, free in
soil solution (full circles) and immobilized on soil particles (empty circles), are distinguished.
Full, dashed and dotted lines represent the fit of double exponential models, their confidence
and predictive error intervals at 5% P-level, respectively. (A) G6PDH: glucose-6-phosphate
dehydrogenase; (B) GHK: glucose hexokinase; (C) MDH: malate dehydrogenase.
� ACKNOWLEDGMENTS: We thank D. Tourvieille M. Leguillon, D. Jolivot, F. Cambon.
and the “Plant and Pathogen” team of the UMR-INRA 1095 for their technical support. We
thank P. Ambus, L. da Silveira Pontes, and L. Horváth who respectively sampled the soil in
Denmark, Brazil and Hungary respectively; C. Mallet for culture analysis; S. Revaillot, O.
Delfosse and J.-L. Ollier for chemical and isotopic analyses; L. Genestoux, C. Chabalier, F.-
X. Sauvage, N. Duchatau for intracellular enzymatic activity analyses, G. Borrel for gas
spectrometry; and V. Allard, P. Barré, S. Barot, J. Bloor & R. Pilon for their constructive
comments on a previous version of the manuscript. The research leading to these results has
received funding from the French Institutes INRA-INRIA (ARC-VitelBio), the French
national agency ANR (DIMIMOS) and the European Community's 6th and 7th Framework
Programs (FP6 and FP7) under grant agreement n° 017841 (Nitro-Europe) and n° 226701
(CARBO-Extreme). All authors have refused to apply for the research bonus scheme set up
by the French government in 2010 and have consequently no competing financial interest in
this work.
AUTHOR CONTRIBUTIONS: This work originated from an idea of SF; VM, ED and SF
designed experiments; RD and MJ conducted soil incubations and counting of cultivable
Appendix of the Thesis
171
microorganisms; RD and VM performed gas spectrometry; ACL and VM performed
fluorescence in situ hybridization (TSA-FISH); VM and SF conducted the incubation
experiment with intracellular enzymes; GA, VP, ED and SF conducted the incubation
experiment with yeast extract; SF built the model for estimating acellular respiration in soils;
VM, TS and SF wrote the manuscript; and all authors took part in the interpretation of the
results.
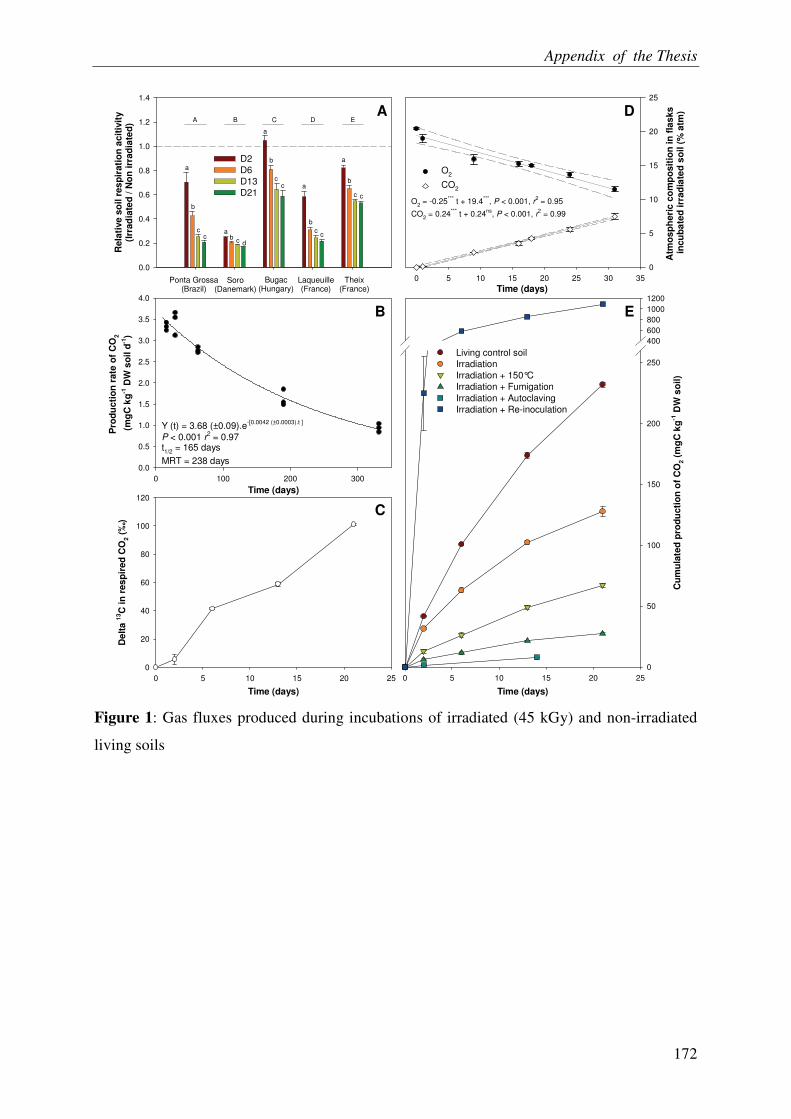
Appendix of the Thesis
172
Time (days)
0 5 10 15 20 25C
um
ula
ted
pro
du
cti
on
of
CO
2 (
mg
C k
g-1
DW
so
il)
0
50
100
150
200
250
400
600
800
1000
1200
Living control soil
Irradiation
Irradiation + 150°C
Irradiation + Fumigation
Irradiation + Autoclaving
Irradiation + Re-inoculation
Time (days)
0 100 200 300
Pro
du
cti
on
rate
of
CO
2
(mg
C k
g-1
DW
so
il d
-1)
0.0
0.5
1.0
1.5
2.0
2.5
3.0
3.5
4.0
Time (days)
0 5 10 15 20 25
De
lta
13C
in
res
pir
ed
CO
2 (
‰)
0
20
40
60
80
100
120
Rela
tive s
oil r
es
pir
ati
on
acit
ivit
y(I
rrad
iate
d / N
on
irr
ad
iate
d)
0.0
0.2
0.4
0.6
0.8
1.0
1.2
1.4
D2
D6
D13
D21
Time (days)0 5 10 15 20 25 30 35
Atm
os
ph
eri
c c
om
po
sit
ion
in
fla
sks
in
cu
ba
ted
irr
ad
iate
d s
oil (
% a
tm)
0
5
10
15
20
25
O2
CO2
A
a
b
cc
ab
c d
a
b
cc a
b
cc
a
b
c c
A B C D E
Ponta Grossa(Brazil)
Soro(Danemark)
Bugac(Hungary)
Laqueuille(France)
Theix(France)
C
E
D
Y (t) = 3.68 (±0.09).e-[0.0042 (±0.0003).t ]
P < 0.001 r2 = 0.97
t1/2
= 165 days
MRT = 238 days
O2 = -0.25
*** t + 19.4
***, P < 0.001, r
2 = 0.95
CO2 = 0.24
*** t + 0.24
ns, P < 0.001, r
2 = 0.99
B
Figure 1: Gas fluxes produced during incubations of irradiated (45 kGy) and non-irradiated
living soils
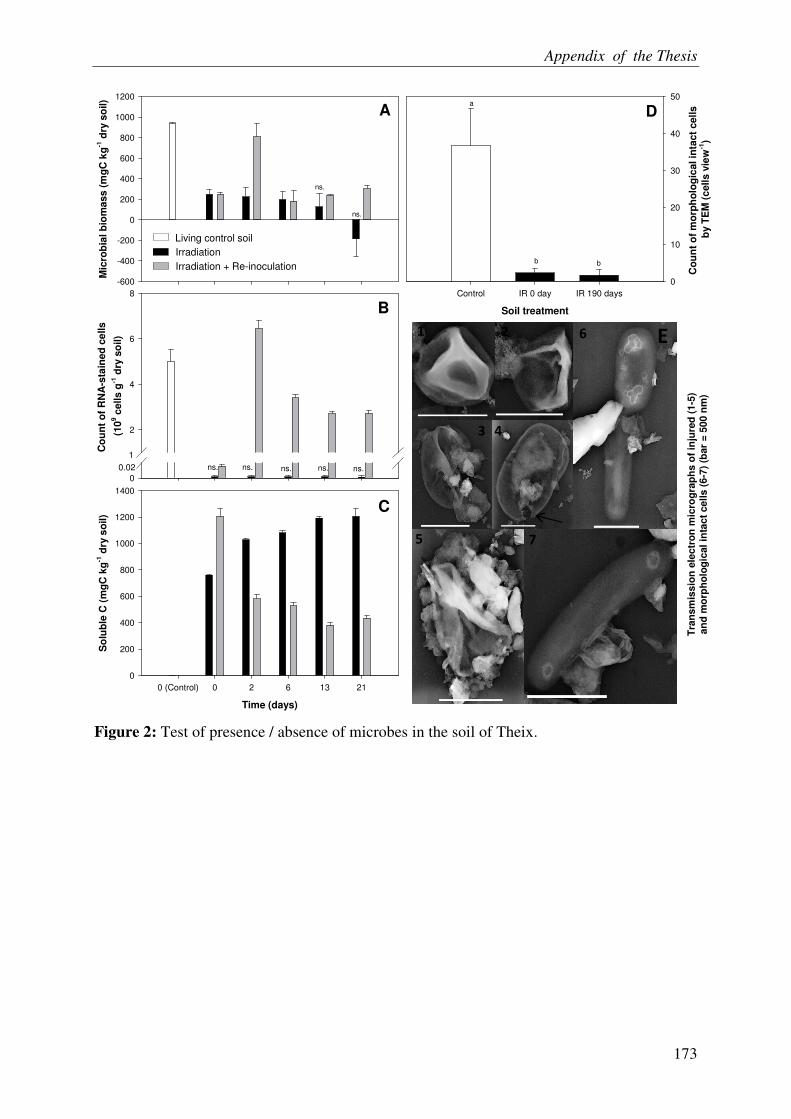
Appendix of the Thesis
173
Mic
rob
ial b
iom
ass
(m
gC
kg
-1 d
ry s
oil)
-600
-400
-200
0
200
400
600
800
1000
1200
Time (days)
0 (Control) 0 2 6 13 21
So
lub
le C
(m
gC
kg
-1 d
ry s
oil)
0
200
400
600
800
1000
1200
1400
Co
un
t o
f R
NA
-sta
ined
ce
lls
(10
9 c
ells g
-1 d
ry s
oil)
0
2
4
6
8
Living control soil
Irradiation
A
B
Irradiation + Re-inoculation
ns.
ns.
C
ns. ns.ns. ns. ns.0.02
1
Soil treatment
Control IR 0 day IR 190 days
Co
un
t o
f m
orp
ho
log
ical in
tact
cells
by T
EM
(c
ells v
iew
-1)
0
10
20
30
40
50
Da
b b
Tra
nsm
issio
n e
lectr
on
mic
rog
rap
hs o
f in
jure
d (
1-5
) an
d m
orp
ho
log
ical
inta
ct
cells (
6-7
) (b
ar
= 5
00 n
m)
� � �
� �
� �
�
Mic
rob
ial b
iom
ass
(m
gC
kg
-1 d
ry s
oil)
-600
-400
-200
0
200
400
600
800
1000
1200
Time (days)
0 (Control) 0 2 6 13 21
So
lub
le C
(m
gC
kg
-1 d
ry s
oil)
0
200
400
600
800
1000
1200
1400
Co
un
t o
f R
NA
-sta
ined
ce
lls
(10
9 c
ells g
-1 d
ry s
oil)
0
2
4
6
8
Living control soil
Irradiation
A
B
Irradiation + Re-inoculation
ns.
ns.
C
ns. ns.ns. ns. ns.0.02
1
Soil treatment
Control IR 0 day IR 190 days
Co
un
t o
f m
orp
ho
log
ical in
tact
cells
by T
EM
(c
ells v
iew
-1)
0
10
20
30
40
50
Da
b b
Tra
nsm
issio
n e
lectr
on
mic
rog
rap
hs o
f in
jure
d (
1-5
) an
d m
orp
ho
log
ical
inta
ct
cells (
6-7
) (b
ar
= 5
00 n
m)
� � �
� �
� �
�� � �
� �
� �
�
Figure 2: Test of presence / absence of microbes in the soil of Theix.
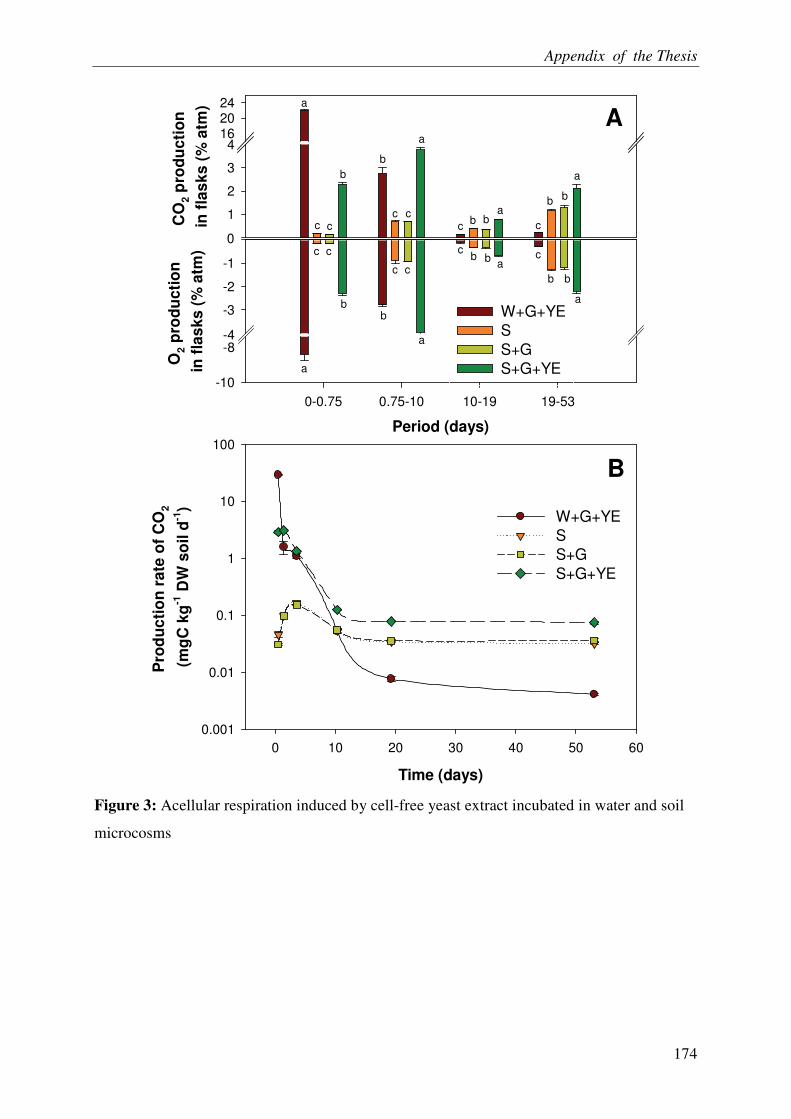
Appendix of the Thesis
174
O2 p
rod
uc
tio
n
in f
las
ks
(%
atm
)
-10
-8-4
-3
-2
-1
0
Period (days)
0-0.75 0.75-10 10-19 19-53
CO
2 p
rod
uc
tio
n
in f
las
ks
(%
atm
)
0
1
2
3
4162024
W+G+YE
S
S+G
S+G+YE
A
Time (days)
0 10 20 30 40 50 60
Pro
du
cti
on
ra
te o
f C
O2
(mg
C k
g-1
DW
so
il d
-1)
0.001
0.01
0.1
1
10
100
W+G+YE
S
S+G
S+G+YE
B
a
b
c c
a
b
c c a
cb b
a
c
b b
a
c
b b
a
cb b
a
c
b
c
b
cc
-4-8
0
a
Figure 3: Acellular respiration induced by cell-free yeast extract incubated in water and soil
microcosms
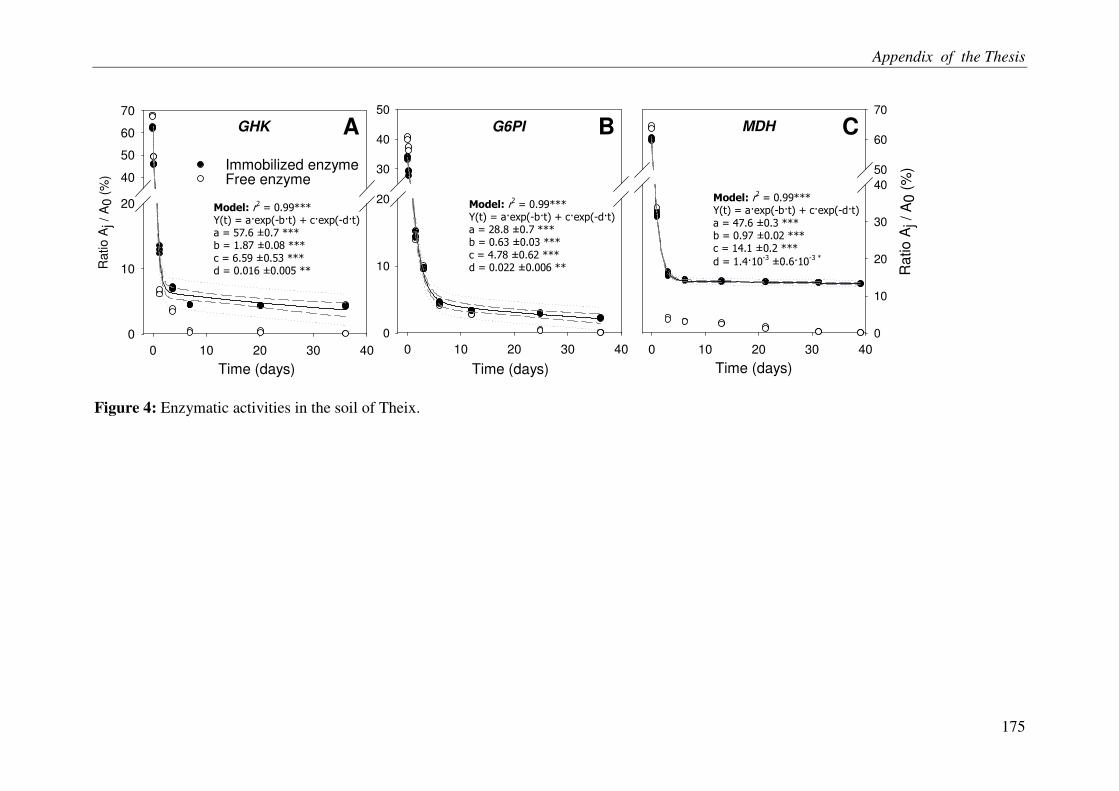
Appendix of the Thesis
175
Time (days)
0 10 20 30 40
Ratio A
j /
A0 (
%)
0
10
20
40
50
60
70
A
Time (days)
0 10 20 30 40
Ra
tio A
j / A
0 (
%)
0
10
20
30
40
50
60
70
Time (days)
0 10 20 30 40
0
10
20
30
40
50
B C
������������������������ ���������������������� ����������������������������������
�������������������������������������
GHK
������������������������ ���������������������� ����������������������������������
�������������������������������������
������������������������ ����������������������
���������������������������������������������������
��������������������
����
G6PI MDH
Immobilized enzymeFree enzyme
Figure 4: Enzymatic activities in the soil of Theix.