Embed Size (px)
Citation preview
Role of Small Industries in Economic Development of Sri Lanka:A Quantitative Aspect
BySampath Amaratunge*
AbstractThe main objective of this paper is to review and assess the effectiveness of existing small industries to the economic development process of Sri Lanka. The extremely rapid developments in the field of small industries during the last formative years have been unprecedented in their impact on the national economy in general and rural poor in particular, with consequent drastic effects on, employment, number of units as well as output. A major conclusion of the paper is that the small industries are playing an ever-increasing role in the economy, which can lead to a sustained long-term growth in the country. It is my belief that the broad based small industrial structure, which is more concerned .on indigenous resources, can easily be achieved intersectoral linkages and thereby achieve a balanced growth in the economy.
1. IntroductionIt is widely proved that, even in advanced market oriented economies small industries11
or cottage industries play a vital role in the domestic economic activities. According to Eugene and Mouse (1965), on “modem small industry fo r developing country” states, from 1950s to 1960s small industries formed a ratio between 89 to 98 percent in the manufacturing sector in Japan, Germany, New Zealand, the UK, and the USA. At present too, it is possible to dominate the small industries within the manufacturing sector in these market economies as well as other advanced market economies (Lakshman, 1991). Sri Lanka is also not an exception in this regard. The survey on manufacturing industries conducted by the Department of Census and Statistics in Sri Lanka has revealed that in 199812, country’s small industries are significant both in private and factory sectors. The present study too analyses small-scale industries in Sri Lanka in an intensively quantitative aspect.
Due to various advantages, that are gainful for the society by way of the small-scale industries such as their ability to provide employment, their wider usage of locally made raw materials and their diversity in the activities engaged are greatly acknowledged by a number of economists and international organizations. (Amaratunge and Shiratake, 2001a). Therefore,
Senior Lecturer, Department of Business Economics, Faculty of Management Studies and Commerce, University of Sri Jayewardenepura, Sri Lanka. E-mail: [email protected]
11 In this study, small industry is defined as those establishments, which consist 25 or less employees.
12 Latest in the series
195

small industries have become vitally important to national economic policy-issues in almost all the economies in general and to the developing economies in particular. Authorities of those countries, donor countries and international and local institutions have great trust on the role of small industries in alleviation of poverty in poorest of poor in the third world (World Bank, 2001).
In Sri Lanka, the bulk of small industries belong mainly to the areas of agriculture, fisheries and manufacturing sectors. There are a number of factors, which make this sector to be naturally low progressive compared to the other large and medium scale industries, which lead them to low wage rate equilibrium. Thus, they will not be able to make enough employment opportunities for entire labour surplus in the country. However, in general small industries are labour intensive. On the one hand, low level of technology is a common feature in these types of industries, resulting from low productivity and a low value added. On the other hand, low cost technology is one of the main features, which causes to promote small industries everywhere. With regard to third world nations, the most important issue is to generate more and more employment opportunities rather than improving technology13 because in these nations poverty alleviation can be achieved only by generating new employment opportunities. The survey on Non-Greater Colombo Economic Commission on private sector industries conducted by the Department of Census and Statistics of Sri Lanka in 1983 has estimated investment per employee as Rs. 9,900 in small industries compared to Rs. 66,000 in large-scale industries and Rs. 34,800 in medium scale industries. However, labour productivity and the quality of labour could be greater in large and ‘medium scale industries, while small industries generate higher level of employment opportunities among the rural communities. The generation of employment through small industries, among the rural poor will be a fostering of spirit of people’s entitlements and capabilities. Therefore, promotion of cottage and small industries form an integral part of poverty alleviation and regional' development, has been emphasised in both government and non-government organisational policies.
However, with regard to the role of economic development through the small-scale sector, the policies should be strongly emphasised to support the sector to achieve the targeted development goals in the country. In this regard very special features in connection with small industries must not be forgotten, since, the strategy will not be useful to cover all the backward areas of development. Therefore, policies should focus on making maximum use of its natural features, which are inherently suitable in achieving most of the objectives of the developing world. Those natural futures are that, (1) they are more labour intensive, without necessarily being too costly or unprofitable, (2) requirements in initial capital, management and other scarce resources are low, (3) small enterprises would create more jobs for the unskilled than for the skilled, (4) small firms are more likely to generate indirect employment opportunities than large ones
The four arguments mentioned above also provide the answer as to why small industries are important. All third world countries have significantly emphasized small
13 Of course, we do not believe that technology is not an important factor, but we believe that, there must be a strong understanding between policies and national problems. Technology to small industries is depending upon number of factors where as competition here is the utmost deciding factor.
196

industrial development strategy as an important characteristic of overall national policy. Hence small industries can play a vital role in alleviation of income and social poverty by uplifting the unsuccessful income standards of poorest of poor. After failing all development strategies, have proved unsuccessful in overcoming poorness and hunger in millions of people in third world by classical, neoclassical, or other theories. According to Uribe-Echevarria (1992), faith on small industries in economic development other than large scale once that has commenced to emphasize a fresh labour intensive (from 1980s), in the context of reducing capital cost in employment generation in small industries compared with the previous emphasis of labour intensiveness. The most important and valid argument in this regard is that small industries could play a dynamic role in alleviation of poverty through generating productive employment. Nevertheless, that has been the structural transformation point of small industrial ideology more towards the socialist way, which led the objective of making new employment rather than scale merits or efficiency in production in developing the third world. The second argument is that, it is very easy to start a small business just only with a common understanding of a society, without any skills or proper knowledge about modem management or finance controlling, as entrepreneur can simply learn the business operation by doing due to the smallness of size of the enterprise. This can also be defined by training the country’s entrepreneurial skills for modem private sector which led to an economic environment that is hidden in the absence of opportunities to come out under the large sector oriented growth process. Furthermore, in spite of this trend all authorities in less developed countries, international donor agencies, etc. have paid strong attention to overcome historically suffering national problems by using the small sector and have thereby changed the global definition as their interest on them for this sector, from rural informal sector to modem small scale or micro enterprises in early 1980s. The final argument for small industries is small industries can play a vital role in modem global form as export oriented production units rather than foreign exchange saving in a closed small economy context, because of the wide coverage and diversity of production and location with great reliability on stability under economic fluctuations by the small sector. In the next section, we analyse Sri Lanka’s small industrial policy issues with these three major arguments in mind as key elements to promote small industries in the country.
2. Review of Overall Performance in the Small Industrial Sector
In Sri Lanka, there is no clear definition for small-scale industries for administrative and policy purposes. Besides, different definitions are used by different organisations based on the size of capital and the number of employees in the small industrial sector. In this study for the purpose of analysing the role played by small industrial sector in the economy the definition that has been considered by the Department of Censes and Statistics for small-scale industries, is an establishment, whose number of regular employees does not exceed 25 persons. The data used here are calculated from various annual reports on “Survey of Industries” published by the same government authority. Main attention of industrial analysis was given to the number of establishments, output and number of employees during the periotl14 between 1995 and 1998. However, the country’s database on small industries for research purposes is rather
14 The data information for 1998 was based on the unpublished tables made available by the Department and these data will soon be published in the year 1999 report of Annual Industrial Survey.
15 -CM6151 197
inadequate and people who utilize fhose data should pay tremendous effort to clarify the significance. This significance information gap between the actual level and the published level has naturally slowed down indirectly the development of this sector in terms of research and overall development directly. Therefore, undoubtedly validity of case studies with depth sample surveys in this field has to be critically examined in developing the small-scale industrial sector in the country.
Relative size o f small industrial sector in the total manufacturing sector
Table 1 demonstrates the relative size of small industrial sector in the total manufacturing sector in Sri Lanka. Small industries dominate most of the industrial categories with regard to the number of units. Considering the absolute figures, in 1995 the small-scale industrial sector dominated by 83 percent as its share of units in the total manufacturing sector and, it had increased to 84 percent in 1998 while medium and large scale industries recorded a negative growth of 9 percent. With regard to the number of units, during this period large and medium scale industries lost 231 units where as small industries gained another new 136 units, thus the small industrial sector in the manufacturing sector in Sri Lanka seems to be significant. During the period between 1995 and 1998, the small industrial sector grew by 5.81 percent while large and medium scale industries recorded a negative growth rate of 0.68 percent as the relative share in number of units. The reasons for this dominance can be listed out as simple technology, limited capital requirement, and availability of raw materials. The most expanded small industries in this period were manufacturing of machinery (382), electrical machinery (383) and transport equipment (384) where most of the raw materials were imported. Therefore, the linkage effects of the benefit of growth in terms of units were restricted almost to the expansion in employment. However in terms of output and employment still agro based industries are dominating within small industrial sector where the best performed 3 out of 5 industries were recorded as agro based. Variables such as share of output and employment have exhibited low records in the total manufacturing sector and the percentage contributions were 4, and 16 percent in 1995 and in 1998, 5 and 21 percent respectively. However, the workforce in the small industrial sector can be seen as highly positive towards the country’s unemployment problem compared to medium and large-scale industries. In year, 1998 small industrial workforce accounted for more than one fourth of the total industrial workforce and recorded a 30 percent growth over the year 1995. Considering the number of units and number of employees in terms of the relative share in medium and large scale industries, out of 29 sub sectors nearly 14 sub sectors recorded a negative performance in 1998 reflecting more than 50 percent of the agro based15 industries as under performed. Sri Lanka being primarily an agricultural country, has neglected its own agricultural resources for the industrial development. This has led to slower down definitely the development of medium and large-scale industries and thereby the progress of the ecdnomy as multiplier effect will not operate at its maximum within the economy.
15 Agro based industries: food manufacturing (311), other food manufacturing (312), beverages (313), tobacco manufacturing (314), leather products (323), wood and cork products (331), furniture and fixture (332), paper and paper products (341), rubber products (355) and pottery and chinaware (361).

According to Table 2, it is clear that the agro-based small industries are significant in terms of relative size compared with the small industrial sector in Sri Lanka. Yet one can see from the data provided by the same table that the structural change has been taking place in the country as output of the agro based industries tends to decline while the number of employees increases. Simple technology, easy access to cheap raw materials and easy access to start an industry with less capital are the reasons to increase the relative opportunities in employment in the agro based industrial sector although its output tends to decline. On the one hand higher proportion of employment compared with the output in the agro based sector, indicates a lower capital-intensity on technology used in this sector and on the other hand it implies the lower relative labour productivity. These findings naturally arise research interest regarding the relatively less modernized growing agro-based sector in the country.
Composition o f small industriesComposition of industrial units with less than 25 employees in the industrial sector is
illustrated in Table 3, which gives a general idea about the comparatively important industries within the small industrial sector. The Census of 1998 has described 11,752 small industrial establishments out of which 33 percent belong to the food (311 and 312) and tobacco (314) manufacturing subsection, showing no changes in the composition over the last four years. Apart from agro based small industries, other mining (299), textile (321) and other non- metallic product (369) industries have accounted for 41 percent in terms of units among the small industries in both 1995 and 1998. Same dominance of these industries can also be seen in terms of employment. However, in terms of output, the biggest subsection is food manufacturing (311 and 312) which accounted for 49 percent from the total small industrial output in 1995 and its percentage growth was 13 percent over the last four years. Higher output-employment ratio of food manufacturing sector showed some capital-intensive progress among the overall small industrial sector. In general capital labour ratio in the small industrial sector is less than one third that of the total manufacturing sector. In fact, their average productivity of capital is high and labour productivity is very low.
With regard to growth trends in the small industrial sector both agro based and non- agro based industries clearly and positively developed well during this period. In terms of units and output in non-agro based industries they have placed more positive trends compared with the agro-based industries recording growth rates of 7.23 percent and 1686.15 percent (in non-agro-based) and 5.85 percent and 12.63 percent (in agro-based) respectively. However, in terms of employment, agro-based industries showed a very high growth rate (1017 percent) against the growth rate of the non-agro-based industry (327.67 percent). Thus, agro-based sector is more viable towards economic objectives of the country as reduction of unemployment tends to trickle down the benefit of industrial development to the poorest of poor (where, most of them are living and working in agriculture or agricultural related sectors). Moreover, this relationship will strengthen the forward and backward relationships in the economy. Therefore, to keep up this trend sophisticated techniques should be enhanced which'will be (once rural employment / underemployment have been cleared to a moderate level) a significant advantage with regard to national policies. However technology and employment act as two opposite variables in the economic development, process if only technology is introduced we cannot expect employment to rise as before unless there is a huge expansion of industries. Therefore, the trade-off point should be decided according to the national requirement. We have also found that non agro-based industries have accounted for
199

60 percent out of the best five small industries in terms of growth trends in the overall small sector with regard to variables such as the number of units, output or employment.
Agro based small industrial sector in terms of composition
Sri Lanka being primarily an agricultural country, certainly the agro-based industries in the small industrial sector can play a vital role in the country’s economic development process. It is also possible to develop agro based small industries throughout the island as plenty of agricultural raw materials are available, which can be seen as an important requirement in considering the long run strength of industrialization in Sri Lanka (FAO, 1985). Considering Sri Lanka's economic development in the long run* a positive approach to make a strong foundation, agro based industrial strategy could be implemented in the development policies more towards in the domestic value added context. However, during the past five decades, compared with the respectable level of annual economic growth (4.2 percent), unfortunately, the growth rate of the agricultural sector has been significantly lower (2.6 percent). The prevailing per capita income of .this sector (Rs. 262016) is estimated as 42 percent lower than the average Sri Lankan per capita income level and 38.5 percent lower than the standards of the . International Bank for Reconstruction and Development (IBRD17). Therefore, it is not surprising that at present more than 80 percent of the rural population (rural population accounts for 77 percent from the total population: World Bank, 2001) engaged in agricultural practices face severe income constraints. Because of the income, uncertainty created in such life-styles it is clear that the only hope of improving the standard of living of the people of the rural sector is through some kind of agriculture. Hence, a subsidiary source of income is essential in order to build up the rural agrarian society. The agricultural sector is mostly composed of small plots of lands and the crop production is seasonal. These two factors result in absorbing a limited quantity of labour to this sector (Thorbecke and Svejner 1987). Thus, the development of agro-based small-scale industries associated with rural development is of paramount importance as a way of generating new demand for agriculture in order to uplift the rural sector in general and to expand the people’s entitlements and capabilities18 through generating new employment in particular (Amaratunge and others, 1999, 2001b, 2001c, 2002a and 2002b).
According to the industrial classification out of the total-of 29 small-scale industries in Table 4, ten industries are categorized as agro-based. Food manufacturing small industrial sector dominates in the agro-based as well as overall small industrial establishments in the country. In terms of units, output and employment, in food manufacturing sector (311), grain mill products (3116) and bakery products (3117) were the dominant sub sectors in the food manufacturing small industrial’ sector. However with regard to the expansion of employment opportunities by small industries most, of the sub sectors of food manufacturing show a negative drawback while vegetable, animal oils and fats (3115) sub sector shows a massive
16 Calculation was done according to the paddy agricultural wage per day multiplied by the average working days per month.
17 US$ 2 per day (Rs. 142 and roughly Rs. 4260 per month) is the poverty point and ultra poor point is US$ 1.5 per day (Rs. 106.5,.roughly Rs. 3000 per month) Poverty data, World Bank Website, 1999.07.
18 An entitlement to something is the right to have or to do it and Capabilities to do something are what you are |able to do it: BBC English Dictionary. • 1
200

growth of 68 percent in 1998 over the past four years. These growth patterns can be mainly attributed to the growing health conscious ideas, which motivate the use of vegetable oil instead of coconut oil. .
In considering the overall composition of the industries it was found that agro based small industries have a distinguished place. More results could be gained from analysing its breakdown, when doing so at overall level, it is sometimes leading astray some small industries misleadingly show a significant place. A very good example in this direction is that according to the composition of the overall small sector with regard to the units, food manufacturing (311) recorded a negative growth rate of 0.23 percent and other food manufacturing sector (312) recorded a positive growth rate of 1.85 percent for the period between 1995-98 (see Table 3). However in contrast according to the agro based small sector composition has revealed the fact that there had been a positive growth rate of 27.37 percent in food manufacturing and a negative growth rate of 2.9 percent in other food manufacturing sector (see Table 4). With regard to output and employment too according to the overall analysis it has been recorded as double digit positive growth rates of output as 16.4 percent and employment as 22.3 percent where as in the detailed analysis both these variables experienced negative growth rates as output 31.4 and employment recorded a 445.2 percent. Therefore, here it is very clear that only one objective i.e. either improving the number of units or improving employment opportunities could be achieved. In other words one sub sector cannot be used to achieve all the objectives such as high output, high employment generation etc. Thus, it is better to identify the best sub sector to suit different objectives. For example, food manufacturing sub industries have the advantage to expand in terms of number of units because of its world current tendency to improve in terms of technology rather than in terms of employment. Of course, output expansion is totally an independent argument as it is the ultimate goal of any kind of an economic objective. We haven not found any agro based small industry sub sector that has greatly, moderately or at least parallel growth rates together in terms of number of units and employment. Therefore, the important argument is to identify clearly, as to which industry could easily expand in terms of intra terms (by number of units) or inter terms (by number of employees) where both these objectives could meet the ultimate goal of expanding the output.
Location o f small industriesr
According to this concept, small industries are referred as rural industries in many occasions, but unfortunately, in Sri Lanka small industries are more scattered in urban areas rather than in rural areas (see Table 5). Further more being agro-based industries these are vitally important in the small industrial structure, which reflects the negligence of developing, the economically backward arrears through small industries. According to the same table, all two-digit (or close to two) values in terms of units, output and employment are scattered only in urban areas. With regard to the overall industries by the end of the year2000, 76 percent of the registered industries were located in Colombo District and Gampaha District (next to Colombo) districts. Apart from the negligence of rural areas excessive concentration of industries in urban areas will lead to a number of problems such as labour scarcity, road congestion, environmental pollution, etc. Moreover, the situation has worsened as national policy discourages the migration from rural to urban areas, which led rural sector for limited access for small industries to a considerable extent. However, with regard to Sri Lanka’s approach to industrial location it can be clearly seen that the locations are decided only
201
according to the investor’s economic cost or benefits rather than country’s needs. Therefore, according to the ideological approach, period of location of industries has been changing in the country. - Profit oriented private investors either small or large tries to get the maximum return for their investment. Almost in all the cases, investors are least bothered about rural development or proper location of industries, which could be the best to the society. This will give an answer as to why there should be a firm policy in order to have industrial diversification of a country. Central Bank of Sri Lanka has agreed (Economic Progress of independent Sri Lanka, 1998) that the country’s industrial location or industrial diversification policy is a vulnerable policy in directing investments, which are ideal for the country’s objectives economically, socially and culturally.
3. Concluding Remarks
In this paper, we have examined the role of small industries in economic development of Sri Lanka. There are three equally important characteristics of development such as (1) raising people’s living levels, i.e., their income, consumption levels, education etc.; (2) Creating conditions conductive to the growth of social and political conditions etc.; (3) increasing people’s freedom of choice etc. However, this study has concentrated on employment and output aspects of the small sector. In this direction, a certain number of units have also become important. Expansion in employment and output has the direct effect for income poverty alleviation. Especially when the finished goods are made out of indigenous raw materials, increase of output will give the benefit to those suppliers by expanding demand for their products. If the industry is located in the area where raw materials are generated definitely, the rural sector can absorb the major portion of the benefit through industrial expansion. This is the reason why the role of small industries in developing the rural sector, has been preciously emphasized by number of economists. This expansion of input and output or rural products will eventually lead to expand not only employment opportunities but also is easy to manage due to its simple management process compared with the large scale sector. This interlinked relationship of “raw material supply - small industry production - employment opportunities” can make a valuable contribution to economic development through rural development, island wide.
However, as in many other developing countries, Sri Lanka’s small sector too is predominant in terms of units but little in terms of output. The present statistics regarding small-scale sector showed evidence that compared with the large and medium industrial employment small sector share was not minimal but marginal. Considering the growth rates or in terms of the absolute numbers, the small verses large industries small sector has recorded a growth over the large sector in terms of number of units, number of employees and even in terms of gross output. However, most of the expanded small industries belong to the non-agro based sector in the economy where imported raw materials are being used which trickle down the effect of expansion that will mainly be limited to the employees. However, still agro-based industries are in the front line of the small sector.
For the last four years from 1998, employment share in small sector has grown by 30 percent recording nearly one-fourth employment of the labour force in the overall industrial sector. With regard to the role of small industries in economic development, increasing share of all- important aspects in the small sector showed its viability of solving major macro economic problems in the country. Therefore, by employing an efficient policy for this sector will be the
202

most appropriate strategy of gietting the maximum use of small industries to the economic development process. With regard to the relative share in terms of composition in the small sector, we could see that the structural change is taking place from agro based to non-agro based. Especially, there is a visual trend to decrease output while increasing employment, proving that the high usage of simple technology in these enterprises would result low labour productivity and low capital intensity. If the information technology (IT) base can be imposed to this sector, this sector can make more merits in all aspects in country’s development process.
Furthermore, the existing structure of small industries in terms of its composition values shows that a great portion of food manufacturing sector is leading by proving its ability to support the countries economic development goals. Food manufacturing sector is leading (311 and 312) with 50 percent accounts of the small industrial output, 15 percent of the employment and 14 percent of number X)f- units in the overall small sector in any given year, which we have considered. This shows the high capital intensity ratio in production, which under relative size of small industries, which the agro based, has not performed. However, it is obvious that capital intensity ratio is less than the large sector and it is less than one third, which indicates that how far small sector, can help in the country’s economic development process. Expansion of these industries will not only provide employment or output but also trickle down its benefits to the raw material suppliers who are living generally in Sri Lanka’s rural sector. Therefore, only in concerning the absolute data in the small sector, it is difficult to evaluate the true role of small industries in economic development. Sri Lanka’s rural population is more than 75 percent from the total population and more than 80 percent from them are engaged in agriculture or agriculture related work. One of the biggest problems in developing the country’s agriculture (excluding plantation sector) is developing agriculture marketing or creation of sufficient market facilities. According to Sri Lanka’s experiences, government controlled large scale marketing structure failed to fulfil these problems and eventually now the middleman is squeezing small farmer returns from agriculture. Therefore, creation of market for farmers through small industries is virtually important to Sri Lanka. However, in analysing the data in terms of composition of small sector, with regard to the relative comparison, we have found a structural change in industries that uses relatively higher technology from agro based to non-agro based. The growth rates also show some high values in non agro-based sector than agro based. No matter whether the non-agro based sector is leading, the important fact is that the agro based sector could result in high domestic value added component and also it can trickle down its benefits to the majority of the rural folk who are generally poor. Thus, promotion of this sector must be in the priority list. This sector can be used as an alternative method of developing the agricultural sector, which, presently, increases almost less than a half of the country’s overall rate of economic growth.. Therefore, severe income constrains faced by the majority of the population can be indirectly benefited from small industries that are especially agro-based.
Furthermore, we have identified that even though agro based industries are vital in the small sector the growth rates of such industries are not impressive as some industries showed some positive changes in slow phase and others were negative. In analysing the jagro based sector in the small sector some complicated points could be found. For an example in terms of composition under small sector food manufacturing general growth, rates are not impressive. The reason is that the other industries especially non agro based are increasing in a rapid rate compared with the agro based and that is why the general situation is misguiding, but under
203

the agro sector analysis we have found that food sector is growing rapidly. We have also found that some sectors are very sensitive to expand in employment but not in output or number of units vice versa. For an example, again food industry can be considered, as it is sensitive to improve in the production but not in employment. Of course, we cannot undermine the employment percentage absorbed here in the overall small sector. What we can conclude here is that policies should be made in mind of such structure of small industries. When promoting small industries as a method of employment generation we have to concentrate on the most sensitive cases in that respect rather than others in order to get the maximum benefit of the policy as well as the cost of promotion. There must be some policies which can be adapted to the overall small sector as a whole but most of the policies are not such. Policy must strongly consider the objective and the type of industry, which it is going to promote.
Finally, it is worthwhile to conclude that small sector is planned to play an ever-vital role in matching with the economic development objectives in the country. According to the special suitability of small industries to countries like Sri Lanka, national authorities, donor countries, donor agencies, etc. have given a prominent place for these industries in economic development process. Thus, various policies as well as new institutions were coming into operation in time as global economic structure makes quick changes and everything will finally be decided according to the competitiveness. Sri Lanka’s national strategy for the future open-up will be promotion of resource based to knowledge based industries (including the small sector) which is expected to be strengthened by IT innovations. However, it is well known that small industries have natural constraints in expanding the system particularly in the third world. Sri Lanka is not an exception for this situation and quite interesting to see how they approach new techniques in production, which are of very high cost in price and skilled in techniques. In any kind of a planning for the small sector particularly in the developing world, we have to keep in mind that simplicity of technology is one of the most important features of this sector. However, near open up will decide the country’s future in industrialization and undoubtedly the competitiveness of the industry will be the utmost important factor for the survival.

299311312313314321322323324331332341342351352353355356361362369371372381382383384385
type of Industry
Table 1. The Relative Size of Small Industry in Sri Lanka
______Number of Units _______________________Output Number of EmployeesRel. Size of SI Growth Rel.SizeofSI Growth Rel.SizeofSI Growth1995 1998 SI M&L 1995 1998 SI M&L 1995 1998 SI M&L
Other Minings 98.28 97.99 -0.30 0.00 47.78 54.80 14.69 0.22 80.12 78.93 -1.49 -104.90Food Manufacturing 91.36 92.81 1.59 24.66 12.07 11.46 -5.05 24.66 3157 43.74 3855 -0.12Other Food Manufacturing 47.08 48.17 2.32 29.47 12.15 9.47 -22.06 29.47 14.70 13.70 -6.80 1458Beverages 57.89 64.71 11.78 -8.49 0.01 0.08 700.00 -8.49 0.18 1.93 97222 -15.41Tobacco 93.96 95.33 1.46 9.06 0.97 1.92 97.94 9.06 70.26 80.52 14.60 -17.89Textiles 83.38 82.74 -0.77 -13.03 4.65 6.80 46.24 -13.03- 21.01 26.42 25.75 4.00Wearing Apparel 38.79 4550 17.30 -4.78 0.17 0.53 211.76 -4.78 0.64 3.06 378.13 -5.95Leather Products 70.00 69.12 -1.26 -34.34 1.64 1.52 -7.32 -34.34 11.25 19.26 71.20 -34.14Foot Ware Except Plastic or Rubber 72.00 75.00 4.17 1.03 4.46 3.37 -24.44 1.03 4.76 5.01 5.25 4.87Wood and Cork Products 91.78 92.36 0.63 -35.09 26.83 23.30 -13.16 -35.09 60.04 62.10 3.43 -3.05Furniture and Fixture______________________92.25 92.99 0.80 11.90 20.37 15.29 -24.94 11.90 29.12 41.83 43.65 -1.92Paper and Paper Products 77.27 81.65 5.67 -12.18 3.09 3.91 26.54 -12.18 11.07 14.84 34.06 12.04Printing and Publishing 80.84. 80.28 -0.69 -24.45 4.84 3.78 -21.90 -24.45 14.62 9.00 -38.44 21.06Industrial Chemicals 45.71 45.71 • 0.00 39.67 11.55 659 -4194 39.67 13.11 8.73 -33.41 72.41Other Chemical Products 68.32 71.28 4.33 8.00 0.85 1.19 40.00 8.00 14.65 17.67 20.61 22.87Petroleum Products 0.00 0.00 0.00 -13.52 0.00 0.00 0.00 -13.52 0.00 0.00 0.00 59.76Rubber Products 71.91 71.91 0.00 -6.29 6.68 2.24 -66.47 -6.29 12.18 13.32 9.36 24.08Plastic Products 35.80 32.61 -8.91 3,76 4.01 4.13 2.99 3.76 3.01 3.67 21.93 31.36Pottery China etc. 86.36 88.64 2.64 -16.63 0.09 0.73 711.11 -16.63 1.79 12.29 586.59 -5.71Glass Products 80.95 85.00 5.00 56.83 9.27 4.77 -48.54 56.83 15.99 18.41 15.13 1.79Other Non Metallic Products 92.99 92.96 -0.03 -4.88 11.88 11.17 -5.98 -4.88 63.72 66.29 4.03 5.40Iron and Steel Basic Industries ____________ 0.00 0.00 0.00 4.84 0.00 0.00 0.00 4.84 0.00 0.00 0.00 -28.87Non- Ferrous Metal Basic Industries 0.00 0.00 0.00 -65.41 0.00 0.00 0.00 -65.41 0.00 0.00 0.00 -48.42Fabricated Metal Products_________________ 81.72 87.81 7.45 -20.08 6.02 955 58.64 -20.08 22.03 29.64 34.54 -1.12Manufacturing of Machinery 56.98 72.86 27.87 31.15 Q-49 0.48 -2.04 31.15 4.86 5.28 8.64 12.29Electrical Machinery etc. 16.67 22.73 36.35 13.23 0.09 0.11 22.22 13.23 1.01 3.64 260.40 -1.87Transport Equipment_____________________ 59.78 74.32 24.32 10.08 0.68 0.67 -1.47 10.08 3.01 4.15 37.87 0.70Professional Equipment______________________________________________________________________________________________________________ ■______ 35.71 33.33 -6.66___4.54____L08____ 2.42 124.07______ 454 4.88 6.22 27.46 62.65Other 71.07 82.42 15.97 -8.66 0.75 0.70 -6.67 -8.66 1.94 2.54 30.93 -13.63
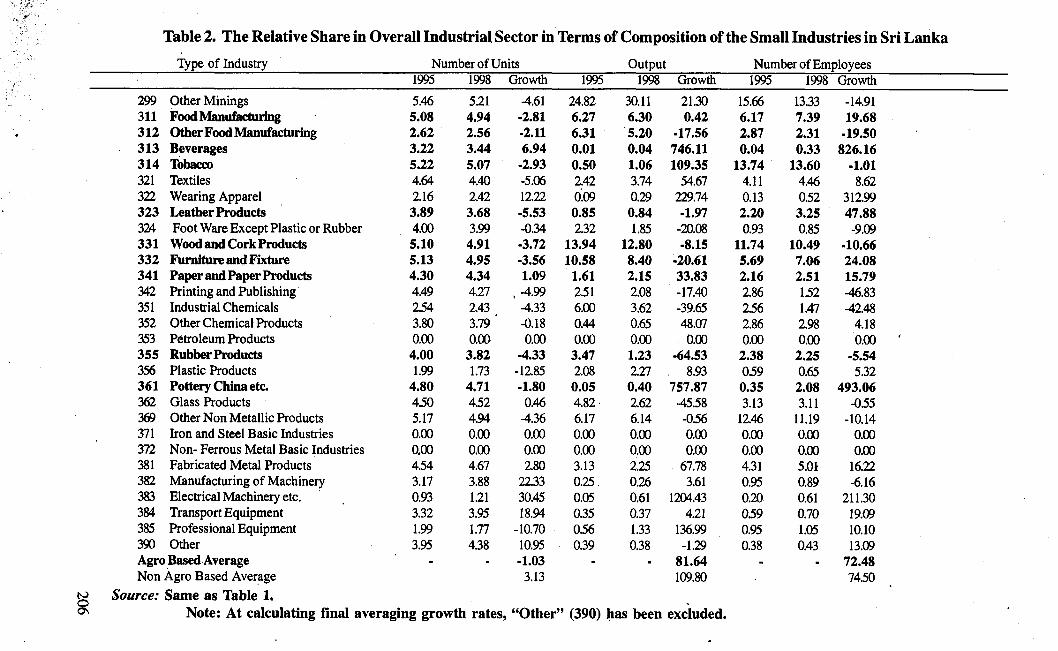
Table 2. The Relative Share in Overall Industrial Sector in Terms of Composition of the Small Industries in Sri LankaType of Industry_______________________ Number of Units________________ Output_____________Number of Employees
1995 1998 Growth 1995 1998 Growth 1995 1998 Growth299 Other Minings 5.46 5.21 -4.61 24.82 30.11 21.30 15.66 13.33 -14.91311 Food Manufacturing 5.08 4.94 -2.81 6.27 6.30 0.42 6.17 7.39 19.68312 Other Food Manufacturing 2.62 2.56 ■2.11 6.31 5.20 -17.56 2.87 2.31 -19.50313 Beverages 3.22 3.44 6.94 0.01 0.04 746.11 0.04 0.33 826.16314 Tobacco 5.22 5.07 -2.93 0.50 1.06 109.35 13.74 13.60 -1.01321 Textiles 4.64 4.40 -5.06 2.42 3.74 54.67 4.11 4.46 8.62322 Wearing Apparel 2.16 2.42 12.22 0.09 0.29 229.74 0.13 0.52 312.99323 Leather Products 3.89 3.68 -5.53 0.85 0.84 -1.97 2.20 3.25 47.88324 Foot Ware Except Plastic or Rubber 4.00 3.99 -0.34 2.32 1.85 -20.08 0.93 0.85 -9.09331 Wood and Cork Products 5.10 4.91 -3.72 13.94 12.80 -8.15 11.74 10.49 -10.66332 Furniture and Fixture 5.13 4.95 -3.56 10.58 8.40 -20.61 5.69 7.06 24.08341 Paper and Paper Products 4.30 4.34 1.09 1.61 2.15 33.83 2.16 2.51 15.79342 Printing and Publishing 4.49 4.27 , -4.99 251 2.08 -17.40 2.86 1.52 -46.83351 Industrial Chemicals 234 2.43 -4.33 6.00 3.62 -39.65 2.56 1.47 -42.48352 Other Chemical Products 3.80 3.79 ' -0.18 0.44 0.65 48.07 2.86 2.98 4.18353 Petroleum Products 0.00 0.00 0.00 0.00 0.00 0.00 0.00 0.00 0.00355 Rubber Products 4.00 3.82 -4.33 3.47 1.23 -64.53 2.38 2.25 -5.54356 Plastic Products 1.99 1.73 -12.85 2.08 2.27 8.93 0.59 0.65 5.32361 Pottery China etc. 4.80 4.71 -1.80 0.05 0.40 757.87 0.35 2.08 493.06362 Glass Products 450 4.52 0.46 4.82- 2.62 -45.58 3.13 3.11 -0.55369 Other Non Metallic Products 5.17 4.94 ■4.36 6.17 6.14 -0.56 12.46 11.19 -10.14371 Iron and Steel Basic Industries 0.00 0.00 0.00 0.00 0.00 0.00 0.00 0.00 0.00372 Non- Ferrous Metal Basic Industries 0.00 0.00 0.00 0.00 0.00 0.00 0.00 0.00 0.00381 Fabricated Metal Products 4.54 4.67 2.80 3.13 2.25 67.78 4.31 5.01 16.22382 Manufacturing of Machinery 3.17 3.88 22.33 0.25. 0.26 3.61 0.95 0.89 -6.16383 Electrical Machinery etc. 0.93 1.21 30.45 0.05 0.61 1204.43 0.20 0.61 211.30384 Transport Equipment 3.32 3.95 18.94 0.35 0.37 4.21 059 0.70 19.09385 Professional Equipment 1.99 1.77 -10.70 0.56 1.33 136.99 0.95 1.05 10.10390 Other 3.95 4.38 10.95 0.39 0.38 -1.29 0.38 0.43 13.09Agro Based Average - - -1.03 - - 81.64 - - 72.48Non Agro Based Average 3.13 109.80 74.50
Source: Same as Table 1.Note: At calculating final averaging growth rates, “Other” (390) has been excluded.

Table 3. The Composition of the Small Industries in Sri Lanka
Number of Units Output Number of Employees
1995 1998 Growth 1995 1998 Growth 1995 1998 Growth
299 Other Minings 14.26 14.09 -1.22 4.79 6.00 25.21 15.14 12.74 -15.83311 Food Manufacturing 11.01 10.99 -0.23 19.90 23.17 16.44 8.41 10.28 22.30312 Other Food Manufacturing 3.40 3.46 1.85 29.07 28.19 -3.01 6.40 4.90 -23.33313 Beverages 0.19 0.19 -1.16 0.01 0.08 712.07 0.01 0.08 583.49314 Tobacco 18.47 18.25 -1.16 1.17 2.53 115.82 19.34 20.18 4.34321 • Textiles 14.47 14.85 2.61 10.37 13.37 28.96 17.69 18.04 1.97322 Wearing Appajel 2.26 • 2.41 6.36 0.71 2.10 195.56 1.38 458 231.98323 Leather Products 0.42 0.40 -5.19 0.23 0.14 -39.56 0.48 0.43 -9.99m Foot Were Except Plastic or Rubber 0.31 0.31 -1.16 1.88 1.40 -25.22 0.51 0.41 -19.59331 Wood And Cork Products 4.61 4.63 0.32 3.61 1.92 -46.69 4.93 3.78 -23.22332 Furniture and Fixture 2.97 3.05 2.57 0.75 0.59 -21.76 1.76 2.19 24.65341 Paper and Paper Products 0.73 0.76 3.49 0.85 0.94 10.89 0.58 0.66 13.93342 Printing and Publishing 1.49 1.49 -0.01 153 0.88 -42.25 1.65 0.84 -49.24351 Industrial Chemicals 0.14 0.14 -1.16 2.92 2.18 -25.19 0.28 0.23 -20.60352 Other Chemical Products 1.19 1.18 -0.44 0.81 1.22 50.96 1.16 1.30 11.57353 Petroleum Products 0.00 0.00 0.00 0.00 0.00 0.00 0.00 0.00 0.00355 Rubber Products 3.86 4.01 3.92 8.77 2.60 -70.32 3.08 3.07 -0.22356 Plastic Products 0.25 0.26 2.25 151 1.60 6.13 0.28 0.33 17.24361 Pottery China etc. 0.98 1.00 1.44 0.03 0.18 589.43 0.21 1.11 425.63362 Glass Products 0.15 0.14 -1.16 0.38 0.29 -23.82 0.15 0.13 -12.40369 Other Non Metallic Products 12.68 12.47 -1.69 650 5.72 -12.07 13.21 11.33 -14.28371 Iron and Steel Basic Industries 0.00 0.00 0.00 0.00 0.00 0.00 0.00 0.00 0.00372 Non- Ferrous Mettle Basic Industries 0.00 0.00 0.00 0.00 0.00 0.00 0.00 0.00 0.00381 Fabricated Metal Products 3.19 3.00 -5.95 1.69 2.21 3054 1.63 1.74 7.10382 Manufacturing of Machinery 0.42 0.43 2.88 0.19 0.25 27.16 0.29 0.26 -11.09383 Electrical Machinery etc. 0.08 0.09 9.83 0.03 0.39 1322.24 0.07 0.18 163.42384 Transport Equipment 0.47 0.47 -1.16 0.30 0.32 7.62 0.30 0.31 2.02385 Professional Equipment 0.04 0.04 -1.16 0.01 0.01 135.21 0.02 0.04 52.78390 Other 1.95 1.91 -1.59 2.00 1.70 -14.89 1.04 0.86 -17.38
Source: Same as Table 1.

Table 4. Composition of Small Scale Agro Based Industries in Sri Lanka
Type of Industry Percentage Units 1995 1998 % Change
Percentage Output 1995 1998 % Change
Percentage Employees 1995 1998 i % Change
311 Food Manufacturing 100 100 - . 100 100 . 100 100 m3112 Dairy Products' 2.11 2.01 -4.74 0.98 0.73 -25.51 3.19 2.03 -57.143113 Canning Fruits and Vegetables 0.55 0.7 26.75 0.63 0.25 -60.32 1.03 1.11 7.083114 Canning & Processing Fish 2.11 1.94 -8.22 1.94 1.16 -40.21 4.11 2.69 -52.673115 Vegetable, Animal Oils and Fats 1.72 2.09 21.59 4.95 12.14 145.25 6.3 19.71 68.043116 Grain Mill Products 37.61 37.26 -0.94 69.69 42.26 -39.36 38.82 41.38 6.183117 Bakery Products 33.15 33.77 1.88 17.05 16.33 -4.22 30.64 25.33 -20.973118 Sugar Manufacturing and Refiners 18.37 18.2 -0.91 0.61 1.08 77.05 10.81 6.57 -64.63119 Cocoa, Chocolate and Confectionery 4.38 4.03 -8.04 4.16 0.66 -84.13 5.1 1.18 -331.09311 Total Percentage Change - - 27.37, - - ■31.45 _ ■445.17312 Other Food Manufacturing 100 100 100 100 . 100 1003121 Other Food Products 97.97 98.03 0.06 99.86 99.89 0.03 99.44 99.41 -0.033122 Prepared Animal Foods 2.03 1.97 -2.96 0.14 0.11 -21.43 0.56 ̂ 0.59 5.08312 Total Percentage Change - ■2.9 - _ ■21.4 _ 5.05 •313 Beverages 100 100 - 100 100 . 100 100 .
3132 Wine Industry 77.27 77.27 0 54.17 87.78 62.05 40 92.94 56.963133 Malts Liquors and Malt 0 0 0 0 0 0 0 0 03134 Soft brinks and Carbonate Water 22.73 22.73 0 45.83 12.22 -73.34 60 7.06 -749.86313 Total Percentage Change - - 0 - . -11.29 _ ■692.9314 Tobacco Manufacturing 100 100 - 100 100 . 100 100 m3140 Tobacco Manufacturing 100 100 0 100 100 0 100 ' 100 0314 Total Percentage Change - . . 0 . . 0 0323 Leather and Leather Products 100 10Q - 100 100 . 100 100 m3231 Tanneries and Leather 0 0 0 0 0 0 0 0 03233 Leather and Leather Substitutes 100 100 0 100 100 0 100 100 0323 Total Percentage Change - ■ 0 . _ 0 0331 Manufacture Of Wood and Cork Products 100 100 . 100 100 • 100 100 m
3311 Saw Mills and Wood Mills 63.06 63.42 0.57 85.47 78.18 -8.53 61.25 54.51 -12.363312 Wooden / Cane Containers 22.01 21.69 -1.45 7.35 9.09 23.67 29.68 36.1 17.783313 Wood and Cork Products 14.93 14.89 -0.27 7.18 12.72 77.16 9.06 9.39 3.51331 Total Percentage Change - - ■1.15 . - 92.3 . 8.93332 Manufacturing of Furniture and Fixture 100 100 ■ 100 100 - 100 100
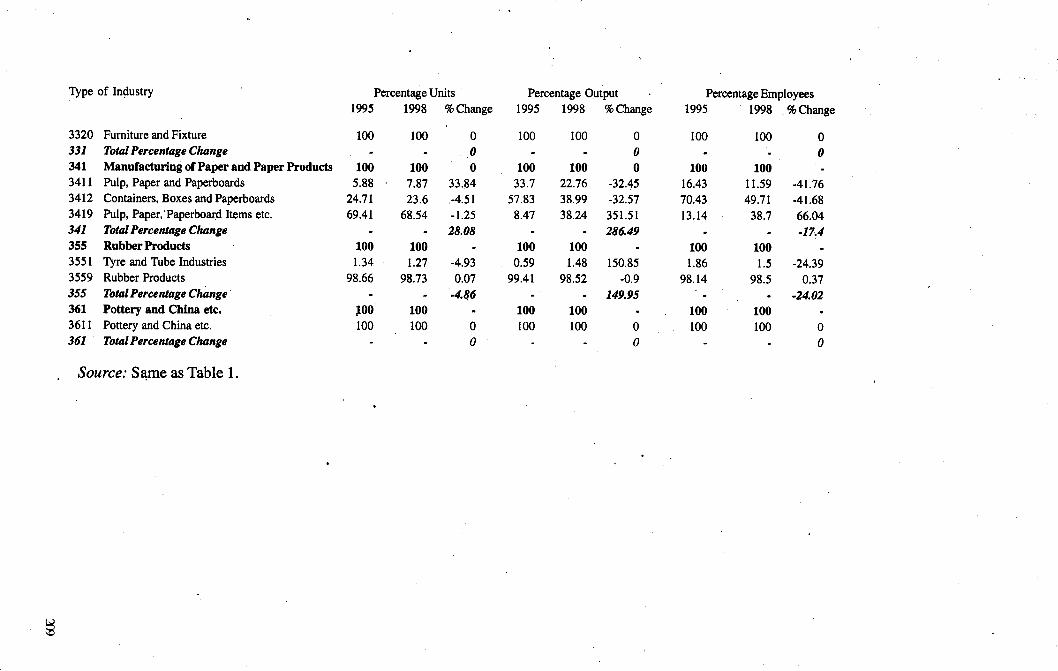
Type of Industry Percentage Units 1995 1998 % Change
3320 Furniture and Fixture 100 100 0331 Total Percentage Change - . 0341 Manufacturing of Paper and Paper Products 100 100 03411 Pulp, Paper and Paperboards 5.88 ■ 7.87 33.843412 Containers, Boxes and Paperboards 24.71 23.6 -4.513419 Pulp, Paper, Paperboard Items etc. 69.41 68.54 -1.25341 Total Percentage Change - - 28.08355 Rubber Products 100 100 -
3551 Tyre and Tube Industries 1.34 1.27 -4.933559 Rubber Products 98.66 98.73 0.07355 Total Percentage Change - - ■4.86361 Pottery and China etc. 100 100 -
3611 Pottery and China etc. 100 100 0361 Total Percentage Change - - 0
Source: Same as Table 1.
8
Percentage Output 1995 1998 % Change
Percentage Employees 1995 1998 % Change
100 100 0 100 100 0- - 0 • - 0
100 100 0 100 100 -
33.7 22.76 -32.45 16.43 11.59 -41.7657.83 38.99 -32.57 70.43 49.71 -41.688.47 38.24 351.51 13.14 38.7 66.04
- - 286.49 - - ■17.4100 100 - 100 100 .
0.59 1.48 150.85 1.86 1.5 -24.3999.41 98.52 -0.9 98.14 98.5 0.37
- - 149.95 - - ■24.02100 100 - 100 100 -
100 100 0 . 100 100 0- - 0 - - 0

Table 5. Industrial Location in the Country
District Number Of Units Output Number of Employees1995 1998 % Change 1995 1998 % Change 1995 1998 % Change
Colombo 8.95 9.94 11.11 9.53 8.53 -10.49 10.42 9.45 -931Gampaha 1332 13.64 2.4 16.27 11.74 -27.84 9.93 14.15 42.50Kalutara 5.44 5.25 -3.5 9.87 3.78 -61.70 4.99 5.15 3.21Kandy 14.57 15.58 6.93 13.22 19.38 46.60 14.5 14.56 0.41Matale 4.22 4.28 1.4 4.99 4.72 -5.41 6.54 12.53 91.59Nuwara Eliya 6.61 7.58 14.63 3.66 3.17 -13.39 4.8 4.4 -8.33Galle 6.44 7.13 10.74 2.69 13.79 412.64 8.9 9.24 3.82Matara 3.63 4 10.24 1.39 2.7 94.24 2.19 4.71 115.07Hambantota 1.15 1.18 2.49 0.45 0.28 -37.78 0.57 0.45 -21.05Kurunegala 7.09 7.72 8.83 1339 4.83 -63.93 9.93 6.65 -33.03Puttalam •5.72 6.57 14.81 9.69 8.08 -16.62 4.56 4.43 -2.85Anuradapura 1.27 1.45 13.87 3.88 1.37 -64.69 1.03 1.5 45.63Polonnnaruwa 0.95 1.09 14.69 0.56 4.85 766.07 0.29 1.22 320.69Badulla 5.75 6.21 8.01 1.01 1.07 5.94 4.2 2.61 -37.86Monaragala 1.68 1.88 12.02 0.21 0.39 85.71 0.88 0.69 -21.59Ratnapura 9.34 2.28 -75.61 1.31 1.53 16.79 10.64 1.73 -83.74Kegalla 3.87 4.23 9.29 7.87 9.77 24.14 5.66 6.54 15.55
Source: Same as Table 1.
210

References
Amaratunge, S. and Shiratake, Y. (1999). An Economical Analysis of the Marketing System of Agricultural Production in the Mahaweli "H" Zone in Sri Lanka Bulletin of Agriculture, No.84, Saga University, Japan.
Amaratunge, S. and Shiratake, Y. (2001a). Empirical Evidence of Small Scale Industries in Third World: An Overview of Literature, Bulletin of Agriculture, No. 86, Saga University, Japan
Amaratunge, S. and Shiratake, Y. (2001b). The Economical Effects of Agricultural Diversification on Farm Management: A Case Study on Coconut Triangle Area in Sri Lanka. Review of Agricultural Economics, Vol. 51, No: 2, Kyushu Agricultural Ecpnomics Society, Japan.
Amaratunge, S., Ratnayake, P., Shiratake, Y. and Takeda, J, (2001c). Alternative Agriculture as a Method of Re-strengthening the Agricultural Sector: A Case Study on Coconut Triangle in Sri Lanka. Economic Review, Vol. 34, No: 2 Saga University Economics Society, Saga, Japan.
Amaratunge, S., Nakamura, H. and .Ratnayake, P. (2002a). Survival of Small Scale Industries in a Market Economy: A Case Study on Sri Lanka. Ryukoku Journal of Economics, Vol. 41, No. 5,Kiyoto, Japan.
Amaratunge, S. And Shiratake, Y. (2002b). The Role of Small Scale Tea Industries as a Method of Rural Development: A Field Study in Kalutara District in Sri Lanka. Vol. 53, No: 2, Review of Agricultural Economics, Kyushu Agricultural Economics Society, Japan.
BBC English Dictionary, (2000). BBC English Dictionary/CD ROM, London.Census and Statistics. (1995-2001). Annual Industrial Survey Reports, Colombo, Sri Lanka.Central Bank. (1998). Economic Progress of Independent Sri Lanka, Sri Lanka.Eugene, S. and Morse, R. (1956), Modem Small Industry for Developing Countries. Me Graw Hill,
New York.FAO. (1985). Country Report: Sri Lanka. Food and Agriculture Organization, Colombo, Sri Lanka.Lakshman, W. and Others. (1991). Changes in the Industrial Structure and the Role of Small and
Medium Industries in Developing Countries: The Case of Sri Lanka. Institute of Developing Economies, Tokyo.
Thorbeeke, E. and Svejnar, J. (1987). Economic Policies and Agricultural Performance in Sri Lanka 1960-1984. Organization for Economic Co-operation and Development, Paris.
Uribe-echevarria. (1992). Small-scale industrial development: policy and strategic issues. Institute of Social Studies, Working Paper Series, No. 117, The Hague.
World Bank. (2001). World Development Indicators. Washington DC.World Bank (2002). Global Economic Prospects. Washington DC.World Bank (2002). Official Web Site, worldbank.org
211


![Second Small and Medium Industries Project (Loan 1084-SRI[SF])](https://img.pdfslide.net/doc/110x75/577ce6d91a28abf10393be49/second-small-and-medium-industries-project-loan-1084-srisf.jpg)