Embed Size (px)
Citation preview

Vegetation lidar WS, Chiba University, May 26, 2017
Role of the active sensing in the satellite earth observation
Teruyuki Nakajima JAXA/EORC
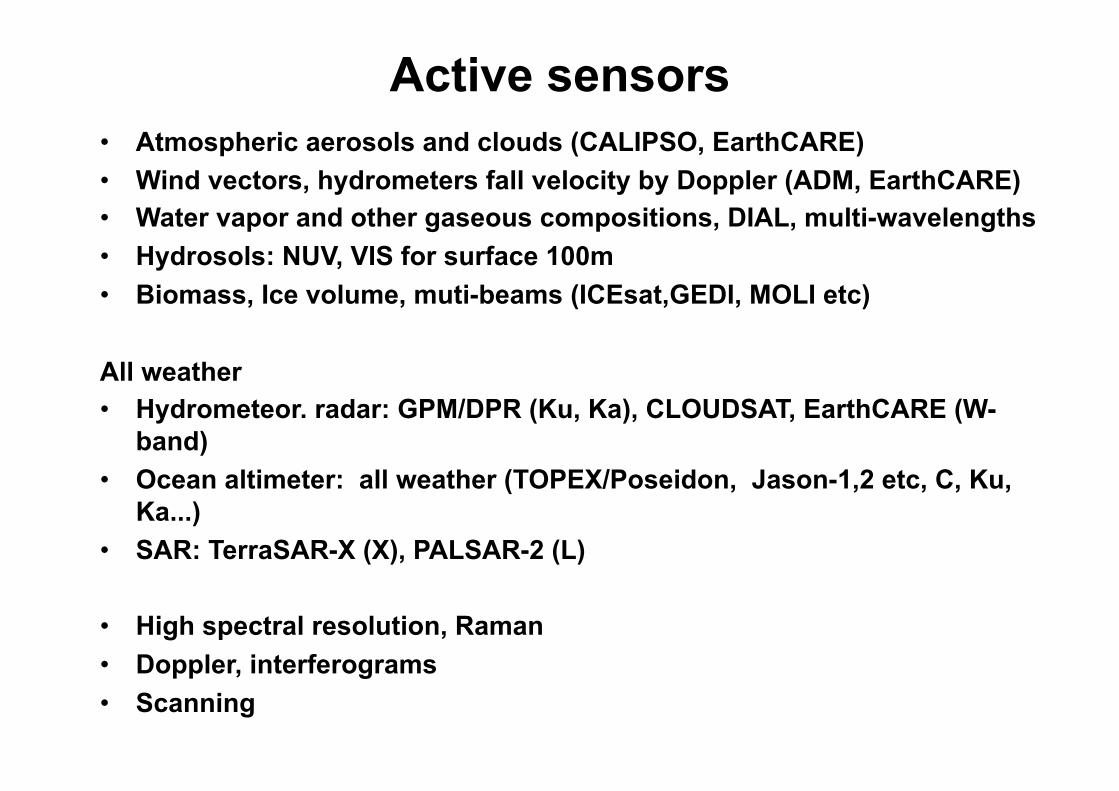
Active sensors• Atmospheric aerosols and clouds (CALIPSO, EarthCARE) • Wind vectors, hydrometers fall velocity by Doppler (ADM, EarthCARE) • Water vapor and other gaseous compositions, DIAL, multi-wavelengths • Hydrosols: NUV, VIS for surface 100m • Biomass, Ice volume, muti-beams (ICEsat,GEDI, MOLI etc) All weather • Hydrometeor. radar: GPM/DPR (Ku, Ka), CLOUDSAT, EarthCARE (W-
band) • Ocean altimeter: all weather (TOPEX/Poseidon, Jason-1,2 etc, C, Ku,
Ka...) • SAR: TerraSAR-X (X), PALSAR-2 (L)
• High spectral resolution, Raman • Doppler, interferograms • Scanning
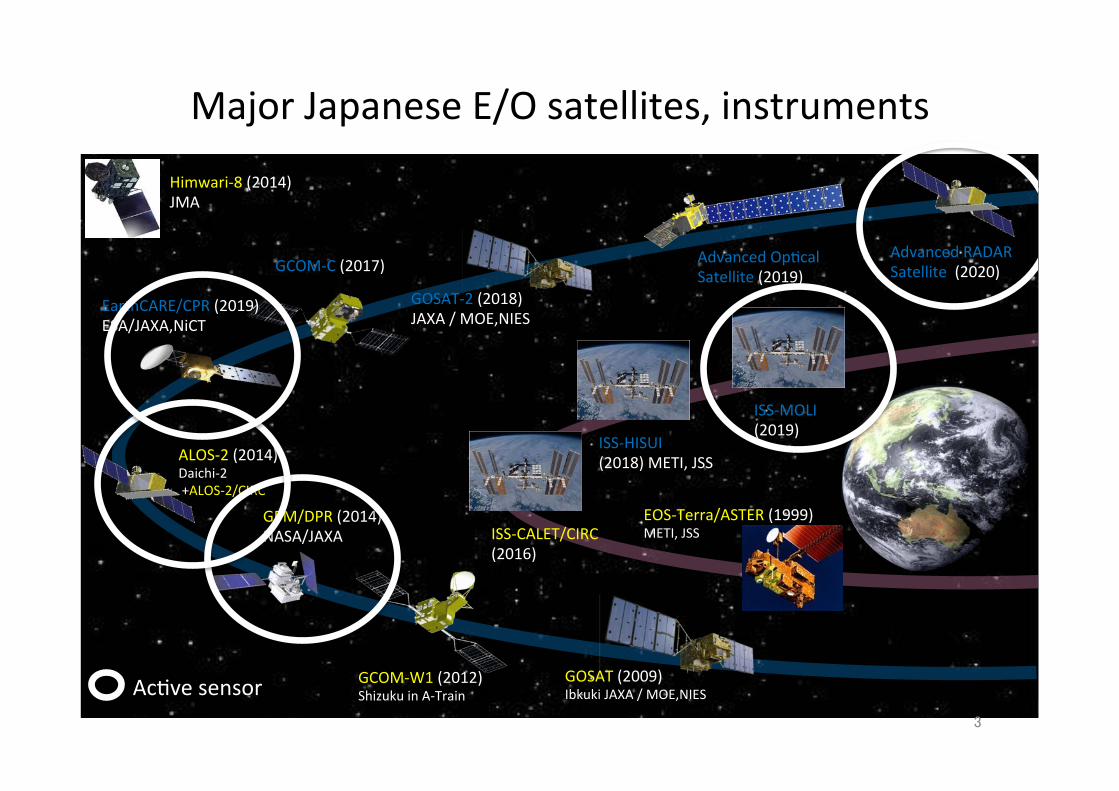
MajorJapaneseE/Osatellites,instruments
ALOS-2(2014)Daichi-2+ALOS-2/CIRC
GPM/DPR(2014)NASA/JAXA
GCOM-C(2017)
EarthCARE/CPR(2019)ESA/JAXA,NiCT
GOSAT(2009)IbkukiJAXA/MOE,NIES
GCOM-W1(2012)ShizukuinA-Train
GOSAT-2(2018)JAXA/MOE,NIES
AdvancedOpTcalSatellite(2019)
AdvancedRADARSatellite(2020)
Himwari-8(2014)JMA
EOS-Terra/ASTER(1999)METI,JSSISS-CALET/CIRC
(2016)
ISS-MOLI(2019)
AcTvesensor
ISS-HISUI(2018)METI,JSS
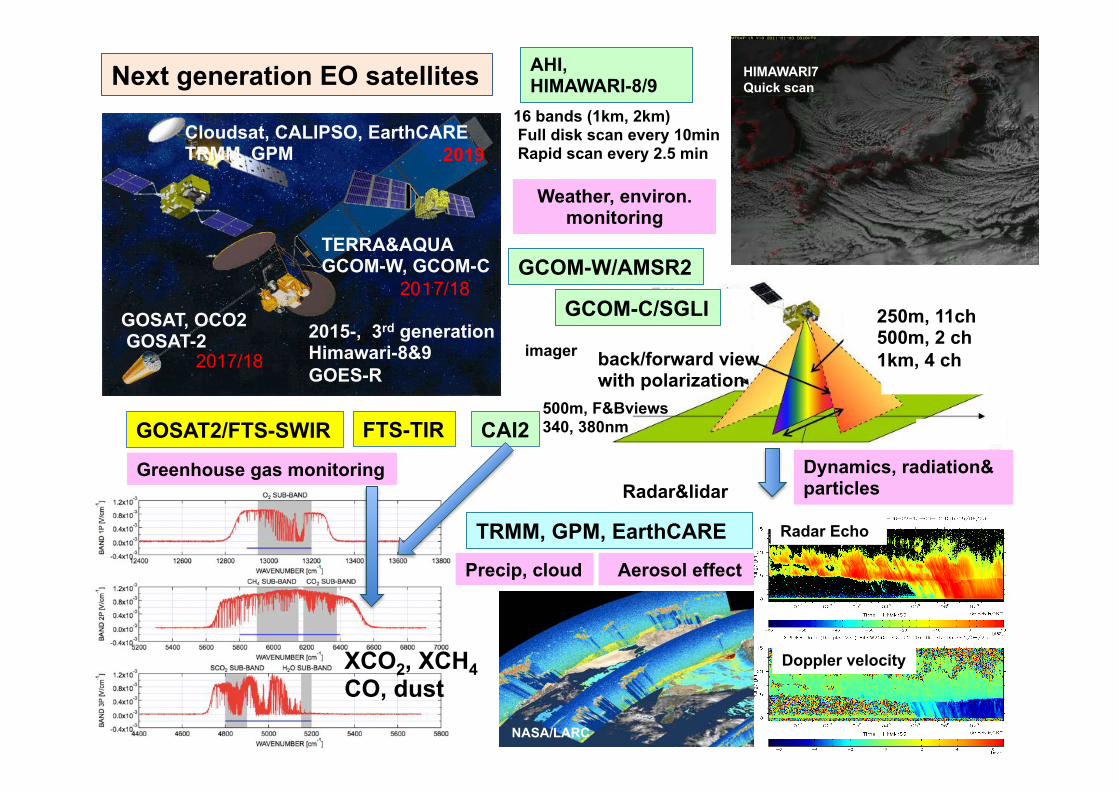
Next generation EO satellites
Cloudsat, CALIPSO, EarthCARE TRMM, GPM
GOSAT, OCO2 GOSAT-2
TERRA&AQUA GCOM-W, GCOM-C
2015-, 3rd generation Himawari-8&9 GOES-R
20 7/18
2017/18
2019
AHI, HIMAWARI-8/9
4
雨�
Radar Echo�
Doppler velocity �
NASA/LARC
NASA/LARC
TRMM, GPM, EarthCARE
GOSAT2/FTS-SWIR CAI2
XCO2, XCH4 CO, dust
FTS-TIR
Greenhouse gas monitoring
16 bands (1km, 2km) Full disk scan every 10min Rapid scan every 2.5 min
HIMAWARI7 Quick scan
Aerosol effect
Radar&lidar
Weather, environ. monitoring
Dynamics, radiation& particles
back/forward view with polarization
250m, 11ch 500m, 2 ch 1km, 4 ch imager
GCOM-C/SGLI
500m, F&Bviews 340, 380nm
GCOM-W/AMSR2
Precip, cloud
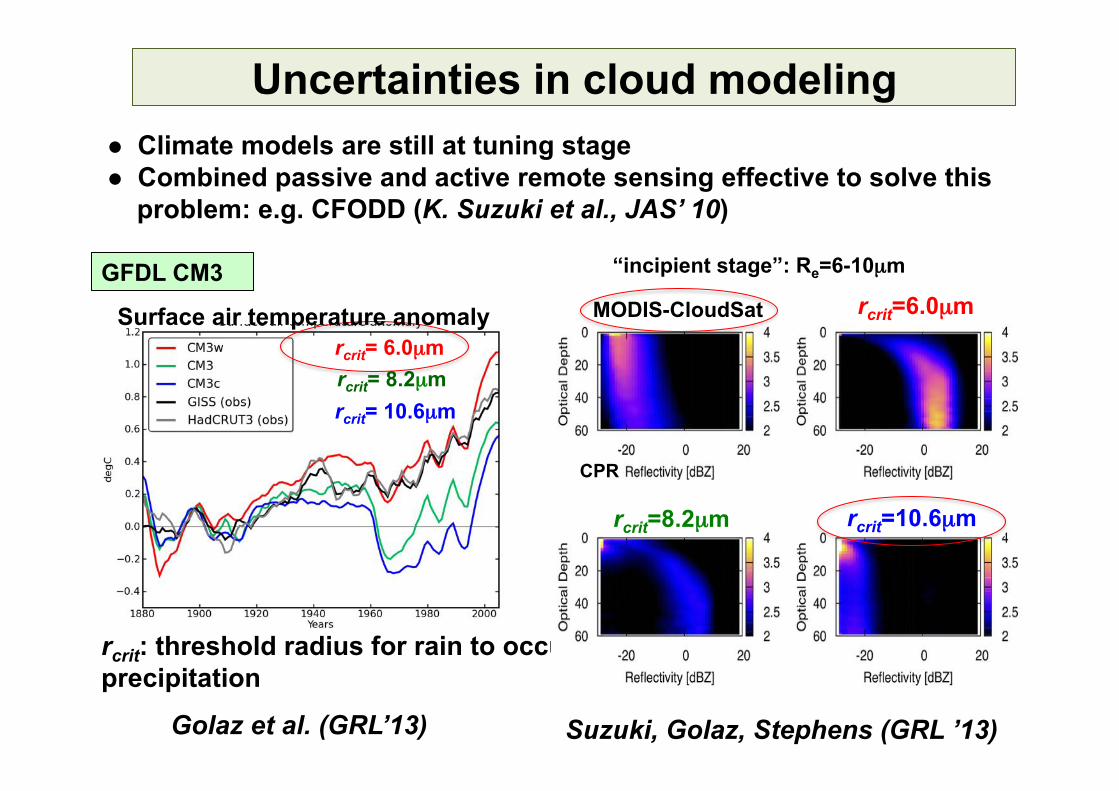
Uncertainties in cloud modeling
rcrit= 6.0µm rcrit= 8.2µm rcrit= 10.6µm
GFDL CM3
Suzuki, Golaz, Stephens (GRL ’13) Golaz et al. (GRL’13)
rcrit: threshold radius for rain to occur precipitation
MODIS-CloudSat rcrit=6.0µm
rcrit=8.2µm rcrit=10.6µm
“incipient stage”: Re=6-10µm
l Climate models are still at tuning stage l Combined passive and active remote sensing effective to solve this
problem: e.g. CFODD (K. Suzuki et al., JAS’ 10)
CPR
Surface air temperature anomaly
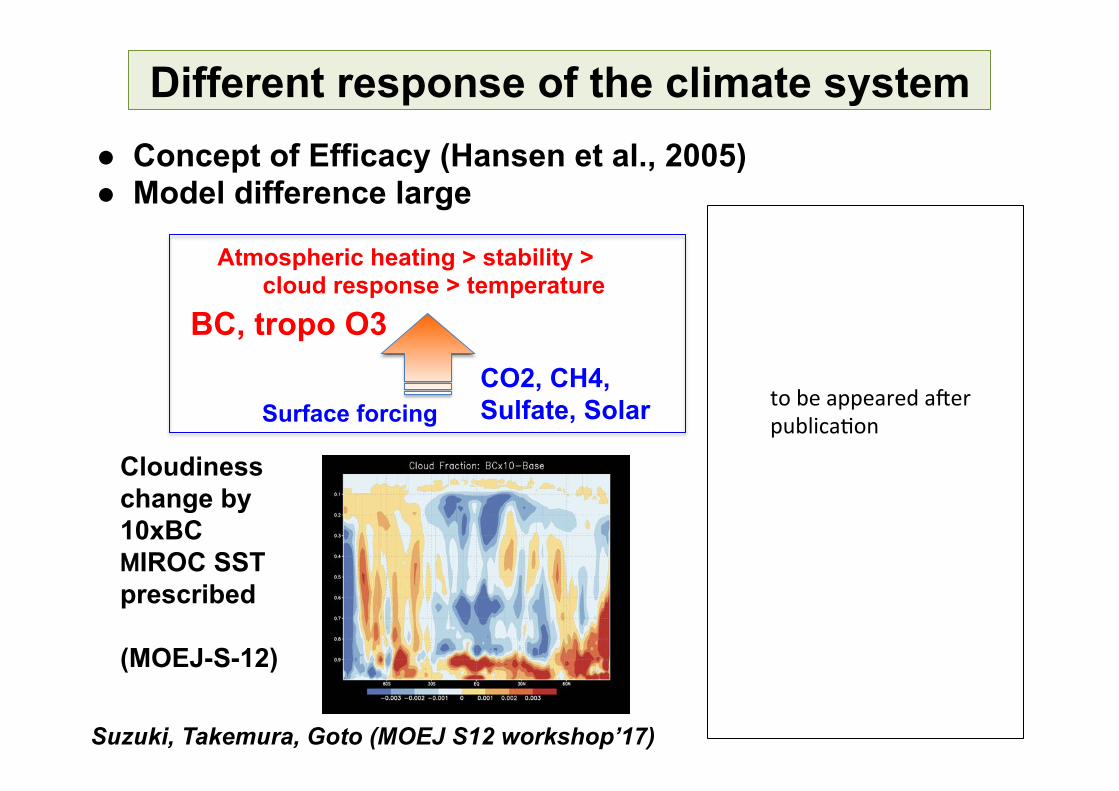
Different response of the climate system
CO2, CH4, Sulfate, Solar
BC, tropo O3
Atmospheric heating > stability > cloud response > temperature
Surface forcing
l Concept of Efficacy (Hansen et al., 2005) l Model difference large
Cloudiness change by 10xBC
IROC SST prescribed (MOEJ-S-12)
Suzuki, Takemura, Goto (MOEJ S12 workshop’17)�
tobeappearedaYerpublicaTon
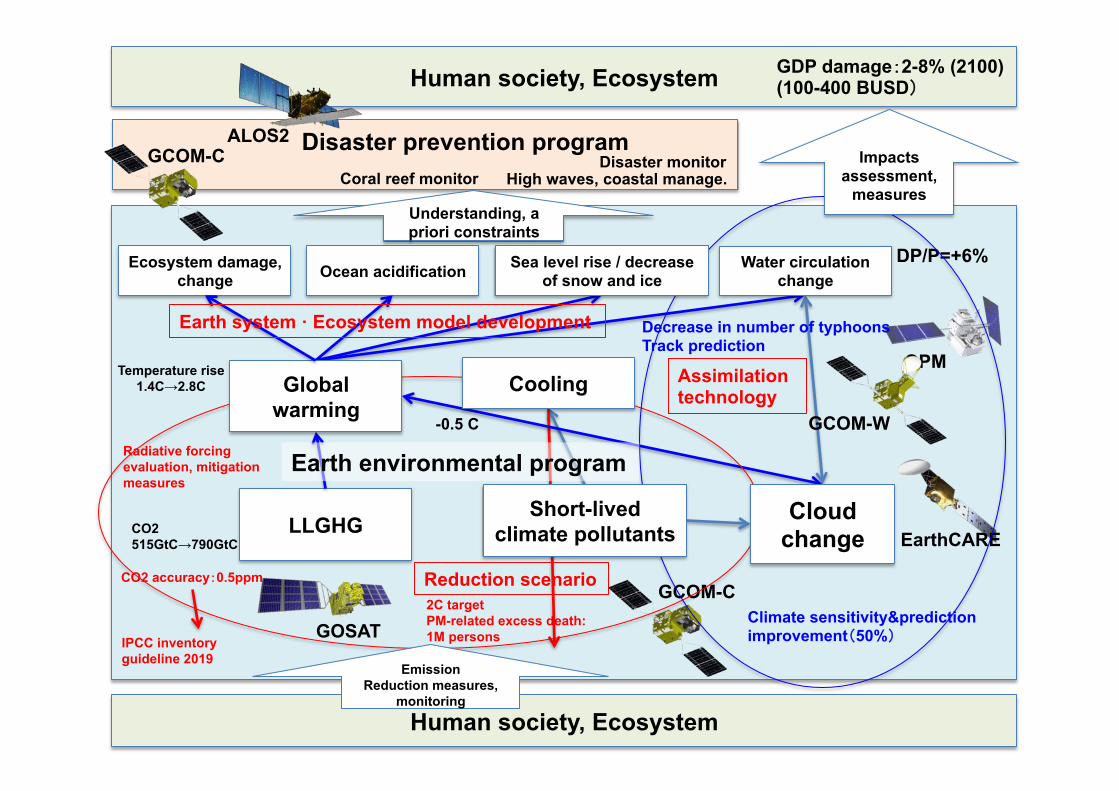
Human society, Ecosystem
Human society, Ecosystem
GPM
GOSAT
DP/P=+6%
LLGHG
Ocean acidification
ALOS2
GCOM-C
Coral reef monitor
EarthCARE CO2 515GtC→790GtC
Temperature rise 1.4C→2.8C
-0.5 C
High waves, coastal manage.Disaster monitor
Disaster prevention program
IPCC inventory guideline 2019
2C target PM-related excess death: 1M persons
CO2 accuracy 0.5ppm
Radiative forcing evaluation, mitigation measures
Climate sensitivity&prediction improvement 50%
Impacts assessment,
measures
Water circulation change
Global warming
Cooling
Cloud change
Short-lived climate pollutants
Decrease in number of typhoons Track prediction
GCOM-W
GCOM-C
GDP damage 2-8% (2100) (100-400 BUSD
Ecosystem damage, change
Understanding, a priori constraints
Sea level rise / decrease of snow and ice
Assimilation technology
Reduction scenario
Earth system · Ecosystem model development
Earth environmental program
Emission Reduction measures,
monitoring
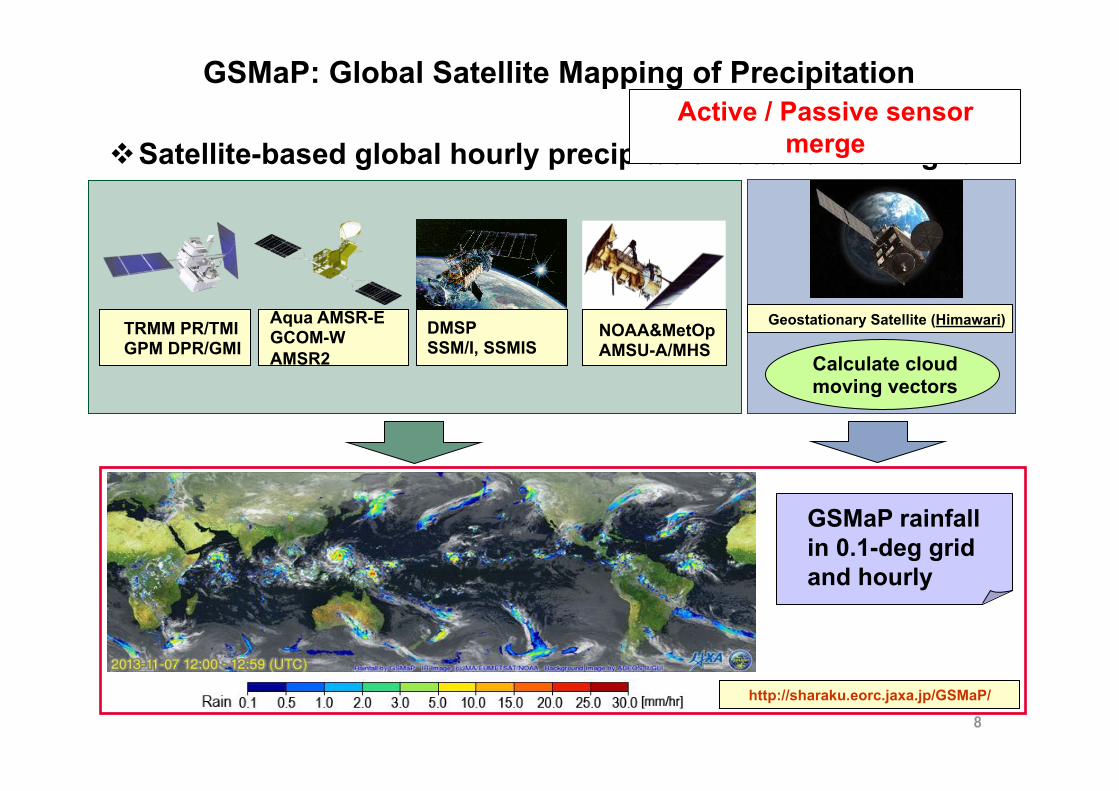
GSMaP: Global Satellite Mapping of Precipitation
TRMM PR/TMI GPM DPR/GMI
Aqua AMSR-E GCOM-W AMSR2
Geostationary Satellite (Himawari)
GSMaP rainfall in 0.1-deg grid and hourly
DMSP SSM/I, SSMIS
Calculate cloud moving vectors
NOAA&MetOp AMSU-A/MHS
v Satellite-based global hourly precipitation data of 10km grid
http://sharaku.eorc.jaxa.jp/GSMaP/
Active / Passive sensor merge
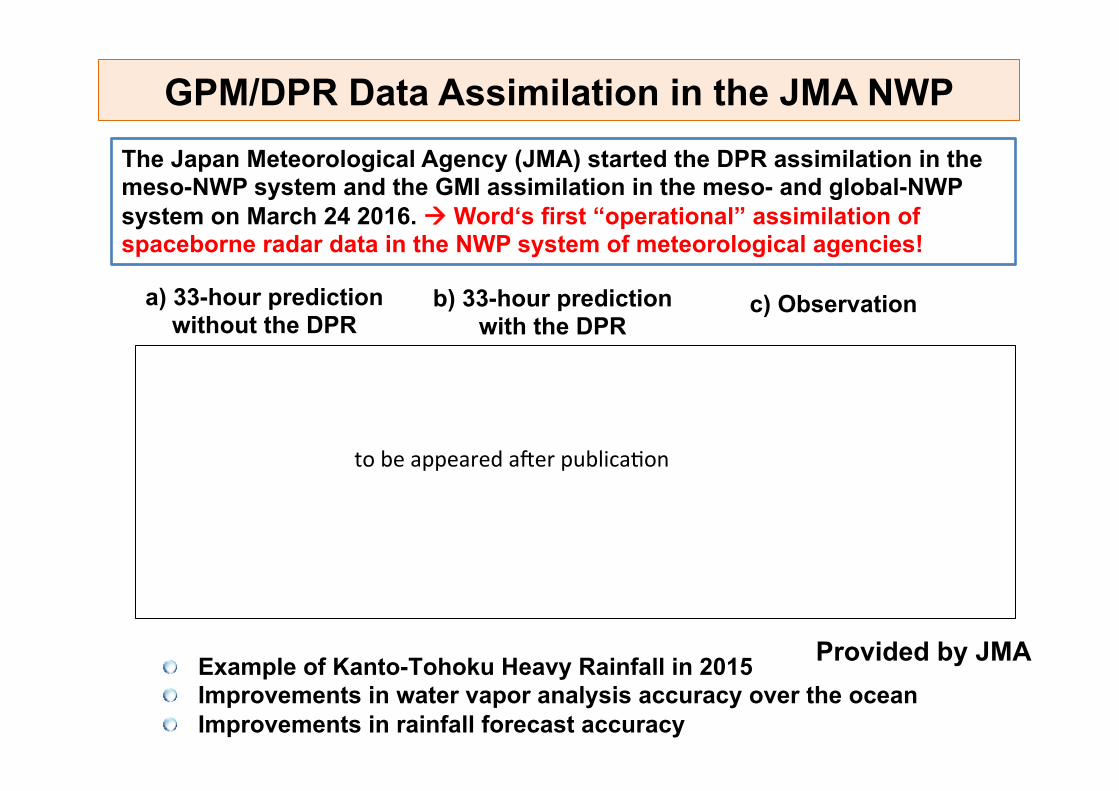
GPM/DPR Data Assimilation in the JMA NWP
a) 33-hour prediction without the DPR
b) 33-hour prediction with the DPR
c) Observation
Example of Kanto-Tohoku Heavy Rainfall in 2015 Improvements in water vapor analysis accuracy over the ocean Improvements in rainfall forecast accuracy
Provided by JMA
The Japan Meteorological Agency (JMA) started the DPR assimilation in the meso-NWP system and the GMI assimilation in the meso- and global-NWP system on March 24 2016. à Word‘s first “operational” assimilation of spaceborne radar data in the NWP system of meteorological agencies!
tobeappearedaYerpublicaTon
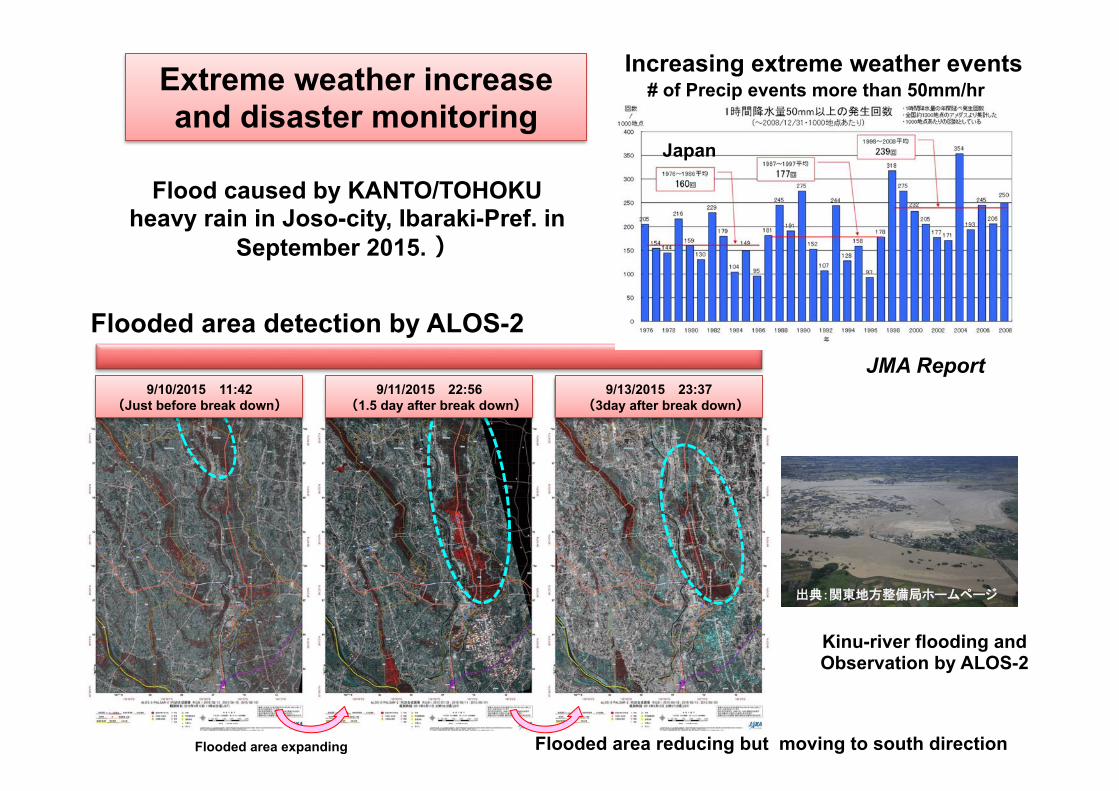
Flooded area detection by ALOS-2
Extreme weather increase and disaster monitoring
Flooded area reducing but moving to south direction
9/13/2015 23:37 3day after break down
9/10/2015 11:42 Just before break down
9/11/2015 22:56 1.5 day after break down
Flooded area expanding
Kinu-river flooding and Observation by ALOS-2
JMA Report
Increasing extreme weather events# of Precip events more than 50mm/hr
Japan
Flood caused by KANTO/TOHOKU heavy rain in Joso-city, Ibaraki-Pref. in
September 2015.
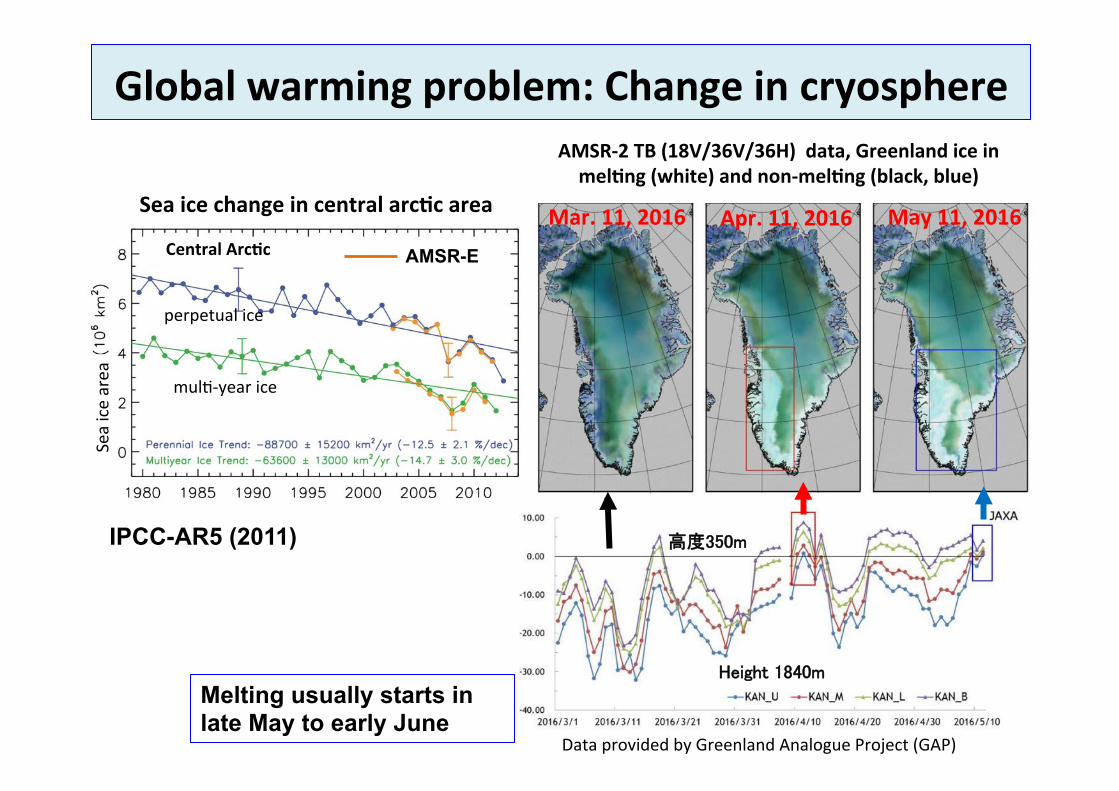
Globalwarmingproblem:ChangeincryosphereAMSR-2TB(18V/36V/36H)data,GreenlandiceinmelIng(white)andnon-melIng(black,blue)
DataprovidedbyGreenlandAnalogueProject(GAP)
Mar.11,2016 Apr.11,2016 May11,2016
Melting usually starts in late May to early June
perpetualice
mulT-yearice
IPCC-AR5 (2011)
Seaicearea
AMSR-ECentralArcIc
SeaicechangeincentralarcIcarea

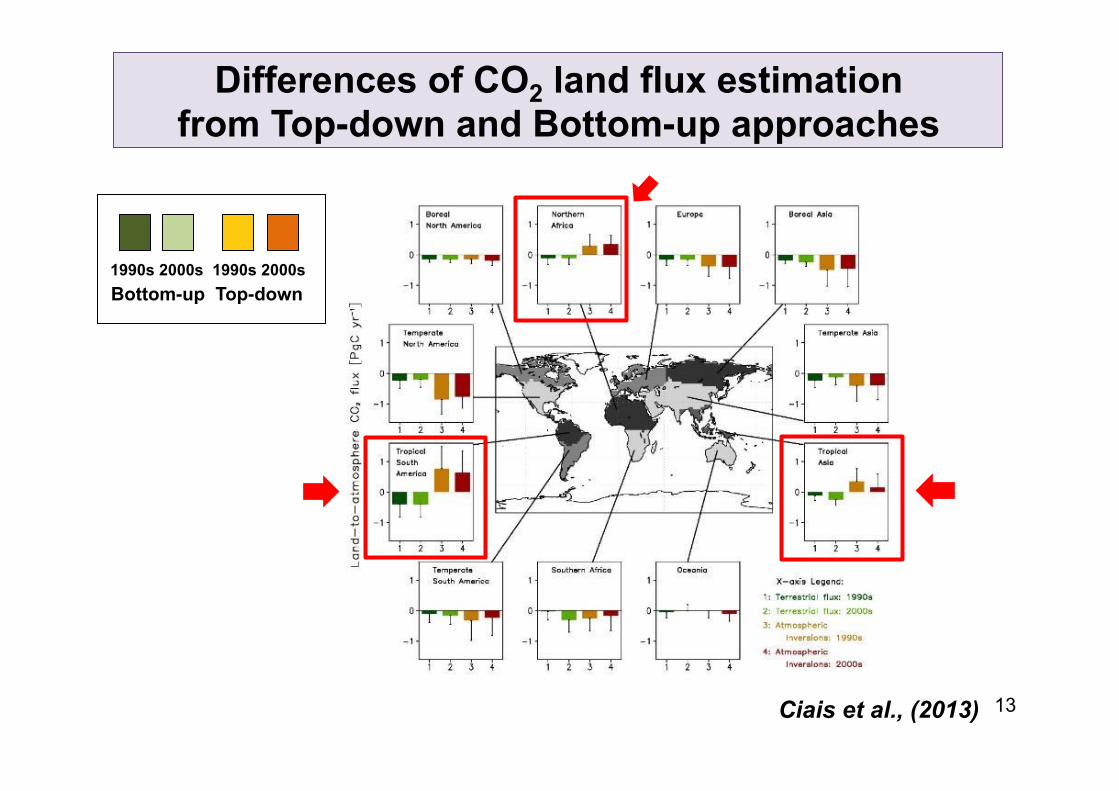
Global anthropogenic CO2 budget
• Cumulative result shows contribution of “Land to atmosphere flux” is enough large, comparing with “Fossil fuel combustion (Anthropogenic)“
• Recent result shows the uncertainty of “Land to atmosphere flux” is much worse.
l Needs precise evaluation of “BIOMASS” and its change
(IPCC AR5)
13
Differences of CO2 land flux estimation from Top-down and Bottom-up approaches
1990s 2000s 1990s 2000sBottom-up Top-down
Ciais et al., (2013) �
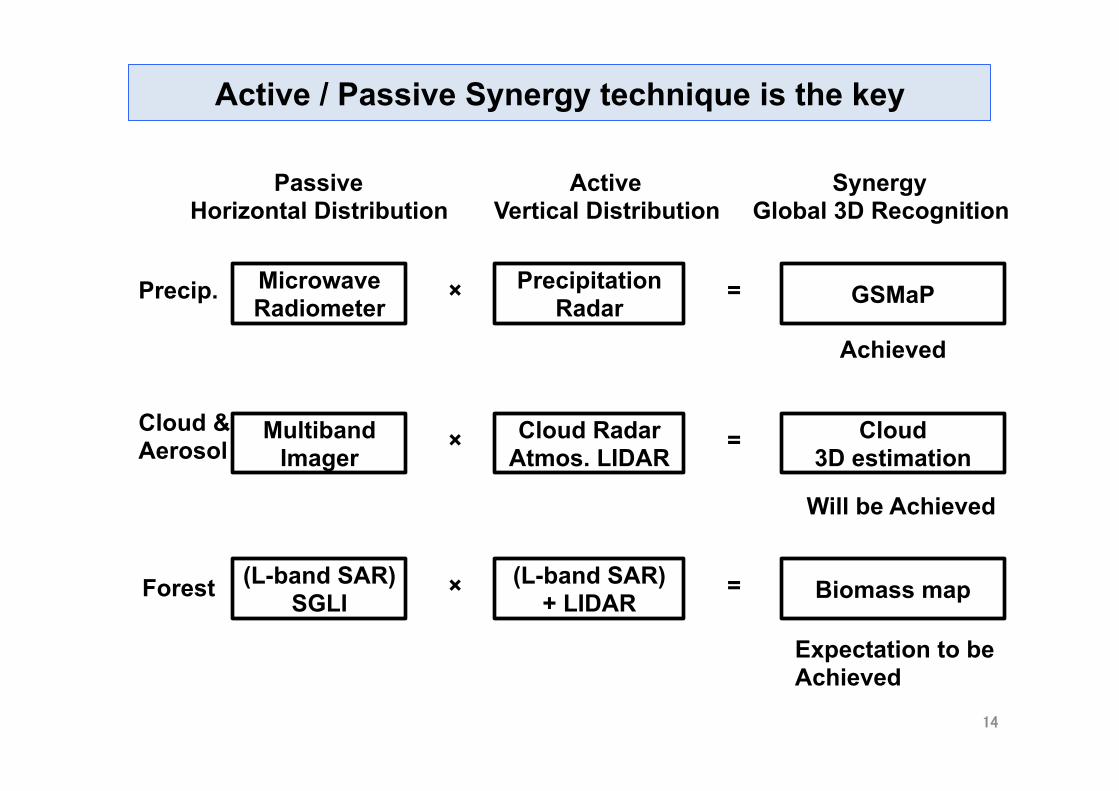
Active / Passive Synergy technique is the key
Microwave Radiometer
Passive Horizontal Distribution
Active Vertical Distribution
Synergy Global 3D Recognition
Precipitation Radar GSMaP× =
Multiband Imager
Cloud Radar Atmos. LIDAR
Cloud 3D estimation
× =
(L-band SAR) SGLI
(L-band SAR) + LIDAR Biomass map× =
Precip.
Cloud & Aerosol
Forest
Achieved
Will be Achieved
Expectation to be Achieved
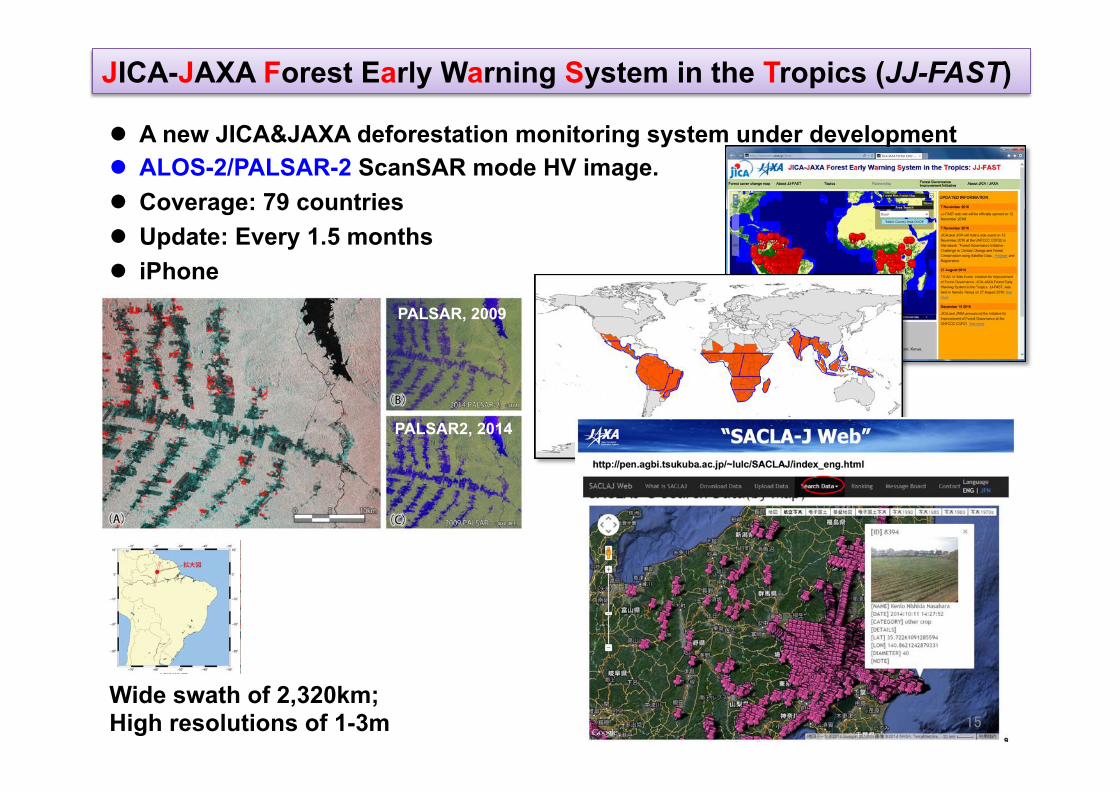
l A new JICA&JAXA deforestation monitoring system under development l ALOS-2/PALSAR-2 ScanSAR mode HV image. l Coverage: 79 countries l Update: Every 1.5 months l iPhone
JICA-JAXA Forest Early Warning System in the Tropics (JJ-FAST)
JJ-FAST coverage�
PALSAR, 2009
PALSAR2, 2014
Wide swath of 2,320km; High resolutions of 1-3m
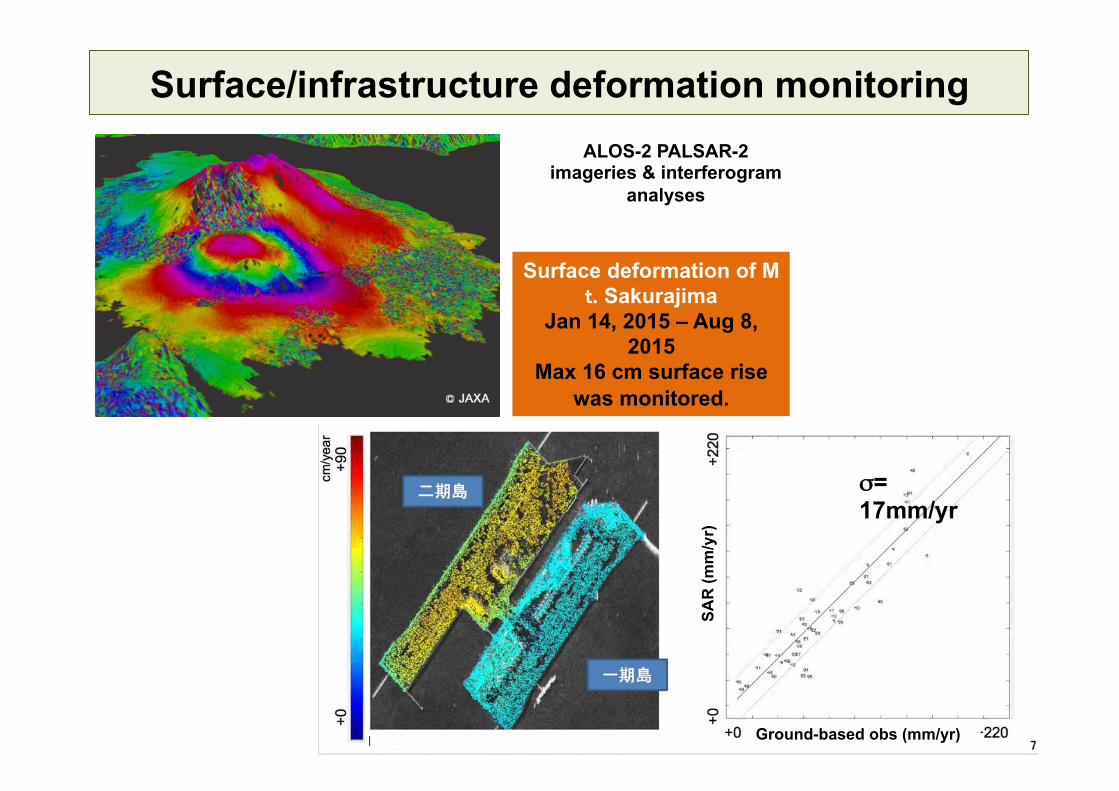
Surface/infrastructure deformation monitoring
Ground-based obs (mm/yr)
SA
R (m
m/y
r)
σ= 17mm/yr
Surface deformation of M. Sakurajima
Jan 14, 2015 – Aug 8, 2015
Max 16 cm surface rise was monitored.
ALOS-2 PALSAR-2 imageries & interferogram
analyses
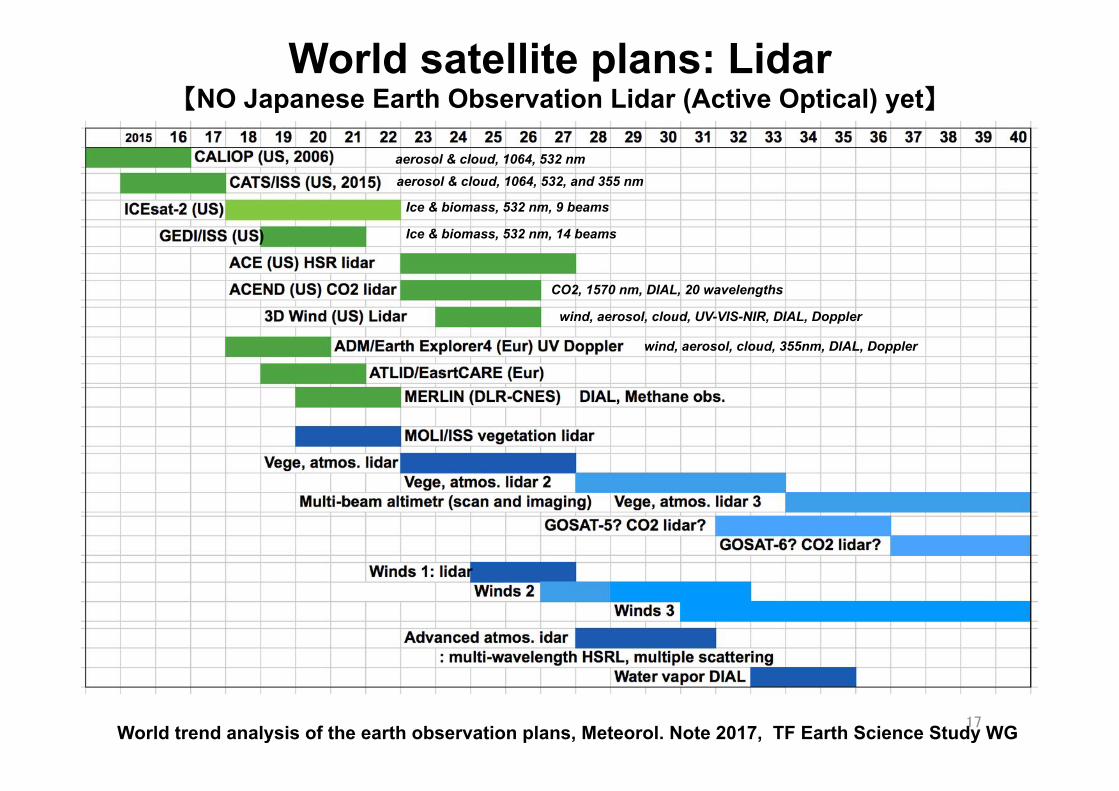
World trend analysis of the earth observation plans, Meteorol. Note 2017, TF Earth Science Study WG
World satellite plans: Lidar NO Japanese Earth Observation Lidar (Active Optical) yet
aerosol & cloud, 1064, 532, and 355 nm�aerosol & cloud, 1064, 532 nm�
Ice & biomass, 532 nm, 9 beams�
Ice & biomass, 532 nm, 14 beams�
CO2, 1570 nm, DIAL, 20 wavelengths�
wind, aerosol, cloud, UV-VIS-NIR, DIAL, Doppler�
wind, aerosol, cloud, 355nm, DIAL, Doppler�
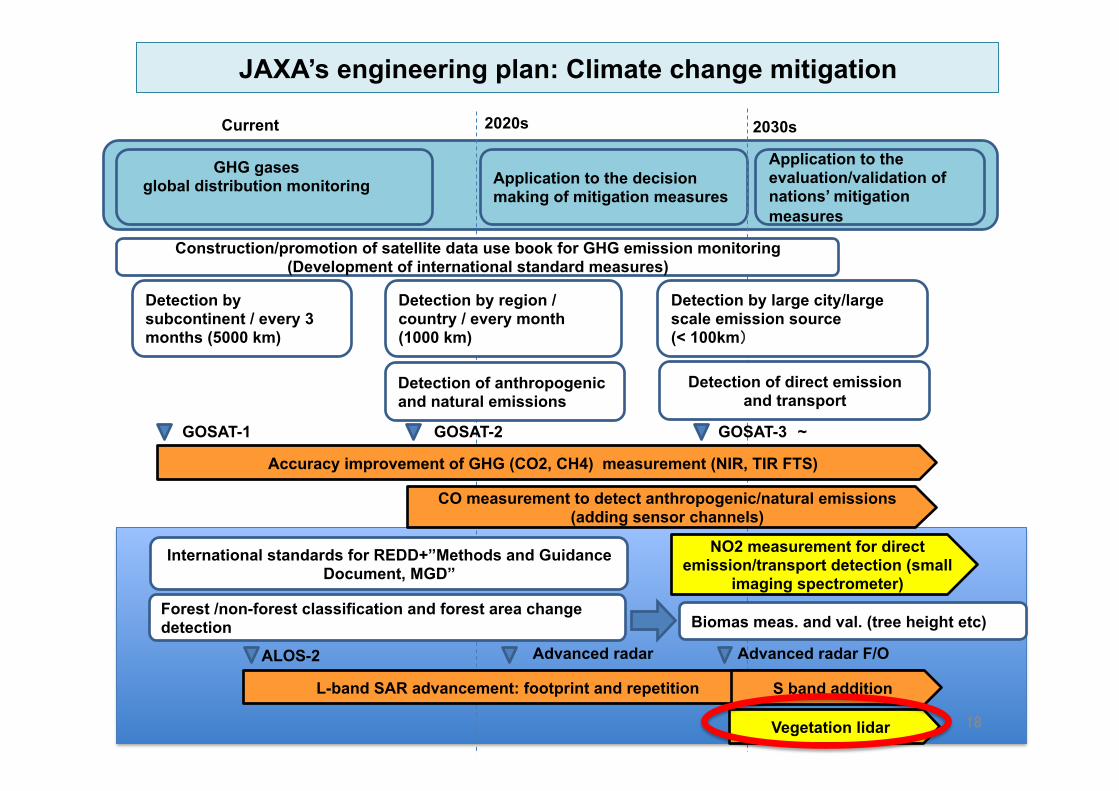
Application to the decision making of mitigation measures
Application to the evaluation/validation of nations’ mitigation measures
GHG gases global distribution monitoring
2020s 2030sCurrent
GOSAT-1 GOSAT-3 ~GOSAT-2
Accuracy improvement of GHG (CO2, CH4) measurement (NIR, TIR FTS)
CO measurement to detect anthropogenic/natural emissions (adding sensor channels)
NO2 measurement for direct emission/transport detection (small
imaging spectrometer)
Construction/promotion of satellite data use book for GHG emission monitoring (Development of international standard measures)
Biomas meas. and val. (tree height etc) Forest /non-forest classification and forest area change detection
Advanced radar F/OALOS-2 Advanced radar
L-band SAR advancement: footprint and repetition S band addition
Vegetation lidar
International standards for REDD+”Methods and Guidance Document, MGD”
JAXA’s engineering plan: Climate change mitigation
Detection by region / country / every month (1000 km)
Detection by subcontinent / every 3 months (5000 km)
Detection by large city/large scale emission source (< 100km
Detection of anthropogenic and natural emissions
Detection of direct emission and transport
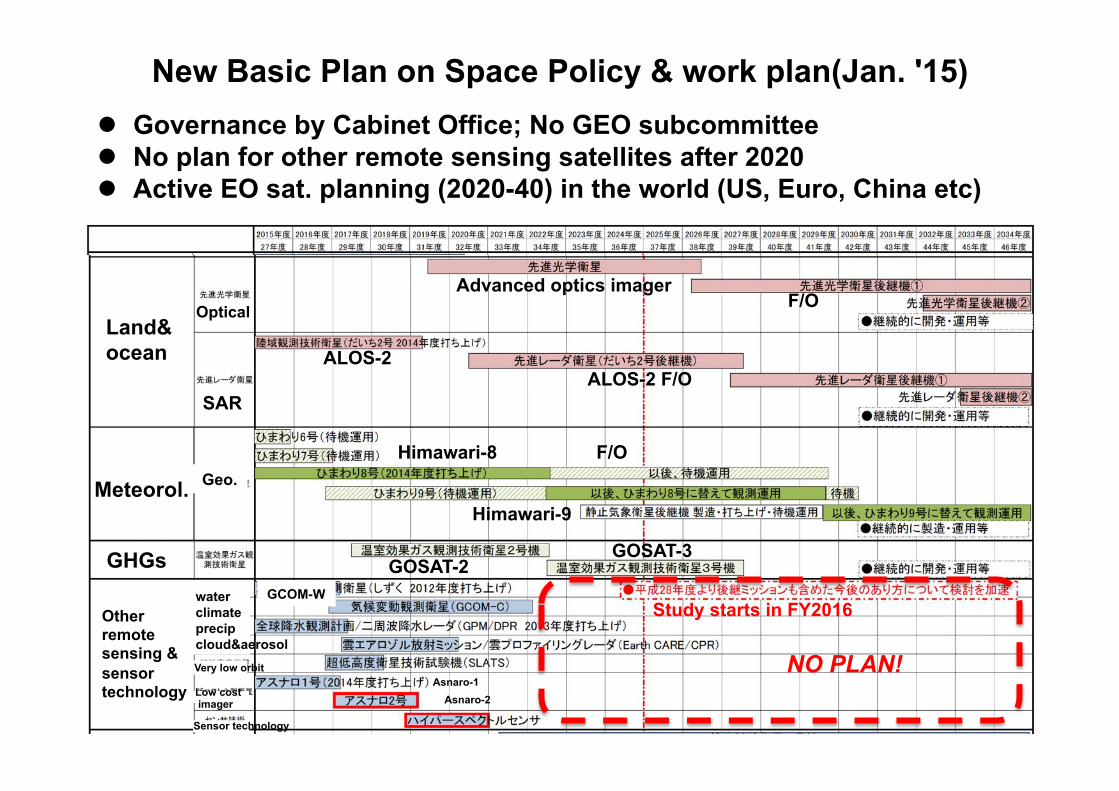
New Basic Plan on Space Policy & work plan(Jan. '15)
NO PLAN!�
l Governance by Cabinet Office; No GEO subcommittee l No plan for other remote sensing satellites after 2020 l Active EO sat. planning (2020-40) in the world (US, Euro, China etc)
GHGs
SAR
Optical
ALOS-2
Geo.Himawari-8
GOSAT-2water climate precip cloud&aerosol
Asnaro-2
Other remote sensing & sensor technology Low cost
imager
Sensor technology
Very low orbit
GCOM-W
Asnaro-1
Land& ocean
GHGs
Himawari-9
F/O
GOSAT-3
ALOS-2 F/O
Advanced optics imagerF/O
Study starts in FY2016
Meteorol.
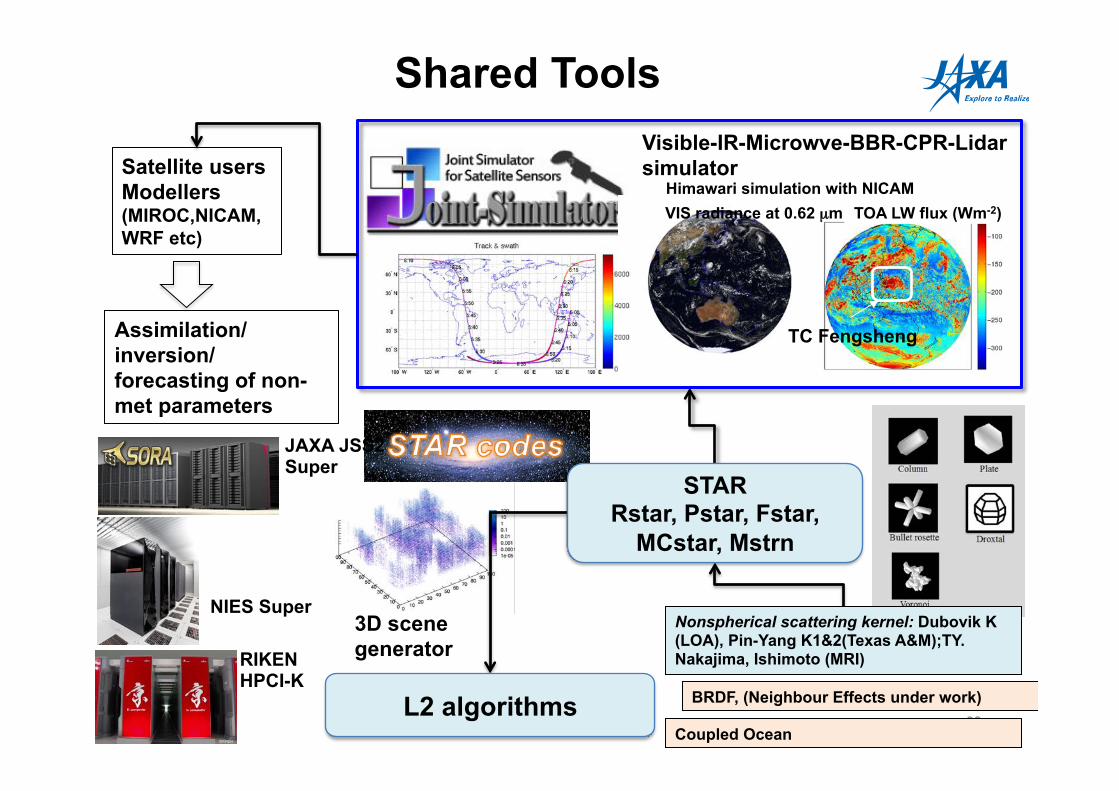
Shared Tools
L2 algorithms
Himawari simulation with NICAM VIS radiance at 0.62 µm
TC Fengsheng
TOA LW flux (Wm-2)
Visible-IR-Microwve-BBR-CPR-Lidar simulator
3D scene generator
Satellite users Modellers (MIROC,NICAM, WRF etc)
STAR Rstar, Pstar, Fstar,
MCstar, Mstrn
Nonspherical scattering kernel: Dubovik K (LOA), Pin-Yang K1&2(Texas A&M);TY. Nakajima, Ishimoto (MRI)
JAXA JSS2 Super
RIKEN HPCI-K
NIES Super
Assimilation/inversion/forecasting of non-met parameters
BRDF, (Neighbour Effects under work)
Coupled Ocean
Summaryl Climate & environmental change program
• Forcing: LLGHG, SLCP; emission estimate
• Climate sensitivity, mechanisms: Cloud, precipitation
• Impacts: water, ecosystem, cryosphere
l Disaster prevention program
l Horizontal and vertical information needed
l Imager, lidar, radar technologies in progress