Embed Size (px)
Citation preview
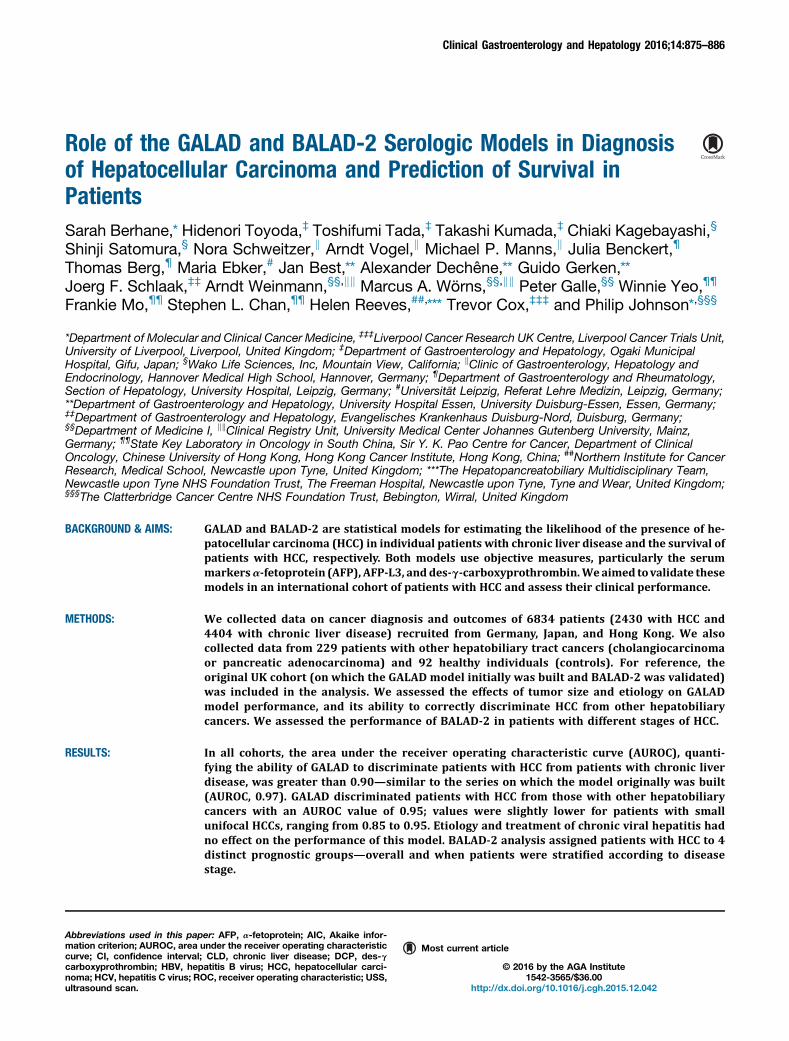
Role of the GALAD and BALAD-2 Serologic Models in Diagnosisof Hepatocellular Carcinoma and Prediction of Survival inPatientsSarah Berhane,* Hidenori Toyoda,‡ Toshifumi Tada,‡ Takashi Kumada,‡ Chiaki Kagebayashi,§
Shinji Satomura,§ Nora Schweitzer,k Arndt Vogel,k Michael P. Manns,k Julia Benckert,¶
Thomas Berg,¶ Maria Ebker,# Jan Best,** Alexander Dechêne,** Guido Gerken,**Joerg F. Schlaak,‡‡ Arndt Weinmann,§§,kk Marcus A. Wörns,§§,kk Peter Galle,§§ Winnie Yeo,¶¶
Frankie Mo,¶¶ Stephen L. Chan,¶¶ Helen Reeves,##,*** Trevor Cox,‡‡‡ and Philip Johnson*,§§§
*Department of Molecular and Clinical Cancer Medicine, ‡‡‡Liverpool Cancer Research UK Centre, Liverpool Cancer Trials Unit,University of Liverpool, Liverpool, United Kingdom; ‡Department of Gastroenterology and Hepatology, Ogaki MunicipalHospital, Gifu, Japan; §Wako Life Sciences, Inc, Mountain View, California; kClinic of Gastroenterology, Hepatology andEndocrinology, Hannover Medical High School, Hannover, Germany; ¶Department of Gastroenterology and Rheumatology,Section of Hepatology, University Hospital, Leipzig, Germany; #Universität Leipzig, Referat Lehre Medizin, Leipzig, Germany;**Department of Gastroenterology and Hepatology, University Hospital Essen, University Duisburg-Essen, Essen, Germany;‡‡Department of Gastroenterology and Hepatology, Evangelisches Krankenhaus Duisburg-Nord, Duisburg, Germany;§§Department of Medicine I, kkClinical Registry Unit, University Medical Center Johannes Gutenberg University, Mainz,Germany; ¶¶State Key Laboratory in Oncology in South China, Sir Y. K. Pao Centre for Cancer, Department of ClinicalOncology, Chinese University of Hong Kong, Hong Kong Cancer Institute, Hong Kong, China; ##Northern Institute for CancerResearch, Medical School, Newcastle upon Tyne, United Kingdom; ***The Hepatopancreatobiliary Multidisciplinary Team,Newcastle upon Tyne NHS Foundation Trust, The Freeman Hospital, Newcastle upon Tyne, Tyne and Wear, United Kingdom;§§§The Clatterbridge Cancer Centre NHS Foundation Trust, Bebington, Wirral, United Kingdom
BACKGROUND & AIMS: GALAD and BALAD-2 are statistical models for estimating the likelihood of the presence of he-patocellular carcinoma (HCC) in individual patients with chronic liver disease and the survival ofpatients with HCC, respectively. Both models use objective measures, particularly the serummarkersa-fetoprotein (AFP), AFP-L3, anddes-g-carboxyprothrombin.Weaimed tovalidate thesemodels in an international cohort of patients with HCC and assess their clinical performance.
METHODS: We collected data on cancer diagnosis and outcomes of 6834 patients (2430 with HCC and4404 with chronic liver disease) recruited from Germany, Japan, and Hong Kong. We alsocollected data from 229 patients with other hepatobiliary tract cancers (cholangiocarcinomaor pancreatic adenocarcinoma) and 92 healthy individuals (controls). For reference, theoriginal UK cohort (on which the GALAD model initially was built and BALAD-2 was validated)was included in the analysis. We assessed the effects of tumor size and etiology on GALADmodel performance, and its ability to correctly discriminate HCC from other hepatobiliarycancers. We assessed the performance of BALAD-2 in patients with different stages of HCC.
RESULTS: In all cohorts, the area under the receiver operating characteristic curve (AUROC), quanti-fying the ability of GALAD to discriminate patients with HCC from patients with chronic liverdisease, was greater than 0.90—similar to the series on which the model originally was built(AUROC, 0.97). GALAD discriminated patients with HCC from those with other hepatobiliarycancers with an AUROC value of 0.95; values were slightly lower for patients with smallunifocal HCCs, ranging from 0.85 to 0.95. Etiology and treatment of chronic viral hepatitis hadno effect on the performance of this model. BALAD-2 analysis assigned patients with HCC to 4distinct prognostic groups—overall and when patients were stratified according to diseasestage.
Abbreviations used in this paper: AFP, a-fetoprotein; AIC, Akaike infor-mation criterion; AUROC, area under the receiver operating characteristiccurve; CI, confidence interval; CLD, chronic liver disease; DCP, des-gcarboxyprothrombin; HBV, hepatitis B virus; HCC, hepatocellular carci-noma; HCV, hepatitis C virus; ROC, receiver operating characteristic; USS,ultrasound scan.
Most current article
© 2016 by the AGA Institute1542-3565/$36.00
http://dx.doi.org/10.1016/j.cgh.2015.12.042
Clinical Gastroenterology and Hepatology 2016;14:875–886

CONCLUSIONS: We validated the performance of the GALAD and BALAD-2 models for the diagnosis of HCC andpredicting patient survival, respectively (based on levels of the serummarkers AFP, AFP-L3, and des-g-carboxyprothrombin), in an international cohort of almost 7000 patients. These systemsmight beused in HCC surveillance and determination of patient prognosis.
Keywords: Liver Cancer; Prognostic Marker; Diagnostic; Quantification.
We recently developed a serum-based tool(GALAD) for the detection of hepatocellular car-
cinoma (HCC) based on the objective measures ofGender, Age and the 3 serologic biomarkers of a-fetopro-tein (AFP), AFP-L3, and des-g-carboxyprothrombin(DCP),1 all of which are commercially available on a sin-gle standard platform.2 The model has the potential to beused in the surveillance setting and may mitigate some ofthe limitations of ultrasound scanning (USS), includinglimited sensitivity in obese patients and in patientswith advanced cirrhosis. The former is of particularimportance because obesity-related HCC accounts foran increasing percentage of HCC.3–7 However, the modelhas not been validated in other countries where the un-derlying etiology of HCC is different. Although itappeared to perform as well in patients with early dis-ease (defined as tumor size < 5 cm) as it did in patientswith advanced disease, we did not undertake detailedanalysis of the impact of tumor size on the utility ofthe model. This is of importance in the screening settingbecause the earlier the disease is detected the better thechance of curative treatment.
The same 3 biomarkers were combined with liverfunction tests (serum bilirubin and albumin) by Toyodaet al8 to form the BALAD model (Bilirubin, Albumin, AFP-L3, AFP and DCP) for prognostication in HCC. A morerigorous statistical approach generated a second model(BALAD-2) that applied the same variables in a contin-uous rather than a categoric manner,9 but, again, themodel has not been validated in the international settingor at different disease stages.
We describe the application of these 2 models tocohorts from Germany, Japan, and Hong Kong.
Patients and Methods
We used cohorts from Germany, Japan, and Hong Kong(Table 1). Both HCC and chronic liver disease (CLD) co-horts were used for GALAD validation and HCC patientswere used only for BALAD-2 validation. CLD refers to liverdisease that has lasted over a period of 6 months. Table 1also reports the percentage of cases with cirrhosis.
The German cohort came from 4 large centers basedat the University Hospital Essen (collected between 2005and 2008), Hannover Medical High School (collectedbetween 2008 and 2014), Leipzig (Evangelisches Kran-kenhaus Duisburg-Nord, collected between 2010 and2013), and Mainz University Medical Centre (collected
between 2003 and 2012). Overall, they comprised 1278patients (275 HCC and 1003 patients with CLD alone).
The Japanese patients comprised 4476 patients (1514with HCC and 2962 with CLD alone) and these wererecruited from Ogaki Municipal Hospital where theyinitially were diagnosed as having HCC between 1988and 2013.
The Hong Kong cohort (247 HCC patients) wasrecruited from the Prince of Wales Hospital, Departmentof Clinical Oncology, Chinese University of Hong Kongbetween 2009 and 2013.10
For reference, the original UK cohort (on which theGALAD model initially was built and BALAD-2 was vali-dated) was included in the analysis. These patients wererecruited at the Queen Elizabeth Hospital (Birmingham,UK) and the NHS Foundation Trust (Newcastle UponTyne) between 2007 and 2012. The Birmingham cohortcomprised 670 patients (331 with HCC and 339 withCLD alone), and the Newcastle cohort comprised 163patients (63 with HCC and 100 with CLD alone).
We also included 229 patients with other hep-atobiliary tract cancers (cholangiocarcinoma andpancreatic adenocarcinoma) (Table 2), and 92 healthycontrols (Table 1) recruited also from the Queen Eliz-abeth Hospital (Birmingham, UK) between 2006 and2012 and 2009 and 2011 respectively, to test the abilityof the GALAD model to discriminate HCC from otherhepatobiliary cancers and healthy controls. The hep-atobiliary cohort was divided further into 3 subgroups:intrahepatic cholangiocarcinoma, extrahepatic chol-angiocarcinoma, and pancreatic adenocarcinoma.
None of the CLD control group had evidence of HCC atthe time the relevant serum sample was taken or within aminimum follow-up period of 9 months (Table 1). Theywere considered typical of those whowould be included ina surveillance program. In all cohorts, the HCC patients hadthe 3 biomarkers measured within !1.7 months of HCCdiagnosis and before any treatment was administered.
The diagnosis of HCC was made according to inter-national guidelines.3,4 Patients in the control groups hadestablished chronic liver disease (on the basis of liverbiopsy and/or typical clinical and imaging features). Allpatients had the 3 constituent biomarkers measuredusing the mTASWako i30 autoanalyzer (Wako PureChemical Industries, Ltd, Osaka, Japan). Patients withHCC were classified as having early (those receivingpotentially curative therapy), intermediate (intra-arterialtherapies), or advanced disease (systemic chemotherapyor supportive care).
876 Berhane et al Clinical Gastroenterology and Hepatology Vol. 14, No. 6

In Japan, the biomarkers were, in both the HCC andcontrol groups, undertaken as part of a surveillanceprogram. In the other centers, they were collected spe-cifically for this research study. The inclusion criterionwas chronic liver disease (as defined earlier) with thepresence or absence of cirrhosis specified.
In total, 7155 patients (2430 with HCC and 4725 withCLD) were involved in this study.
Assays of a-Fetoprotein, a-Fetoprotein-L3,and Des-g-Carboxyprothrombin
AFP, AFP-L3, and DCP all were measured in the sameserum sample. The measurements of high-sensitivityAFP-L3 (hs-AFP-L3) and DCP were achieved by using amicrochip capillary electrophoresis and liquid-phasebinding assay on a mTASWako i30 autoanalyzer.2 Theanalytical sensitivity of the autoanalyzer is 0.3 ng/mLAFP, and the percentage of AFP-L3 can be measuredwhen AFP is more than 0.3 ng/mL.2
Statistical Methods
Stata IC 12 software was used to perform theanalyses.
GALAD. The GALAD model, as described previously,1
uses the following equation:
Z " #10:08$ 0:09% age$ 1:67% sex
$ 2:34 log10 &AFP' $ 0:04% AFP-L3
$ 1:33% log10 &DCP';
where sex " 1 for males and 0 for females.Taking the exponential (exp) of the linear predictor
(Z), the probability of HCC (Pr(HCC)) in an individualpatient (ranging from 0 to 1) can be estimated using thefollowing equation:
Pr&HCC' " exp&Z'=&1$ exp(Z)':
To estimate sensitivity and specificity, 3 different setsof cut-off points were used in this study, as follows. First,the 3 original cut-off points as specified in the originalGALAD study1 (that were based on the overall UKcohort). Second, using the original UK cohort, 3 new cut-off points were generated using a subset of patients whohad early stage HCC (within Milan Criteria). As in theoriginal study, 1 cut-off point maximizes sensitivity whilekeeping specificity at 80%, the second maximizes speci-ficity while keeping sensitivity at 80%, and the thirdmaximizes the sum of sensitivity and specificity. Third,the same 3 optimized cut-off points, specific for Japanand Germany, also were reported. For Japan, this wasgenerated from a subgroup within Milan Criteria,whereas in Germany this was based on the overall cohortbecause the number of early stage disease patients wastoo small for meaningful analysis.
The effect of tumor size (maximum tumor diameter)and etiology on the performance of the GALAD modelwas tested. Tumor size was recorded on the basis of animaging procedure (computed tomography or magneticresonance imaging scan). Unifocal tumor size rangesapplied were as follows: smaller than 2, smaller than 3,smaller than 4, smaller than 5, and smaller than 10 cm,as well as those within the Milan criteria.
For the purpose of analysis, etiology was classified ashepatitis C virus (HCV)- or hepatitis B virus (HBV)-related, or as other (mainly alcoholic liver disease).Although detailed data on alcohol consumption wereavailable in the Japanese cohort, a distinct diagnosis ofalcoholic cirrhosis was collected only in the UK andGerman cohorts. These were combined under “Europe”to test the performance of the model in an alcoholiccirrhosis cohort for comparison with the other etiologies.The model performance also was tested in HCV patientsdepending on whether or not they had achieved sus-tained viral response status or, in case of HBV, if theywere on active antiviral treatment. Detailed informationwas available only in the Japanese cohort. The number ofcases receiving antiviral therapy in the German cohortwas too small for a meaningful analysis.
By using the GALAD model, the area under thereceiver operating characteristic (ROC) curves (AUROC),sensitivities, and specificities were generated for eachcohort as a whole, and then as subgroups according tothe tumor size and etiology classifications as describedearlier. The 95% confidence intervals (CIs) for theAUROCs were constructed assuming a normal distribu-tion for the area under the curve (asymptotic normalCIs). The performance of the GALAD model also wascompared with that of the individual biomarkers. Theequality of the ROC curves was tested using the methodas described by DeLong et al.11
BALAD-2. Survival was measured from the date of HCCdiagnosis until the date of death or the date of the lastfollow-up evaluation. Patients undergoing transplantation(4.8% and 3.6% of the UK and German cohorts, respec-tively) (Table 1) were not excluded from the analysis.
The BALAD-2 model9 (built on a Japanese cohort andvalidated on a UK cohort), uses the following equation:
Linear predictor " 0:02 * &AFP# 2:57'$ 0:012* AFP-L3–14:19' $ 0:19 * &ln(DCP) # 1:93'$ 0:17 * &(bilirubin1=2) # 4:50'# 0:09 * &albumin# 35:11';
where AFP was capped at 50,000 units. Both AFP andDCP are modeled as per 1000 units. AFP and DCP werein ng/ml. Bilirubin in mmol/L and albumin in g/LS.
To generate the 4 prognostic groups, cut-off pointsapplied to the linear predictor such that if it is greaterthan 0.24 (risk 4, high), 0.24 to greater than -0.91 (risk3), -0.91 to greater than -1.74 (risk 2), and -1.74 or less(risk 1, low).
June 2016 Validation of GALAD and BALAD-2 Score 877
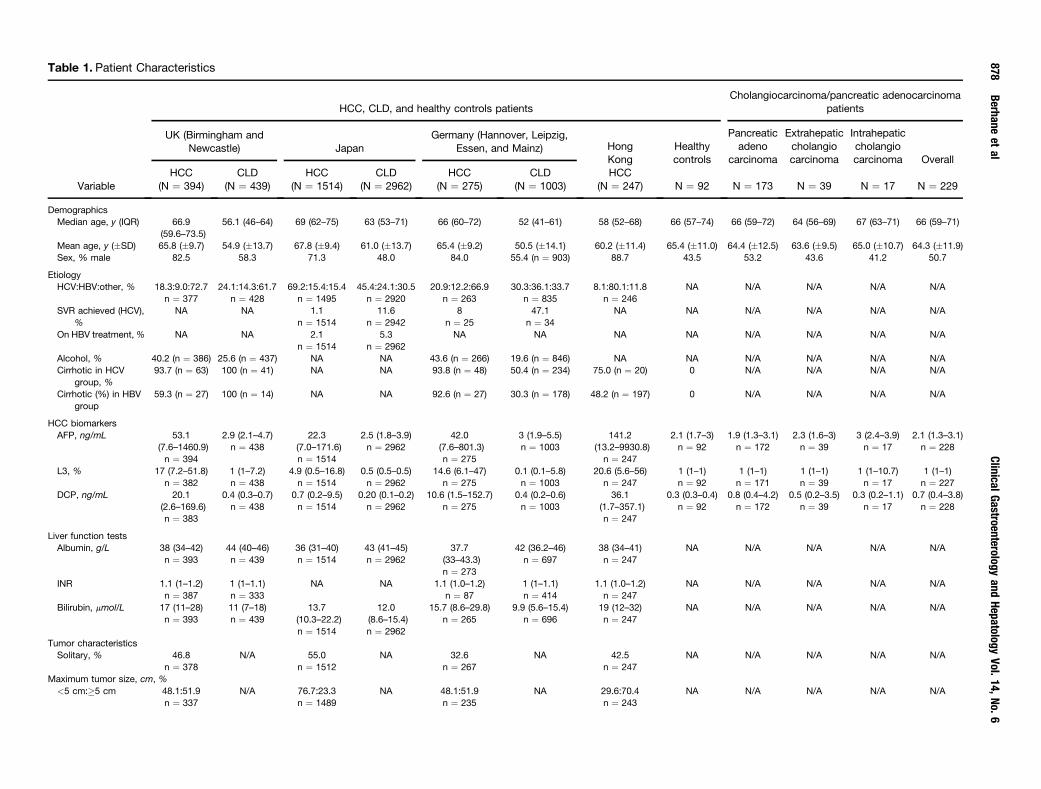
Table 1. Patient Characteristics
Variable
HCC, CLD, and healthy controls patientsCholangiocarcinoma/pancreatic adenocarcinoma
patients
UK (Birmingham andNewcastle) Japan
Germany (Hannover, Leipzig,Essen, and Mainz) Hong
KongHealthycontrols
Pancreaticadeno
carcinoma
Extrahepaticcholangiocarcinoma
Intrahepaticcholangiocarcinoma Overall
HCC(N " 394)
CLD(N " 439)
HCC(N " 1514)
CLD(N " 2962)
HCC(N " 275)
CLD(N " 1003)
HCC(N " 247) N " 92 N " 173 N " 39 N " 17 N " 229
DemographicsMedian age, y (IQR) 66.9
(59.6–73.5)56.1 (46–64) 69 (62–75) 63 (53–71) 66 (60–72) 52 (41–61) 58 (52–68) 66 (57–74) 66 (59–72) 64 (56–69) 67 (63–71) 66 (59–71)
Mean age, y (!SD) 65.8 (!9.7) 54.9 (!13.7) 67.8 (!9.4) 61.0 (!13.7) 65.4 (!9.2) 50.5 (!14.1) 60.2 (!11.4) 65.4 (!11.0) 64.4 (!12.5) 63.6 (!9.5) 65.0 (!10.7) 64.3 (!11.9)Sex, % male 82.5 58.3 71.3 48.0 84.0 55.4 (n " 903) 88.7 43.5 53.2 43.6 41.2 50.7
EtiologyHCV:HBV:other, % 18.3:9.0:72.7
n " 37724.1:14.3:61.7
n " 42869.2:15.4:15.4
n " 149545.4:24.1:30.5
n " 292020.9:12.2:66.9
n " 26330.3:36.1:33.7
n " 8358.1:80.1:11.8
n " 246NA N/A N/A N/A N/A
SVR achieved (HCV),%
NA NA 1.1n " 1514
11.6n " 2942
8n " 25
47.1n " 34
NA NA N/A N/A N/A N/A
On HBV treatment,% NA NA 2.1n " 1514
5.3n " 2962
NA NA NA NA N/A N/A N/A N/A
Alcohol, % 40.2 (n " 386) 25.6 (n " 437) NA NA 43.6 (n " 266) 19.6 (n " 846) NA NA N/A N/A N/A N/ACirrhotic in HCV
group, %93.7 (n " 63) 100 (n " 41) NA NA 93.8 (n " 48) 50.4 (n " 234) 75.0 (n " 20) 0 N/A N/A N/A N/A
Cirrhotic (%) in HBVgroup
59.3 (n " 27) 100 (n " 14) NA NA 92.6 (n " 27) 30.3 (n " 178) 48.2 (n " 197) 0 N/A N/A N/A N/A
HCC biomarkersAFP, ng/mL 53.1
(7.6–1460.9)n " 394
2.9 (2.1–4.7)n " 438
22.3(7.0–171.6)n " 1514
2.5 (1.8–3.9)n " 2962
42.0(7.6–801.3)n " 275
3 (1.9–5.5)n " 1003
141.2(13.2–9930.8)n " 247
2.1 (1.7–3)n " 92
1.9 (1.3–3.1)n " 172
2.3 (1.6–3)n " 39
3 (2.4–3.9)n " 17
2.1 (1.3–3.1)n " 228
L3, % 17 (7.2–51.8)n " 382
1 (1–7.2)n " 438
4.9 (0.5–16.8)n " 1514
0.5 (0.5–0.5)n " 2962
14.6 (6.1–47)n " 275
0.1 (0.1–5.8)n " 1003
20.6 (5.6–56)n " 247
1 (1–1)n " 92
1 (1–1)n " 171
1 (1–1)n " 39
1 (1–10.7)n " 17
1 (1–1)n " 227
DCP, ng/mL 20.1(2.6–169.6)n " 383
0.4 (0.3–0.7)n " 438
0.7 (0.2–9.5)n " 1514
0.20 (0.1–0.2)n " 2962
10.6 (1.5–152.7)n " 275
0.4 (0.2–0.6)n " 1003
36.1(1.7–357.1)n " 247
0.3 (0.3–0.4)n " 92
0.8 (0.4–4.2)n " 172
0.5 (0.2–3.5)n " 39
0.3 (0.2–1.1)n " 17
0.7 (0.4–3.8)n " 228
Liver function testsAlbumin, g/L 38 (34–42)
n " 39344 (40–46)n " 439
36 (31–40)n " 1514
43 (41–45)n " 2962
37.7(33–43.3)n " 273
42 (36.2–46)n " 697
38 (34–41)n " 247
NA N/A N/A N/A N/A
INR 1.1 (1–1.2)n " 387
1 (1–1.1)n " 333
NA NA 1.1 (1.0–1.2)n " 87
1 (1–1.1)n " 414
1.1 (1.0–1.2)n " 247
NA N/A N/A N/A N/A
Bilirubin, mmol/L 17 (11–28)n " 393
11 (7–18)n " 439
13.7(10.3–22.2)n " 1514
12.0(8.6–15.4)n " 2962
15.7 (8.6–29.8)n " 265
9.9 (5.6–15.4)n " 696
19 (12–32)n " 247
NA N/A N/A N/A N/A
Tumor characteristicsSolitary, % 46.8
n " 378N/A 55.0
n " 1512NA 32.6
n " 267NA 42.5
n " 247NA N/A N/A N/A N/A
Maximum tumor size, cm, %<5 cm:+5 cm 48.1:51.9
n " 337N/A 76.7:23.3
n " 1489NA 48.1:51.9
n " 235NA 29.6:70.4
n " 243NA N/A N/A N/A N/A
878Berhane
etal
ClinicalGastroenterology
andHepatology
Vol.14,
No.
6

This equation was applied to all the HCC cohorts andseparation of the prognostic groups assessed byKaplan–Meier survival curves. The utility of the modelalso was tested by applying to subgroups according totreatment delivered.
The prognosis of HCC is widely assumed to bedetermined by underlying liver dysfunction andtumor-related factors. We hypothesized that BALAD-2accurately reflected prognosis because it combinedboth of these, the former through bilirubin and albu-min (BA) and the latter through the 3 biomarkers, AFP-L3, AFP and DCP (LAD). To test this hypothesis we firstassessed the prognostic impact of underlying liverdysfunction, by applying the ALBI (Albumin-Bilirubin)grade, a recently proposed and validated instrumentfor assessing liver function in HCC.12 We then used theEuropean cohort (merged UK and Germany) the testthe extent to which adding the tumor markers, that is,the BALAD model would increase the discriminatoryutility of the ALBI grade using the Harrell-C statis-tic,13,14 and Akaike information criterion (AIC).15
Harrell-C assesses the discriminative ability of themodel by measuring the proportion of patient pairs forwhich the model correctly assigns lower risk to thepatient who truly survives longest (ie, is at least risk).A good discriminative performance corresponds to ahigher C-statistic. AIC measures the relative fit be-tween models for a given set of data. A 4-pointreduction (per additional covariate) is indicative ofan improved model.
Cases with missing data (within bilirubin, albumin,AFP, AFP-L3, DCP, age, and sex) were excluded from theanalysis; however, these made up only 1.7% and 1% ofthe GALAD and BALAD-2 data, respectively.
Results
GALAD
Demographic and clinical details of the cohorts areshown in Table 1.
The model provided an overall AUROC of 0.93 (95%CI, 0.92–0.94) and 0.94 (95% CI, 0.93–0.96) for theJapanese and German validation cohorts, respectively(Supplementary Figure 1A), only marginally lower thanthe figure for the original UK cohort (0.97, 95% CI,0.96–0.98). GALAD also correctly classified HCC fromother hepatobiliary cancers and healthy controls withinthe UK cohort showing AUROCs of 0.95 (95% CI,0.93–0.96) and 0.97 (95% CI, 0.96–0.99), respectively(Supplementary Figure 1B and C). The ROC curve resultsof the hepatobiliary cancer subgroups (pancreaticadenocarcinoma, extrahepatic cholangiocarcinoma, andintrahepatic cholangiocarcinoma) are shown inSupplementary Figure 2. The AUROC derived from themodel was superior (P < .0001) to that obtained if thebiomarkers were used individually (Figure 1A–C). This
<3cm
:3–5cm
:>5
cm21
.1:33.2:45
.7n"
337
N/A
56.4:21.2:22
.4n"
1489
NA
22.6:31.5:46
.0n"
235
NA
14.4:17.3:68
.3n"
243
NA
N/A
N/A
N/A
N/A
Trea
tmen
ts(HCC)
Nn"
313
NA
n"
1513
NA
n"
168
NA
n"
247
NA
N/A
N/A
N/A
N/A
Tran
splantation,
%4.8
03.6
0Res
ectio
n,%
2.6
32.9
4.2
14.6
Ablative,
%10
.526
.93.0
8.1
TACE,
%38
.021
.026
.213
.4Sorafen
ib/
chem
othe
rapy
,%
16.0
1.1
14.3
26.3
Sup
portive,
%22
.713
.514
.337
.7Other
palliative,
%5.4
4.6
34.5
0
Surviva
lMed
ianfollow-up
time,
mo(95%
CI)
31.1
(28.3–
39.8)
n"
387
24.6
(23.0–
29.0)
n"
422
68.4
(60.8–
74.0)
n"
1514
56.4
(n"
2962
)47
.9(43.2–69
.9)
n"
264
31.4
(29.7–33
.4)
n"
295
37.7
(35.3–43
.1)
n"
246
NA
N/A
N/A
N/A
N/A
Ove
rallsu
rvival,mo
(95%
CI)
12.3
(9.8–14
.9)
n"
387
Not
reac
hed
n"
422
45.2
(40.5–
50.1)
n"
1514
Not
reac
hed
n"
2962
12.7
(8.5–16
.4)
n"
264
Not
reac
hed
n"
295
10.8
(5.9–15
.0)
n"
246
NA
N/A
N/A
N/A
N/A
NOTE
.Allco
ntinuo
usva
riables
(exc
eptsu
rvival)a
repres
entedas
med
ian(with
interqua
rtile
rang
e).
CI,co
nfide
nceinterval;INR,interna
tiona
lnormalized
ratio
;IQR,interqu
artilerang
e;N/A,n
otap
plicab
le;NA,n
otav
ailable;
TACE,
Tran
scathe
terarteria
lche
moe
mbo
lization.
June 2016 Validation of GALAD and BALAD-2 Score 879

Table 2. Comparison Between GALAD Model and the Individual HCC Biomarkers
Model/biomarker Cut-off value
All Early HCC (within Milan criteria)
AUC (95% CI)
P value(GALAD vsbiomarker)
Sensitivity,%
Specificity,%
Correctlyclassified, % AUC (95% CI)
P value(GALAD vsbiomarker)
Sensitivity,%
Specificity,%
Correctlyclassified, %
UKGALAD model -0.63 0.97 (0.96–0.98) - 91.6 89.7 90.6 0.93 (0.90–0.96) — 80.2 89.7 87.9AFP 20 ng/mLa 0.88 (0.85–0.90) <.0001 60.7 96.4 79.5 0.84 (0.79–0.89) <.0001 49.1 96.4 86.9AFP-L3 7%a 0.84 (0.82–0.87) <.0001 75.4 73.5 74.4 0.81 (0.76–0.85) <.0001 71.7 73.5 73.2DCP 0.48 ng/mLa 0.90 (0.88–0.93) <.0001 62.4 93.8 79.2 0.81 (0.77–0.86) <.0001 86.8 63.7 68.2AFP $ AFP-L3 $ DCPb Same as above 0.75 (0.72–0.77) <.0001 99.2 50.0 72.9 0.75 (0.72–0.77) <.0001 99.1 50.0 59.6JapanGALAD model -1.95c 0.93 (0.92–0.94) - 81.4 89.1 86.5 0.91 (0.90–0.92) — 82.1 81.6 81.7AFP 20 ng/mLa 0.89 (0.88–0.90) <.0001 51.3 97.3 81.8 0.87 (0.86–0.89) <.0001 42.2 97.3 84.6AFP-L3 7%a 0.75 (0.74–0.77) <.0001 41.2 91.8 74.7 0.71 (0.70–0.73) <.0001 30.0 91.8 77.5DCP 0.48 ng/mLa 0.84 (0.83–0.85) <.0001 57.3 97.4 83.8 0.78 (0.76–0.80) <.0001 41.4 97.4 84.5AFP $ AFP-L3 $ DCPb Same as above 0.84 (0.83–0.85) <.0001 79.3 88.3 85.3 0.80 (0.78–0.81) <.0001 71.2 88.3 84.3GermanyGALAD model -0.68c 0.94 (0.93–0.96) - 88.4 88.2 88.3 NA NA NA NA NAAFP 20 ng/mLa 0.87 (0.85–0.89) <.0001 56.7 93.9 85.9 NA NA NA NA NAAFP-L3 7%a 0.83 (0.80–0.86) <.0001 71.3 79.7 77.9 NA NA NA NA NADCP 0.48 ng/mLa 0.86 (0.83–0.89) <.0001 89.1 64.2 69.6 NA NA NA NA NAAFP $ AFP-L3 $ DCPb Same as above 0.73 (0.71–0.75) <.0001 95.3 54.3 63.2 NA NA NA NA NA
CI, confidence interval.aCut-off points for the 3 biomarkers were based on the guidelines of the Japan Society of Hepatology. For the GALAD model, the optimum cut-off point was set from the ROC analysis.bThe combination (AFP $ AFP-L3 $ DCP) represents the current method of using the markers in Japan. A positive result was recorded if any of the markers exceeded their specified cut-off point.cLocally based cut-off value that maximizes both sensitivity and specificity for GALAD in each cohort. Japan cut-off values were generated from within the Milan subgroup. UK and Germany were based on the whole cohort.
880Berhane
etal
ClinicalGastroenterology
andHepatology
Vol.14,
No.
6

was true both in the cohort overall and within the subsetof early stage HCC patients (within Milan criteria)(Figure 1D and E). Table 2 shows the figures for sensi-tivity, specificity, and the AUROC for all patients as wellas those within the Milan criteria. Cut-off values for theGALAD model in Table 2 maximize the sum of sensitiv-ities and specificities for each cohort.
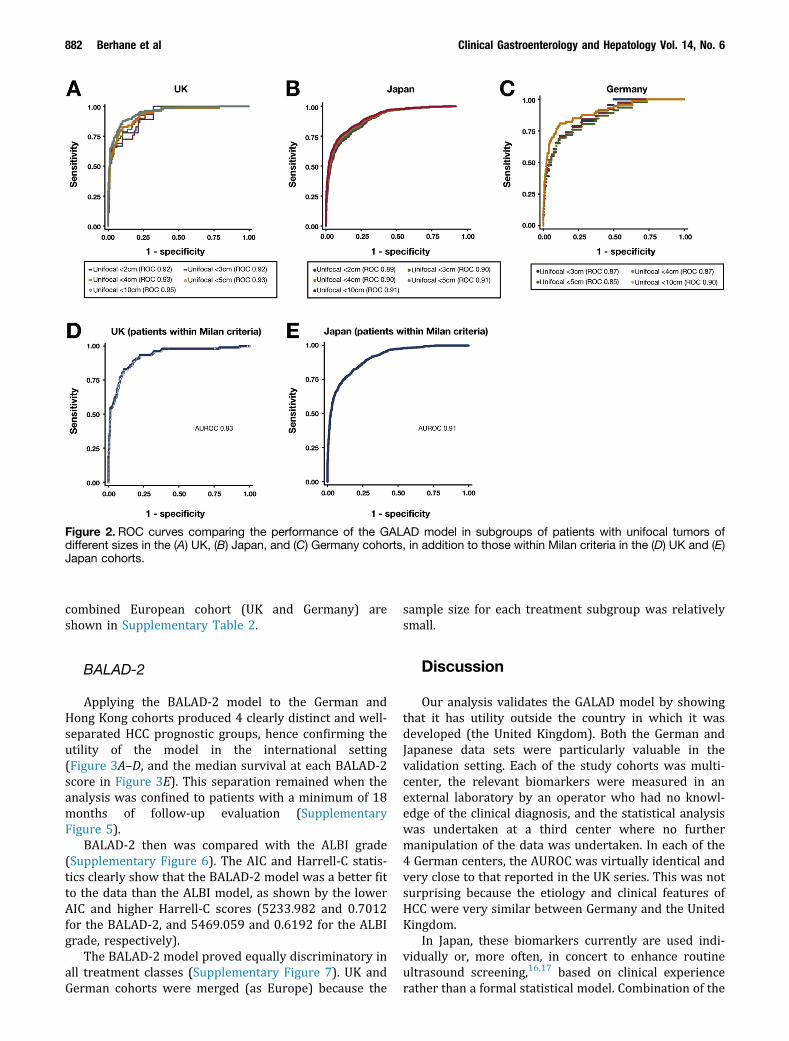
The utility of the model was slightly lower in thesmaller unifocal tumors, but remained in range of 0.85 to0.95 (Figure 2A–C). The AUROCs of patients with lessthan 2-cm unifocal tumors were 0.92 (95% CI,0.85–0.997), 0.89 (95% CI, 0.88–0.91), and 0.93 (95% CI,0.89–0.97) for the United Kingdom, Japan, and Germany,however, in the latter group the numbers were verysmall. Unifocal tumors less than 3 cm in the Germanseries generated an AUROC of 0.87 (95% CI, 0.81–0.94).In those patients who were within Milan criteria, thecorresponding AUROC figures were 0.93 (95% CI,0.90–0.96) and 0.91 (95% CI, 0.90–0.92) in the UnitedKingdom and Japan cohorts, respectively (Figure 2Dand E).
There was no evidence of a difference (P > .05) inmodel performance between HBV, HCV, and other
subgroups in the European cohorts. Although there wassome evidence of difference between the etiologies in theJapanese cohort (P " .0012), this was unlikely to be ofclinical significance because the figures ranged only be-tween 0.92 and 0.95 (Supplementary Figure 3A–C).Because of lower numbers of HCV and HBV subgroupswithin the UK and German cohorts, these were combinedunder “Europe” and the alcoholic etiology subgroup wasadded before generating GALAD AUROC curves(Supplementary Figure 3D). This showed that the GALADmodel performed equally well (P " .7490) in all 4 etio-logic subgroups.
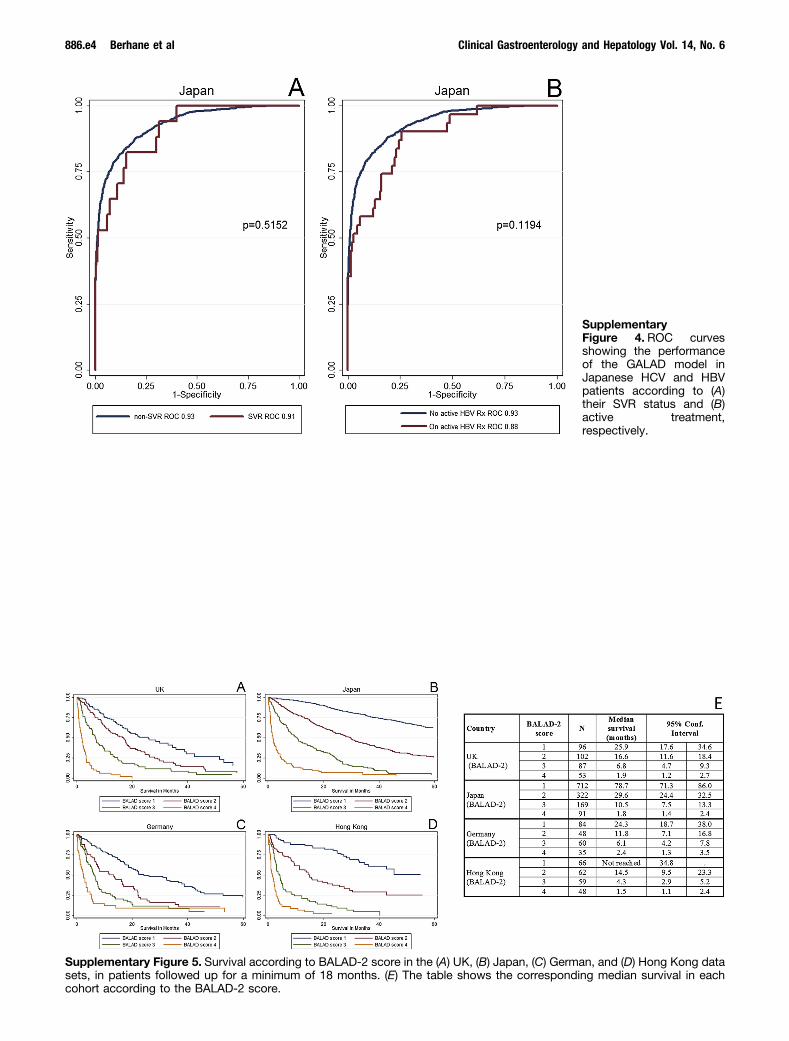
In the Japanese series, performance of the GALADmodel was not affected (P > .1) by the status of sus-tained viral response or active viral treatment in HCVand HBV patients, respectively (SupplementaryFigure 4).
The AUROC values as well as the sensitivity, speci-ficity, and correctly classified percentages at the differentcut-off values (whole cohort and subgroups) are sum-marized in Table 3 (UK-based cut-off values) andSupplementary Table 1 (country-specific cut-off values).The same data for the different etiologies in the
Figure 1. ROC curves comparing the overall performance of the GALAD model with the individual biomarkers in the (A) UK, (B)Japan, and (C) German cohorts, as well as in early stage HCC (within Milan criteria) in the (D) UK and (E) Japan cohorts.
June 2016 Validation of GALAD and BALAD-2 Score 881
combined European cohort (UK and Germany) areshown in Supplementary Table 2.
BALAD-2
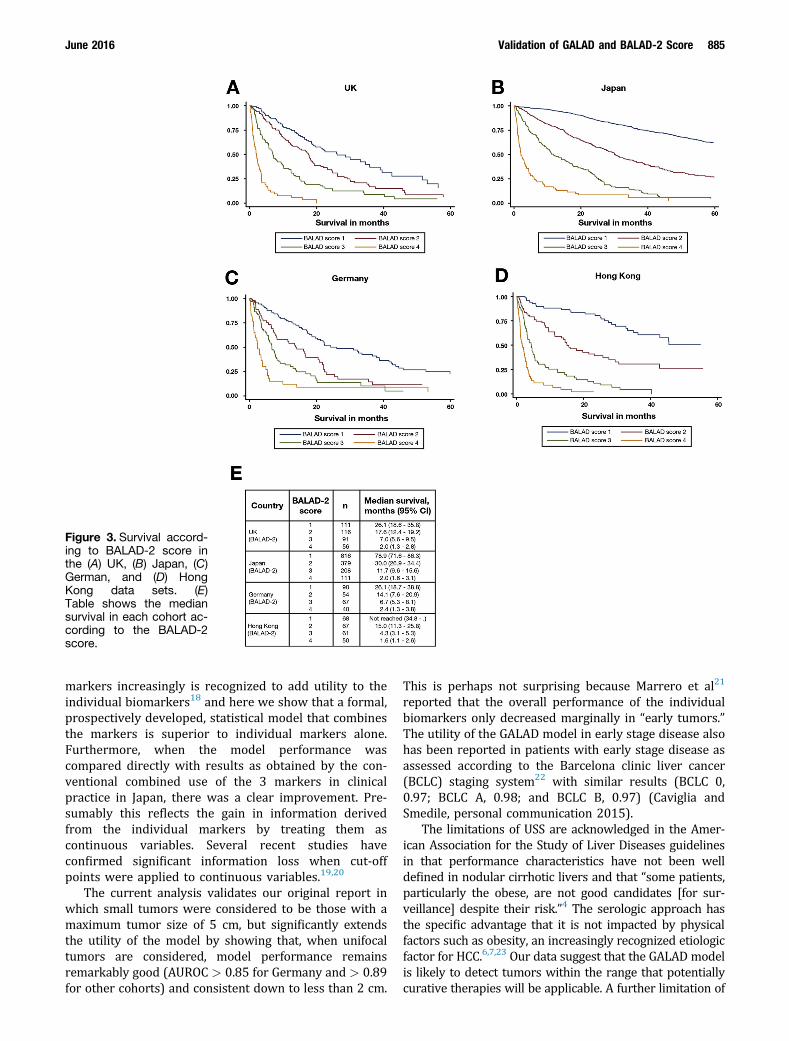
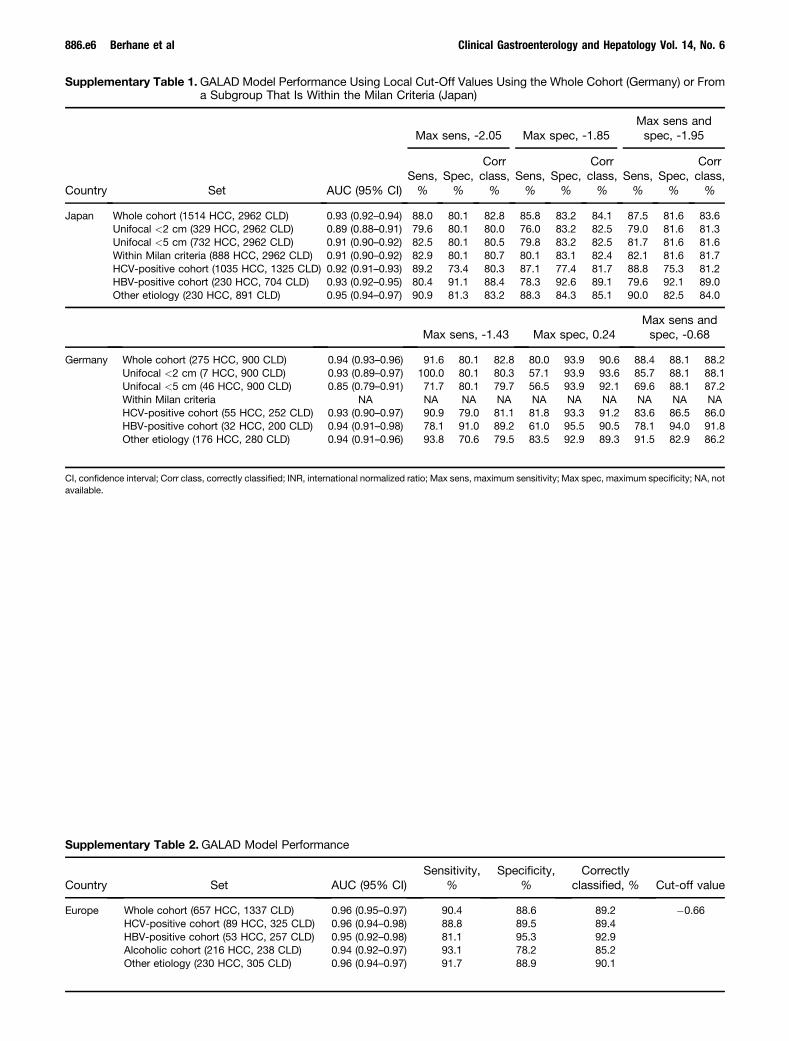
Applying the BALAD-2 model to the German andHong Kong cohorts produced 4 clearly distinct and well-separated HCC prognostic groups, hence confirming theutility of the model in the international setting(Figure 3A–D, and the median survival at each BALAD-2score in Figure 3E). This separation remained when theanalysis was confined to patients with a minimum of 18months of follow-up evaluation (SupplementaryFigure 5).
BALAD-2 then was compared with the ALBI grade(Supplementary Figure 6). The AIC and Harrell-C statis-tics clearly show that the BALAD-2 model was a better fitto the data than the ALBI model, as shown by the lowerAIC and higher Harrell-C scores (5233.982 and 0.7012for the BALAD-2, and 5469.059 and 0.6192 for the ALBIgrade, respectively).
The BALAD-2 model proved equally discriminatory inall treatment classes (Supplementary Figure 7). UK andGerman cohorts were merged (as Europe) because the
sample size for each treatment subgroup was relativelysmall.
Discussion
Our analysis validates the GALAD model by showingthat it has utility outside the country in which it wasdeveloped (the United Kingdom). Both the German andJapanese data sets were particularly valuable in thevalidation setting. Each of the study cohorts was multi-center, the relevant biomarkers were measured in anexternal laboratory by an operator who had no knowl-edge of the clinical diagnosis, and the statistical analysiswas undertaken at a third center where no furthermanipulation of the data was undertaken. In each of the4 German centers, the AUROC was virtually identical andvery close to that reported in the UK series. This was notsurprising because the etiology and clinical features ofHCC were very similar between Germany and the UnitedKingdom.
In Japan, these biomarkers currently are used indi-vidually or, more often, in concert to enhance routineultrasound screening,16,17 based on clinical experiencerather than a formal statistical model. Combination of the
Figure 2. ROC curves comparing the performance of the GALAD model in subgroups of patients with unifocal tumors ofdifferent sizes in the (A) UK, (B) Japan, and (C) Germany cohorts, in addition to those within Milan criteria in the (D) UK and (E)Japan cohorts.
882 Berhane et al Clinical Gastroenterology and Hepatology Vol. 14, No. 6

Table 3.GALAD Model Performance
Country Set AUC (95% CI)
Original cut-off values Cut-off values based on UK patients within Milan Criteria
Max sens, -1.36 Max spec, 0.88Max sens andspec, -0.63 Max sens, -1.54 Max spec, -0.59
Max sens andspec, -0.77
Sens,%
Spec,%
Corrclass,%
Sens,%
Spec,%
Corrclass,%
Sens,%
Spec,%
Corrclass,%
Sens,%
Spec,%
Corrclass,%
Sens,%
Spec,%
Corrclass,%
Sens,%
Spec,%
Corrclass,%
UK Whole cohort(382 HCC, 437 CLD)
0.97 (CI, 0.96–0.98) 94.8 83.1 88.5 77.2 97.5 88.0 91.6 89.7 90.6 96.1 80.1 87.6 91.6 90.2 90.8 92.7 88.8 90.6
Unifocal <2 cm(9 HCC, 437 CLD)
0.92 (0.85–0.997) 77.8 83.1 83.0 55.6 97.5 96.6 77.8 89.7 89.5 77.8 80.1 80.0 77.8 90.2 89.9 77.8 88.8 88.6
Unifocal <3 cm(29 HCC, 437 CLD)
0.92 (0.88–0.96) 72.4 83.1 82.4 58.6 97.5 95.1 72.4 89.7 88.6 82.8 80.1 80.3 72.4 90.2 89.1 72.4 88.8 87.8
Unifocal <4 cm(52 HCC, 437 CLD)
0.93 (0.90–0.96) 80.8 83.1 82.8 51.9 97.5 92.6 78.9 89.7 88.6 88.5 80.1 81.0 78.9 90.2 89.0 78.9 88.8 87.7
Unifocal <5 cm(75 HCC, 437 CLD)
0.93 (0.90–0.96) 84.0 83.1 83.2 57.3 97.5 91.6 82.7 89.7 88.7 89.3 80.1 81.5 82.7 90.2 89.1 82.7 88.8 87.9
Unifocal <10 cm(127 HCC, 437 CLD)
0.95 (0.93–0.97) 89.0 83.1 84.4 65.4 97.5 90.3 87.4 89.7 89.2 92.9 80.1 83.0 87.4 90.2 89.5 87.4 88.8 88.5
Within Milan criteria(106 HCC, 437 CLD)
0.93 (0.90–0.96) 85.9 83.1 83.6 54.7 97.5 89.1 80.2 89.7 87.9 90.6 80.1 82.1 80.2 90.2 88.2 83.0 88.8 87.7
HCV-positive cohort(67 HCC, 103 CLD)
0.98 (0.97–1.0) 95.5 87.4 90.6 77.6 99.0 90.6 91.0 94.2 92.9 97.0 85.4 90.0 91.0 95.2 93.5 94.0 94.2 94.1
HBV-positive cohort(33 HCC, 61 CLD)
0.99 (0.96–1.00) 93.9 100.0 97.9 69.7 100.0 89.4 87.9 100.0 95.7 93.9 98.4 96.8 87.9 100.0 95.7 87.9 100.0 95.7
Other etiology(267 HCC, 262 CLD)
0.96 (0.95–0.98) 95.5 77.5 86.6 78.7 96.2 87.3 92.5 85.5 89.0 96.3 73.7 85.1 92.5 86.3 89.4 93.3 84.4 88.9
Japan Whole cohort(1514 HCC, 2962 CLD)
0.93 (0.92–0.94) 79.9 90.0 86.6 50.1 99.1 82.5 70.5 95.8 87.2 81.9 87.7 85.8 69.6 96.1 87.1 72.5 94.9 87.3
Unifocal <2 cm(329 HCC, 2962 CLD)
0.89 (0.88–0.91) 68.7 90.0 87.9 27.7 99.1 91.9 54.4 95.8 91.7 71.1 87.7 86.1 53.2 96.0 91.7 56.5 94.9 91.0
Unifocal <3 cm(554 HCC, 2962 CLD)
0.90 (0.88–0.91) 70.8 90.0 87.0 31.8 99.1 88.5 58.1 95.8 89.9 72.7 87.7 85.4 56.7 96.0 89.8 60.3 94.9 89.4
Unifocal <4 cm(672 HCC, 2962 CLD)
0.90 (0.89–0.92) 72.5 90.0 86.8 33.6 99.1 87.0 59.8 95.8 89.2 74.6 87.7 85.3 58.2 96.0 89.0 62.2 94.9 88.8
Unifocal <5 cm(732 HCC, 2962 CLD)
0.91 (0.90–0.92) 73.1 90.0 86.7 35.1 99.1 86.4 60.4 95.8 88.8 75.1 87.7 85.3 58.9 96.0 88.6 62.6 94.9 88.5
Unifocal <10 cm(810 HCC, 2962 CLD)
0.91 (0.90–0.92) 74.2 90.0 86.6 38.0 99.1 86.0 62.6 95.8 88.7 76.2 87.7 85.3 61.2 96.0 88.5 64.6 94.9 88.4
Within Milan criteria(888 HCC, 2962 CLD)
0.91 (0.90–0.92) 72.5 90.0 86.0 33.8 99.1 84.0 60.6 95.8 87.7 75.2 87.7 84.9 59.1 96.0 87.5 63.5 94.9 87.6
0.91 (0.84–0.97) 52.9 97.1 95.0 35.3 99.7 96.7 41.2 99.1 96.4 52.9 95.9 93.9 41.2 99.1 96.4 41.2 99.0 96.2
June2016
Validationof
GALA
Dand
BALA
D-2
Score883

Table 3. Continued
Country Set AUC (95% CI)
Original cut-off values Cut-off values based on UK patients within Milan Criteria
Max sens, -1.36 Max spec, 0.88Max sens andspec, -0.63 Max sens, -1.54 Max spec, -0.59
Max sens andspec, -0.77
Sens,%
Spec,%
Corrclass,%
Sens,%
Spec,%
Corrclass,%
Sens,%
Spec,%
Corrclass,%
Sens,%
Spec,%
Corrclass,%
Sens,%
Spec,%
Corrclass,%
Sens,%
Spec,%
Corrclass,%
Achieved SVRa
(17 HCC, 341 CLD)Non-SVRa
(1497 HCC, 2601 CLD)0.93 (0.92–0.94) 80.2 89.0 85.8 50.2 98.9 81.1 70.8 95.4 86.4 82.2 86.6 85.0 70.0 95.5 86.2 72.9 94.3 86.5
On active HBV Rxb
(31 HCC, 156 CLD)0.88 (0.82–0.94) 51.6 97.4 89.8 35.5 100.0 89.3 35.5 98.7 88.2 51.6 96.2 88.8 35.5 98.7 88.2 39.5 98.7 89.0
No HBV Rxb
(1483 HCC, 2806 CLD)0.93 (0.92–0.94) 80.5 89.6 86.5 50.4 99.0 82.2 71.2 95.7 87.2 82.5 87.3 85.6 70.3 95.8 87.0 73.2 94.7 87.3
HCV-positive cohort(1035 HCC, 1325 CLD)
0.92 (0.91–0.93) 81.5 85.4 83.6 47.5 98.4 76.1 71.1 93.6 83.7 83.2 82.6 82.8 70.1 93.7 83.4 73.6 92.2 84.1
HBV-positive cohort(230 HCC, 704 CLD)
0.93 (0.92–0.95) 73.5 95.7 90.3 54.8 99.4 88.4 62.6 97.3 88.8 74.4 95.0 89.9 61.7 97.7 88.9 64.4 96.9 88.9
Other etiology(230 HCC, 891 CLD)
0.95 (0.94–0.97) 80.9 92.4 90.0 57.0 99.7 90.9 76.5 98.1 93.7 83.9 89.6 88.4 76.1 98.2 93.7 76.5 97.2 93.0
Germany Whole cohort(275 HCC, 900 CLD)
0.94 (0.93–0.96) 91.6 81.3 83.7 75.3 95.8 91.0 87.6 88.6 88.3 91.6 79.2 82.1 87.3 88.8 88.4 89.1 86.8 87.3
Unifocal <2 cm(7 HCC, 900 CLD)
0.93 (0.89–0.97) 100.0 81.3 81.5 42.9 95.8 95.4 71.4 88.6 88.4 100.0 79.2 79.4 71.4 88.8 88.6 85.7 86.8 86.8
Unifocal <3 cm(23 HCC, 900 CLD)
0.87 (0.81–0.94) 73.9 81.3 81.2 47.8 95.8 94.6 65.2 88.6 88.0 73.9 79.2 79.1 65.2 88.8 88.2 69.6 86.8 86.4
Unifocal <4 cm(38 HCC, 900 CLD)
0.87 (0.81–0.93) 73.7 81.3 81.0 50.0 95.8 93.9 68.4 88.6 87.7 73.7 79.2 79.0 68.4 88.8 87.9 71.1 86.8 86.1
Unifocal <5 cm(46 HCC, 900 CLD)
0.85 (0.79–0.91) 71.7 81.3 80.9 52.2 95.8 93.7 67.4 88.6 87.5 71.7 79.2 78.9 67.4 88.8 87.7 69.6 86.8 85.9
Unifocal <10 cm(73 HCC, 900 CLD)
0.90 (0.86–0.94) 82.2 81.3 81.4 64.4 95.8 93.4 79.5 88.6 87.9 82.2 79.2 79.5 79.5 88.8 88.1 80.8 86.8 86.3
Within Milan criteria NA NA NA NA NA NA NA NA NA NA NA NA NA NA NA NA NA NA NAHCV-positive cohort
(55 HCC, 252 CLD)0.93 (0.90–0.97) 90.9 79.8 81.8 76.4 95.0 91.7 83.6 87.3 86.6 90.9 78.6 80.8 83.6 87.5 86.8 85.5 84.9 85.0
HBV-positive cohort(32 HCC, 200 CLD)
0.94 (0.91–0.98) 78.1 92.0 90.1 59.4 96.3 91.2 75.0 94.0 91.4 78.1 90.0 88.4 75.0 94.0 91.4 78.1 93.8 91.7
Other etiology(176 HCC, 280 CLD)
0.94 (0.91–0.96) 93.8 72.5 80.7 77.8 95.4 88.6 91.5 83.9 86.7 93.8 69.3 78.7 91.5 84.3 87.1 92.1 80.5 85.0
CI, confidence interval; Corr class, correctly classified; Max sens, maximum sensitivity; Max spec, maximum specificity; NA, not available; Rx, treatment; SVR, sustained viral response.aP " .5152.bP " .1194.
884Berhane
etal
ClinicalGastroenterology
andHepatology
Vol.14,
No.
6
markers increasingly is recognized to add utility to theindividual biomarkers18 and here we show that a formal,prospectively developed, statistical model that combinesthe markers is superior to individual markers alone.Furthermore, when the model performance wascompared directly with results as obtained by the con-ventional combined use of the 3 markers in clinicalpractice in Japan, there was a clear improvement. Pre-sumably this reflects the gain in information derivedfrom the individual markers by treating them ascontinuous variables. Several recent studies haveconfirmed significant information loss when cut-offpoints were applied to continuous variables.19,20
The current analysis validates our original report inwhich small tumors were considered to be those with amaximum tumor size of 5 cm, but significantly extendsthe utility of the model by showing that, when unifocaltumors are considered, model performance remainsremarkably good (AUROC > 0.85 for Germany and > 0.89for other cohorts) and consistent down to less than 2 cm.
This is perhaps not surprising because Marrero et al21
reported that the overall performance of the individualbiomarkers only decreased marginally in “early tumors.”The utility of the GALAD model in early stage disease alsohas been reported in patients with early stage disease asassessed according to the Barcelona clinic liver cancer(BCLC) staging system22 with similar results (BCLC 0,0.97; BCLC A, 0.98; and BCLC B, 0.97) (Caviglia andSmedile, personal communication 2015).
The limitations of USS are acknowledged in the Amer-ican Association for the Study of Liver Diseases guidelinesin that performance characteristics have not been welldefined in nodular cirrhotic livers and that “some patients,particularly the obese, are not good candidates [for sur-veillance] despite their risk.”4 The serologic approach hasthe specific advantage that it is not impacted by physicalfactors such as obesity, an increasingly recognized etiologicfactor for HCC.6,7,23 Our data suggest that the GALAD modelis likely to detect tumors within the range that potentiallycurative therapies will be applicable. A further limitation of
Figure 3. Survival accord-ing to BALAD-2 score inthe (A) UK, (B) Japan, (C)German, and (D) HongKong data sets. (E)Table shows the mediansurvival in each cohort ac-cording to the BALAD-2score.
June 2016 Validation of GALAD and BALAD-2 Score 885
USS is that other primary liver tumors may be detected. Ina recent analysis of surveillance in Japan (1994–2005),4.4% of detected hepatic tumors ultimately were classifiedas cholangiocarcinoma.24 Our data suggest that the GALADmodel can discriminate successfully between HCC andcholangiocarcinoma (Supplementary Figures 1B and 2).
Having validated the GALAD model, it now requirestesting in a prospective manner and we are aware that the3 tumor markers involved in GALAD currently are beingassessed prospectively in clinical trials in North America.From these it will be possible to assess the potential roleof the GALAD model in the clinical surveillance setting.
Our analysis supports the clinically plausible viewthat the prognostic power of the BALAD-2 model is basedon its ability to reflect both the degree of underlying liverdysfunction (bilirubin and albumin) and tumor-relatedfactors (LAD). The general applicability of the model isunderlined by the observation that discrimination isequally good, irrespective to the treatment applied.
Supplementary Material
Note: To access the supplementary material accom-panying this article, visit the online version of ClinicalGastroenterology and Hepatology at www.cghjournal.org,and at http://dx.doi.org/10.1016/j.cgh.2015.12.042.
References1. Johnson PJ, Pirrie SJ, Cox TF, et al. The detection of hepato-
cellular carcinoma using a prospectively developed and vali-dated model based on serological biomarkers. CancerEpidemiol Biomarkers Prev 2014;23:144–153.
2. Kagebayashi C, Yamaguchi I, Akinaga A, et al. Automatedimmunoassay system for AFP–L3% using on-chip electrokineticreaction and separation by affinity electrophoresis. Anal Bio-chem 2009;388:306–311.
3. Bruix J, Sherman M. Management of hepatocellular carcinoma.Hepatology 2005;42:1208–1236.
4. Bruix J, Sherman M. Management of hepatocellular carcinoma:an update. Hepatology 2011;53:1020–1022.
5. Bolondi L, Sofia S, Siringo S, et al. Surveillance programme ofcirrhotic patients for early diagnosis and treatment of hepatocellularcarcinoma: a cost effectiveness analysis. Gut 2001;48:251–259.
6. Dyson J, Jaques B, Chattopadyhay D, et al. Hepatocellularcancer: the impact of obesity, type 2 diabetes and a multidis-ciplinary team. J Hepatol 2014;60:110–117.
7. Siegel AB, Zhu AX. Metabolic syndrome and hepatocellularcarcinoma: two growing epidemics with a potential link. Cancer2009;115:5651–5661.
8. Toyoda H, Kumada T, Osaki Y, et al. Staging hepatocellularcarcinoma by a novel scoring system (BALAD score) based onserum markers. Clin Gastroenterol Hepatol 2006;4:1528–1536.
9. Fox R, Berhane S, Teng M, et al. Biomarker-based prognosis inhepatocellular carcinoma: validation and extension of theBALAD model. Br J Cancer 2014;110:2090–2098.
10. Chan SL, Mo F, Johnson P, et al. Applicability of BALAD score inprognostication of hepatitis B-related hepatocellular carcinoma.J Gastroenterol Hepatol 2015;30:1529–1535.
11. DeLong ER, DeLong DM, Clarke-Pearson DL. Comparing theareas under two or more correlated receiver operating
characteristic curves: a nonparametric approach. Biometrics1988;44:837–845.
12. JohnsonPJ, BerhaneS, Kagebayashi C, et al. Assessment of liverfunction in patients with hepatocellular carcinoma: a newevidence-based approach-the ALBI grade. J Clin Oncol 2015;33:550–558.
13. Newson RB. Comparing the predictive powers of survivalmodels using Harrell’s C or Somers’ D. Stata J 2010;10:339.
14. Taktak AFG, Eleuteri A, Lake SP, et al. Evaluation of prognosticmodels: discrimination and calibration performance. In: Pro-ceedings of the 3rd International Conference on ComputationalIntelligence in Medicine and Healthcare, 2007.
15. Akaike H. Information theory as an extension of the maximumlikelihood principle. In Petrov BN, ed. Second internationalsymposium on information theory. 1973.
16. The Japan Society of Hepatology. Chapter 2: diagnosis andsurveillance. Hepatol Res 2010;40:16–47.
17. Kudo M, Matsui O, Izumi N, et al. JSH consensus-based clinicalpractice guidelines for the management of hepatocellular car-cinoma: 2014 update by the Liver Cancer Study Group of Japan.Liver Cancer 2014;3:458–468.
18. Ertle JM, Heider D, Wichert M, et al. A combination of a-feto-protein and des-g-carboxy prothrombin is superior in detectionof hepatocellular carcinoma. Digestion 2013;87:121–131.
19. Del Priore G, Zandieh P, Lee M-J. Treatment of continuous dataas categoric variables in obstetrics and gynecology. ObstetGynecol 1997;89:351–354.
20. Royston P, Altman DG, Sauerbrei W. Dichotomizing continuouspredictors in multiple regression: a bad idea. Stat Med 2006;25:127–141.
21. Marrero JA, Feng Z, Wang Y, et al. Alpha-fetoprotein,des-gamma carboxyprothrombin, and lectin-bound alpha-fetoprotein in early hepatocellular carcinoma. Gastroenterology2009;137:110–118.
22. Caviglia GP, Abate ML, Petrini E, et al. Highly sensitivealpha-fetoprotein, Lens culinaris agglutinin-reactive fraction ofalpha-fetoprotein and des-gamma-carboxyprothrombin for he-patocellular carcinoma detection. Hepatol Res 2015;17:12544.
23. Singal A, Volk ML, Waljee A, et al. Meta-analysis: surveillancewith ultrasound for early-stage hepatocellular carcinoma in pa-tients with cirrhosis. Aliment Pharmacol Ther 2009;30:37–47.
24. Ikai I, Kudo M, Arii S, et al. Report of the 18th follow-upsurvey of primary liver cancer in Japan. Hepatol Res 2010;40:1043–1059.
Reprint requestsAddress requests for reprints to: Philip Johnson, MD, Department of Molecularand Clinical Cancer Medicine, The Duncan Building, Daulby Street, LiverpoolL69 3GA, United Kingdom. e-mail: [email protected]; fax: (0151)706-5826.
AcknowledgmentsThe authors thank Janet Morse (University of Birmingham), and Judith Ertle andHanife Bilgi (Department of Gastroenterology and Hepatology, UniversityHospital Essen, University Duisburg-Essen). The authors also thank SandraKoch (University Medical Center, Johannes Gutenberg University) for dataentry and database queries.
Some of these data were reported in abstract form at The Liver Meeting,the 64th Annual Meeting of the American Association for the Study of LiverDiseases 2013, and the European Association for the Study of the Liver annualmeeting 2015.
Conflicts of interestThe authors disclose no conflicts.
FundingSome of the statistical analysis was funded by Liverpool Health Partners.
886 Berhane et al Clinical Gastroenterology and Hepatology Vol. 14, No. 6
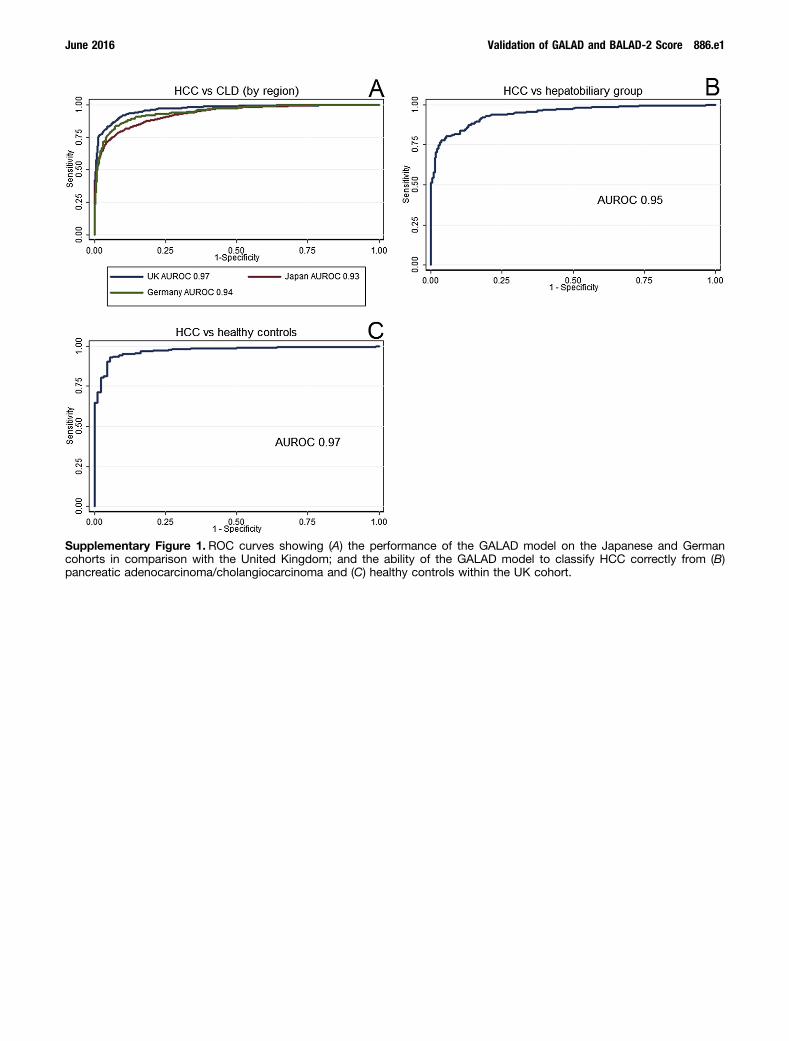
Supplementary Figure 1. ROC curves showing (A) the performance of the GALAD model on the Japanese and Germancohorts in comparison with the United Kingdom; and the ability of the GALAD model to classify HCC correctly from (B)pancreatic adenocarcinoma/cholangiocarcinoma and (C) healthy controls within the UK cohort.
June 2016 Validation of GALAD and BALAD-2 Score 886.e1

Supplementary Figure 2. ROC curves showing the ability of the GALAD model to classify HCC correctly from (A) pancreaticadenocarcinoma, (B) extrahepatic cholangiocarcinoma, and (C) intrahepatic cholangiocarcinoma in the UK cohort.
886.e2 Berhane et al Clinical Gastroenterology and Hepatology Vol. 14, No. 6

Supplementary Figure 3. ROC curves showing the performance of the GALAD model in the different etiologies (HCV, HBV,alcohol, and other) of (A) UK, (B) Japan, (C) Germany, and (D) Europe (UK and Germany combined).
June 2016 Validation of GALAD and BALAD-2 Score 886.e3
SupplementaryFigure 4. ROC curvesshowing the performanceof the GALAD model inJapanese HCV and HBVpatients according to (A)their SVR status and (B)active treatment,respectively.
Supplementary Figure 5. Survival according to BALAD-2 score in the (A) UK, (B) Japan, (C) German, and (D) Hong Kong datasets, in patients followed up for a minimum of 18 months. (E) The table shows the corresponding median survival in eachcohort according to the BALAD-2 score.
886.e4 Berhane et al Clinical Gastroenterology and Hepatology Vol. 14, No. 6

Supplementary Figure 6. Survival in Europe (UK and Germany) according to the (A) ALBI grade and the (B) BALAD-2 score.(C) The table shows the corresponding median survival in months at each score/grade.
Supplementary Figure 7. Survival according to the BALAD-2 score in Japanese patients undergoing (A) curative, (B) inter-mediate, and (C) palliative treatments. (D–F) The corresponding graphs for Europe (UK and Germany) are shown. (G) The tableshows the median survival in each treatment group according to the BALAD-2 score.
June 2016 Validation of GALAD and BALAD-2 Score 886.e5
Supplementary Table 1. GALAD Model Performance Using Local Cut-Off Values Using the Whole Cohort (Germany) or Froma Subgroup That Is Within the Milan Criteria (Japan)
Country Set AUC (95% CI)
Max sens, -2.05 Max spec, -1.85Max sens andspec, -1.95
Sens,%
Spec,%
Corrclass,%
Sens,%
Spec,%
Corrclass,%
Sens,%
Spec,%
Corrclass,%
Japan Whole cohort (1514 HCC, 2962 CLD) 0.93 (0.92–0.94) 88.0 80.1 82.8 85.8 83.2 84.1 87.5 81.6 83.6Unifocal <2 cm (329 HCC, 2962 CLD) 0.89 (0.88–0.91) 79.6 80.1 80.0 76.0 83.2 82.5 79.0 81.6 81.3Unifocal <5 cm (732 HCC, 2962 CLD) 0.91 (0.90–0.92) 82.5 80.1 80.5 79.8 83.2 82.5 81.7 81.6 81.6Within Milan criteria (888 HCC, 2962 CLD) 0.91 (0.90–0.92) 82.9 80.1 80.7 80.1 83.1 82.4 82.1 81.6 81.7HCV-positive cohort (1035 HCC, 1325 CLD) 0.92 (0.91–0.93) 89.2 73.4 80.3 87.1 77.4 81.7 88.8 75.3 81.2HBV-positive cohort (230 HCC, 704 CLD) 0.93 (0.92–0.95) 80.4 91.1 88.4 78.3 92.6 89.1 79.6 92.1 89.0Other etiology (230 HCC, 891 CLD) 0.95 (0.94–0.97) 90.9 81.3 83.2 88.3 84.3 85.1 90.0 82.5 84.0
Max sens, -1.43 Max spec, 0.24Max sens andspec, -0.68
Germany Whole cohort (275 HCC, 900 CLD) 0.94 (0.93–0.96) 91.6 80.1 82.8 80.0 93.9 90.6 88.4 88.1 88.2Unifocal <2 cm (7 HCC, 900 CLD) 0.93 (0.89–0.97) 100.0 80.1 80.3 57.1 93.9 93.6 85.7 88.1 88.1Unifocal <5 cm (46 HCC, 900 CLD) 0.85 (0.79–0.91) 71.7 80.1 79.7 56.5 93.9 92.1 69.6 88.1 87.2Within Milan criteria NA NA NA NA NA NA NA NA NA NAHCV-positive cohort (55 HCC, 252 CLD) 0.93 (0.90–0.97) 90.9 79.0 81.1 81.8 93.3 91.2 83.6 86.5 86.0HBV-positive cohort (32 HCC, 200 CLD) 0.94 (0.91–0.98) 78.1 91.0 89.2 61.0 95.5 90.5 78.1 94.0 91.8Other etiology (176 HCC, 280 CLD) 0.94 (0.91–0.96) 93.8 70.6 79.5 83.5 92.9 89.3 91.5 82.9 86.2
CI, confidence interval; Corr class, correctly classified; INR, international normalized ratio; Max sens, maximum sensitivity; Max spec, maximum specificity; NA, notavailable.
Supplementary Table 2.GALAD Model Performance
Country Set AUC (95% CI)Sensitivity,
%Specificity,
%Correctly
classified, % Cut-off value
Europe Whole cohort (657 HCC, 1337 CLD) 0.96 (0.95–0.97) 90.4 88.6 89.2 #0.66HCV-positive cohort (89 HCC, 325 CLD) 0.96 (0.94–0.98) 88.8 89.5 89.4HBV-positive cohort (53 HCC, 257 CLD) 0.95 (0.92–0.98) 81.1 95.3 92.9Alcoholic cohort (216 HCC, 238 CLD) 0.94 (0.92–0.97) 93.1 78.2 85.2Other etiology (230 HCC, 305 CLD) 0.96 (0.94–0.97) 91.7 88.9 90.1
886.e6 Berhane et al Clinical Gastroenterology and Hepatology Vol. 14, No. 6


![[XLS]Office 2007 XLSX · Web view02622 ГО43-150-02 У1 Хорс : кр.симм. (G12) GALAD 00470 ИСУ02-5000-/К23 -01 : симметр. GALAD 00466 ИО04-500-002 : симметр](https://img.pdfslide.net/doc/110x75/5aad00037f8b9a8d678d9849/xlsoffice-2007-xlsx-view02622-43-150-02-1-g12.jpg)