Embed Size (px)
Citation preview
Rolling Resistance Demonstrations
A car with no engine rolls to a stop on a flat road. The drag that stops the car is a combination of energy loss due to hysteresis in the rubber tires as they flex in contact with the road, and small contributions from air resistance and a constant frictional torque in the wheel bearings. Pumping the types to a higher internal pressure reduces their footprints on the road and the flexing as they rotate. A car with harder tires rolls further.
Drag due to rolling resistance (not to be confused with sliding friction) can be measured in the laboratory with a force probe attached to a flat platform that is moved at constant speed with a force probe, on balls or cylinders of the same radius.
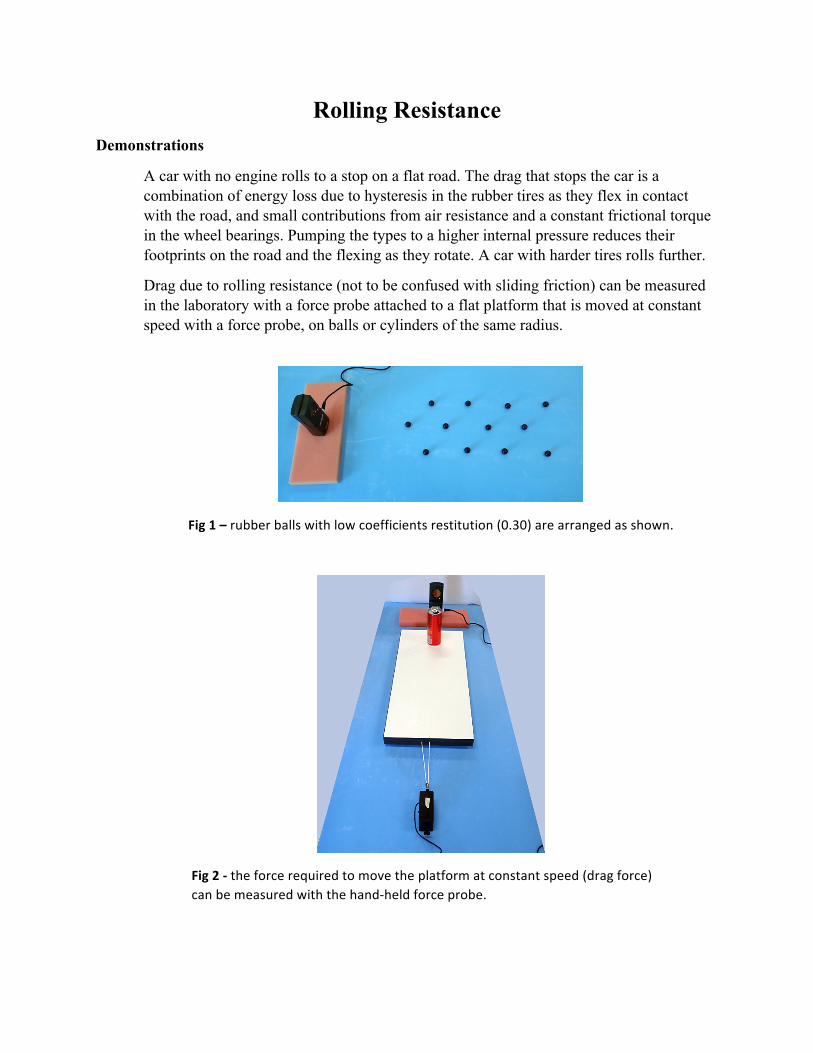
Fig1–rubberballswithlowcoefficientsrestitution(0.30)arearrangedasshown.
Fig2-theforcerequiredtomovetheplatformatconstantspeed(dragforce)canbemeasuredwiththehand-heldforceprobe.
For the demonstrations below the balls were placed directly on the bench top. The upper and lower surfaces are then the same and the balls are distorted the same amount above and below. To simplify calculations the platform is made much more massive than the balls. Small contributions made to the drag force at constant velocity due to linear and rotational motion of the balls can be neglected. In these circumstances the drag force due to rolling resistance, by analogy with a sliding friction force, is given by …
F = Crmg … where Cr is the coefficient of rolling resistance ……………………...and mg is the weight of the platform.
The number of balls can be varied, the weight of the platform can be increased by adding more shelves and the speed of the motion can be increased.
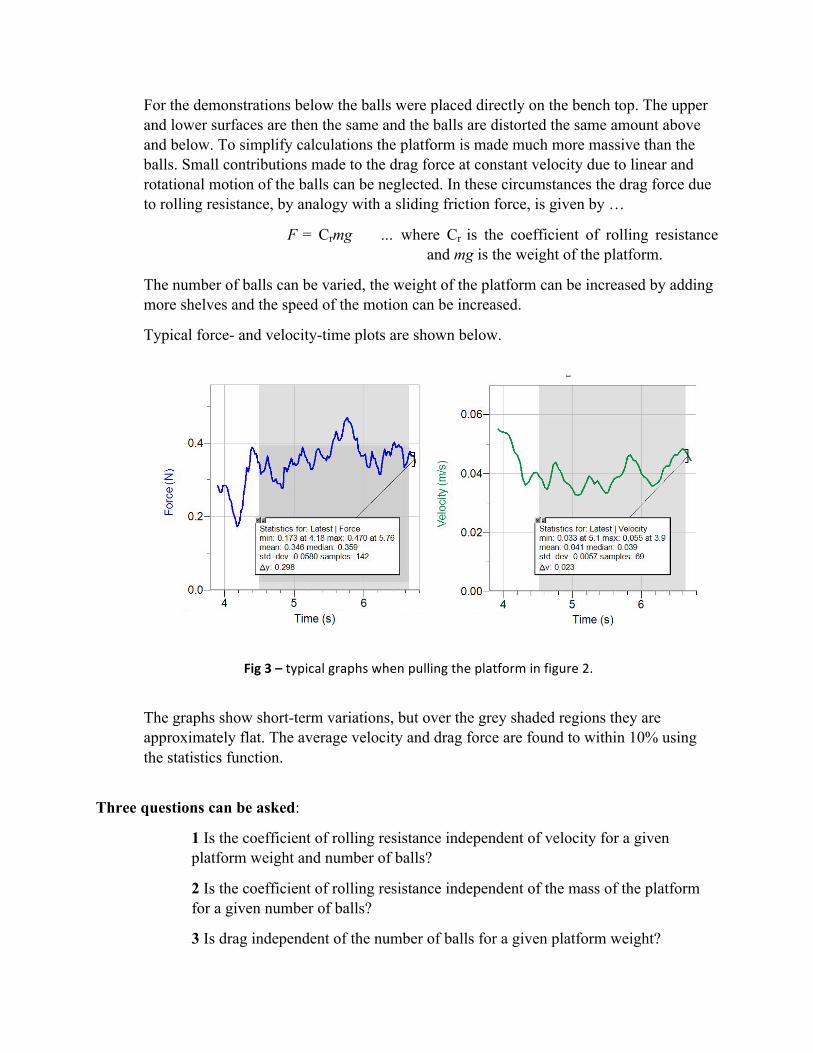
Typical force- and velocity-time plots are shown below.
Fig3–typicalgraphswhenpullingtheplatforminfigure2.
The graphs show short-term variations, but over the grey shaded regions they are approximately flat. The average velocity and drag force are found to within 10% using the statistics function.
Three questions can be asked:
1 Is the coefficient of rolling resistance independent of velocity for a given platform weight and number of balls?
2 Is the coefficient of rolling resistance independent of the mass of the platform for a given number of balls?
3 Is drag independent of the number of balls for a given platform weight?
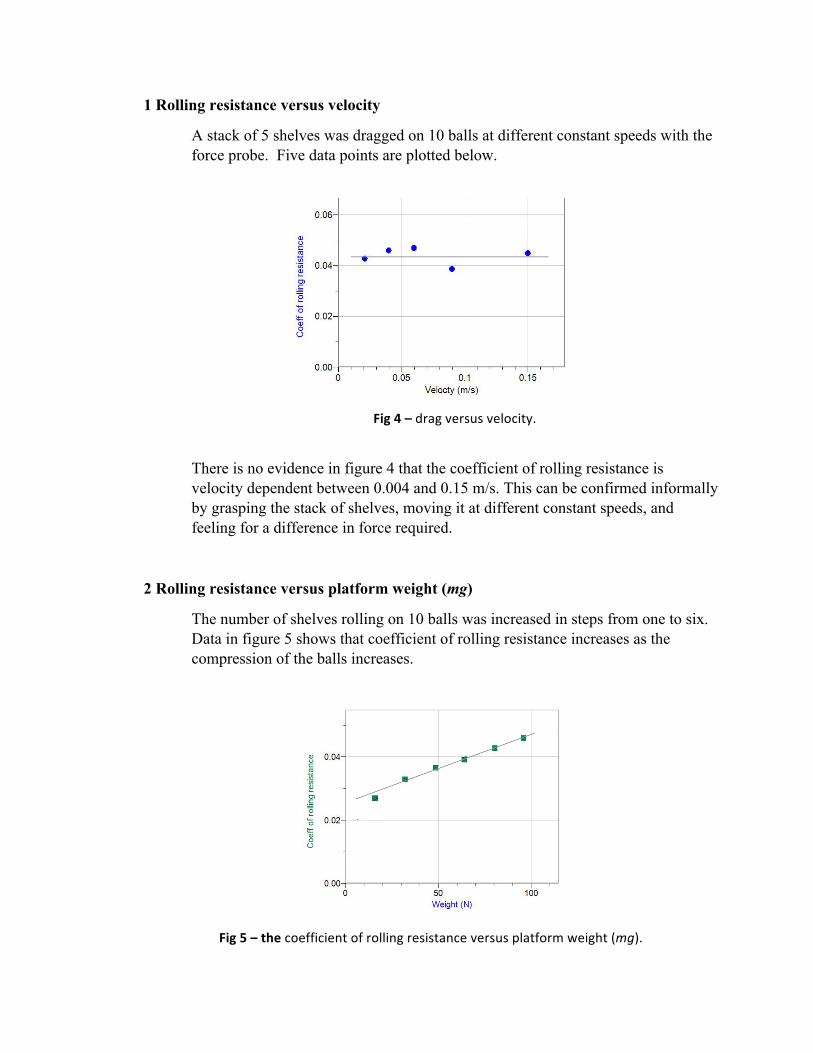
1 Rolling resistance versus velocity
A stack of 5 shelves was dragged on 10 balls at different constant speeds with the force probe. Five data points are plotted below.
Fig4–dragversusvelocity.
There is no evidence in figure 4 that the coefficient of rolling resistance is velocity dependent between 0.004 and 0.15 m/s. This can be confirmed informally by grasping the stack of shelves, moving it at different constant speeds, and feeling for a difference in force required.
2 Rolling resistance versus platform weight (mg)
The number of shelves rolling on 10 balls was increased in steps from one to six. Data in figure 5 shows that coefficient of rolling resistance increases as the compression of the balls increases.
Fig5–thecoefficientofrollingresistanceversusplatformweight(mg).
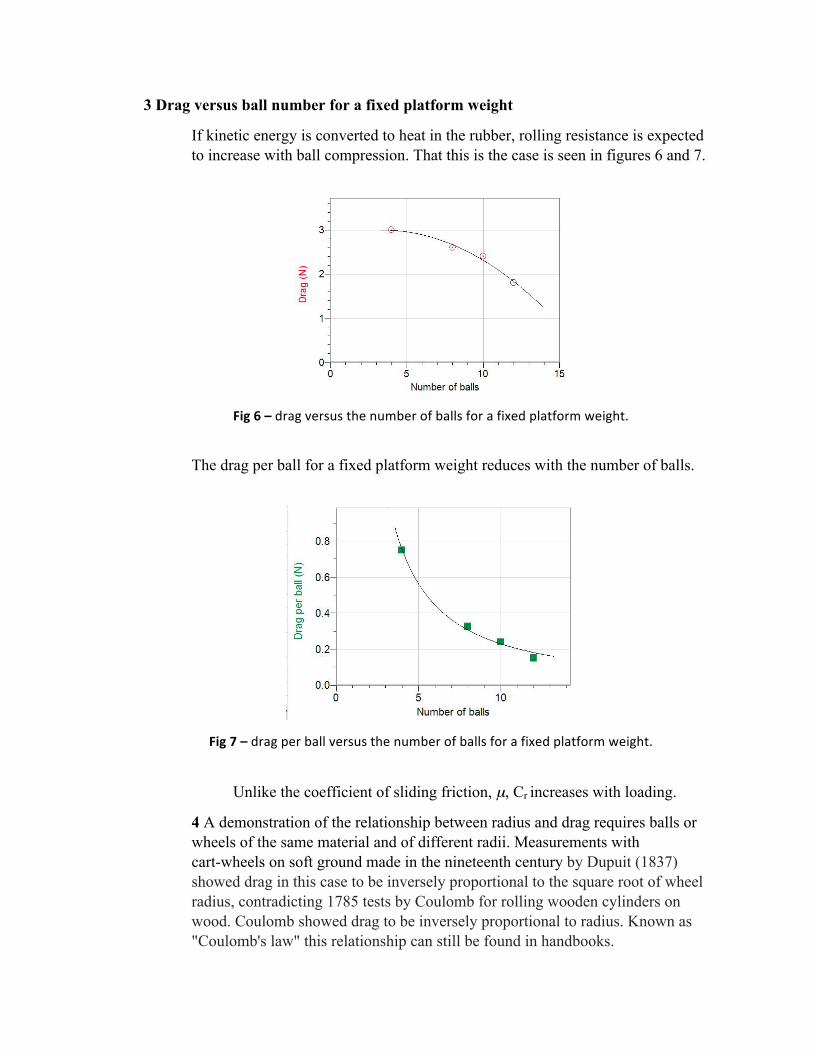
3 Drag versus ball number for a fixed platform weight
If kinetic energy is converted to heat in the rubber, rolling resistance is expected to increase with ball compression. That this is the case is seen in figures 6 and 7.
Fig6–dragversusthenumberofballsforafixedplatformweight.
The drag per ball for a fixed platform weight reduces with the number of balls.
Fig7–dragperballversusthenumberofballsforafixedplatformweight.
Unlike the coefficient of sliding friction, µ, Cr increases with loading.
4 A demonstration of the relationship between radius and drag requires balls or wheels of the same material and of different radii. Measurements with cart-wheels on soft ground made in the nineteenth century by Dupuit (1837) showed drag in this case to be inversely proportional to the square root of wheel radius, contradicting 1785 tests by Coulomb for rolling wooden cylinders on wood. Coulomb showed drag to be inversely proportional to radius. Known as "Coulomb's law" this relationship can still be found in handbooks.
Questions remain
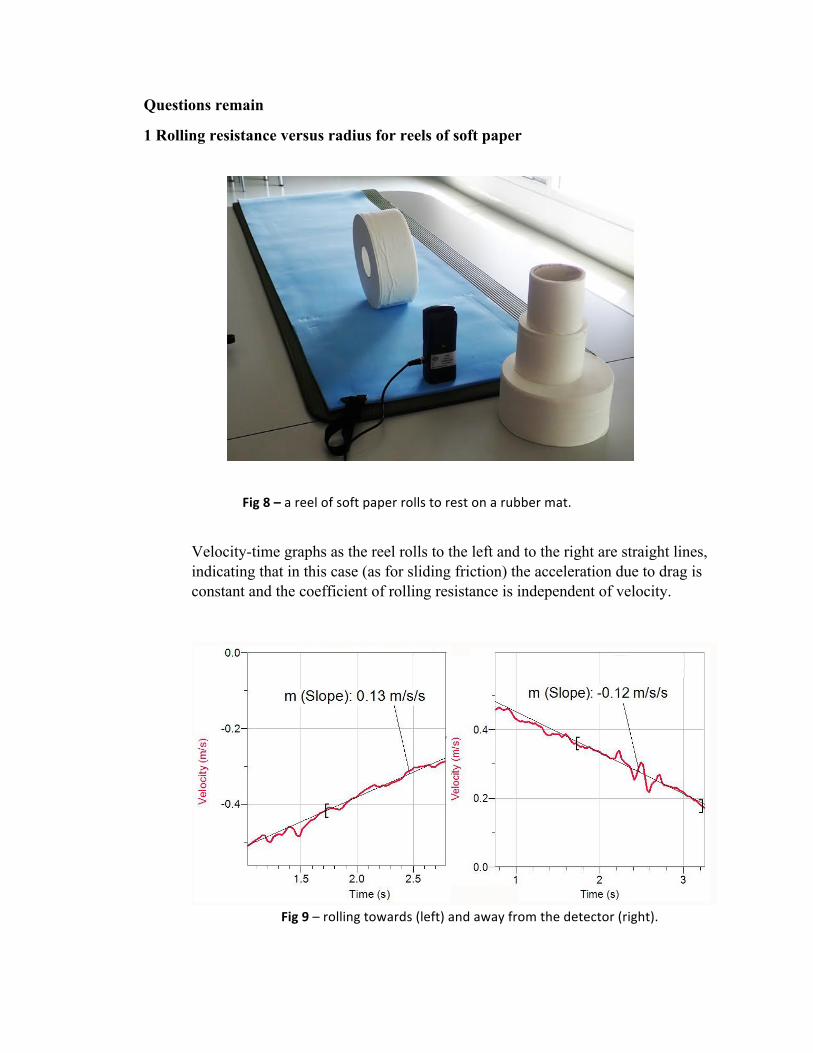
1 Rolling resistance versus radius for reels of soft paper
Fig8–areelofsoftpaperrollstorestonarubbermat.
Velocity-time graphs as the reel rolls to the left and to the right are straight lines, indicating that in this case (as for sliding friction) the acceleration due to drag is constant and the coefficient of rolling resistance is independent of velocity.
Fig9–rollingtowards(left)andawayfromthedetector(right).
Note that moments of inertia for the reels in figure 8 change from close to 1/2 mr2
for the largest to approach mr2 for the smallest.
Investigate the radius dependence of the coefficient of rolling resistance in this, or a similar case, accounting for the moments of inertia.
… or …
Design apparatus using reels like those in figure 8 to eliminate the effect of changing moments of inertia and to reduce the effect of a thin layer of paper on the smaller reels. Determine the radius dependence of the coefficient of rolling resistance with your apparatus.
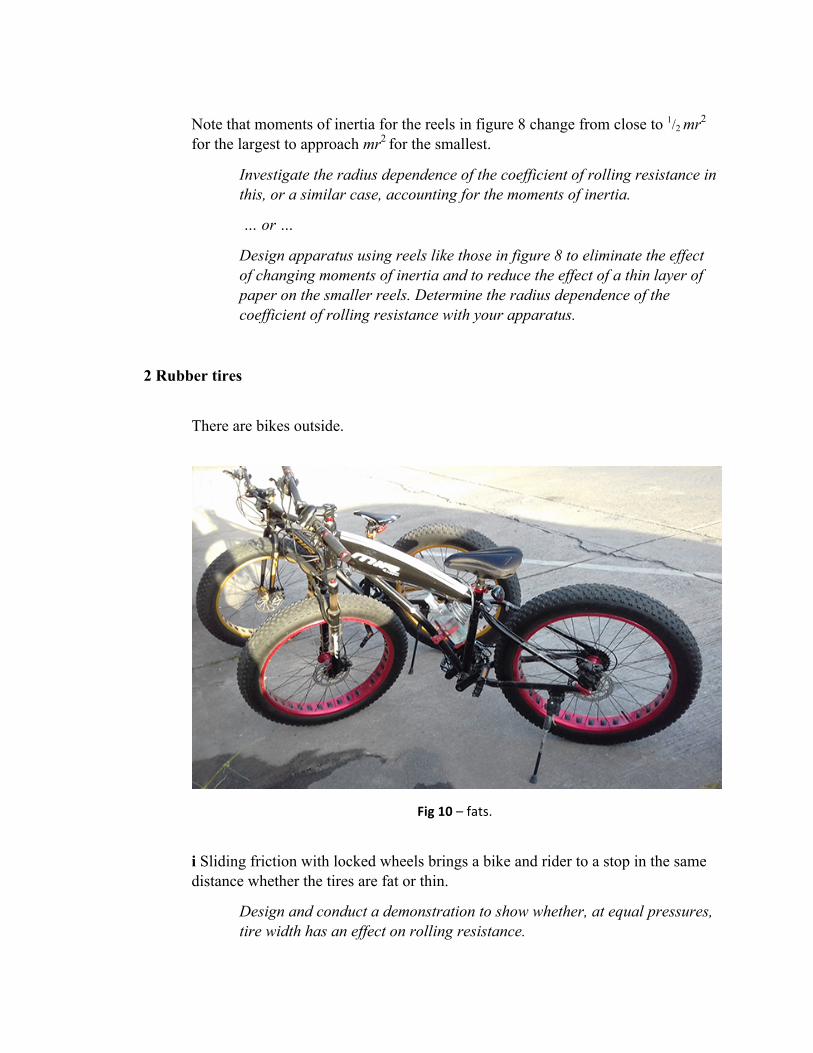
2 Rubber tires
There are bikes outside.
Fig10–fats.
i Sliding friction with locked wheels brings a bike and rider to a stop in the same distance whether the tires are fat or thin.
Design and conduct a demonstration to show whether, at equal pressures, tire width has an effect on rolling resistance.
ii Select bike tires of the same width in the same condition.
Plan experiments to determine the dependence of the coefficient of rolling resistance on tire pressure, loading, and/or wheel radius.
You may plan to have whatever you want made, and to use equipment that we may or may not have. A complete answer will include detailed discussion of more than one method. You are asked to plan this project, not to make measurements.
iii As part of a wider study select one of the possible relationships between rolling resistance , tire pressure, loading, or wheel diameter.
Outline an approach to control other variables and carry out a set of measurements in a simple and effective way to determine that relationship.
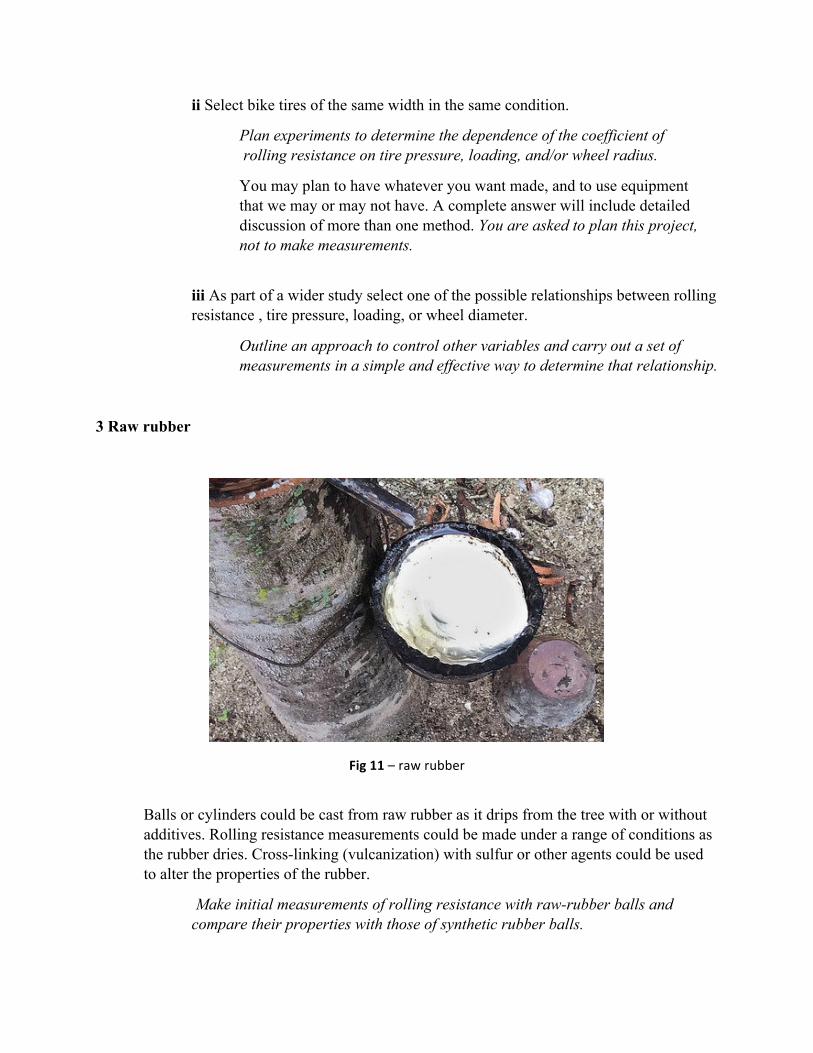
3 Raw rubber
Fig11–rawrubber
Balls or cylinders could be cast from raw rubber as it drips from the tree with or without additives. Rolling resistance measurements could be made under a range of conditions as the rubber dries. Cross-linking (vulcanization) with sulfur or other agents could be used to alter the properties of the rubber.
Make initial measurements of rolling resistance with raw-rubber balls and compare their properties with those of synthetic rubber balls.
4 PVA glue with the addition of 10-20% of flour (of different types) can be cross-linked by soaking in a solution of borax. Initial trials with PVA wood-glue, sticky rice powder (very well mixed) and borax solution produced a 1 cm ball that bounced to 65% of the drop height.
Make measurements of rolling resistance with various cross-linked PVA balls and compare their properties with those of synthetic rubber balls.
5 Marbles, hard cylinders, or wheels of different radii, can be rolled on beads of natural rubber, carpet etc.
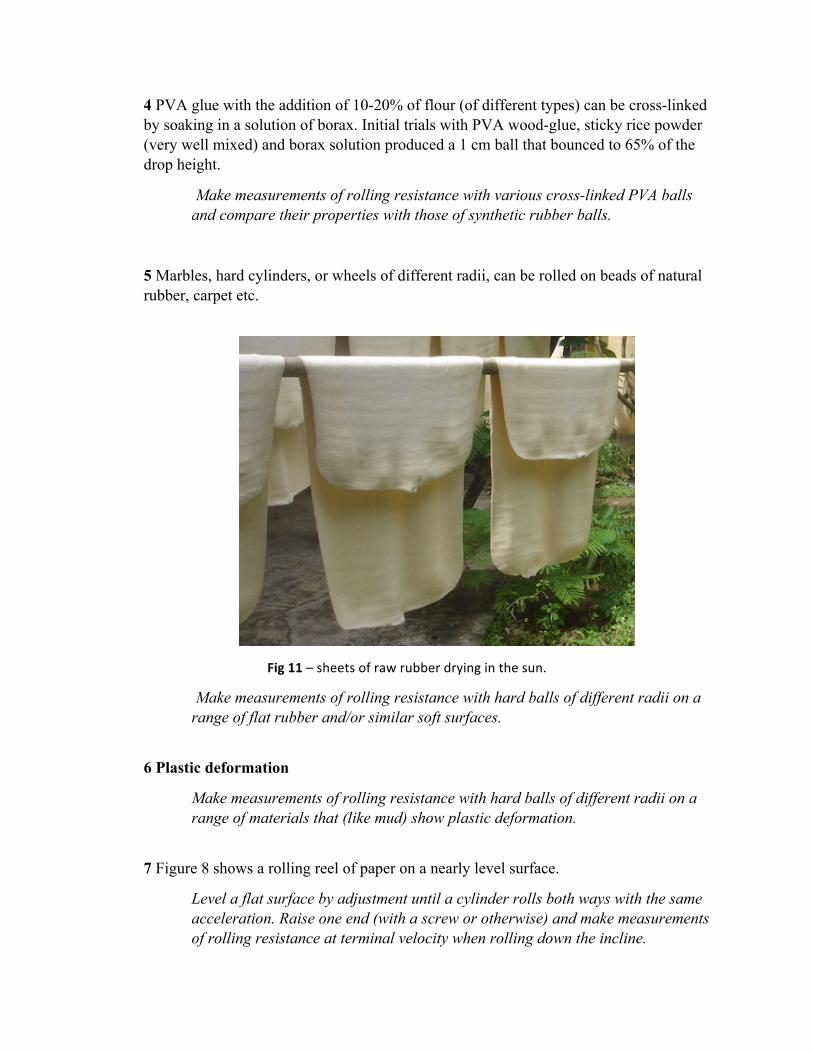
Fig11–sheetsofrawrubberdryinginthesun.
Make measurements of rolling resistance with hard balls of different radii on a range of flat rubber and/or similar soft surfaces.
6 Plastic deformation
Make measurements of rolling resistance with hard balls of different radii on a range of materials that (like mud) show plastic deformation.
7 Figure 8 shows a rolling reel of paper on a nearly level surface.
Level a flat surface by adjustment until a cylinder rolls both ways with the same acceleration. Raise one end (with a screw or otherwise) and make measurements of rolling resistance at terminal velocity when rolling down the incline.