Embed Size (px)
Citation preview
Rollover Phenomena in Liquefied Natural Gas Storage: Analysis on Heat and Pressure
Distribution Through CFD Simulation
Z. Zakaria Department of Energy Engineering
Faculty of Chemical and Energy Engineering Universiti Teknologi Malaysia, 81310 Johor Bahru Johor Malaysia
K. Kamarulzaman
Department of Energy Engineering Faculty of Chemical and Energy Engineering
Universiti Teknologi Malaysia, 81310 Johor Bahru Johor Malaysia
A. Samsuri Department of Petroleum Engineering
Faculty of Chemical and Energy Engineering, Uiversiti Teknologi Malaysia 81310 Johor Bahru Johor Malaysia
Abstract- CFD utilization in LNG industry especially in storage procedure is getting momentum since the increase in demand for LNG worldwide has led to a flexible trading market. Stored at LNG boiling temperature, heat leak is a major challenge as it causes slow boil-off which leads to LNG stratification and LNG rollover, a tragedy which has negatively impacted people, environment, company asset and reputation due to rupture and damage of the storage tank. ANSYS Fluent 14 was used to analyze the heat and pressure distribution of LNG during heat leak. The simulation involved static tank, heat leak from bottom and side wall, initial and surrounding temperature of 111K and 303K and thermal conductivity of perlite of 0.029 w/m.k. The susceptible area to rupture on inner wall tank was located at the top circumference of the tank due to higher pressure. The leak of heat occurred at the side wall contributes the largest heat compared to bottom tank since more surface area provided.
Keywords: LNG rollover; LNG storage tank; CFD simulation; ANSYS Fluent; stress distribution analysis.
I. INTRODUCTION
Over the last 20 years, the world trade in LNG gas tripled and grows from just over 8.5 Bcf/d (billions cubic feet per day) in 1994 to nearly 32 Bcf/d in 2013[1]. The increase in demand for energy mainly in natural gas and LNG signifies the need to a better technology to improvise the system as well as the safety features of its technology. In onshore, LNG is kept in insulated storage tank which pressure is just above atmospheric pressure and temperature of around -162oC. As it is stored at such low temperature, there is a significant heat leak from the surroundings into the tank which varying the temperature inside the tank. The heat leak will also cause LNG evaporation and lead to stratification phenomena. For the typical LNG storage tank, the vaporization of LNG will range about 0.15% to 0.17% per day of the total storage volume [2]. Stratification of LNG inside a storage tank is something which can happen in any LNG storage tank. Prior to stratification, the LNG will evaporate in the tank thus produce boil-off gas. It is also known as weathering process. The boil-off due to heat leak will create natural convection on LNG mixture, and maintain a uniform LNG composition. Heat leak through wall can be determined using Equation (1).
where H = heat leak, R = thermal resistance, A = area of the shell of tank, h = thickness of multilayer insulation, km = average thermal conductivity of insulation, hLNG = convective heat transfer coefficient of LNG
(1)AhAhΔh
AkxΔT
R
ΔTH LNGa
m
International Journal of Innovations in Engineering and Technology (IJIET) http://dx.doi.org/10.21172/ijiet.81.053
Volume 8 Issue 1 – February 2017 392 ISSN: 2319 - 1058
and ha = convective heat transfer coefficient of ambient air. Moreover, the heat flux through the surface caused by boil-off can be used to determine the heat transfer into the LNG tank as given in Equation (2) and (3) [3].
where m = boil-off rate, kh = correction coefficient of Ch, Ch = hashemi constant, A= area of LNG tank, Ts = bulk liquid temperature, Tb = LNG boiling point, Lv = latent heat of boil-off of LNG.
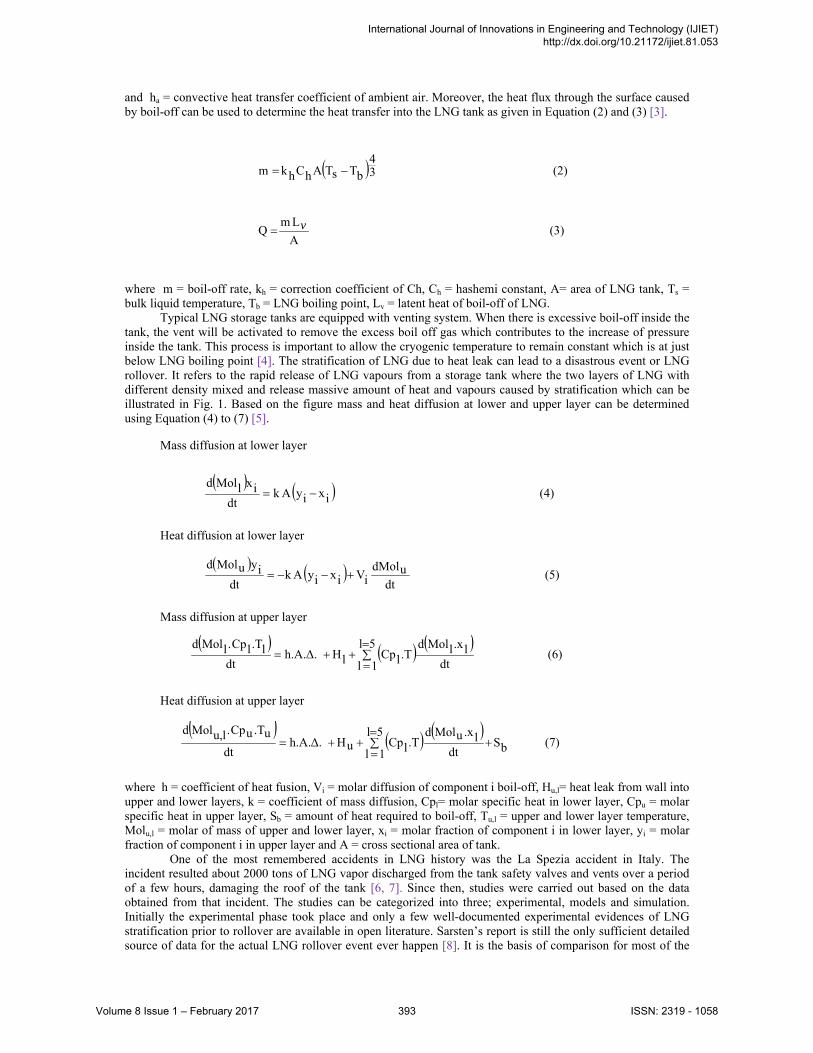
Typical LNG storage tanks are equipped with venting system. When there is excessive boil-off inside the tank, the vent will be activated to remove the excess boil off gas which contributes to the increase of pressure inside the tank. This process is important to allow the cryogenic temperature to remain constant which is at just below LNG boiling point [4]. The stratification of LNG due to heat leak can lead to a disastrous event or LNG rollover. It refers to the rapid release of LNG vapours from a storage tank where the two layers of LNG with different density mixed and release massive amount of heat and vapours caused by stratification which can be illustrated in Fig. 1. Based on the figure mass and heat diffusion at lower and upper layer can be determined using Equation (4) to (7) [5].
Mass diffusion at lower layer
Heat diffusion at lower layer
Mass diffusion at upper layer
Heat diffusion at upper layer
where h = coefficient of heat fusion, Vi = molar diffusion of component i boil-off, Hu,l= heat leak from wall into upper and lower layers, k = coefficient of mass diffusion, Cpl= molar specific heat in lower layer, Cpu = molar specific heat in upper layer, Sb = amount of heat required to boil-off, Tu,l = upper and lower layer temperature, Molu,l = molar of mass of upper and lower layer, xi = molar fraction of component i in lower layer, yi = molar fraction of component i in upper layer and A = cross sectional area of tank.
One of the most remembered accidents in LNG history was the La Spezia accident in Italy. The incident resulted about 2000 tons of LNG vapor discharged from the tank safety valves and vents over a period of a few hours, damaging the roof of the tank [6, 7]. Since then, studies were carried out based on the data obtained from that incident. The studies can be categorized into three; experimental, models and simulation. Initially the experimental phase took place and only a few well-documented experimental evidences of LNG stratification prior to rollover are available in open literature. Sarsten’s report is still the only sufficient detailed source of data for the actual LNG rollover event ever happen [8]. It is the basis of comparison for most of the
(2)34
bTsTAhChkm
(3)A
LmQ v
(4)ixiyAkdt
ixlMold
(5)dt
udMoliVixiyAk
dtiyuMold
(6)
dtl.xlMold5l
1 l.TlCplHh.A.Δ.
dtl.TlCp.lMold
7)(bS
dtl.xuMold5l
1 l.TlCpuHh.A.Δ.
dt
u.TuCp.lu,Mold
International Journal of Innovations in Engineering and Technology (IJIET) http://dx.doi.org/10.21172/ijiet.81.053
Volume 8 Issue 1 – February 2017 393 ISSN: 2319 - 1058
simulations of LNG rollover. The report was based on actual rollover phenomena in La Spezia, Italy. It consists of operational data based on available measurements of the tank process variables such as pressure, temperatures and densities. From the report, it was shown that prior to rollover, the density of LNG at different layers turned to equalize.
Figure 1. Stratification phenomena in LNG tank
After the first phase, Sarsten experimental data has triggered quite a number of theoretical model
developments. Chatterjee, Geist and Germeles were among the first to develop model for rollover but in 1983, Heestand and Shipman developed a model which preceded the other model and become the industry standard rollover model [5, 9, 10]. They had improved previous theoretical model by considering five most common constituents of LNG namely methane, ethane, propane, n-butane and nitrogen. He disregard the use of Turner’s concept because he claimed that the correlations under-estimate the mass transfer between the stratified layers. His approach was to use Reynolds analogy and Globe and Dropkin correlation for heat transfer to calculate mass transfer coefficient. As a result, the model predictions predicted a closer time for rollover occurrence based on Sarsten experimental data for LaSpezia incident [10, 11]. In 2002, a thermo physical model for the stored LNG was developed.
The model was tested on real data of tank operation. The model was developed based on the normal process in a typical LNG storage tank. When the heat from surrounding leaked into LNG fluid, it will warm up the liquid at the bottom causing buoyant effects and push the liquid upwards along the wall. On the surface, it will evaporate off and cooled or become denser. It will flow back across the surface to sink back toward the bottom, mixing with the rest of LNG and maintaining the bulk at uniform composition and temperature. In 2006, Heestand model was redeveloped using the Peng-Robinson equation of state which previously Heestand used the SRK equation of states [9]. In 2010, a new LNG model was developed which predicts LNG thermodynamic properties using GERG-2004 equation of state [2]. Whilst in 2011, lumped parameter model was developed by considering two stratified layers and temperature and composition of LNG over the respective layers. Equations considered were mass and energy balance, stratification forecast and boil-off preferential using vapour liquid equilibrium [12].
The latest phase of research methodology is the development of LNG simulation using CFD. For offshore storage vessel, most of the researches are on the procedure of FLNG marine tankers boil-off. For onshore storage tanks, a paper was published at the Spring Meeting of the American Institute of Chemical Engineers [13]. The potential use of CFD model introduced and density stratification to reduce boil off in storage tank were proposed. More accurate models and data were required to optimize the strategy of using CFD to simulate density stratification [14]. Tokyo Gas was the first to use Fluent CFD to model and simulate LNG density stratification. The scope done was during the filling operation of LNG with different heel and new cargo [14]. From the results, stratification of LNG can be seen where the low density feed cargo moved to the top surface of the heel cargo. Yet, the simulation did not use to model any approach to a rollover event.
For stress distribution analysis, in 2011, Cheng et al. had presented a paper on CFD simulation but he was using ADINA software for the study. The research scope was on LNG storage concrete wall cracks due to pull pressure. Based on the results, highly potential area to rupture during normal stage was fixed at the bottom end which is easy to produce transverse cracks. At leakage stage, one fifth the height from bottom of the tank was easy to produce longitudinal cracks [15]. The scope for the study was on a large concrete storage tank and the
International Journal of Innovations in Engineering and Technology (IJIET) http://dx.doi.org/10.21172/ijiet.81.053
Volume 8 Issue 1 – February 2017 394 ISSN: 2319 - 1058
crack distribution during earthquake in different seismic intensities [16]. Both simulations were using finite element method.
The scope of this paper is to evaluate a pressure distribution profile onto LNG storage tank due to rollover phenomena obtained from computational fluid dynamics (CFD) model using ANSYS Fluent software which previously only used Fluent. In the software, the study was done using finite volume and k-epsilon method. The model used is similar with Koyama for feed cargo but the scope is using static LNG instead of filling operation. The results showed the stratification of LNG layer occurred due to heat leak to static LNG cargo and the pressure profile showed high pressure on the tank top circumference.
II. SIMULATION WORK
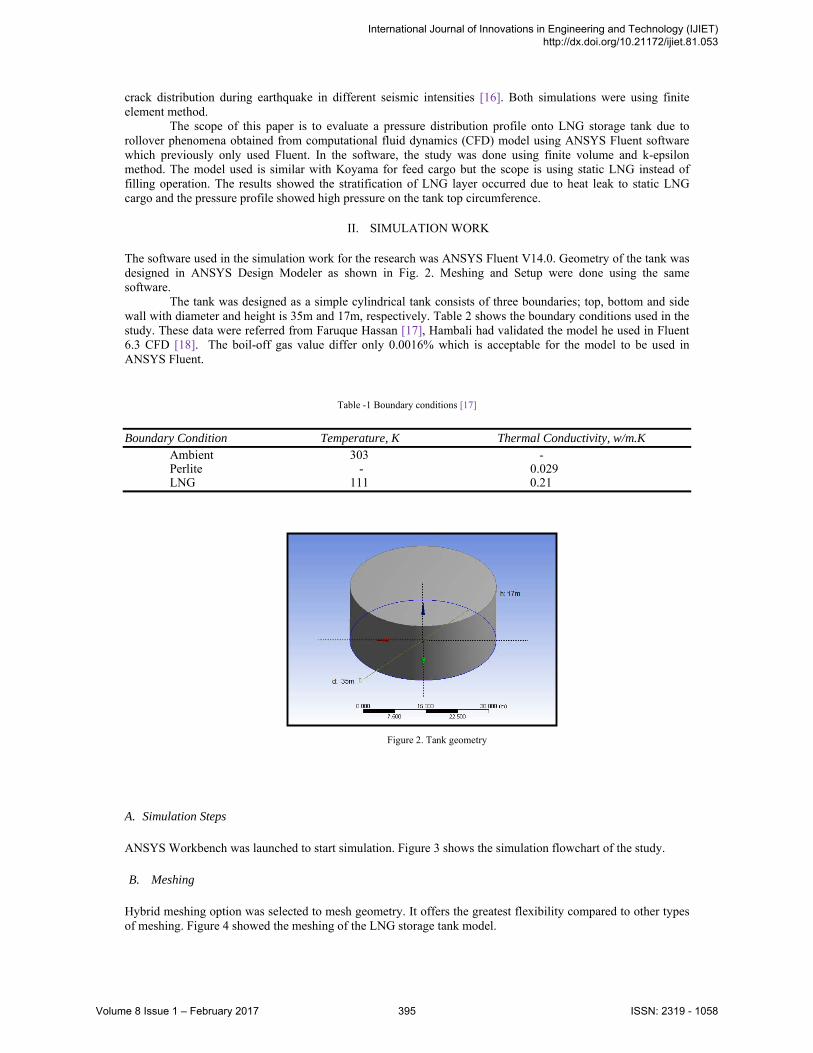
The software used in the simulation work for the research was ANSYS Fluent V14.0. Geometry of the tank was designed in ANSYS Design Modeler as shown in Fig. 2. Meshing and Setup were done using the same software.
The tank was designed as a simple cylindrical tank consists of three boundaries; top, bottom and side wall with diameter and height is 35m and 17m, respectively. Table 2 shows the boundary conditions used in the study. These data were referred from Faruque Hassan [17], Hambali had validated the model he used in Fluent 6.3 CFD [18]. The boil-off gas value differ only 0.0016% which is acceptable for the model to be used in ANSYS Fluent.
Table -1 Boundary conditions [17]
Boundary Condition Temperature, K Thermal Conductivity, w/m.K Ambient 303 - Perlite - 0.029 LNG 111 0.21
Figure 2. Tank geometry
A. Simulation Steps
ANSYS Workbench was launched to start simulation. Figure 3 shows the simulation flowchart of the study. B. Meshing
Hybrid meshing option was selected to mesh geometry. It offers the greatest flexibility compared to other types of meshing. Figure 4 showed the meshing of the LNG storage tank model.
International Journal of Innovations in Engineering and Technology (IJIET) http://dx.doi.org/10.21172/ijiet.81.053
Volume 8 Issue 1 – February 2017 395 ISSN: 2319 - 1058
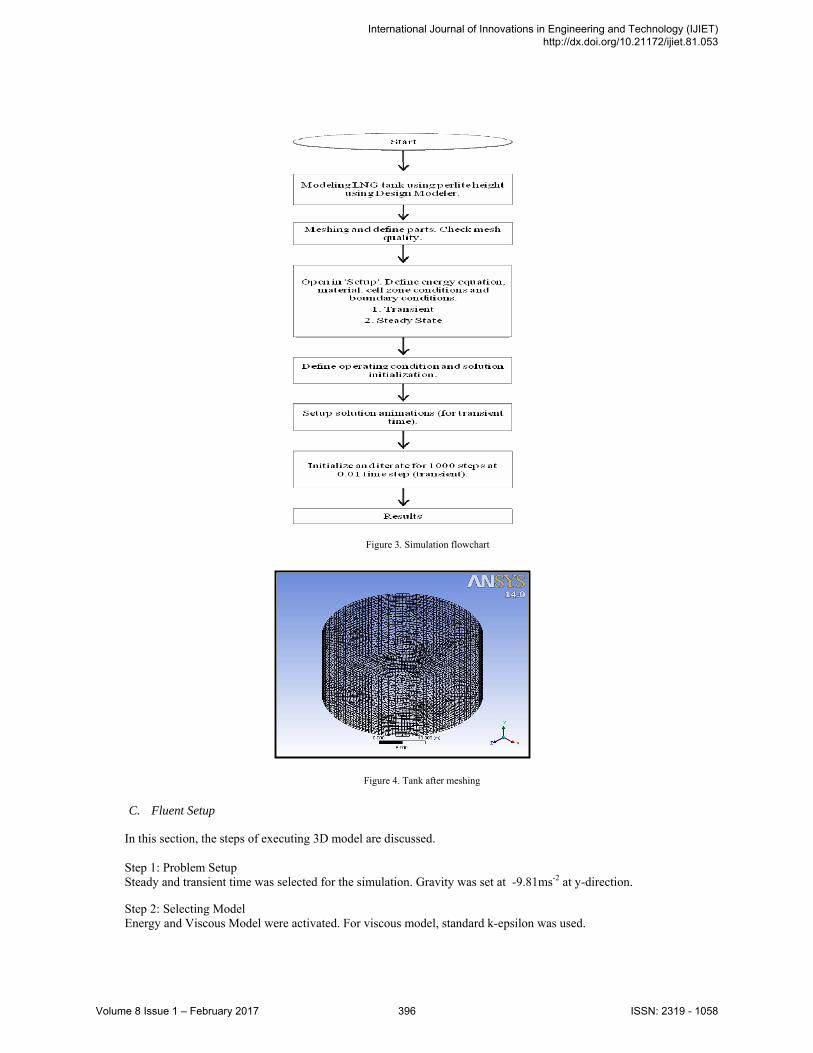
Figure 3. Simulation flowchart
Figure 4. Tank after meshing
C. Fluent Setup
In this section, the steps of executing 3D model are discussed.
Step 1: Problem Setup Steady and transient time was selected for the simulation. Gravity was set at -9.81ms-2 at y-direction.
Step 2: Selecting Model Energy and Viscous Model were activated. For viscous model, standard k-epsilon was used.
International Journal of Innovations in Engineering and Technology (IJIET) http://dx.doi.org/10.21172/ijiet.81.053
Volume 8 Issue 1 – February 2017 396 ISSN: 2319 - 1058

Step 3: Materials Simulation involved one type of LNG cargo. LNG properties data were inserted in the material section. The density of LNG is based on piecewise-polynomial. Density as a function of temperature was based on Equation (8) [13].
where is density of LNG. Perlite as the insulation material, the properties was key-in under solid category. Thermal conductivity values of perlite were varied to get the results using steady state simulation procedure.
Step 4: Operating conditions For operating conditions, the operating pressure value input was 101325 Pa and the gravity was enabled with value 9.81ms-2 in y-direction.
Step 5: Boundary conditions Each of the zone’s boundary conditions were set up accordingly and the value input for every boundary were set up in this step. In this study, side and bottom wall with perlite material properties were set at a temperature of 303K. No heat leak at tank top wall.
Step 6: Solution The solution methods scheme chosen was SIMPLE, a pressure-velocity coupling. The final step was to calculate solution. In this study, 12000 iterations were used for transient and 500 iterations for steady state calculations. The initialization used standard initialization and the initial temperature was set to 111K. In Calculation Activities, the solution animations were set to get the results for transient time. Parameter that was set for animations were the Total Temperature and Density. The results were shown based on the vertical symmetry plane of the tank.
Step 7: Iterations of the solution Final step was the iterating stage. The cases were checked and no error was found before proceeding with the calculations.
III. RESULTS AND DISCUSSIONS A. Total Heat Leak
Total heat leak at varied perlite thermal conductivity was observed. Figure 5 shows the graph of heat leak again thermal conductivity. From the graph, heat leak increased smoothly when thermal conductivity increased. The leak which occurred at the side wall contributes the largest heat leak compared to tank bottom. This was due to the surface area of side wall which is 1869.2 m2 compared to the tank bottom area which was 962.1 m2. It shows the effect of having insulation with low thermal conductivity can help to reduce heat leak. Total heat leak was mainly contributed by the side wall as the surface area is higher.
Figure 5. Total heat leak against thermal conductivity
)8(oρ131.38T1.1473m
kgρ
International Journal of Innovations in Engineering and Technology (IJIET) http://dx.doi.org/10.21172/ijiet.81.053
Volume 8 Issue 1 – February 2017 397 ISSN: 2319 - 1058

(c)’
(d)
(e)
(f)
(g)
(h)
(i)
(j)
Figure 6. Density profile of LNG
Figure 6 showed the heat leak warmed the fluid near the side wall and tank bottom causing buoyancy
force to push the LNG near the wall moved upwards along the wall. Stratification of LNG was shown from the results near the end of simulation. Initially, there was no stratification of LNG layer can be observed. The density of LNG near the wall became lighter due to heat leak and there was an upward liquid flow along the wall. The slightly superheated LNG fluid then arrived at the top of LNG surface. Here due to decrease in hydrostatic pressure, super-saturation becomes greater under the same thermodynamic condition. Then, the flash cooled liquid (denser liquid) flows across the surface to sink back toward the bottom, mixing with the bulk core of LNG at the bottom which may created a dynamic force onto storage wall. This process might devastate the tank since additional force developed is not taking into account during the design stage.
Figure 7. Density stratification
International Journal of Innovations in Engineering and Technology (IJIET) http://dx.doi.org/10.21172/ijiet.81.053
Volume 8 Issue 1 – February 2017 398 ISSN: 2319 - 1058

Figure 7 shows the density stratified into layer. The boil-off of LNG at the top surface had changed the chemical and physical composition of LNG layer thus eventually the mixed LNG was stratified into layer with different density. Based on the figure, the top layer has density value of 406 kg/m3 while the bottom layer of 422 kg/m3. Initial density was set from the simulation was 425 kg/m3. This confirm that the stratification process develop into the storage tank and might put the system in unsafe condition. B. Pressure Distribution
Fluent reads the total pressure as the gauge static pressure sum with the dynamic pressure. In this study, the operating pressure was set at 101325 Pa. From the simulation, initially higher pressure was seen at the bottom of and the lower pressure near the tank top as shown in Figure 8. The high pressure at the bottom initially was due to hydrostatic pressure. Upon heat leak and stratification, higher pressure was detected near the side wall of the tank, increasing in value near the tank top. The pressure then accumulated at the centre of the tank before it began to form uniform layered pressure which was higher at the top and lower when it goes down at the bottom. This was due to the effects of heat leak through the tank wall as shown in Figure 9. This was due to the effect of heat leak through the tank wall. The highest pressure point was along the circumference which joined tank top and tank side wall. The pressure at this point was 102257 Pa which is higher than the operating pressure. It shows that the top circumference of the tank is susceptible for rupture. This was similar to the effects of seismic response as reported by [15, 19] where the crack first appears and spread outside along the top circumference until the whole top of the concrete tank wall fail entirely.
Figure 10 showed a higher turbulence near top of side wall area. The red region of intensity shows the intensity value of 23.9% to 26%. Typically the turbulence intensity of 5% to 20% is considered as high turbulence case. It means that the study system is in super high turbulence case which the system might rupture.
(a)
(b)
(c)
(d)
(e)
(f) Figure 8. Pressure profile of LNG
International Journal of Innovations in Engineering and Technology (IJIET) http://dx.doi.org/10.21172/ijiet.81.053
Volume 8 Issue 1 – February 2017 399 ISSN: 2319 - 1058
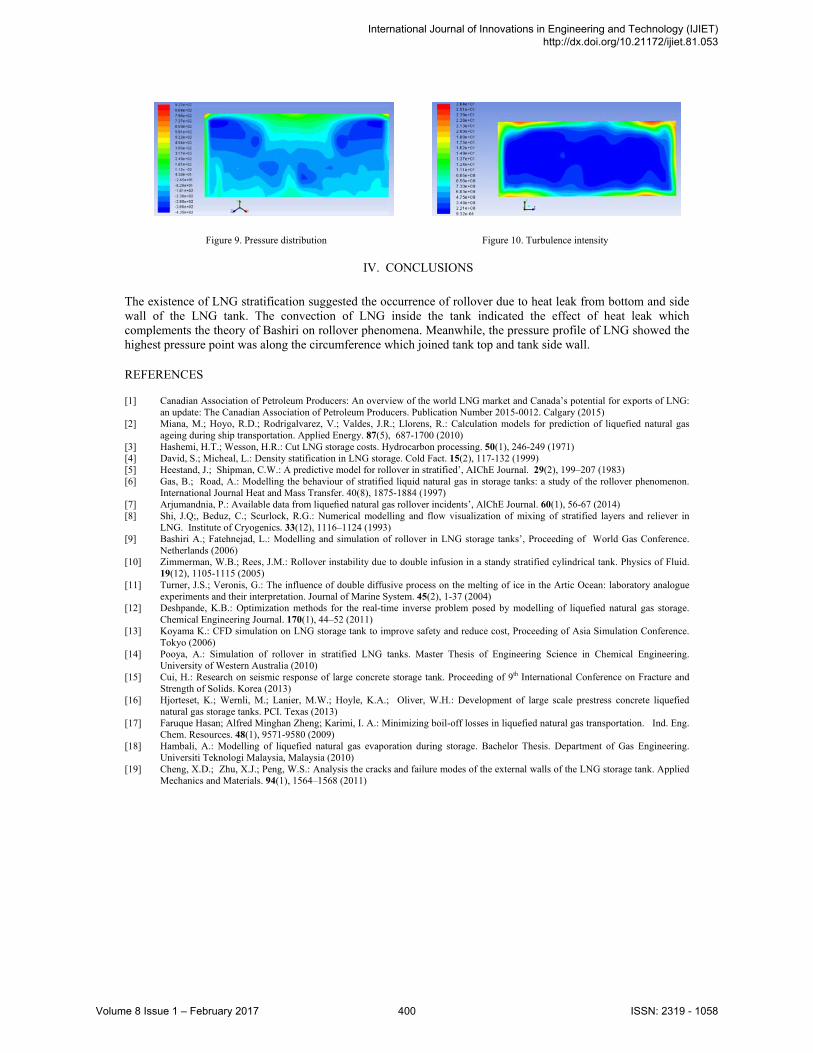
Figure 9. Pressure distribution Figure 10. Turbulence intensity
IV. CONCLUSIONS
The existence of LNG stratification suggested the occurrence of rollover due to heat leak from bottom and side wall of the LNG tank. The convection of LNG inside the tank indicated the effect of heat leak which complements the theory of Bashiri on rollover phenomena. Meanwhile, the pressure profile of LNG showed the highest pressure point was along the circumference which joined tank top and tank side wall. REFERENCES [1] Canadian Association of Petroleum Producers: An overview of the world LNG market and Canada’s potential for exports of LNG:
an update: The Canadian Association of Petroleum Producers. Publication Number 2015-0012. Calgary (2015) [2] Miana, M.; Hoyo, R.D.; Rodrigalvarez, V.; Valdes, J.R.; Llorens, R.: Calculation models for prediction of liquefied natural gas
ageing during ship transportation. Applied Energy. 87(5), 687-1700 (2010) [3] Hashemi, H.T.; Wesson, H.R.: Cut LNG storage costs. Hydrocarbon processing. 50(1), 246-249 (1971) [4] David, S.; Micheal, L.: Density statification in LNG storage. Cold Fact. 15(2), 117-132 (1999) [5] Heestand, J.; Shipman, C.W.: A predictive model for rollover in stratified’, AIChE Journal. 29(2), 199–207 (1983) [6] Gas, B.; Road, A.: Modelling the behaviour of stratified liquid natural gas in storage tanks: a study of the rollover phenomenon.
International Journal Heat and Mass Transfer. 40(8), 1875-1884 (1997) [7] Arjumandnia, P.: Available data from liquefied natural gas rollover incidents’, AlChE Journal. 60(1), 56-67 (2014) [8] Shi, J.Q;, Beduz, C.; Scurlock, R.G.: Numerical modelling and flow visualization of mixing of stratified layers and reliever in
LNG. Institute of Cryogenics. 33(12), 1116–1124 (1993) [9] Bashiri A.; Fatehnejad, L.: Modelling and simulation of rollover in LNG storage tanks’, Proceeding of World Gas Conference.
Netherlands (2006) [10] Zimmerman, W.B.; Rees, J.M.: Rollover instability due to double infusion in a standy stratified cylindrical tank. Physics of Fluid.
19(12), 1105-1115 (2005) [11] Turner, J.S.; Veronis, G.: The influence of double diffusive process on the melting of ice in the Artic Ocean: laboratory analogue
experiments and their interpretation. Journal of Marine System. 45(2), 1-37 (2004) [12] Deshpande, K.B.: Optimization methods for the real-time inverse problem posed by modelling of liquefied natural gas storage.
Chemical Engineering Journal. 170(1), 44–52 (2011) [13] Koyama K.: CFD simulation on LNG storage tank to improve safety and reduce cost, Proceeding of Asia Simulation Conference.
Tokyo (2006) [14] Pooya, A.: Simulation of rollover in stratified LNG tanks. Master Thesis of Engineering Science in Chemical Engineering.
University of Western Australia (2010) [15] Cui, H.: Research on seismic response of large concrete storage tank. Proceeding of 9th International Conference on Fracture and
Strength of Solids. Korea (2013) [16] Hjorteset, K.; Wernli, M.; Lanier, M.W.; Hoyle, K.A.; Oliver, W.H.: Development of large scale prestress concrete liquefied
natural gas storage tanks. PCI. Texas (2013) [17] Faruque Hasan; Alfred Minghan Zheng; Karimi, I. A.: Minimizing boil-off losses in liquefied natural gas transportation. Ind. Eng.
Chem. Resources. 48(1), 9571-9580 (2009) [18] Hambali, A.: Modelling of liquefied natural gas evaporation during storage. Bachelor Thesis. Department of Gas Engineering.
Universiti Teknologi Malaysia, Malaysia (2010) [19] Cheng, X.D.; Zhu, X.J.; Peng, W.S.: Analysis the cracks and failure modes of the external walls of the LNG storage tank. Applied
Mechanics and Materials. 94(1), 1564–1568 (2011)
International Journal of Innovations in Engineering and Technology (IJIET) http://dx.doi.org/10.21172/ijiet.81.053
Volume 8 Issue 1 – February 2017 400 ISSN: 2319 - 1058