Embed Size (px)
Citation preview

7/27/2019 Romania Market Overview 2013
http://slidepdf.com/reader/full/romania-market-overview-2013 1/20
Highights
• Oce take-up in Bucharest amounted to a record 240,000 sq m in 2011. Prime rents
remained stable over the course of the year, but are forecast to increase by the end
of 2012 as a result of a limited development pipeline.
• Several major new retail developments came to the Romanian market in the second
half of 2011. International fashion retailers have been an increasingly important
source of demand for high quality retail space.
• Take-up of approximately 100,000 sq m of class A logistics and industrial space
was recorded in 2011, a similar level to 2010. Vacancy rates in this sector have been
falling due to a lack of new development completions.
• A number of important new infrastructure developments, including the Basarab
Bridge and the Pipera overpass, have opened up new areas of Bucharest as
attractive property locations. This has increased the interest of developers and
investors in these areas.
2012
RomaniaMARKET OverviewReview & outlook
in association with
7/27/2019 Romania Market Overview 2013
http://slidepdf.com/reader/full/romania-market-overview-2013 2/20
2012
Romania
MARKET OVERVIEWReview & outlook
2
http://knightfrank.com/romania
Contents
1. Oce Market 3
2. Retail Market 8
3. Industrial Market 10
4. Land Market 12
5. Investment Market 14
6. Valuations 16
7. IFRS and Deferred Taxes 17
7/27/2019 Romania Market Overview 2013
http://slidepdf.com/reader/full/romania-market-overview-2013 3/20
3
www.knightfrank.com
in association with
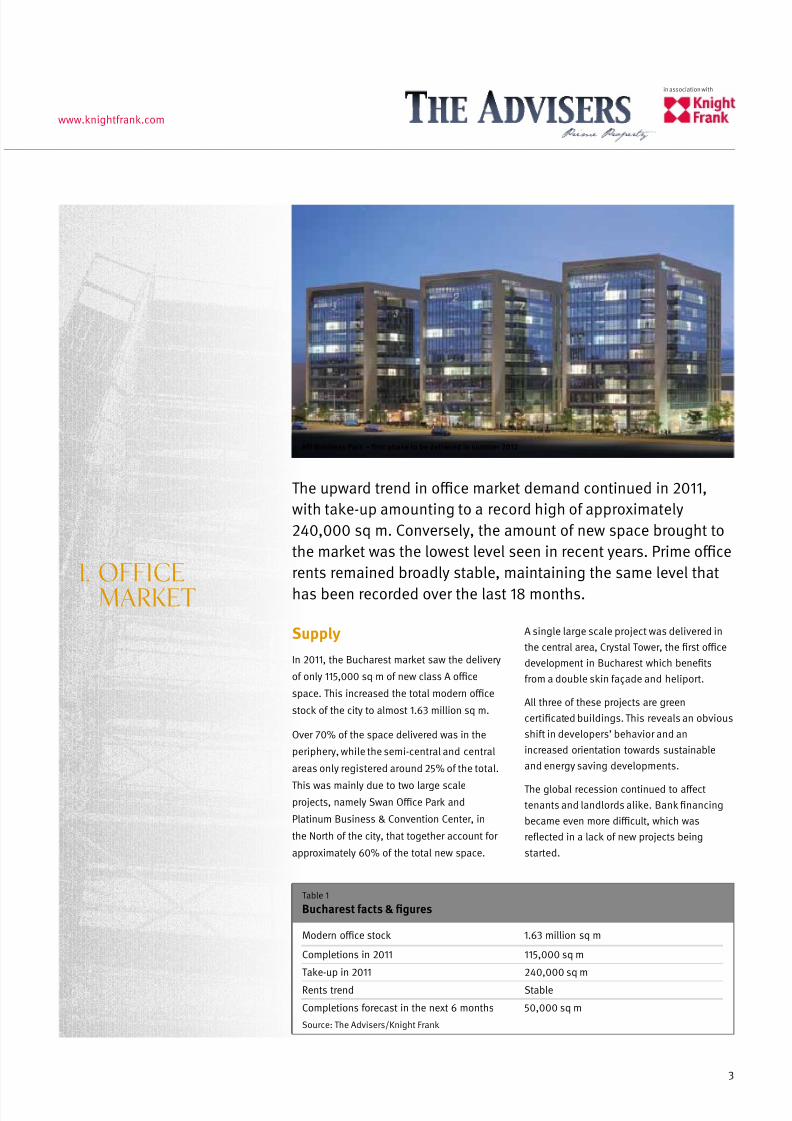
Supply
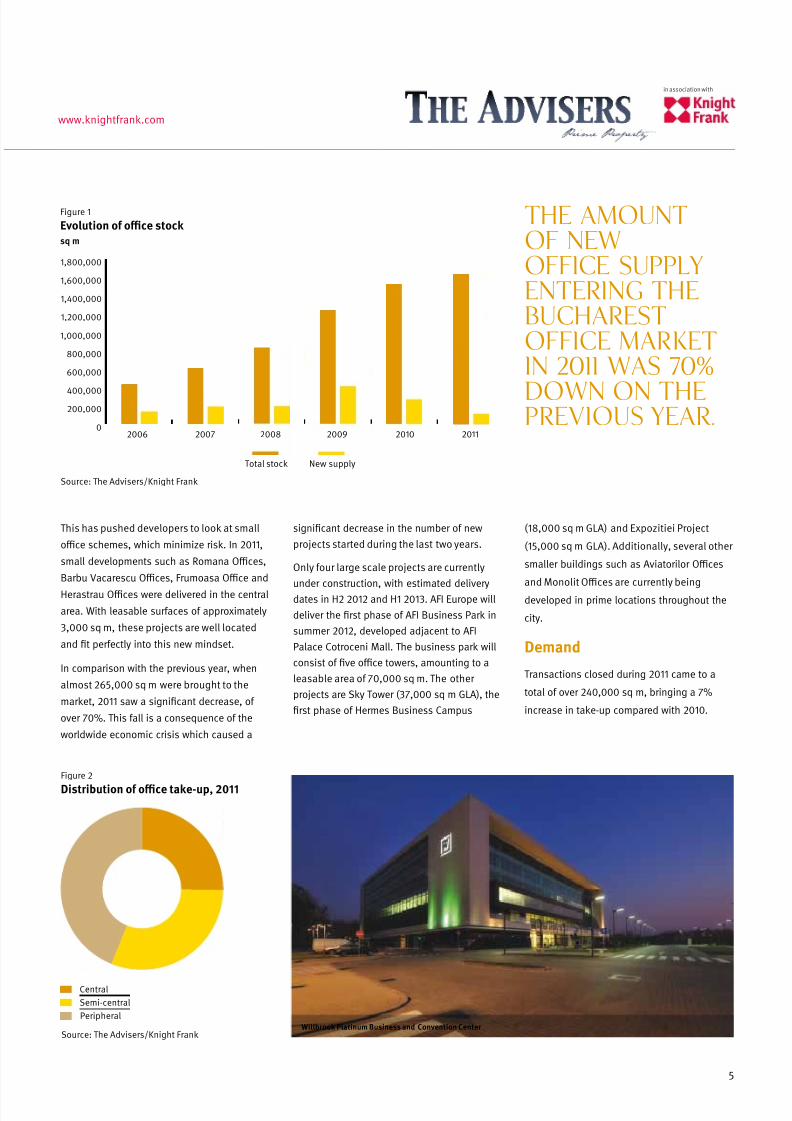
In 2011, the Bucharest market saw the delivery
of only 115,000 sq m of new class A oce
space. This increased the total modern oce
stock of the city to almost 1.63 million sq m.
Over 70% of the space delivered was in the
periphery, while the semi-central and central
areas only registered around 25% of the total.
This was mainly due to two large scaleprojects, namely Swan Oce Park and
Platinum Business & Convention Center, in
the North of the city, that together account for
approximately 60% of the total new space.
A single large scale project was delivered in
the central area, Crystal Tower, the rst oce
development in Bucharest which benets
from a double skin façade and heliport.
All three of these projects are green
certicated buildings. This reveals an obvious
shift in developers’ behavior and an
increased orientation towards sustainable
and energy saving developments.
The global recession continued to aect
tenants and landlords alike. Bank nancing
became even more dicult, which was
reected in a lack of new projects being
started.
The upward trend in oce market demand continued in 2011,
with take-up amounting to a record high of approximately
240,000 sq m. Conversely, the amount of new space brought to
the market was the lowest level seen in recent years. Prime oce
rents remained broadly stable, maintaining the same level that
has been recorded over the last 18 months.
1. OFFICE
MARKET
Table 1
Bucharest facts & gures
Modern oce stock 1.63 million sq m
Completions in 2011 115,000 sq m
Take-up in 2011 240,000 sq m
Rents trend Stable
Completions forecast in the next 6 months 50,000 sq m
Source: The Advisers/Knight Frank
AFI Business Park – rst phase to be delivered in summer 2012
7/27/2019 Romania Market Overview 2013
http://slidepdf.com/reader/full/romania-market-overview-2013 4/20
2012
Romania
MARKET OVERVIEWReview & outlook
4
http://knightfrank.com/romania
E60
E60
E70
DN4DN5
E70
E60
E60
E85
E85
E81
A2
Baneasa
Forest
Lake Vacaresti
CornetuForest
Tunari Forest
Mill Lake
Lake Cernica
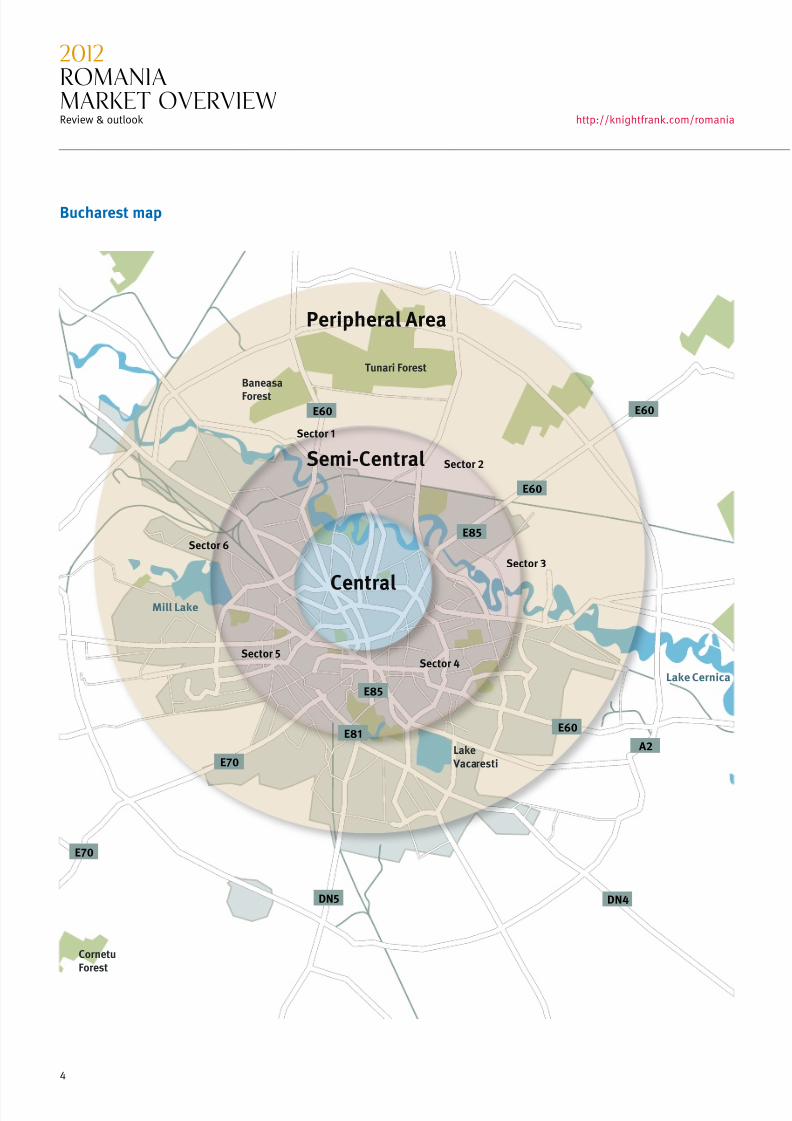
Central
Semi-Central
Peripheral Area
Sector 5
Sector 1
Sector 6
Sector 2
Sector 3
Sector 4
Bucharest map
7/27/2019 Romania Market Overview 2013
http://slidepdf.com/reader/full/romania-market-overview-2013 5/20
5
www.knightfrank.com
in association with
signicant decrease in the number of new
projects started during the last two years.
Only four large scale projects are currently
under construction, with estimated delivery
dates in H2 2012 and H1 2013. AFI Europe will
deliver the rst phase of AFI Business Park in
summer 2012, developed adjacent to AFI
Palace Cotroceni Mall. The business park will
consist of ve oce towers, amounting to a
leasable area of 70,000 sq m. The other
projects are Sky Tower (37,000 sq m GLA), the
rst phase of Hermes Business Campus
The amount
of new
ofce supply
entering the
Bucharest
ofce market
in 2011 was 70%
down on theprevious year.
Source: The Advisers/Knight Frank
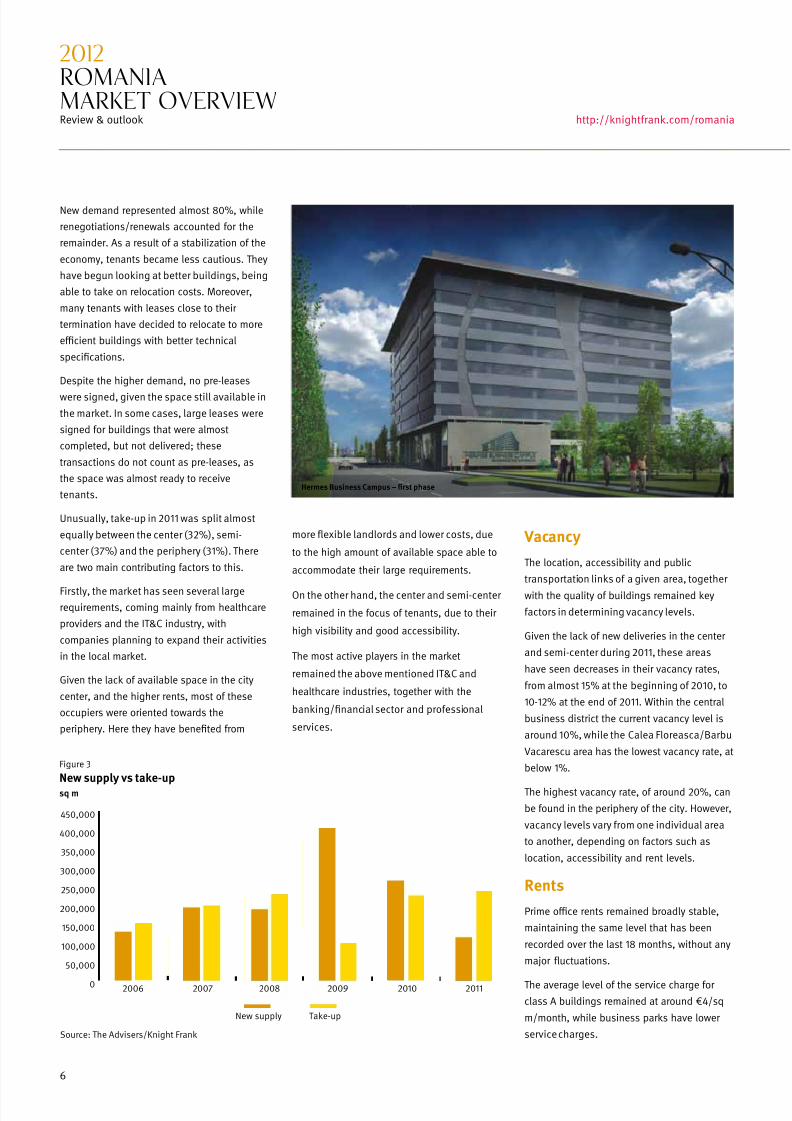
Figure 2
Distribution of oce take-up, 2011
Central
Semi-central
Peripheral
This has pushed developers to look at small
oce schemes, which minimize risk. In 2011,
small developments such as Romana Oces,
Barbu Vacarescu Oces, Frumoasa Oce and
Herastrau Oces were delivered in the central
area. With leasable surfaces of approximately
3,000 sq m, these projects are well located
and t perfectly into this new mindset.
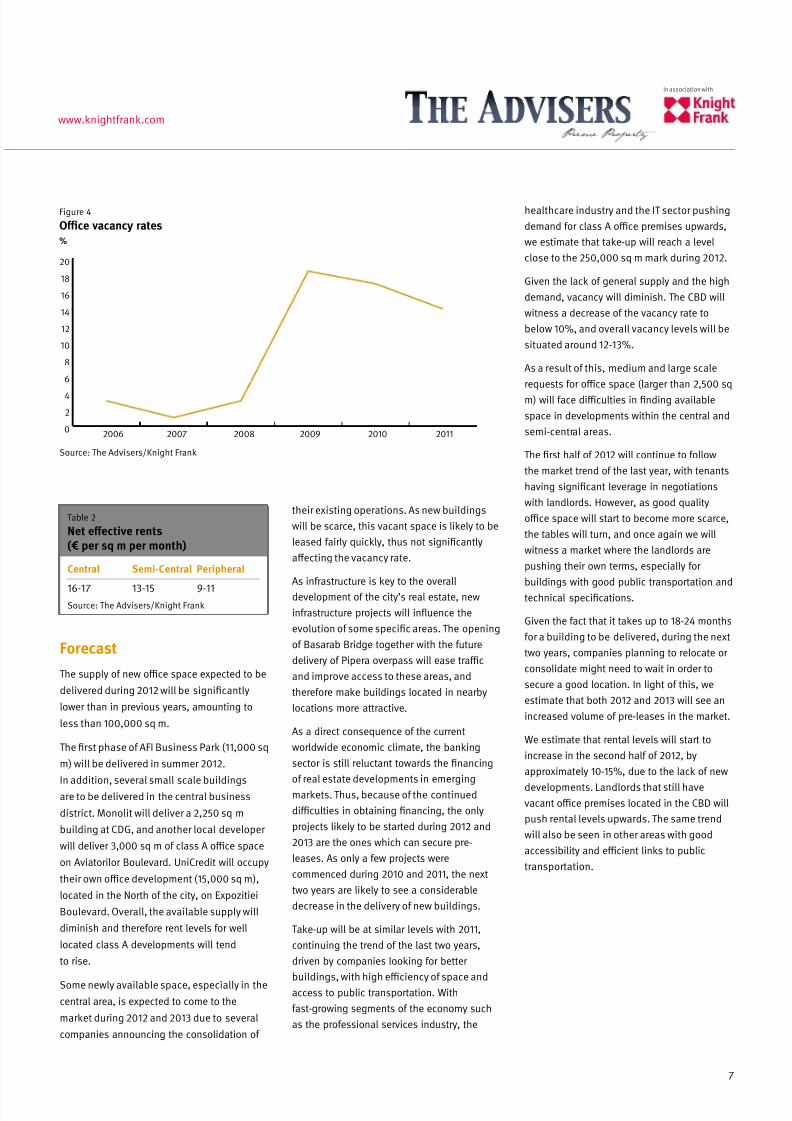
In comparison with the previous year, when
almost 265,000 sq m were brought to the
market, 2011 saw a signicant decrease, of
over 70%. This fall is a consequence of the
worldwide economic crisis which caused a
0
200,000
400,000
600,000
800,000
1,000,000
1,200,000
1,400,000
1,600,000
1,800,000
2006
2007 2008 2009 2010 2011
Figure 1
Evolution of oce stock sq m
Source: The Advisers/Knight Frank
Total stock New supply
(18,000 sq m GLA) and Expozitiei Project
(15,000 sq m GLA). Additionally, several other
smaller buildings such as Aviatorilor Oces
and Monolit Oces are currently being
developed in prime locations throughout the
city.
Demand
Transactions closed during 2011 came to a
total of over 240,000 sq m, bringing a 7%
increase in take-up compared with 2010.
Willbrook Platinum Business and Convention Center
7/27/2019 Romania Market Overview 2013
http://slidepdf.com/reader/full/romania-market-overview-2013 6/20
2012
Romania
MARKET OVERVIEWReview & outlook
6
http://knightfrank.com/romania
Vacancy
The location, accessibility and public
transportation links of a given area, together
with the quality of buildings remained key
factors in determining vacancy levels.
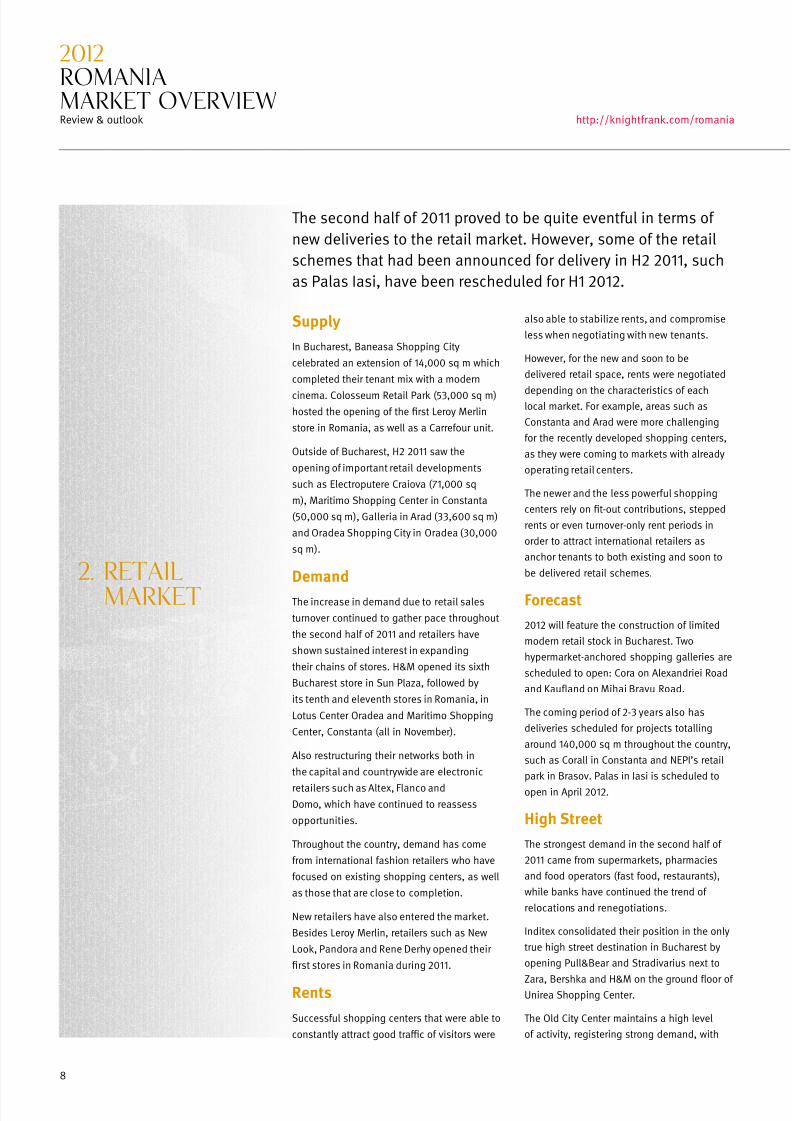
Given the lack of new deliveries in the center
and semi-center during 2011, these areas
have seen decreases in their vacancy rates,
from almost 15% at the beginning of 2010, to
10-12% at the end of 2011. Within the central
business district the current vacancy level is
around 10%, while the Calea Floreasca/Barbu
Vacarescu area has the lowest vacancy rate, at
below 1%.
The highest vacancy rate, of around 20%, can
be found in the periphery of the city. However,
vacancy levels vary from one individual area
to another, depending on factors such as
location, accessibility and rent levels.
Rents
Prime oce rents remained broadly stable,
maintaining the same level that has been
recorded over the last 18 months, without any
major uctuations.
The average level of the service charge for
class A buildings remained at around €4/sq
m/month, while business parks have lower
service charges.
New demand represented almost 80%, while
renegotiations/renewals accounted for the
remainder. As a result of a stabilization of the
economy, tenants became less cautious. They
have begun looking at better buildings, being
able to take on relocation costs. Moreover,
many tenants with leases close to their
termination have decided to relocate to more
ecient buildings with better technical
specications.
Despite the higher demand, no pre-leases
were signed, given the space still available in
the market. In some cases, large leases were
signed for buildings that were almost
completed, but not delivered; these
transactions do not count as pre-leases, as
the space was almost ready to receive
tenants.
Unusually, take-up in 2011 was split almost
equally between the center (32%), semi-
center (37%) and the periphery (31%). There
are two main contributing factors to this.
Firstly, the market has seen several large
requirements, coming mainly from healthcare
providers and the IT&C industry, with
companies planning to expand their activities
in the local market.
Given the lack of available space in the city
center, and the higher rents, most of these
occupiers were oriented towards the
periphery. Here they have beneted from
0
50,000
100,000
150,000
200,000
250,000
300,000
350,000
400,000
450,000
2006
2007 2008 2009 2010 2011
Figure 3
New supply vs take-upsq m
Source: The Advisers/Knight Frank
New supply Take-up
more exible landlords and lower costs, due
to the high amount of available space able to
accommodate their large requirements.
On the other hand, the center and semi-center
remained in the focus of tenants, due to their
high visibility and good accessibility.
The most active players in the market
remained the above mentioned IT&C and
healthcare industries, together with the
banking/nancial sector and professional
services.
Hermes Business Campus – rst phase
7/27/2019 Romania Market Overview 2013
http://slidepdf.com/reader/full/romania-market-overview-2013 7/20
7
www.knightfrank.com
in association with
Table 2
Net eective rents(€ per sq m per month)
Central Semi-Central Peripheral
16-17 13-15 9-11Source: The Advisers/Knight Frank
Forecast
The supply of new oce space expected to be
delivered during 2012 will be signicantly
lower than in previous years, amounting to
less than 100,000 sq m.
The rst phase of AFI Business Park (11,000 sq
m) will be delivered in summer 2012.
In addition, several small scale buildingsare to be delivered in the central business
district. Monolit will deliver a 2,250 sq m
building at CDG, and another local developer
will deliver 3,000 sq m of class A oce space
on Aviatorilor Boulevard. UniCredit will occupy
their own oce development (15,000 sq m),
located in the North of the city, on Expozitiei
Boulevard. Overall, the available supply will
diminish and therefore rent levels for well
located class A developments will tend
to rise.
Some newly available space, especially in the
central area, is expected to come to the
market during 2012 and 2013 due to several
companies announcing the consolidation of
their existing operations. As new buildings
will be scarce, this vacant space is likely to be
leased fairly quickly, thus not signicantly
aecting the vacancy rate.
As infrastructure is key to the overall
development of the city’s real estate, new
infrastructure projects will inuence the
evolution of some specic areas. The opening
of Basarab Bridge together with the future
delivery of Pipera overpass will ease trac
and improve access to these areas, and
therefore make buildings located in nearby
locations more attractive.
As a direct consequence of the current
worldwide economic climate, the banking
sector is still reluctant towards the nancing
of real estate developments in emerging
markets. Thus, because of the continued
diculties in obtaining nancing, the only
projects likely to be started during 2012 and
2013 are the ones which can secure pre-
leases. As only a few projects were
commenced during 2010 and 2011, the next
two years are likely to see a considerable
decrease in the delivery of new buildings.
Take-up will be at similar levels with 2011,
continuing the trend of the last two years,
driven by companies looking for better
buildings, with high eciency of space andaccess to public transportation. With
fast-growing segments of the economy such
as the professional services industry, the
0
2
4
6
8
10
12
14
16
18
20
2006
2007 2008 2009 2010 2011
Figure 4
Oce vacancy rates %
Source: The Advisers/Knight Frank
healthcare industry and the IT sector pushing
demand for class A oce premises upwards,
we estimate that take-up will reach a level
close to the 250,000 sq m mark during 2012.
Given the lack of general supply and the high
demand, vacancy will diminish. The CBD will
witness a decrease of the vacancy rate to
below 10%, and overall vacancy levels will be
situated around 12-13%.
As a result of this, medium and large scale
requests for oce space (larger than 2,500 sq
m) will face diculties in nding available
space in developments within the central and
semi-central areas.
The rst half of 2012 will continue to follow
the market trend of the last year, with tenants
having signicant leverage in negotiations
with landlords. However, as good quality
oce space will start to become more scarce,
the tables will turn, and once again we will
witness a market where the landlords are
pushing their own terms, especially for
buildings with good public transportation and
technical specications.
Given the fact that it takes up to 18-24 months
for a building to be delivered, during the next
two years, companies planning to relocate or
consolidate might need to wait in order to
secure a good location. In light of this, we
estimate that both 2012 and 2013 will see an
increased volume of pre-leases in the market.
We estimate that rental levels will start to
increase in the second half of 2012, by
approximately 10-15%, due to the lack of new
developments. Landlords that still havevacant oce premises located in the CBD will
push rental levels upwards. The same trend
will also be seen in other areas with good
accessibility and ecient links to public
transportation.
7/27/2019 Romania Market Overview 2013
http://slidepdf.com/reader/full/romania-market-overview-2013 8/20
2012
Romania
MARKET OVERVIEWReview & outlook
8
http://knightfrank.com/romania
Supply
In Bucharest, Baneasa Shopping City
celebrated an extension of 14,000 sq m which
completed their tenant mix with a modern
cinema. Colosseum Retail Park (53,000 sq m)
hosted the opening of the rst Leroy Merlin
store in Romania, as well as a Carrefour unit.
Outside of Bucharest, H2 2011 saw the
opening of important retail developments
such as Electroputere Craiova (71,000 sq
m), Maritimo Shopping Center in Constanta
(50,000 sq m), Galleria in Arad (33,600 sq m)
and Oradea Shopping City in Oradea (30,000
sq m).
Demand
The increase in demand due to retail sales
turnover continued to gather pace throughout
the second half of 2011 and retailers have
shown sustained interest in expanding
their chains of stores. H&M opened its sixth
Bucharest store in Sun Plaza, followed by
its tenth and eleventh stores in Romania, in
Lotus Center Oradea and Maritimo Shopping
Center, Constanta (all in November).
Also restructuring their networks both in
the capital and countrywide are electronic
retailers such as Altex, Flanco and
Domo, which have continued to reassess
opportunities.
Throughout the country, demand has come
from international fashion retailers who have
focused on existing shopping centers, as well
as those that are close to completion.
New retailers have also entered the market.
Besides Leroy Merlin, retailers such as New
Look, Pandora and Rene Derhy opened their
rst stores in Romania during 2011.
Rents
Successful shopping centers that were able to
constantly attract good trac of visitors were
2. RETAIl
MARKET
also able to stabilize rents, and compromise
less when negotiating with new tenants.
However, for the new and soon to be
delivered retail space, rents were negotiated
depending on the characteristics of eachlocal market. For example, areas such as
Constanta and Arad were more challenging
for the recently developed shopping centers,
as they were coming to markets with already
operating retail centers.
The newer and the less powerful shopping
centers rely on t-out contributions, stepped
rents or even turnover-only rent periods in
order to attract international retailers as
anchor tenants to both existing and soon to
be delivered retail schemes.
Forecast
2012 will feature the construction of limited
modern retail stock in Bucharest. Two
hypermarket-anchored shopping galleries are
scheduled to open: Cora on Alexandriei Road
and Kauand on Mihai Bravu Road.
The coming period of 2-3 years also has
deliveries scheduled for projects totalling
around 140,000 sq m throughout the country,
such as Corall in Constanta and NEPI’s retail
park in Brasov. Palas in Iasi is scheduled to
open in April 2012.
High Street
The strongest demand in the second half of
2011 came from supermarkets, pharmacies
and food operators (fast food, restaurants),
while banks have continued the trend of
relocations and renegotiations.
Inditex consolidated their position in the only
true high street destination in Bucharest by
opening Pull&Bear and Stradivarius next to
Zara, Bershka and H&M on the ground oor of Unirea Shopping Center.
The Old City Center maintains a high level
of activity, registering strong demand, with
The second half of 2011 proved to be quite eventful in terms of
new deliveries to the retail market. However, some of the retail
schemes that had been announced for delivery in H2 2011, such
as Palas Iasi, have been rescheduled for H1 2012.
7/27/2019 Romania Market Overview 2013
http://slidepdf.com/reader/full/romania-market-overview-2013 9/20
9
www.knightfrank.com
in association with
several restaurant and bar operators lookingto secure locations and cash in on the high
footfall.
Infrastructure works have been completed
in the second half of 2011, making the area
even more attractive and, although the foot
trac decreased towards the end of the year
due to the cold season, business has been
maintained at a satisfactory level compared
to previous years.
Following the trend set by other luxury and
high fashion brands, Burberry and Max Mara
have signed on Calea Victoriei and in the
vicinity, in the area close to Radisson hotel.
Calea Victoriei maintains the status of a luxury
destination, followed closely behind by theMarriot hotel retail gallery which continues to
attract well-known brands such as Valentino.
Magheru and Balcescu Blvd, which were
among the most expensive and sought
after locations before 2008, have registered
high vacancy rates as these areas have
encountered diculties in nding appropriate
retailers to ll the empty spaces.
The most active players on the market,
supermarkets such as Mega Image, Carrefour,
Pro and Billa, have looked to consolidate
and take advantage of the current lower
rental levels.
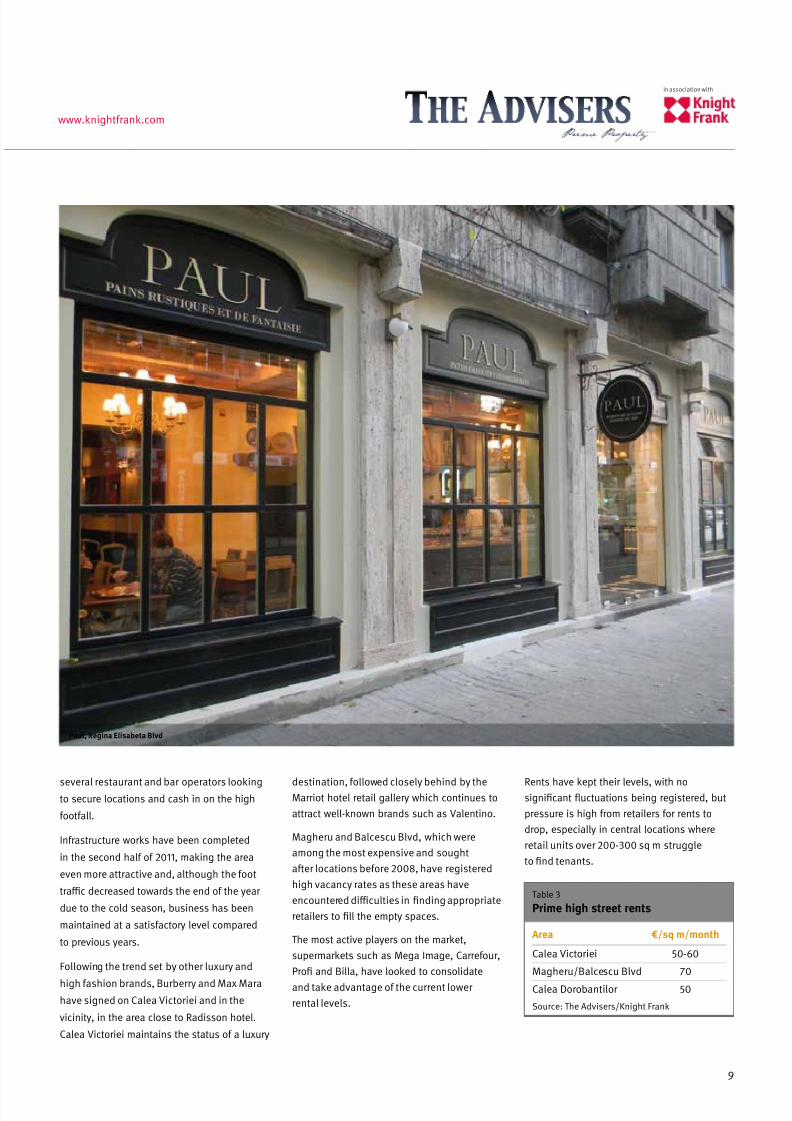
Paul, Regina Elisabeta Blvd
Rents have kept their levels, with nosignicant uctuations being registered, but
pressure is high from retailers for rents to
drop, especially in central locations where
retail units over 200-300 sq m struggle
to nd tenants.
Table 3
Prime high street rents
Area €/sq m/month
Calea Victoriei 50-60
Magheru/Balcescu Blvd 70
Calea Dorobantilor 50
Source: The Advisers/Knight Frank
7/27/2019 Romania Market Overview 2013
http://slidepdf.com/reader/full/romania-market-overview-2013 10/20
2012
Romania
MARKET OVERVIEWReview & outlook
10
http://knightfrank.com/romania
3. INDUSTRIAl
MARKET
Supply
Similar to 2010, 2011 was a challenging
year for both landlords and tenants. Heavily
inuenced by the economic conditions, most
of the market players remained cautious.
Continuing the trend that started in 2010,
during 2011 the balance of the market moved
away from Bucharest, towards cities like
Ploiesti, Pitesti, Craiova, Timisoara and Cluj,
where demand for modern warehouses
increased, for both production and logistics.
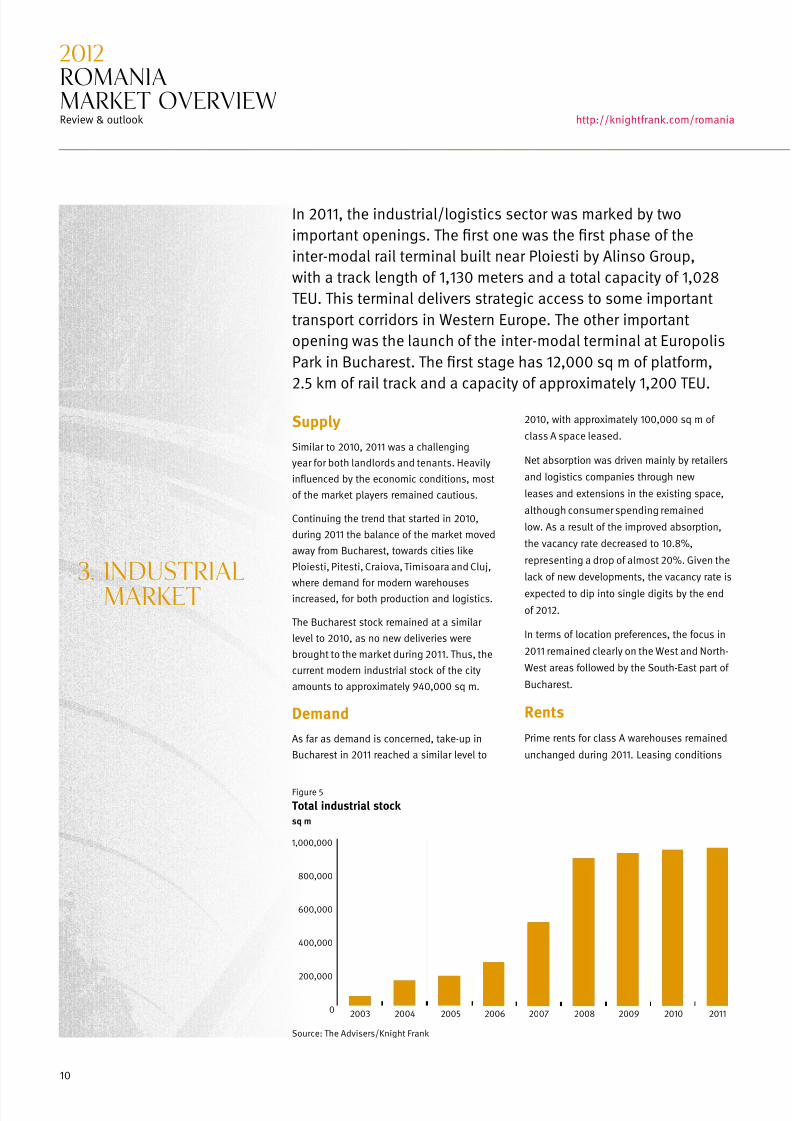
The Bucharest stock remained at a similar
level to 2010, as no new deliveries were
brought to the market during 2011. Thus, the
current modern industrial stock of the city
amounts to approximately 940,000 sq m.
Demand
As far as demand is concerned, take-up in
Bucharest in 2011 reached a similar level to
2010, with approximately 100,000 sq m of
class A space leased.
Net absorption was driven mainly by retailers
and logistics companies through new
leases and extensions in the existing space,
although consumer spending remained
low. As a result of the improved absorption,
the vacancy rate decreased to 10.8%,
representing a drop of almost 20%. Given the
lack of new developments, the vacancy rate is
expected to dip into single digits by the end
of 2012.
In terms of location preferences, the focus in
2011 remained clearly on the West and North-
West areas followed by the South-East part of
Bucharest.
Rents
Prime rents for class A warehouses remained
unchanged during 2011. Leasing conditions
0
200,000
400,000
600,000
800,000
1,000,000
2003
2004 2005 2006 2007 2008 2009 2010 2011
Figure 5
Total industrial stock sq m
Source: The Advisers/Knight Frank
In 2011, the industrial/logistics sector was marked by two
important openings. The rst one was the rst phase of the
inter-modal rail terminal built near Ploiesti by Alinso Group,
with a track length of 1,130 meters and a total capacity of 1,028
TEU. This terminal delivers strategic access to some important
transport corridors in Western Europe. The other important
opening was the launch of the inter-modal terminal at Europolis
Park in Bucharest. The rst stage has 12,000 sq m of platform,
2.5 km of rail track and a capacity of approximately 1,200 TEU.
7/27/2019 Romania Market Overview 2013
http://slidepdf.com/reader/full/romania-market-overview-2013 11/20
11
www.knightfrank.com
in association with
0
2
4
6
8
10
12
14
16
2007 2008 2009 2010 2011
Figure 6
Industrial vacancy rates%
Source: The Advisers/Knight Frank
which is following a similar trend to other
countries in the region, such as the Czech
Republic and Poland.
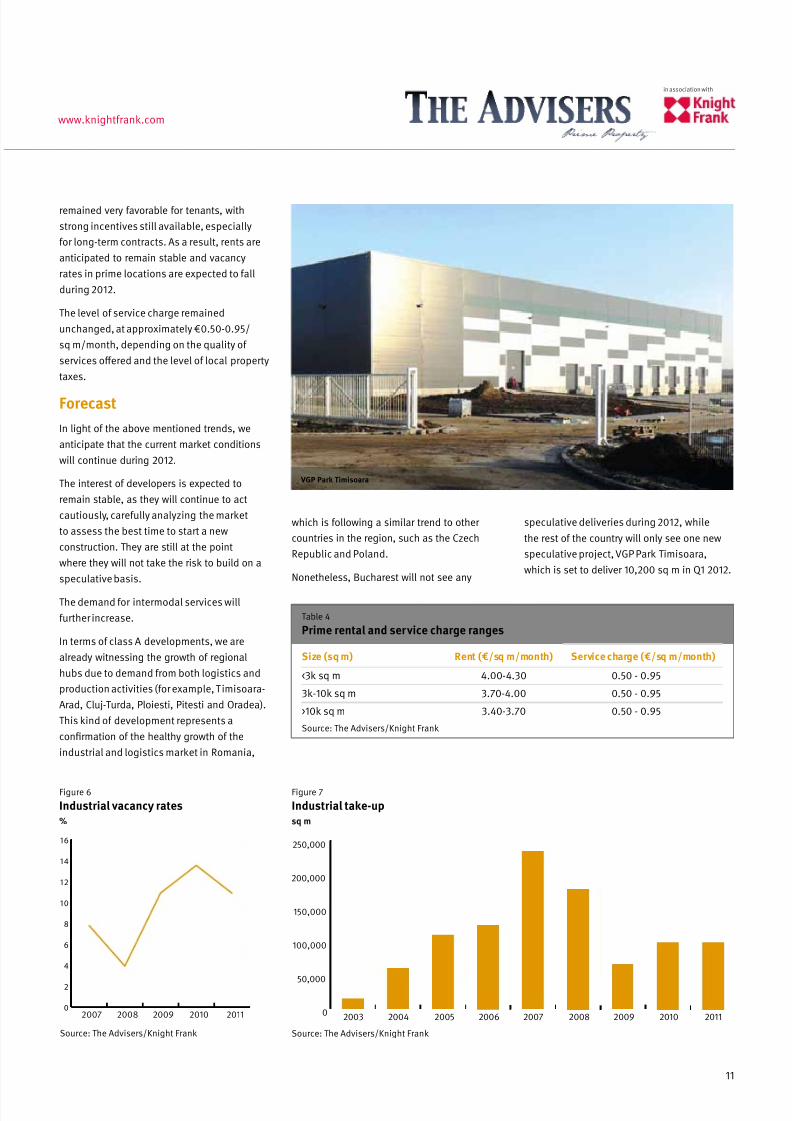
Nonetheless, Bucharest will not see any
speculative deliveries during 2012, while
the rest of the country will only see one new
speculative project, VGP Park Timisoara,
which is set to deliver 10,200 sq m in Q1 2012.
Table 4
Prime rental and service charge ranges
Size (sq m) Rent (€/sq m/month) Service charge (€/sq m/month)
<3k sq m 4.00-4.30 0.50 - 0.95
3k-10k sq m 3.70-4.00 0.50 - 0.95
>10k sq m 3.40-3.70 0.50 - 0.95
Source: The Advisers/Knight Frank
0
50,000
100,000
150,000
200,000
250,000
2003
2004 2005 2006 2007 2008 2009 2010 2011
Figure 7
Industrial take-upsq m
Source: The Advisers/Knight Frank
remained very favorable for tenants, with
strong incentives still available, especially
for long-term contracts. As a result, rents are
anticipated to remain stable and vacancy
rates in prime locations are expected to fall
during 2012.
The level of service charge remained
unchanged, at approximately €0.50-0.95/
sq m/month, depending on the quality of
services oered and the level of local property
taxes.
Forecast
In light of the above mentioned trends, we
anticipate that the current market conditions
will continue during 2012.
The interest of developers is expected to
remain stable, as they will continue to act
cautiously, carefully analyzing the market
to assess the best time to start a new
construction. They are still at the point
where they will not take the risk to build on a
speculative basis.
The demand for intermodal services will
further increase.
In terms of class A developments, we are
already witnessing the growth of regional
hubs due to demand from both logistics and
production activities (for example, Timisoara-
Arad, Cluj-Turda, Ploiesti, Pitesti and Oradea).
This kind of development represents a
conrmation of the healthy growth of the
industrial and logistics market in Romania,
VGP Park Timisoara

7/27/2019 Romania Market Overview 2013
http://slidepdf.com/reader/full/romania-market-overview-2013 12/20
2012
Romania
MARKET OVERVIEWReview & outlook
12
http://knightfrank.com/romania
4. lAND
MARKET
Although still not reaching its highest
potential, the market has shown a certain
vibrancy in terms of potential deals and
interested parties. The active players included
end-users such as retailers, gas station
chains, pharmaceutical and manufacturing
companies.
A very powerful driver of the land market
came from oce space developers. Their
requirements were focused on some specic
areas, such as the Barbu Vacarescu/Calea
Floreasca area, which has become the most
sought-after business district in Bucharest
during the last two years. After two years
of inactivity, potential buyers became
more interested in buying the available
land plots here, driven by the low vacancy
rates in certain districts. However, they are
still cautious in signing transactions. This
was also conrmed by the longer period
of negotiations, with it taking up to 6-9
months in order for the parties to complete
a transaction. Because of the zoning and
planning issues faced by developers,
the majority of buyers expect that all
documentation for a land site is settled before
closing a transaction, including building
permits and other necessary papers.
Nevertheless, the big retailers such as Cora,
Kauand and Auchan remained the most
active players in the land market. They have
focused in buying strategic land plots in
key locations, which were impossible to
acquire in the booming period due to the
very high prices. Dedeman was by far the
biggest investor in land in the DIY segment,
expanding throughout the country in cities
like Constanta and Baia Mare, with its total
chain reaching 26 stores, varying from 6,000
to 18,000 sq m.
Basarab Bridge, Bucharest
2011 was characterized by stability and improved demand, but
also by cautiousness regarding the signing of new transactions.
7/27/2019 Romania Market Overview 2013
http://slidepdf.com/reader/full/romania-market-overview-2013 13/20
13
www.knightfrank.com
in association with
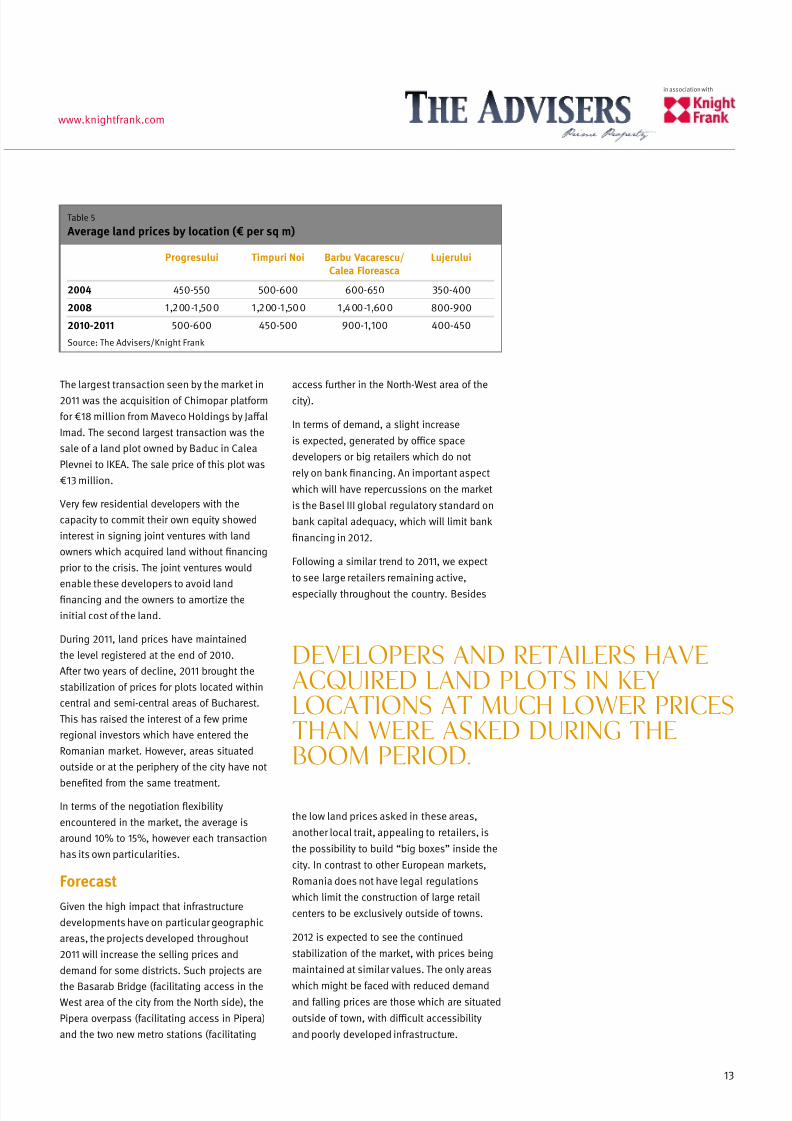
Table 5
Average land prices by location (€ per sq m)
Progresului Timpuri Noi Barbu Vacarescu/Calea Floreasca
Lujerului
2004 450-550 500-600 600-650 350-400
2008 1,200-1,500 1,200-1,500 1,400-1,600 800-900
2010-2011 500-600 450-500 900-1,100 400-450
Source: The Advisers/Knight Frank
The largest transaction seen by the market in
2011 was the acquisition of Chimopar platform
for €18 million from Maveco Holdings by Jaal
Imad. The second largest transaction was the
sale of a land plot owned by Baduc in Calea
Plevnei to IKEA. The sale price of this plot was
€13 million.
Very few residential developers with the
capacity to commit their own equity showed
interest in signing joint ventures with land
owners which acquired land without nancing
prior to the crisis. The joint ventures would
enable these developers to avoid landnancing and the owners to amortize the
initial cost of the land.
During 2011, land prices have maintained
the level registered at the end of 2010.
After two years of decline, 2011 brought the
stabilization of prices for plots located within
central and semi-central areas of Bucharest.
This has raised the interest of a few prime
regional investors which have entered the
Romanian market. However, areas situated
outside or at the periphery of the city have not
beneted from the same treatment.
In terms of the negotiation exibility
encountered in the market, the average is
around 10% to 15%, however each transaction
has its own particularities.
Forecast
Given the high impact that infrastructure
developments have on particular geographic
areas, the projects developed throughout
2011 will increase the selling prices and
demand for some districts. Such projects are
the Basarab Bridge (facilitating access in the
West area of the city from the North side), the
Pipera overpass (facilitating access in Pipera)
and the two new metro stations (facilitating
access further in the North-West area of the
city).
In terms of demand, a slight increase
is expected, generated by oce space
developers or big retailers which do not
rely on bank nancing. An important aspect
which will have repercussions on the market
is the Basel III global regulatory standard on
bank capital adequacy, which will limit bank
nancing in 2012.
Following a similar trend to 2011, we expect
to see large retailers remaining active,
especially throughout the country. Besides
the low land prices asked in these areas,
another local trait, appealing to retailers, is
the possibility to build “big boxes” inside the
city. In contrast to other European markets,
Romania does not have legal regulations
which limit the construction of large retail
centers to be exclusively outside of towns.
2012 is expected to see the continued
stabilization of the market, with prices being
maintained at similar values. The only areas
which might be faced with reduced demand
and falling prices are those which are situated
outside of town, with dicult accessibility
and poorly developed infrastructure.
Developers and retailers have
acquired land plots in key
locations at much lower prices
than were asked during the
boom period.
7/27/2019 Romania Market Overview 2013
http://slidepdf.com/reader/full/romania-market-overview-2013 14/20
2012
Romania
MARKET OVERVIEWReview & outlook
14
http://knightfrank.com/romania
5. INVESTMENT
MARKET
An important aspect of this period was the
fact that current market conditions have
enabled prime properties to become available
for sale. Prices stabilized and will remain
constant throughout 2012.
The time taken to negotiate and close
transactions increased due to the more
dicult nancing conditions. Investors
targeted properties with nancing in place in
order to avoid this issue.
Demand
Demand is driven by the same international
companies who have maintained their
condence and interest in the Romanian
market ever since they entered it in 2004-
2005. NEPI listed at the Bucharest stock
exchange and continued to be aggressive in
buying properties while CA Immo nalized the
takeover of Europolis.
A number of smaller properties of a value
of up to €15 million have been acquired
by Romanian entrepreneurs redirecting
investments from other businesses.
Supply
There is a good supply of stock in oce and
retail schemes with long sustainable lease
contracts. The most sought-after properties
were big box units (with unbreakable lease
contracts for a minimum of 7 years) and fully
leased oce buildings with international
tenants in central or semi central locations.
An eect of the current world economicsituation was seen in the fact that the
majority of deals did not involve cash –
they were either joint ventures or share deals.
Financing became even more dicult to
access in 2011, which inevitably led to some
negotiations being postponed until further
notice. However, it is expected that solutions
to make nancing easier will be found
in 2012.
The yields registered in 2011 have remained
similar to the ones from 2010. The sale of
Floreasca Business Park at the end of 2010
has set the benchmark for the oce sector at
between 8% and 8.5%.
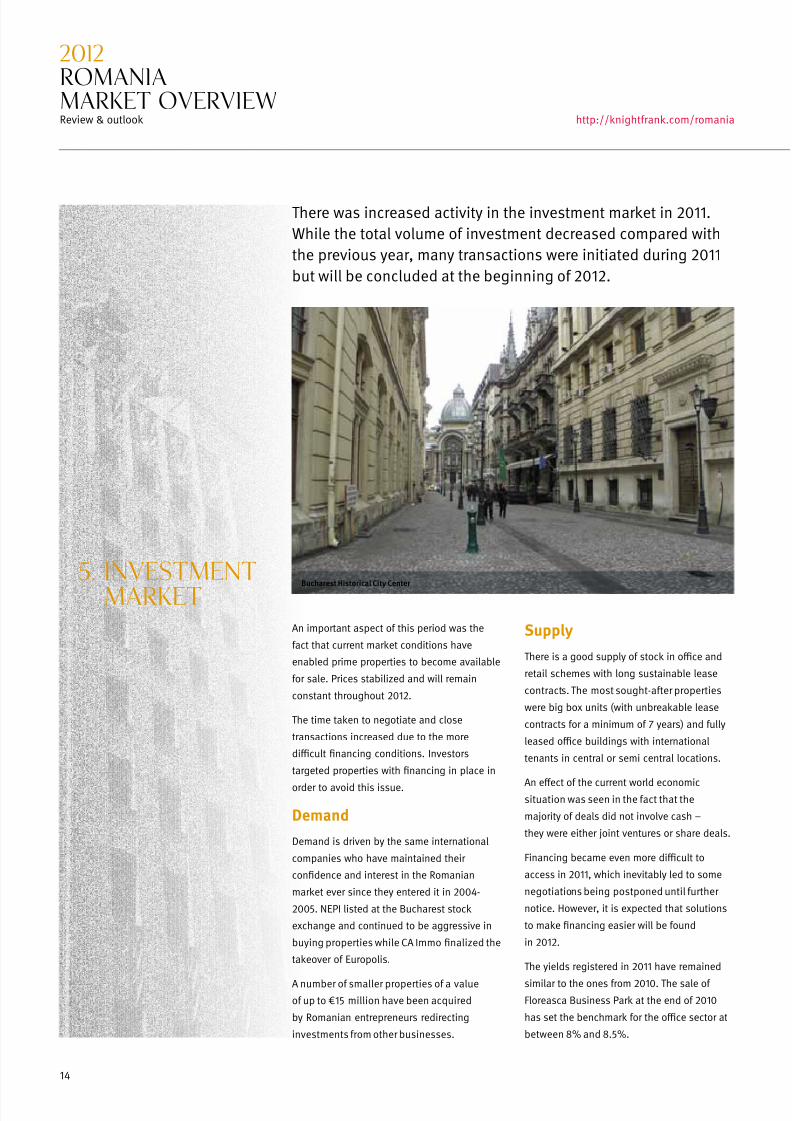
There was increased activity in the investment market in 2011.
While the total volume of investment decreased compared with
the previous year, many transactions were initiated during 2011
but will be concluded at the beginning of 2012.
Bucharest Historical City Center

7/27/2019 Romania Market Overview 2013
http://slidepdf.com/reader/full/romania-market-overview-2013 15/20
15
www.knightfrank.com
in association with
Table 6
Prime property yields (%)
Oces Retail Industrial
8.00-8.50 9.00-9.50 9.50-10.50
Source: The Advisers/Knight Frank
Infrastructure works in the city have helped
the investment market and improved aspects
such as accessibility and trac in important
areas, leading to increased interest in
properties in the surrounding locations. TheBasarab Bridge and the Pipera overpass are
signicant examples.
In total, the volume of deals in the investment
market in 2011 was approximately €250
million.
In spite of the dicult environment, there
were still a number of notable transactions
in 2011. NEPI acquired a stake in the soon-
to-be-built Victoria City shopping center.
Argo RE took over Omilos, the owner of two
shopping centers: Era Oradea and Era Iasi,
with a combined worth of approximately
€150 million. Argo thus became the largest
owner of shopping centers in Romania. Also
of note, Adama sold its remaining stake to
Immonanz for €42.7 million.
Having gone through a setback in 2009and 2010, 2011 did mark a slight increase
in economic growth in Romania and 2012 is
expected to slowly but surely follow the same
trend.
The Lakeview oce building

7/27/2019 Romania Market Overview 2013
http://slidepdf.com/reader/full/romania-market-overview-2013 16/20
2012
Romania
MARKET OVERVIEWReview & outlook
16
http://knightfrank.com/romania
6. VAlUATIONS
Property Taxation
for lega Entities
Demand
Property taxation for real estate assets owned by legal
entities in Romania is split into two main elements: land and
construction taxes.
For sites, the annual levy is calculatedaccording to coecients established by the
Fiscal Code, depending on the land area,
the locality classication, the use of the site
according to local urbanism authorities, etc.
On the other hand, for constructions, the yearly
toll level is between 0.25% and 1.50% of the
gross book value of the construction, more
precisely of the inventory value registered in
the books of the property owner. For buildings
which have been entirely depreciated, the
property tax is diminished by 15%.
For calculation of the gross book value of
a building, one must take into account the
sum of the values of all its elements and
functional installations. Thus, terraces, stairs,
elevators as well as lighting, sanitary, heating
installations and any other indispensable
element should be part of the gross book
value of the building, whereas the expendable
assets such as individual air conditioned split
units should not.
2011 Fiscal Code regulations
According to the 2011 issue of the Fiscal
Code, the tax quota for constructions can be
increased to amounts between 10% and 20%
of the inventory value for buildings which have
not been revalued during the last 3 years,
and between 30% and 40% for buildings not
revalued during the last 5 years.
If until recently, the maximum annual quota of
the property tax for constructions was 10% of
the gross book value in the case of buildings
which were not revalued during the previous
3 years, the recently published rules contain a
double ceiling in that case. Furthermore, the
updated law also introduced an up to 40% tax
quota of the gross book value for constructionswhich were not revalued during the previous 5
years. Therefore, landlords who are not aware
of the law changes might nd themselves in
the position of having to settle a property tax
equal to the inventory value of the building
during 2 and a half years.
Another important element comprised in the
recent set of laws is the tax for non-operational
touristic properties. For these, the duty is
set at a minimum of 5% of the gross book
value of the building, the exact amount being
established by the local authorities.
Revaluations
According to accounting principles, once a
legal entity decides to revalue a building, it
needs to revalue the entire accounting class of
that asset. This means that if a company wants
to revalue one of its properties located for
instance in Bucharest, but owns also 3 other
properties throughout Romania, the legal
entity must revalue all 4 properties.
In terms of valuation dates, nancial
reporting revaluations performed for scal
purposes (reporting to DITL – Local Authority
for Taxation) are traditionally made as of
December 31. Nevertheless, local subsidiaries
of multinational companies that have opted for
a dierent scal period than the calendar year
have to revalue their assets accordingly, at the
end of the accounting year.

7/27/2019 Romania Market Overview 2013
http://slidepdf.com/reader/full/romania-market-overview-2013 17/20
17
www.knightfrank.com
in association with
7. IFRS AND
DEFERREDTAxES
The concept relies on the fact that accounting
treatment and tax treatment of certain
expenses and income may be dierent. In
cases where such dierences are temporary,
current income tax (prot tax) might not
reect the substance of transactions and the
accrual principle: the impact in prot or loss
of a certain expense could be in one period,
while the related current tax charges in
another period.
To illustrate, we can look at the treatment of a provision for a commercial litigation that
is booked based on the expected outcome
of a case. While the expense might be
recorded on the P&L based on the provision,
such amount is not currently deductible for
income tax purposes. As such, the current
year income tax charge for the company does
not take into account the eventual tax impact
of the deduction. This means that without
the deferred tax calculation, the current year
income tax of the company will look high in
relation to the reported income. On the other hand, when the litigation is solved and the
company is liable for the settlement amount
under the lawsuit, the expense becomes
deductible for current income tax purposes.
However, since the related expense for the
litigation outcome was already recorded
in the previous period (by recording the
provision) there will be a decrease of current
income tax that is not reected in the current
reported prot calculation and the current tax
charge would appear understated compared
to the level of income.
Deferred tax addresses this matter, by
recording the future impact on taxes for such
type of temporary dierences. In the above
example, a deferred tax asset would be set up
on the balance sheet, and a related deferred
tax benet would be credited in the prot or loss account in the year when the provision
is recorded. Essentially what this is doing is
adjusting the income eect of the expense
by also recognizing the eventual tax savings
associated with the deduction. To calculate
this, we take the amount of provision
multiplied by the applicable tax rate (which is
16% for Romania). Then, in the year when the
lawsuit is nalized and the expense becomes
deductible the temporary dierence reverses,
hence the deferred tax asset is reversed – the
reversal of the deferred tax credit o-sets the
deduction under current tax, thus having nil
impact on the tax charge, which matches the
nil expense related to the litigation.
Every company preparing
IFRS nancial statements isfaced with a complex matter –
deferred taxes. It is a dicult
concept and represents one
of the dierences between
IFRS and statutory accounting.
We will present the main
principles and specic
applications for Romanian
companies.
Author: Francesca Postolache,
Director, Real Estate Leader,
PwC.
Francesca Postolache

7/27/2019 Romania Market Overview 2013
http://slidepdf.com/reader/full/romania-market-overview-2013 18/20
2012
Romania
MARKET OVERVIEWReview & outlook
18
http://knightfrank.com/romania
The methodology of computation for deferred
taxes, as included in the International
Accounting Standard 12 ‘Income Taxes’ (“IAS
12”), is in summary as follows:
• For all assets and liabilities the tax base is
determined.
• The dierence between tax base and the
carrying amount (the amount for which
the asset and liability is recorded in the
IFRS nancial statements) represents a
temporary dierence.
• For temporary dierences, in Romania
deferred tax is computed by applying the
tax rate of 16% (with some exceptions
specically indicated in the standard).
• The tax base of an asset is the amount that
will be deductible for tax purposes against
any taxable economic benets that will ow
to the entity when it recovers the carrying
amount of the asset. If those economic
benets will not be taxable, the tax base of
the asset is equal to its carrying amount.
• The tax base for a liability is its carrying
amount, less any amount that will be
deductible for tax in respect of that liability
in future periods.
• Deferred tax shall be recognised as income
or an expense and included in prot or
loss for the period, except to the extent
that the tax arises from a transaction or
event which is recognised, in the same or a
dierent period outside prot or loss, either
in other comprehensive income or directly
in equity; or a business combination
(when deferred tax is recognised against
goodwill). An example where deferred tax
is not recognised in prot or loss is related
to revaluations of xed assets – deferred
tax impact of revaluations will also be
recognised in revaluation reserves.
It sounds complicated, but the general
principle is to record the tax eect of
temporary dierences between accounting
prot and taxable prot so that such tax eect
is matched with the corresponding year inwhich the income or expense is reported for
accounting purposes.
One application of deferred tax that is
relevant for most Romanian real estate
developers or investors is in respect of
revaluation of xed assets or the sale of
companies with appreciated real estate.
Starting 1 May 2009 there have been several
changes in the Fiscal Code. From these
changes, one of them had a signicant
impact on deferred tax: a change in the
way the revaluations of property, plant and
equipment performed after 1 January 2004
were treated for tax purposes.
This change led to a decrease in the tax base
of xed assets. The new tax base became
the historical cost (or revalued amount at 1
January 2004) less accumulated depreciation
on this historical cost (or revalued amount at 1
January 2004), because this is amount that is
deductible for current tax purposes.
For deferred tax computations, the IFRS
net book value of xed assets needs to be
compared with this lower tax base.
Two typical situations where this has
signicant impact are as follows:
1. IFRS - historical cost;
Statutory - revaluation
Under this scenario the company has the
accounting policy under IFRS to record xed
assets at historical cost less accumulated
depreciation and any impairment losses,
while in the statutory accounts the respective
xed assets are stated at revalued amount.
In this case, if there is no other dierence
between IFRS and the statutory accounts
(such as dierent depreciation rates and
methods) and no dierences in scal
depreciation, no deferred tax will be recorded,
as the tax base is the historical amount,
which is equal to the IFRS book value. For IFRS
accounting the tax impact of depreciation is
matching the depreciation expense recorded,
as this amount of depreciation based on
historical amount will also be the one
deductible for tax purposes.
2. IFRS and Statutory –
revaluation
Under this scenario the company has the
same accounting policy under IFRS and
statutory, respectively to record xed assets
at revalued amounts.
In this case, a deferred tax liability typically
results (although with a downward valuation
it is conceivable that a deferred tax asset
could also arise), computed as the dierence
between the IFRS book value (revaluedamount) and the new tax base (historical cost
or revalued amount at 1 January 2004, less
accumulated depreciation computed until
the end of the reporting period based on this
historical cost or revalued amount at 1 January
2004).
In this situation the deferred tax liability is
recognized in equity (revaluation reserve) at
the moment of the change in scal legislation
(1 May 2009), as well as at any date when
subsequent revaluations are performed in
the IFRS nancial statements. This way, every
time there is a change in revaluation reserve
adjusting the value of the assets, the related
16% tax charge is also recorded in revaluation
reserve – the revaluation reserve will be
stated net of the tax charge of 16%.
Another important consideration is when a
local real estate company applies Romanian
statutory accounting rules, but an oshore
parent or potential acquirer applies IFRS.
In case of a sale of shares in a Romanian
entity with appreciated property, the oshore
acquiror applying IFRS may need to reduce
the carrying value of the appreciated asset
for a potential capital gains tax on eventual
disposal of the asset. This could have an
impact on the price negotiations between
foreign investors and Romanian shareholders
in real estate companies.
We hope the above has shed some light
on this complex accounting topic and next
time you are reading a set of IFRS nancial
statements the deferred tax lines will be less
of a mystery.

7/27/2019 Romania Market Overview 2013
http://slidepdf.com/reader/full/romania-market-overview-2013 19/20
19
www.knightfrank.com
in association with
7/27/2019 Romania Market Overview 2013
http://slidepdf.com/reader/full/romania-market-overview-2013 20/20
AmericasUSABermudaBrazilCanadaCaribbeanChile
AustralasiaAustraliaNew Zealand
EuropeUKAustria
BelgiumCzech RepublicFranceGermanyHungaryIrelandItalyMonacoPolandPortugalRomaniaRussiaSpainSwitzerlandThe Netherlands
Ukraine
AfricaBotswanaKenyaMalawiNigeriaSouth AfricaTanzaniaUgandaZambiaZimbabwe
AsiaCambodiaChina
Hong KongIndiaIndonesiaMacauMalaysiaSingaporeSouth KoreaThailandVietnam
The Gulf BahrainUAE
Romania
Horatiu Florescu
President & CEO
+40 21 380 85 85 - General
+40 21 380 85 35 - Fax
The Advisers, in association with Knight Frank, provides high standard consultancy
and representation services to developers, investors, owners and tenants, within
the entire array of real estate projects, in all market sectors, at both strategic andcommercial levels.
Sharing resources within the Knight Frank network, our team oers to its clients
international knowledge and expertise, tailored to the specic local needs.
Knight Frank Research provides strategic advice, consultancy services and forecasting
to a wide range of clients worldwide including developers, investors, funding
organisations, corporate institutions and the public sector. All our clients recognise
the need for expert independent advice customised to their specic needs.
Knight Frank Reports are also available at www.knightfrank.com
© Knight Frank LLP 2012
This report is published for general information only. Although high standards have been used in the
preparation of the information, analysis, views and projections presented in this report, no legal responsibility
can be accepted by Knight Frank Research or Knight Frank LLP for any loss or damage resultant from the
contents of this document. As a general report, this material does not necessarily represent the view of Knight
Frank LLP in relation to particular properties or projects. Reproduction of this report in whole or in part is
allowed with proper reference to Knight Frank Research.
Knight Frank LLP is a limited liability par tnership registered in England with registered number OC305934.
Our registered oce is 55 Baker Street, London, W1U 8AN, where you may look at a list of members’ names.
in association with