Embed Size (px)
Citation preview
1
A PROFILE OF THE SOUTH AFRICAN ROOIBOS TEA MARKET VALUE CHAIN
2011
Directorate Marketing Private Bag X 15
Arcadia 0007
Tel: 012 319 8455 Fax: 012 319 8131
Email: [email protected] www.daff.gov.za
2
Table of Contents
1. DESCRIPTION OF THE INDUSTRY 3
1.1 Production trends 4
1.2 Employment 6
2. MARKET STRUCTURE 6
2.1 Domestic market 6
2.1.1 Some of the price trends in the rooibos industry 6
2.2 Market Dynamics 7
2.2.1 Global market size and growth for product segment (South 7
African market where available) 7
2.2.2 Current positioning of rooibos tea within this market 8
2.2.3 Geographical patterns of demand Error! Bookmark not defined.
2.2.4 Import and export tariffs for tea 9
2.2.5 Market segment and product trends 9
2.2.6 Drivers of purchasing decisions 10
3. ROOIBOS TEA EXPORTS 10
3.1 Share Analysis 16
4. PROCESSING OF ROOIBOS TEA 18
4.1 Various packed products derived from rooibos plant 19
4.2 Choices of packaging 19
4.3 Rooibos tea processing stages 19
5. SWOT ANALYSIS 23
6. ACKNOWLEDGEMENTS 25
3
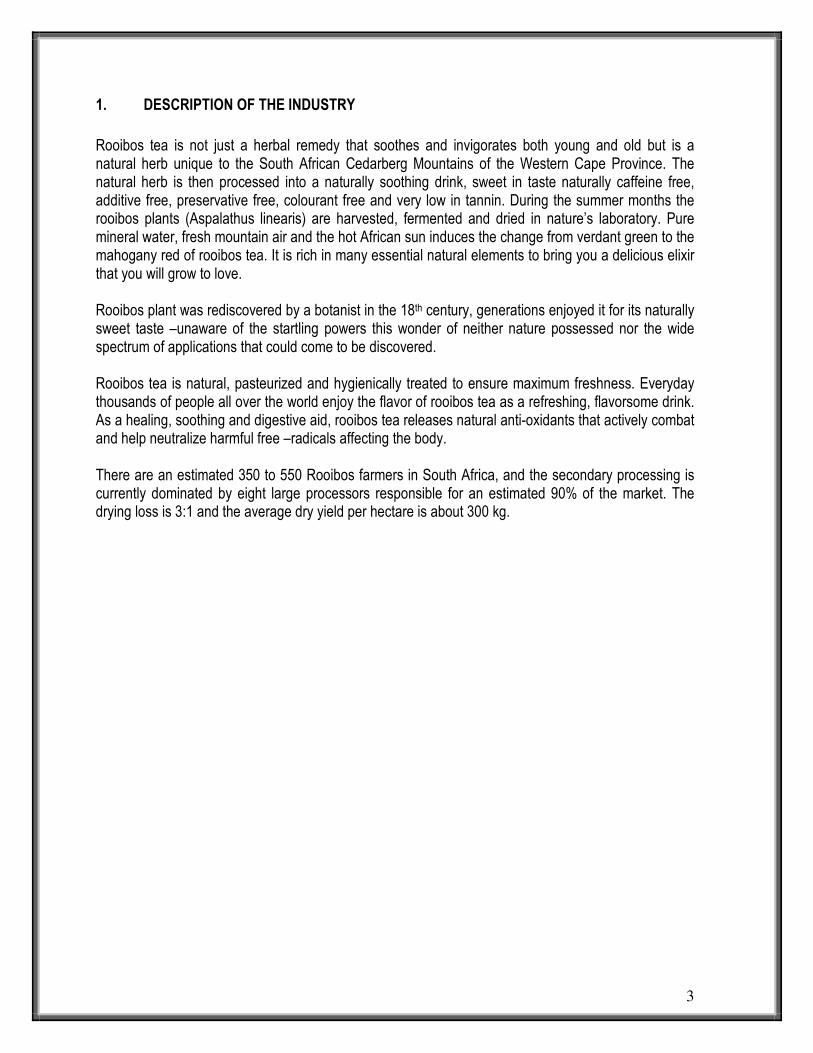
1. DESCRIPTION OF THE INDUSTRY
Rooibos tea is not just a herbal remedy that soothes and invigorates both young and old but is a natural herb unique to the South African Cedarberg Mountains of the Western Cape Province. The natural herb is then processed into a naturally soothing drink, sweet in taste naturally caffeine free, additive free, preservative free, colourant free and very low in tannin. During the summer months the rooibos plants (Aspalathus linearis) are harvested, fermented and dried in nature’s laboratory. Pure mineral water, fresh mountain air and the hot African sun induces the change from verdant green to the mahogany red of rooibos tea. It is rich in many essential natural elements to bring you a delicious elixir that you will grow to love. Rooibos plant was rediscovered by a botanist in the 18th century, generations enjoyed it for its naturally sweet taste –unaware of the startling powers this wonder of neither nature possessed nor the wide spectrum of applications that could come to be discovered. Rooibos tea is natural, pasteurized and hygienically treated to ensure maximum freshness. Everyday thousands of people all over the world enjoy the flavor of rooibos tea as a refreshing, flavorsome drink. As a healing, soothing and digestive aid, rooibos tea releases natural anti-oxidants that actively combat and help neutralize harmful free –radicals affecting the body. There are an estimated 350 to 550 Rooibos farmers in South Africa, and the secondary processing is currently dominated by eight large processors responsible for an estimated 90% of the market. The drying loss is 3:1 and the average dry yield per hectare is about 300 kg.
4
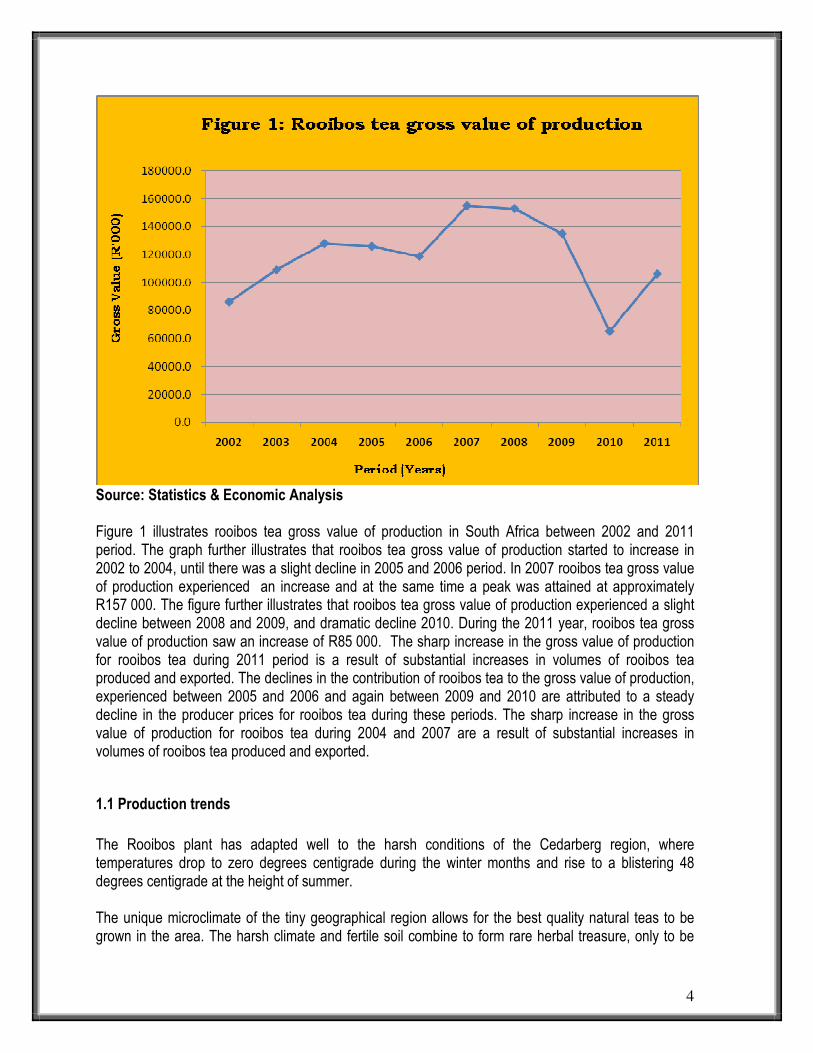
Source: Statistics & Economic Analysis Figure 1 illustrates rooibos tea gross value of production in South Africa between 2002 and 2011 period. The graph further illustrates that rooibos tea gross value of production started to increase in 2002 to 2004, until there was a slight decline in 2005 and 2006 period. In 2007 rooibos tea gross value of production experienced an increase and at the same time a peak was attained at approximately R157 000. The figure further illustrates that rooibos tea gross value of production experienced a slight decline between 2008 and 2009, and dramatic decline 2010. During the 2011 year, rooibos tea gross value of production saw an increase of R85 000. The sharp increase in the gross value of production for rooibos tea during 2011 period is a result of substantial increases in volumes of rooibos tea produced and exported. The declines in the contribution of rooibos tea to the gross value of production, experienced between 2005 and 2006 and again between 2009 and 2010 are attributed to a steady decline in the producer prices for rooibos tea during these periods. The sharp increase in the gross value of production for rooibos tea during 2004 and 2007 are a result of substantial increases in volumes of rooibos tea produced and exported.
1.1 Production trends
The Rooibos plant has adapted well to the harsh conditions of the Cedarberg region, where temperatures drop to zero degrees centigrade during the winter months and rise to a blistering 48 degrees centigrade at the height of summer. The unique microclimate of the tiny geographical region allows for the best quality natural teas to be grown in the area. The harsh climate and fertile soil combine to form rare herbal treasure, only to be
5
found in South Africa. The winter rains vary between as little as 180 mm to 500 mm for the year. No irrigation is used and the rooibos plant is often subjected to severe drought conditions. The survival mechanism of this hardy bush is its tap root that digs down 3m or more into the well-drained, cool, sandy soil that has a high acidity level. Cape Natural Tea Products is 50% owned by a group of Rooibos farmers and therefore source their tea directly from farmer shareholders. This enables Cape Natural Tea Products to manage its supply chain very efficiently. Producers have direct interest in supplying their best quality teas, both organic and conventional. Rooibos tea from Cape natural Tea Products grows on the slopes of the Cederberg mountain range in a 150 km radius from Clanmilliam in the Western Cape.
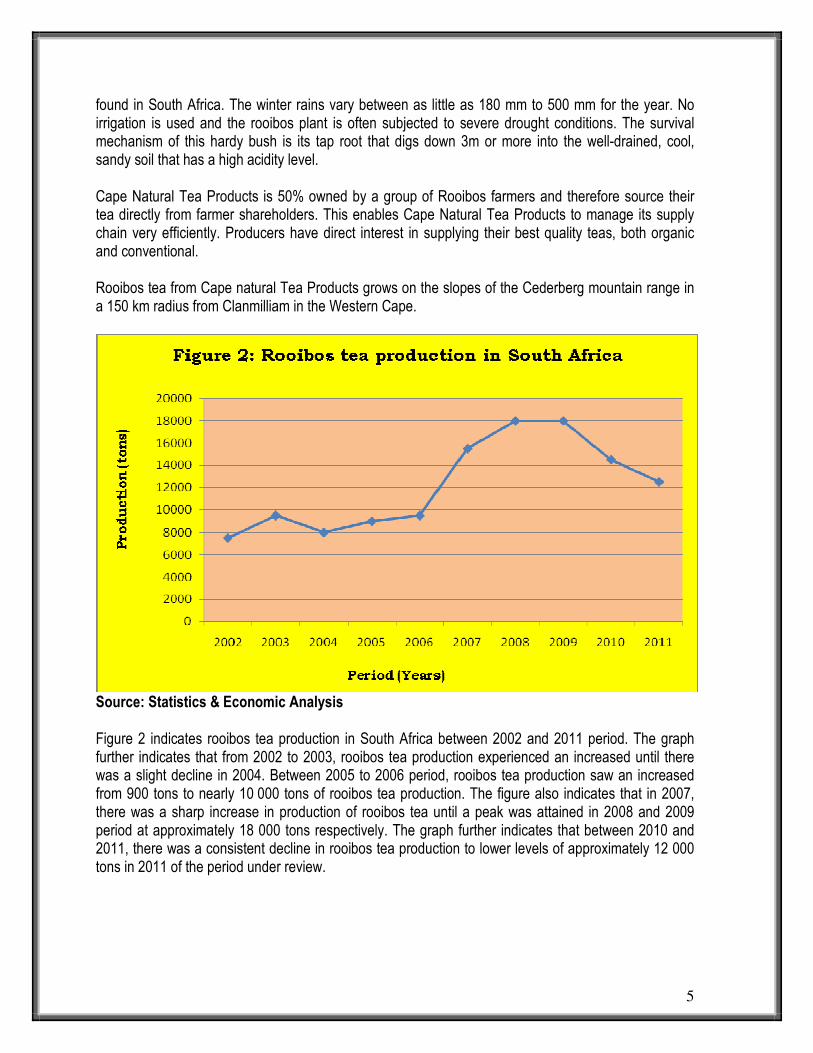
Source: Statistics & Economic Analysis Figure 2 indicates rooibos tea production in South Africa between 2002 and 2011 period. The graph further indicates that from 2002 to 2003, rooibos tea production experienced an increased until there was a slight decline in 2004. Between 2005 to 2006 period, rooibos tea production saw an increased from 900 tons to nearly 10 000 tons of rooibos tea production. The figure also indicates that in 2007, there was a sharp increase in production of rooibos tea until a peak was attained in 2008 and 2009 period at approximately 18 000 tons respectively. The graph further indicates that between 2010 and 2011, there was a consistent decline in rooibos tea production to lower levels of approximately 12 000 tons in 2011 of the period under review.
6
1.2 Employment
Traditionally Rooibos tea industry has employed more than 5000 people both in the farms and processing plants, and earns an estimated R500 million per year. Rooibos tea industry is one of the biggest employers of people from the rural provinces of South Africa, providing both permanent and seasonal employment opportunities in the industry.
2. MARKET STRUCTURE
2.1 Domestic market
Tea, like most other commodity products, is a US Dollar traded commodity across the world. Western Cape Province is the producer and supplier of rooibos tea for local consumption. On average, South Africa produces approximately 12 000 tons of rooibos tea per year. South Africans consumes 4500 to 5000 tons and the rest is exported. Movements in the US Dollar exchange rate compared to other currencies affect price competitiveness of such commodities. South Africa is a net importer of tea. Free market principles determine that domestic market prices will fluctuate in a price range between import parity and export parity levels. The level of competition in the domestic market ensures that prices are set as close as possible to import parity levels, whilst over supply, exchange rates and world market prices determine export parity price levels.
2.1.1 Some of the price trends in the rooibos industry
• Prices in the rooibos industry are prone to great variations depending on the harvest, for instance, currently the producer price is R4.50 cents/kg down from 1600 cents/kg in 2004 due to an overplanting of rooibos in response to the earlier high prices.
• Fairtrade Labelling Organization (FLO) International introduced a minimum price for rooibos tea in 2008, setting the minimum price paid to producers at R30.35/kg.
• Prices in the Honeybush industry are more stable as a general state of undersupply (few producers, drought-proneness in producing regions tends to keep prices consistently high.
7
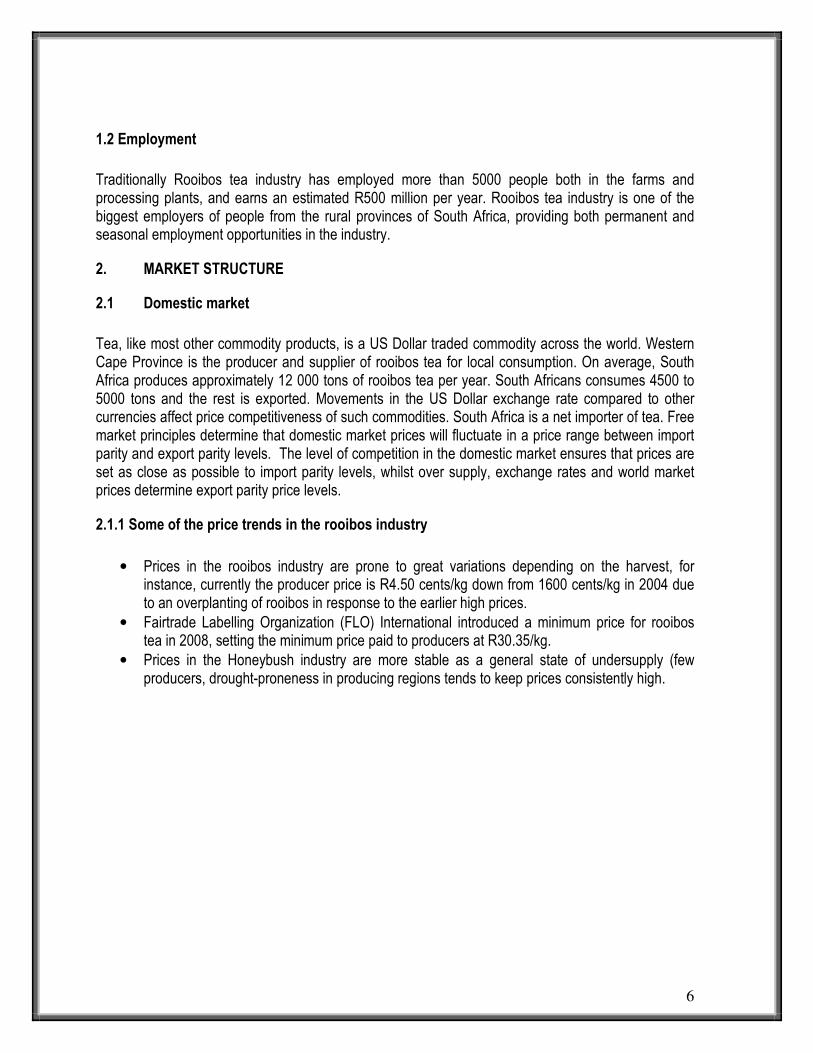
Source: Statistics & Economic Analysis Figure 3 shows rooibos tea average producer prices in South Africa between 2002 and 2011 period. The graph further shows that average producer prices started to increase in 2002 and 2003, the average producer prices for rooibos tea were steady during the same period. The figure also shows that rooibos tea average producer prices attained a peak in 2004 at approximately 1 600 cents per kilogram, followed by a sharp and dramatic decline in average producer prices from 2005 to 2010 period. The figure further shows that the lowest rooibos tea average producer prices were attained in 2010 at approximately R450 cents per kilogram. Rooibos tea average producer prices declined continuously between 2005 and 2010, and that can be attributed to a steady increase in the production of rooibos tea in the domestic market over the same period. The figure also shows that in 2011, rooibos tea average producer prices experienced an increase of approximately 850 cents per kilogram. The increase in average producer prices of rooibos tea can be attributed to a steady decline in production of rooibos tea during 2010 and 2011 period. (See figure 2 above) 2.2 Market Dynamics This section provides an overview of the key issues in the market for rooibos tea products:
2.2.1 Global market size and growth for product segment (South
African market where available)
• The global tea market value was estimated at US$23.3 billion in 2007 and the size of the herbal tea market is around 100, 000 tonnes and according to Tata Global Beverages, green/fruits and herbal tea account for 49% of the value of all global packaged tea revenues.
8
• The market for herbal tea is showing significant growth, particularly compared to black tea. For example, consumer black tea sales in the United Kingdom fell by 10.3 % between 1997 and 2002, while herbal teas increased by 50%.
• In South Africa, the hot drinks market is estimated to be worth around R3 billion annually, with an estimate of the total black tea market in South Africa to be around 21,000 to 22,000 tonnes per annum.
• The international fair-trade tea market was estimated to have a retail value of approximately 200 million euro’s (R1.9 billion) in 2009.
• South African exports of fairtrade rooibos tea to the United Kingdom and Germany in 2005 were 13.5 tonnes.
2.2.2 Current positioning of rooibos tea within this market
• Rooibos tea constitutes less than 0.3% of the global tea market, and 10% of the global herbal tea market. The total production volume was around 14,000 tonnes in 2007.
• In the fair-trade market, the estimated production volume of fair-trade Rooibos tea is around 18 tonnes per year.
• Locally, Rooibos tea mainly competes in the same segment as black tea and has an 18% market share of the domestic tea market.
• There is some difference of opinion within the industry over the perceived commoditization of Rooibos tea and the international marketing strategies of rooibos.
• Larger bulk processors favour marketing rooibos as a black tea alternative and generic marketing, while smaller players wish to market it as a niche product due to limited supply and higher margins.
2.2.3 Geographical patterns of demand
• The current dominant export markets for rooibos tea are Germany, Netherlands, United
Kingdom, Japan and the United States of America. These accounted for 84% of rooibos tea exports in 2007 as compared to 90% of honeybush exports between 1999 and 2008.
• Total consumption of herbal tea in Germany was estimated to be 33, 336 tonnes in 2007. Rooibos accounts for 7.7% of Germany’s herbal market.
• In the United Kingdom, the total consumption of herbal teas in 2008-09 was estimated to be worth $179m (US) with rooibos tea accounting for a market share of 8.1 % (value $14.5m US).
• Growth markets for rooibos include: -United Kingdom: 300% increase in rooibos sales between 2003 and 2007. -Chile: Increase of 247 tonnes between 2006 and 2007, now contributing 3% to total rooibos exports. This is likely to be predominantly for extract production to supply the North American iced tea market, although the emergence of a tea and coffee culture in Chile has seen the introduction of a wide range of premium products and exotic blends. -Russia: High per capita tea consumption rate (1.3 kg compared to global average of 0.3 kg). Fruit /herbal teas estimated to grow by 48% between 2007 and 2012. There is emerging interest in rooibos from Russian companies.
9
2.2.4 Import and export tariffs for tea
• Neither bulk nor packaged tea exports attract export duties in South Africa. • Exports of rooibos tea to European Union and US are duty free and no distinction is made
between bulk and packaged teas. • In Japan, honeybush tea has tariff duties of 15% whilst rooibos tea is 3%. • Since these tariffs are based on the percentage of value of the goods, higher valued goods
(e.g. packed tea) are required to pay higher tariffs than lower value goods (e.g. bulk, unpackaged tea).
2.2.5 Market segments and product trends
Product segments:
• Black tea. • Specialty tea. • Herbal and fruit tea (single infusion and blends). • Decaffeinated tea. • Green tea. • Conventional rooibos is still the predominant sub-segment within teas making use of rooibos,
with organic and green rooibos maintaining a stable market share of 12% of exports between 2003 and 2007.
• The fair-trade and organic sub-segments are particularly important in the USA, comprising 40% of rooibos exports.
• However, the emphasis is on the quality of tea, so consistent quality control at the grower and processing stage is crucial.
• Within this segment, rooibos is predominantly used as a base for exotic, blended herbal tea as innovation and rarity of flavours dominate this market.
Product trends: Premium teas
• The market for specialty/ gourmet tea is emerging and provides a potential differentiation strategy for rooibos tea. It is a growing niche market, estimated to account for 8.5% of the United States of America’s US$2.1 billion tea industry. Gourmet teas can command a premium of around 30%. However, the emphasis is on the quality of tea, so consistent quality control at the grower and processing stage is crucial. Within this segment, rooibos tea is predominantly used as a base for exotic, blended herbal tea as innovation and rarity of flavours dominate this market. France is one of the leading locations for premium tea with companies such as Mariage Freres, Dammann Freres and Le Palais des Thes. These companies have also expanded into Germany, the USA and Japan. The Gourmet tea market also serves the hospitality and aviation markets e.g. products of TWG Teas (a Singaporean specialty tea company) are served on Singapore Airways.
• Increasing varieties of herbal blends in the European Union and United States (a United States report noted that 62% of tea retailers increased the number of different teas sold in 2008).
10
However, there are original variations e.g. there is a preference for unblended tea in the Japanese market where 90% of tea consumed is unblended.
• Emergence of a new beverage category – the tea espresso pioneered by the Red Espresco Company from South Africa which uses specially formulated loose tea through a traditional coffee machine filter. Globally successful, over four million red espressos have been prepared in 2010 and successful marketing has raised profile of rooibos tea internationally.
2.2.6 Drivers of purchasing decisions
• Consumer drivers: Consumer purchasing decisions of herbal tea are driven by health factors (including properties such as caffeine free) and exotic tastes. -Mood influencing foods and drinks are an important emerging driver of consumer purchasing decisions – products that make mood, emotional, and cognitive health claims. Consumers increasingly link what they eat with brain chemistry and its function. -Pleasure is also an important aspect of modern food and drinks consumption- consuming and experience culture.
• Commercial drivers: Quality certification is growing in importance within South African domestic market, with retailers such as Woolworths requiring ISO certification for produce.
• Quality and safety are more rigorous in the developed export markets of the European Union, United States of America and Japan, playing a crucial role in purchasing decisions (especially in Japan).
• Traceability of herbal ingredients is becoming increasingly important. • Reliability of supply is also an important purchasing decision for commercial buyers.
3. ROOIBOS TEA EXPORTS
South Africa is the only exporter of rooibos tea in Africa and exports approximately more than 6000 tons per year, and at the same time the country does not import rooibos tea from the world. Rooibos tea is exported to more than 30 countries across the globe key among those are Germany, Netherlands, Japan, United Kingdom and the United States of America.
11
Figure 4: Exports destinations of Rooibos
(Conventional) Tea in 2011
43%
4%6%
21%
22%
4%
Germany Japan USA UK Netherlands Poland
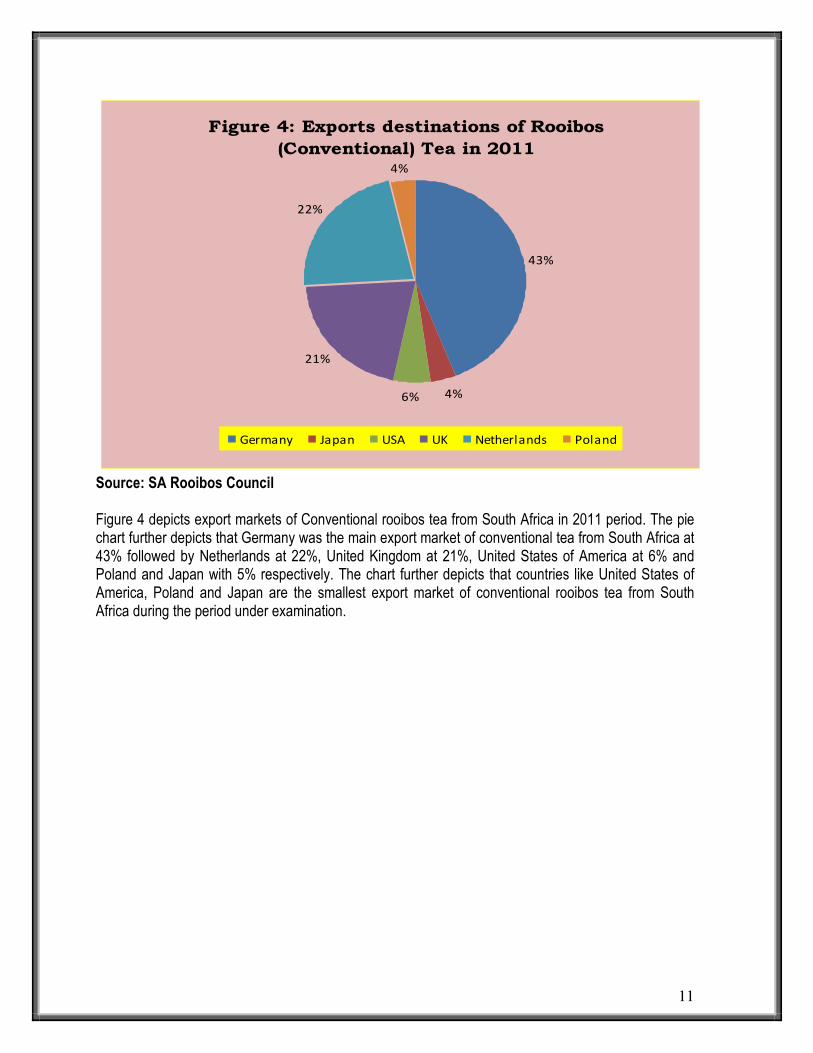
Source: SA Rooibos Council Figure 4 depicts export markets of Conventional rooibos tea from South Africa in 2011 period. The pie chart further depicts that Germany was the main export market of conventional tea from South Africa at 43% followed by Netherlands at 22%, United Kingdom at 21%, United States of America at 6% and Poland and Japan with 5% respectively. The chart further depicts that countries like United States of America, Poland and Japan are the smallest export market of conventional rooibos tea from South Africa during the period under examination.
12
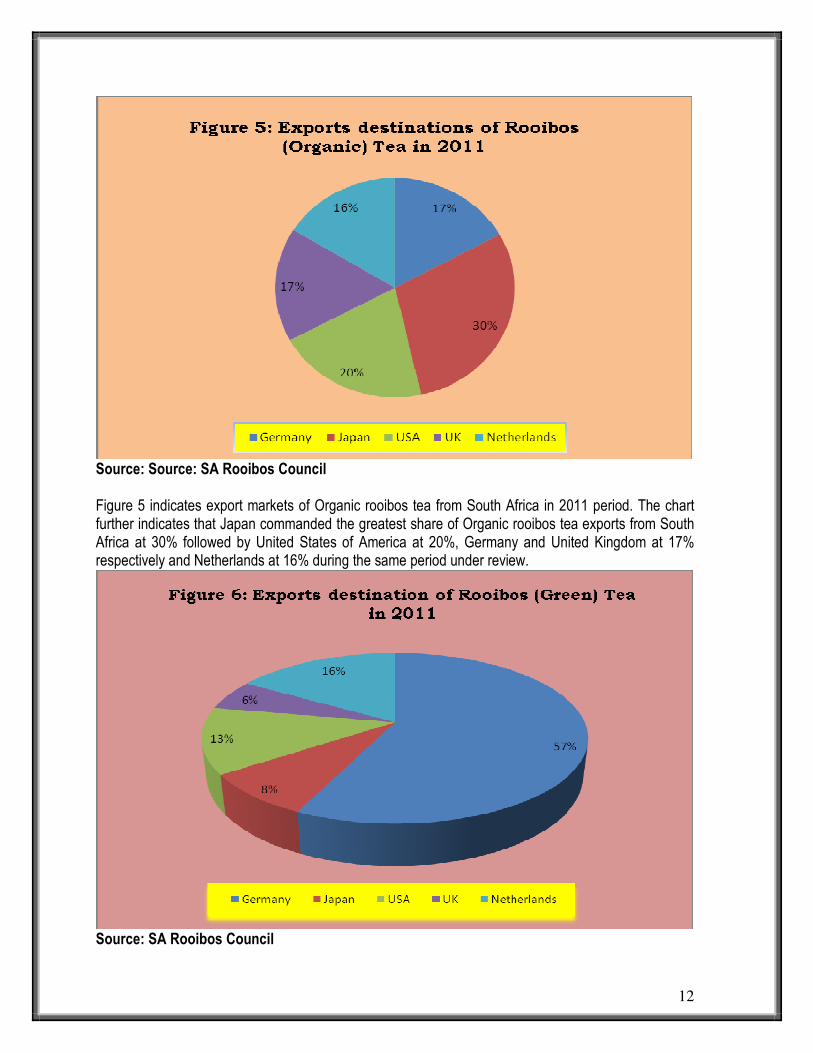
Source: Source: SA Rooibos Council Figure 5 indicates export markets of Organic rooibos tea from South Africa in 2011 period. The chart further indicates that Japan commanded the greatest share of Organic rooibos tea exports from South Africa at 30% followed by United States of America at 20%, Germany and United Kingdom at 17% respectively and Netherlands at 16% during the same period under review.
Source: SA Rooibos Council

13
Figure 6 illustrates export markets of Green rooibos tea from South Africa in 2011 period. The pie chart further illustrates that Germany was the main export market for Green rooibos tea from South Africa with approximately 57%, followed by Netherlands at 16%, USA at 13%, Japan at 8% and the United Kingdom at 6% during the same period under review. Figure 4 above also illustrates that Germany was the main export market of conventional rooibos tea and in figure 5 Germany was the third biggest export market of Organic rooibos tea during the same period under review.
Source: SA Rooibos Council Figure 7 shows total exports volumes of rooibos tea from South Africa per year to the world between 2002 and 2011. The graph further shows that during the period under review, total exports volumes of rooibos tea from South Africa started to increase in 2002 to 2003 year, until a decline was experienced in 2004 and 2005 due to a decline in production in the domestic market. Total exports volumes of rooibos tea experienced a surge in 2006 until a peak was attained in 2007 at approximately 7 million tons. The figure also shows that, there was a consistent decline in total exports volumes of rooibos tea from 2008 to 2011 period.
14
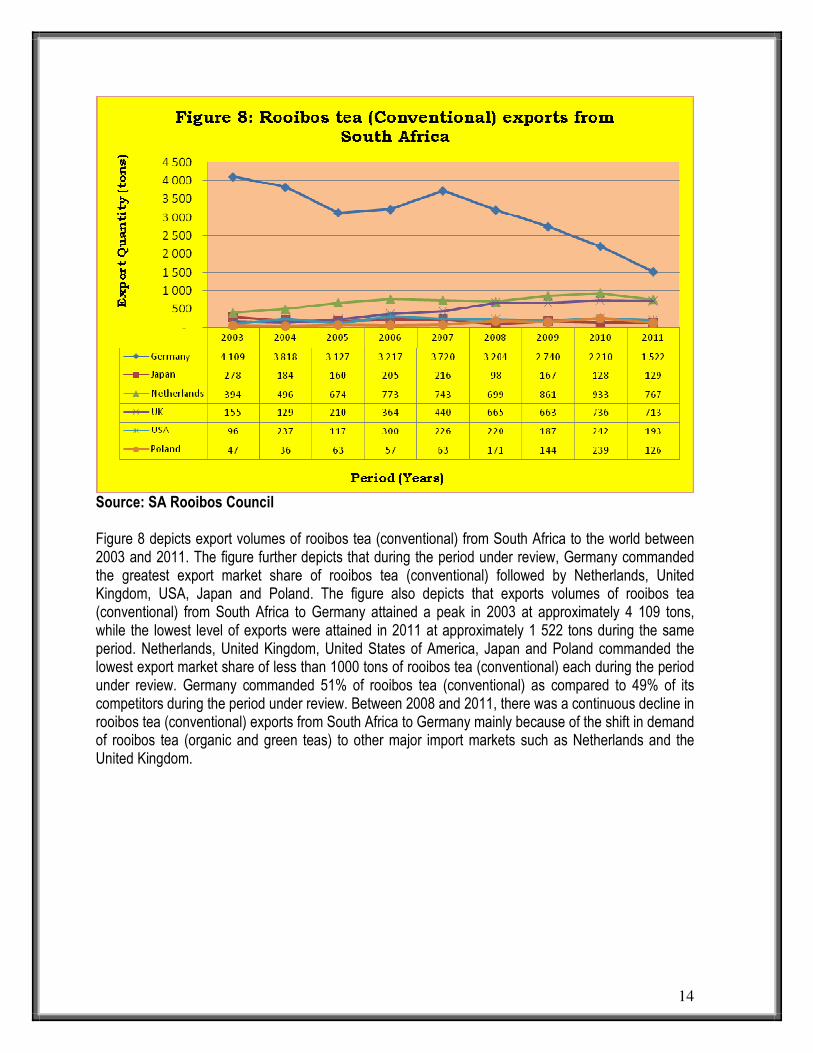
Source: SA Rooibos Council Figure 8 depicts export volumes of rooibos tea (conventional) from South Africa to the world between 2003 and 2011. The figure further depicts that during the period under review, Germany commanded the greatest export market share of rooibos tea (conventional) followed by Netherlands, United Kingdom, USA, Japan and Poland. The figure also depicts that exports volumes of rooibos tea (conventional) from South Africa to Germany attained a peak in 2003 at approximately 4 109 tons, while the lowest level of exports were attained in 2011 at approximately 1 522 tons during the same period. Netherlands, United Kingdom, United States of America, Japan and Poland commanded the lowest export market share of less than 1000 tons of rooibos tea (conventional) each during the period under review. Germany commanded 51% of rooibos tea (conventional) as compared to 49% of its competitors during the period under review. Between 2008 and 2011, there was a continuous decline in rooibos tea (conventional) exports from South Africa to Germany mainly because of the shift in demand of rooibos tea (organic and green teas) to other major import markets such as Netherlands and the United Kingdom.

15
Figure 9: Rooibos tea (Organic) exports from South Africa
-
50
100
150
200
250
300
350
400
Period (Years)
Exp
ort
s Q
uan
tity
(to
ns)
Germany 354 202 213 65 166 225 197 124 115
Japan 183 97 104 96 197 153 209 222 202
Netherlands 60 14 43 19 38 49 71 112 110
UK 14 21 96 62 76 117 109 119 114
USA 23 36 98 77 151 119 78 106 140
Poland 0 0 0 1 0 0 0 0 0
2003 2004 2005 2006 2007 2008 2009 2010 2011
Source: SA Rooibos Council Figure 9 illustrates export volumes of rooibos tea (organic) from South Africa to the world between 2003 and 2011. The graph further illustrates that in 2003 and 2008 years, Germany commanded greatest export market share of rooibos tea (organic) from South Africa, followed by Japan while the other 3 countries exported not more than 200 tons of rooibos tea (organic). Figure 9 also illustrates that rooibos tea (organic) exports from South Africa to Germany started to increase in 2003, and at the same time attained a peak at approximately 354 tons. Between 2009 and 2011, rooibos tea (organic) experienced a consistent decline in exports from South Africa to Germany of approximately 10 tons in 2011. Rooibos tea (organic) exports from South Africa to Japan started to increase in 2003 and experienced a decline between 2004 and 2006 years. In 2007 exports of rooibos tea (organic) from South Africa to Japan started to increase again and slightly declined in 2008. An increase in rooibos tea (organic) exports from South Africa to Japan was experienced in 2009, and a peak was attained in 2010 at approximately 222 tons. In 2011, Japan saw a slight decline in exports of rooibos tea (organic) from South Africa to approximately 200 tons.
16
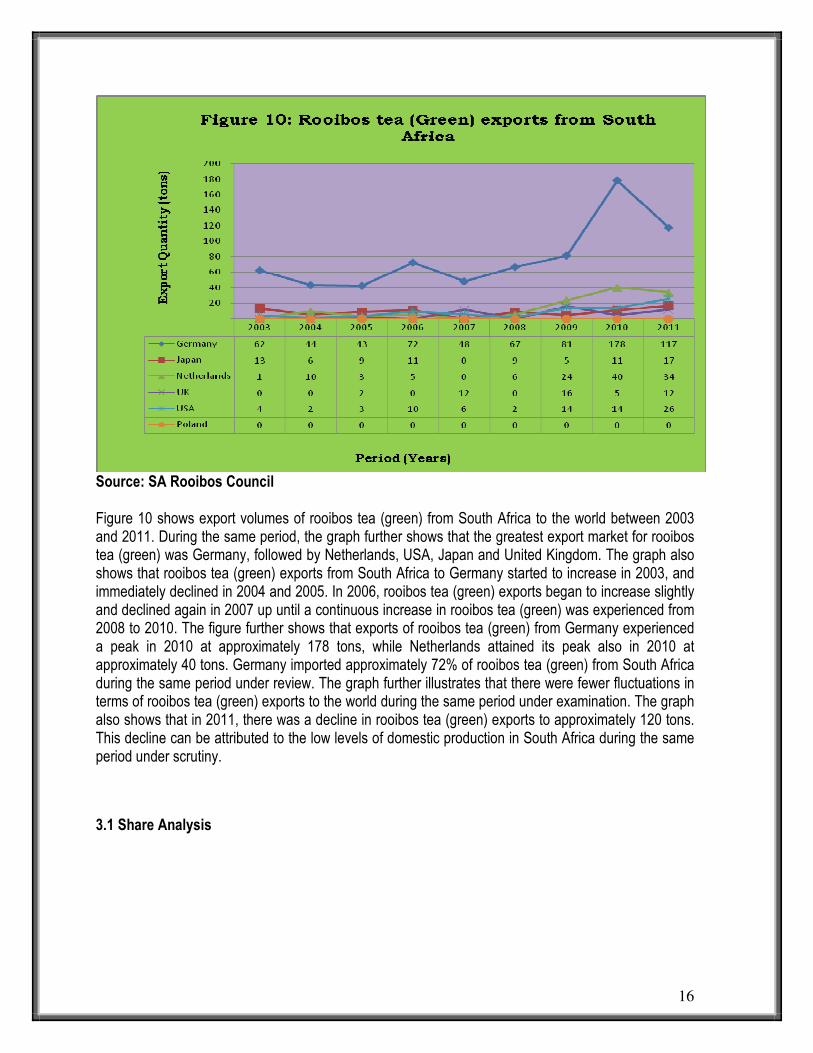
Source: SA Rooibos Council Figure 10 shows export volumes of rooibos tea (green) from South Africa to the world between 2003 and 2011. During the same period, the graph further shows that the greatest export market for rooibos tea (green) was Germany, followed by Netherlands, USA, Japan and United Kingdom. The graph also shows that rooibos tea (green) exports from South Africa to Germany started to increase in 2003, and immediately declined in 2004 and 2005. In 2006, rooibos tea (green) exports began to increase slightly and declined again in 2007 up until a continuous increase in rooibos tea (green) was experienced from 2008 to 2010. The figure further shows that exports of rooibos tea (green) from Germany experienced a peak in 2010 at approximately 178 tons, while Netherlands attained its peak also in 2010 at approximately 40 tons. Germany imported approximately 72% of rooibos tea (green) from South Africa during the same period under review. The graph further illustrates that there were fewer fluctuations in terms of rooibos tea (green) exports to the world during the same period under examination. The graph also shows that in 2011, there was a decline in rooibos tea (green) exports to approximately 120 tons. This decline can be attributed to the low levels of domestic production in South Africa during the same period under scrutiny.
3.1 Share Analysis
17
Table 1: Share of South Africa’s rooibos tea (conventional) exports to the total world rooibos tea exports (%)
Year Countries
2003
2004
2005
2006
2007
2008
2009
2010
2011
Germany
14.9 13.8 11.3 11.6 13.5 11.6 9.90 7.99 5.50
Japan
17.4 11.7 10.3 13.1 13.8 6.27 10.7 8.17 8.23
Netherlands
6.21
7.83
10.6
12.2
11.7
11.0
13.6
14.7
12.1
United Kingdom
3.81
3.18
5.15
8.92
10.8
16.3
16.3
18.1
17.5
United States of America
5.26
13.1
6.43
16.5
12.4
12.1
10.3
13.3
10.6
Poland
4.96
3.80
6.66
6.01
6.66
18.1
15.3
25.3
13.3
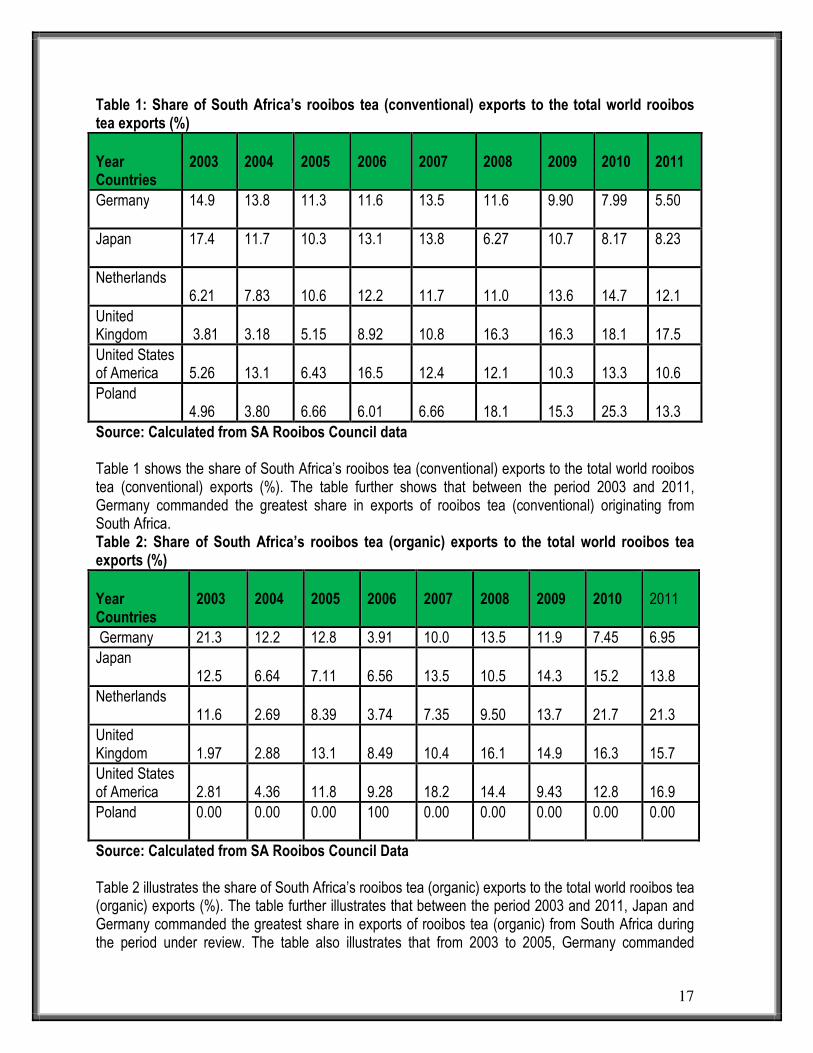
Source: Calculated from SA Rooibos Council data Table 1 shows the share of South Africa’s rooibos tea (conventional) exports to the total world rooibos tea (conventional) exports (%). The table further shows that between the period 2003 and 2011, Germany commanded the greatest share in exports of rooibos tea (conventional) originating from South Africa. Table 2: Share of South Africa’s rooibos tea (organic) exports to the total world rooibos tea exports (%)
Year Countries
2003
2004
2005
2006
2007
2008
2009
2010
2011
Germany 21.3 12.2 12.8 3.91 10.0 13.5 11.9 7.45 6.95
Japan
12.5
6.64
7.11
6.56
13.5
10.5
14.3
15.2
13.8
Netherlands 11.6
2.69
8.39
3.74
7.35
9.50
13.7
21.7
21.3
United Kingdom
1.97
2.88
13.1
8.49
10.4
16.1
14.9
16.3
15.7
United States of America
2.81
4.36
11.8
9.28
18.2
14.4
9.43
12.8
16.9
Poland
0.00 0.00 0.00 100 0.00 0.00 0.00 0.00 0.00
Source: Calculated from SA Rooibos Council Data Table 2 illustrates the share of South Africa’s rooibos tea (organic) exports to the total world rooibos tea (organic) exports (%). The table further illustrates that between the period 2003 and 2011, Japan and Germany commanded the greatest share in exports of rooibos tea (organic) from South Africa during the period under review. The table also illustrates that from 2003 to 2005, Germany commanded
18
greatest share in exports of rooibos tea (organic). In 2006 and 2007, Japan commanded the greatest share in exports of rooibos tea (organic) from South Africa. From 2008 to 2009 Germany again commanded the greatest share of rooibos tea (organic) exports from South Africa Table 3: Share of South Africa’s rooibos tea (green) exports to the total world rooibos tea exports (%)
Year Countries
2003
2004
2005
2006
2007
2008
2009
2010
2011
Germany
8.75 6.11 5.99 10.2 6.76 9.35 11.4 25.0 16.5
Japan
16.5 6.78 11.4 14.0 0.00 11.1 5.94 13.7 21.0
Netherlands
0.00 7.93 2.57 4.41 0.00 4.50 19.3 32.9 27.5
United Kingdom
0.04 0.00 4.51 0.67 24.6 0.00 34.2 10.7 25.2
United States of America
5.05
1.89
4.05
12.4
7.33
2.97
17.1
17.4
31.8
Poland
0.00 0.00 0.00 0.00 0.00 0.00 0.00 0.00 0.00
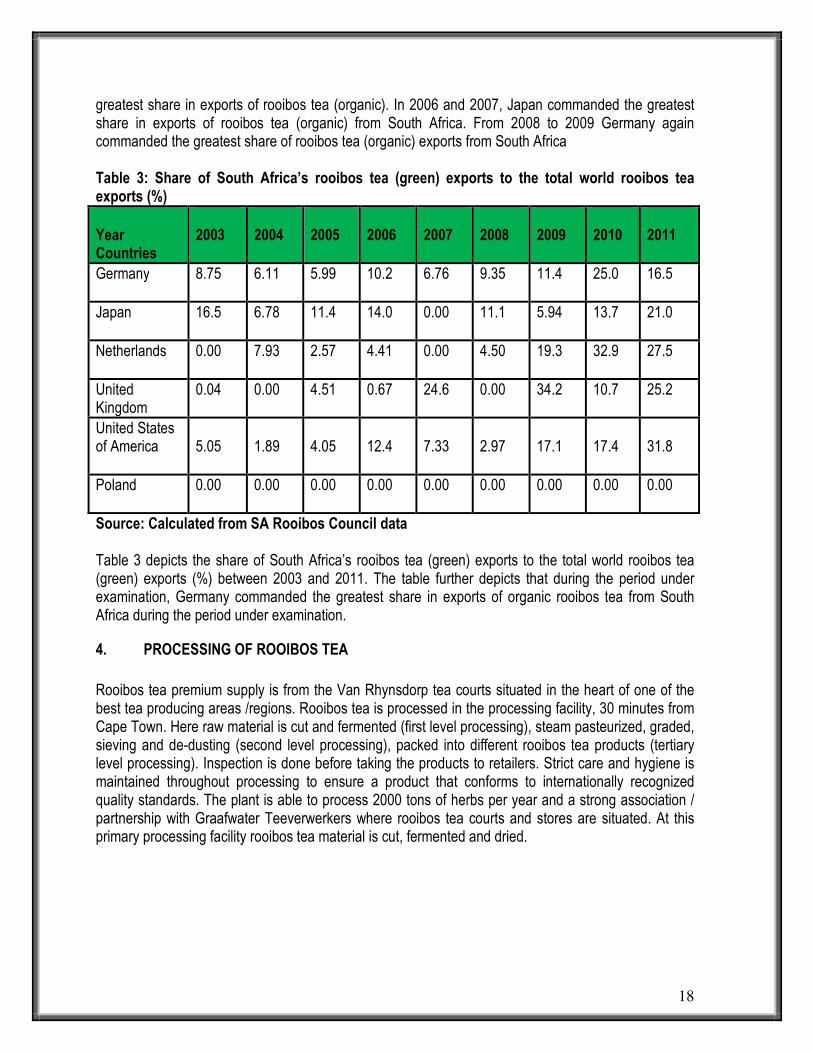
Source: Calculated from SA Rooibos Council data Table 3 depicts the share of South Africa’s rooibos tea (green) exports to the total world rooibos tea (green) exports (%) between 2003 and 2011. The table further depicts that during the period under examination, Germany commanded the greatest share in exports of organic rooibos tea from South Africa during the period under examination.
4. PROCESSING OF ROOIBOS TEA
Rooibos tea premium supply is from the Van Rhynsdorp tea courts situated in the heart of one of the best tea producing areas /regions. Rooibos tea is processed in the processing facility, 30 minutes from Cape Town. Here raw material is cut and fermented (first level processing), steam pasteurized, graded, sieving and de-dusting (second level processing), packed into different rooibos tea products (tertiary level processing). Inspection is done before taking the products to retailers. Strict care and hygiene is maintained throughout processing to ensure a product that conforms to internationally recognized quality standards. The plant is able to process 2000 tons of herbs per year and a strong association / partnership with Graafwater Teeverwerkers where rooibos tea courts and stores are situated. At this primary processing facility rooibos tea material is cut, fermented and dried.
19
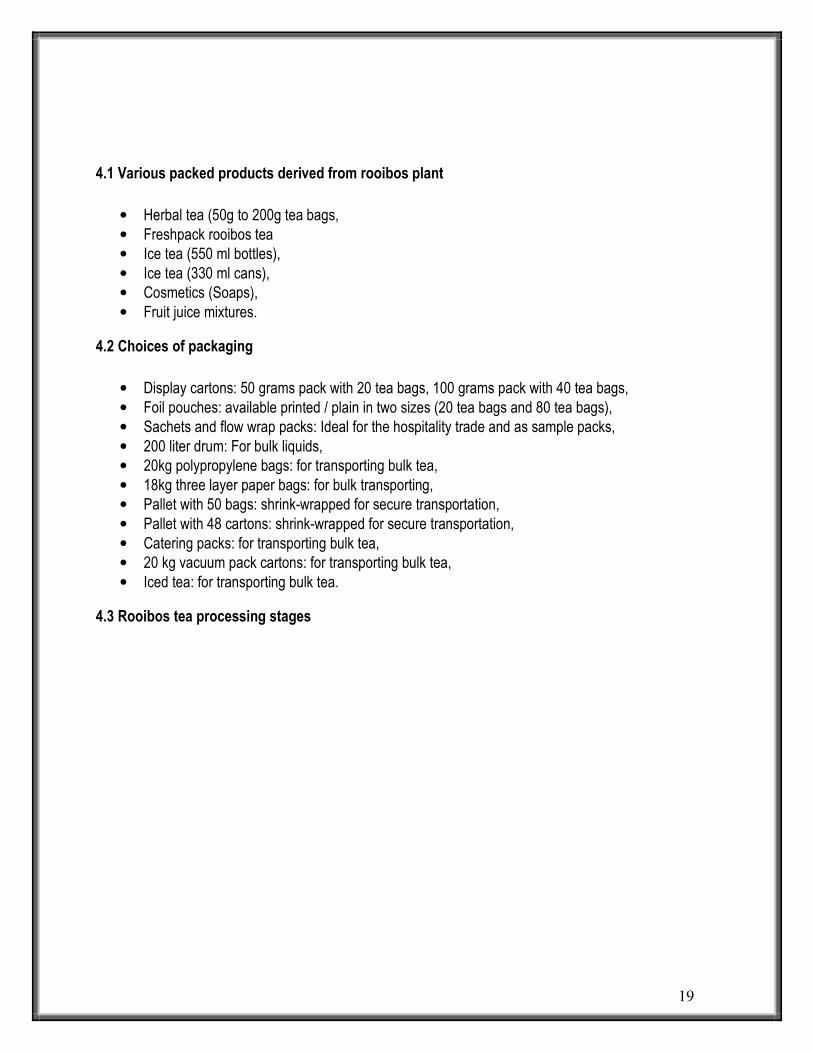
4.1 Various packed products derived from rooibos plant
• Herbal tea (50g to 200g tea bags, • Freshpack rooibos tea • Ice tea (550 ml bottles), • Ice tea (330 ml cans), • Cosmetics (Soaps), • Fruit juice mixtures.
4.2 Choices of packaging
• Display cartons: 50 grams pack with 20 tea bags, 100 grams pack with 40 tea bags, • Foil pouches: available printed / plain in two sizes (20 tea bags and 80 tea bags), • Sachets and flow wrap packs: Ideal for the hospitality trade and as sample packs, • 200 liter drum: For bulk liquids, • 20kg polypropylene bags: for transporting bulk tea, • 18kg three layer paper bags: for bulk transporting, • Pallet with 50 bags: shrink-wrapped for secure transportation, • Pallet with 48 cartons: shrink-wrapped for secure transportation, • Catering packs: for transporting bulk tea, • 20 kg vacuum pack cartons: for transporting bulk tea, • Iced tea: for transporting bulk tea.
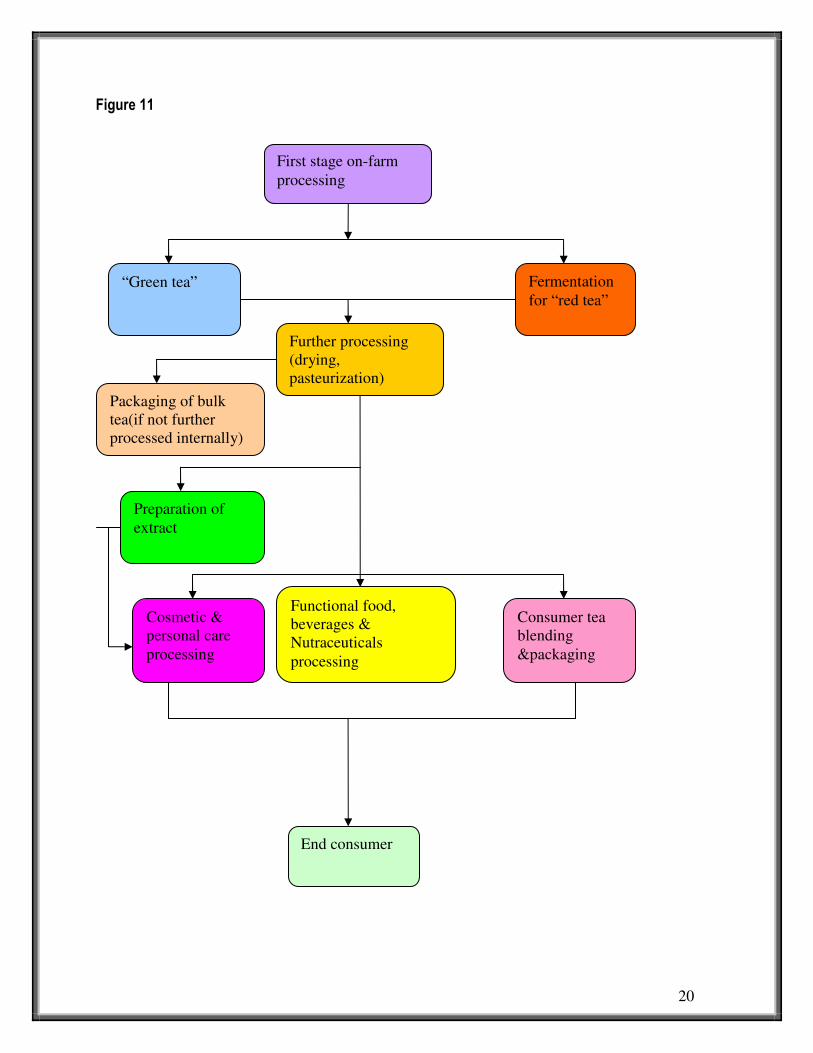
4.3 Rooibos tea processing stages
20
Figure 11
First stage on-farm
processing
“Green tea” Fermentation
for “red tea”
Further processing
(drying,
pasteurization)
Functional food,
beverages &
Nutraceuticals
processing
Consumer tea
blending
&packaging
Cosmetic &
personal care
processing
Packaging of bulk
tea(if not further
processed internally)
Preparation of
extract
End consumer
21
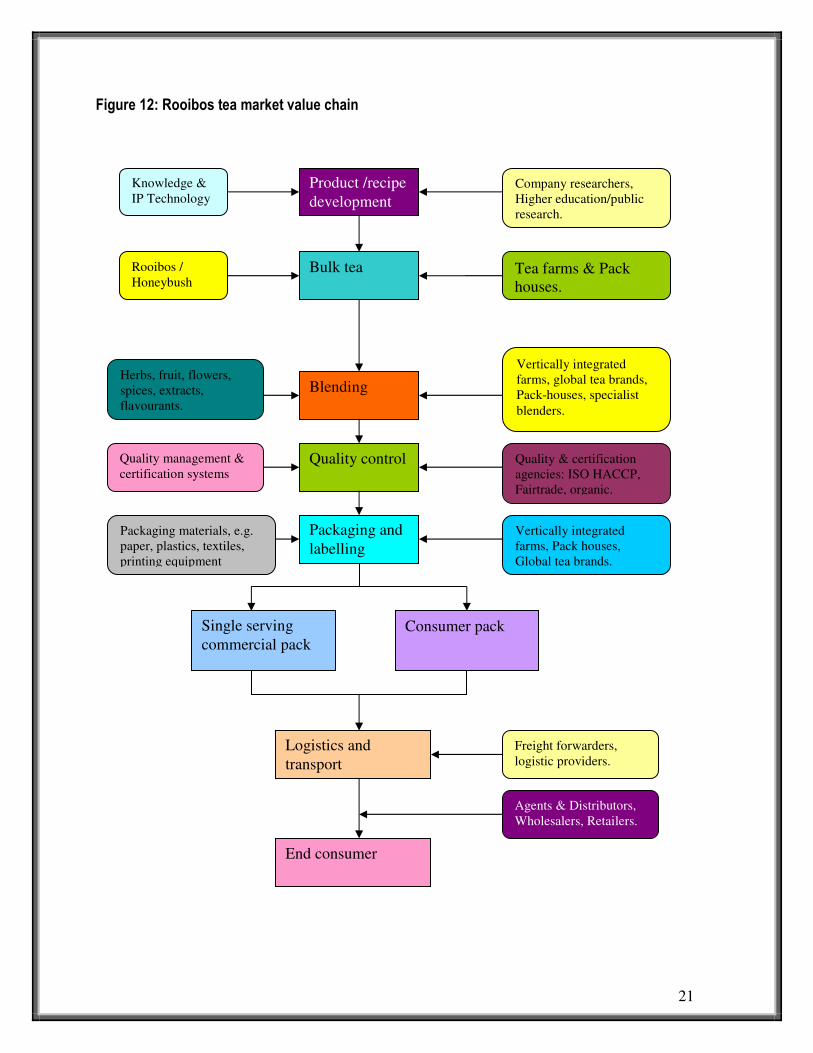
Figure 12: Rooibos tea market value chain
Product /recipe
development
Bulk tea
Blending
Quality control
Packaging and
labelling
Single serving
commercial pack
Consumer pack
Logistics and
transport
End consumer
Knowledge &
IP Technology
Rooibos /
Honeybush
Herbs, fruit, flowers,
spices, extracts,
flavourants.
Quality management &
certification systems
Packaging materials, e.g.
paper, plastics, textiles,
printing equipment
Company researchers,
Higher education/public
research.
Tea farms & Pack
houses.
Vertically integrated
farms, global tea brands,
Pack-houses, specialist
blenders.
Quality & certification
agencies: ISO HACCP,
Fairtrade, organic.
Vertically integrated
farms, Pack houses,
Global tea brands.
Freight forwarders,
logistic providers.
Agents & Distributors,
Wholesalers, Retailers.
22
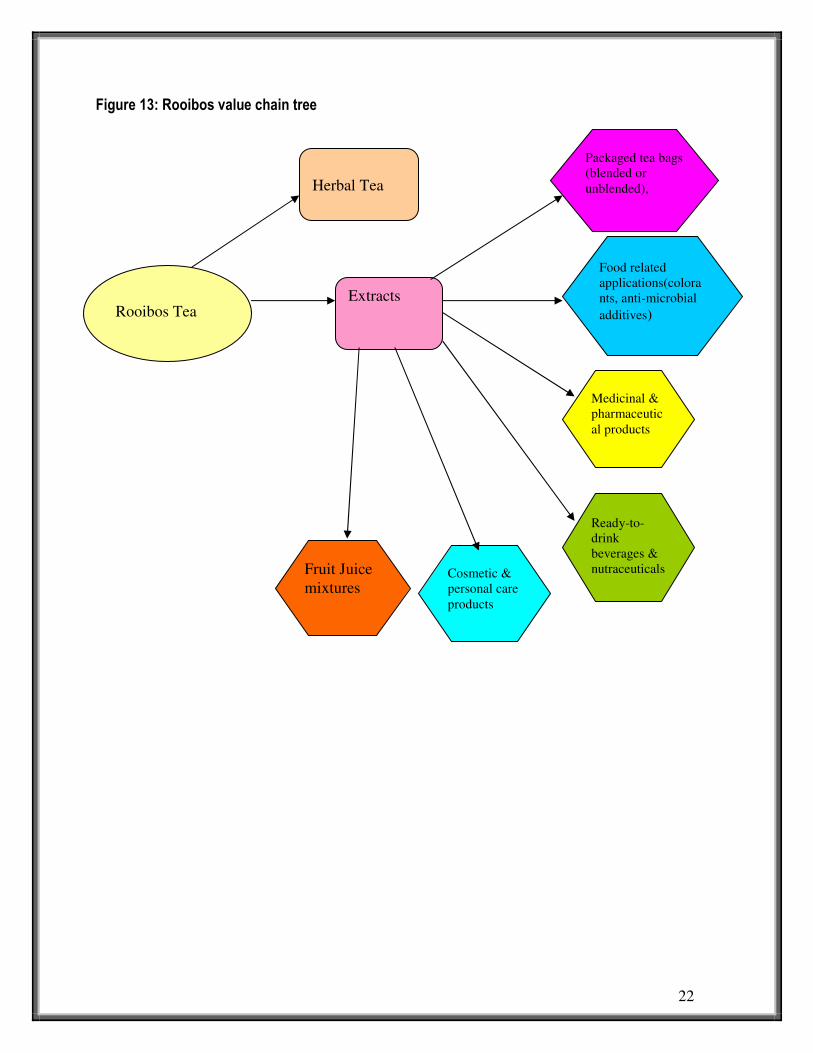
Figure 13: Rooibos value chain tree
Rooibos Tea
Herbal Tea
Extracts
Food related
applications(colora
nts, anti-microbial
additives)
Packaged tea bags
(blended or
unblended),
Medicinal &
pharmaceutic
al products
Ready-to-
drink
beverages &
nutraceuticals
. Cosmetic &
personal care
products
Fruit Juice
mixtures
23
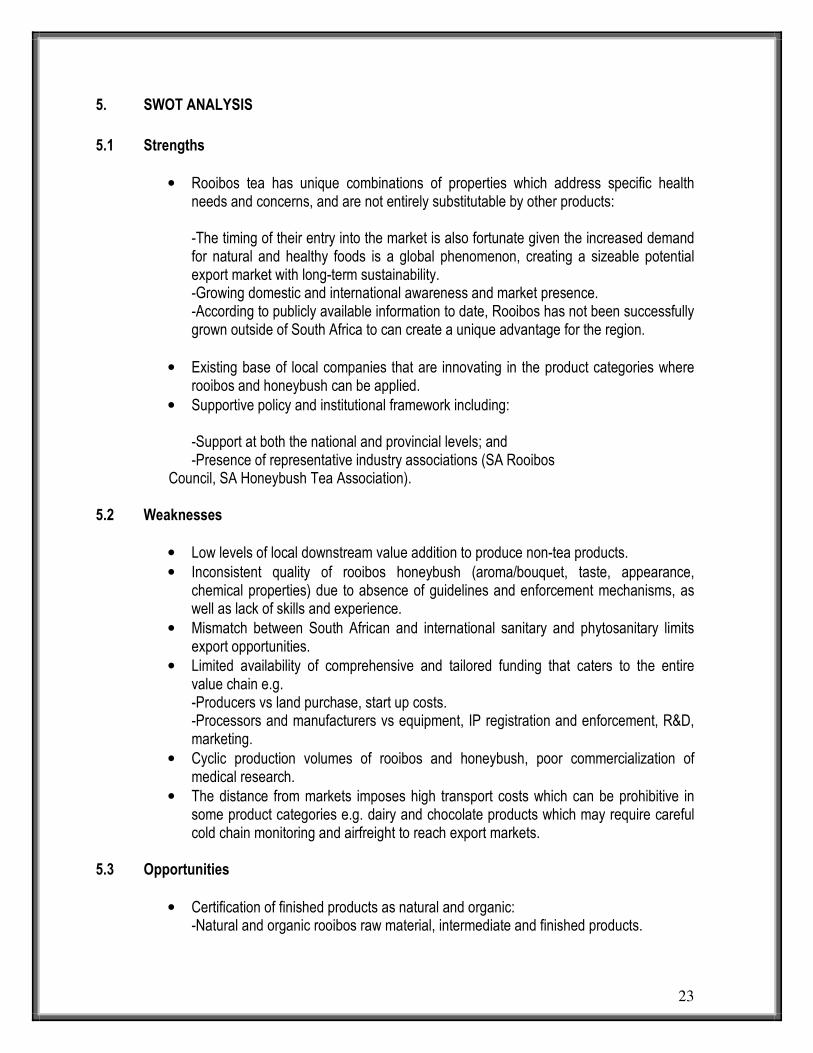
5. SWOT ANALYSIS
5.1 Strengths
• Rooibos tea has unique combinations of properties which address specific health needs and concerns, and are not entirely substitutable by other products:
-The timing of their entry into the market is also fortunate given the increased demand for natural and healthy foods is a global phenomenon, creating a sizeable potential export market with long-term sustainability. -Growing domestic and international awareness and market presence. -According to publicly available information to date, Rooibos has not been successfully grown outside of South Africa to can create a unique advantage for the region.
• Existing base of local companies that are innovating in the product categories where
rooibos and honeybush can be applied. • Supportive policy and institutional framework including:
-Support at both the national and provincial levels; and -Presence of representative industry associations (SA Rooibos
Council, SA Honeybush Tea Association). 5.2 Weaknesses
• Low levels of local downstream value addition to produce non-tea products. • Inconsistent quality of rooibos honeybush (aroma/bouquet, taste, appearance,
chemical properties) due to absence of guidelines and enforcement mechanisms, as well as lack of skills and experience.
• Mismatch between South African and international sanitary and phytosanitary limits export opportunities.
• Limited availability of comprehensive and tailored funding that caters to the entire value chain e.g. -Producers vs land purchase, start up costs. -Processors and manufacturers vs equipment, IP registration and enforcement, R&D, marketing.
• Cyclic production volumes of rooibos and honeybush, poor commercialization of medical research.
• The distance from markets imposes high transport costs which can be prohibitive in some product categories e.g. dairy and chocolate products which may require careful cold chain monitoring and airfreight to reach export markets.
5.3 Opportunities
• Certification of finished products as natural and organic: -Natural and organic rooibos raw material, intermediate and finished products.
24
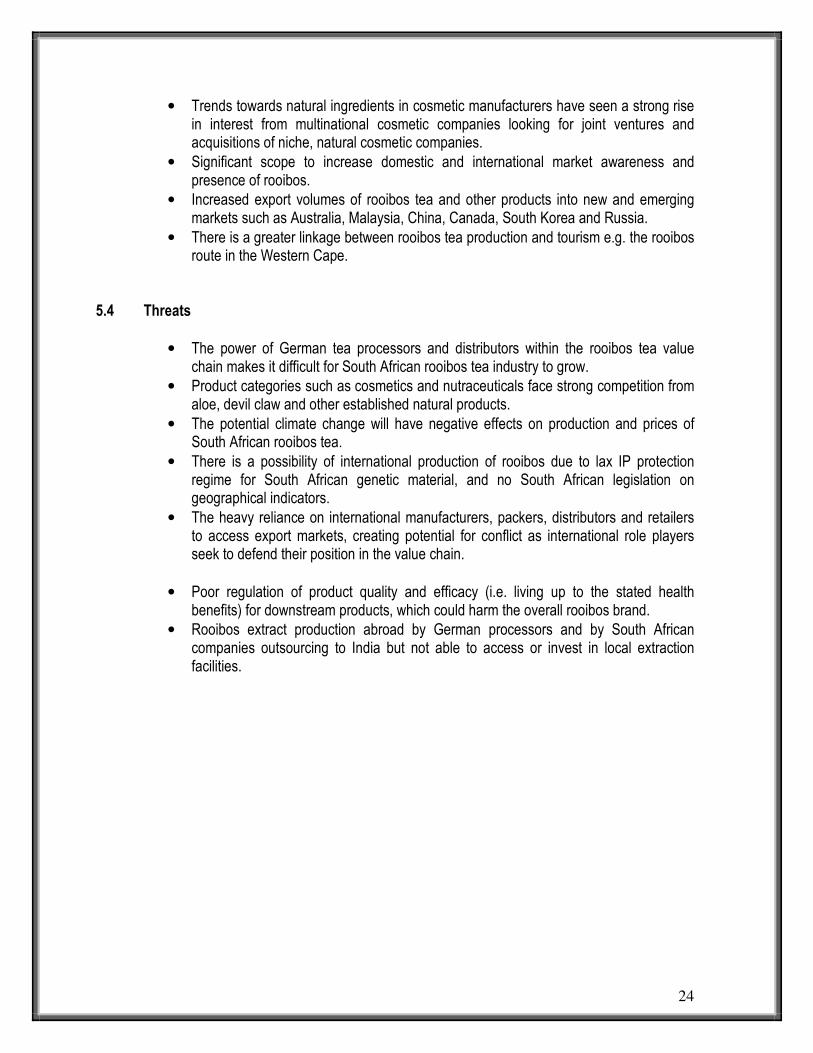
• Trends towards natural ingredients in cosmetic manufacturers have seen a strong rise in interest from multinational cosmetic companies looking for joint ventures and acquisitions of niche, natural cosmetic companies.
• Significant scope to increase domestic and international market awareness and presence of rooibos.
• Increased export volumes of rooibos tea and other products into new and emerging markets such as Australia, Malaysia, China, Canada, South Korea and Russia.
• There is a greater linkage between rooibos tea production and tourism e.g. the rooibos route in the Western Cape.
5.4 Threats
• The power of German tea processors and distributors within the rooibos tea value chain makes it difficult for South African rooibos tea industry to grow.
• Product categories such as cosmetics and nutraceuticals face strong competition from aloe, devil claw and other established natural products.
• The potential climate change will have negative effects on production and prices of South African rooibos tea.
• There is a possibility of international production of rooibos due to lax IP protection regime for South African genetic material, and no South African legislation on geographical indicators.
• The heavy reliance on international manufacturers, packers, distributors and retailers to access export markets, creating potential for conflict as international role players seek to defend their position in the value chain.
• Poor regulation of product quality and efficacy (i.e. living up to the stated health
benefits) for downstream products, which could harm the overall rooibos brand. • Rooibos extract production abroad by German processors and by South African
companies outsourcing to India but not able to access or invest in local extraction facilities.
25
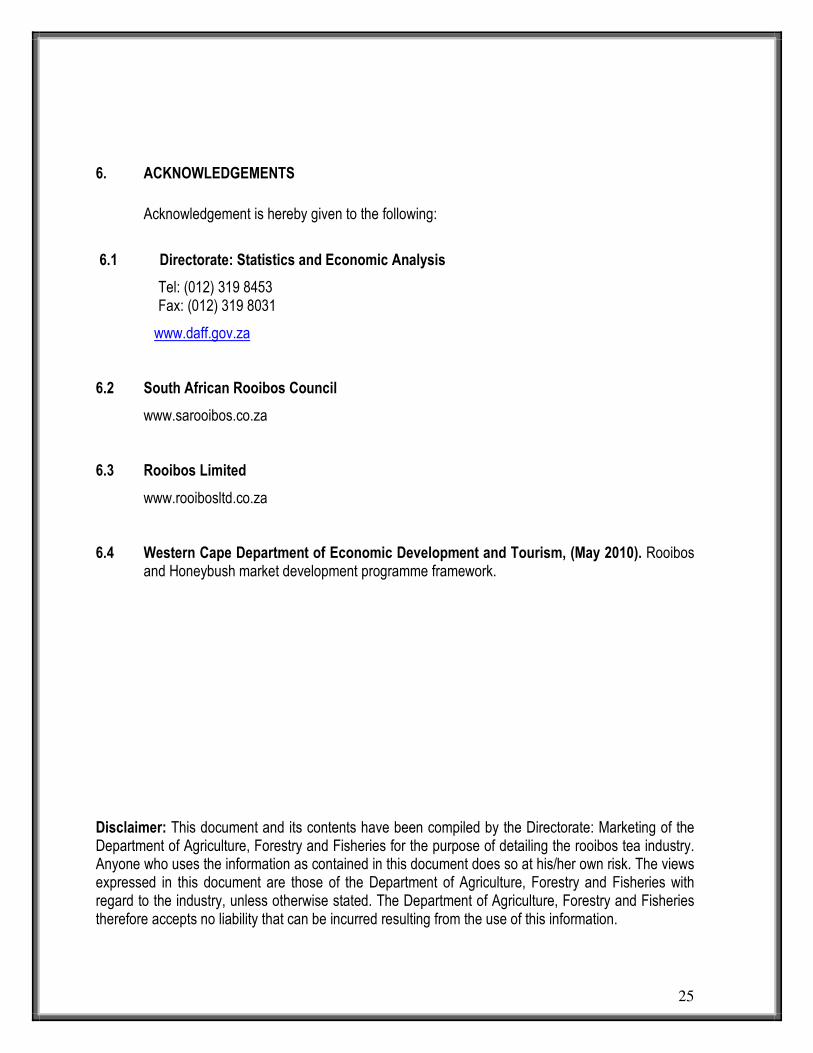
6. ACKNOWLEDGEMENTS
Acknowledgement is hereby given to the following:
6.1 Directorate: Statistics and Economic Analysis
Tel: (012) 319 8453 Fax: (012) 319 8031
www.daff.gov.za
6.2 South African Rooibos Council
www.sarooibos.co.za
6.3 Rooibos Limited
www.rooibosltd.co.za
6.4 Western Cape Department of Economic Development and Tourism, (May 2010). Rooibos and Honeybush market development programme framework.
Disclaimer: This document and its contents have been compiled by the Directorate: Marketing of the Department of Agriculture, Forestry and Fisheries for the purpose of detailing the rooibos tea industry. Anyone who uses the information as contained in this document does so at his/her own risk. The views expressed in this document are those of the Department of Agriculture, Forestry and Fisheries with regard to the industry, unless otherwise stated. The Department of Agriculture, Forestry and Fisheries therefore accepts no liability that can be incurred resulting from the use of this information.