Embed Size (px)
Citation preview
AA - Architectural Acoustics - Room and Building Acoustics:Paper ICA2016-843
Room acoustic experiments inside theUniversidade Federal de Santa Maria Industrial College:
A case study with low-cost instrumentation
Jean Carlo Bernardi(a), Bruno G. Knebel(b), Bernardo H. Pereira Murta(c),William D’A. Fonseca(d), Paulo H. Mareze(e), Eric Brandão(f)
(a - f)Federal University of Santa Maria, Acoustical Engineering, Santa Maria, RS, Brazil,[email protected], [email protected], [email protected],
[email protected], [email protected], [email protected]
Abstract:
When studying Room Acoustics, simulations simply are not enough to get the whole picture of thesubject. It is important to notice that, measurements on site are also a vital part of the learningprocess, since it allows the estimation of relevant information concerning the rooms’ acousticfunctional efficiency. Later, this information can be used to evaluate acoustic parameters that willplay an important role in the acoustic quality for the room. It is very important for students toget experience with rooms acoustic measurements. Nevertheless, it cannot always be carriedout easily. Among several reasons, one is the high price of the professional acoustic equipmentneeded to properly do so. Facing this problem, this work aims to present a case study using low-cost equipment as an alternative method to grant more learning freedom for the students. Thecase study takes place at Universidade Federal de Santa Maria’s Technical Industrial CollegeAuditorium, Brazil, where the students performed several binaural measurements to evaluate theAuditorium’s performance related to speech and music.
Keywords: room acoustics, instrumentation, impulse response, low-cost, experiments.
Room acoustic experiments inside the UniversidadeFederal de Santa Maria Industrial College: A case studywith low-cost instrumentation
1 IntroductionOver the recent years the use of simulations has dramatically increased in every field of science,thus, room acoustics is no exception. Every year, algorithms have become more sophisticatedand improvements on computer processing power are developed. Hence, more complex sim-ulations can be processed in less time, yielding more accurate results than ever before. Thepros of using simulation are not a mystery as well; it is possible to obtain several acousticalparameters through it, for example, Reverberation Time (RT), Early Decay Time (EDT), amongmore specific ones, such as D50 or C80, for instance [1]. Such parameters are of great importancein determining the acoustic quality of a room [2]. Having all this in mind, it becomes convenientto make use of simulations as the main tool to teach room acoustics, however, while it holdsgreat importance, simulations simply are not enough to get the whole picture of the subject.
On place measurements are time-consuming activities since loads of requirements and plansare needed to be resolved beforehand to optimize time spent in room and logistics of equipmentmanagement and properly installation. In addition, one of the most challenging parts whenhandling a relatively large student class is guaranteeing the proper use of the equipment inorder to keep it safe avoiding damage. Nonetheless, measurements on site are also a vital partof the learning process allowing the students a more vivid experience on how the theory ofroom acoustics was built and how it works.
Facing these challenges the use of low-cost instrumentation can have a significant impact on theapproach taken by a professor when teaching room acoustics. More freedom for both studentsand the professor can be achieved, allowing measurements to take place without the risk ofdamaging expensive equipment. Furthermore, this allows several measurements to be taken bydistinct students in different rooms simultaneously.
Aiming to provide a solution for the challenge, the present work makes use of low-cost instru-mentation to perform room acoustic measurements at a lecture hall, the Universidade Federalde Santa Maria Industrial College, in Brazil. The measurements were acquired by a MATLAB-controlled USB external soundcard as both monaural and binaural impulse responses, the latterthrough the use of a customized head-torso simulator with electret microphones. These impulseresponses were later post processed using the ITA-Toolbox1 and self-written scripts. The resultsobtained were compared to different measurement positions and the acoustic quality of thelecture hall was evaluated accordingly to these parameters. The case study measurements werecarried out by a group of three senior undergraduate students of Acoustical Engineering throughthe use of both omnidirectional sources as well as the lecture hall sound reinforcement system.
1Free MATLAB toolbox developed at the Institute of Technical Acoustics at RWTH Aachen University (Germany) foracoustic measurements and signal processing.
2

2 Object of study: Industrial College AuditoriumThis section presents a description of the Industrial College Auditorium, where measurementstook place. Originally built in 1960, the auditorium has gone through several refurbishments andimprovements untill this day. The auditorium has a total capacity of 106 persons in the audiencein addition to four seats for the stage. The auditorium plan is presented in Figure 1 to clarify theaudience distribution and its size.
Figure 1: Industrial College Auditorium’s Plan.
The auditorium’s main use is for seminars, lectures and conferences, therefore, requiring agood acoustic quality for speech. Despite that, there is no element of acoustic treatment in theauditorium, the seats are heavily padded chairs and the floor is light carpet covered by a rubbermaterial on the passageways. The walls are made of concrete, finished with cement and painted.The ceiling is made of regular gypsum boards.
Auditorium’s height, floor to ceiling, is considered low for such an environment, reaching amaximum of 3 meters at the front floor, just before the stage, and lowering to a minimum of2.25 meters at the last row. The estimated room’s volume is, approximately, 300 m3.
3 EquipmentThe equipment used for the measurements is an important feature of this paper. Aiming tofulfill the low-cost equipment premise proposed for such an activity, the students carried out themeasurements with the following set of equipment:
• Data acquisition system:
– M-Audio Ultra Track Pro (commercial USB eternal soundcard);
3
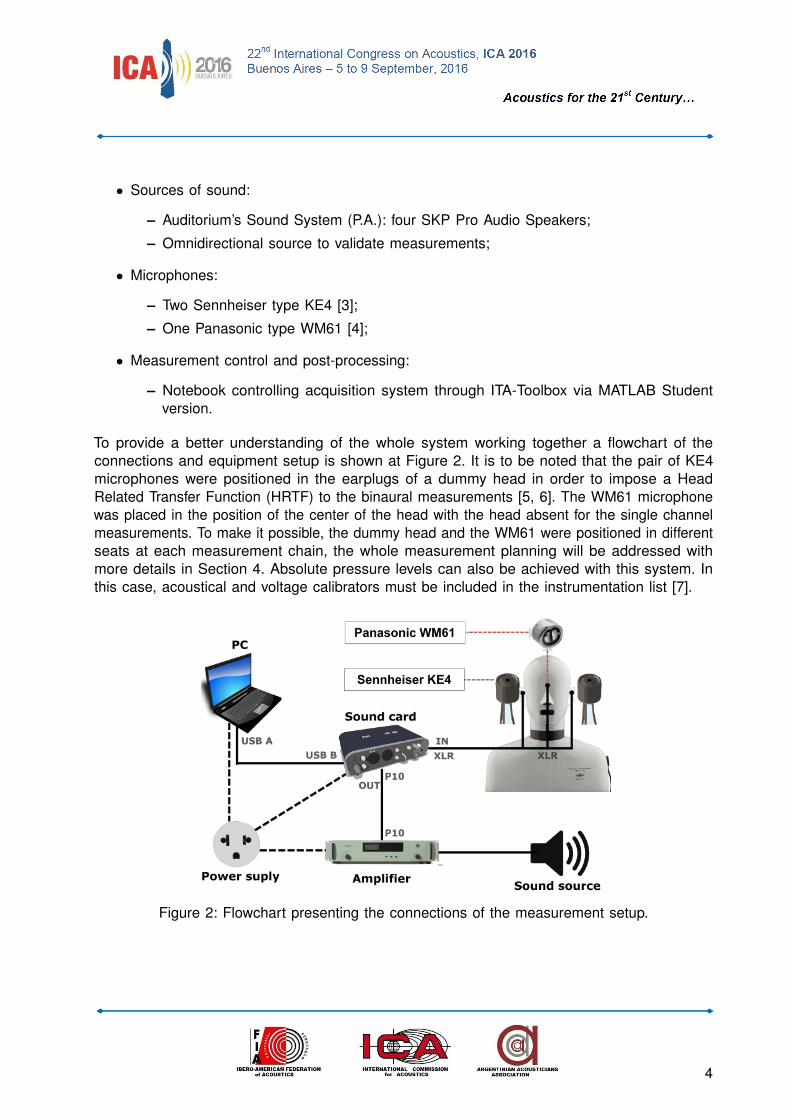
• Sources of sound:
– Auditorium’s Sound System (P.A.): four SKP Pro Audio Speakers;
– Omnidirectional source to validate measurements;
• Microphones:
– Two Sennheiser type KE4 [3];
– One Panasonic type WM61 [4];
• Measurement control and post-processing:
– Notebook controlling acquisition system through ITA-Toolbox via MATLAB Studentversion.
To provide a better understanding of the whole system working together a flowchart of theconnections and equipment setup is shown at Figure 2. It is to be noted that the pair of KE4microphones were positioned in the earplugs of a dummy head in order to impose a HeadRelated Transfer Function (HRTF) to the binaural measurements [5, 6]. The WM61 microphonewas placed in the position of the center of the head with the head absent for the single channelmeasurements. To make it possible, the dummy head and the WM61 were positioned in differentseats at each measurement chain, the whole measurement planning will be addressed withmore details in Section 4. Absolute pressure levels can also be achieved with this system. Inthis case, acoustical and voltage calibrators must be included in the instrumentation list [7].
Figure 2: Flowchart presenting the connections of the measurement setup.
4

4 Measurement PlanThe studied auditorium is used daily for lectures and seminars. Thus, students were needed towork during the night shift and spend as less time as possible inside it during the measurements(there was also a concern about the background noise and vibration). The complete measure-ment was planned beforehand and all the logistics were pre-organized in order to measure 5positions for each monaural and binaural measurements, using two different sound sources(conventional omnidirectional and room’s existing P.A.) as fast as possible.
Measurements positions were selected to provide a relatively good representation of the soundfield in the auditorium. The chosen positions were: first and last row, near the sidewalls as wellas in the center of the room, as depicted in Figure 3. The idea is to cover variations in thesound field that the audience may experiment.
Figure 3: Measurement map with the five seats, covering different sound field scenarios.
Due to the time constraints previously mentioned, the measurement logistic was carefully plannedin advance, variables such as cable lengths, measurement positions, number of measurements,data storage requirements and side equipment as measuring tape, thermometer and barometer,were all taken into the account. The planning allowed the students to optimize the measurementprocess, every step was planned in a Test Matrix. Thus, on site, there was almost no decisionleft to be taken, avoiding inconvenient situations and/or surprises. From previous experience,the students have estimated that this previous planning has saved half of the time that it wouldbe spent without the Test Matrix developed. To achieve this optimal time, both monoaural andbinaural measurements were carried out simultaneously in different positions. It was needed atotal of 5 batch measurements to acquire all the data.
4.1 Signal processing
After the measurements, the acquired data needs to be processed in order to be correlated withrelevant acoustic parameters. This signal processing was carried out using scripts via MATLABdeveloped by the students. The data was batch processed in order to obtain the ImpulseResponses (IR) and Binaural Room Impulse Responses (BRIR), following the convolution andsignal processing theories.
5

Once the IR relative to each microphone at each position is obtained, the reverberation timeand other parameters are estimated employing ITA-Toolbox processing tools together withthe developed scripts. The analysis presented throughout this work is limited to detect somecharacteristics of the room, such as its first resonant modes in the frequency domain analysis,mean reverberation time for each position and the Early Decay Time (EDT).
5 ResultsThe results are presented in 3 parts. The first one shows the frequency response of the room,comparing it to the room’s modes (see Figure 4). The second analysis shows the reverberationtimes all positions measured with both sources (Section 5.2). Finally, the EDT is estimated for 3positions (see Figure 8).
5.1 Frequency domain analysis - Room
An analysis of the impulse response in the frequency domain (or Frequency Response Function,FRF) is carried out. The measured data with the omnidirectional source and the microphone atthe center of the head is compared to the estimated modal distribution of the room, per Figure4. There are small variations concerning the modes frequency and FRF peaks. However, thiserror may be related to the simplification of modal analysis. The auditorium was approached bya rectangular room with dimensions (7.78 x 13.92 x 3.00) m, ignoring, therefore, the floor heightvariation. Nevertheless, the modal distribution estimation can be considered valid except for thesmall variations.
Frequency [Hz]30 40 50 60 70
Mag
nitu
de [-
]
0.0
0.1
0.2
0.3
0.4
0.5
0.6
0.7
0.8
0.9
1.0Modal distribution compared to the FRF position 1 - Omni source - Microphone on center of the head
normalized FRFRoom modes
Figure 4: Modal distribution compared to the normalized FRF at Position 1(by using the omnidirectional source and the microphone at the center of the head).
6

5.2 Reverberation Time (RT)
Figures 5 and 6 shows the results for the reverberation time in third octave bands, for allpositions and sources described in the measurement map shown in Figure 3, as well as theaverage reverberation time. Error bars represent the standard deviation of the repetitions. InFigure 5 it is possible to observe that in one position for the bands 400 Hz and 630 Hz thereverberation time measured is clearly over-estimated. Therefore, those values were excluded inthe averaging process of the reverberation time for the P.A. system.
Frequency [Hz]100 160 250 400 630 1000 1600 2500 4000 6300 10000
Rev
erbe
ratio
n tim
e [s
]
0.0
0.5
1.0
1.5
2.0
2.5
3.0Reverberation time - Average of 5 positions - P.A. system source
Position 1Position 2Position 3Position 4Position 5Average RT
Figure 5: Reverberation time in third octave bands relative to the measurement positions usingthe omnidirectional microphone with the P.A. (as sound source).
Frequency [Hz]100 160 250 400 630 1000 1600 2500 4000 6300 10000
Rev
erbe
ratio
n tim
e [s
]
0.0
0.5
1.0
1.5
2.0
2.5
3.0Reverberation time - Average of 5 positions - Omni source
Position 1Position 2Position 3Position 4Position 5Average RT
Figure 6: Reverberation time in third octave bands relative to the measurement positions usingthe omnidirectional microphone with the omnidirectional source.
7

A comparison of the reverberation time measured with the two sound sources is shown inFigure 7. It is possible to perceive good accordance between the measured values. Thisreinforces the hypothesis that the electroacoustic P.A. system installed in the room is adequatefor its applications. It amplifies speech exciting the room (in the range of frequencies between200 Hz and 10 kHz) similarly to the omnidirectional sound source (the RT nearly flat, about0.6 s).
Omni P.A.
RT by position - Microphone on center of the head
100004000
Frequency [Hz]
2500 1600
1000 630
400 250
160 100
0.0
0.6
1.2
2.4
3.0
3.6
1.8Tim
e [s
]
Figure 7: Comparison betwen the calculated TR in third octave bands using as sound sourcethe P.A. system and the B&K dodecahedron (averaging between positions).
According to Long [8], rooms that the main objective is to use for speech should have a flatreverberation time at all frequencies. The analyzed room meets the RT requirements specified bythe Brazilian standard NBR 12179 [9]. Since its estimated volume is approximately 300 m3, theRT is close to the recommended by Long for environments intended to speak with this volume,approximately 0.5 seconds. Furthermore, the room have shown a nearly flat reverberation timeup above the band 250 Hz.
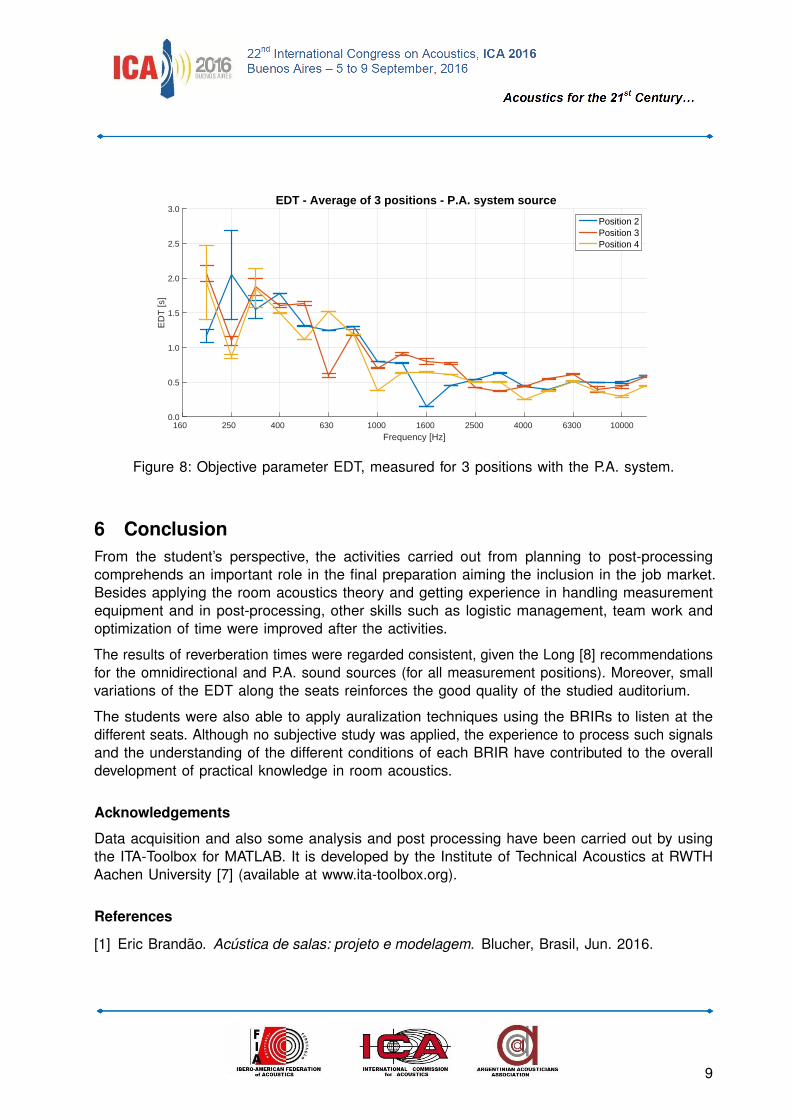
The EDT is a parameter related to the intelligibility in a room [1]. Thus, it is important that thisparameter does not present significant variations among different seats. Figure 8 depicts themean EDT and its standard deviation over the three repeats for three distinct positions.
8
Frequency [Hz]160 250 400 630 1000 1600 2500 4000 6300 10000
ED
T [s
]
0.0
0.5
1.0
1.5
2.0
2.5
3.0EDT - Average of 3 positions - P.A. system source
Position 2Position 3Position 4
Figure 8: Objective parameter EDT, measured for 3 positions with the P.A. system.
6 ConclusionFrom the student’s perspective, the activities carried out from planning to post-processingcomprehends an important role in the final preparation aiming the inclusion in the job market.Besides applying the room acoustics theory and getting experience in handling measurementequipment and in post-processing, other skills such as logistic management, team work andoptimization of time were improved after the activities.
The results of reverberation times were regarded consistent, given the Long [8] recommendationsfor the omnidirectional and P.A. sound sources (for all measurement positions). Moreover, smallvariations of the EDT along the seats reinforces the good quality of the studied auditorium.
The students were also able to apply auralization techniques using the BRIRs to listen at thedifferent seats. Although no subjective study was applied, the experience to process such signalsand the understanding of the different conditions of each BRIR have contributed to the overalldevelopment of practical knowledge in room acoustics.
Acknowledgements
Data acquisition and also some analysis and post processing have been carried out by usingthe ITA-Toolbox for MATLAB. It is developed by the Institute of Technical Acoustics at RWTHAachen University [7] (available at www.ita-toolbox.org).
References
[1] Eric Brandão. Acústica de salas: projeto e modelagem. Blucher, Brasil, Jun. 2016.
9

[2] H. Kuttruff. Room Acoustics. CRC Press, 5 edition, Jun. 2009.
[3] Martin Guski. Influences of external error sources on measurements of room acoustic parame-ters. PhD thesis, RWTH Aachen, Aachen, Germany, 2015.
[4] William D’A. Fonseca. Development and Application of an Acoustic Imaging System usingBeamforming Technique for Moving Sources (original: Desenvolvimento e Aplicação deSistema para Obtenção de Imagens Acústicas pelo Método do Beamforming para Fontes emMovimento). Master’s thesis, Federal University of Santa Catarina, Florianópolis, SC, Brazil,Feb. 2009.
[5] Michael Vorländer. Auralization: Fundamentals of Acoustics, Modelling, Simulation, Algorithmsand Acoustic Virtual Reality. Springer, Berlin, Germany, 2007.
[6] Henrik Møller. Fundamentals of binaural technology. Applied Acoustics, 36(3):171 – 218,1992.
[7] Pascal Dietrich, Bruno Masiero, Martin Pollow, Roman Scharrer, and M Muller-Trapet. Matlabtoolbox for the comprehension of acoustic measurement and signal processing. Fortschritteder Akustik–DAGA, Berlin, 2010.
[8] Marshall Long. Architectural acoustics. Elsevier, 2005.
[9] ABNT Associação Brasileira de Normas Técnicas. NBR 12179 - 1992 - Tratamento acústicoem recintos fechados, Abril 1992.
10


![Experiments on gestures: walking, running, and hittingChapter 7. Experiments on gestures: walking, running, and hitting 113 acoustic cues [33, 131]. This is done in a stereotype and/or](https://img.pdfslide.net/doc/110x75/5f38862289622b03104d20fa/experiments-on-gestures-walking-running-and-chapter-7-experiments-on-gestures.jpg)