Embed Size (px)
Citation preview
1
Room Temperature Ionic Liquids Ruth E. Baltus Introduction The initial objective of this project was to carry out a fundamental study of the transport characteristics of a variety of gases and organic solutes in room temperature ionic liquids. The goal was to combine information collected from a number of different experimental measurements in order to develop a fundamental understanding of the interactions governing transport in ionic liquids. Measurements include the diffusivity and solubility of target solutes in different ionic liquids as well as ionic liquid viscosity and density at different dissolved solute concentrations.
Our efforts focused primarily on carbon dioxide solubility and diffusivity measurements. Additional measurements involved gas permeation through supported ionic liquid measurements, work that is closely related to the transport measurements. These measurements were conducted with commercially available ionic liquids as well as with novel ionic liquids that were synthesized in our laboratory. Gas permeation through polymerized ionic liquid films was also measured.
In addition to our investigations of thermodynamics and transport of gases in ionic liquids, electrochemical characteristics of different room temperature ionic liquids was also investigated. This work is motivated by the recognition that ionic liquids may have potential as electrolytes for energy storage devices.
Gas Solubility and Diffusion Measurements in Commercial Ionic Liquids
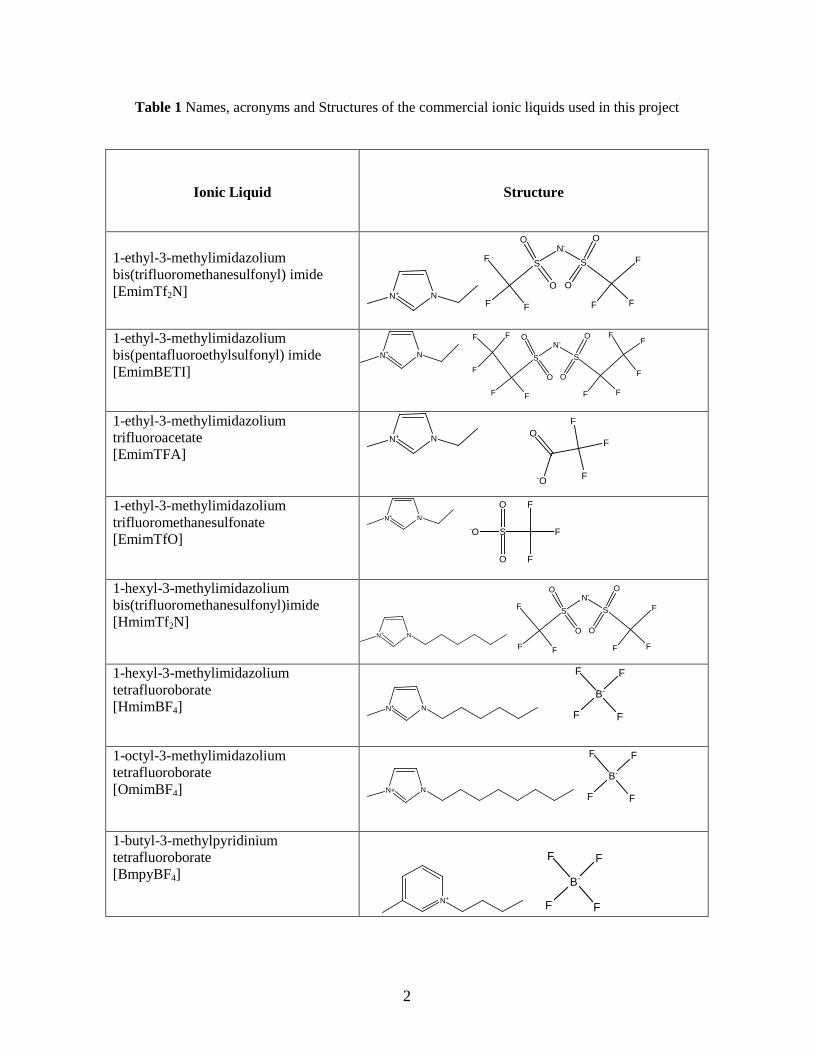
Measurements were performed with a collection of commercial ionic liquids, with names, acronyms and structures listed in Table 1. The experimental system used for determining gas solubility and diffusion involves tracking the decrease in pressure that results following the introduction of target gas into a small closed chamber containing a film of ionic liquid. The solubility and diffusivity of target gas were determined by fitting the pressure decay to a one dimensional diffusion model. Gas solubility was characterized using the Henry’s Law constant for each gas-ionic liquid system. These measurements focused primarily on CO2 as the target gas, with measurements performed with twelve different commercially available ionic liquids. A limited number of measurements were also performed with NO2 as the target gas. Early measurements were performed by Ying Hou, an MS student supported as a Teaching Assistant. More recent work was conducted by Sekhar Moganty, a PhD student supported as a Research Assistant on this NSF grant.
2
N-
S
O
O
FF
F
FF
S
O
O
FF
FF
F
S
O
O
-O
F
F
F
Table 1 Names, acronyms and Structures of the commercial ionic liquids used in this project
Ionic Liquid
Structure
1-ethyl-3-methylimidazolium bis(trifluoromethanesulfonyl) imide [EmimTf2N]
1-ethyl-3-methylimidazolium bis(pentafluoroethylsulfonyl) imide [EmimBETI]
1-ethyl-3-methylimidazolium trifluoroacetate [EmimTFA]
1-ethyl-3-methylimidazolium trifluoromethanesulfonate [EmimTfO]
1-hexyl-3-methylimidazolium bis(trifluoromethanesulfonyl)imide [HmimTf2N]
1-hexyl-3-methylimidazolium tetrafluoroborate [HmimBF4]
1-octyl-3-methylimidazolium tetrafluoroborate [OmimBF4]
1-butyl-3-methylpyridinium tetrafluoroborate [BmpyBF4]
N+ N
N-
S
O
O
F
FF
S
O
O
F
FF
N+ N
N+ N
N+ N
B-
FF
F F
N+ N
B-
FF
F F
N+
B-
FF
F F
N+ N
O
-O
F
F
F
N-
S
O
O
F
FF
S
O
O
F
FFN+ N
3
1-n-butyl-3-methylimidazolium bis(trifluoromethylsulfonyl)imide [BmimTf2N]
N NH3C
CH3
1,2-dimethyl-3-propylimidazolium bis(trifluoromethylsulfonyl)imide [PmmimTf2N]
N NH3C CH3
1-butyl-3-methylpyridinium bis(trifluoromethylsulfonyl)imide [BmpyTf2N]
1-n-butyl-3-methylimidazolium tetrafluoroborate [BmimBF4]
N NH3C
CH3
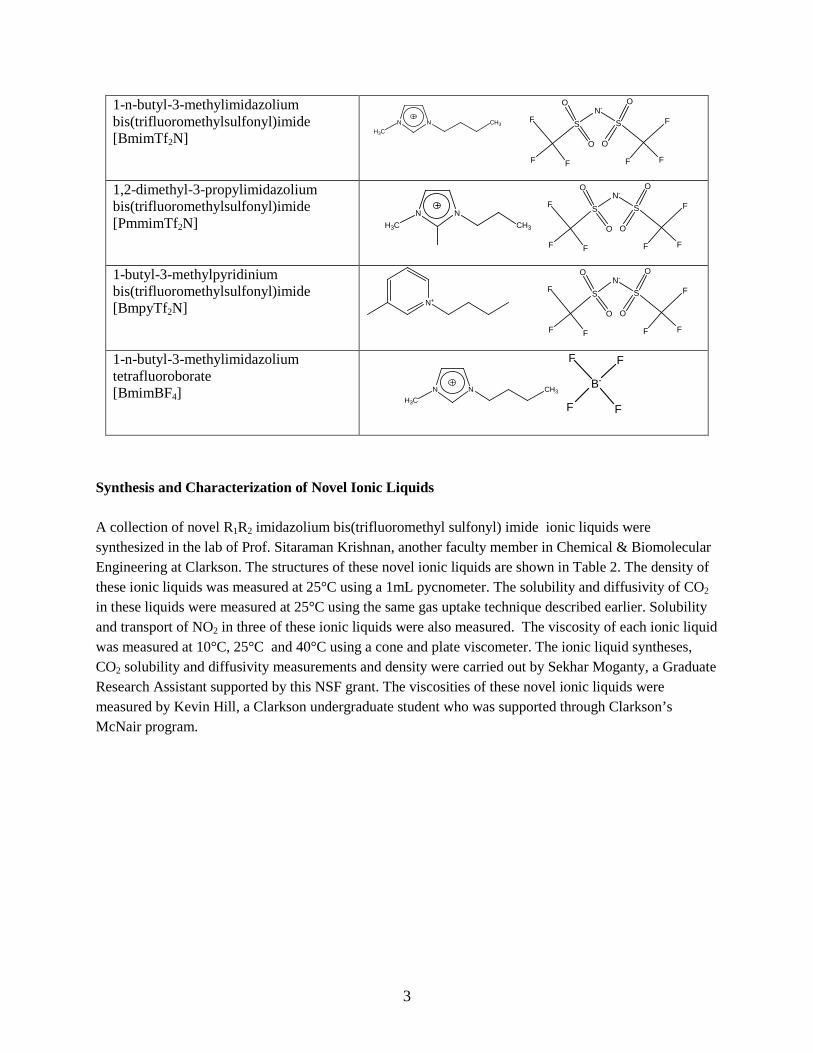
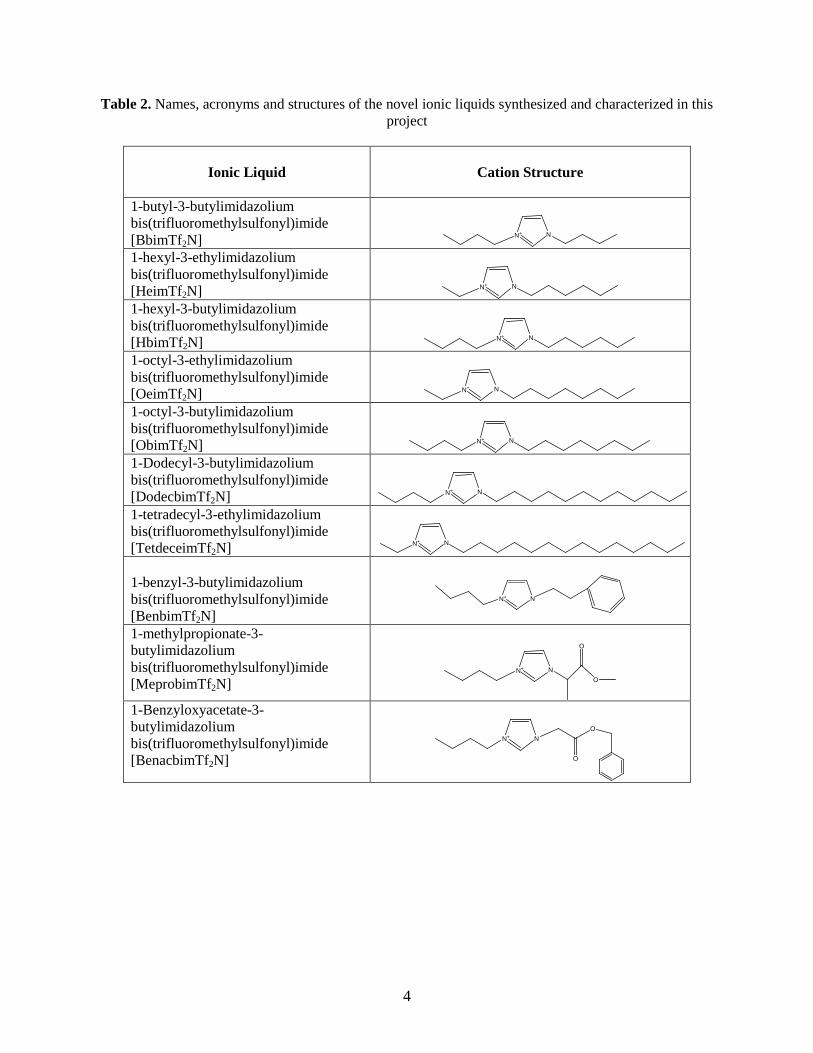
Synthesis and Characterization of Novel Ionic Liquids A collection of novel R1R2 imidazolium bis(trifluoromethyl sulfonyl) imide ionic liquids were synthesized in the lab of Prof. Sitaraman Krishnan, another faculty member in Chemical & Biomolecular Engineering at Clarkson. The structures of these novel ionic liquids are shown in Table 2. The density of these ionic liquids was measured at 25°C using a 1mL pycnometer. The solubility and diffusivity of CO2
in these liquids were measured at 25°C using the same gas uptake technique described earlier. Solubility and transport of NO2 in three of these ionic liquids were also measured. The viscosity of each ionic liquid was measured at 10°C, 25°C and 40°C using a cone and plate viscometer. The ionic liquid syntheses, CO2 solubility and diffusivity measurements and density were carried out by Sekhar Moganty, a Graduate Research Assistant supported by this NSF grant. The viscosities of these novel ionic liquids were measured by Kevin Hill, a Clarkson undergraduate student who was supported through Clarkson’s McNair program.
N+
B-
FF
F F
N-
S
O
O
F
FF
S
O
O
F
FF
N-
S
O
O
F
FF
S
O
O
F
FF
N-
S
O
O
F
FF
S
O
O
F
FF
4
Table 2. Names, acronyms and structures of the novel ionic liquids synthesized and characterized in this project
Ionic Liquid
Cation Structure
1-butyl-3-butylimidazolium bis(trifluoromethylsulfonyl)imide [BbimTf2N]
1-hexyl-3-ethylimidazolium bis(trifluoromethylsulfonyl)imide [HeimTf2N]
1-hexyl-3-butylimidazolium bis(trifluoromethylsulfonyl)imide [HbimTf2N]
1-octyl-3-ethylimidazolium bis(trifluoromethylsulfonyl)imide [OeimTf2N]
1-octyl-3-butylimidazolium bis(trifluoromethylsulfonyl)imide [ObimTf2N]
1-Dodecyl-3-butylimidazolium bis(trifluoromethylsulfonyl)imide [DodecbimTf2N]
1-tetradecyl-3-ethylimidazolium bis(trifluoromethylsulfonyl)imide [TetdeceimTf2N]
1-benzyl-3-butylimidazolium bis(trifluoromethylsulfonyl)imide [BenbimTf2N]
1-methylpropionate-3-butylimidazolium bis(trifluoromethylsulfonyl)imide [MeprobimTf2N]
1-Benzyloxyacetate-3-butylimidazolium bis(trifluoromethylsulfonyl)imide [BenacbimTf2N]
N+ N
N+ N
N+ N
N+ N
N+ N
N+ N
N+ N
N+ N
N+ NO
O
N+ N
O
O
5
Gas Permeation through Supported Ionic Liquid Membranes
Supported ionic liquid membranes were prepared by saturating the pores in anodic alumina membranes with ionic liquid. These supported ionic liquid membranes (SILMs) were placed into a stainless steel membrane holder. The upstream side of the membrane was exposed to target gas at a fixed pressure, approximately 2 psig. A collection vessel was placed on the downstream side of the membrane which was initially evacuated. Gas permeation through the membrane was monitored by measuring pressure in the collection vessel as a function of time. Permeation measurements were performed for time periods up to one day. The resulting pressure versus time data were interpreted using a one dimensional diffusion model to determine a permeance value for each SILM/gas system. Ideal selectivities for CO2 capture were determined by comparing CO2 to N2 permeance values with the same ionic liquid. Gas permeability through supported polymerized ionic liquid films were also investigated. Joshua Close, a Graduate Teaching Assistant supported by Clarkson University, was primarily responsible for this aspect of this project. Karen Farmer, a Cornell University undergraduate student also performed some membrane permeance measurements. Karen was supported primarily by the REU supplement grant, with some additional support provided by an REU Site grant to Clarkson (Environmental Science and Engineering). Ionic Liquid Viscosity Measurements Several undergraduate students have been involved with performing viscosity measurements with a number of different ionic liquid systems. Bradley Buchheit, a May 2008 Clarkson B.S. graduate, completed his Honors thesis that involved an examination of the impact of dissolved water, methanol and butanol on the viscosity of room temperature ionic liquids. Water and methanol were selected as a first step in examining dissolved solutes with different polarity. A low volume capillary viscometer was used for these measurements. Water content was measured using Karl-Fisher titration.
Daniel Wang, an undergraduate student from the University of Rochester spent summer 2008 examining the impact of dissolved lithium salts and polypropylene carbonate on ionic liquid viscosity. Lithium salts were examined because ionic liquids have potential as solvents in lithium ion batteries. Solutions containing 1M LiTf2N were used for these measurements. Polypropylene carbonate was selected because it is an additive that is being considered to reduce the viscosity of ionic liquids in chemical processes. The viscosity of solutions containing different levels of polypropylene carbonate in Emim EtSO4 were measured. Viscosity measurements with both the Li salt and polypropylene carbonate solutions were performed using a cone and plate viscometer which enables one to examine the rheological behavior of these unique liquids. (Newtonian behavior is assumed when using a capillary viscometer.) Dan was supported by an REU Site grant to Clarkson University (Environmental Sciences and Engineering).
Another Clarkson undergraduate student, Kevin Hill, spent the summer of 2009 investigating the viscosity of the new, novel ionic liquids that were synthesized by Sekhar Moganty. Kevin was supported as part of Clarkson’s McNair program.
6
Electrochemical Measurements Cyclic voltammetry measurements were performed with different electrode materials to determine the electrochemical window of two different ionic liquids (Bmim BF4 and 1-butyl-2,3-dimethylimidazolium (Bdmim) BF4). Electrochemical impedance spectroscopy (EIS) measurements were performed with the same ionic liquids with four different electrode materials (glassy carbon, platinum, gold, and tantalum). EIS experiments were conducted from 100 KHz to 10 mHz at different potentials within the electrochemical window to ensure the absence of any faradaic reactions. Results from these measurements were interpreted using electrode-equivalent circuit models and provided information about the reactive surfaces in these systems. All electrochemical experiments were conducted using a VERSASTAT3 electrochemical station that was purchased using this NSF grant. Electrochemical measurements were also performed with carbon nanotube and glassy carbon electrodes with 1-ethyl-3-butylimidazolium tetrafluoroborate and 1-butyl-3-methylimidazolium tetrafluoroborate ionic liquids. These measurements were performed by Sekhar Moganty, the RA supported on the grant with help from Professor Dipankar Roy and several of his students from Clarkson’s Department of Physics.
Biocatalysis in Ionic Liquids
Efforts were also initiated to examine enzyme catalysis in room temperature ionic liquids. There is interest in biocatalysis in ionic liquid solvents because of the broad range of solutes that can be dissolved in ionic liquids, making them candidates for non-aqueous catalysis. This work involved tyrosinase as a model enzyme. Four different ionic liquids were examined: bmim PF6, bmim BF4, bmim DBP (dibutyl phosphate) and hmim PF6. Fluorescence spectroscopy and FTIR were used to examine changes in enzyme conformation in different ionic liquid/water systems. Enzyme activity was investigated using phenol as a substrate, with the production of quinine tracked using uv-vis spectroscopy. This work was performed during summer 2008 by Lindsey Duplissa a Clarkson undergraduate student who was supported by the REU supplement to this grant. Lindsey also participated in the activities of the Environmental Science and Engineering REU site during her time on campus.
7
Major Findings The structures of the ionic liquids investigated in this study and the acronyms used for these liquids are listed in Tables 1 and 2 in the Activities section of this Project Report. Here, we will begin with a summary of the Major Findings from our efforts. This is followed by a more detailed discussion of some of the results, with an emphasis on results that have not been previously reported in Progress Reports for this grant. Summary Carbon Dioxide Solubility and Diffusivity in Commercial Ionic Liquids
1. Carbon dioxide solubility in ionic liquids depends much more strongly on ionic liquid anion than on the ionic liquid cation. Of the tested commercial ionic liquids, carbon dioxide solubility was highest in Hmim Tf2N (H = 28 bar at 25°C) and smallest in Bmpy BF4 (H = 60 bar at 25°C). (Solubility is inversely proportional to Henry’s Law constant.) Consistent with previous reports from our group and others, solubility was found to increase as the length of the alkyl chain on the cation increased.
2. Carbon dioxide solubility in ionic liquids with Emim cation with different anions resulted in the following order: Tf2N ~ BETI > TFA > TfO. Apparently, the additional fluorines on Emim BETI did not improve CO2 solubility relative to EmimTf2N.
3. Carbon dioxide solubility was successfully interpreted using regular solution theory. Solubility parameters for the ionic liquids were related to the activation energy of viscosity, following an approach proposed by Eyring in his rate theory of liquids. Solubility parameters estimated using this approach were found to be in very good agreement with values determined from literature values for the energy of vaporization. Carbon dioxide solubility was found to be inversely proportional to the ionic liquid solubility parameter and correlated well with the difference in the square of the difference in solubility parameter between ionic liquid and carbon dioxide. This means that one can estimate carbon dioxide solubility in ionic liquids from measurement of ionic liquid viscosity as a function of temperature.
4. The temperature sensitivity of the Henry’s Law constant was used to determine the partial molar enthalpy and partial molar entropy of CO2 absorption. Values for
2COh∆ and 2COs∆ were not
strongly dependent on ionic liquid structure for the ionic liquids with imidazolium cation. A comparison of
2COh∆ and 2COs∆ in pyridinium based ionic liquids to values in imidazolium based
ionic liquids shows smaller values for the ionic liquids with a pyridinium cation, indicating weaker ionic liquid-CO2 interactions for the pyridinium based ionic liquids.
5. Carbon dioxide diffusivity in ionic liquids was found to depend on the ionic liquid cation as well as the anion.
6. The diffusion coefficient for CO2 in room temperature ionic liquids is ~ 10-6 cm2/s, an order of magnitude smaller than for CO2 diffusion in traditional organic solvents. These slow diffusion rates can, in general, be attributed to the relatively high viscosity of ionic liquids. CO2 diffusion was found to be proportional to μIL
-1/2 , extending a trend observed for carbon dioxide solubility in non-ionic solvents.
8
7. Correlations were developed to relate CO2 diffusivity in ionic liquids to physical properties of the ionic liquids. Different correlations were needed for ionic liquids with Tf2N anion and for ionic liquids with other anions.
8. There is an inverse correlation between carbon dioxide solubility and transport, with the most promising ionic liquids from a thermodynamic perspective showing the poorest gas transport characteristics. Both thermodynamics and transport characteristics are related to ionic liquid viscosity.
9. The thermodynamic and transport properties of nitrous oxide (NO2) in ionic liquids were found to be comparable to those for CO2 in the same ionic liquids, illustrating the importance of solute size in these properties.
Novel Ionic Liquids – Viscosity and Carbon Dioxide Solubility and Diffusivity
1. Ionic liquid viscosity was affected dramatically by the choice of side group on the imidazolium cation, with viscosity largest in Benacbim Tf2N, by a factor of 10-20 compared to the viscosity of the other novel ionic liquids.
2. An increase in the total alkyl chain length on the imidazolium cation was found to increase both the ionic liquid viscosity as well as carbon dioxide solubility. Most interestingly, these properties appear to be independent of the distribution of the carbons on the alkyl side chains. For example, the viscosity and CO2 solubility Hbim Tf2N were approximately equal to the viscosity and CO2 solubility in Bbim Tf2N. Both of these ionic liquids have a total of 8 carbons on the alkyl side chains. Similar observations were found for ionic liquids with 10, 12 and 16 carbon alkyl side chains.
3. The maximum CO2 solubility was observed in TetdeceimTf2N, with a Henry’s Law constant of 14 bar at 25°C. This is twice the maximum solubility observed at 25°C with the commercial ionic liquids.
4. The diffusion coefficient for CO2 in room temperature ionic liquids is ~ 10 -6 cm2/s, a similar order of magnitude for CO2 diffusion in commercial ionic liquids. The dependency of the CO2 diffusion on ionic liquid viscosity was found to be similar to the commercial ionic liquids.
Gas Permeance through Supported Ionic Liquid Membranes
1. The ideal selectivity of CO2 over N2 ranged from ~ 10 - 20 in supported ionic liquid membranes; selectivity in the polymerized supported ionic liquid membrane was considerably smaller than this.
2. A plot of CO2-N2 selectivity versus CO2 permeability indicates that these ionic liquid systems lie along the upper bound of a Robeson plot. Selectivity values in these systems are somewhat smaller than values reported by others for polymeric membranes but permeability values are considerably ( ~ factor of 100) larger.
3. Membrane permeability results indicate that permeability is not controlled by thermodynamics, as is often assumed when one only has solubility information.
4. Supported ionic liquid membranes were found to be stable at transmembrane pressures up to 6.5 atm.
9
5. There remains some questions about the influence of the pore support on gas permeation through these ionic liquid based membranes.
Ionic Liquid Viscosity
1. Ionic liquid viscosity decreases with the addition of water, alcohols and polypropylene carbonate but increases with the addition of lithium salts. These results indicate that the lithium salt increases coulombic anion-cation interactions whereas the other species disrupt those interactions. The strong influence of water on ionic liquid viscosity indicates that the potential for water absorption must be considered when designing separation or reaction processes that utilize ionic liquids.
Electrochemical Characteristics of Ionic Liquids
1. Cyclic voltametry results show an electrochemical window ranging from 4.2 to 5.7 V for the two ionic liquids examined in this project. This window is considerably larger than the window observed with aqueous salts such as KNO3 (~ 1 V). This large window indicates that ionic liquids have potential in various electrochemical applications, such as in batteries and as supercapacitors. The outer bounds of the electrochemical windows represent the tolerable overpotentials that can be applied without activating large faradaic currents.
2. For Bmim BF4 the electrochemical windows narrow in the order tantalum > platinum > gold> glassy carbon electrodes whereas with 1Bdmim BF4, the order is tantalum > gold > platinum > glassy carbon. The electrochemical windows correlate with the work functions of the experimental electrodes.
3. Electrochemical impedance spectroscopy results indicate that all eight electrode-ionic liquid pairs investigated yield the same electrode equivalent circuit, with a faradaic path of electrolyte oxidation/reduction accompanied by a nonfaradaic adsorption branch of electrolyte impurities. The common electrode equivalent circuit implies that, in the absence of faradaic currents, the overall reactive features of the electrochemical interface are largely governed by the ionic liquid properties.
Biocatalysis in Ionic Liquids
1. Activity of tyrosinase in ionic liquid/buffer mixtures shows that water is needed for enzyme activity and that activity can be increased with the addition of ionic liquids to aqueous systems. These results are consistent with conformational changes undergone by the enzyme as ionic liquid is introduced.
10
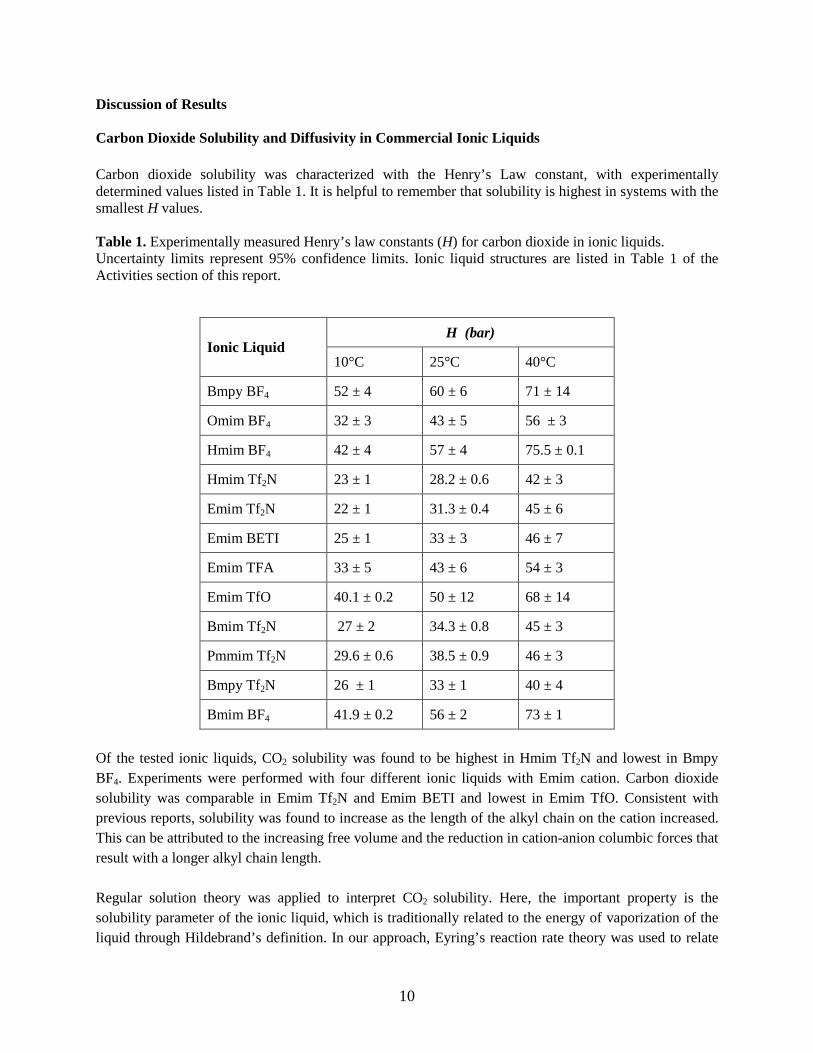
Discussion of Results Carbon Dioxide Solubility and Diffusivity in Commercial Ionic Liquids Carbon dioxide solubility was characterized with the Henry’s Law constant, with experimentally determined values listed in Table 1. It is helpful to remember that solubility is highest in systems with the smallest H values. Table 1. Experimentally measured Henry’s law constants (H) for carbon dioxide in ionic liquids. Uncertainty limits represent 95% confidence limits. Ionic liquid structures are listed in Table 1 of the Activities section of this report.
Ionic Liquid H (bar)
10°C 25°C 40°C
Bmpy BF4 52 ± 4 60 ± 6 71 ± 14
Omim BF4 32 ± 3 43 ± 5 56 ± 3
Hmim BF4 42 ± 4 57 ± 4 75.5 ± 0.1
Hmim Tf2N 23 ± 1 28.2 ± 0.6 42 ± 3
Emim Tf2N 22 ± 1 31.3 ± 0.4 45 ± 6
Emim BETI 25 ± 1 33 ± 3 46 ± 7
Emim TFA 33 ± 5 43 ± 6 54 ± 3
Emim TfO 40.1 ± 0.2 50 ± 12 68 ± 14
Bmim Tf2N 27 ± 2 34.3 ± 0.8 45 ± 3
Pmmim Tf2N 29.6 ± 0.6 38.5 ± 0.9 46 ± 3
Bmpy Tf2N 26 ± 1 33 ± 1 40 ± 4
Bmim BF4 41.9 ± 0.2 56 ± 2 73 ± 1 Of the tested ionic liquids, CO2 solubility was found to be highest in Hmim Tf2N and lowest in Bmpy BF4. Experiments were performed with four different ionic liquids with Emim cation. Carbon dioxide solubility was comparable in Emim Tf2N and Emim BETI and lowest in Emim TfO. Consistent with previous reports, solubility was found to increase as the length of the alkyl chain on the cation increased. This can be attributed to the increasing free volume and the reduction in cation-anion columbic forces that result with a longer alkyl chain length. Regular solution theory was applied to interpret CO2 solubility. Here, the important property is the solubility parameter of the ionic liquid, which is traditionally related to the energy of vaporization of the liquid through Hildebrand’s definition. In our approach, Eyring’s reaction rate theory was used to relate
11
the energy of vaporization of the ionic liquid to its activation energy of viscosity and therefore relate the solubility parameter to the activation energy of viscosity. Carbon dioxide solubility was found to be inversely proportional to the ionic liquid solubility parameter, as shown in Figure 1. Very good agreement was observed between measured and predicted Henry’s Law constants, as shown in Figure 2. The important conclusion to be drawn from these results is that one can make a reasonable prediction of carbon dioxide solubility from experimental measurement of ionic liquid viscosity at different temperatures.
Figure 1 Carbon Dioxide Solubility as a function of Ionic Liquid Solubility Parameter. The solubility parameter was determined from the activation energy for viscosity of the ionic liquid.
Figure 2 Predicted versus measured Henry's Law constants for carbon dioxide in ionic liquids. Values were predicted using Regular Solution Theory with ionic liqiud solubility parameters determined from the activation energy of viscosity. Experimental values were measured at Clarkson as part of this study.
12
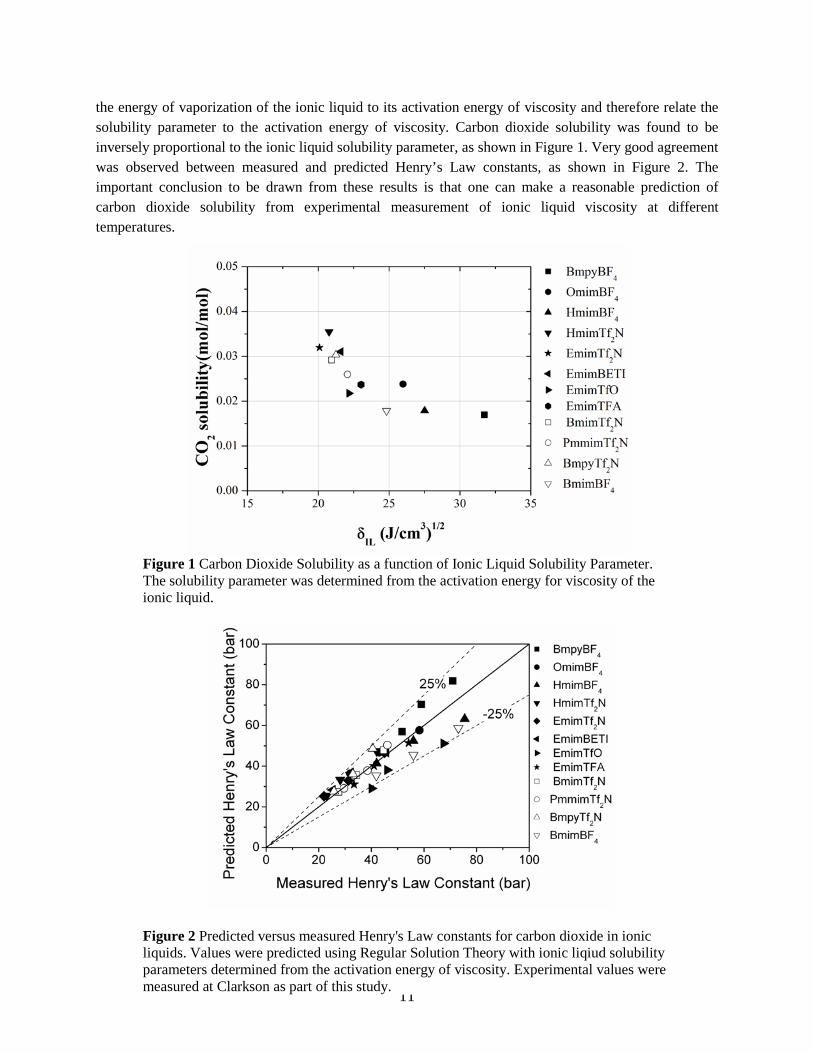
Experimentally determined diffusion coefficients for carbon dioxide in the commercial ionic liquids are summarized in Figure 3. Diffusion coefficients are of order 10-6 cm2/s and are in reasonable agreement with values reported by others in the literature, values determined using different experimental approaches. The activation energy for CO2 diffusion in ionic liquids was determined from the slope of a semi-log plot of diffusivity versus reciprocal temperature, with values summarized in Table 2. Also listed in Table 2 are activation energies for CO2 diffusion in methanol and isooctane. The activation energy values for CO2
diffusion in the reported ionic liquids are generally larger than in the traditional organic solvents.
Figure 3 Carbon Dioxide Diffusivity in Ionic Liquids
13
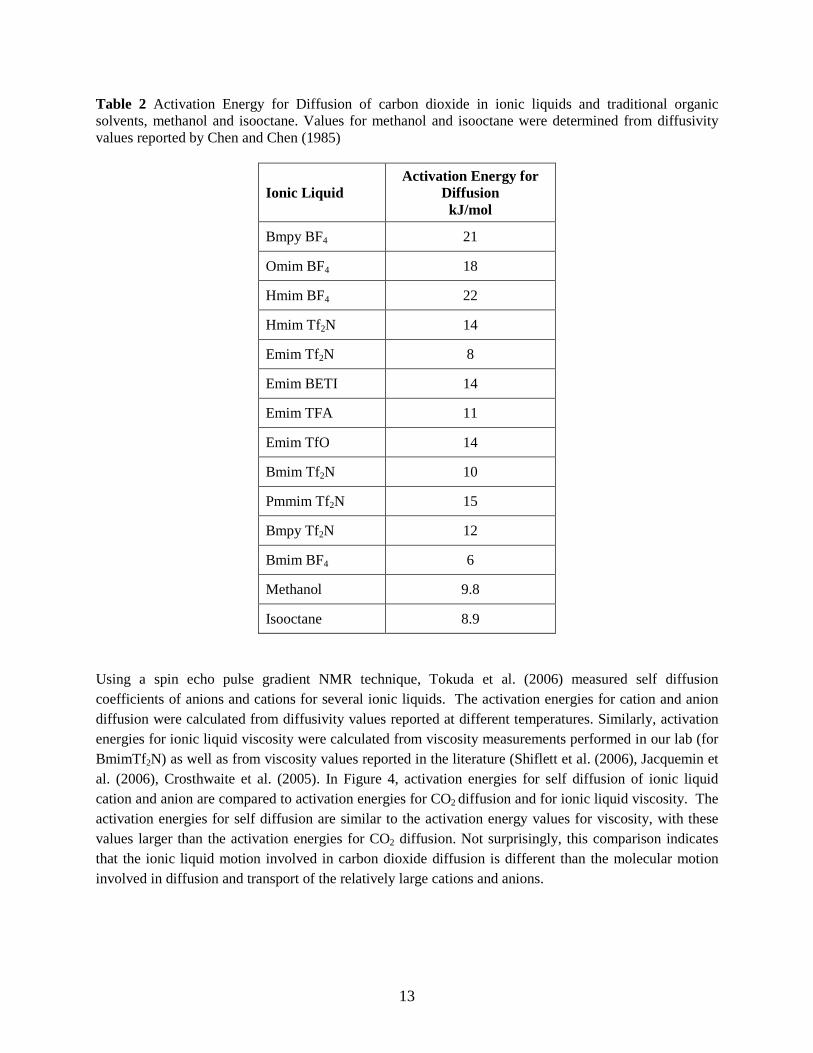
Table 2 Activation Energy for Diffusion of carbon dioxide in ionic liquids and traditional organic solvents, methanol and isooctane. Values for methanol and isooctane were determined from diffusivity values reported by Chen and Chen (1985)
Ionic Liquid Activation Energy for
Diffusion kJ/mol
Bmpy BF4 21
Omim BF4 18
Hmim BF4 22
Hmim Tf2N 14
Emim Tf2N 8
Emim BETI 14
Emim TFA 11
Emim TfO 14
Bmim Tf2N 10
Pmmim Tf2N 15
Bmpy Tf2N 12
Bmim BF4 6
Methanol 9.8
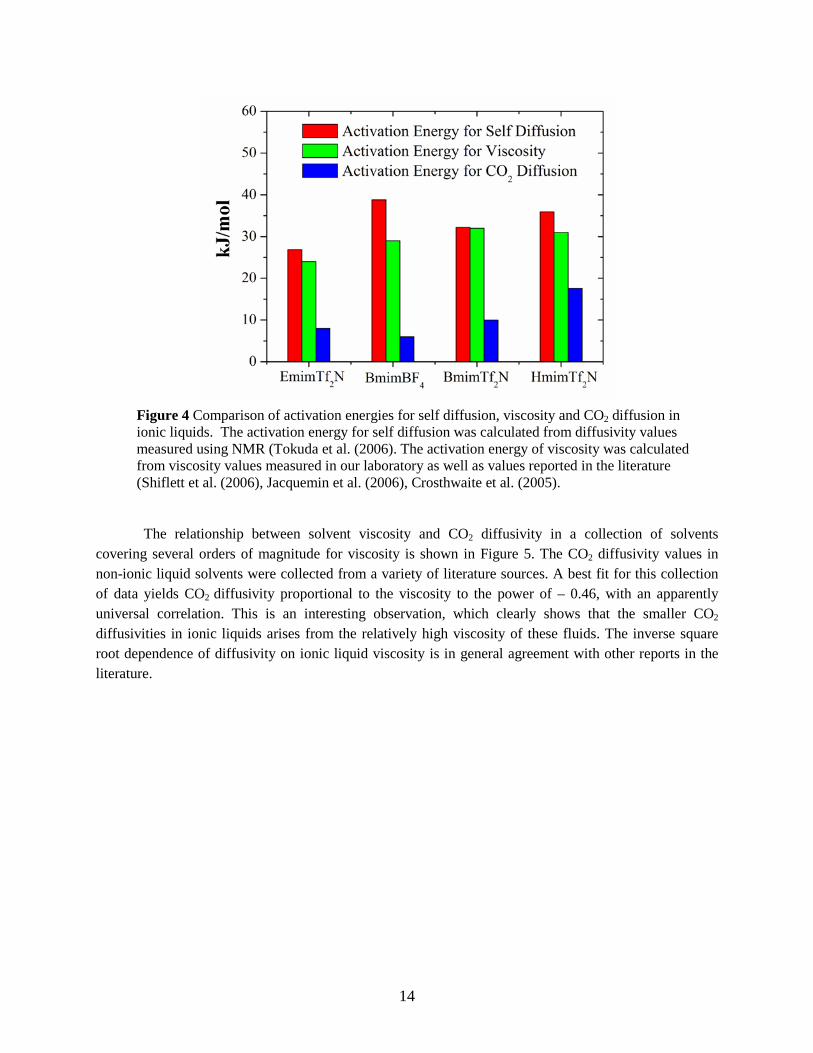
Isooctane 8.9 Using a spin echo pulse gradient NMR technique, Tokuda et al. (2006) measured self diffusion coefficients of anions and cations for several ionic liquids. The activation energies for cation and anion diffusion were calculated from diffusivity values reported at different temperatures. Similarly, activation energies for ionic liquid viscosity were calculated from viscosity measurements performed in our lab (for BmimTf2N) as well as from viscosity values reported in the literature (Shiflett et al. (2006), Jacquemin et al. (2006), Crosthwaite et al. (2005). In Figure 4, activation energies for self diffusion of ionic liquid cation and anion are compared to activation energies for CO2 diffusion and for ionic liquid viscosity. The activation energies for self diffusion are similar to the activation energy values for viscosity, with these values larger than the activation energies for CO2 diffusion. Not surprisingly, this comparison indicates that the ionic liquid motion involved in carbon dioxide diffusion is different than the molecular motion involved in diffusion and transport of the relatively large cations and anions.
14
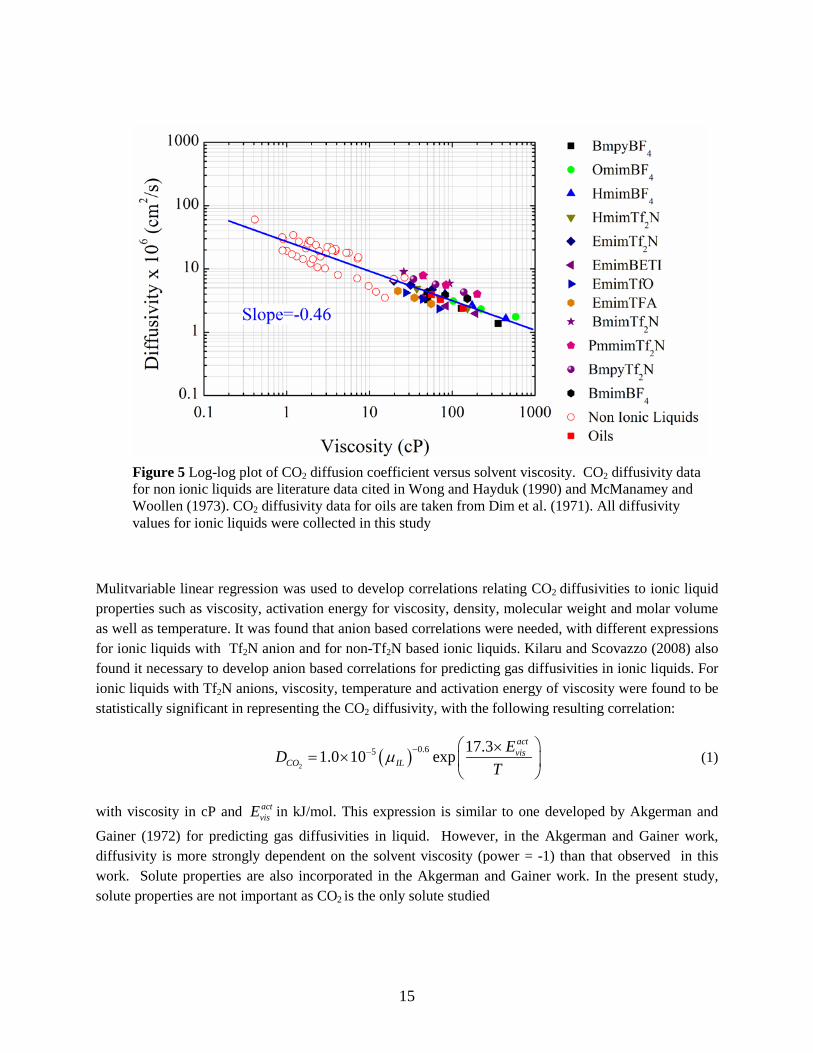
The relationship between solvent viscosity and CO2 diffusivity in a collection of solvents covering several orders of magnitude for viscosity is shown in Figure 5. The CO2 diffusivity values in non-ionic liquid solvents were collected from a variety of literature sources. A best fit for this collection of data yields CO2 diffusivity proportional to the viscosity to the power of – 0.46, with an apparently universal correlation. This is an interesting observation, which clearly shows that the smaller CO2
diffusivities in ionic liquids arises from the relatively high viscosity of these fluids. The inverse square root dependence of diffusivity on ionic liquid viscosity is in general agreement with other reports in the literature.
Figure 4 Comparison of activation energies for self diffusion, viscosity and CO2 diffusion in ionic liquids. The activation energy for self diffusion was calculated from diffusivity values measured using NMR (Tokuda et al. (2006). The activation energy of viscosity was calculated from viscosity values measured in our laboratory as well as values reported in the literature (Shiflett et al. (2006), Jacquemin et al. (2006), Crosthwaite et al. (2005).
15
Mulitvariable linear regression was used to develop correlations relating CO2 diffusivities to ionic liquid properties such as viscosity, activation energy for viscosity, density, molecular weight and molar volume as well as temperature. It was found that anion based correlations were needed, with different expressions for ionic liquids with Tf2N anion and for non-Tf2N based ionic liquids. Kilaru and Scovazzo (2008) also found it necessary to develop anion based correlations for predicting gas diffusivities in ionic liquids. For ionic liquids with Tf2N anions, viscosity, temperature and activation energy of viscosity were found to be statistically significant in representing the CO2 diffusivity, with the following resulting correlation:
( )2
0.65 17.31.0 10 expactvis
CO ILED
Tµ −− ×
= ×
(1)
with viscosity in cP and actvisE in kJ/mol. This expression is similar to one developed by Akgerman and
Gainer (1972) for predicting gas diffusivities in liquid. However, in the Akgerman and Gainer work, diffusivity is more strongly dependent on the solvent viscosity (power = -1) than that observed in this work. Solute properties are also incorporated in the Akgerman and Gainer work. In the present study, solute properties are not important as CO2 is the only solute studied
Figure 5 Log-log plot of CO2 diffusion coefficient versus solvent viscosity. CO2 diffusivity data for non ionic liquids are literature data cited in Wong and Hayduk (1990) and McManamey and Woollen (1973). CO2 diffusivity data for oils are taken from Dim et al. (1971). All diffusivity values for ionic liquids were collected in this study
16
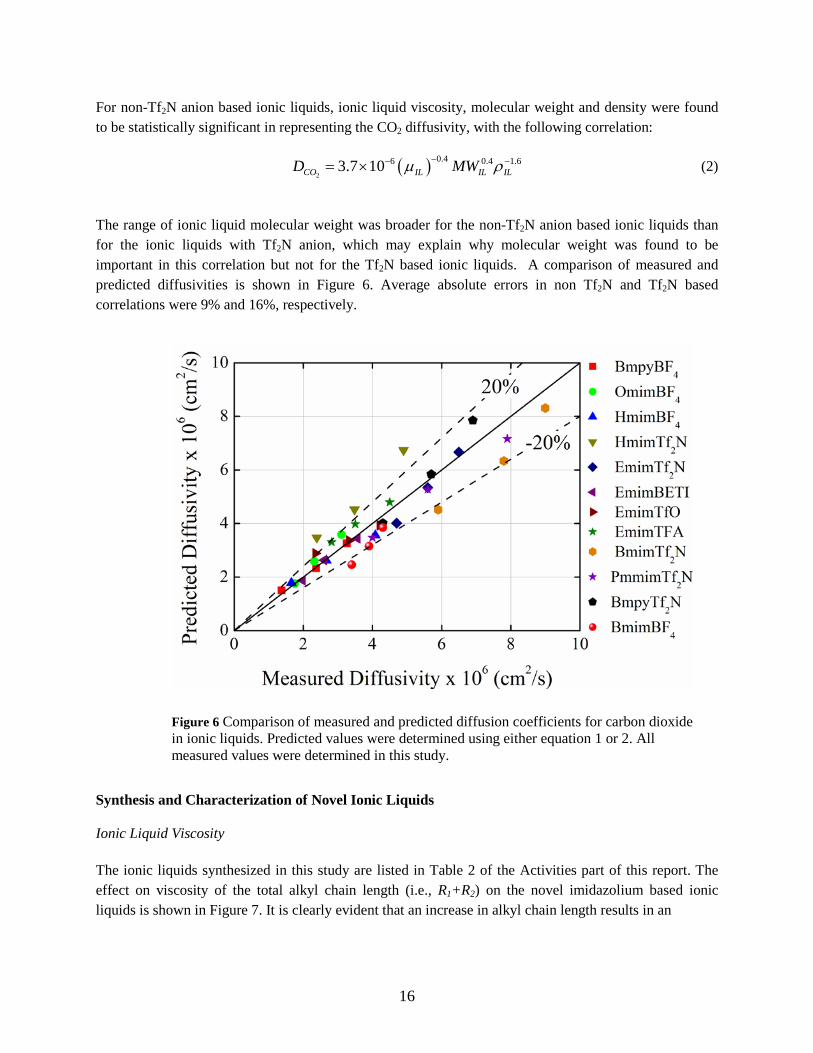
For non-Tf2N anion based ionic liquids, ionic liquid viscosity, molecular weight and density were found to be statistically significant in representing the CO2 diffusivity, with the following correlation:
( )2
0.46 0.4 1.63.7 10CO IL IL ILD MWµ ρ−− −= × (2)
The range of ionic liquid molecular weight was broader for the non-Tf2N anion based ionic liquids than for the ionic liquids with Tf2N anion, which may explain why molecular weight was found to be important in this correlation but not for the Tf2N based ionic liquids. A comparison of measured and predicted diffusivities is shown in Figure 6. Average absolute errors in non Tf2N and Tf2N based correlations were 9% and 16%, respectively.
Synthesis and Characterization of Novel Ionic Liquids Ionic Liquid Viscosity
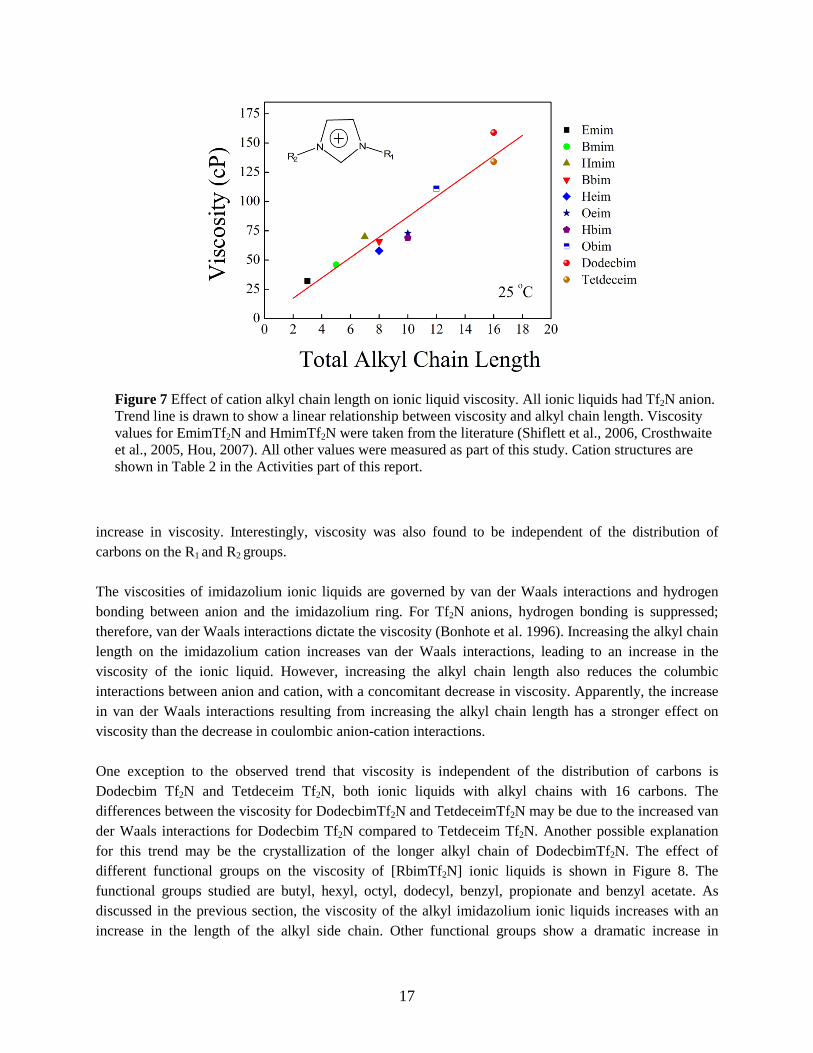
The ionic liquids synthesized in this study are listed in Table 2 of the Activities part of this report. The effect on viscosity of the total alkyl chain length (i.e., R1+R2) on the novel imidazolium based ionic liquids is shown in Figure 7. It is clearly evident that an increase in alkyl chain length results in an
Figure 6 Comparison of measured and predicted diffusion coefficients for carbon dioxide in ionic liquids. Predicted values were determined using either equation 1 or 2. All measured values were determined in this study.
17
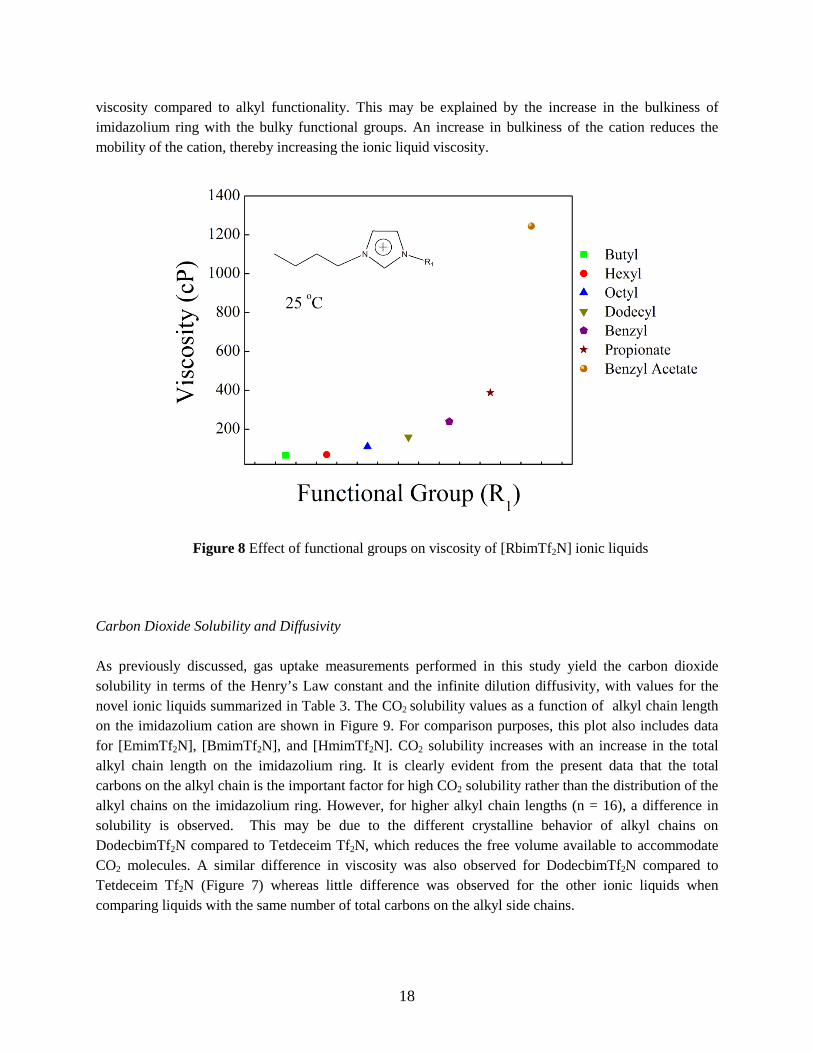
increase in viscosity. Interestingly, viscosity was also found to be independent of the distribution of carbons on the R1 and R2 groups. The viscosities of imidazolium ionic liquids are governed by van der Waals interactions and hydrogen bonding between anion and the imidazolium ring. For Tf2N anions, hydrogen bonding is suppressed; therefore, van der Waals interactions dictate the viscosity (Bonhote et al. 1996). Increasing the alkyl chain length on the imidazolium cation increases van der Waals interactions, leading to an increase in the viscosity of the ionic liquid. However, increasing the alkyl chain length also reduces the columbic interactions between anion and cation, with a concomitant decrease in viscosity. Apparently, the increase in van der Waals interactions resulting from increasing the alkyl chain length has a stronger effect on viscosity than the decrease in coulombic anion-cation interactions. One exception to the observed trend that viscosity is independent of the distribution of carbons is Dodecbim Tf2N and Tetdeceim Tf2N, both ionic liquids with alkyl chains with 16 carbons. The differences between the viscosity for DodecbimTf2N and TetdeceimTf2N may be due to the increased van der Waals interactions for Dodecbim Tf2N compared to Tetdeceim Tf2N. Another possible explanation for this trend may be the crystallization of the longer alkyl chain of DodecbimTf2N. The effect of different functional groups on the viscosity of [RbimTf2N] ionic liquids is shown in Figure 8. The functional groups studied are butyl, hexyl, octyl, dodecyl, benzyl, propionate and benzyl acetate. As discussed in the previous section, the viscosity of the alkyl imidazolium ionic liquids increases with an increase in the length of the alkyl side chain. Other functional groups show a dramatic increase in
Figure 7 Effect of cation alkyl chain length on ionic liquid viscosity. All ionic liquids had Tf2N anion. Trend line is drawn to show a linear relationship between viscosity and alkyl chain length. Viscosity values for EmimTf2N and HmimTf2N were taken from the literature (Shiflett et al., 2006, Crosthwaite et al., 2005, Hou, 2007). All other values were measured as part of this study. Cation structures are shown in Table 2 in the Activities part of this report.
18
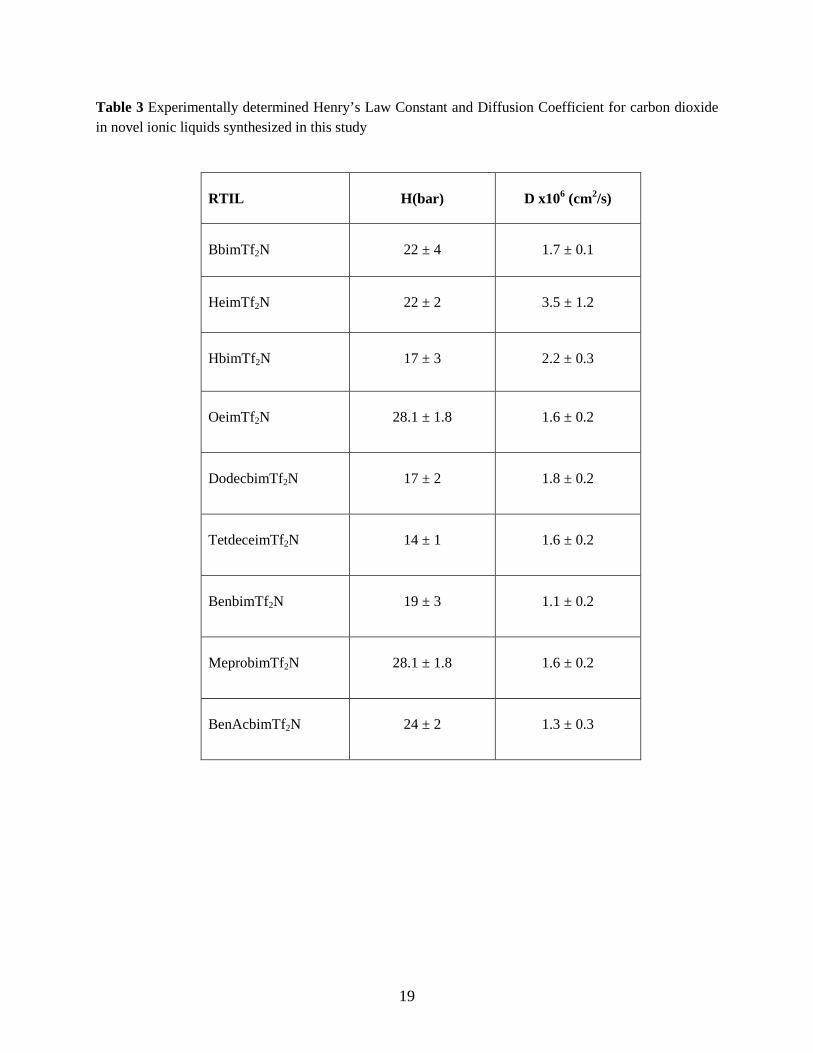
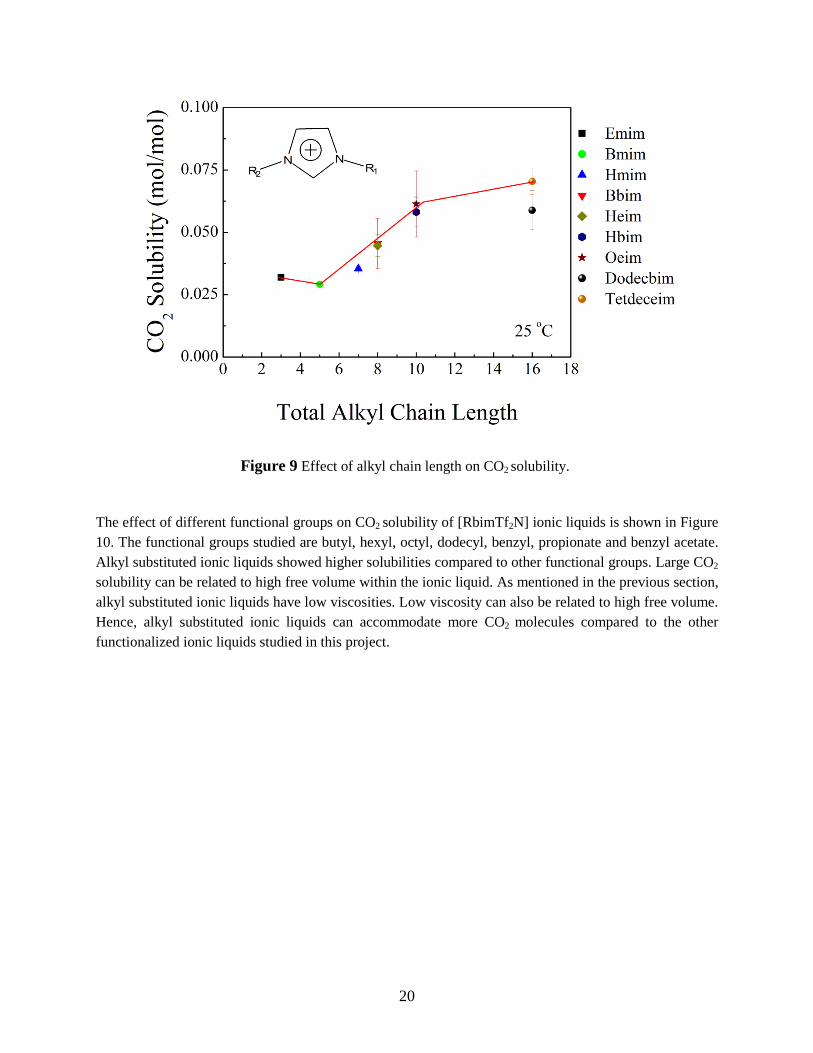
viscosity compared to alkyl functionality. This may be explained by the increase in the bulkiness of imidazolium ring with the bulky functional groups. An increase in bulkiness of the cation reduces the mobility of the cation, thereby increasing the ionic liquid viscosity. Carbon Dioxide Solubility and Diffusivity As previously discussed, gas uptake measurements performed in this study yield the carbon dioxide solubility in terms of the Henry’s Law constant and the infinite dilution diffusivity, with values for the novel ionic liquids summarized in Table 3. The CO2 solubility values as a function of alkyl chain length on the imidazolium cation are shown in Figure 9. For comparison purposes, this plot also includes data for [EmimTf2N], [BmimTf2N], and [HmimTf2N]. CO2 solubility increases with an increase in the total alkyl chain length on the imidazolium ring. It is clearly evident from the present data that the total carbons on the alkyl chain is the important factor for high CO2 solubility rather than the distribution of the alkyl chains on the imidazolium ring. However, for higher alkyl chain lengths (n = 16), a difference in solubility is observed. This may be due to the different crystalline behavior of alkyl chains on DodecbimTf2N compared to Tetdeceim Tf2N, which reduces the free volume available to accommodate CO2 molecules. A similar difference in viscosity was also observed for DodecbimTf2N compared to Tetdeceim Tf2N (Figure 7) whereas little difference was observed for the other ionic liquids when comparing liquids with the same number of total carbons on the alkyl side chains.
Figure 8 Effect of functional groups on viscosity of [RbimTf2N] ionic liquids
19
Table 3 Experimentally determined Henry’s Law Constant and Diffusion Coefficient for carbon dioxide in novel ionic liquids synthesized in this study
RTIL
H(bar)
D x106 (cm2/s)
BbimTf2N
22 ± 4
1.7 ± 0.1
HeimTf2N
22 ± 2
3.5 ± 1.2
HbimTf2N
17 ± 3
2.2 ± 0.3
OeimTf2N
28.1 ± 1.8
1.6 ± 0.2
DodecbimTf2N
17 ± 2
1.8 ± 0.2
TetdeceimTf2N
14 ± 1
1.6 ± 0.2
BenbimTf2N
19 ± 3
1.1 ± 0.2
MeprobimTf2N
28.1 ± 1.8
1.6 ± 0.2
BenAcbimTf2N
24 ± 2
1.3 ± 0.3
20
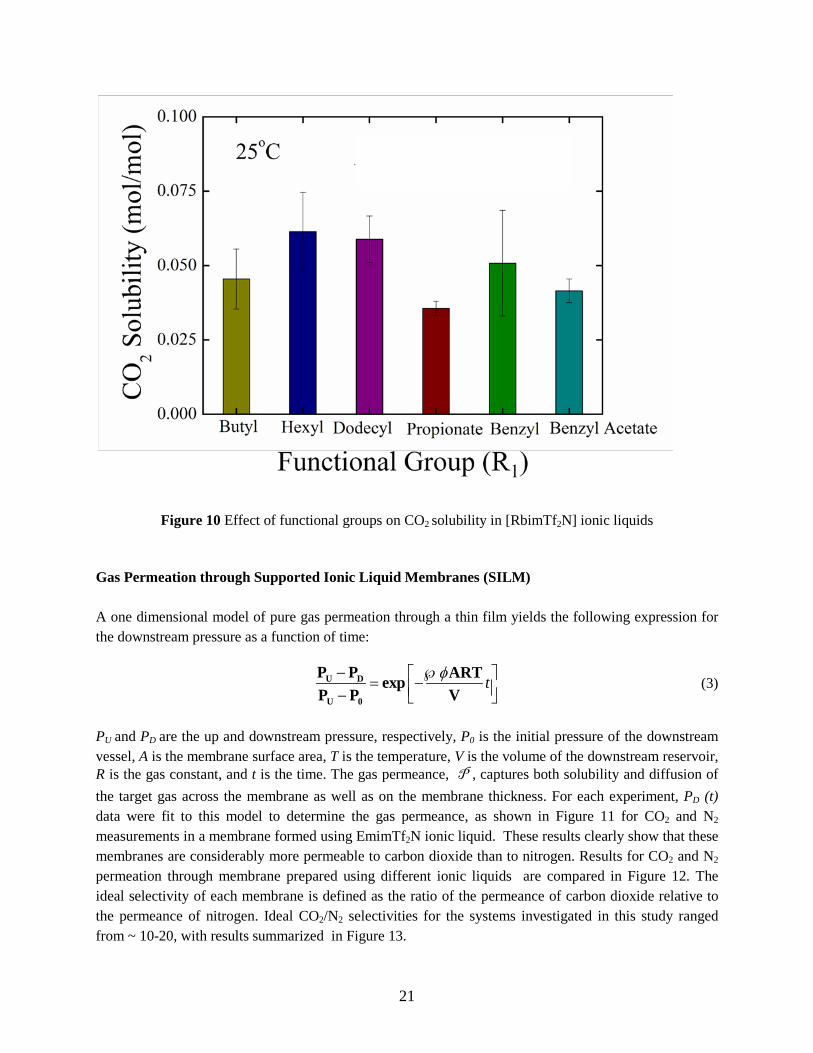
The effect of different functional groups on CO2 solubility of [RbimTf2N] ionic liquids is shown in Figure 10. The functional groups studied are butyl, hexyl, octyl, dodecyl, benzyl, propionate and benzyl acetate. Alkyl substituted ionic liquids showed higher solubilities compared to other functional groups. Large CO2 solubility can be related to high free volume within the ionic liquid. As mentioned in the previous section, alkyl substituted ionic liquids have low viscosities. Low viscosity can also be related to high free volume. Hence, alkyl substituted ionic liquids can accommodate more CO2 molecules compared to the other functionalized ionic liquids studied in this project.
Figure 9 Effect of alkyl chain length on CO2 solubility.
21
Figure 10 Effect of functional groups on CO2 solubility in [RbimTf2N] ionic liquids
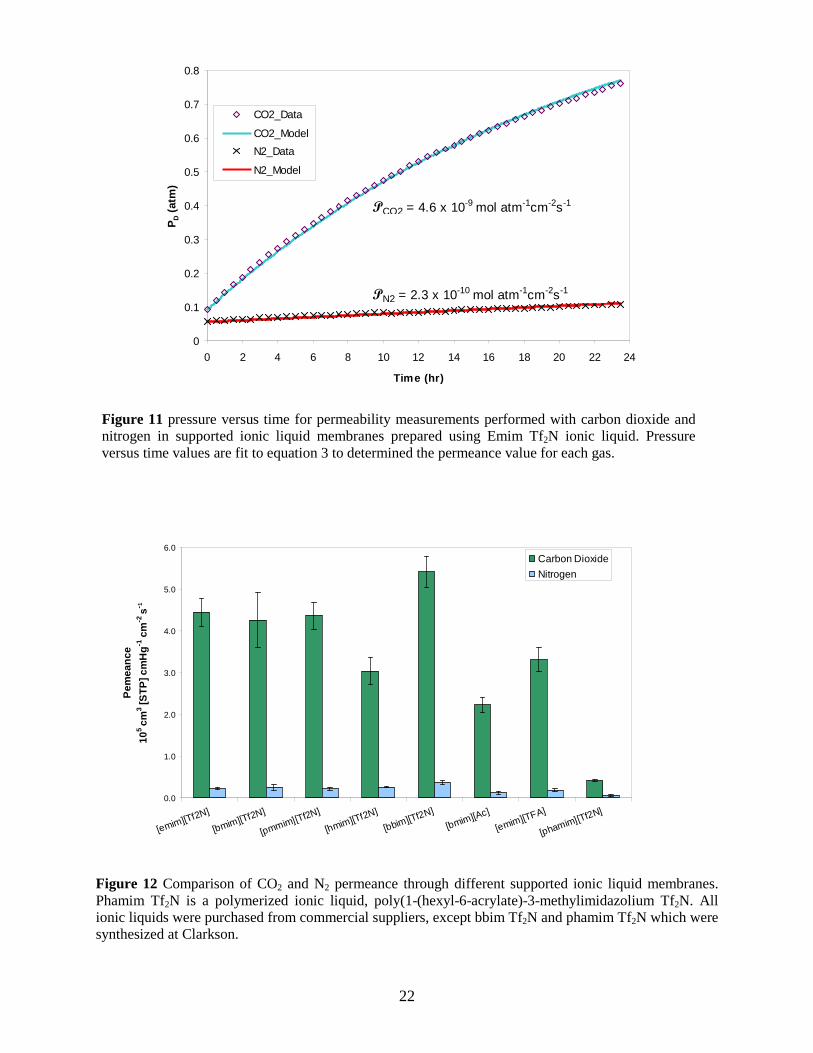
Gas Permeation through Supported Ionic Liquid Membranes (SILM) A one dimensional model of pure gas permeation through a thin film yields the following expression for the downstream pressure as a function of time:
tφ− ℘ = − − U D
U 0
P P ARTexpP P V
(3)
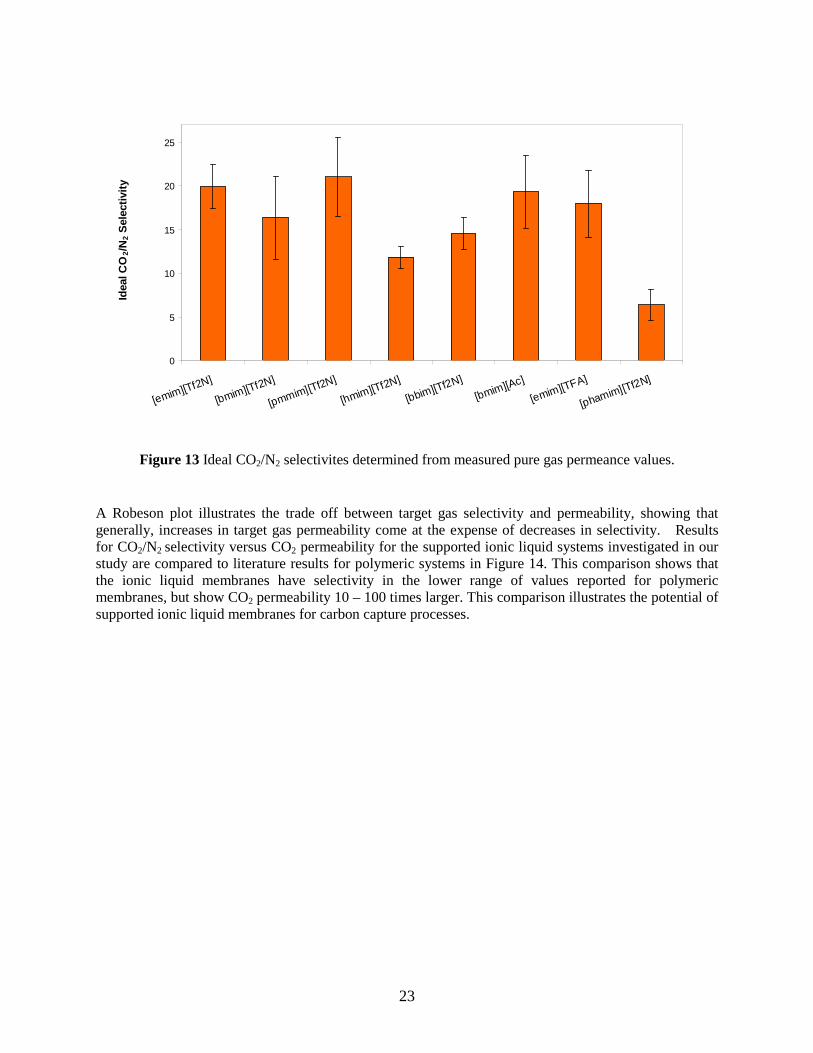
PU and PD are the up and downstream pressure, respectively, P0 is the initial pressure of the downstream vessel, A is the membrane surface area, T is the temperature, V is the volume of the downstream reservoir, R is the gas constant, and t is the time. The gas permeance, P , captures both solubility and diffusion of the target gas across the membrane as well as on the membrane thickness. For each experiment, PD (t) data were fit to this model to determine the gas permeance, as shown in Figure 11 for CO2 and N2 measurements in a membrane formed using EmimTf2N ionic liquid. These results clearly show that these membranes are considerably more permeable to carbon dioxide than to nitrogen. Results for CO2 and N2 permeation through membrane prepared using different ionic liquids are compared in Figure 12. The ideal selectivity of each membrane is defined as the ratio of the permeance of carbon dioxide relative to the permeance of nitrogen. Ideal CO2/N2 selectivities for the systems investigated in this study ranged from ~ 10-20, with results summarized in Figure 13.
22
Figure 12 Comparison of CO2 and N2 permeance through different supported ionic liquid membranes. Phamim Tf2N is a polymerized ionic liquid, poly(1-(hexyl-6-acrylate)-3-methylimidazolium Tf2N. All ionic liquids were purchased from commercial suppliers, except bbim Tf2N and phamim Tf2N which were synthesized at Clarkson.
0.0
1.0
2.0
3.0
4.0
5.0
6.0
[emim][Tf2N]
[bmim][Tf2N]
[pmmim][Tf2N]
[hmim][Tf2N]
[bbim][Tf2N][bmim][Ac]
[emim][TFA]
[phamim][Tf2N]
Pem
eanc
e10
5 cm
3 [STP
] cm
Hg-1
cm
-2 s- 1
Carbon DioxideNitrogen
0
0.1
0.2
0.3
0.4
0.5
0.6
0.7
0.8
0 2 4 6 8 10 12 14 16 18 20 22 24
Time (hr)
P D (a
tm)
CO2_Data
CO2_ModelN2_Data
N2_Model
PCO2 = 4.6 x 10⁻⁹ mol atm-1cm-2s-1
PN2 = 2.3 x 10⁻¹⁰ mol atm-1cm-2s-1
Figure 11 pressure versus time for permeability measurements performed with carbon dioxide and nitrogen in supported ionic liquid membranes prepared using Emim Tf2N ionic liquid. Pressure versus time values are fit to equation 3 to determined the permeance value for each gas.
23
Figure 13 Ideal CO2/N2 selectivites determined from measured pure gas permeance values.
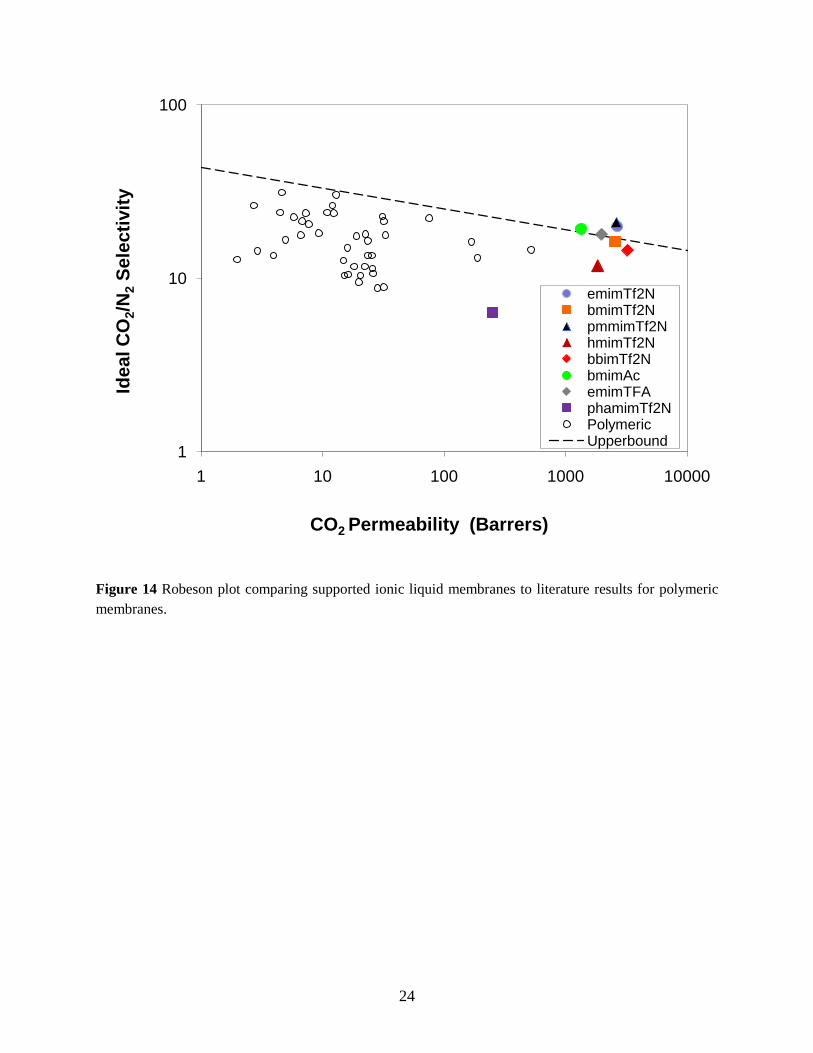
A Robeson plot illustrates the trade off between target gas selectivity and permeability, showing that generally, increases in target gas permeability come at the expense of decreases in selectivity. Results for CO2/N2 selectivity versus CO2 permeability for the supported ionic liquid systems investigated in our study are compared to literature results for polymeric systems in Figure 14. This comparison shows that the ionic liquid membranes have selectivity in the lower range of values reported for polymeric membranes, but show CO2 permeability 10 – 100 times larger. This comparison illustrates the potential of supported ionic liquid membranes for carbon capture processes.
0
5
10
15
20
25
[emim][Tf2N]
[bmim][Tf2N]
[pmmim][Tf2N]
[hmim][Tf2N]
[bbim][Tf2N][bmim][Ac]
[emim][TFA]
[phamim][Tf2N]
Idea
l CO
2/N2 S
elec
tivity
24
Figure 14 Robeson plot comparing supported ionic liquid membranes to literature results for polymeric membranes.
1
10
100
1 10 100 1000 10000
Idea
l CO
2/N2
Sele
ctiv
ity
CO2 Permeability (Barrers)
emimTf2NbmimTf2NpmmimTf2NhmimTf2NbbimTf2NbmimAcemimTFAphamimTf2NPolymericUpperbound
25
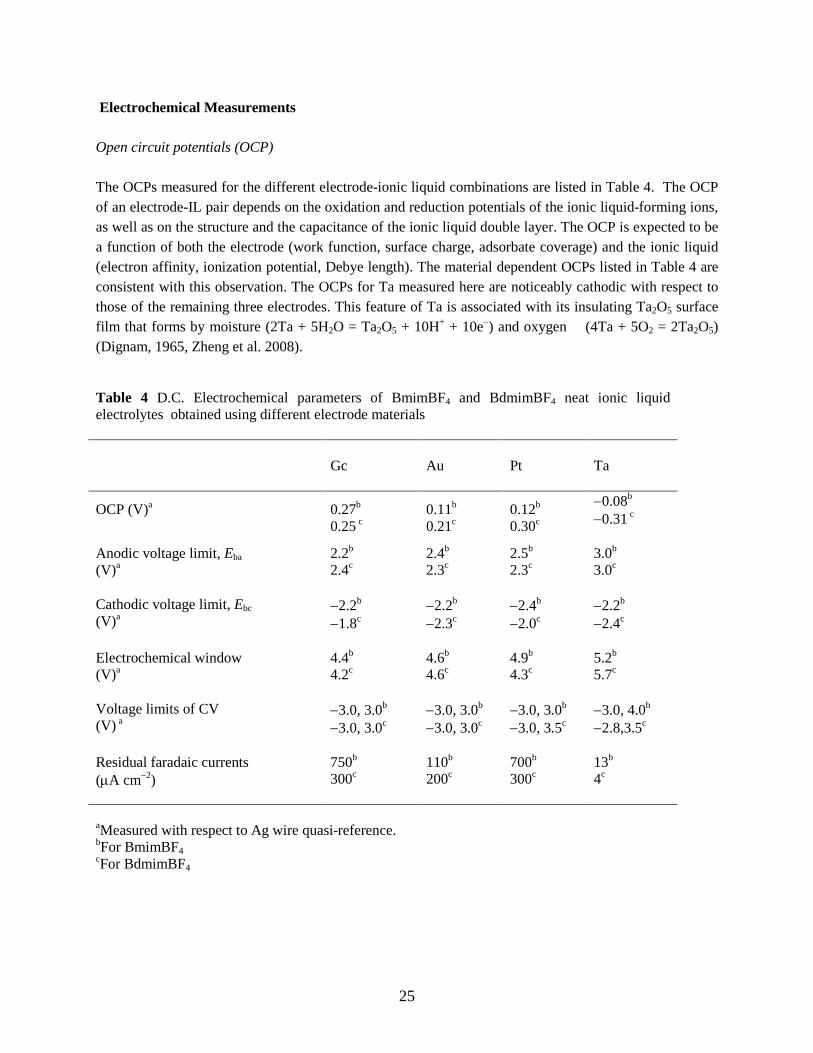
Electrochemical Measurements Open circuit potentials (OCP)
The OCPs measured for the different electrode-ionic liquid combinations are listed in Table 4. The OCP of an electrode-IL pair depends on the oxidation and reduction potentials of the ionic liquid-forming ions, as well as on the structure and the capacitance of the ionic liquid double layer. The OCP is expected to be a function of both the electrode (work function, surface charge, adsorbate coverage) and the ionic liquid (electron affinity, ionization potential, Debye length). The material dependent OCPs listed in Table 4 are consistent with this observation. The OCPs for Ta measured here are noticeably cathodic with respect to those of the remaining three electrodes. This feature of Ta is associated with its insulating Ta2O5 surface film that forms by moisture (2Ta + 5H2O = Ta2O5 + 10H+ + 10e−) and oxygen (4Ta + 5O2 = 2Ta2O5) (Dignam, 1965, Zheng et al. 2008).
Table 4 D.C. Electrochemical parameters of BmimBF4 and BdmimBF4 neat ionic liquid electrolytes obtained using different electrode materials
Gc Au Pt Ta
OCP (V)a
0.27b
0.25 c 0.11b
0.21c 0.12b
0.30c
−0.08b
−0.31 c
Anodic voltage limit, Eba (V)a
2.2b 2.4c
2.4b 2.3c
2.5b 2.3c
3.0b 3.0c
Cathodic voltage limit, Ebc (V)a
−2.2b −1.8c
−2.2b −2.3c
−2.4b −2.0c
−2.2b −2.4c
Electrochemical window (V)a
4.4b 4.2c
4.6b 4.6c
4.9b 4.3c
5.2b 5.7c
Voltage limits of CV (V) a
−3.0, 3.0b −3.0, 3.0c
−3.0, 3.0b −3.0, 3.0c
−3.0, 3.0b −3.0, 3.5c
−3.0, 4.0b −2.8,3.5c
Residual faradaic currents (µA cm−2)
750b 300c
110b 200c
700b 300c
13b 4c
aMeasured with respect to Ag wire quasi-reference. bFor BmimBF4 cFor BdmimBF4
26
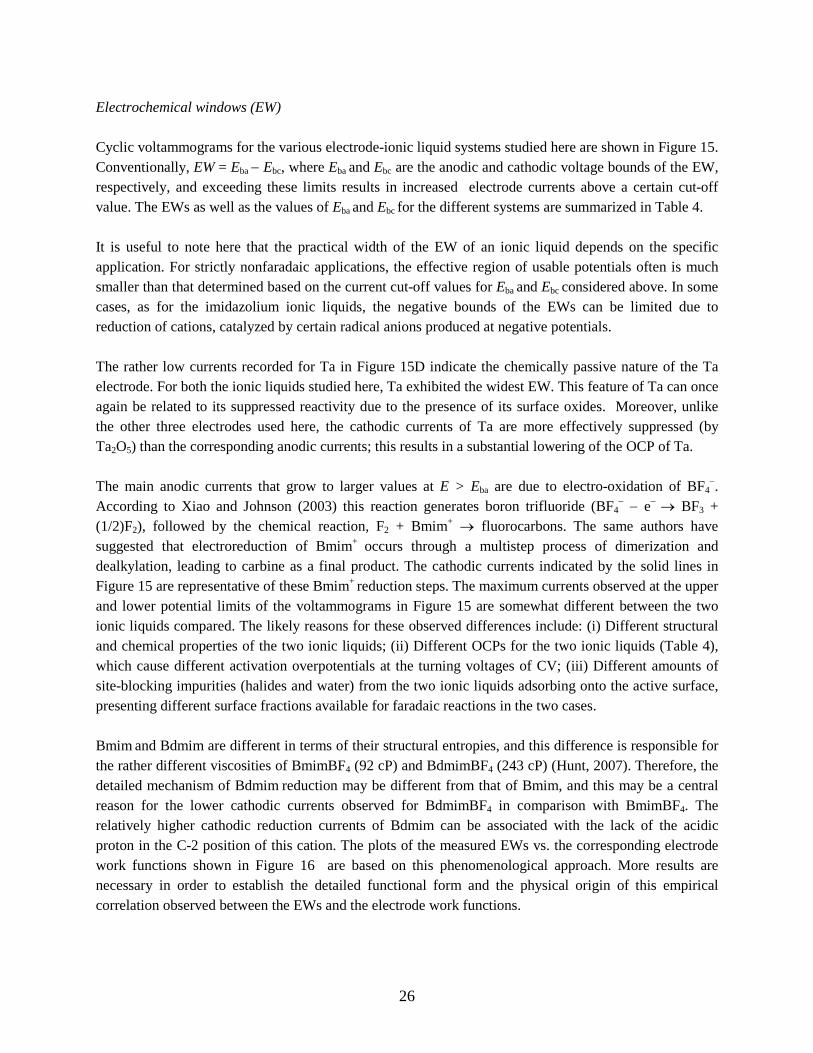
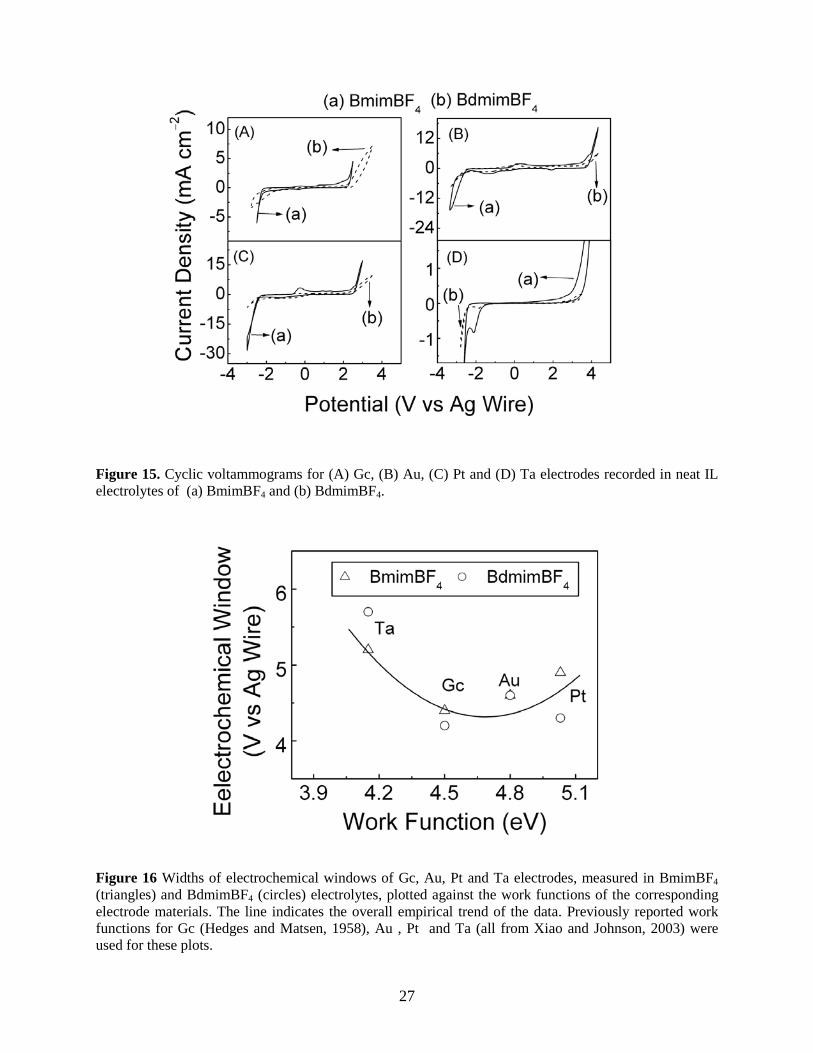
Electrochemical windows (EW)
Cyclic voltammograms for the various electrode-ionic liquid systems studied here are shown in Figure 15. Conventionally, EW = Eba − Ebc, where Eba and Ebc are the anodic and cathodic voltage bounds of the EW, respectively, and exceeding these limits results in increased electrode currents above a certain cut-off value. The EWs as well as the values of Eba and Ebc for the different systems are summarized in Table 4. It is useful to note here that the practical width of the EW of an ionic liquid depends on the specific application. For strictly nonfaradaic applications, the effective region of usable potentials often is much smaller than that determined based on the current cut-off values for Eba and Ebc considered above. In some cases, as for the imidazolium ionic liquids, the negative bounds of the EWs can be limited due to reduction of cations, catalyzed by certain radical anions produced at negative potentials. The rather low currents recorded for Ta in Figure 15D indicate the chemically passive nature of the Ta electrode. For both the ionic liquids studied here, Ta exhibited the widest EW. This feature of Ta can once again be related to its suppressed reactivity due to the presence of its surface oxides. Moreover, unlike the other three electrodes used here, the cathodic currents of Ta are more effectively suppressed (by Ta2O5) than the corresponding anodic currents; this results in a substantial lowering of the OCP of Ta. The main anodic currents that grow to larger values at E > Eba are due to electro-oxidation of BF4
−. According to Xiao and Johnson (2003) this reaction generates boron trifluoride (BF4
− − e− → BF3 + (1/2)F2), followed by the chemical reaction, F2 + Bmim+ → fluorocarbons. The same authors have suggested that electroreduction of Bmim+ occurs through a multistep process of dimerization and dealkylation, leading to carbine as a final product. The cathodic currents indicated by the solid lines in Figure 15 are representative of these Bmim+ reduction steps. The maximum currents observed at the upper and lower potential limits of the voltammograms in Figure 15 are somewhat different between the two ionic liquids compared. The likely reasons for these observed differences include: (i) Different structural and chemical properties of the two ionic liquids; (ii) Different OCPs for the two ionic liquids (Table 4), which cause different activation overpotentials at the turning voltages of CV; (iii) Different amounts of site-blocking impurities (halides and water) from the two ionic liquids adsorbing onto the active surface, presenting different surface fractions available for faradaic reactions in the two cases. Bmim and Bdmim are different in terms of their structural entropies, and this difference is responsible for the rather different viscosities of BmimBF4 (92 cP) and BdmimBF4 (243 cP) (Hunt, 2007). Therefore, the detailed mechanism of Bdmim reduction may be different from that of Bmim, and this may be a central reason for the lower cathodic currents observed for BdmimBF4 in comparison with BmimBF4. The relatively higher cathodic reduction currents of Bdmim can be associated with the lack of the acidic proton in the C-2 position of this cation. The plots of the measured EWs vs. the corresponding electrode work functions shown in Figure 16 are based on this phenomenological approach. More results are necessary in order to establish the detailed functional form and the physical origin of this empirical correlation observed between the EWs and the electrode work functions.
27
Figure 15. Cyclic voltammograms for (A) Gc, (B) Au, (C) Pt and (D) Ta electrodes recorded in neat IL electrolytes of (a) BmimBF4 and (b) BdmimBF4. Figure 16 Widths of electrochemical windows of Gc, Au, Pt and Ta electrodes, measured in BmimBF4 (triangles) and BdmimBF4 (circles) electrolytes, plotted against the work functions of the corresponding electrode materials. The line indicates the overall empirical trend of the data. Previously reported work functions for Gc (Hedges and Matsen, 1958), Au , Pt and Ta (all from Xiao and Johnson, 2003) were used for these plots.
28
Electrochemical impedance spectra (EIS) and electrode-equivalent circuit parameters Figure 17 shows electrode dependent Nyquist plots for (A) BmimBF4 and (B) BdmimBF4, recorded at the respective OCPs of the different systems. Z′ and Z′′ are the real and imaginary parts of the total electrode impedance Z, respectively. The symbols and the lines denote experimental data and non-linear fits to the data using the equivalent electrode circuit shown in Figure 17C. Here, Re is the electrolyte resistance, and Rct is the charge transfer resistance that provides the D.C. current paths for electrolyte decomposition outside the EW. The constant phase element (CPE), Qdl, represents the frequency-dispersed version of the double layer capacitance (Cdl) and originates from the spatial inhomogeneity of the electrode interface. Uneven packing of the large, asymmetric cations of the ionic liquid in the double layer contributes to these interfacial inhomogeneities. The impedance of Qdl has the form [30]: 1n 1
dl 1( ) [ ( ) ]Z Q Y jω −= , where Y1 is a
frequency independent term, and 0≤ n1 ≤1; ω is the A.C. angular frequency of EIS, and j = 1− . Since Z(Qdl) is inversely proportional to 1n( )ω , the CPE impedance dominates the low-frequency spectrum. The Qad-Rad branch in Fig. 17C blocks D.C. faradaic currents, as its impedance becomes infinite in the D.C. limit. This branch can be attributed to a nonfaradaic adsorption step that occurs in parallel with the faradaic reactions in the ionic liquid. A likely candidate for this nonfaradaic step is the adsorption of impurities, such as halide ions from the ionic liquids, onto the electrode surfaces. Due to their relatively small size, the adsorption geometry, and hence the degree of chemisorption for these impurity ions is likely to be more favored than the constituent ions of the ionic liquid. The complex impedance, ad( )Z Q ,
of the adsorption-CPE can be written in the same form of Z(Qdl) merely by replacing Y1 and n1 with Y2 and n2, for the adsorption reaction, respectively. In the absence of faradaic (Rct = ∞) and adsorption (Rad = ∞) steps, the site averaged time constant (τav) of the spatially inhomogeneous electrode can phenomenologically be assumed as: 11/ n
av e 1( )R Yτ ≈ . This avτtakes the familiar form of the time constant of homogeneous electrodes when n1 = 1 and Y1 = Cdl. An order of magnitude estimate for the residual faradaic currents (jres) observed in Figure 15 within the EWs can be empirically described as: res av e| | | | | ( / ) |j j v Rτ≈ − . Here, v is the voltage scan rate of CV; the site-averaged double layer capacitance and current are assumed to be on the orders of av e( / )Rτ and av e( / )v Rτ , respectively. The last row in Table 4 presents the voltage-averaged estimates for resj within the EWs,
obtained by using EIS-measured Re and Ydl in the above expression. Considering that the faradaic charge necessary to modify a full monolayer is only ~200-250 µC cm−2 (for typical one-electron transfer reactions), the residual currents listed in Table 4 are not negligible. Depending on how long they flow through the electrode interface, these currents can cumulatively modify the detailed properties of the latter. This reinforces the earlier mentioned reason why low-frequency EIS (necessary to detect the CPE elements) for such lingering faradaic systems should be performed at OCPs.
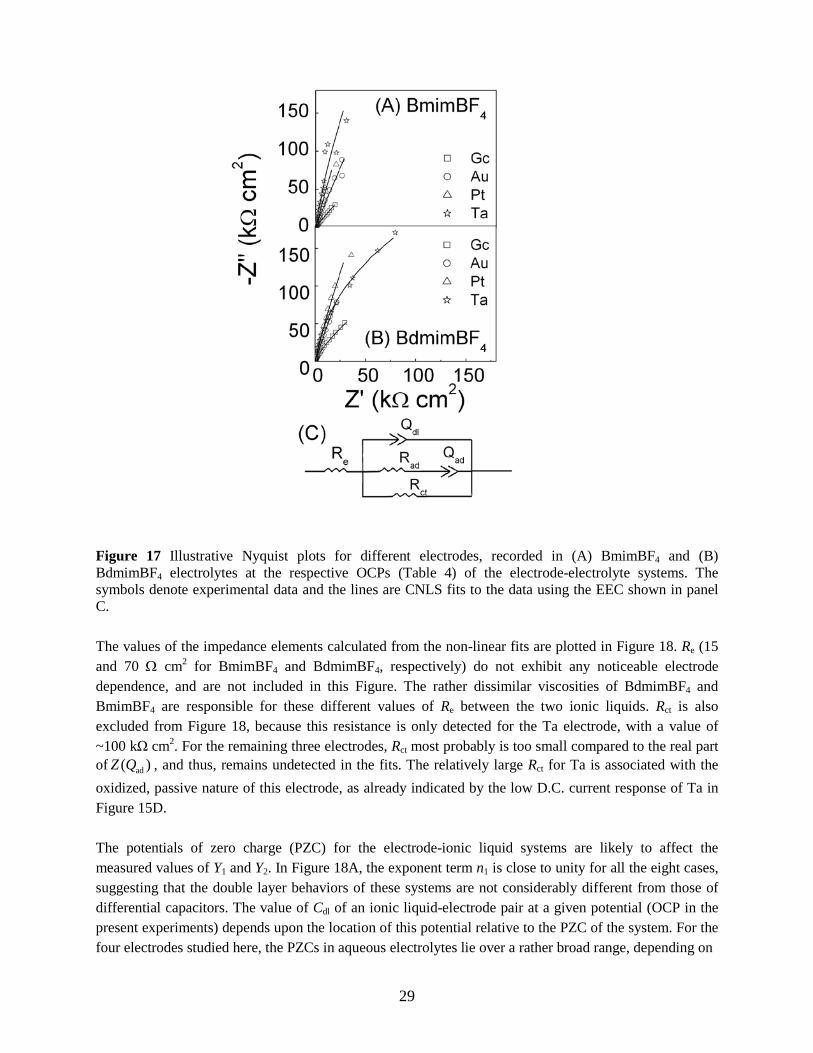
29
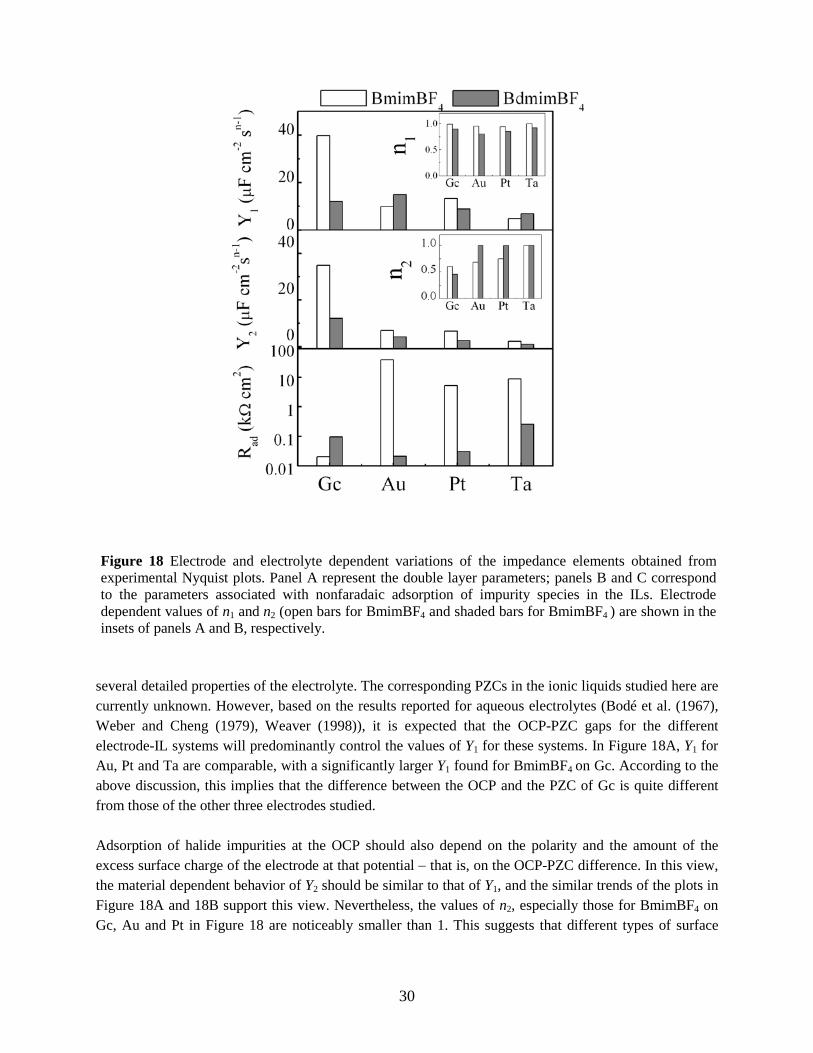
Figure 17 Illustrative Nyquist plots for different electrodes, recorded in (A) BmimBF4 and (B) BdmimBF4 electrolytes at the respective OCPs (Table 4) of the electrode-electrolyte systems. The symbols denote experimental data and the lines are CNLS fits to the data using the EEC shown in panel C. The values of the impedance elements calculated from the non-linear fits are plotted in Figure 18. Re (15 and 70 Ω cm2 for BmimBF4 and BdmimBF4, respectively) do not exhibit any noticeable electrode dependence, and are not included in this Figure. The rather dissimilar viscosities of BdmimBF4 and BmimBF4 are responsible for these different values of Re between the two ionic liquids. Rct is also excluded from Figure 18, because this resistance is only detected for the Ta electrode, with a value of ~100 kΩ cm2. For the remaining three electrodes, Rct most probably is too small compared to the real part of ad( )Z Q , and thus, remains undetected in the fits. The relatively large Rct for Ta is associated with the oxidized, passive nature of this electrode, as already indicated by the low D.C. current response of Ta in Figure 15D. The potentials of zero charge (PZC) for the electrode-ionic liquid systems are likely to affect the measured values of Y1 and Y2. In Figure 18A, the exponent term n1 is close to unity for all the eight cases, suggesting that the double layer behaviors of these systems are not considerably different from those of differential capacitors. The value of Cdl of an ionic liquid-electrode pair at a given potential (OCP in the present experiments) depends upon the location of this potential relative to the PZC of the system. For the four electrodes studied here, the PZCs in aqueous electrolytes lie over a rather broad range, depending on
30
several detailed properties of the electrolyte. The corresponding PZCs in the ionic liquids studied here are currently unknown. However, based on the results reported for aqueous electrolytes (Bodé et al. (1967), Weber and Cheng (1979), Weaver (1998)), it is expected that the OCP-PZC gaps for the different electrode-IL systems will predominantly control the values of Y1 for these systems. In Figure 18A, Y1 for Au, Pt and Ta are comparable, with a significantly larger Y1 found for BmimBF4 on Gc. According to the above discussion, this implies that the difference between the OCP and the PZC of Gc is quite different from those of the other three electrodes studied. Adsorption of halide impurities at the OCP should also depend on the polarity and the amount of the excess surface charge of the electrode at that potential − that is, on the OCP-PZC difference. In this view, the material dependent behavior of Y2 should be similar to that of Y1, and the similar trends of the plots in Figure 18A and 18B support this view. Nevertheless, the values of n2, especially those for BmimBF4 on Gc, Au and Pt in Figure 18 are noticeably smaller than 1. This suggests that different types of surface
Figure 18 Electrode and electrolyte dependent variations of the impedance elements obtained from experimental Nyquist plots. Panel A represent the double layer parameters; panels B and C correspond to the parameters associated with nonfaradaic adsorption of impurity species in the ILs. Electrode dependent values of n1 and n2 (open bars for BmimBF4 and shaded bars for BmimBF4 ) are shown in the insets of panels A and B, respectively.
31
sites (defects, steps, grain boundaries) probably are associated with the adsorption step represented by Qad in these cases. In Figure 18C, the values of the adsorption resistance Rad for Au, Pt and Ta measured in BdmimBF4 are smaller than their corresponding values in BmimBF4. According to this observation, the impurities from BmimBF4 adsorb on these electrodes more efficiently than those from BdmimBF4. These impurity adsorbates seem to restrict the surface sites available for electro-oxidation of BF4
− in a preferential manner, because the anodic currents of BF4
− oxidation for Au, Pt and Ta in Figure 15B-D are smaller in BdmimBF4 as compared to their counterparts in BmimBF4. The electrolyte dependent trend of Rad for Gc in Figure 18C is opposite of that observed for Au, Pt and Ta. Consistent with this observation and the above-described mechanism of impurity-induced site blocking, the anodic current of BF4
− oxidation for Gc in Figure 15A in BdmimBF4 is larger than that in BmimBF4. References Akgerman, A., and Gainer, J. L. "Predicting gas-liquid diffusivities " J. Chem. Eng. Data , 1972, 17, 372-
377. Bodé, D.D., Jr., Andersen, T.N. and Eyring,, H. “Anion and pH Effects on the Potentials of Zero Charge
of Gold and Silver Electrodes”, J. Phys. Chem., 1967, 71, 792. Bonhote, P., Dias, A. P., Papgeorgiou, N., Kalyanasundaram, K., Gratzel, M. “Hydrophobic, highly
conductive ambient temperature molten salts” Inorg Chem 1996, 35, 1168-1178. Camper, D., Becker, C., Koval, C., and Noble, R.. "Diffusion and solubility measurements in
room temperature ionic liquids " Ind. Eng. Chem. Res., 2006, 45, 445-450. Chen, B. H. C.; Chen, S. H., Diffusion of slightly soluble gases in liquids: measurement and correlation
with implications on liquid structures. Chem. Eng. Sci. 1985, 40, 1735-1741. Crosthwaite, J. M.; Muldoon, M. J.; Dixon, J. K.; Anderson, J. L.; Brennecke, J. F., Phase transition and
decomposition temperatures, heat capacities and viscosities of pyridinium ionic liquids. Journal of Chemical Thermodynamics 2005, 37, (6), 559-568.
Dignam, M.J., “Conduction Properties of Valve Metal-Oxide Systems”, J. Electrochem. Soc., 1965, 112. 722-729.
Dim, A., Gardner, G. R., Ponter, A. B., and Wood, T. "Diffusion of carbon dioxide into primary alcohols and methyl cellulose ether solutions." J. Chem. Eng. Japan , 1971, 4(1), 92-95.
Hedges, M., and Matsen, F.A., J. Chem. Phys. , 1958, 28 , 950. Hunt, P.A., J. Phys. Chem. B “ Why Does a Reduction in Hydrogen Bonding Lead to an Increase in
Viscosity for the 1-Butyl-2,3-dimethyl-imidazolium-Based Ionic Liquids?”, 2007, 111, 4844. Jacquemin, J.; Husson, P.; Padua, A. A. H.; Majer, V., Density and viscosity of several pure and water-
saturated ionic liquids. Green Chemistry 2006, 8, (2), 172-180. Kilaru, P. K., Condamarian, R. A., and Scovazzo, P. "Correlations of low pressure carbon dioxide and
hydrocarbon solubilities in imidazolium, phoponium, and ammonium based room temperature ionic liquids. Part 1. Using surface tension." Ind. Eng. Chem. Res., 2008, 47, 900-909.
McManamey, W. J., and Woollen, J. M. "The diffusivity of carbon dioxide in some organic liquids at 25o and 50oC." AIChE. J. , 1973, 19, 667-669.
32
Morgan, D., Ferguson, L., and Scovazzo, P. (2005). "Diffusivities of gases in room temperature ionic liquids: Data and correlations obtained using a lag time technique." Ind. Eng. Chem. Res., 2005, 44, 4815-4823.
Shiflett, M. B.; Harmer, M. A.; Junk, C. P.; Yokozeki, A., Solubility and diffusivity of difluoromethane in room-temperature ionic liquids. Journal of Chemical and Engineering Data 2006, 51, (2), 483-495.
Tokuda, H.; Ishii, K.; Susan, M. A. B. H.; Tsuzuki, S.; Hayamizu, K.; Watanabe, M., “Physicochemical properties and structures of room-temperature ionic liquids. 3. Variation of cationic structures” Journal of Physical Chemistry B 2006, 110, (6), 2833-2839.
Weaver, M.J., “Potentials of Zero Charge for Platinum(111)-Aqueous Interfaces: A Combined Assessment from In-Situ and Ultrahigh-Vacuum Measurements,” Langmuir , 1998, 14, 3932.
Weber,J.H., and Cheng, K.H. “Nonadsorption of Fulvic Acid from Aqueous Solutions on Glassy Carbon or Wax Sealed Graphite Electrodes,” Anal. Chem. , 1979, 51, 796.
Wong, C. F., and Hayduk, W. "Correlations for prediction of molecular diffusivities in liquids at infinite dilution." Can. J. Chem. Eng. 1990, 68, 849-859.
L. Xiao, K. E. Johnson, “Electrochemistry of 1-Butyl-3-methyl-1H-imidazolium Tetrafluoroborate Ionic Liquid,” J. Electrochem. Soc. , 2003, 150, E307.
J. P. Zheng, B. K. Klug, D. Roy, “Electrochemical Investigation of Surface Reactions for Chemical Mechanical Planarization of Tantalum in Oxalic Acid Solutions,” J. Electrochem. Soc. , 2008, 155 H341.


![Ion Association in [bmim][PF6]/Naphthalene Mixtures: An … · The vast number of molecular electrolytes collectively known as room temperature ionic liquids (or ionic liquids (ILs)](https://img.pdfslide.net/doc/110x75/5f8370b51222e2087c0670f4/ion-association-in-bmimpf6naphthalene-mixtures-an-the-vast-number-of-molecular.jpg)