Embed Size (px)
Citation preview

Root Cause Analysis: Helping make the right decisions
J ER EM Y BER R I AULT, M BA

Introduction
2
Presenter QA for over 20 years Started as a UAT analyst Very passionate about QA and its impact MBA from Athabasca University
Presentation How to use metrics to make positive change Current pitfalls Getting the right information to the right people

Making decisions
“…the efficient production of the quality that the market expects.” W. Edwards Deming - was an American statistician, considered the father of the modern quality movement
3

Sound familiar?
4
Root Cause Defect count
Requirements 3
Code 15
Environment 4
Design 2
Testing 1
Decisions that can be made
Options1. Expand capacity – More staff2. Work harder – O.T.3. Keep fixing things – Releases
#2 and/or #3 – the “easy way out” and produces a vicious circle of not having time to improve, so more problems occur.
#1 is meant to be the real ‘solution’ but almost always turns into #2 and/or #3
5

Decisions that can be made
6
Same issues occur
Work Harder dealing
with issues
Back log due to timelines not
changing
Expand capacity –More staff
Future release

Rework
“…Re-work costs make up 30 to 50% of the average IT project.” Barry Boehm, Software Engineering Economics.
7
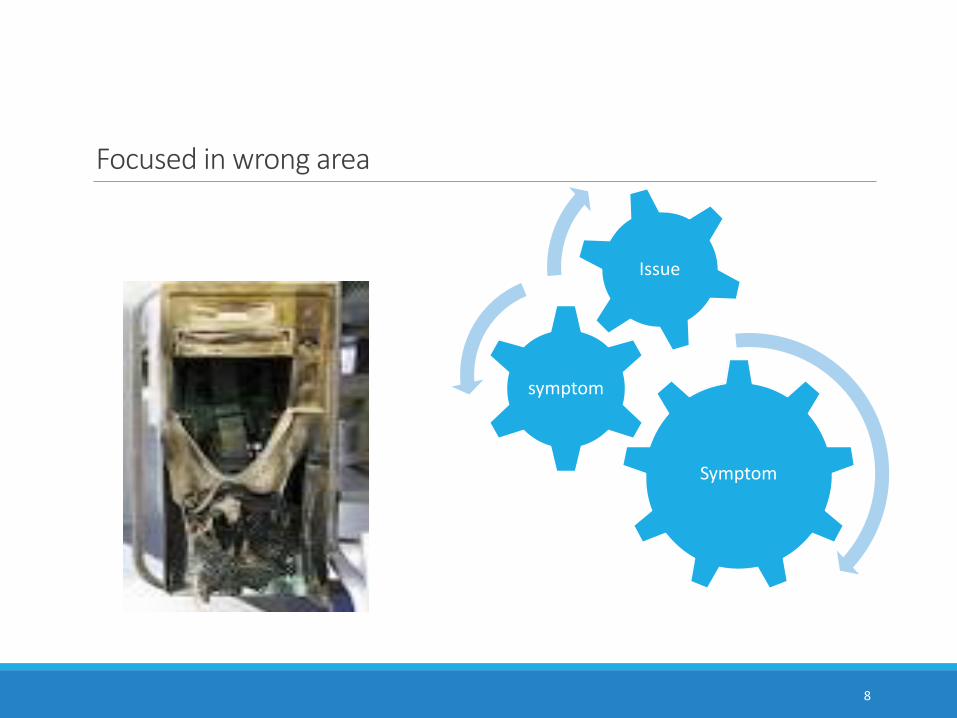
Focused in wrong area
8
Symptom
symptom
Issue

“If you don’t ask the right questions, you don’t get the right answers. Asking questions is the ABC of diagnosis. Only the inquiring mind solves problems” – Edward Hodnett, American poet
9

Provide value
10
Continuous improvement is the main activity where RCA provides value
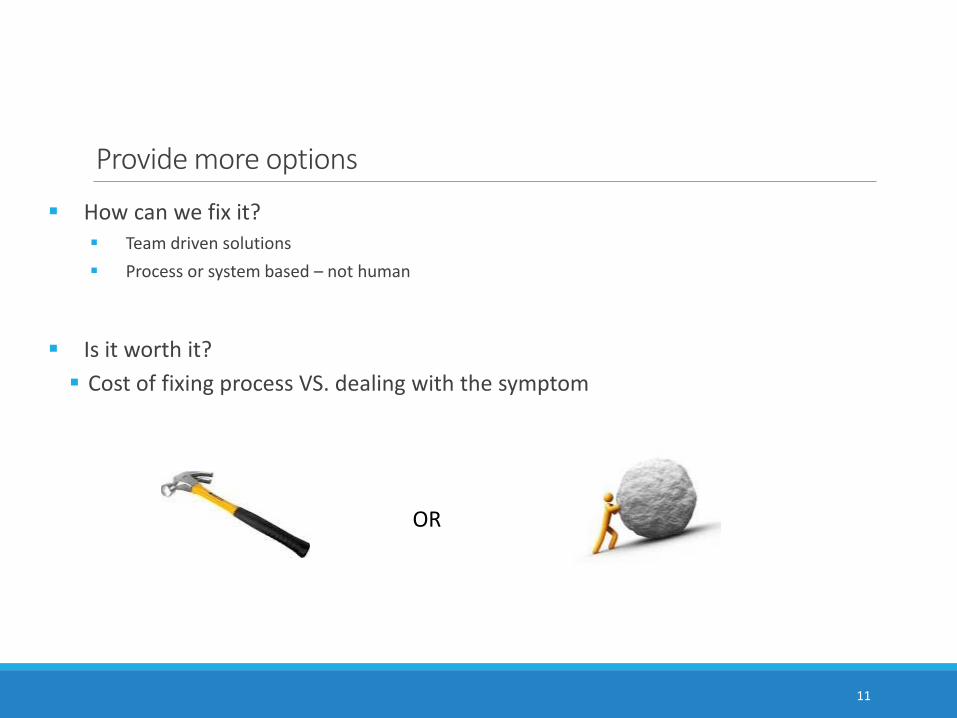
Provide more options
How can we fix it? Team driven solutions Process or system based – not human
Is it worth it? Cost of fixing process VS. dealing with the symptom
11
OR
Data, data and more data
12

What’s the story?
13
FreeDigitalPhotos.net
Where are the repeated bottlenecks
Process slow downs Where are the true slow downs Hard to find Percentage rework – Time spent
14
Numbers game
Ratios Helps determine relationships
Six Sigma Correlations Graphs Can show impacts
Regression analysis Cost benefits Average cost of defects Detailed Root Cause Tracked over time Forward thinking Potential solutions
15
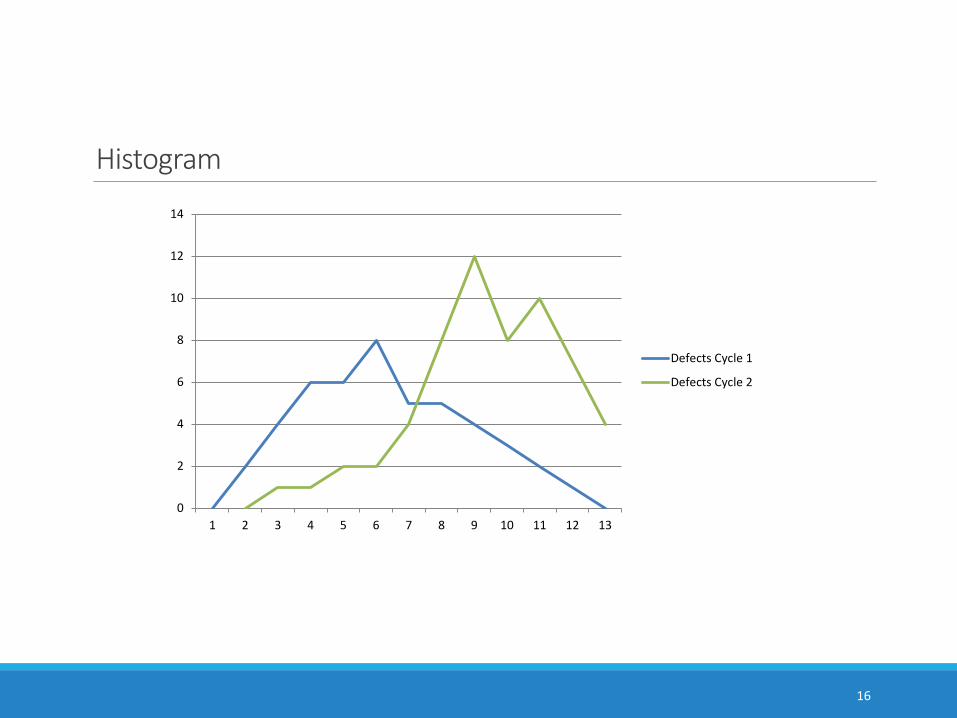
Histogram
16
0
2
4
6
8
10
12
14
1 2 3 4 5 6 7 8 9 10 11 12 13
Defects Cycle 1
Defects Cycle 2
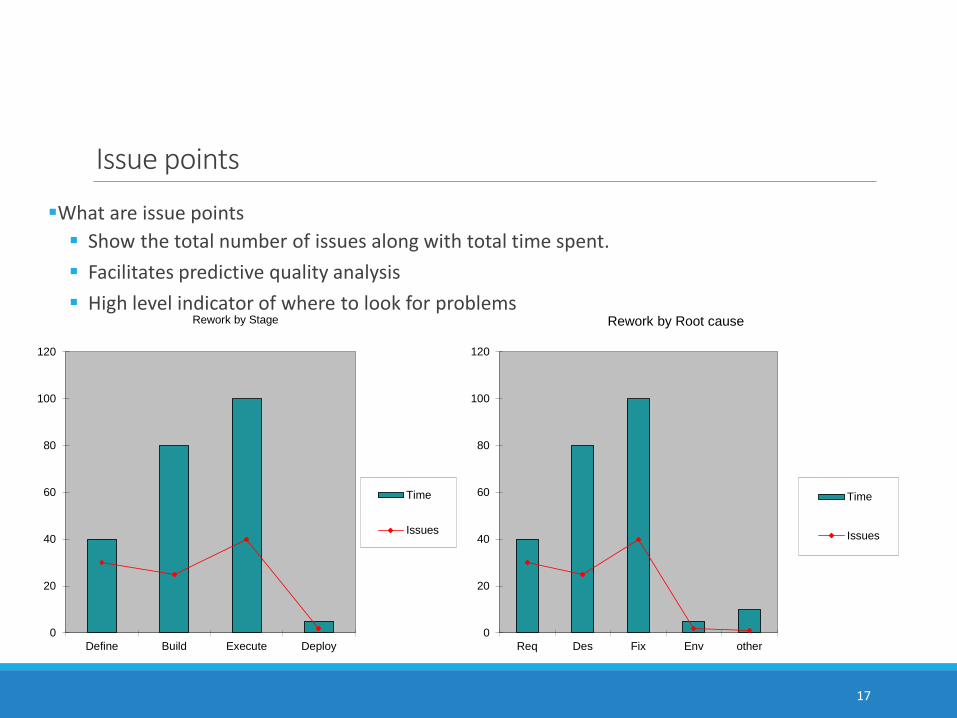
Issue points
What are issue points Show the total number of issues along with total time spent. Facilitates predictive quality analysis High level indicator of where to look for problems
17
0
20
40
60
80
100
120
Define Build Execute Deploy
Rework by Stage
Time
Issues
0
20
40
60
80
100
120
Req Des Fix Env other
Rework by Root cause
Time
Issues

Tools to use for RCA
Pareto Chart 80/20 rule Helps narrowing down repetitive issues
18
0.00%
5.00%
10.00%
15.00%
20.00%
25.00%
30.00%
35.00%
40.00%
45.00%
Requirement Compliler Context Other
Are we done?
“Great things are not done by impulse, but by a series of small things brought together.” – Vincent Van Gogh (11)
19
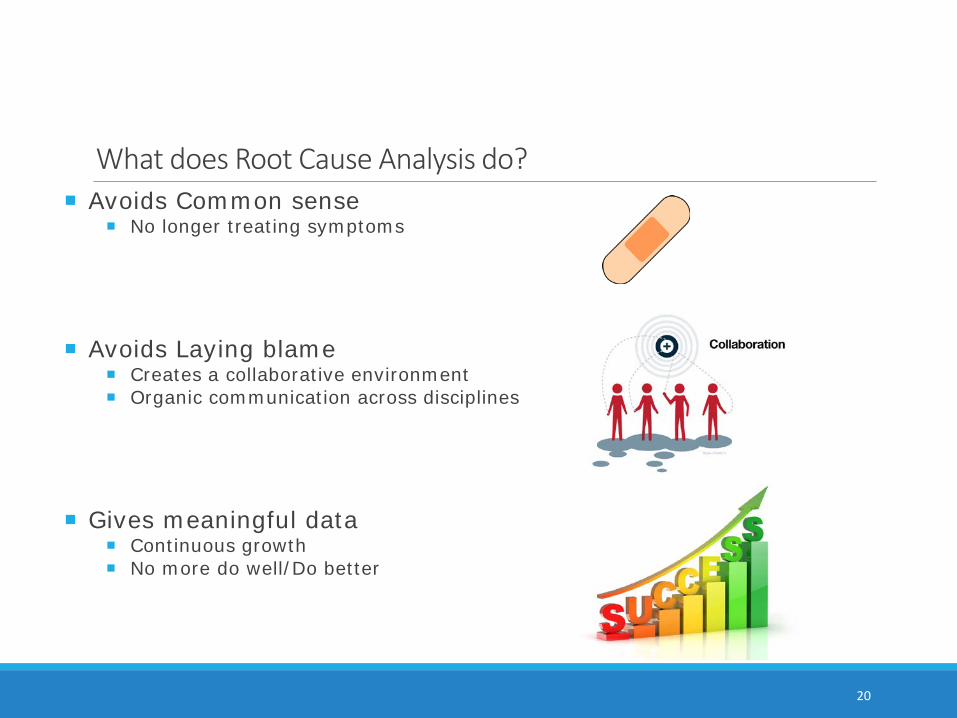
What does Root Cause Analysis do?
20
Avoids Common sense No longer treating symptoms
Avoids Laying blame Creates a collaborative environment Organic communication across disciplines
Gives meaningful data Continuous growth No more do well/Do better

What does Root Cause Analysis do?
21
Which process(es) are broken? Is there a bottleneck? Is there a miss? Are the right peripheral processes connected?
What needs fixing? System lag? Compatibility? Correct version?
Repetitive? Does it happen in most projects?

Where do we need to start?
22
Metrics, metrics, metrics Must use the right metrics to tell the right story
Must be confident

What else do we need?
23
Open lines of communication with all stakeholders
Keep it going
Information overload
24

Questions
25