Embed Size (px)
Citation preview

Root Cause Assessment –Fractured Girder Flanges
Transbay (Salesforce) Transit Center, San FranciscoTJPA BoardDecember 13, 2018
Prepared by:LPI, Inc.Robert S. Vecchio, Ph.D., P.E.CEO

Timeline August 12, 2018: Transbay Transit Center opens to the public
September 25, 2018: Cracks found in two girder flanges
October 1, 2018: LPI retained to perform root cause assessment of girderfractures and the removal and testing of the fractured sections
October 23 through 29, 2018: Girder samples removed by IPM underdirection of TT and LPI - samples shipped to LPI’s New York facilities
November 14-15, 2018: Joint laboratory examination at LPI with allinterested parties
December 2018: Expected completion of all metallurgical and mechanicaltesting
January 2019: Expected completion of root cause assessment
2

Fremont Street and First Street Girders
Fractured Fremont St Girder

Girder Sample Removal• Four samples
were removed from the fractured Fremont St. girders• North Girder, D.4-NE-
NW (cracked)• North Girder, D.4-SE-
SW (cracked)• South Girder, E.6-
NE-NW• South Girder, E.6-SE-
SW (cracked)
5

Girder Sample RemovalTypical Girder Sample
6
• Fremont St., south girder, E.6-SE-SW (cracked)

Girder Core Removal• Four 3-in. diameter cores removed from the girder
flanges at First Street
• NE-18• NW-18• SE-18• SW-18
7

8
Fracture Surface ExaminationFracture Origin in the Weld Access Hole of Girder Sample E.6-SW

Fracture Surface ExaminationFracture Origin in the Weld Access Hole of Girder Sample D.4-NW
9
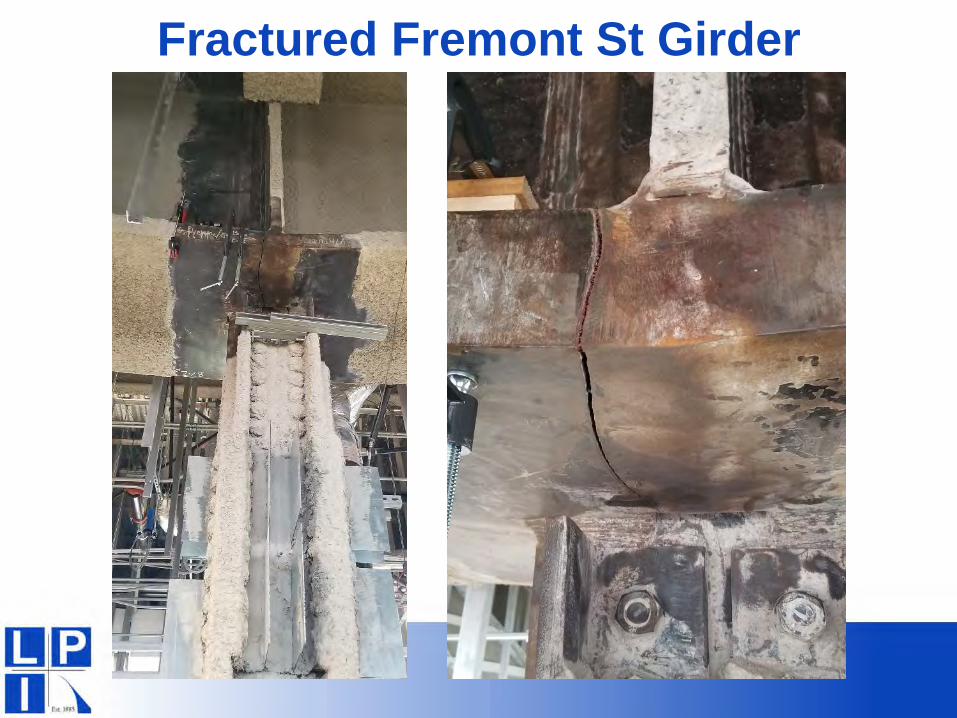
Fracture Surface ExaminationFracture Origin in the Weld Access Hole of Girder Sample D.4-SW
10

Fluorescent Magnetic Particle Testing D.4-SW exhibited secondary cracking in the radius of the weld access hole.
11

Scanning Electron Microscopy (SEM)Initiation sites for all girder fractures exhibited tenacious dark oxide (high temperature)with underlying low-energy (brittle) cleavage fracture. The remainder of the fracturesurfaces also exhibited a cleavage fracture morphology.
12

Energy Dispersive X-ray Spectroscopy (EDS)
E.6-SW: EDS of surface deposit (oxide) at the origin
ElementNumber
ElementSymbol
ElementName
AtomicConc.
WeightConc.
8 O Oxygen 74.92 48.8526 Fe Iron 20.61 46.9120 Ca Calcium 0.83 1.366 C Carbon 2.25 1.1014 Si Silicon 0.49 0.5625 Mn Manganese 0.23 0.5113 Al Aluminium 0.42 0.4712 Mg Magnesium 0.24 0.24
13

MetallographyMetallographic cross-section specimens through weld access hole radii revealed a brittlemartensitic surface layer from thermal cutting containing multiple shallow (micro) cracks.
14

Metallography
15
Metallographic cross-section specimens through weld access hole radii revealed a brittlemartensitic surface layer from thermal cutting containing multiple shallow (micro) cracks.

Surface Hardness TestingRockwell C surface hardness (HRC) measured in the radii of the thermally cut weld accessholes revealed high surface hardness.
ID D.4-NW D.4-NE D.4-SW D.4-Se E.6-NW E.6-NE E.6-SW E.6-SE
1 41 50 37 34 42 42 37 21
2 39 47 35 35 59 31 42 39
3 36 54 47 35 40 41 33 50
4 46 40 37 47 31 46 52 33
5 36 37 33 38 40 28 48 44
Average 40 46 38 38 42 38 42 37
16

Microhardness TestingVickers Microhardness measurement locations, access hole surface to center
D.4-SW E.6-SW Sample 1 E.6-SW Sample 2
Vickers Microhardness measurement Locations, Specimen Center.
17

Microhardness TestingVickers Microhardness (HV) Testing
ID D.4-SW E.6-SW Sample 1
E.6-SW Sample 2 ID D.4-SW E.6-SW
Sample 1E.6-SW
Sample 2
1 (Surface) 406 443 458 13
(Cen
ter)
176 200 179
2 413 356 400 14 183 168 197
3 306 280 392 15 164 189 178
4 235 266 250 16 149 210 185
5 260 338 278 17 167 219 187
6 280 253 220
7 235 238 203
8 189 232 212
9 216 202 201
10 215 200 220
11 220 198 215
12 (Center) 213 200 202
18
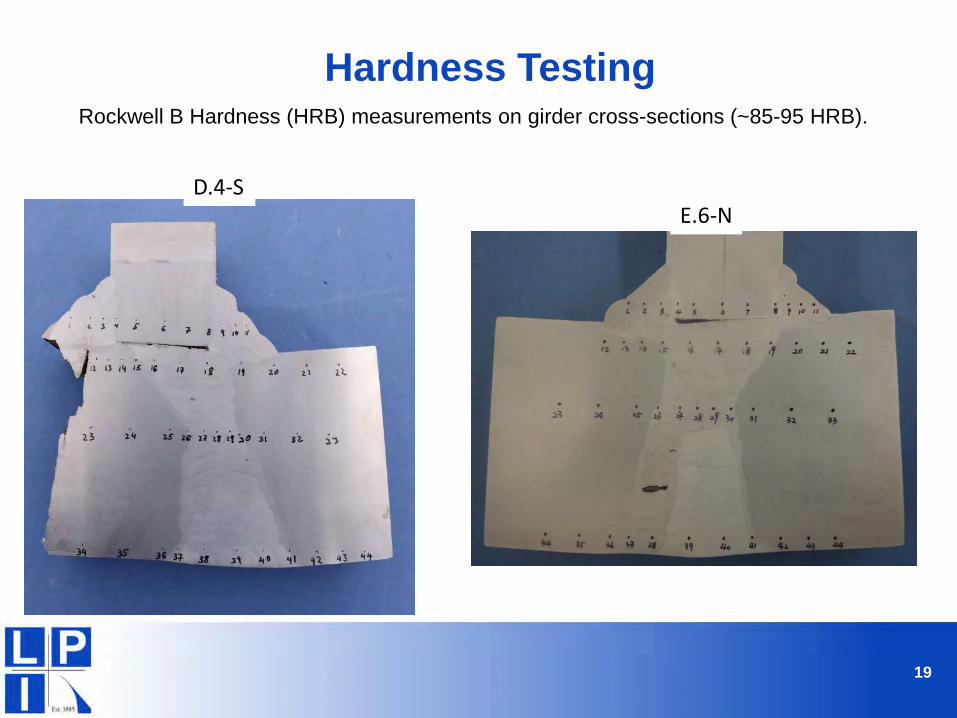
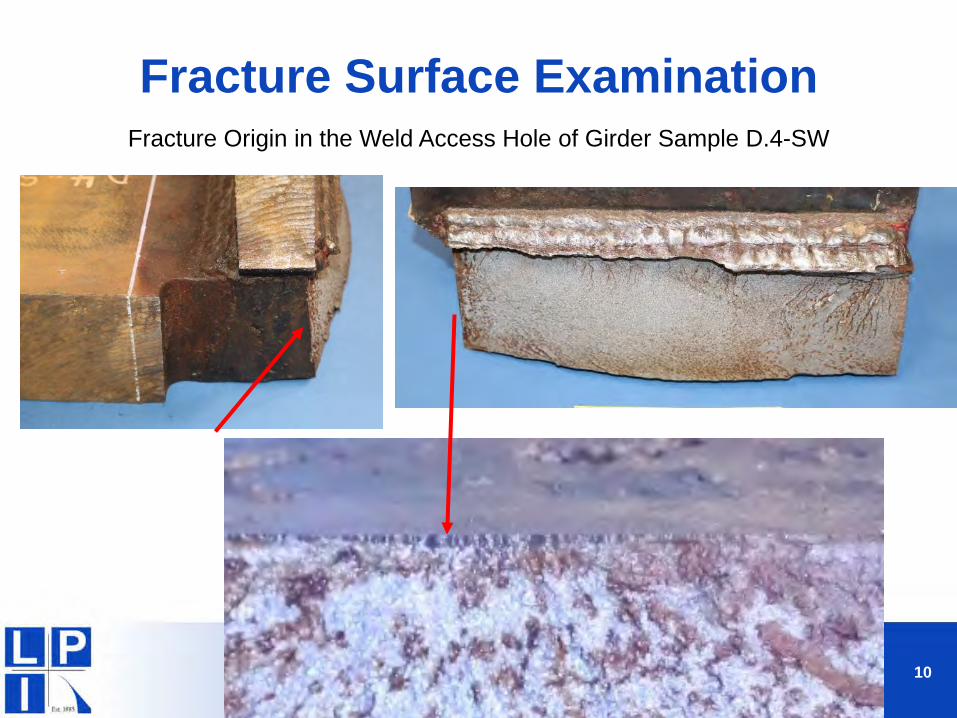
Hardness TestingRockwell B Hardness (HRB) measurements on girder cross-sections (~85-95 HRB).
D.4-SE.6-N
19

Charpy V-Notch (CVN) Impact TestingFremont Street girder sample CVN specimen removal locations and orientation.
20

Charpy V-Notch (CVN) Impact TestingFirst Street core sample CVN specimen removal locations and orientation.
.
21

CVN Results
22
0.0
10.0
20.0
30.0
40.0
50.0
60.0
70.0
80.0
90.0
100.0
-20 0 20 40 60 80 100 120
CVN
Abs
orbe
d En
ergy
(ft-
lb)
Temperature (F)
TPG3 CVN Toughness
First Street
Fremont St D.4-NE
Fremont St D.4-NW
Fremont St D.4-SW
Fremont St E.6-NW
Fremont St E.6-Sw

Tensile TestingTensile specimen locations
¼ Thickness from Top
¼ Thickness from Bottom
23

Tensile TestingCVN removal location, Specimen and Notch direction
GirderSample
ID
TensileID
TensileDirection
Tensile Location
Yield Strength,
0.2 % offset (ksi)
Ultimate Tensile
Strength (ksi)
Elongation, 2 in. gage length (%)
Reduction of Area
D.4-SW
4-3-1
Transverse
¼ Thickness From Top
61 87 25.7 55.8
4-3-2 61 87 26.6 54.8
4-1-1 ¼ Thickness From Bottom
60 87 25.0 56.1
4-1-2 60 87 27.0 57.2
E.6-SW
6-3-1 ¼ Thickness From Top
59 85 25.2 55.3
6-3-2 60 86 23.3 55.8
6-1-1 ¼ Thickness From Bottom
59 86 23.1 54.3
6-1-2 59 85 23.2 55.3
24

Global Girder Geometric Model
Fremont St. E.6 and 1st St. D.4 and E.6 lines are similar
Fremont St. D.4 line (N)
N

Mesh Overview

Mesh Detail at Weld Access Holes and Hanger Fillet Welds

Typical Access Hole Result Path

Access Hole – Max Principal Stress
0
10
20
30
40
50
60
70
80
0.0 0.2 0.4 0.6 0.8 1.0
Stre
ss (k
si)
Normalized Distance Along Path
Weld Access Holes - Max Principal Stress

Preliminary Findings• Four girder flanges were sampled (2 per girder), three of which contained full
flange width fractures.• Analyses and testing performed, to-date, suggests the probable cause of the
girder fractures at the TTC to be the formation of cracks in the girder weldaccess hole radii prior to service:
– Initially, shallow (micro) surface cracks developed during thermal cutting of theweld access holes in the highly hardened and brittle martensitic surface layer.
– Thereafter, larger pop-in cracks formed in two of the four flanges, potentiallyduring butt welding of the flange plates.
– Black, tenacious, high temperature oxide was present on both the shallowsurface cracks and the larger pop-in cracks, confirming that both crack typesformed at elevated temperatures.
– The fracture origins were located in the mid-thickness of the flange where lowfracture toughness, as confirmed by CVN toughness testing, provided littleresistance to rapid, low-energy, brittle fracture.
– CVN testing was performed on all flange samples at the top, ¼ depth, mid-thickness, ¾ depth, and bottom. ¼ depth CVN results were found to beconsistent with the project specification and girder plate mill certifications.
– Rapid, low-energy fracture of the flanges occurred as the girder was subjected toservice loading on top of the normal residual stresses due to welded fabrication.
– Further material testing and stress analyses are currently underway and will beconsidered in the final root cause assessment.
30

Thank You

Bruce Gibbons, SE
December 13, 2018
Salesforce Transit CenterGirder Repairs

Fremont St. Girders - RepairObjective: Restore the bottom flange to its original design capacity.
Grind the flame-cut surface of the web hangers to a smooth surface, and Magnetic Particle test.

Install bolted cover plates to replace flanges
Fremont St. Girders - Repair

Extent of repair is localized to the fracture area
Fremont St. Girders - Repair

Load-Shedding Analysis
1. The cracked girders with reduced section had sufficient capacity to support the building dead loads and occupancy loads.
2. The actual forces in the girders were less than calculated using normal design procedures.

Load-Shedding Analysis
3. Analyze load paths after the Fremont St girders cracked, considering:
a. Beam connection stiffness.b. Bus deck slab and roof slab stiffness.
4. Conclusions:a. Girders deflected 0.75” to 1” after cracking.b. Amount of load shed from the girder was up to 10%.c. Hanger loads reduced after cracking.d. Adjacent beams and columns were not overstressed.e. No indications of any damage, however we will test the
integrity of girder bolted connections as a precaution.
Thank You

Salesforce Transit Center -MTC Peer Review Panel (PRP)
PRP Presentation for TJPA Board of Directors – December 13, 2018Presented by: Andrew B. Fremier, Deputy Executive Director, MTC
Michael D. Engelhardt, Chair, PRP
• Background on PRP• Scope and Status of Review

Background on MTC PRP
• PRP created in response to request to MTC from San Francisco Mayor London Breed and Oakland Mayor Libby Schaaf.
• PRP membership established and PRP activities initiated on October 12.
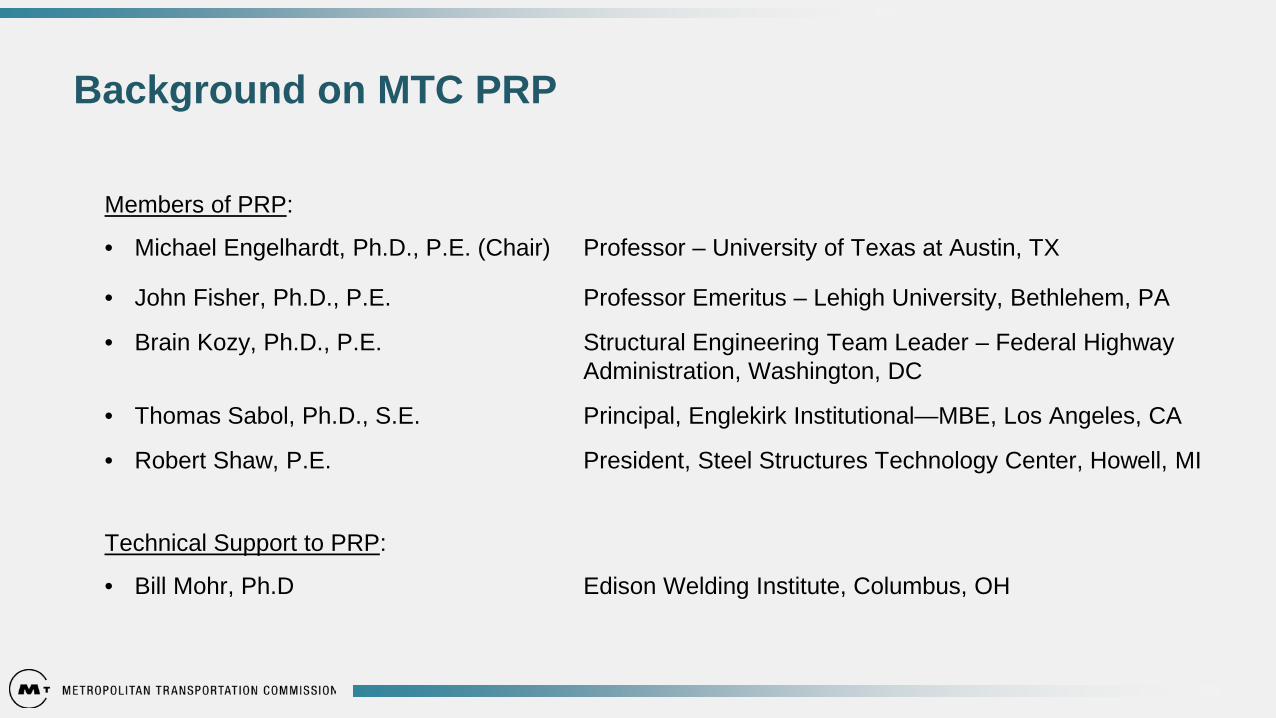
Members of PRP:
• Michael Engelhardt, Ph.D., P.E. (Chair) Professor – University of Texas at Austin, TX
• John Fisher, Ph.D., P.E. Professor Emeritus – Lehigh University, Bethlehem, PA
• Brain Kozy, Ph.D., P.E. Structural Engineering Team Leader – Federal Highway Administration, Washington, DC
• Thomas Sabol, Ph.D., S.E. Principal, Englekirk Institutional—MBE, Los Angeles, CA
• Robert Shaw, P.E. President, Steel Structures Technology Center, Howell, MI
Technical Support to PRP:
• Bill Mohr, Ph.D Edison Welding Institute, Columbus, OH
Background on MTC PRP

• PRP has strived to provide an independent, expeditious, and thorough review.
• Progress through online and in-person presentations and meetings, site-visits.
• PRP has received excellent cooperation from TJPA.
MTC PRP: Process

1. Load capacity of the temporary shoring system
2. Sampling and testing plan for the material from the fractured steel girders
3. Cause of failure, as informed by the material test results and design analysis
4. Current condition of structural elements directly affected by the steel fractures
5. Repair solution, as informed by the cause of failure and current condition
MTC PRP: Scope of Review

1. Shoring: Reviewed and concur with shoring approach.
2. Testing and Sampling Plan: Reviewed and concur.
3. Cause of Failure: General concurrence with preliminary findings; review on-going.
4. Other Impacted Locations: Review on-going.
5. Repair: General concurrence with design approach; review on-going.
MTC PRP: Status of Review