Embed Size (px)
Citation preview
ROOT Some Tips and Tricks
ROOT: http://root.cern.ch/
Steven Kornreich www.beachlook.com
Manuel Calderon de la Barca Sanchez UC Davis
STAR Analysis Meeting, 23/Aug/2011
2
Resources for ROOT ¡ ROOT Web page:
l http://root.cern.ch/
¡ User guides l http://root.cern.ch/root/doc/RootDoc.html
¡ Tutorials l $ROOTSYS/tutorials/
¡ This talk: l Use some examples from tutorials l Add some other “real world” examples
tutorials/hist/fillrandom.C
TCanvas *c1 = new TCanvas("c1","The FillRandom example",200,10,700,900); //last 4 arguments: top x-coord of window, top y-coord of window, x width, y width c1->SetFillColor(18); pad1 = new TPad("pad1","The pad with the function",0.05,0.50,0.95,0.95,21); pad2 = new TPad("pad2","The pad with the histogram",0.05,0.05,0.95,0.45,21); pad1->Draw(); pad2->Draw(); The Pad Constructor: TPad(const char* name, const char* title, Double_t xlow, Double_t ylow, Double_t xup, Double_t yup, Color_t color = -1, Short_t bordersize = -1, Short_t bordermode = -2)
3
Result of Canvas and Pad creation
4
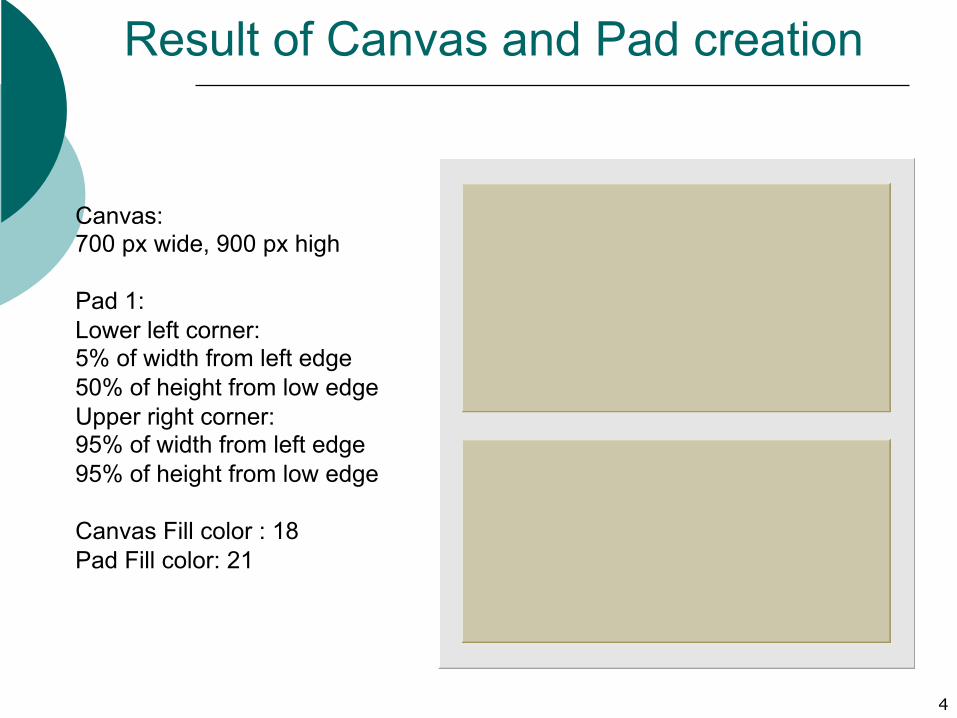
Canvas: 700 px wide, 900 px high Pad 1: Lower left corner: 5% of width from left edge 50% of height from low edge Upper right corner: 95% of width from left edge 95% of height from low edge Canvas Fill color : 18 Pad Fill color: 21
fillrandom.C : Drawing function pad1->cd(); form1 = new TFormula("form1","abs(sin(x)/x)"); sqroot = new TF1("sqroot","x*gaus(0) + [3]*form1",0,10); sqroot->SetParameters(10,4,1,20); pad1->SetGridx(); pad1->SetGridy(); pad1->GetFrame()->SetFillColor(42); pad1->GetFrame()->SetBorderMode(-1); pad1->GetFrame()->SetBorderSize(5); sqroot->SetLineColor(4); sqroot->SetLineWidth(6); sqroot->Draw(); lfunction = new TPaveLabel(5,39,9.8,46,"The sqroot function"); lfunction->SetFillColor(41); lfunction->Draw(); c1-Update(); 5
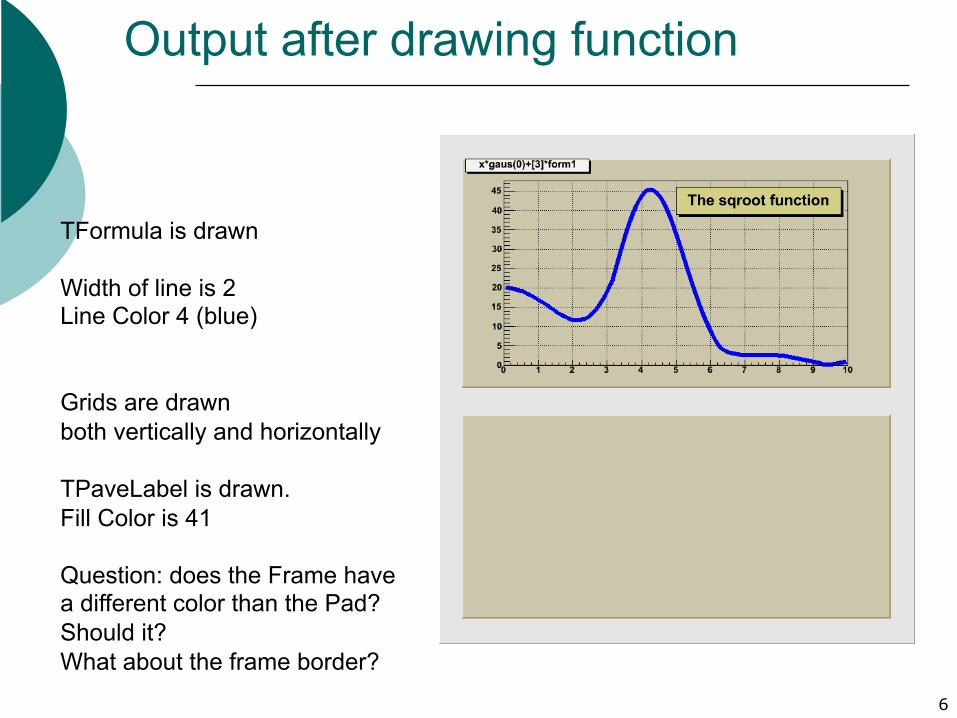
Output after drawing function
6
TFormula is drawn Width of line is 2 Line Color 4 (blue) Grids are drawn both vertically and horizontally TPaveLabel is drawn. Fill Color is 41 Question: does the Frame have a different color than the Pad? Should it? What about the frame border?
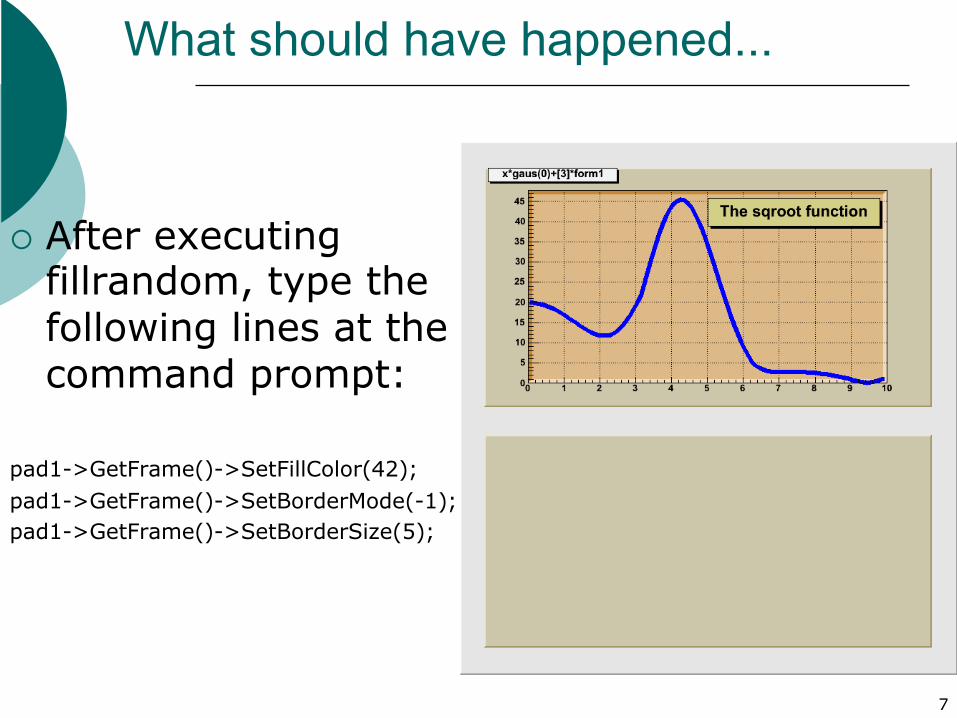
What should have happened...
¡ After executing fillrandom, type the following lines at the command prompt:
pad1->GetFrame()->SetFillColor(42); pad1->GetFrame()->SetBorderMode(-1); pad1->GetFrame()->SetBorderSize(5);
7
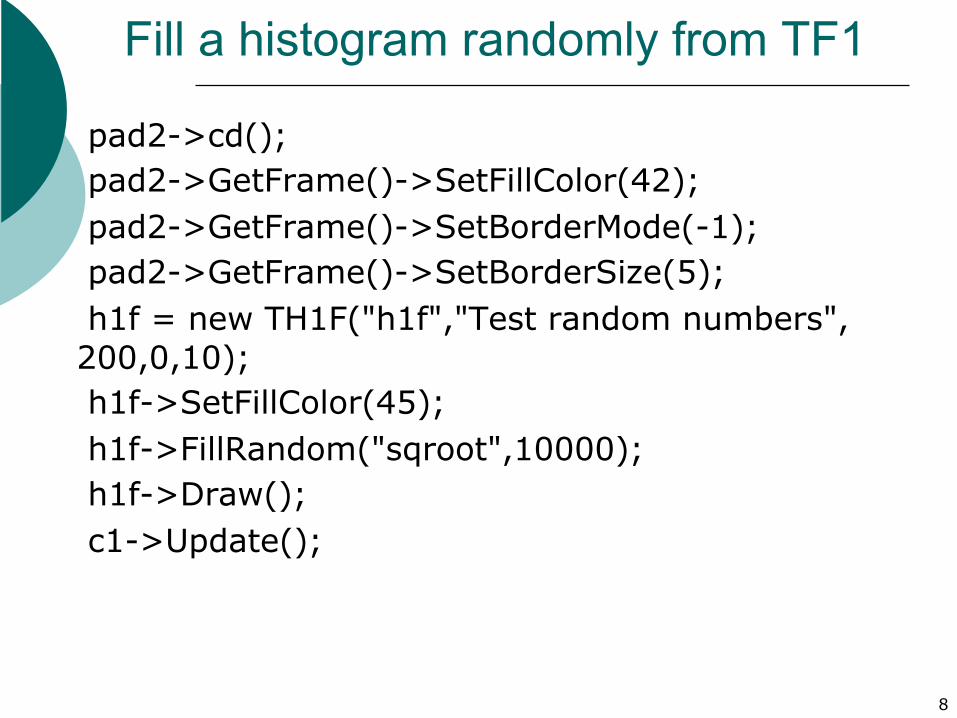
Fill a histogram randomly from TF1
pad2->cd(); pad2->GetFrame()->SetFillColor(42); pad2->GetFrame()->SetBorderMode(-1); pad2->GetFrame()->SetBorderSize(5); h1f = new TH1F("h1f","Test random numbers",200,0,10); h1f->SetFillColor(45); h1f->FillRandom("sqroot",10000); h1f->Draw(); c1->Update();
8
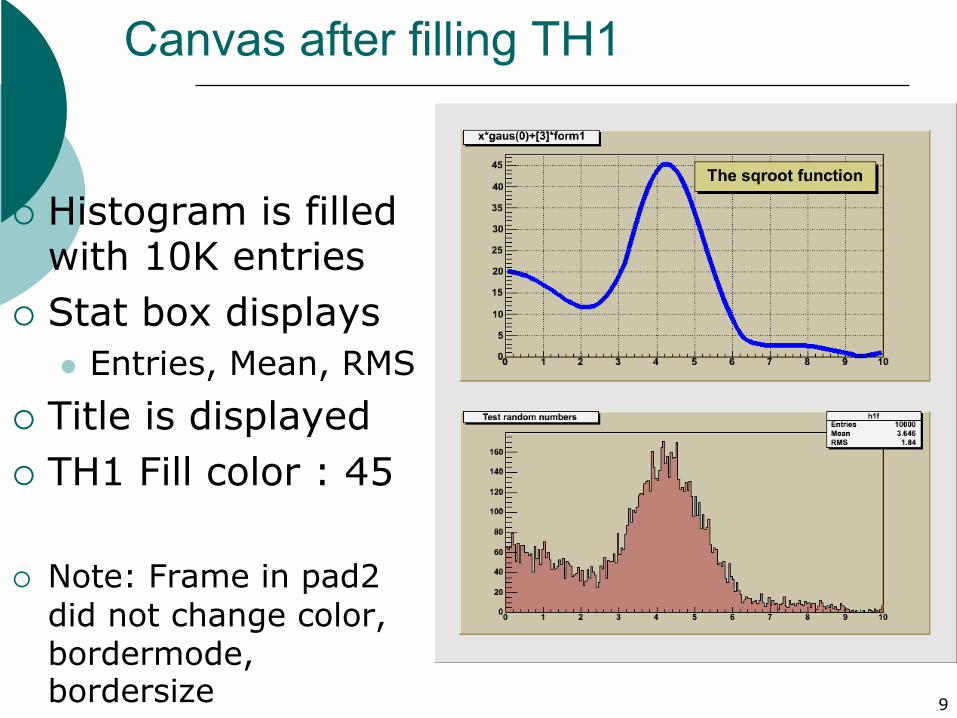
Canvas after filling TH1
¡ Histogram is filled with 10K entries
¡ Stat box displays l Entries, Mean, RMS
¡ Title is displayed ¡ TH1 Fill color : 45
¡ Note: Frame in pad2 did not change color, bordermode, bordersize 9
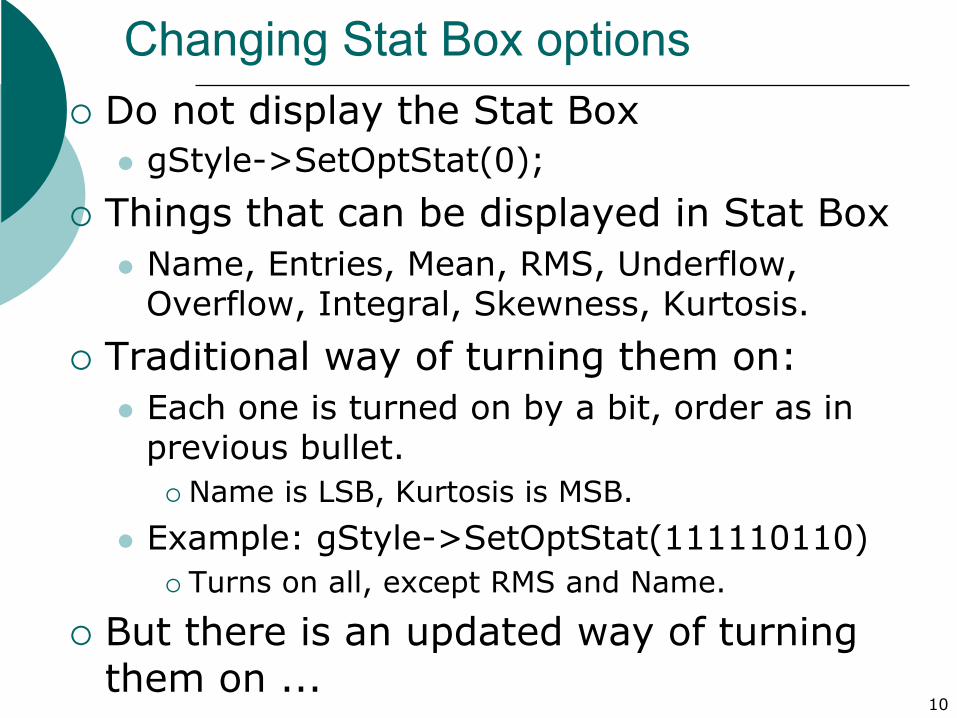
Changing Stat Box options ¡ Do not display the Stat Box
l gStyle->SetOptStat(0); ¡ Things that can be displayed in Stat Box
l Name, Entries, Mean, RMS, Underflow, Overflow, Integral, Skewness, Kurtosis.
¡ Traditional way of turning them on: l Each one is turned on by a bit, order as in
previous bullet. ¡ Name is LSB, Kurtosis is MSB.
l Example: gStyle->SetOptStat(111110110) ¡ Turns on all, except RMS and Name.
¡ But there is an updated way of turning them on ...
10
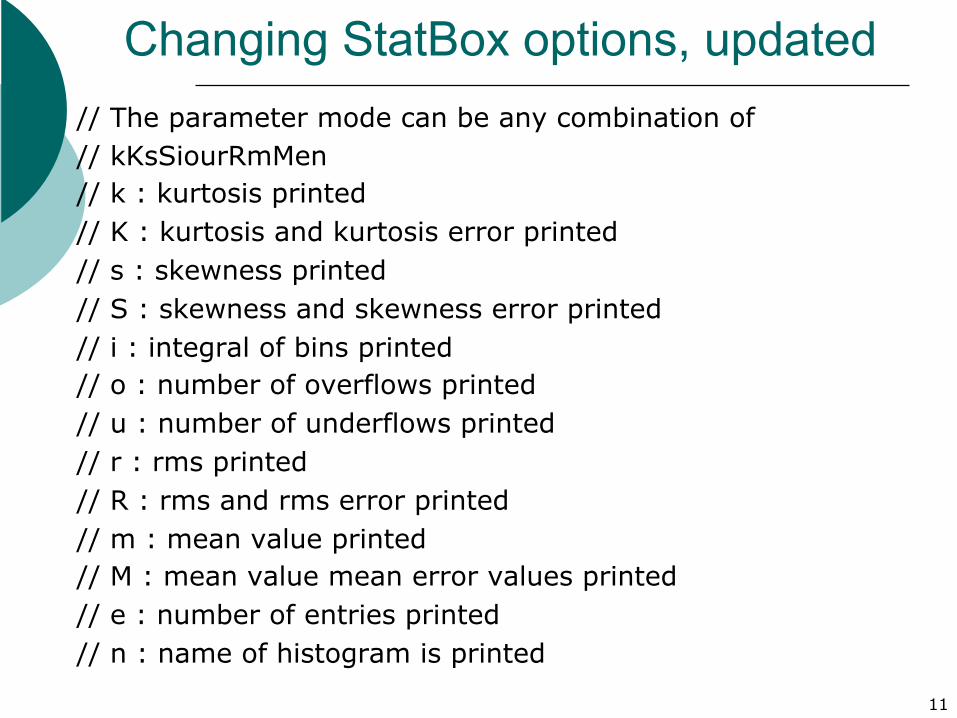
Changing StatBox options, updated // The parameter mode can be any combination of // kKsSiourRmMen // k : kurtosis printed // K : kurtosis and kurtosis error printed // s : skewness printed // S : skewness and skewness error printed // i : integral of bins printed // o : number of overflows printed // u : number of underflows printed // r : rms printed // R : rms and rms error printed // m : mean value printed // M : mean value mean error values printed // e : number of entries printed // n : name of histogram is printed
11
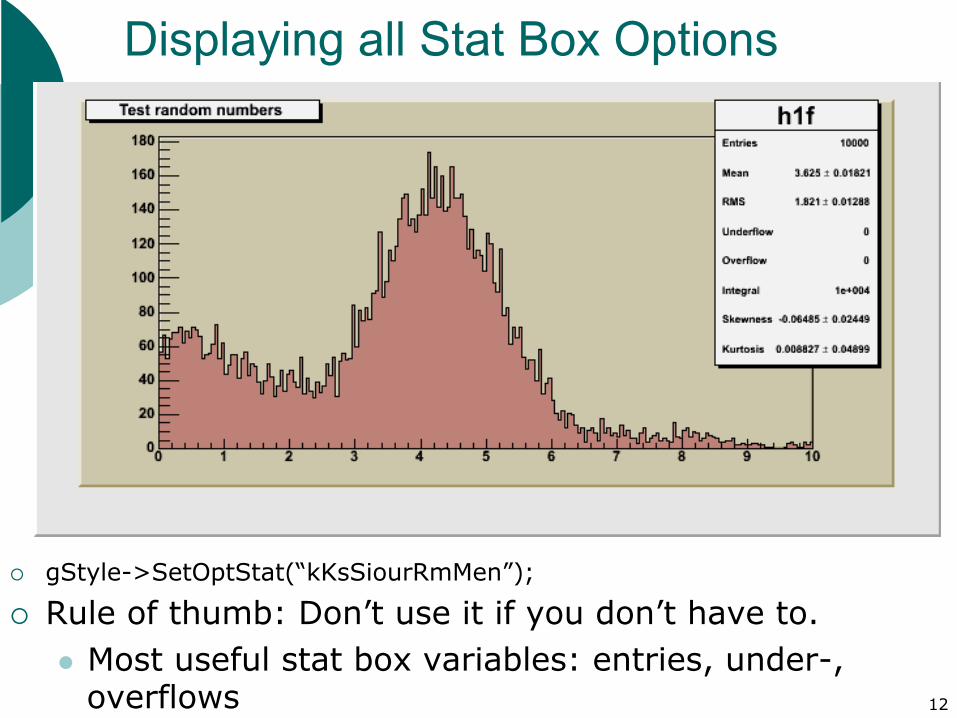
Displaying all Stat Box Options
¡ gStyle->SetOptStat(“kKsSiourRmMen”);
¡ Rule of thumb: Don’t use it if you don’t have to. l Most useful stat box variables: entries, under-,
overflows 12
Use gStyle and rootlogon.C
¡ gStyle can help you streamline your code ¡ Gives your plots a consistent look ¡ Use the rootlogon.C macro:
l There are three levels of logon macros that will be executed: the system logon etc/system.rootlogon.C, the global user logon ~/.rootlogon.C and the local ./.rootlogon.C.
l For backward compatibility also the logon macro as specified by the Rint.Logon environment setting, by default ./rootlogon.C, will be executed.
l No logon macros will be executed when the system is started with the -n option.
13
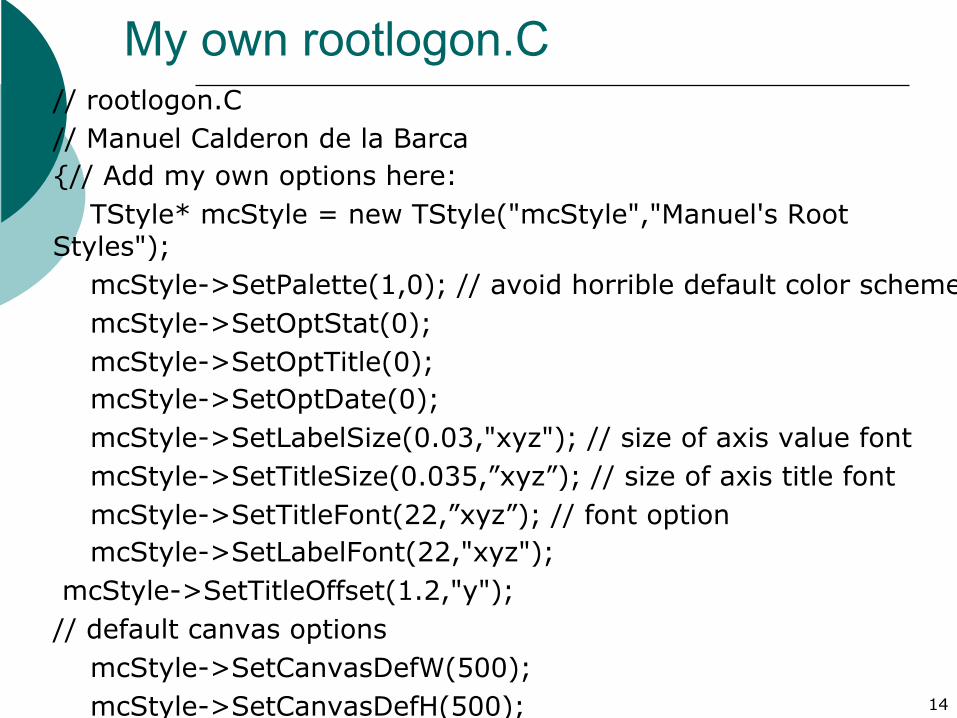
My own rootlogon.C // rootlogon.C // Manuel Calderon de la Barca {// Add my own options here: TStyle* mcStyle = new TStyle("mcStyle","Manuel's Root Styles"); mcStyle->SetPalette(1,0); // avoid horrible default color scheme mcStyle->SetOptStat(0); mcStyle->SetOptTitle(0); mcStyle->SetOptDate(0); mcStyle->SetLabelSize(0.03,"xyz"); // size of axis value font mcStyle->SetTitleSize(0.035,”xyz”); // size of axis title font mcStyle->SetTitleFont(22,”xyz”); // font option mcStyle->SetLabelFont(22,"xyz"); mcStyle->SetTitleOffset(1.2,"y"); // default canvas options mcStyle->SetCanvasDefW(500); mcStyle->SetCanvasDefH(500);
14
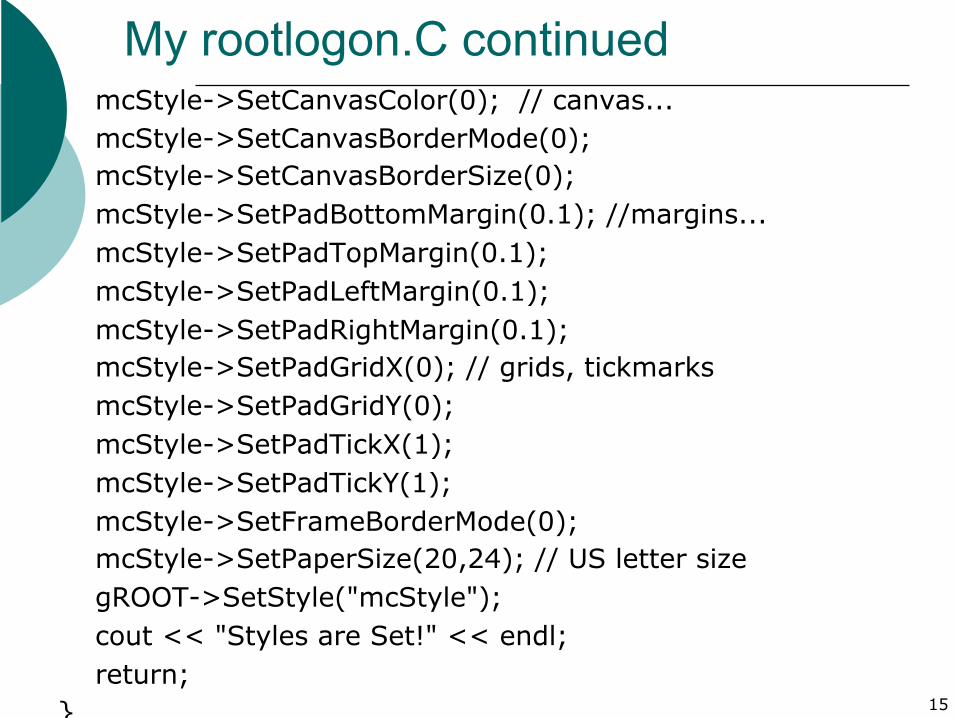
My rootlogon.C continued mcStyle->SetCanvasColor(0); // canvas... mcStyle->SetCanvasBorderMode(0); mcStyle->SetCanvasBorderSize(0); mcStyle->SetPadBottomMargin(0.1); //margins... mcStyle->SetPadTopMargin(0.1); mcStyle->SetPadLeftMargin(0.1); mcStyle->SetPadRightMargin(0.1); mcStyle->SetPadGridX(0); // grids, tickmarks mcStyle->SetPadGridY(0); mcStyle->SetPadTickX(1); mcStyle->SetPadTickY(1); mcStyle->SetFrameBorderMode(0); mcStyle->SetPaperSize(20,24); // US letter size gROOT->SetStyle("mcStyle"); cout << "Styles are Set!" << endl; return; }
15
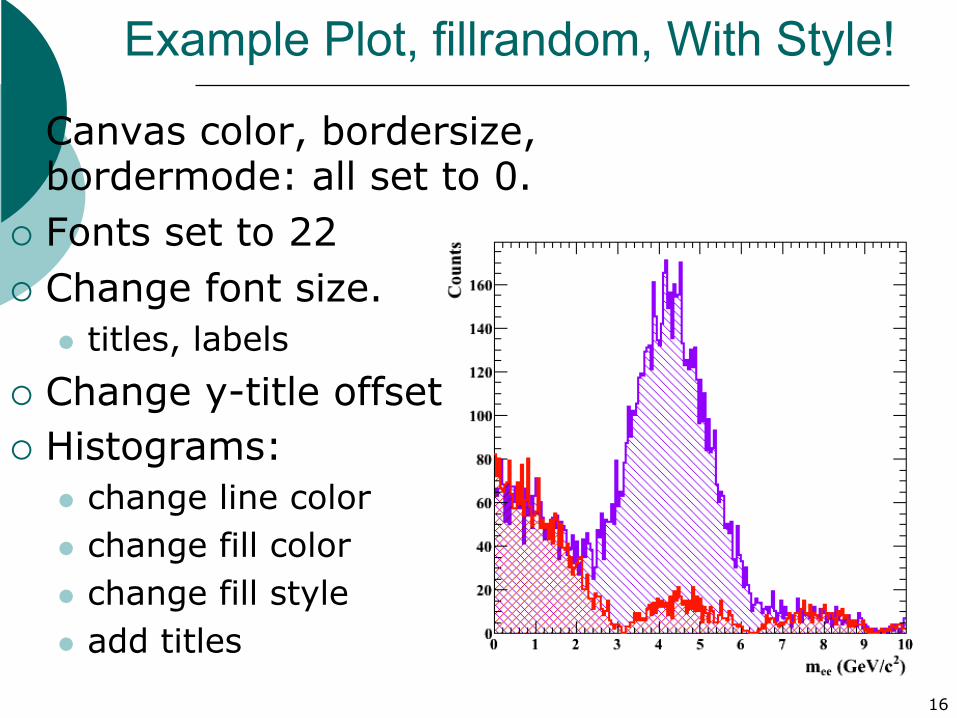
Example Plot, fillrandom, With Style!
¡ Canvas color, bordersize, bordermode: all set to 0.
¡ Fonts set to 22 ¡ Change font size.
l titles, labels ¡ Change y-title offset ¡ Histograms:
l change line color l change fill color l change fill style l add titles
16
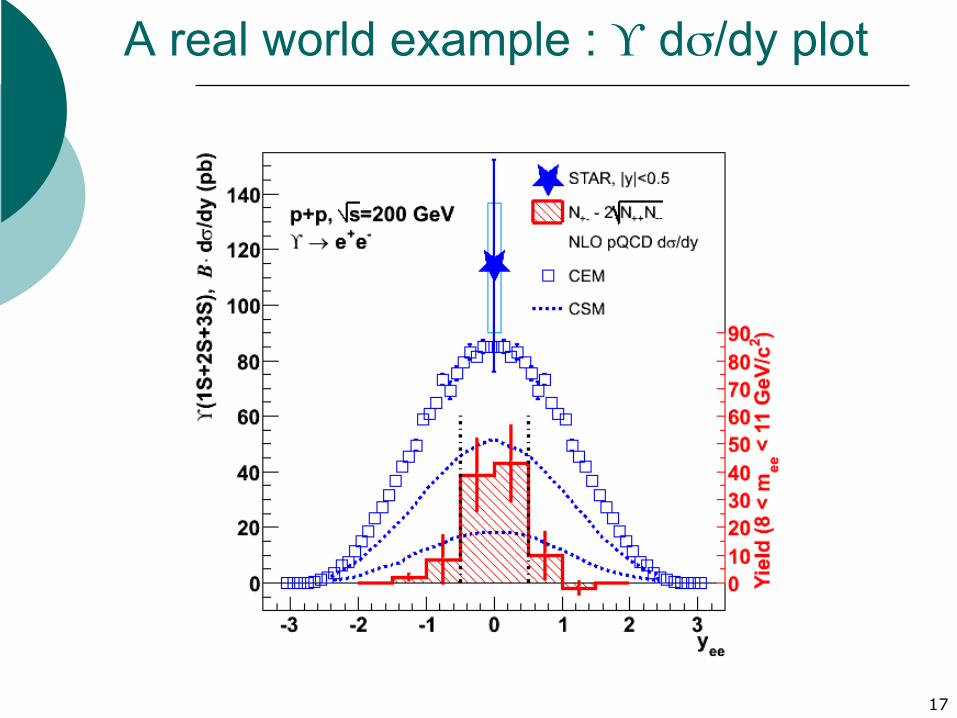
A real world example : ϒ dσ/dy plot
17
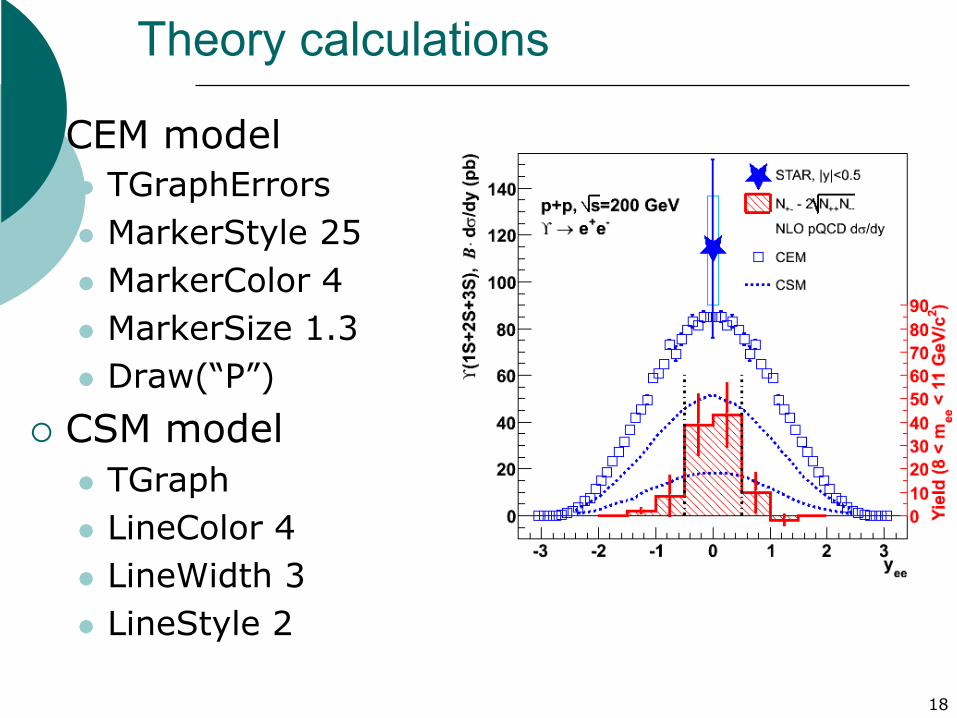
Theory calculations
¡ CEM model l TGraphErrors l MarkerStyle 25 l MarkerColor 4 l MarkerSize 1.3 l Draw(“P”)
¡ CSM model l TGraph l LineColor 4 l LineWidth 3 l LineStyle 2
18
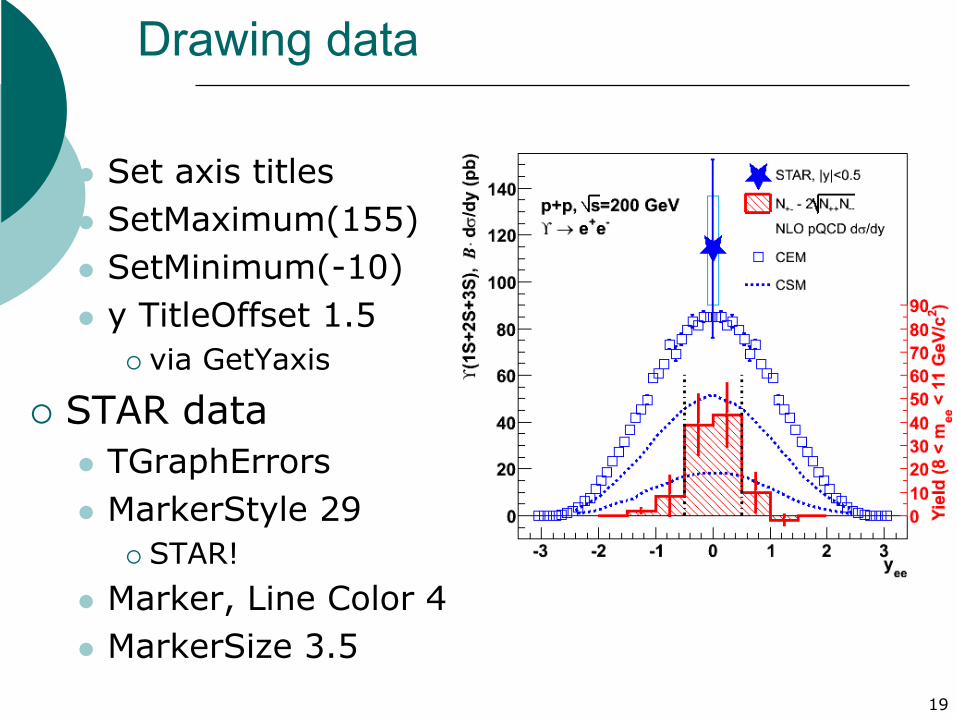
Drawing data ¡ Use dummy to:
l Set axis titles l SetMaximum(155) l SetMinimum(-10) l y TitleOffset 1.5
¡ via GetYaxis
¡ STAR data l TGraphErrors l MarkerStyle 29
¡ STAR! l Marker, Line Color 4 l MarkerSize 3.5
19
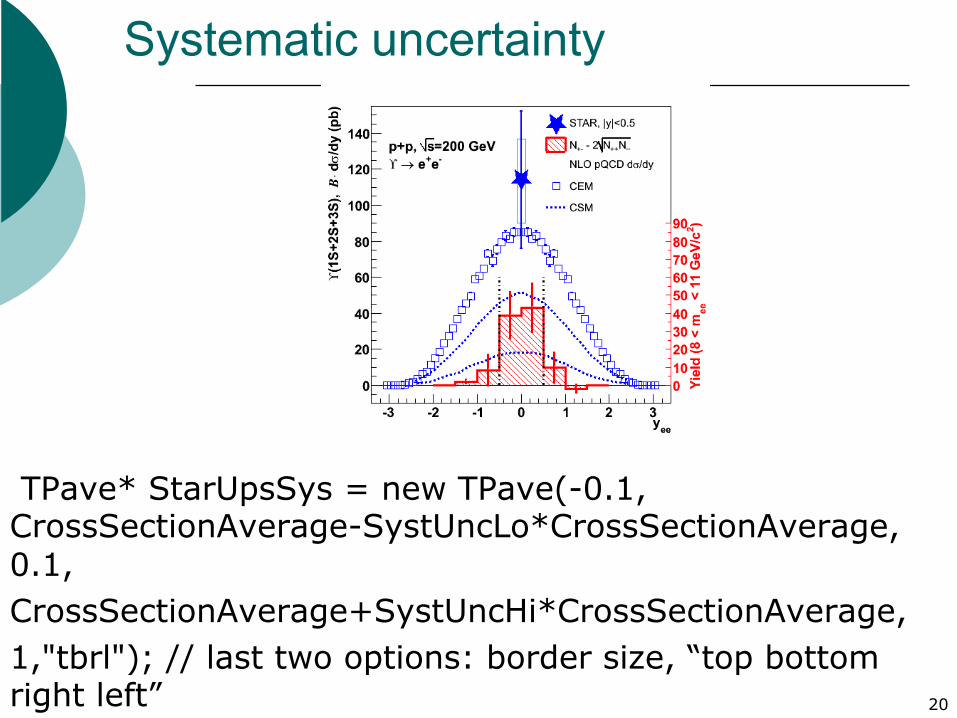
Systematic uncertainty
TPave* StarUpsSys = new TPave(-0.1, CrossSectionAverage-SystUncLo*CrossSectionAverage, 0.1, CrossSectionAverage+SystUncHi*CrossSectionAverage, 1,"tbrl"); // last two options: border size, “top bottom right left” 20
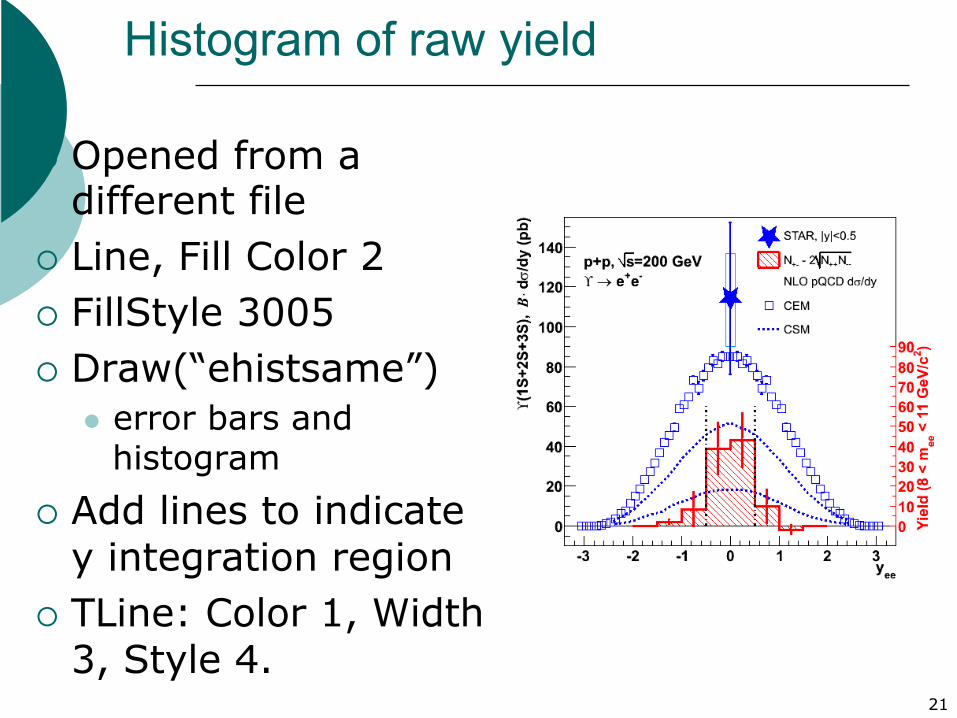
Histogram of raw yield
¡ Opened from a different file
¡ Line, Fill Color 2 ¡ FillStyle 3005 ¡ Draw(“ehistsame”)
l error bars and histogram
¡ Add lines to indicate y integration region
¡ TLine: Color 1, Width 3, Style 4.
21
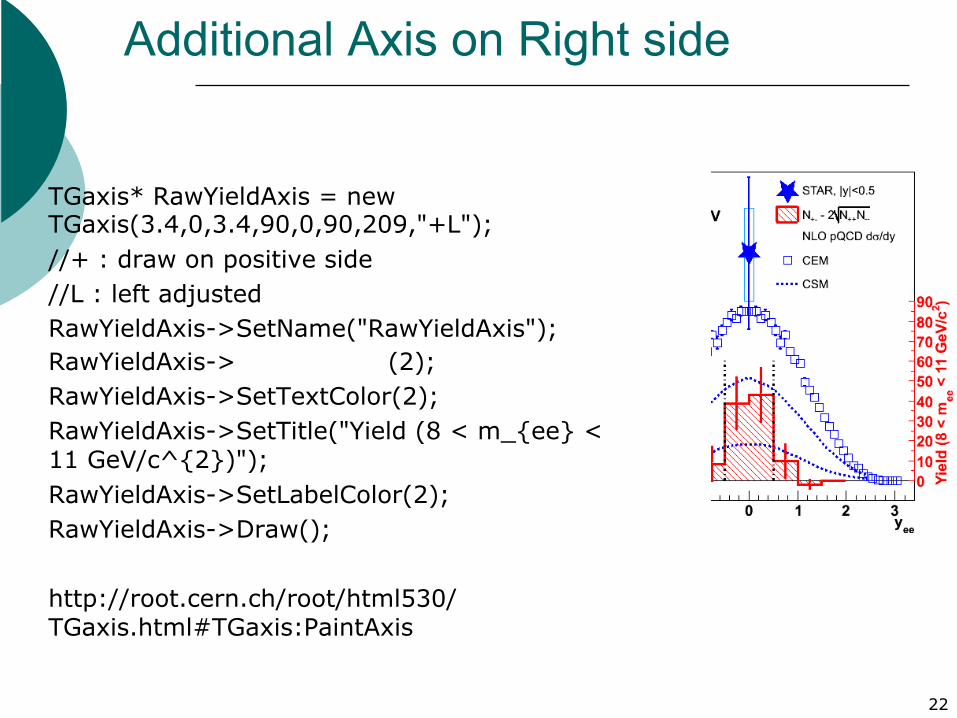
Additional Axis on Right side
TGaxis* RawYieldAxis = new TGaxis(3.4,0,3.4,90,0,90,209,"+L"); //+ : draw on positive side //L : left adjusted RawYieldAxis->SetName("RawYieldAxis"); RawYieldAxis->SetLineColor(2); RawYieldAxis->SetTextColor(2); RawYieldAxis->SetTitle("Yield (8 < m_{ee} < 11 GeV/c^{2})"); RawYieldAxis->SetLabelColor(2); RawYieldAxis->Draw(); http://root.cern.ch/root/html530/TGaxis.html#TGaxis:PaintAxis
22
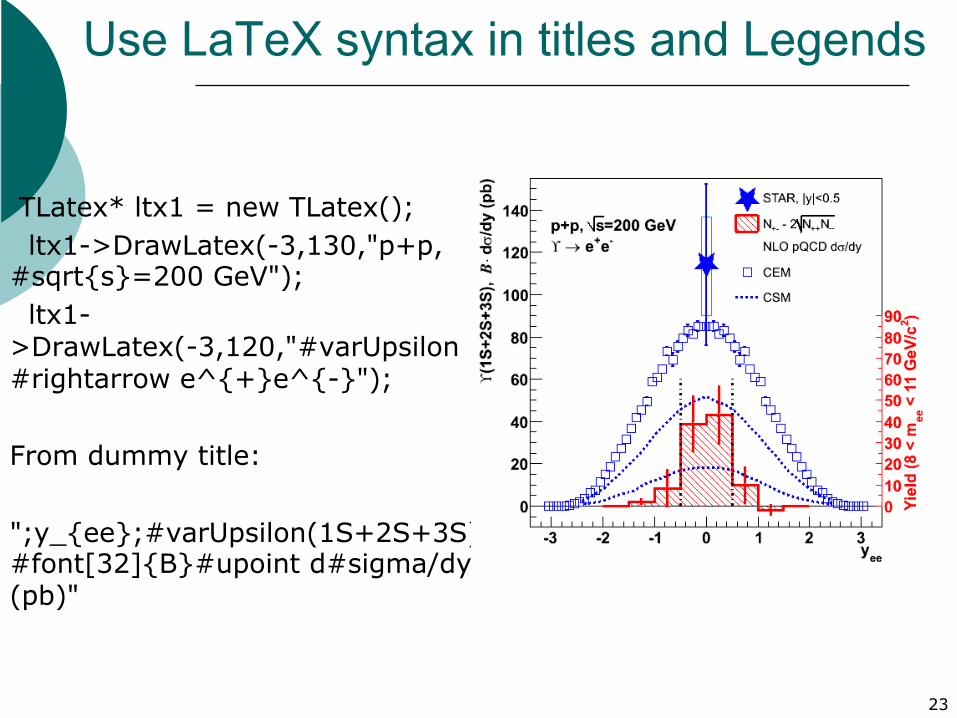
Use LaTeX syntax in titles and Legends
TLatex* ltx1 = new TLatex(); ltx1->DrawLatex(-3,130,"p+p, #sqrt{s}=200 GeV"); ltx1->DrawLatex(-3,120,"#varUpsilon #rightarrow e^{+}e^{-}"); From dummy title: ";y_{ee};#varUpsilon(1S+2S+3S), #font[32]{B}#upoint d#sigma/dy (pb)"
23
24
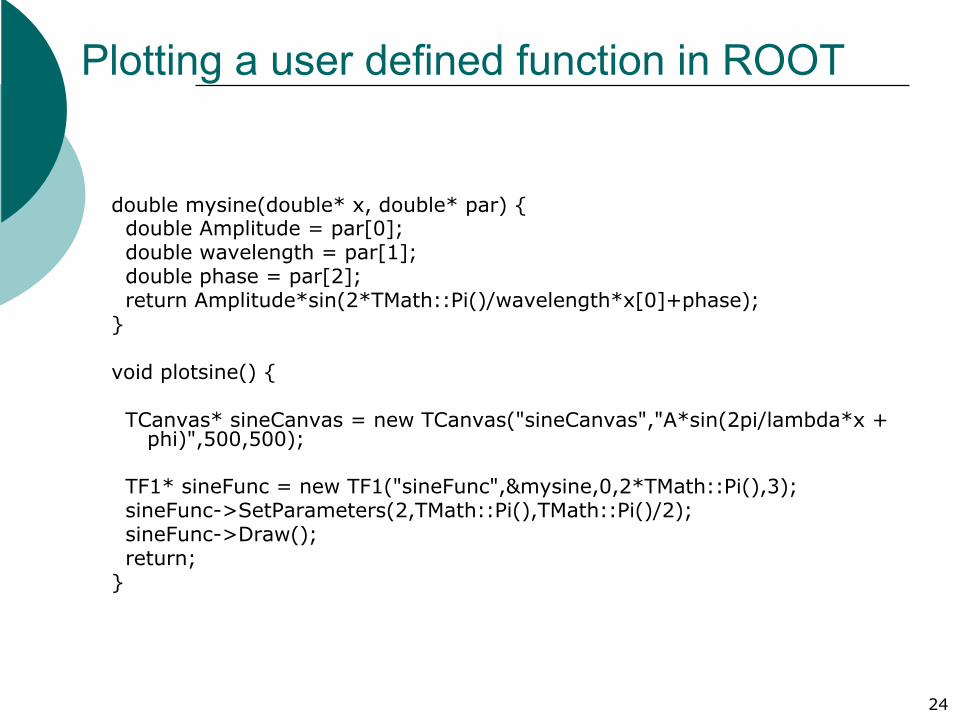
Plotting a user defined function in ROOT
double mysine(double* x, double* par) { double Amplitude = par[0]; double wavelength = par[1]; double phase = par[2]; return Amplitude*sin(2*TMath::Pi()/wavelength*x[0]+phase); } void plotsine() { TCanvas* sineCanvas = new TCanvas("sineCanvas","A*sin(2pi/lambda*x +
phi)",500,500); TF1* sineFunc = new TF1("sineFunc",&mysine,0,2*TMath::Pi(),3); sineFunc->SetParameters(2,TMath::Pi(),TMath::Pi()/2); sineFunc->Draw(); return; }
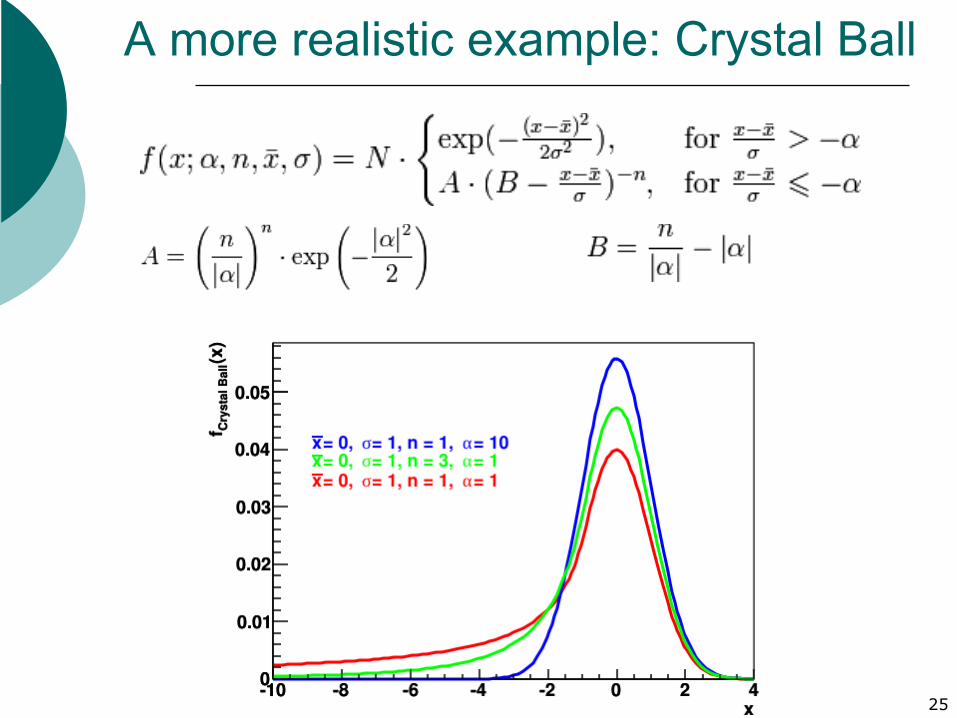
A more realistic example: Crystal Ball
25
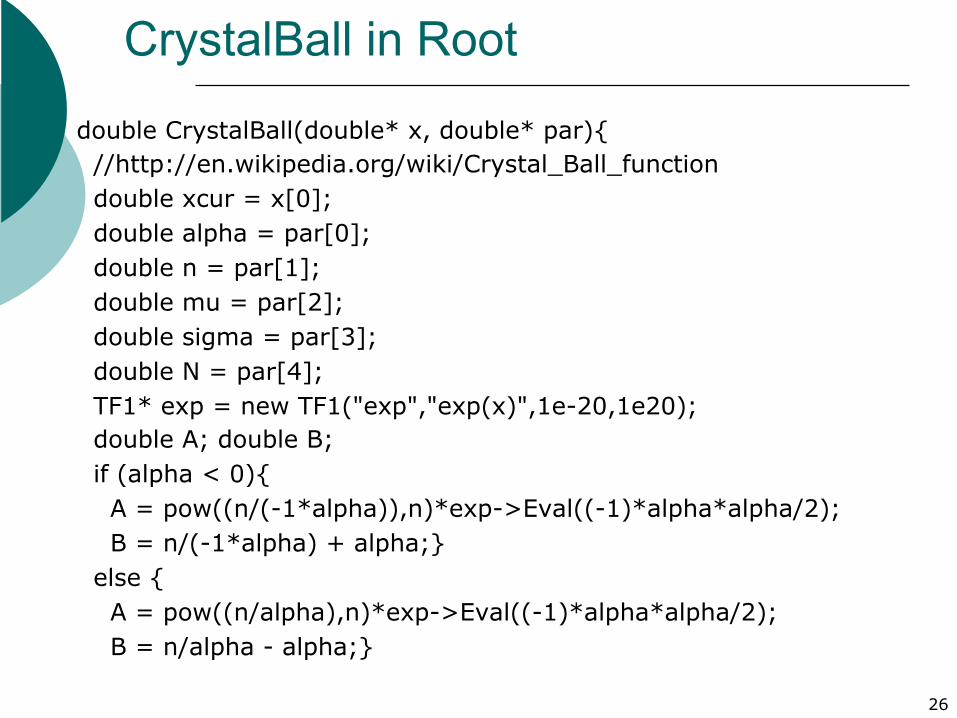
CrystalBall in Root
26
double CrystalBall(double* x, double* par){ //http://en.wikipedia.org/wiki/Crystal_Ball_function double xcur = x[0]; double alpha = par[0]; double n = par[1]; double mu = par[2]; double sigma = par[3]; double N = par[4]; TF1* exp = new TF1("exp","exp(x)",1e-20,1e20); double A; double B; if (alpha < 0){ A = pow((n/(-1*alpha)),n)*exp->Eval((-1)*alpha*alpha/2); B = n/(-1*alpha) + alpha;} else { A = pow((n/alpha),n)*exp->Eval((-1)*alpha*alpha/2); B = n/alpha - alpha;}
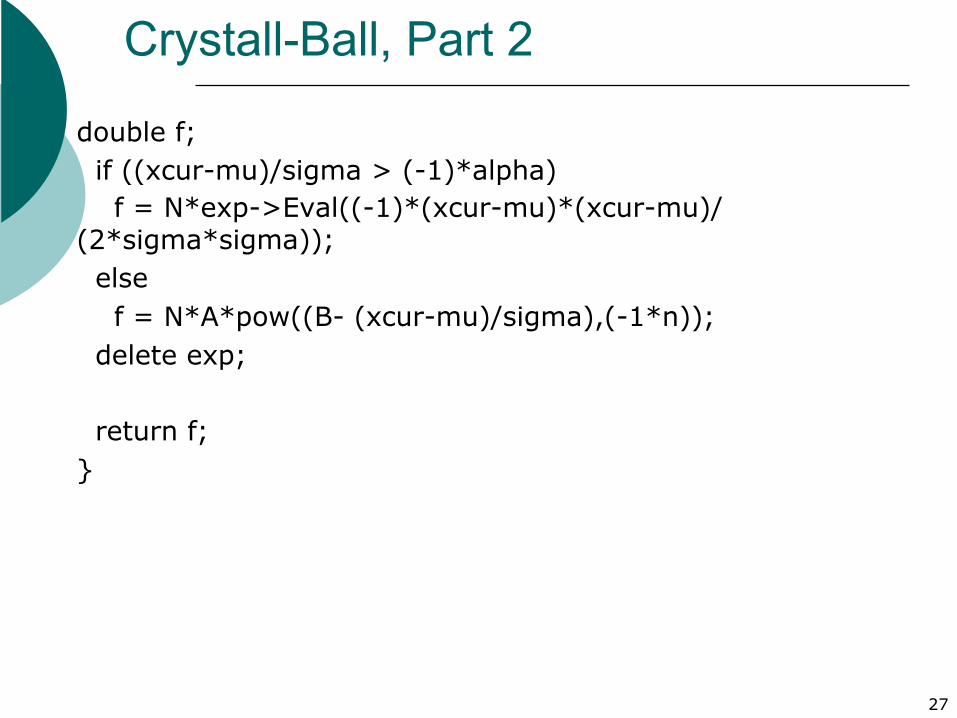
Crystall-Ball, Part 2
double f; if ((xcur-mu)/sigma > (-1)*alpha) f = N*exp->Eval((-1)*(xcur-mu)*(xcur-mu)/(2*sigma*sigma)); else f = N*A*pow((B- (xcur-mu)/sigma),(-1*n)); delete exp; return f; }
27
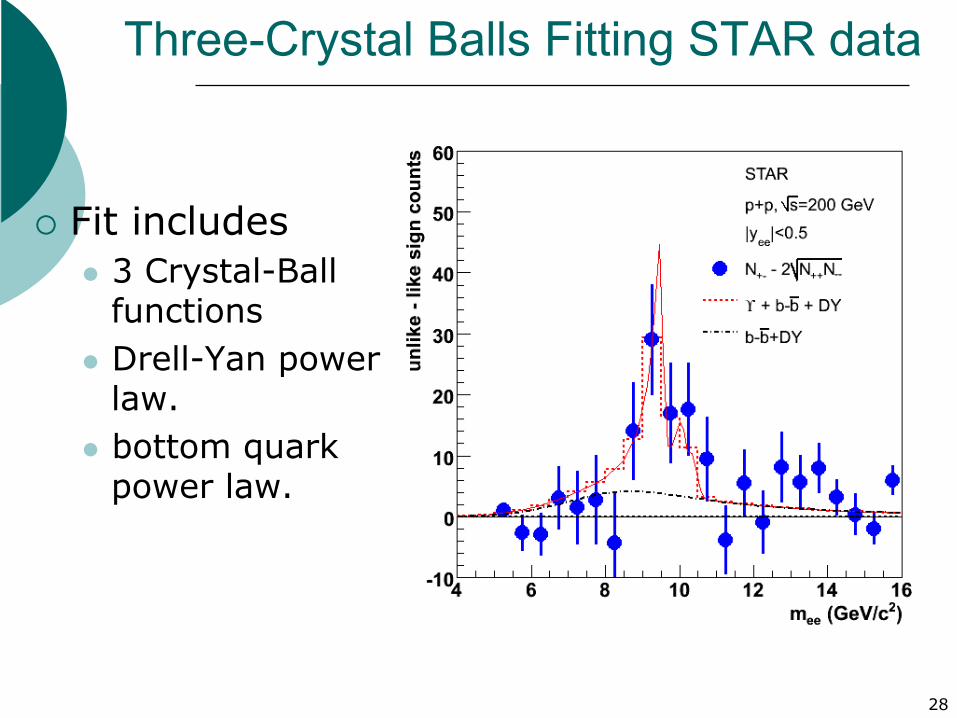
Three-Crystal Balls Fitting STAR data
¡ Fit includes l 3 Crystal-Ball
functions l Drell-Yan power
law. l bottom quark
power law.
28
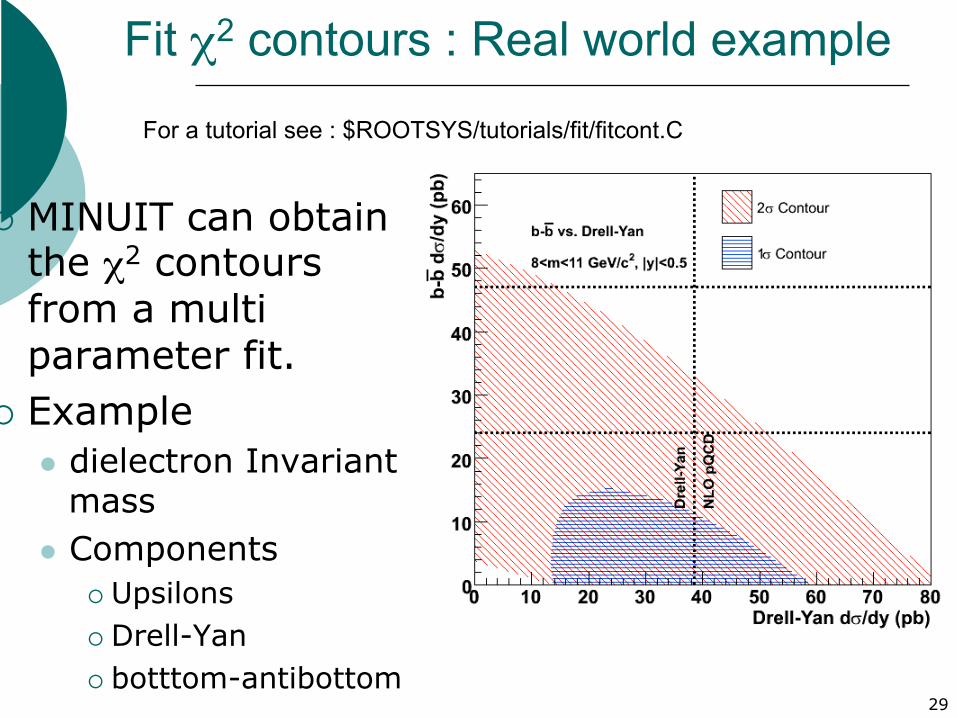
Fit χ2 contours : Real world example
29
¡ MINUIT can obtain the χ2 contours from a multi parameter fit.
¡ Example l dielectron Invariant
mass l Components
¡ Upsilons ¡ Drell-Yan ¡ botttom-antibottom
For a tutorial see : $ROOTSYS/tutorials/fit/fitcont.C
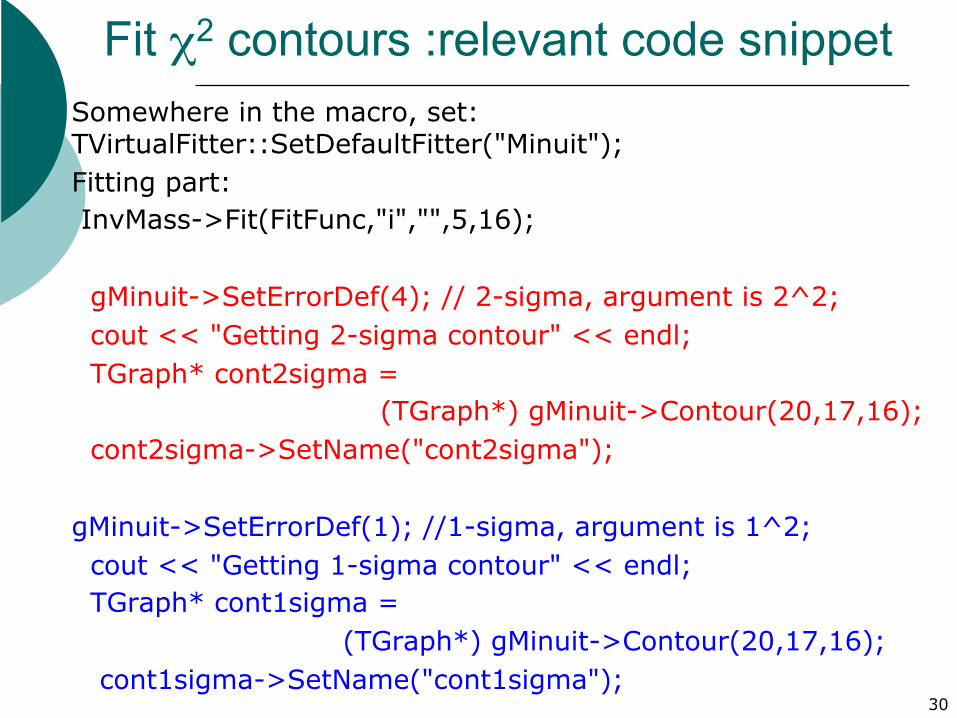
Fit χ2 contours :relevant code snippet Somewhere in the macro, set: TVirtualFitter::SetDefaultFitter("Minuit"); Fitting part: InvMass->Fit(FitFunc,"i","",5,16); gMinuit->SetErrorDef(4); // 2-sigma, argument is 2^2; cout << "Getting 2-sigma contour" << endl; TGraph* cont2sigma = (TGraph*) gMinuit->Contour(20,17,16); cont2sigma->SetName("cont2sigma"); gMinuit->SetErrorDef(1); //1-sigma, argument is 1^2; cout << "Getting 1-sigma contour" << endl; TGraph* cont1sigma = (TGraph*) gMinuit->Contour(20,17,16); cont1sigma->SetName("cont1sigma");
30
31
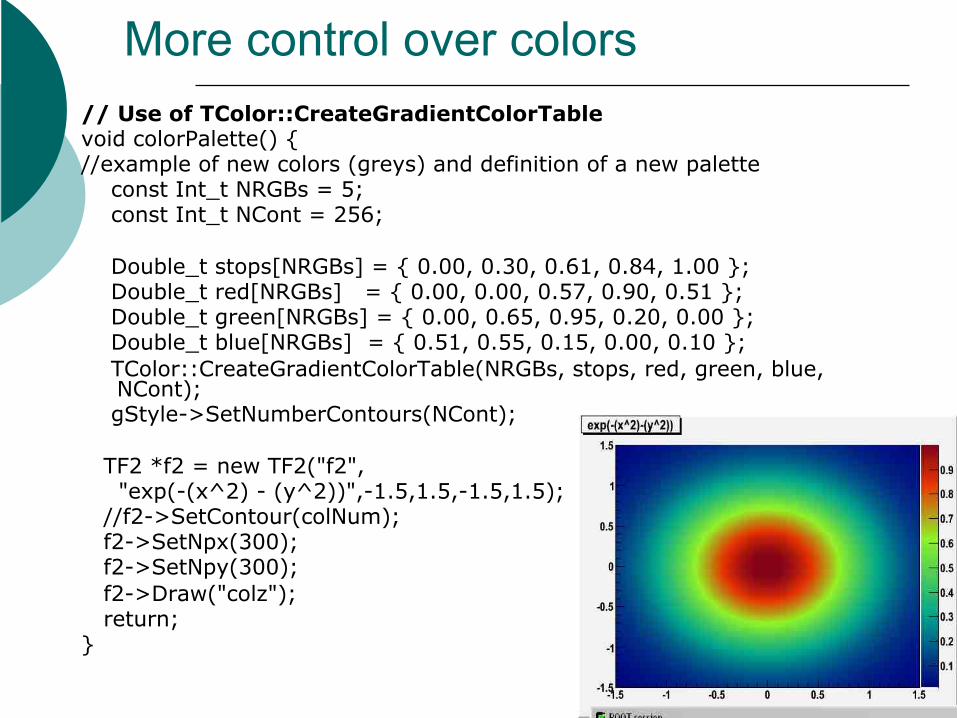
More control over colors // Use of TColor::CreateGradientColorTable void colorPalette() { //example of new colors (greys) and definition of a new palette const Int_t NRGBs = 5; const Int_t NCont = 256; Double_t stops[NRGBs] = { 0.00, 0.30, 0.61, 0.84, 1.00 }; Double_t red[NRGBs] = { 0.00, 0.00, 0.57, 0.90, 0.51 }; Double_t green[NRGBs] = { 0.00, 0.65, 0.95, 0.20, 0.00 }; Double_t blue[NRGBs] = { 0.51, 0.55, 0.15, 0.00, 0.10 }; TColor::CreateGradientColorTable(NRGBs, stops, red, green, blue,
NCont); gStyle->SetNumberContours(NCont); TF2 *f2 = new TF2("f2", "exp(-(x^2) - (y^2))",-1.5,1.5,-1.5,1.5); //f2->SetContour(colNum); f2->SetNpx(300); f2->SetNpy(300); f2->Draw("colz"); return; }
Last word: saving files, and animations
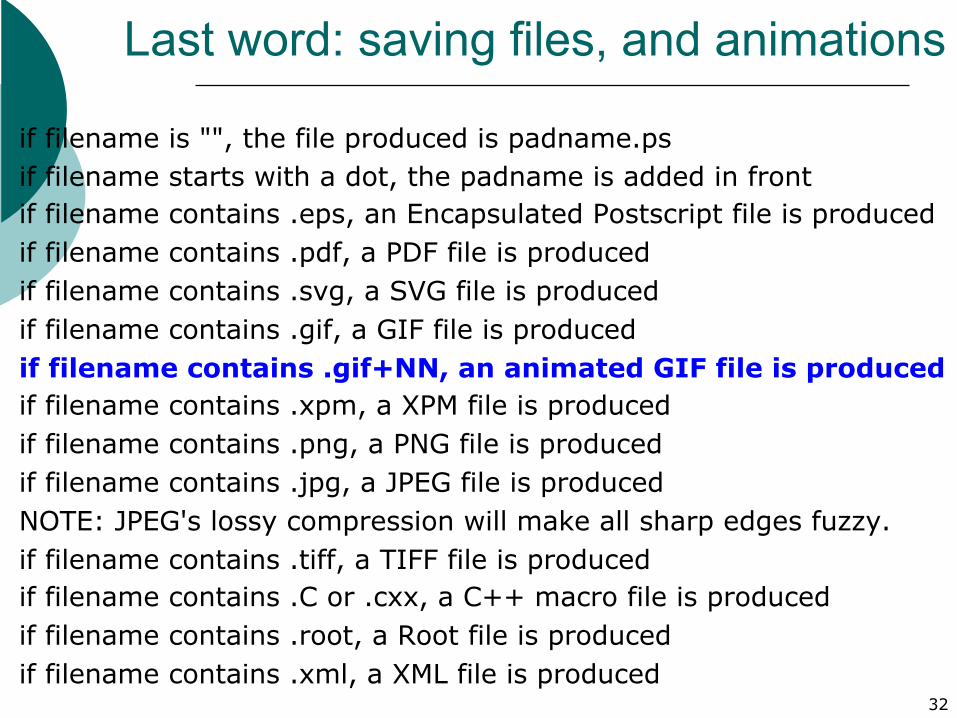
if filename is "", the file produced is padname.ps if filename starts with a dot, the padname is added in front if filename contains .eps, an Encapsulated Postscript file is produced if filename contains .pdf, a PDF file is produced if filename contains .svg, a SVG file is produced if filename contains .gif, a GIF file is produced if filename contains .gif+NN, an animated GIF file is produced if filename contains .xpm, a XPM file is produced if filename contains .png, a PNG file is produced if filename contains .jpg, a JPEG file is produced NOTE: JPEG's lossy compression will make all sharp edges fuzzy. if filename contains .tiff, a TIFF file is produced if filename contains .C or .cxx, a C++ macro file is produced if filename contains .root, a Root file is produced if filename contains .xml, a XML file is produced
32
Animated gifs
33
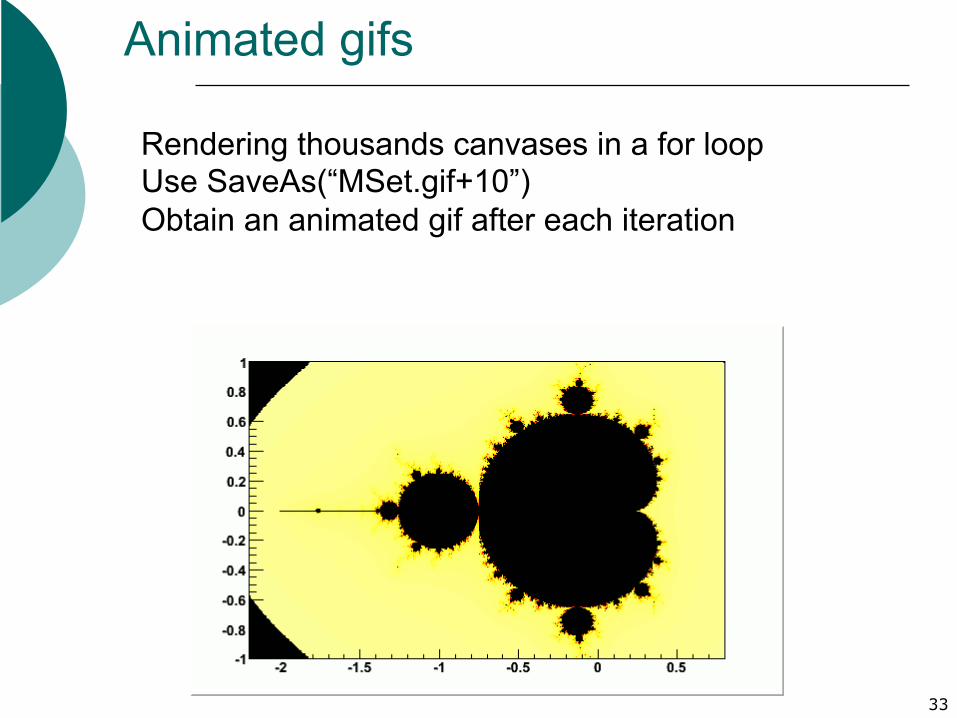
Rendering thousands canvases in a for loop Use SaveAs(“MSet.gif+10”) Obtain an animated gif after each iteration
34
Additional Material
35
ROOT commands
¡ Starting root, just type “root” ¡ At the root prompt:
l .q = Exit from root l .ls = list the files loaded into root session l .! some-unix-command = execute some-unix-
command in the shell ¡ Most c++ commands can also be interpreted. ¡ Executing a macro “myMacro.C”:
l .x myMacro.C
36
ROOT Classes
¡ Since it is C++, everything is represented by classes: l Windows (or canvases) : TCanvas
¡ A window where we can draw data, functions, etc. l Functions : TF1, TF2, TF3
¡ Classes to manipulate mathematical functions, such as sin(x), in order to draw, evaluate, and integrate them.
l Graphs : TGraph ¡ Class used to plot data on a canvas
l Histograms: TH1, TH2, TH3 ¡ Classes to manipulate histograms. Can draw them
on a canvas, integrate them, obtain means and RMS values, evaluate bin contents.
l Tutorials (lots of code to try out ROOT): ¡ $ROOTSYS/tutorials/ ¡ For example: ./hsimple.C, and ./hist/h1draw.C
37
Graph Draw Options The various draw options for a graph are explained in TGraph::PaintGraph. They
are: • "L" A simple poly-line between every points is drawn • "F" A fill area is drawn • “F1” Idem as "F" but fill area is no more repartee around X=0 or Y=0 • "F2" draw a fill area poly line connecting the center of bins • "A" Axis are drawn around the graph • "C" A smooth curve is drawn • "*" A star is plotted at each point • "P" The current marker of the graph is plotted at each point • "B" A bar chart is drawn at each point • "[]" Only the end vertical/horizontal lines of the error bars are drawn. This option
only applies to the TGraphAsymmErrors. • "1" ylow = rwymin The options are not case sensitive and they can be concatenated in most cases. Let
us look at some examples
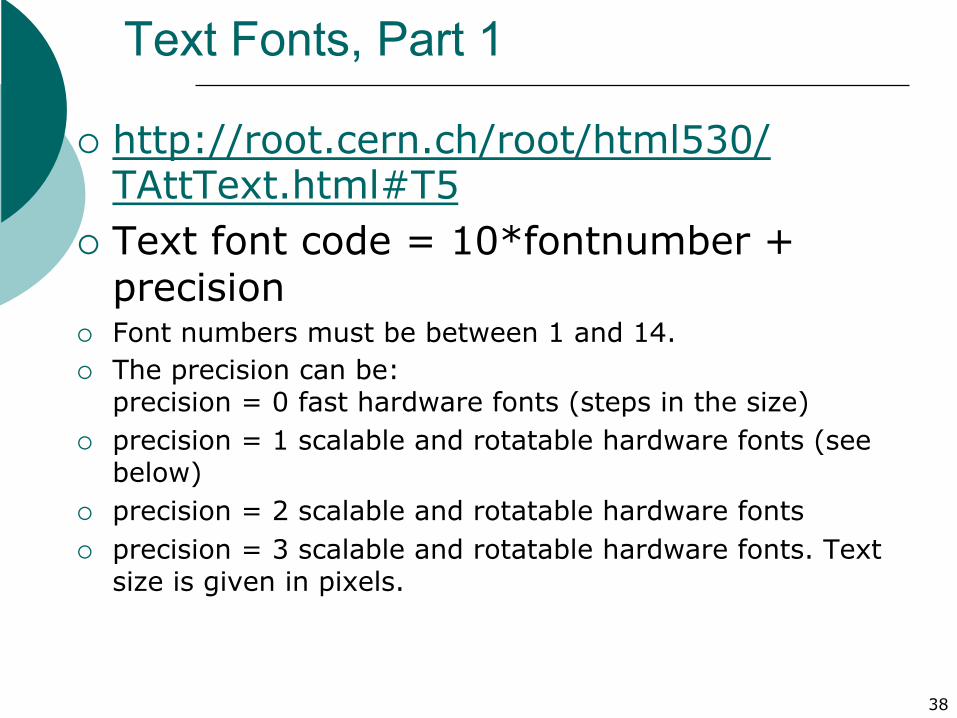
Text Fonts, Part 1
¡ http://root.cern.ch/root/html530/TAttText.html#T5
¡ Text font code = 10*fontnumber + precision
¡ Font numbers must be between 1 and 14. ¡ The precision can be:
precision = 0 fast hardware fonts (steps in the size) ¡ precision = 1 scalable and rotatable hardware fonts (see
below) ¡ precision = 2 scalable and rotatable hardware fonts ¡ precision = 3 scalable and rotatable hardware fonts. Text
size is given in pixels.
38
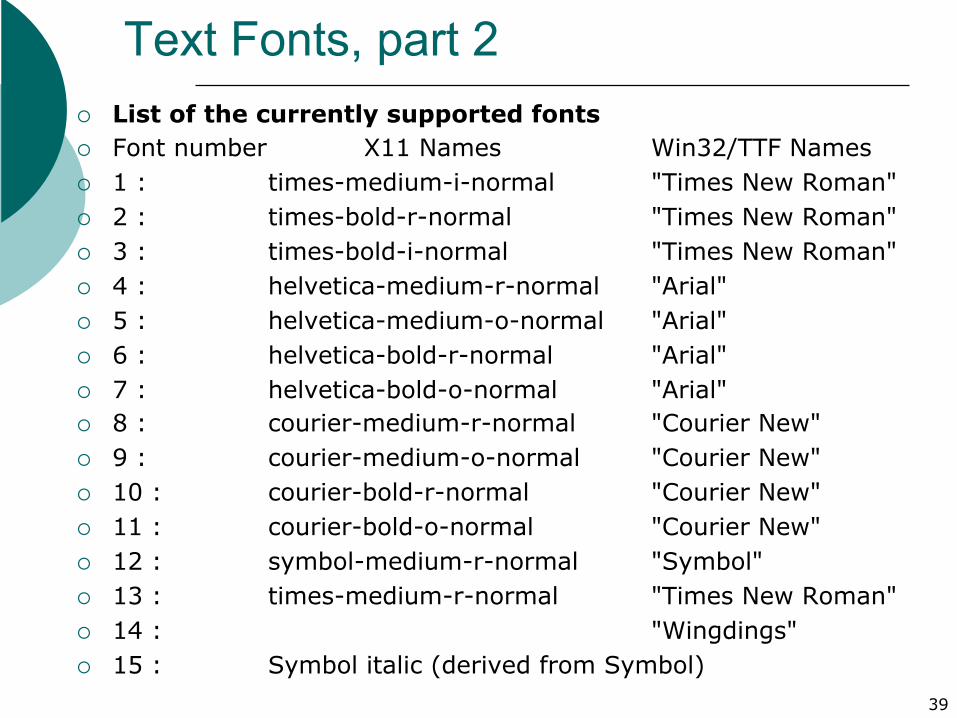
Text Fonts, part 2 ¡ List of the currently supported fonts ¡ Font number X11 Names Win32/TTF Names ¡ 1 : times-medium-i-normal "Times New Roman" ¡ 2 : times-bold-r-normal "Times New Roman" ¡ 3 : times-bold-i-normal "Times New Roman" ¡ 4 : helvetica-medium-r-normal "Arial" ¡ 5 : helvetica-medium-o-normal "Arial" ¡ 6 : helvetica-bold-r-normal "Arial" ¡ 7 : helvetica-bold-o-normal "Arial" ¡ 8 : courier-medium-r-normal "Courier New" ¡ 9 : courier-medium-o-normal "Courier New" ¡ 10 : courier-bold-r-normal "Courier New" ¡ 11 : courier-bold-o-normal "Courier New" ¡ 12 : symbol-medium-r-normal "Symbol" ¡ 13 : times-medium-r-normal "Times New Roman" ¡ 14 : "Wingdings" ¡ 15 : Symbol italic (derived from Symbol)
39
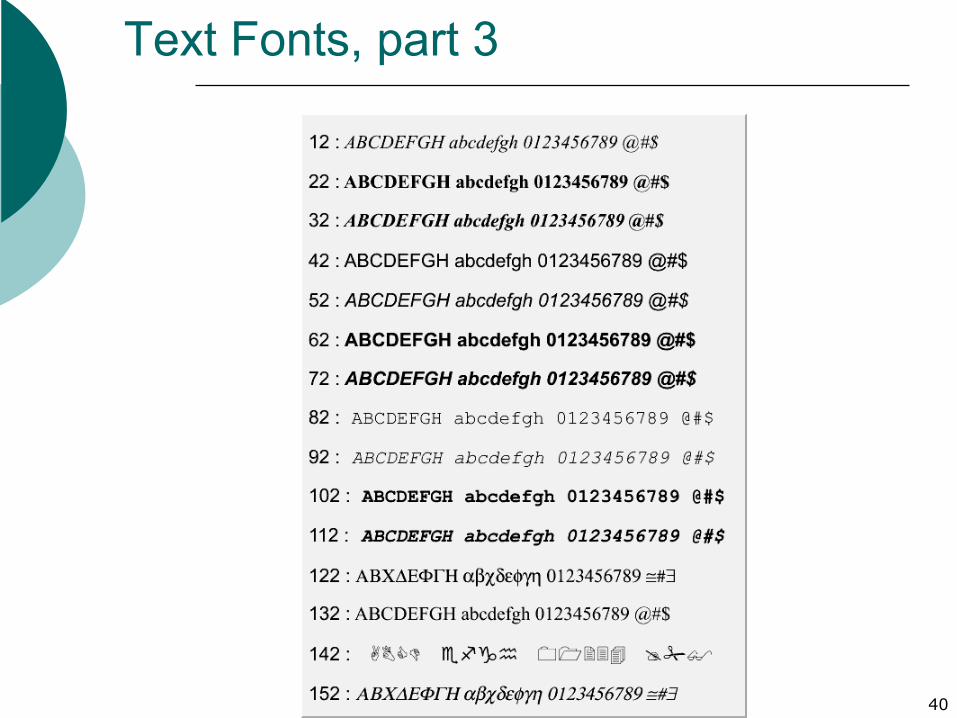
Text Fonts, part 3
40
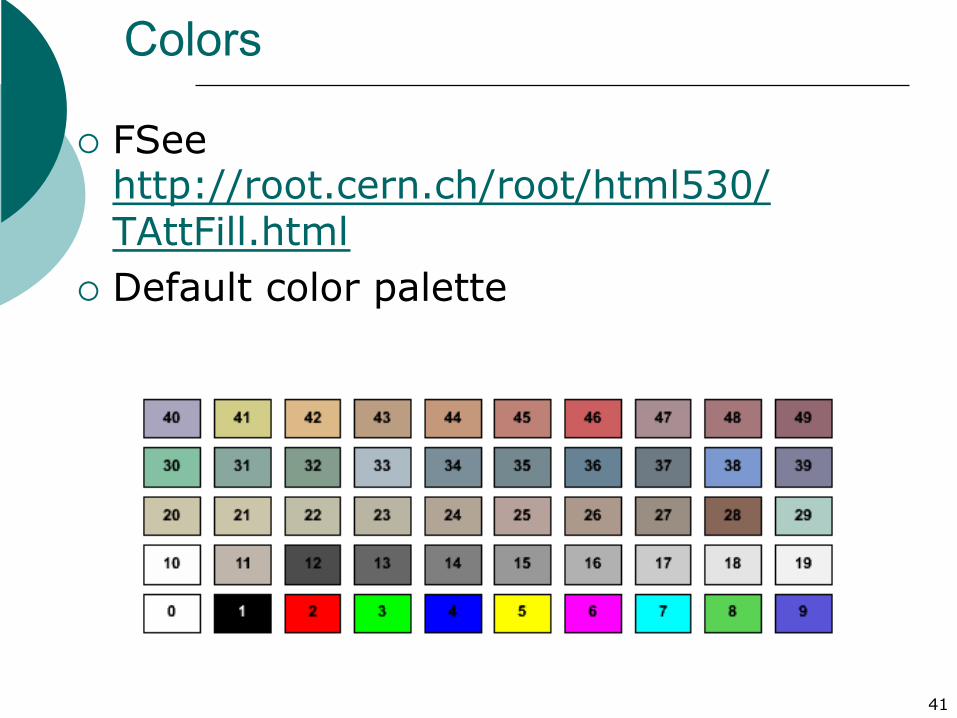
Colors
¡ FSee http://root.cern.ch/root/html530/TAttFill.html
¡ Default color palette
41
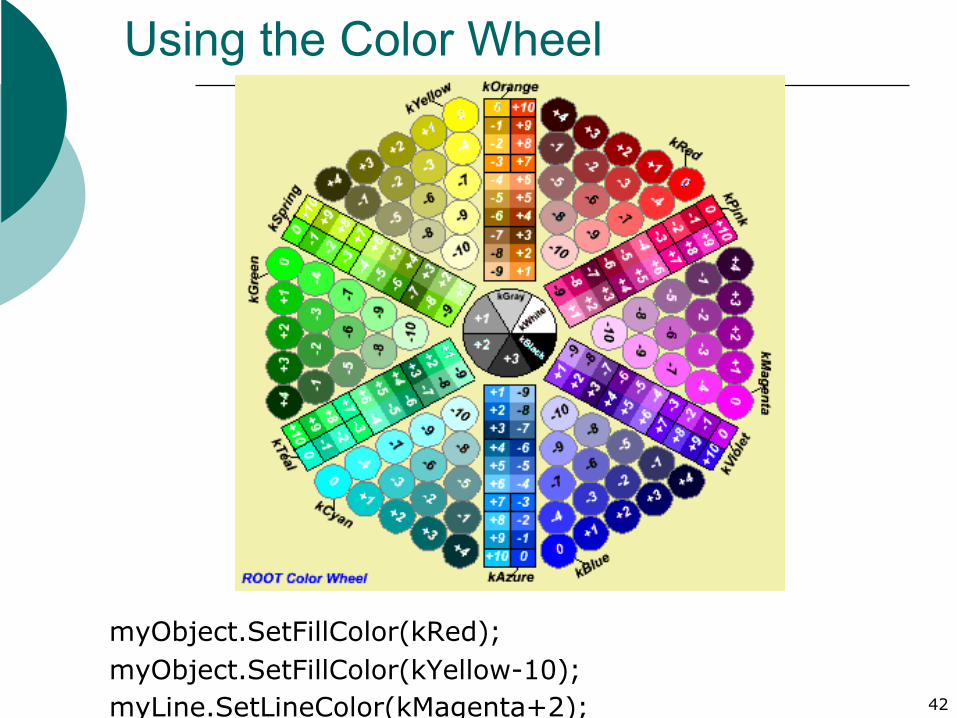
Using the Color Wheel
myObject.SetFillColor(kRed); myObject.SetFillColor(kYellow-10); myLine.SetLineColor(kMagenta+2); 42
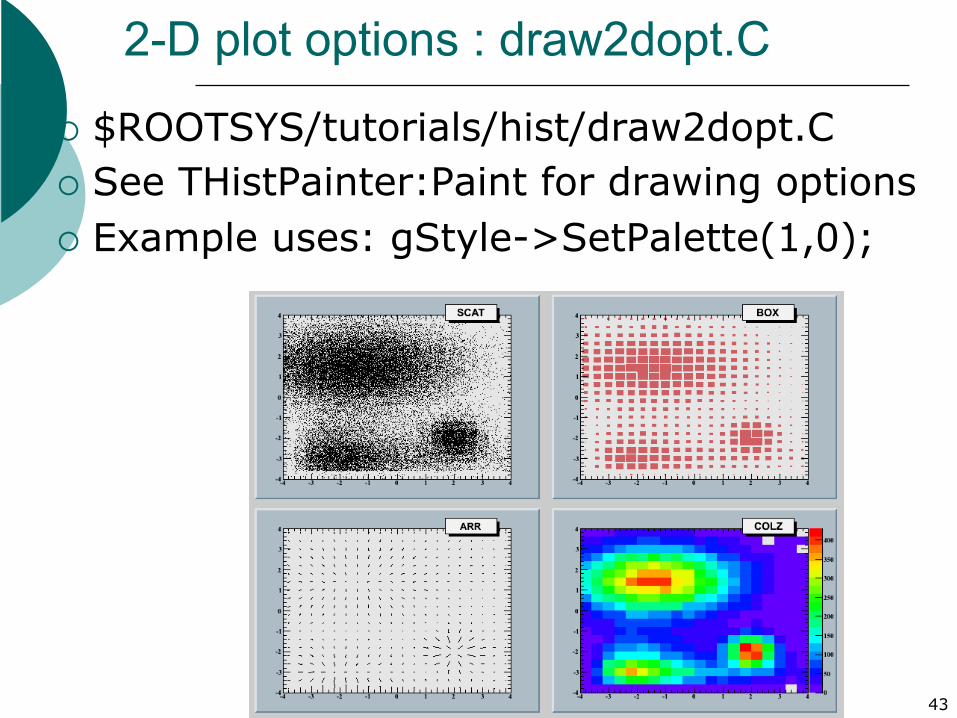
2-D plot options : draw2dopt.C
¡ $ROOTSYS/tutorials/hist/draw2dopt.C ¡ See THistPainter:Paint for drawing options ¡ Example uses: gStyle->SetPalette(1,0);
43
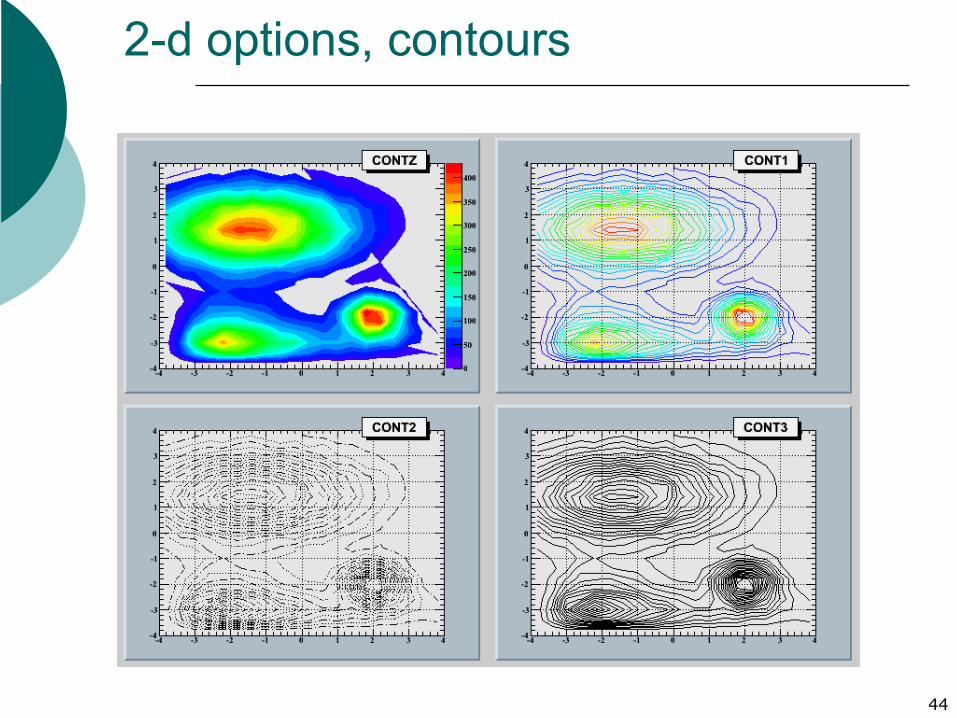
2-d options, contours
44
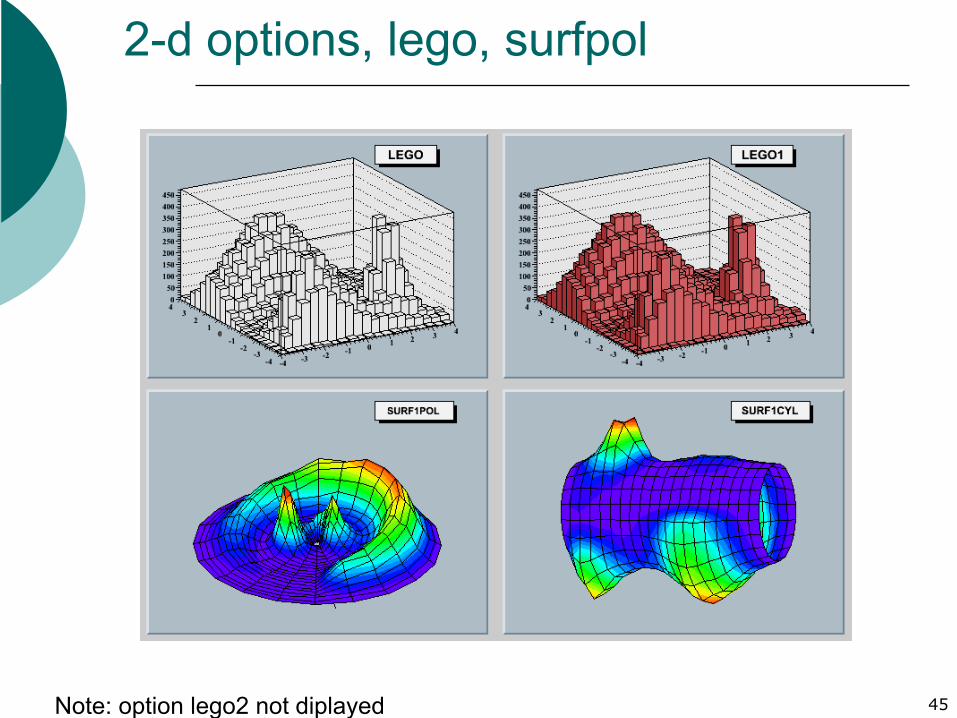
2-d options, lego, surfpol
45 Note: option lego2 not diplayed
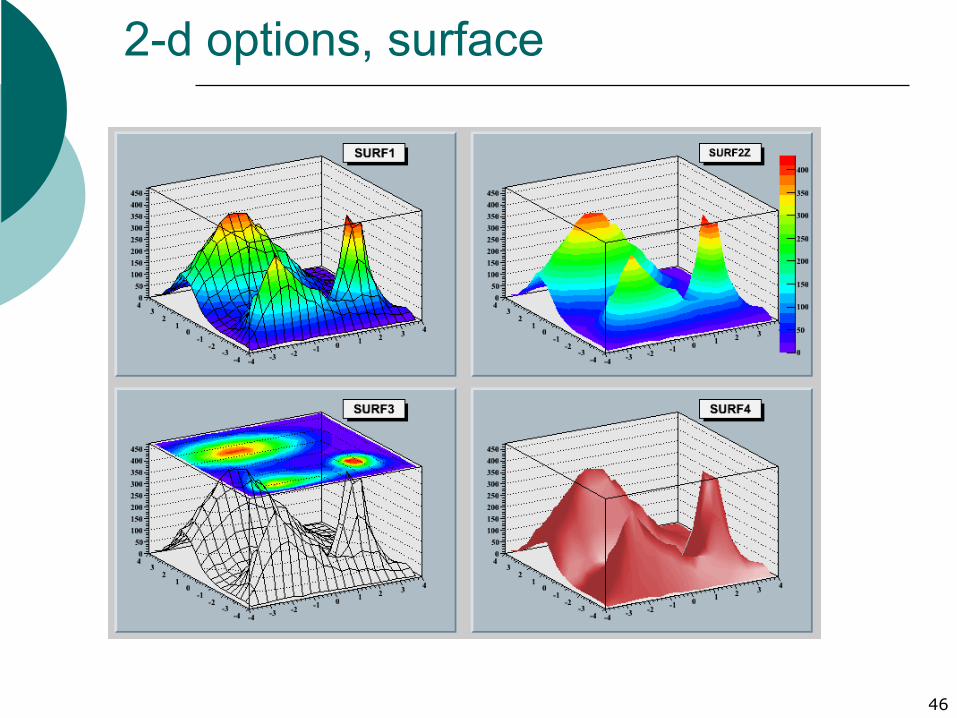
2-d options, surface
46
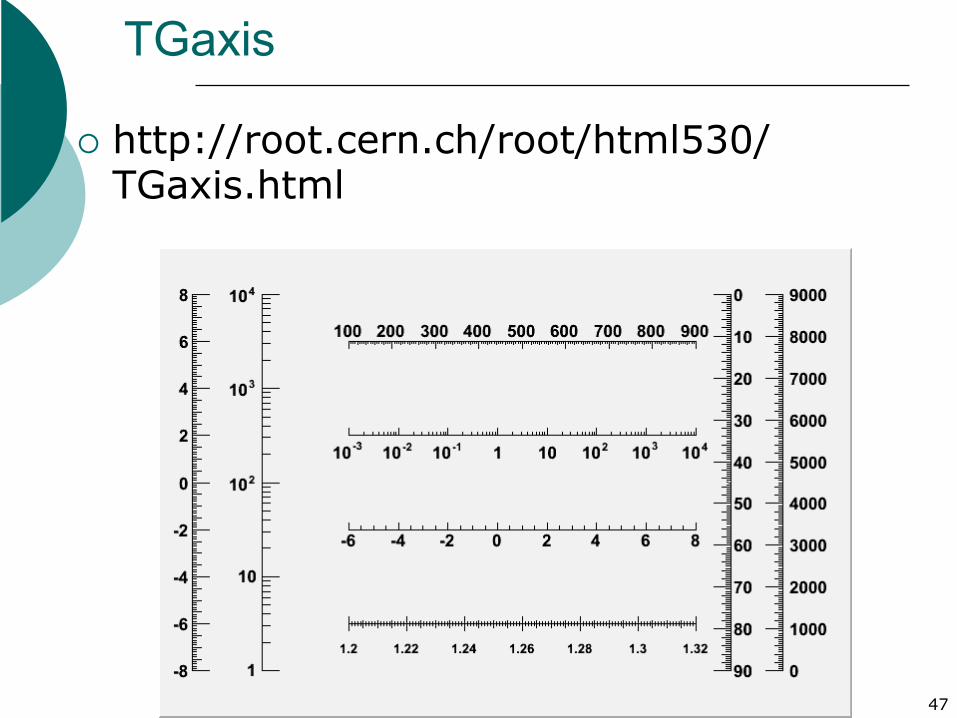
TGaxis
¡ http://root.cern.ch/root/html530/TGaxis.html
47


![VLPSR]LM · useful clinical tips and tricks step by step. 11 Philippe Sleiman Root canal SYSTEM or root CANAL treatment 13 ... of root canals or of endodontic surgery. Because ABs](https://img.pdfslide.net/doc/110x75/5f527335448c3931a80b8733/vlpsrlm-useful-clinical-tips-and-tricks-step-by-step-11-philippe-sleiman-root.jpg)