Embed Size (px)
Citation preview
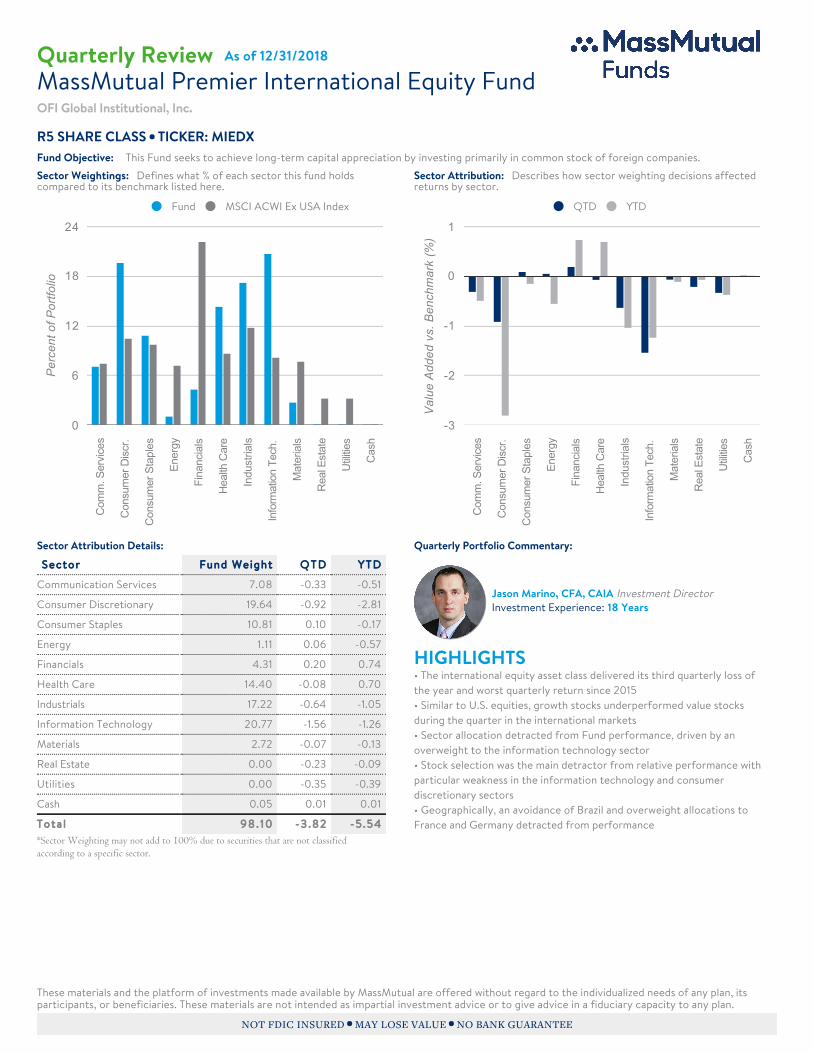
Fund MSCI ACWI Ex USA Index
Sector Weightings: Defines what % of each sector this fund holdscompared to its benchmark listed here.
QTD YTD
Sector Attribution: Describes how sector weighting decisions affectedreturns by sector.
Sector Attribution Details:Sector Fund Weight Q T D Y T D
Communication Services 7.08 -0.33 -0.51
Consumer Discretionary 19.64 -0.92 -2.81
Consumer Staples 10.81 0.10 -0.17
Energy 1.11 0.06 -0.57
Financials 4.31 0.20 0.74
Health Care 14.40 -0.08 0.70
Industrials 17.22 -0.64 -1.05
Information Technology 20.77 -1.56 -1.26
Materials 2.72 -0.07 -0.13
Real Estate 0.00 -0.23 -0.09
Utilities 0.00 -0.35 -0.39
Cash 0.05 0.01 0.01
Tota l 9 8 . 1 0 -3 .82 -5.54
Quarterly Portfolio Commentary:
Jason Marino, CFA, CAIA Investment DirectorInvestment Experience: 18 Years
HIGHLIGHTS • The international equity asset class delivered its third quarterly loss ofthe year and worst quarterly return since 2015 • Similar to U.S. equities, growth stocks underperformed value stocksduring the quarter in the international markets• Sector allocation detracted from Fund performance, driven by anoverweight to the information technology sector• Stock selection was the main detractor from relative performance withparticular weakness in the information technology and consumerdiscretionary sectors• Geographically, an avoidance of Brazil and overweight allocations toFrance and Germany detracted from performance
Fund Objective: This Fund seeks to achieve long-term capital appreciation by investing primarily in common stock of foreign companies.
These materials and the platform of investments made available by MassMutual are offered without regard to the individualized needs of any plan, itsparticipants, or beneficiaries. These materials are not intended as impartial investment advice or to give advice in a fiduciary capacity to any plan.
NOT FDIC INSURED MAY LOSE VALUE NO BANK GUARANTEE
Quarterly Review
R5 SHARE CLASS TICKER: MIEDX
As of 12/31/2018
MassMutual Premier International Equity FundOFI Global Institutional, Inc.
Com
m. S
ervi
ces
Con
sum
er D
iscr
.
Con
sum
er S
tapl
es
Ene
rgy
Fin
anci
als
Hea
lth C
are
Indu
stria
ls
Info
rmat
ion
Tec
h.
Mat
eria
ls
Rea
l Est
ate
Util
ities
Cas
h
0
6
12
18
24
Per
cent
of P
ortfo
lio
Com
m. S
ervi
ces
Con
sum
er D
iscr
.
Con
sum
er S
tapl
es
Ene
rgy
Fin
anci
als
Hea
lth C
are
Indu
stria
ls
Info
rmat
ion
Tec
h.
Mat
eria
ls
Rea
l Est
ate
Util
ities
Cas
h
-3
-2
-1
0
1
Val
ue A
dded
vs.
Ben
chm
ark
(%)
*Sector Weighting may not add to 100% due to securities that are not classified according to a specific sector.
Quarterly Portfolio Commentary
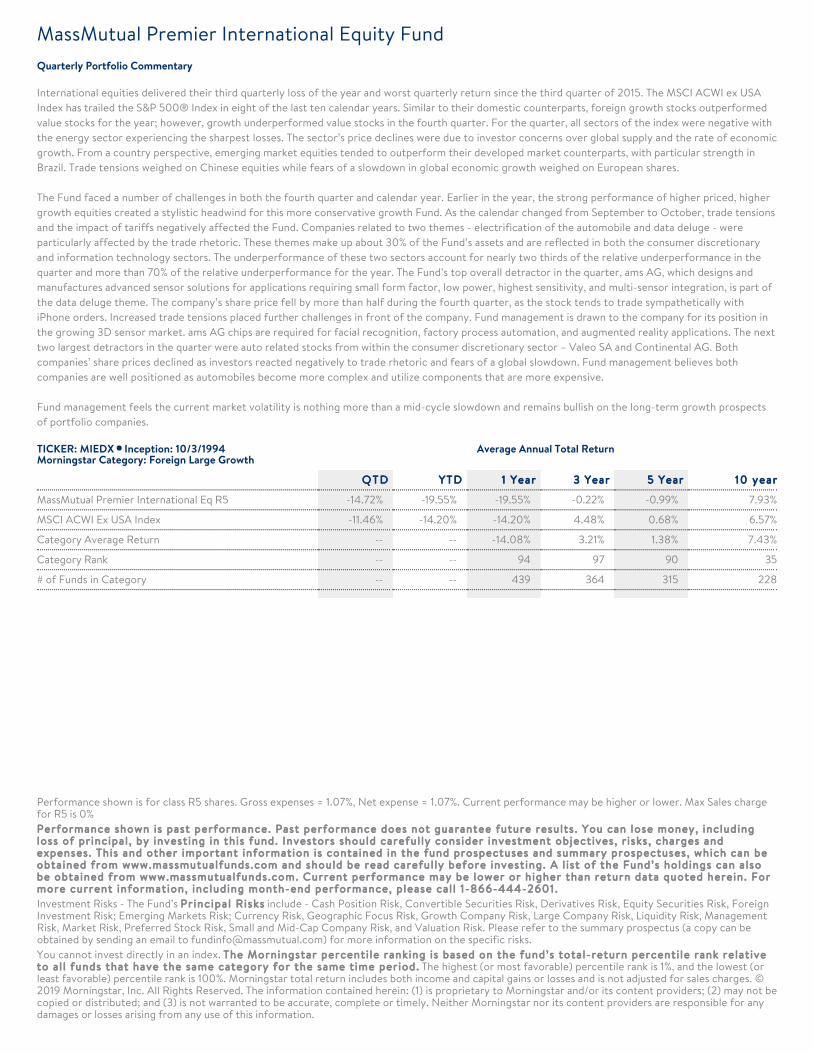
International equities delivered their third quarterly loss of the year and worst quarterly return since the third quarter of 2015. The MSCI ACWI ex USAIndex has trailed the S&P 500® Index in eight of the last ten calendar years. Similar to their domestic counterparts, foreign growth stocks outperformedvalue stocks for the year; however, growth underperformed value stocks in the fourth quarter. For the quarter, all sectors of the index were negative withthe energy sector experiencing the sharpest losses. The sector’s price declines were due to investor concerns over global supply and the rate of economicgrowth. From a country perspective, emerging market equities tended to outperform their developed market counterparts, with particular strength inBrazil. Trade tensions weighed on Chinese equities while fears of a slowdown in global economic growth weighed on European shares.
The Fund faced a number of challenges in both the fourth quarter and calendar year. Earlier in the year, the strong performance of higher priced, highergrowth equities created a stylistic headwind for this more conservative growth Fund. As the calendar changed from September to October, trade tensionsand the impact of tariffs negatively affected the Fund. Companies related to two themes - electrification of the automobile and data deluge - wereparticularly affected by the trade rhetoric. These themes make up about 30% of the Fund’s assets and are reflected in both the consumer discretionaryand information technology sectors. The underperformance of these two sectors account for nearly two thirds of the relative underperformance in thequarter and more than 70% of the relative underperformance for the year. The Fund’s top overall detractor in the quarter, ams AG, which designs andmanufactures advanced sensor solutions for applications requiring small form factor, low power, highest sensitivity, and multi-sensor integration, is part ofthe data deluge theme. The company’s share price fell by more than half during the fourth quarter, as the stock tends to trade sympathetically withiPhone orders. Increased trade tensions placed further challenges in front of the company. Fund management is drawn to the company for its position inthe growing 3D sensor market. ams AG chips are required for facial recognition, factory process automation, and augmented reality applications. The nexttwo largest detractors in the quarter were auto related stocks from within the consumer discretionary sector – Valeo SA and Continental AG. Bothcompanies’ share prices declined as investors reacted negatively to trade rhetoric and fears of a global slowdown. Fund management believes bothcompanies are well positioned as automobiles become more complex and utilize components that are more expensive.
Fund management feels the current market volatility is nothing more than a mid-cycle slowdown and remains bullish on the long-term growth prospectsof portfolio companies.
TICKER: MIEDX Inception: 10/3/1994Morningstar Category: Foreign Large Growth
Average Annual Total Return
Q T D Y T D 1 Year 3 Year 5 Year 10 year
MassMutual Premier International Eq R5 -14.72% -19.55% -19.55% -0.22% -0.99% 7.93%
MSCI ACWI Ex USA Index -11.46% -14.20% -14.20% 4.48% 0.68% 6.57%
Category Average Return -- -- -14.08% 3.21% 1.38% 7.43%
Category Rank -- -- 94 97 90 35
# of Funds in Category -- -- 439 364 315 228
Performance shown is for class R5 shares. Gross expenses = 1.07%, Net expense = 1.07%. Current performance may be higher or lower. Max Sales chargefor R5 is 0%Performance shown is past performance. Past performance does not guarantee future results . You can lose money, includingloss of pr incipal , by invest ing in this fund. Investors should careful ly consider investment objectives, r isks , charges andexpenses. This and other important information is contained in the fund prospectuses and summary prospectuses, which can beobtained from www.massmutualfunds.com and should be read careful ly before invest ing. A l ist of the Fund’s holdings can alsobe obtained from www.massmutualfunds.com. Current performance may be lower or higher than return data quoted herein. Formore current information, including month-end performance, please cal l 1-866-444-2601.Investment Risks - The Fund’s Princ ipa l R isks include - Cash Position Risk, Convertible Securities Risk, Derivatives Risk, Equity Securities Risk, ForeignInvestment Risk; Emerging Markets Risk; Currency Risk, Geographic Focus Risk, Growth Company Risk, Large Company Risk, Liquidity Risk, ManagementRisk, Market Risk, Preferred Stock Risk, Small and Mid-Cap Company Risk, and Valuation Risk. Please refer to the summary prospectus (a copy can beobtained by sending an email to [email protected]) for more information on the specific risks.You cannot invest directly in an index. The Morningstar percenti le ranking is based on the fund’s total-return percenti le rank relat iveto al l funds that have the same category for the same t ime period. The highest (or most favorable) percentile rank is 1%, and the lowest (orleast favorable) percentile rank is 100%. Morningstar total return includes both income and capital gains or losses and is not adjusted for sales charges. ©2019 Morningstar, Inc. All Rights Reserved. The information contained herein: (1) is proprietary to Morningstar and/or its content providers; (2) may not becopied or distributed; and (3) is not warranted to be accurate, complete or timely. Neither Morningstar nor its content providers are responsible for anydamages or losses arising from any use of this information.
MassMutual Premier International Equity Fund
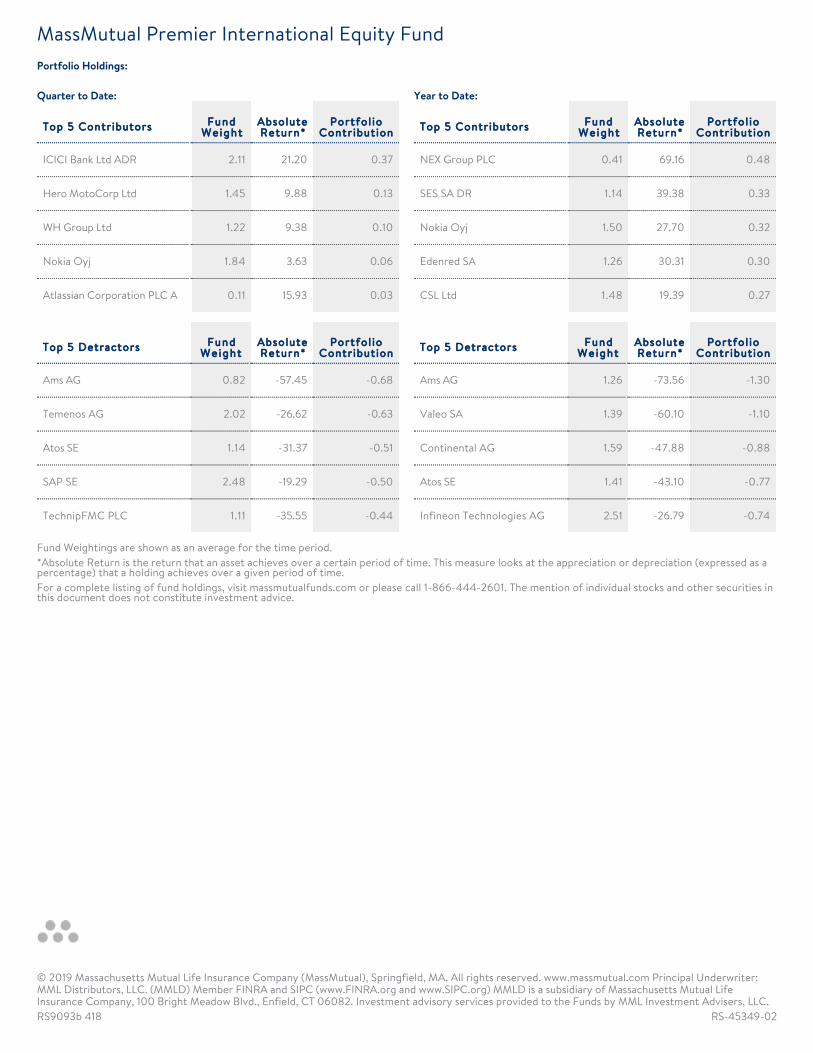
Quarter to Date:
Top 5 Contributors F u n dW e i g h t
AbsoluteReturn*
Portfol ioContr ibut ion
ICICI Bank Ltd ADR 2.11 21.20 0.37
Hero MotoCorp Ltd 1.45 9.88 0.13
WH Group Ltd 1.22 9.38 0.10
Nokia Oyj 1.84 3.63 0.06
Atlassian Corporation PLC A 0.11 15.93 0.03
Top 5 Detractors F u n dW e i g h t
AbsoluteReturn*
Portfol ioContr ibut ion
Ams AG 0.82 -57.45 -0.68
Temenos AG 2.02 -26.62 -0.63
Atos SE 1.14 -31.37 -0.51
SAP SE 2.48 -19.29 -0.50
TechnipFMC PLC 1.11 -35.55 -0.44
Year to Date:
Top 5 Contributors F u n dW e i g h t
AbsoluteReturn*
Portfol ioContr ibut ion
NEX Group PLC 0.41 69.16 0.48
SES SA DR 1.14 39.38 0.33
Nokia Oyj 1.50 27.70 0.32
Edenred SA 1.26 30.31 0.30
CSL Ltd 1.48 19.39 0.27
Top 5 Detractors F u n dW e i g h t
AbsoluteReturn*
Portfol ioContr ibut ion
Ams AG 1.26 -73.56 -1.30
Valeo SA 1.39 -60.10 -1.10
Continental AG 1.59 -47.88 -0.88
Atos SE 1.41 -43.10 -0.77
Infineon Technologies AG 2.51 -26.79 -0.74
RS9093b 418 RS-45349-02
Portfolio Holdings:
Fund Weightings are shown as an average for the time period.*Absolute Return is the return that an asset achieves over a certain period of time. This measure looks at the appreciation or depreciation (expressed as apercentage) that a holding achieves over a given period of time.For a complete listing of fund holdings, visit massmutualfunds.com or please call 1-866-444-2601. The mention of individual stocks and other securities inthis document does not constitute investment advice.
© 2019 Massachusetts Mutual Life Insurance Company (MassMutual), Springfield, MA. All rights reserved. www.massmutual.com Principal Underwriter:MML Distributors, LLC. (MMLD) Member FINRA and SIPC (www.FINRA.org and www.SIPC.org) MMLD is a subsidiary of Massachusetts Mutual LifeInsurance Company, 100 Bright Meadow Blvd., Enfield, CT 06082. Investment advisory services provided to the Funds by MML Investment Advisers, LLC.
MassMutual Premier International Equity Fund

THIS PAGE INTENTIONALLY LEFT BLANK