Embed Size (px)
Citation preview

Rosalie BrownRosalie Brown
Paul BarrettPaul Barrett

♦ When scoring non-applicants or applicants on a personality questionnaire it isassumed that the psychometric structure of the questionnaire is the sameacross the two groups
♦ Therefore, what is being measured is the same construct - in the case of mostpersonality questionnaires this would the the factor structure
♦ The structure will be defined by the items that load onto a scale and therelationships and correlations between the scales
♦ If we take as given that the assumption holds for applicant and non-applicantdata then we accept that the groups may differ on the score level achieved
♦ There is an assumption that a candidate has a true score
♦ But, do applicants distort their responses? Research evidence suggests yes.

♦ The raising or enhancing of scores has been extensively studied. Edward’s(1959) Personal Preference Schedule (EPPS) - (Borislow, 1958; Dicken, 1959;Stollack, 1965; and Orpen 1971). California Psychological Inventory (CPI) -Dicken, 1960; Canter 1963; and Johnson 1986. A customised personalityinventory designed for the army - Hough et al 1985. All demonstrated thatpeople could consciously enhance self-image.
♦ Research evidence supports the belief that respondents can consciouslydissemble on personality inventories in the selection context. (Wesman, 1952,Orpen, 1971, Hough et al 1985).
♦ According to Paulhus (1984, 1986) faking can occur when a respondentanswers in a positively biased way and actually through self-deceptionbelieves their responses are true. Paulhus draws a distinction between thisand impression management which is defined as conscious dissimulation.Studies support this distinction, (Jackson & Messick 1962, Wiggins 1964,Paulhus 1984, Barrick & Mount 1996)

♦ Hough et al (1985) conducted a rigorous study, which was a repeated-measure, counterbalanced design where faking good was trying to get into thearmy and faking bad was attempting to fail selection. It was found that:
(a) when instructed, soldiers could distort their responses
(b) distorted protocols could be detected with a validity key; but
(c) regular army applicants did not distort their responses.
It was concluded that “intentional distortion does not appear to be a problemin an applicant setting”.
♦ Barrick & Mount (1996) examined whether self-deception and impressionmanagement affects the predictive validity of two of the “Big Five”personality dimensions, conscientiousness and emotional stability, in 2applicant samples.
Results from structural equation modelling indicated that scores on bothdimensions were distorted by both response styles. However, neither type ofdistortion attenuated the predictive validity of either personality construct.

♦ How can it not matter if people distort their responses?
♦ In the case of the studies mentioned above (predictive validity) thenperhaps it does not matter! However, this point will be revisited later byexamining some of the conditions that may apply.
♦ If we examine the way most personality tests are used, i.e. normreferencing (Brown 1999), then yes it will matter if the wrong norm groupis used i.e. applicants to non-applicants.

A
B C E
F
G H
I
L M
N O
Q1
Q2
Q3
Q4
IMA
B
C E F
G
H I
L
M
N
O
Q1
Q2
Q3 Q4 IM
0
1
2
3
4
5
6
7
8
9
10
A B C E F G H I L M N O Q1 Q2 Q3 Q4 IM
16PF-5 SCALES
ST
ENS
App UK
N_App UK
16PF-5 Profiles for UK Applicant (N=506) and the UK Non-Applicant (589) samples compared tothe UK ASE standardization population (British Adults)

A
B
C
E
F
G
H
I
L
M
N O
Q1
Q2
Q3
Q4
IM
A
B
C
E
F
G
H
I
L
M
N
O Q1
Q2
Q3
Q4
IM
0
1
2
3
4
5
6
7
8
9
10
A B C E F G H I L M N O Q1 Q2 Q3 Q4 IM
16PF-5 SCALES
ST
EN
SApplicant compared to 506 UK Applicants
Applicant compared to 589 UK Non-Applicants
16PF-5 Profiles for a single applicant compared to the UK Applicant (N=506) and theUK Non-Applicant (589) samples

♦ When candidates distort their responses, this can be systematicsystematic in that scalescores are elevated by some constant across all candidates (everybody tends toincrease their scores say on conscientiousness). This kind of distortion has noeffect upon the affected trait scale score and some criterion - and is a possibleexplanation for the Barrick and Mount result (distortion yet equivalentpredictive validity - an example is below).
♦ Alternatively, the distortion may be non-systematicnon-systematic, with certain candidatesobtaining elevated scores whilst others remain static. This kind of distortionhas unpredictable consequences upon trait-criterion correlations. An examplebelow shows what happens when “true low-scorers on conscientiousness” tendto fake-good at a rate relative to the size of their low scores, whilst average tohigh scorers maintain their “true” score.

Systematic Variation: Hypothetical Applicant and Non-Applicant Data Correlation between Job Criterion score in each group = 0.52
Conscientiousness Sten score
Job
Cri
teri
on S
core
0
2
4
6
8
10
12
14
0 1 2 3 4 5 6 7 8 9 10
Non-Applicants
Applicants

Non-Systematic Distortion of Conscientiousness scores (Faking Good)
Non-Applicant correlation = 0.52, Applicant Correlation = -0.08
Conscientiousness Sten Score
Job
Cri
teri
on S
core
0
2
4
6
8
10
12
14
0 1 2 3 4 5 6 7 8 9 10
Non-Applicants
Applicants

♦ What happens if the assumptions made on slide one do not hold and thestructure is different for the two groups?
♦ Then what’s being measured for both groups is not really the same any more
♦ Is there any evidence to support this?
♦ Schmit & Ryan (1993)
♦ This alerted us to a potential problem

♦ What degree of factor similarity exists between applicant and non-applicantpersonality test data?
♦ That is, if the difference between samples are only ones of “score level” andnot of “psychometric structure” (level vs structure), then we should be seeingvirtual identity between factor solutions within each sample.
♦ The answer to the above question was achieved by examining the data from awidely used questionnaire with an explicit and relatively unambiguous factorstructure.Our thanks to NFER-NELSON, the publishers, for providing the UK 16PF5 IntercorrelationMatrix

♦ UK ASE N=1575 Non-Applicants mixed-gender correlation matrix
♦ US IPAT N=2500 Non-Applicants mixed-gender correlation matrix
♦ UK N=589 Non-Applicants mixed-gender correlation matrix
♦ UK N=506 Applicants mixed-gender correlation matrix
Sample Data for the 16PF5 Analyses
Statistical Analyses
♦ MINRES exploratory common factor analysis (5 factors extracted)
♦ Hyperplane-maximised Direct Oblimin Rotation and Varimax Rotations
♦ Modified Kaiser-Hunka-Bianchini congruential factor comparison
Factor 1 Factor 2 Factor 3 Factor 4 Factor 5Factor 1 .9905 -.0622 -.1151 .4009 -.3575Factor 2 -.0617 .9388 -.1318 .1977 .3587Factor 3 -.1100 -.1269 .9821 -.1218 .1343Factor 4 .3961 .1968 -.1260 .9731 -.0619Factor 5 -.3613 .3653 .1420 -.0633 .9623
Comparing the UK ASE Varimax Target Matrix to the maximally congruentUK Non-Applicant matrix. The factor order is:Factor 1: ExtraversionFactor 2: Self-ControlFactor 3: Tough MindedFactor 4: AnxietyFactor 5: Independence
The numbers in the matrix are factor congruence coefficients - interpreted inthe same way as correlation coefficients.

Comparing the UK ASE Varimax Target Matrix to the maximally congruentUK Applicant matrix. The factor order is:Factor 1: ExtraversionFactor 2: Self-ControlFactor 3: Tough MindedFactor 4: AnxietyFactor 5: Independence
The numbers in the matrix are factor congruence coefficients - interpreted inthe same way as correlation coefficients.
Factor 1 Factor 2 Factor 3 Factor 4 Factor 5Factor 1 .9493 .0025 -.1352 .4397 -.4656Factor 2 .0027 .9527 -.0458 .2025 .3497Factor 3 -.1438 -.0453 .9618 -.2052 .1498Factor 4 .4075 .1745 -.1788 .9471 .0740Factor 5 -.4942 .3451 .1495 .0847 .8075

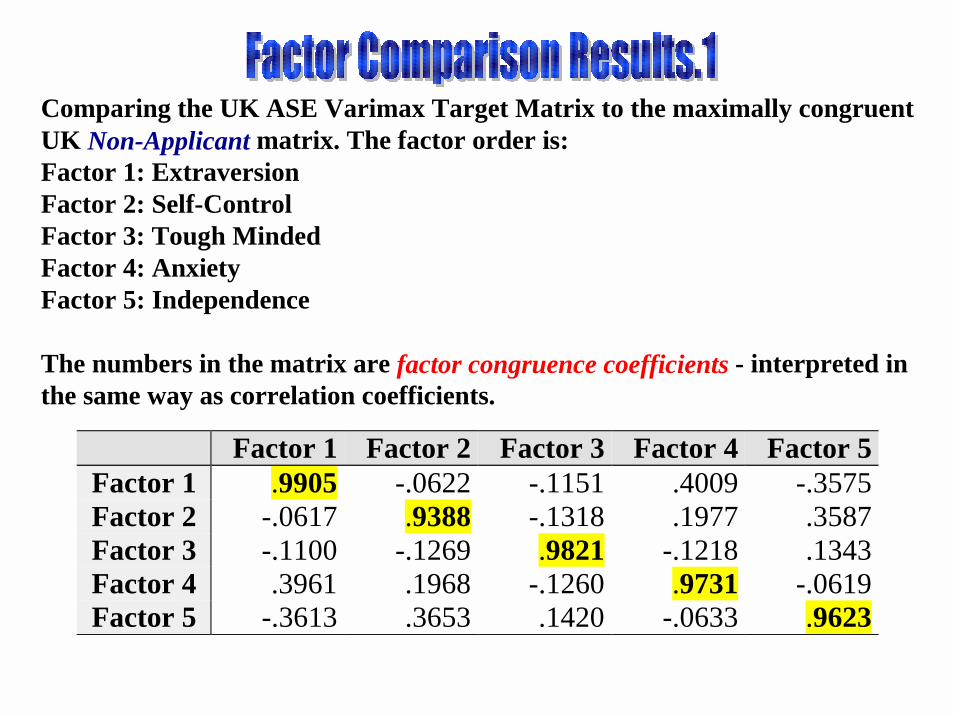
•Figures in bracketsare the US matrix
loadings reported inTable 1.3,p.14, of theUS Technical Manual
•Loadings less than[0.3] are left blank
•Figures in bracketsare the US matrix
loadings reported inTable 1.3,p.14, of theUS Technical Manual
•Loadings less than[0.3] are left blank
Fact o r Pat t ern Lo adings fro m explo rato ry MINRES co m m o n facto r analysesand Ort ho gonal Pro custes ro tat io ns
UK/US Non App AppA .62 (.74) .57 .69C .30EF .66 (.70) .71 .47GH .58 (.44) .59 .46ILMN -.51 (-.67) -.51O
Q1Q2 -.69 (-.81) -.67 -.37Q3Q4
•Figures in bracketsare the US matrix
loadings reported inTable 1.3,p.14, of theUS Technical Manual
•Loadings less than[0.3] are left blank
•Figures in bracketsare the US matrix
loadings reported inTable 1.3,p.14, of theUS Technical Manual
•Loadings less than[0.3] are left blank
U K/U S N on App AppACEF (-.39)G .64(.78) .65 .64HILM -.50 (-.58) -.44 -.46NO
Q 1Q 2Q 3 .64 (.82) .58 .71Q 4
Fact o r Pat t ern Lo adings fro m explo rato ry MINRES co m m o n facto r analysesand Ort ho gonal Pro custes ro tat io ns

•Figures in bracketsare the US matrix
loadings reported inTable 1.3,p.14, of theUS Technical Manual
•Loadings less than[0.3] are left blank
•Figures in bracketsare the US matrix
loadings reported inTable 1.3,p.14, of theUS Technical Manual
•Loadings less than[0.3] are left blank
UK/US Non App AppA -.33 (-.35) -.33C .52 .46 .51E .50 .44 .40FGH .32 .30I -.61 (-.75) -.43 -.39LM (-.39)NO -.67 -.65 -.58
Q1 (-.68)Q2Q3Q4
Fact o r Pat t ern Lo adings fro m explo rato ry MINRES co m m o n facto r analysesand Ort ho gonal Pro custes ro tat io ns

•Figures in bracketsare the US matrix
loadings reported inTable 1.3,p.14, of theUS Technical Manual
•Loadings less than[0.3] are left blank
•Figures in bracketsare the US matrix
loadings reported inTable 1.3,p.14, of theUS Technical Manual
•Loadings less than[0.3] are left blank
UK/US Non App AppAC -.49 (-.70) -.52EFGHIL .57 (.57) .63 .62M .35 .31NO .36 (.76) .39
Q1Q2Q3Q4 .50 (.86) .39 .37
Fact o r Pat t ern Lo adings fro m explo rato ry MINRES co m m o n facto r analysesand Ort ho gonal Pro custes ro tat io ns

•Figures in bracketsare the US matrix
loadings reported inTable 1.3,p.14, of theUS Technical Manual
•Loadings less than[0.3] are left blank
•Figures in bracketsare the US matrix
loadings reported inTable 1.3,p.14, of theUS Technical Manual
•Loadings less than[0.3] are left blank
UK/US Non App AppACE .49 (.87) .35 .54FGH .36 (.43) .33IL (.31)M .34 .37NO
Q1 .60 (.49) .65 .50Q2Q3Q4
Factor Pat t ern Loadings from exploratory MINRES com m on factor analysesand Orthogonal Procustes ro tat io ns

♦ Whilst the above is based upon a set of maximally congruent rotations to atarget Varimax UK ASE dataset, and is optimal within the orthogonalityconstraints, it can be argued that the actual US target matrix, from which thesecond-order or global factor score coefficients were drawn, represents themore optimal target matrix. This factor matrix represents the output from anoblique rotation, and its factors are correlated.
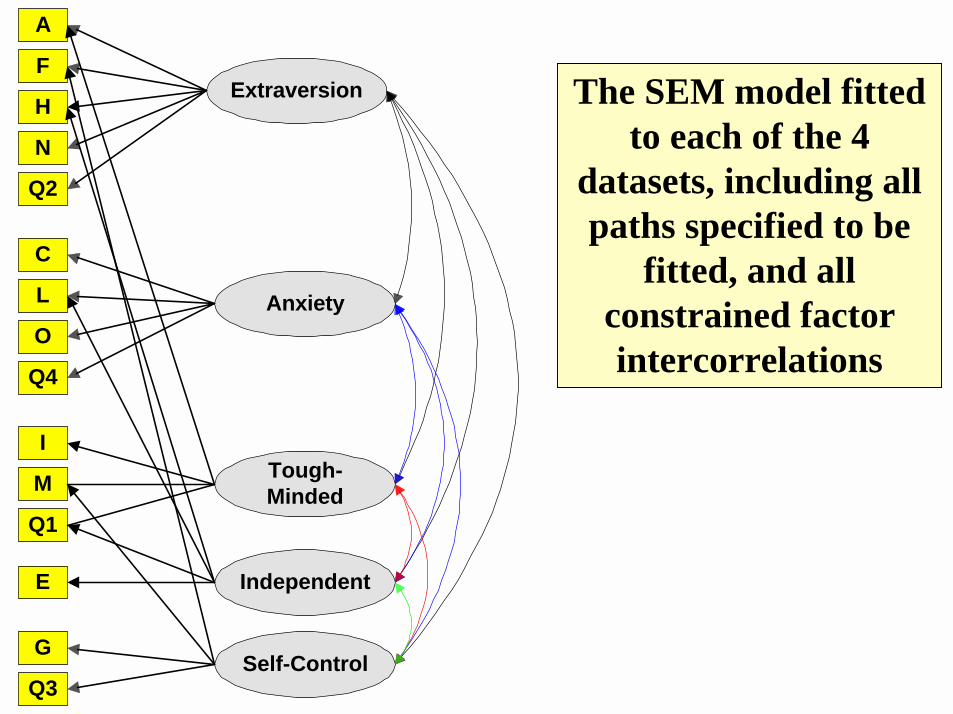
♦ There are two options for analysis. The first is a simple congruence coefficientanalysis between factor vectors from this target matrix and other obliquelyrotated matrix factors. However, this leaves open the possibility of bad-fit dueto rotational transformation differences alone. The alternative is to adopt astructural equation modelling (SEM) analysis, used in this case as an efficientoblique procrustes (target-fit) procedure that permits the specification ofexpected factor correlations as well as loadings.
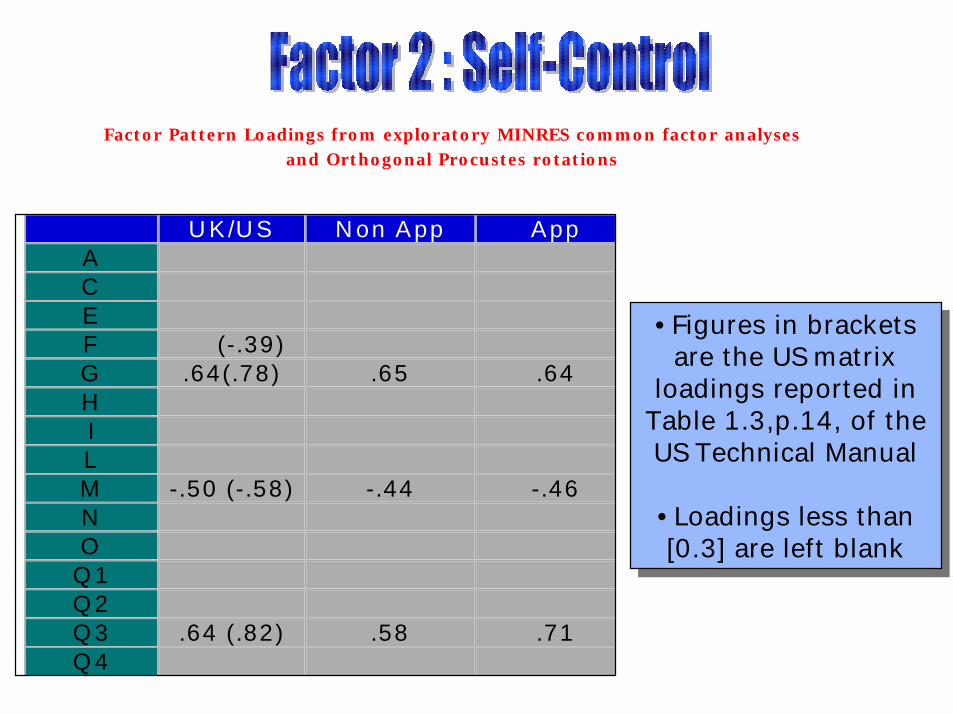
♦ The target factor pattern used was that given in the US Technical manual tothe test, in Table 1.3, p. 14 of the manual. Paths to be estimated in each of 4data matrices were those whose factor loadings were greater than 0.3 in thistarget matrix. All other loadings were set to 0.0.
♦ Target factor correlations were taken from Appendix 1B in the TechnicalManual. These correlation values were used as pre-specified constraints foreach SEM solution. For comparison purposes, completely standardizedsolutions were computed from 4 data matrices.
A
C
Q2
N
H
F
I
Q4
O
L
Q1
M
Q3
G
E
Extraversion
Anxiety
Tough-Minded
Independent
Self-Control
The SEM model fittedto each of the 4
datasets, including allpaths specified to be
fitted, and allconstrained factorintercorrelations

Facto r Pat t ern Lo adings fro m SEPATH Structural Equat io n Mo delling so lut io nsUS1 : US (N=3 4 9 8 ) REPORTED IN TABLE 1 .3 , P.1 4 OF THE US TECHNICAL MANUAL
US2 : US (N=2 5 0 0 ) 1 6 PF-5 NORM DATA CORR. MATRIX (APP 5 B, P9 4 US TECHNICAL MANUAL)UK: UK 1 6 PF-5 REFERENCE SAMPLE
NON-APP: THE NON-APPLICANT SAMPLE (N=5 8 9 )APP: THE APPLICANT SAMPLE (N=5 0 6 )
U S 1 U S 2 U K N o nA p p
A p p
A .74 .61 .56 .56 .49CEF .70 .57 .63 .65 .53GH .44 .51 .53 .51 .46ILMN -.67 -.51 -.54 -.55 -.36O
Q 1Q 2 -.81 -.69 -.67 -.68 -.60Q 3Q 4

•Shaded loadingsrepresent moderate to
serious departuresfrom the expected
values
•Shaded loadingsrepresent moderate to
serious departuresfrom the expected
values
Facto r Pat t ern Lo adings fro m SEPATH Structural Equat io n Mo delling so lut io nsUS1 : US (N=3 4 9 8 ) REPORTED IN TABLE 1 .3 , P.1 4 OF THE US TECHNICAL MANUAL
US2 : US (N=2 5 0 0 ) 1 6 PF-5 NORM DATA CORR. MATRIX (APP 5 B, P9 4 US TECHNICAL MANUAL)UK: UK 1 6 PF-5 REFERENCE SAMPLE
NON-APP: THE NON-APPLICANT SAMPLE (N=5 8 9 )APP: THE APPLICANT SAMPLE (N=5 0 6 )
U S1 U S2 U K N onA pp
A pp
AC -.70 -.86 -.80 -.78 -.68EFGHIL .57 .54 .47 .45 .24MNO .76 .67 .62 .63 .60
Q 1Q 2Q 3Q 4 .86 .51 .44 .41 .43

•Shaded loadingsrepresent moderate to
serious departuresfrom the expected
values
•Shaded loadingsrepresent moderate to
serious departuresfrom the expected
values
Facto r Pat t ern Lo adings fro m SEPATH Structural Equat io n Mo delling so lut io nsUS1 : US (N=3 4 9 8 ) REPORTED IN TABLE 1 .3 , P.1 4 OF THE US TECHNICAL MANUAL
US2 : US (N=2 5 0 0 ) 1 6 PF-5 NORM DATA CORR. MATRIX (APP 5 B, P9 4 US TECHNICAL MANUAL)UK: UK 1 6 PF-5 REFERENCE SAMPLE
NON-APP: THE NON-APPLICANT SAMPLE (N=5 8 9 )APP: THE APPLICANT SAMPLE (N=5 0 6 )
U S 1 U S 2 U K N onA pp
A pp
A -.35 -.11 -.49 -.40 -.37CEFGHI -.75 -.30 -.72 -.61 -.85LM -.39 -.24 -.21 -.16 -.15NO
Q 1 -.68 -.93 -.34 -.45 -.15Q 2Q 3Q 4

•Shaded loadingsrepresent moderate to
serious departuresfrom the expected
values
•Shaded loadingsrepresent moderate to
serious departuresfrom the expected
values
Facto r Pat t ern Lo adings fro m SEPATH Structural Equat io n Mo delling so lut io nsUS1 : US (N=3 4 9 8 ) REPORTED IN TABLE 1 .3 , P.1 4 OF THE US TECHNICAL MANUAL
US2 : US (N=2 5 0 0 ) 1 6 PF-5 NORM DATA CORR. MATRIX (APP 5 B, P9 4 US TECHNICAL MANUAL)UK: UK 1 6 PF-5 REFERENCE SAMPLE
NON-APP: THE NON-APPLICANT SAMPLE (N=5 8 9 )APP: THE APPLICANT SAMPLE (N=5 0 6 )
U S 1 U S 2 U K N o nA p p
A p p
ACE .8 7 .7 8 .7 9 .5 8 .6 5FGH .4 3 .3 7 .4 3 .4 6 .4 0IL .3 1 .2 2 .3 2 .1 9 .1 7MNO
Q 1 .4 9 .3 9 .4 3 .4 5 .5 6Q 2Q 3Q 4

•Shaded loadingsrepresent moderate to
serious departuresfrom the expected
values
•Shaded loadingsrepresent moderate to
serious departuresfrom the expected
values
Facto r Pat t ern Lo adings fro m SEPATH Structural Equat io n Mo delling so lut io nsUS1 : US (N=3 4 9 8 ) REPORTED IN TABLE 1 .3 , P.1 4 OF THE US TECHNICAL MANUAL
US2 : US (N=2 5 0 0 ) 1 6 PF-5 NORM DATA CORR. MATRIX (APP 5 B, P9 4 US TECHNICAL MANUAL)UK: UK 1 6 PF-5 REFERENCE SAMPLE
NON-APP: THE NON-APPLICANT SAMPLE (N=5 8 9 )APP: THE APPLICANT SAMPLE (N=5 0 6 )
U S 1 U S 2 U K N o nA p p
A p p
ACEF -.39 -.39 -.40 -.29 -.25
G .78 .77 .69 .79 .66HILM -.58 -.49 -.53 -.41 -.49NO
Q 1Q 2Q 3 .82 .47 .56 .46 .70Q 4

The global factor scores
P. 14, 1st para., US Technical manual, “global factor equations were developedusing only those primary scales having a loading of .30 or greater …”
Extraversion = .3A + .3F + .2H - .3N - .3Q2Anxiety = -.4C + .3L + .4O + .4Q4 Tough Minded = -.2A - .5I - .3M - .5Q1Independence = .6E + .3H + .2L + .3Q1Self-Control = -.2F + .4G - .3M + .4Q3
Extraversion = .3A + .3F + .2H - .3N - .3Q2Anxiety = -.4C + .4O + .4Q4 Tough Minded = -.2A - .5IIndependence = .6E + .3H + .3Q1Self-Control = .4G - .3M + .4Q3
From Table 1.4, p.16,US Technical manual
From the UKapplicant datasetSEM analysis

♦ These results from the 16PF5 and the results from the Schmit & Ryanstudy using the Costa and McCrae NEO test, provide a fairly strong casethat there is a real problem - in that there is a difference in factorstructure across applicant and non-applicant groups. This has a very realpractical consequence when using any form of scoring based upon factorloading weights (either as unit or fractional-weight identifiers).
♦ If candidate distortion changes the nature of the relationships between keyvariables in a test, then how do we assign scores, honestlyhonestly, whose meaningis predicated upon such assumed relationships?

♦ For us it is now seems mandatory, as far as test publishers areconcerned, that all commercial questionnaires should be subjected to thesame kind of structural psychometric analysis as outlined above. Theconditions for invariance are the least constrained, relying upon asensible view of factorial invariance and measurement.
♦ It might be argued that, on the basis of the available evidence, for testpublishers not to ensure their test scoring is equally applicable to bothcandidate and non-candidate data is tantamount to negligence, and assuch, open to an appropriate challenge by aggrieved candidates if suchtests are used or interpreted in any way within a selection exercise. Itmay be that we have stumbled upon the only two tests to show theseeffects, the NEO and 16PF5. Perhaps not. This is an empirical problem.

♦ Let’s be very clear about the issue here. It is not that the traits measured bythe 16PF5 (or say the NEO) do not exist in candidates, but that the mannerof their responding means that the rules by which we would identify say“Tough-mindedness” in these candidates no longer hold for them as agroup. If we persist in using their responses as though the rules still held,then we are assigning scores which may no longer be legally defensible.
Http://www.liv.ac.uk/~pbarrett/present.htm