Embed Size (px)
Citation preview

ROSCOMMON COUNTY COUNCIL Comhairle Chontae Roscomáin
ROSCOMMON LANDFILL ENVIRONMENTAL MONITORING
Annual Environmental Report 2009
March 2010 MGE0016CR0010
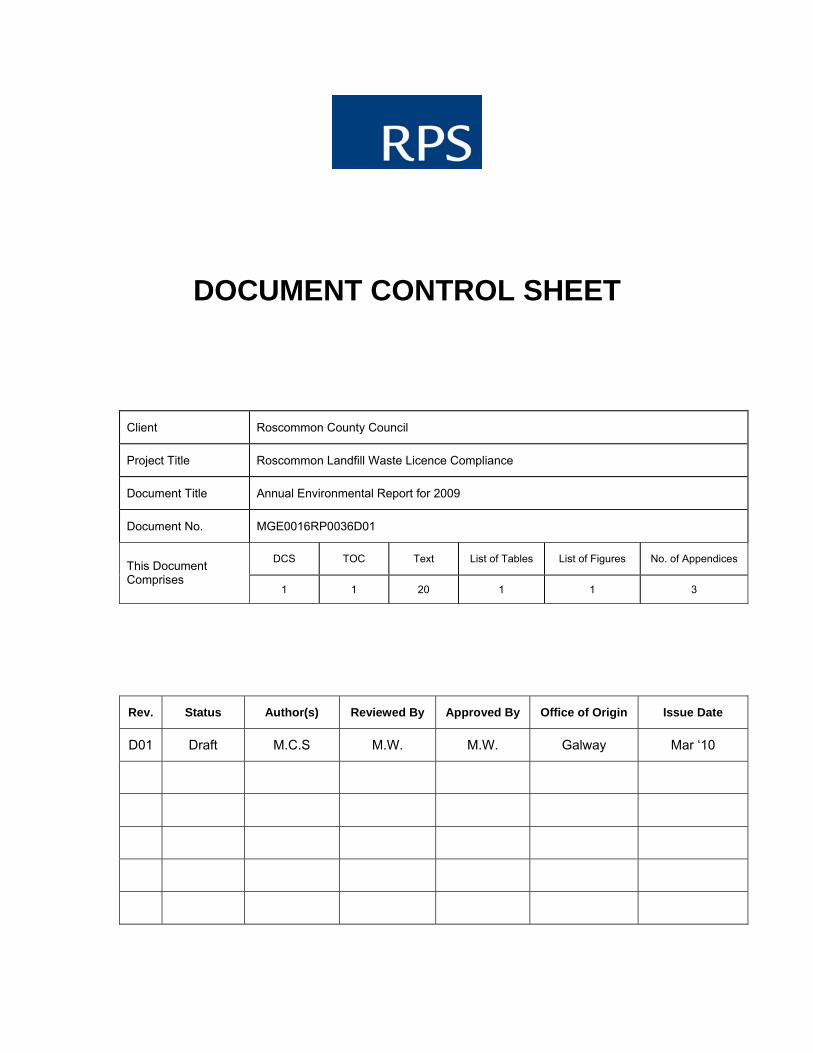
DOCUMENT CONTROL SHEET
Client Roscommon County Council
Project Title Roscommon Landfill Waste Licence Compliance
Document Title Annual Environmental Report for 2009
Document No. MGE0016RP0036D01
DCS TOC Text List of Tables List of Figures No. of Appendices This Document Comprises
1 1 20 1 1 3
Rev. Status Author(s) Reviewed By Approved By Office of Origin Issue Date
D01 Draft M.C.S M.W. M.W. Galway Mar ‘10
Roscommon Landfill Waste Licence Compliance - AER 2009 Waste Licence W0073-01
MGE0016RP0036 Rev D01 i
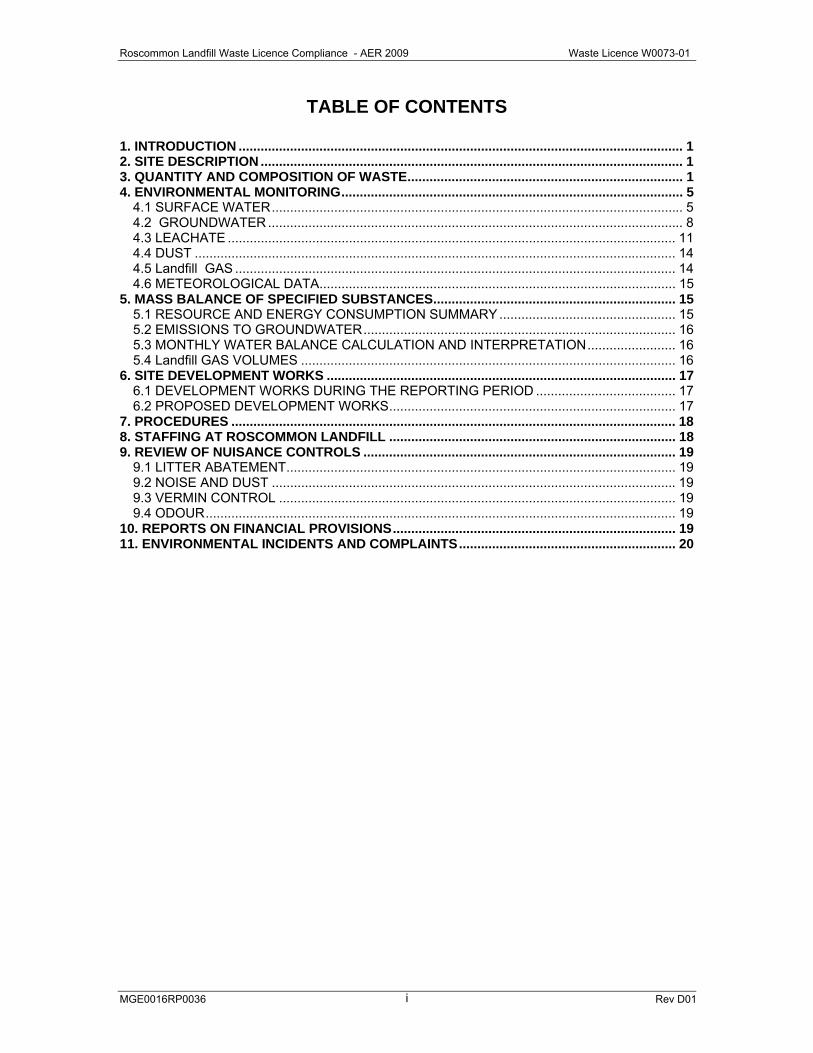
TABLE OF CONTENTS
1. INTRODUCTION ......................................................................................................................... 1 2. SITE DESCRIPTION ................................................................................................................... 1 3. QUANTITY AND COMPOSITION OF WASTE........................................................................... 1 4. ENVIRONMENTAL MONITORING............................................................................................. 5
4.1 SURFACE WATER................................................................................................................ 5 4.2 GROUNDWATER ................................................................................................................. 8 4.3 LEACHATE .......................................................................................................................... 11 4.4 DUST ................................................................................................................................... 14 4.5 Landfill GAS ........................................................................................................................ 14 4.6 METEOROLOGICAL DATA................................................................................................. 15
5. MASS BALANCE OF SPECIFIED SUBSTANCES.................................................................. 15 5.1 RESOURCE AND ENERGY CONSUMPTION SUMMARY................................................ 15 5.2 EMISSIONS TO GROUNDWATER..................................................................................... 16 5.3 MONTHLY WATER BALANCE CALCULATION AND INTERPRETATION........................ 16 5.4 Landfill GAS VOLUMES ...................................................................................................... 16
6. SITE DEVELOPMENT WORKS ............................................................................................... 17 6.1 DEVELOPMENT WORKS DURING THE REPORTING PERIOD ...................................... 17 6.2 PROPOSED DEVELOPMENT WORKS.............................................................................. 17
7. PROCEDURES ......................................................................................................................... 18 8. STAFFING AT ROSCOMMON LANDFILL .............................................................................. 18 9. REVIEW OF NUISANCE CONTROLS ..................................................................................... 19
9.1 LITTER ABATEMENT.......................................................................................................... 19 9.2 NOISE AND DUST .............................................................................................................. 19 9.3 VERMIN CONTROL ............................................................................................................ 19 9.4 ODOUR................................................................................................................................ 19
10. REPORTS ON FINANCIAL PROVISIONS............................................................................. 19 11. ENVIRONMENTAL INCIDENTS AND COMPLAINTS........................................................... 20
Roscommon Landfill Waste Licence Compliance - AER 2009 Waste Licence W0073-01
MGE0016RP0036 Rev D01 ii
LIST OF FIGURES Figure 3.1 Waste Intake for 2008 Figure 3.2 Waste Intake for Years Prior to Reporting Period Figure 4.1 Mean Concentrations of Key Parameters in Surface Water for the Reporting
Period Figure 4.2 Ammonia Levels in Groundwater for the Reporting Period Figure 4.3 Mean Concentrations of Key Parameters of Leachate for the Reporting
Period Figure 4.4 BOD/COD Ratio in Leachate over the Reporting Period Figure 4.5 Summary of Mean Concentrations of Main Components of Landfill Gas Figure 4.6 Monthly Rainfall Data for 2008 from Knock Weather Station Figure 5.1 Total Gas Generation from Roscommon Landfill
LIST OF TABLES Table 3.1 Quantity and Composition of Waste Received for Recovery in 2008 Table 3.2 Total Estimated Waste Intake at Roscommon Landfill Table 4.1 Comparison of Typical Leachate Composition Values and Values at
Roscommon Landfill Table 8.1 Site Management Structure at Roscommon Landfill
LIST OF APPENDICES APPENDIX A SITE LAYOUT LOCATIONS OF MONITORING POINTS
(DG0001-01F08) APPENDIX B MONITORING RESULTS APPENDIX C METEOROLOGICAL DATA
Roscommon Landfill Waste Licence Compliance - AER 2009 Waste Licence 0073-01
MGE0016RP0036 Rev D01 1
1. INTRODUCTION Roscommon Landfill is operated by Roscommon County Council in accordance with Waste
Licence Register No. W0073-01 issued by the EPA. In accordance with Condition 5.2 of the
Licence, acceptance of waste for disposal at the landfill ceased on December 31st 2001. The
reporting period for the purposes of this Annual Environmental Report (AER) is January 1st 2009
to December 31st 2009.
This Annual Environmental Report (AER) has been prepared in accordance with the conditions
of the Waste Licence and the EPA “Draft Guidance on Environmental Management Systems
and Reporting to the Agency, 1999”.
2. SITE DESCRIPTION Roscommon Landfill is located in the townland of Killarney, approximately 3km north east of
Roscommon town on the N63 Longford Road. The total area of waste covers an area of
approximately 5 hectares. Landfilling commenced at this location in the early 1970’s. The
landfill has always operated on a “dilute and disperse” principle. Initially filling of the landfill took
place in the area between the road and the present culvert. In 1981, filling commenced to the
south and the west of this culverted stream. A halting site was built at the facility in 1980.
Landfilling at the facility ceased on December 31st 2001. When the landfill was active the
principal activity was the deposit of domestic, commercial and industrial non-hazardous waste.
It is estimated that up to 170,000 tonnes of waste were deposited at the site over its lifetime. A
Recycling Centre is in operation at the site which accepts recyclables such as paper, glass and
cardboard (see Table 3.1). Domestic waste is also accepted for disposal which is transferred to
Ballaghaderreen Landfill.
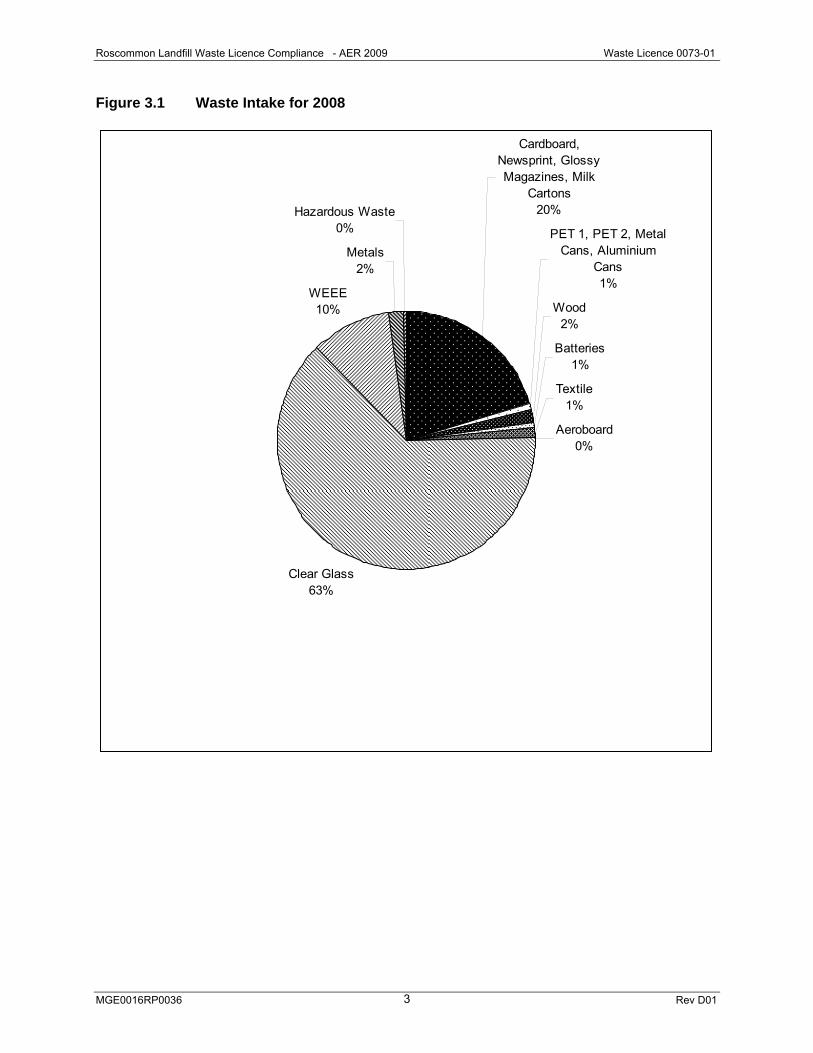
3. QUANTITY AND COMPOSITION OF WASTE Table 3.1 and Figure 3.1 outline the quantities of waste accepted for recovery during the
reporting period at the Recycling Centre. A total of 1,627.7 tonnes of material was recovered in
2009. The total amount of material accepted for recycling in 2008 at the Recycling Centre
Roscommon Landfill Waste Licence Compliance - AER 2009 Waste Licence 0073-01
MGE0016RP0036 Rev D01 2
amounted to 876.56 tonnes. Therefore in 2009 there was a 46.1% increase in the amount of
waste recycled at the Recycling Centre in comparison with 2008. The waste is collected for
recycling by Rehab, KMK Metals Recycling Ltd. (WO 113-02), Indaver (WO 36-02), Textiles
Recycling Ltd, Airpack and Barna Waste. Rehab collect glass, KMK Metals collect WEEE
waste, Textile Recycling Ltd. collect textiles and Indaver collect household hazardous waste.
Barna Waste collect all other waste.
Table 3.2 and Figure 3.2 provide figures for the total tonnage of waste accepted for disposal in
previous years. These figures regarding waste intake at the facility are highly approximate as
there was no weighbridge on site until shortly before closure in 2001. Data on the composition
of the waste for these years is unavailable.
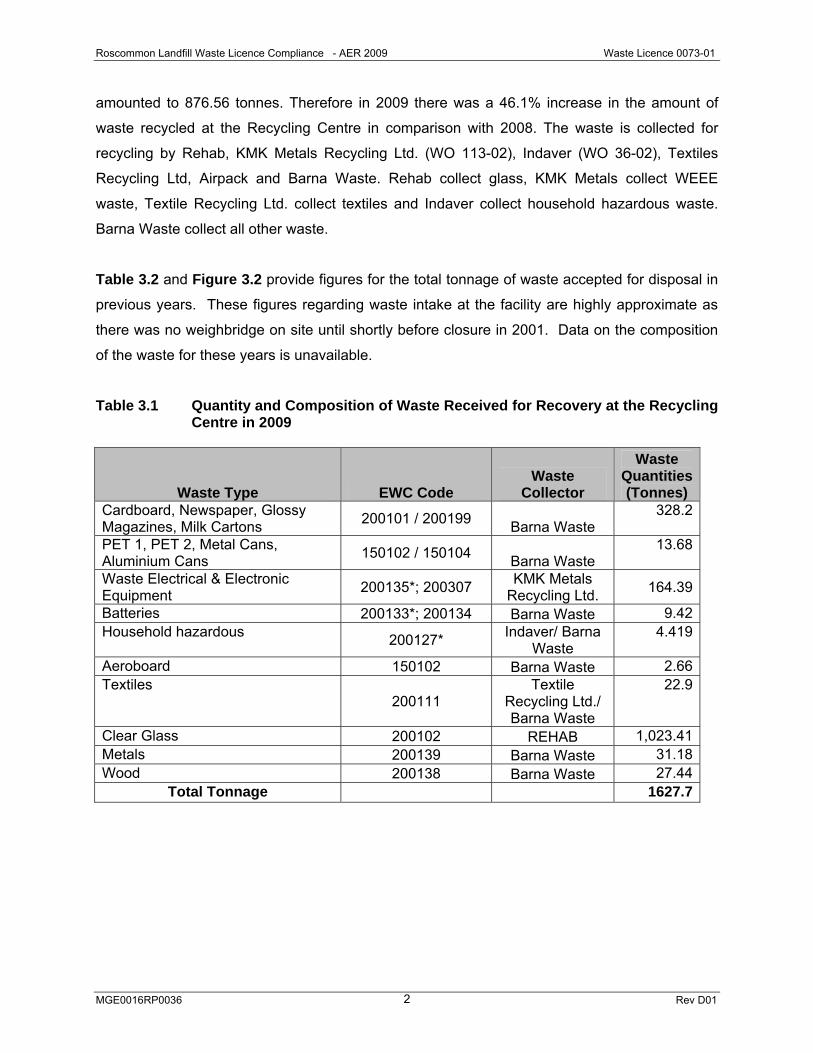
Table 3.1 Quantity and Composition of Waste Received for Recovery at the Recycling
Centre in 2009
Waste Type EWC Code Waste
Collector
Waste Quantities (Tonnes)
Cardboard, Newspaper, Glossy Magazines, Milk Cartons 200101 / 200199 Barna Waste
328.2
PET 1, PET 2, Metal Cans, Aluminium Cans 150102 / 150104 Barna Waste
13.68
Waste Electrical & Electronic Equipment 200135*; 200307 KMK Metals
Recycling Ltd. 164.39
Batteries 200133*; 200134 Barna Waste 9.42Household hazardous 200127* Indaver/ Barna
Waste 4.419
Aeroboard 150102 Barna Waste 2.66Textiles
200111 Textile
Recycling Ltd./ Barna Waste
22.9
Clear Glass 200102 REHAB 1,023.41Metals 200139 Barna Waste 31.18Wood 200138 Barna Waste 27.44
Total Tonnage 1627.7
Roscommon Landfill Waste Licence Compliance - AER 2009 Waste Licence 0073-01
MGE0016RP0036 Rev D01 3
Figure 3.1 Waste Intake for 2008
Cardboard, Newsprint, Glossy Magazines, Milk
Cartons 20%
PET 1, PET 2, Metal Cans, Aluminium
Cans1%
Wood2%
Batteries1%
Textile 1%
Aeroboard0%
Clear Glass 63%
WEEE10%
Metals2%
Hazardous Waste0%
Roscommon Landfill Waste Licence Compliance - AER 2009 Waste Licence 0073-01
MGE0016RP0036 Rev D01 4
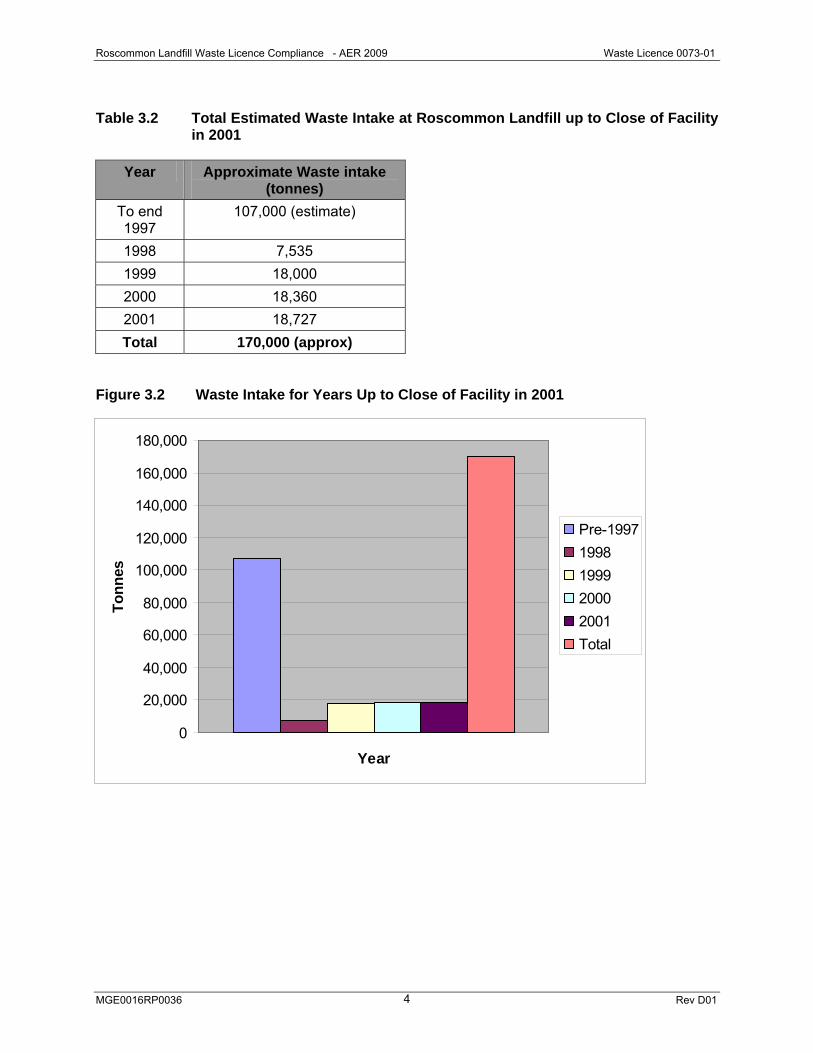
Table 3.2 Total Estimated Waste Intake at Roscommon Landfill up to Close of Facility
in 2001
Year Approximate Waste intake (tonnes)
To end 1997
107,000 (estimate)
1998 7,535 1999 18,000 2000 18,360 2001 18,727 Total 170,000 (approx)
Figure 3.2 Waste Intake for Years Up to Close of Facility in 2001
0
20,000
40,000
60,000
80,000
100,000
120,000
140,000
160,000
180,000
Year
Tonn
es
Pre-19971998199920002001Total
Roscommon Landfill Waste Licence Compliance - AER 2009 Waste Licence 0073-01
MGE0016RP0036 Rev D01 5
4. ENVIRONMENTAL MONITORING During the reporting period of 2004, it was agreed with the EPA that, as the landfill was closed
and fully capped, the scale and scope of the Environmental Monitoring Programme could be
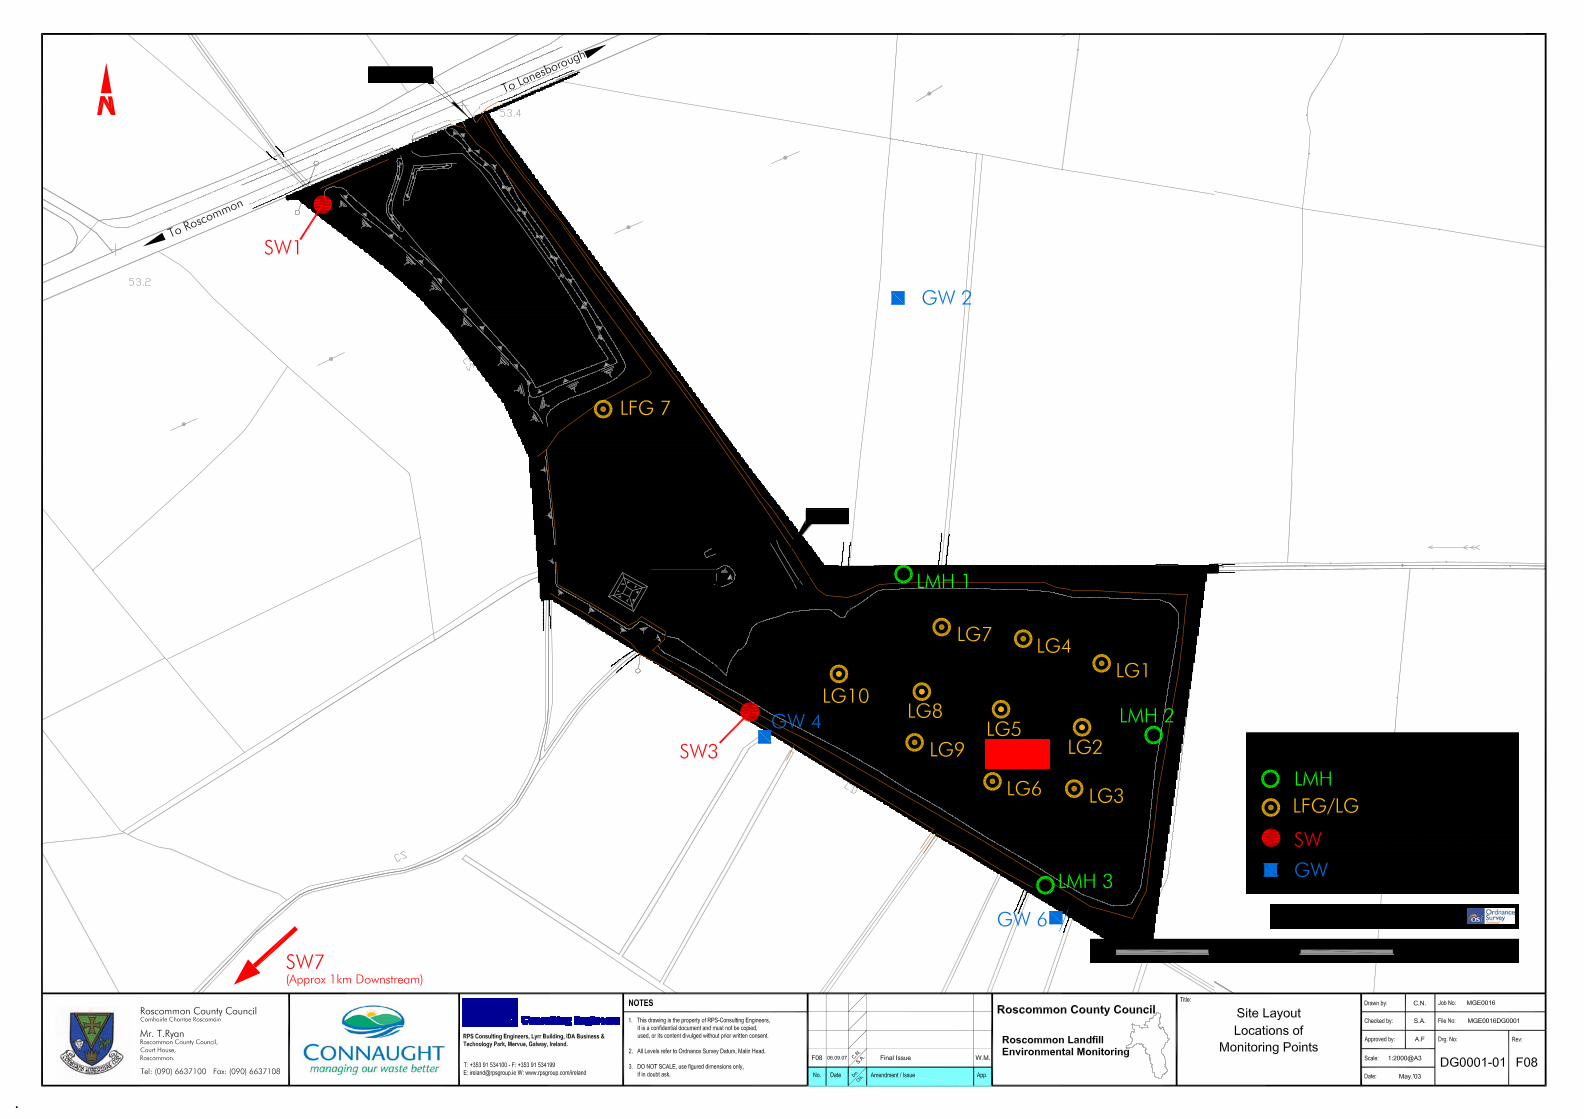
reduced to reflect the level of current operations at the facility. A site plan showing the revised
monitoring locations is included in Appendix A.
The following sections summarise the environmental monitoring undertaken at Roscommon
Landfill during the reporting period (2009). The Waste Licence for Roscommon Landfill requires
that biannual monitoring be carried out in respect of surface water, ground water, leachate and
gas. A letter dated the 8th January 2008 was sent to the EPA North Western Regional Office of
Environmental Enforcement on behalf of Roscommon County Council. The letter requested a
review of the licence. Roscommon County Council suggested that the extent and frequency of
monitoring could be decreased in 2008. In this regard it was proposed that quarterly reporting
should be reduced to biannual reporting. The EPA agreed the review of the licence in this
respect. For the first half of 2009, Roscommon County Council were unable to retrieve
groundwater samples due to a malfunction with the pump. For the second half of 2009,
sampling of groundwater, surface water and leachate locations was carried out in January 2010
due to staff shortages in the period July to December 2009.
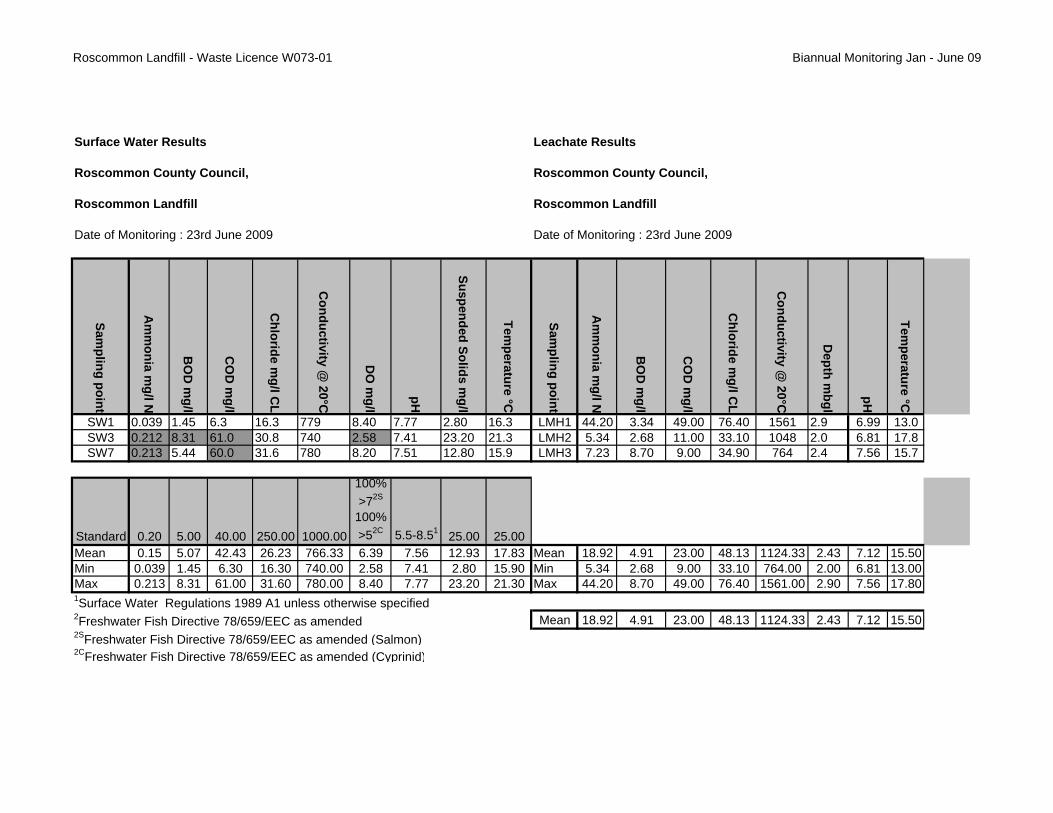
4.1 SURFACE WATER For each half of 2009, samples of surface water were taken by Roscommon County Council
from 3 no. monitoring locations. In June 2009 samples were taken from SW1, SW3, & SW7 and
in January 2010 samples were taken from SW2, SW3 and SW7 (see DG0001F08 in Appendix
A). All results are tabulated within Appendix B. Those parameters which are required to be
analysed on an annual basis were monitored in January 2010. The results were compared with
the European Community (Quality of Surface Water intended for Abstraction of Drinking Water)
Regulations, 1989 (S.I. No. 294 of 1989) and the Fresh Water Fish Directive 78/659/EEC. The
following interpretation summarises the overall surface water quality. More detailed
interpretations can be found within the biannual monitoring reports which were submitted to the
EPA.
Roscommon Landfill Waste Licence Compliance - AER 2009 Waste Licence 0073-01
MGE0016RP0036 Rev D01 6
4.1.1 Interpretation and Non-compliance
Throughout the sampling period (Jan-Dec 2009) the main exceedances of standards were
caused by elevated concentrations of ammonia, chemical oxygen demand (COD), biological
oxygen demand (BOD), suspended solids, iron and manganese and lowered levels of dissolved
oxygen at sampling point SW3.
Ammonia concentrations fluctuated through the year with a maximum concentration of 0.755
mg/l at SW3 during the second half of 2009 (H2 ’08). SW1 sampling results were below the
limit of 0.2 mg/l on both sampling occasions. Concentrations were elevated above the 1989
Regulations limit of 0.2 mg/l at SW7 and SW3 on both sampling occasions. The mean level of
ammonia recorded for the first half of 2009 was 0.15 mg/l and this increased to 0.40 mg/l for the
second half of 2009. Overall levels of ammonia have decreased from a mean concentration of
0.43mg/l in 2008 to a mean concentration of 0.275 mg/l for 2009.
The COD levels were above the limit of 40 mg/l set for water classified as A3 at sampling point
SW3 and SW7 in H1 ‘09. SW1 was compliant with the limit value on this occasion. The COD
levels exceeded the limit value at SW7 in H2 ‘09. The COD level at SW2 and SW3 was within
the limit value for this sampling period. The maximum concentration was recorded at SW3
during the 1st half of 2009 with a level of 61 mg/l. The mean COD level recorded in H2 ’09 was
39.07 mg/l. This figure is similar to the mean COD concentration recorded in the first half of
2009 (42.43 mg/l) and has decreased substantially since the second half of 2008 (69.3 mg/l).
Dissolved oxygen concentrations at SW2 and SW7 were compliant with the standard for H1
and H2 of 2009. The level of dissolved oxygen reported at SW3 in the first half of 2009 was
poor (2.58mg/l). The level of dissolved oxygen at sampling location SW3 in H2 ’09 did not meet
the requirements of the Category A1 or A2 parameters however it does meet the requirements
of the Category A3 parameters as specified in the EC (Quality of Surface Water Intended for the
Abstraction of Drinking Water) Regulations 1989. The level of DO recorded at this sampling
point in 2008 was also low (4.49 mg/l).
The level of Suspended Solids at SW2 and SW3 monitoring points are compliant in this
monitoring period within the required limit of 25 mg/l as set by the FW Fish Directive
78/659/EEC on both sampling occasions. The level of suspended solids in SW7 exceeded the
Roscommon Landfill Waste Licence Compliance - AER 2009 Waste Licence 0073-01
MGE0016RP0036 Rev D01 7
limit in H2 ’09 at 44.4 mg/l, but was below the required limit in H1 ‘09 at 12.8 mg/l. The
concentrations recorded at SW1 and SW7 were compliant in H1 and H2 ’08.
BOD levels at SW3 and SW7 were 8.31 mg/l and 5.44mg/l respectively for H1 ’09 which are
above the recommended upper limit of 5mg/l. When compared to the previous two rounds of
sampling in 2008 the level of BOD at these sampling points is elevated. BOD levels were below
the standard limit of 5mg/l at all sampling points for both halves of 2008. A level of 0.44mg/l
was recorded at SW1 for H1 ‘09. This is well below the upper limit of 5 mg/l. BOD levels were below the standard limit of 5mg/l at all sampling points for the second half of 2009.
All of the sampling points were below the limit for pH, Chloride, Temperature and Electrical Conductivity.
A visual inspection of the water quality showed that there was no odour evident at any time.
Plant growth was consistent for SW3 throughout the year, while weed growth was noted in SW7
in H1 ’09. No discolouration of water was noted at any monitoring point on either occasion.
Weed growth and water discolouration at SW3 and SW7 has been noted on previous
inspections.
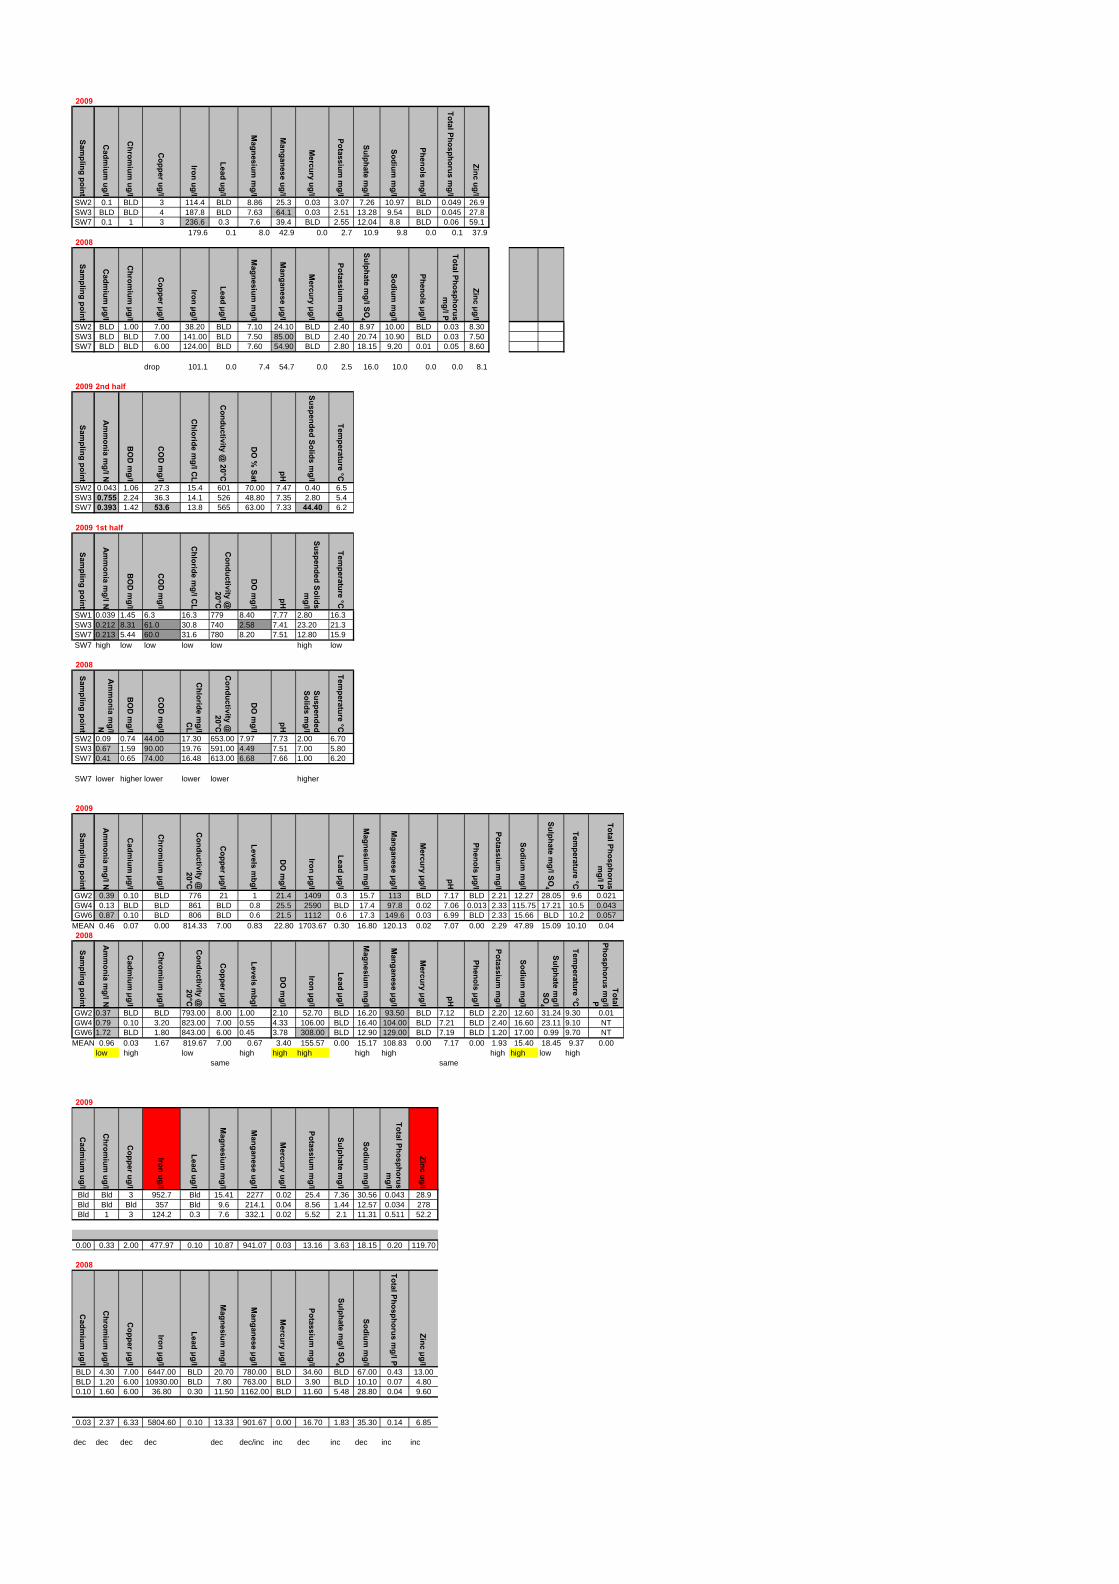
Annual sampling of a range of other parameters was also carried out in January 2010. The
concentrations of cadmium, chromium, copper, lead, magnesium, mercury, phenols, potassium,
sodium, sulphate, total phosphorus and zinc were under the 1989 Regulations limits. The
majority of results were concurrent with those recorded for the second half of 2008. However,
levels of zinc have increased from a mean of 8.1 μg/l in 2008 to 37.93 μg/l for this monitoring
period. The only exceeding parameters were manganese at SW3 and iron at SW7 which were
above the relevant standards.
The standard limit on manganese is 50 μg/l. Levels recorded for this parameter were 64.1 μg/l
at SW3. SW3 also exceeded the limit in last year’s monitoring (2008) at 85 μg/l. The mean
manganese level has decreased from 54.67 μg/l in the second half of 2008 to 42.93 μg/l for this
monitoring period. There has been a consistent drop in the mean level of manganese levels
since 2007.
Roscommon Landfill Waste Licence Compliance - AER 2009 Waste Licence 0073-01
MGE0016RP0036 Rev D01 8
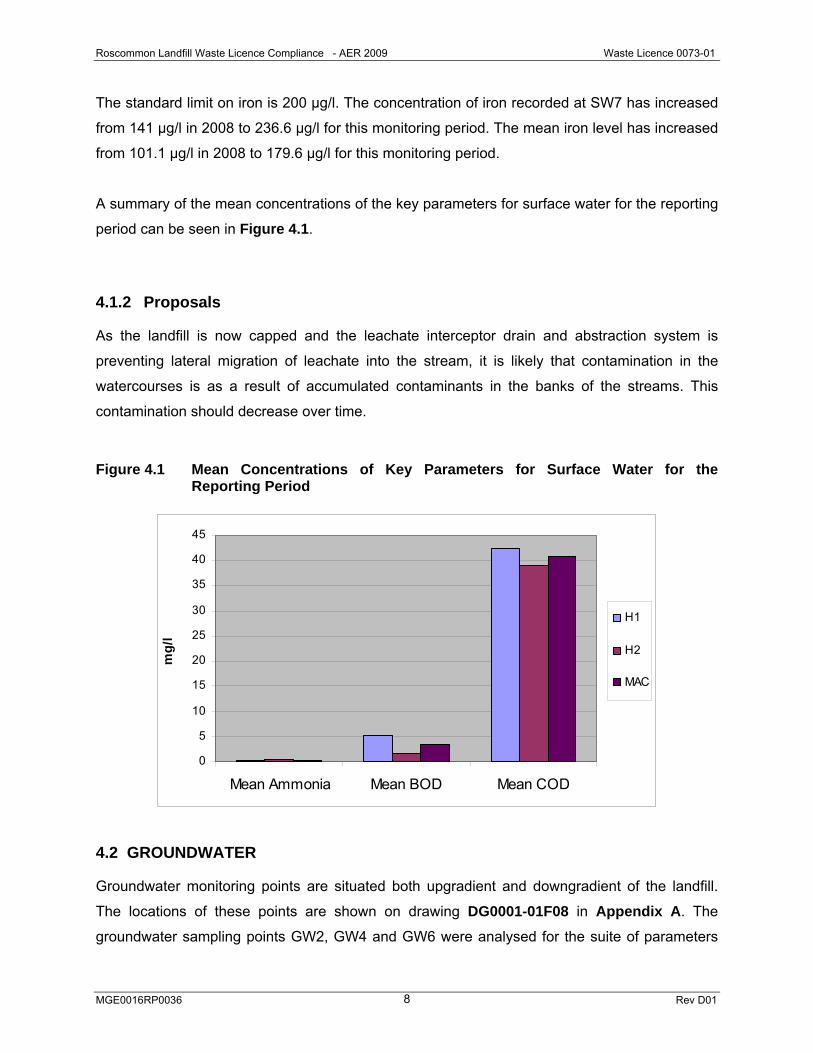
The standard limit on iron is 200 μg/l. The concentration of iron recorded at SW7 has increased
from 141 μg/l in 2008 to 236.6 μg/l for this monitoring period. The mean iron level has increased
from 101.1 μg/l in 2008 to 179.6 μg/l for this monitoring period.
A summary of the mean concentrations of the key parameters for surface water for the reporting
period can be seen in Figure 4.1.
4.1.2 Proposals
As the landfill is now capped and the leachate interceptor drain and abstraction system is
preventing lateral migration of leachate into the stream, it is likely that contamination in the
watercourses is as a result of accumulated contaminants in the banks of the streams. This
contamination should decrease over time.
Figure 4.1 Mean Concentrations of Key Parameters for Surface Water for the
Reporting Period
0
5
10
15
20
25
30
35
40
45
Mean Ammonia Mean BOD Mean COD
mg/
l
H1
H2
MAC
4.2 GROUNDWATER
Groundwater monitoring points are situated both upgradient and downgradient of the landfill.
The locations of these points are shown on drawing DG0001-01F08 in Appendix A. The
groundwater sampling points GW2, GW4 and GW6 were analysed for the suite of parameters
Roscommon Landfill Waste Licence Compliance - AER 2009 Waste Licence 0073-01
MGE0016RP0036 Rev D01 9
agreed with the Agency. Due to a malfunction with the pump used to retrieve groundwater
samples, Roscommon County Council was unable to obtain groundwater samples from GW2,
GW4 and GW6 for H1 ‘09. The following interpretations summarise the overall water quality for
H2 ‘09, the results of which are contained within Appendix B. Those parameters which require
to be analysed on an annual basis were monitored in January 2010. Detailed interpretations
can be found within the biannual monitoring reports which were submitted to the EPA.
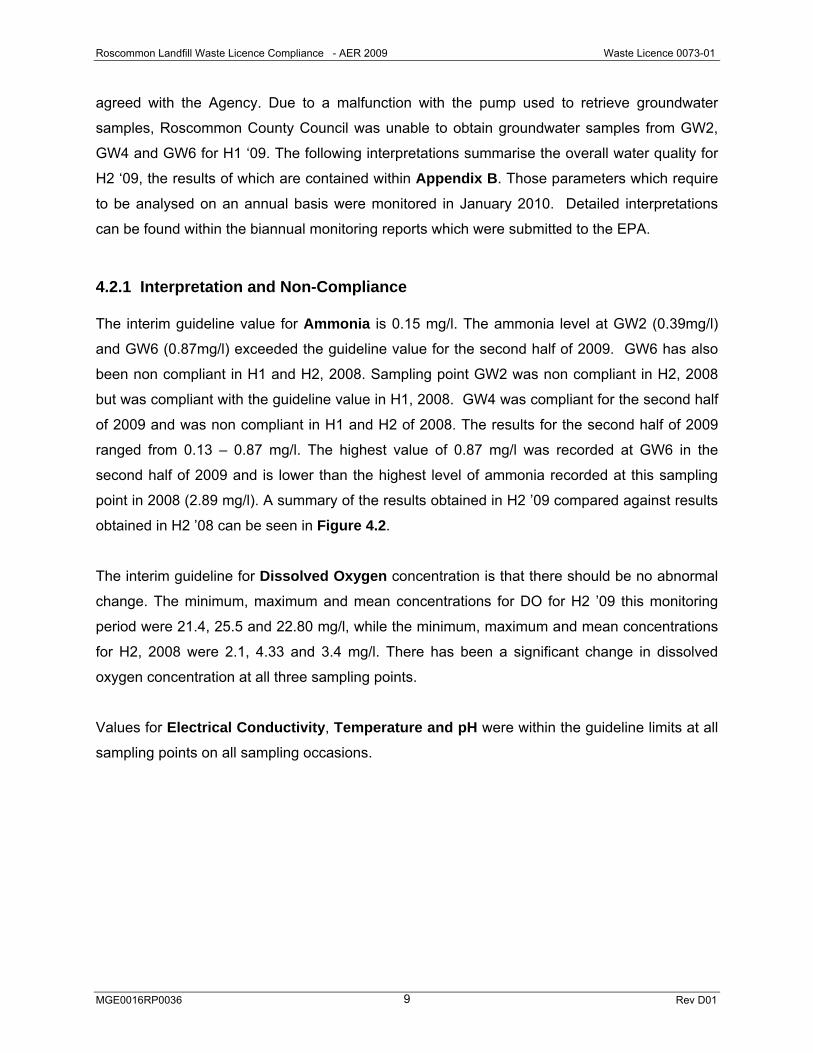
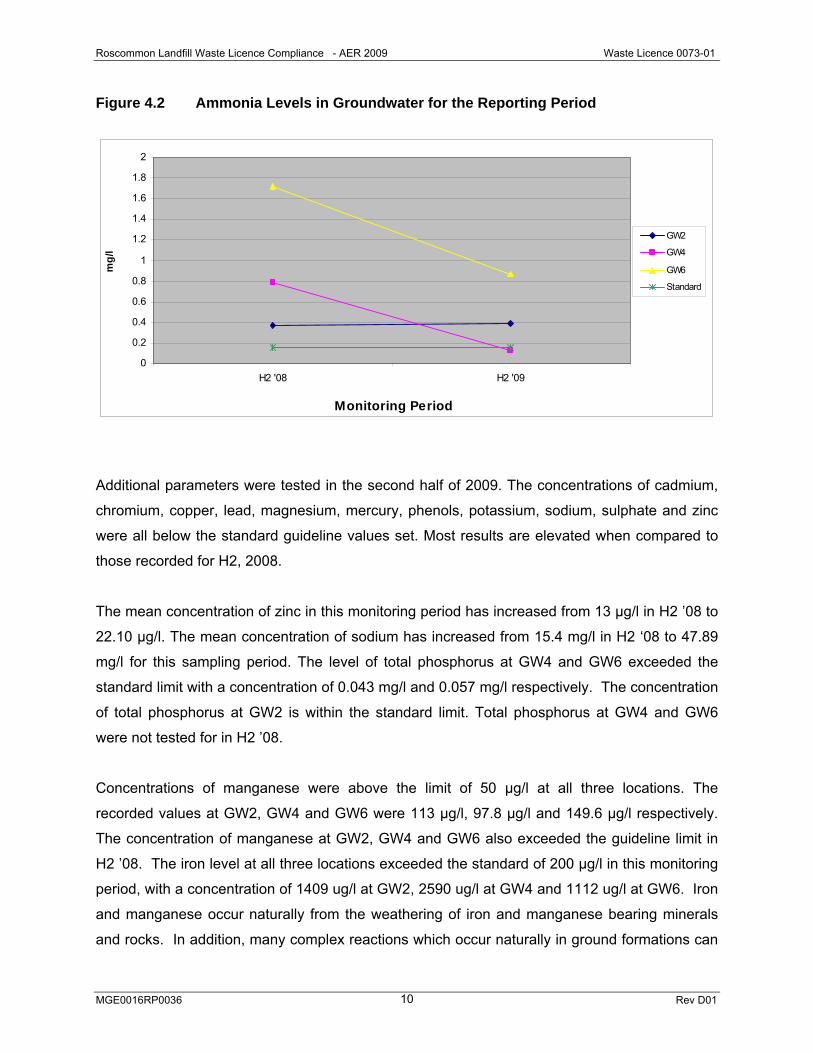
4.2.1 Interpretation and Non-Compliance The interim guideline value for Ammonia is 0.15 mg/l. The ammonia level at GW2 (0.39mg/l)
and GW6 (0.87mg/l) exceeded the guideline value for the second half of 2009. GW6 has also
been non compliant in H1 and H2, 2008. Sampling point GW2 was non compliant in H2, 2008
but was compliant with the guideline value in H1, 2008. GW4 was compliant for the second half
of 2009 and was non compliant in H1 and H2 of 2008. The results for the second half of 2009
ranged from 0.13 – 0.87 mg/l. The highest value of 0.87 mg/l was recorded at GW6 in the
second half of 2009 and is lower than the highest level of ammonia recorded at this sampling
point in 2008 (2.89 mg/l). A summary of the results obtained in H2 ’09 compared against results
obtained in H2 ’08 can be seen in Figure 4.2.
The interim guideline for Dissolved Oxygen concentration is that there should be no abnormal
change. The minimum, maximum and mean concentrations for DO for H2 ’09 this monitoring
period were 21.4, 25.5 and 22.80 mg/l, while the minimum, maximum and mean concentrations
for H2, 2008 were 2.1, 4.33 and 3.4 mg/l. There has been a significant change in dissolved
oxygen concentration at all three sampling points.
Values for Electrical Conductivity, Temperature and pH were within the guideline limits at all
sampling points on all sampling occasions.
Roscommon Landfill Waste Licence Compliance - AER 2009 Waste Licence 0073-01
MGE0016RP0036 Rev D01 10
Figure 4.2 Ammonia Levels in Groundwater for the Reporting Period
0
0.2
0.4
0.6
0.8
1
1.2
1.4
1.6
1.8
2
H2 '08 H2 '09
Monitoring Period
mg/
l
GW2
GW4
GW6
Standard
Additional parameters were tested in the second half of 2009. The concentrations of cadmium,
chromium, copper, lead, magnesium, mercury, phenols, potassium, sodium, sulphate and zinc
were all below the standard guideline values set. Most results are elevated when compared to
those recorded for H2, 2008.
The mean concentration of zinc in this monitoring period has increased from 13 μg/l in H2 ’08 to
22.10 μg/l. The mean concentration of sodium has increased from 15.4 mg/l in H2 ‘08 to 47.89
mg/l for this sampling period. The level of total phosphorus at GW4 and GW6 exceeded the
standard limit with a concentration of 0.043 mg/l and 0.057 mg/l respectively. The concentration
of total phosphorus at GW2 is within the standard limit. Total phosphorus at GW4 and GW6
were not tested for in H2 ’08.
Concentrations of manganese were above the limit of 50 μg/l at all three locations. The
recorded values at GW2, GW4 and GW6 were 113 μg/l, 97.8 μg/l and 149.6 μg/l respectively.
The concentration of manganese at GW2, GW4 and GW6 also exceeded the guideline limit in
H2 ’08. The iron level at all three locations exceeded the standard of 200 μg/l in this monitoring
period, with a concentration of 1409 ug/l at GW2, 2590 ug/l at GW4 and 1112 ug/l at GW6. Iron
and manganese occur naturally from the weathering of iron and manganese bearing minerals
and rocks. In addition, many complex reactions which occur naturally in ground formations can
Roscommon Landfill Waste Licence Compliance - AER 2009 Waste Licence 0073-01
MGE0016RP0036 Rev D01 11
give rise to many soluble forms of iron, which will therefore be present in waters passing
through such formations. However, such elevated iron and manganese levels may also be
attributed to pollution from organic wastes. Chloride was not tested in H2, 2009.
Groundwater levels are tabulated in Appendix B. Levels were recorded in January 2010. On
comparing groundwater levels recorded for this monitoring period with those recorded in H2,
2008, levels have decreased at sampling points GW4 (by 0.25 m) and GW6 (by 0.15 m). The
groundwater level at GW1 has remained consistent with a level of 1.0m recorded in H2 ’08 and
H2 ’09.
4.2.2 Proposals
Leachate abstraction is ongoing from the leachate interceptor drain and from leachate
boreholes in the waste body reducing infiltration of leachate to groundwater. As the landfill is
capped, there is a minimum amount of leachate being generated. The combined effect of these
measures should demonstrate a continual improvement in the quality of the groundwater over
time.
4.3 LEACHATE Samples of leachate were taken by Roscommon County Council from the 3 no. chambers
situated on the leachate interceptor drain and at the leachate lagoon (see DG0001F08 in
Appendix A). The results of this analysis are contained within Appendix B. The following
interpretation summarises the overall leachate quality. More detailed interpretations can be
found within the biannual monitoring reports which were submitted to the EPA.
4.3.1 Interpretation and Non-compliance Levels in each leachate chamber increased by a similar magnitude between H1 ‘08 and H2 ’08.
Leachate levels rose in LMH1 by 0.3metre and in LMH3 by 0.7 metre between H1 ’09 and H2
‘09. Levels in these chambers increased by a similar magnitude between H1 ‘08 and H2 ’08.
The leachate level dropped in LMH2 by 0.4 metres from H1 ’09 to H2 ’09. The leachate level
rose in chamber LMH2 by 0.7 in 2008. The operation of a leachate pumping system installed by
Roscommon County Council during the summer of 2004 is set to automatically maintain
leachate levels in the landfill and in the interceptor drain.
Roscommon Landfill Waste Licence Compliance - AER 2009 Waste Licence 0073-01
MGE0016RP0036 Rev D01 12
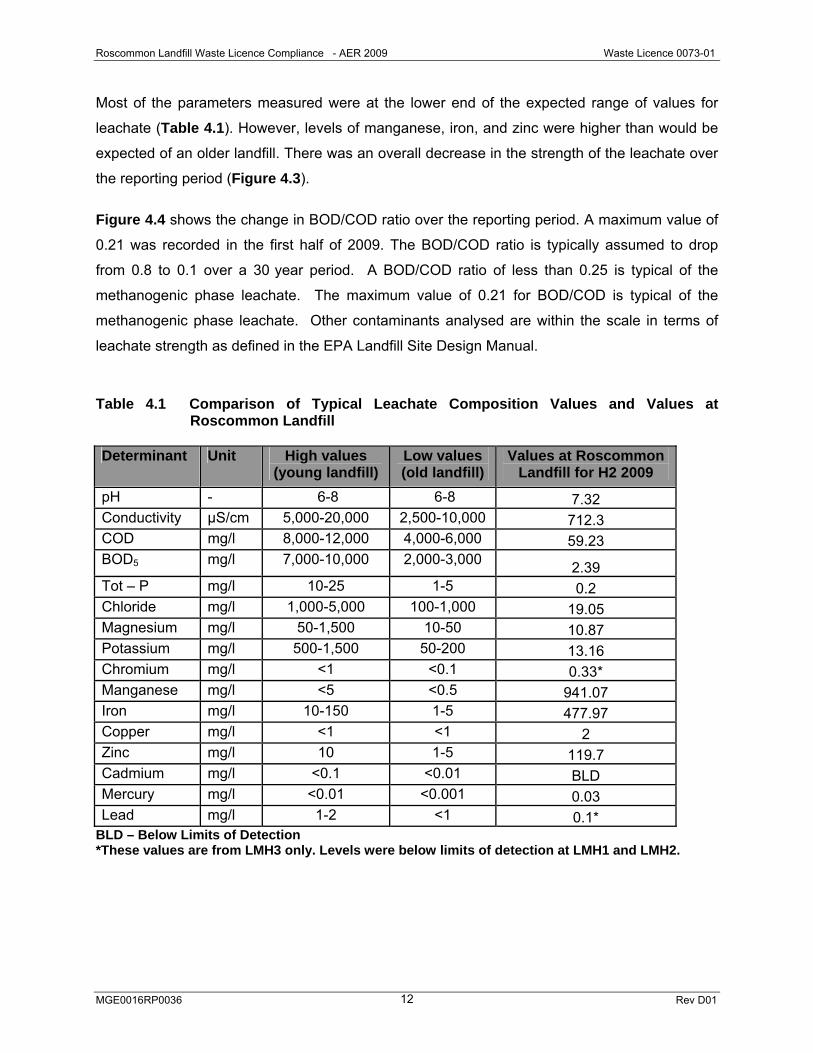
Most of the parameters measured were at the lower end of the expected range of values for
leachate (Table 4.1). However, levels of manganese, iron, and zinc were higher than would be
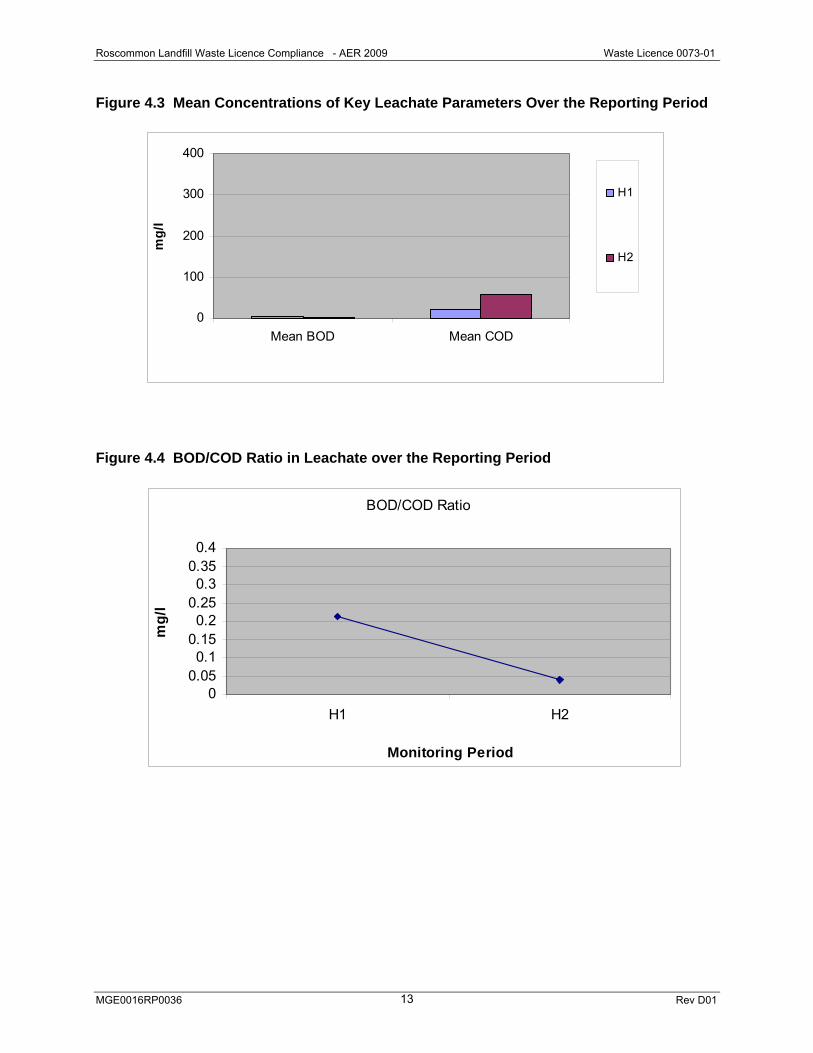
expected of an older landfill. There was an overall decrease in the strength of the leachate over
the reporting period (Figure 4.3).
Figure 4.4 shows the change in BOD/COD ratio over the reporting period. A maximum value of
0.21 was recorded in the first half of 2009. The BOD/COD ratio is typically assumed to drop
from 0.8 to 0.1 over a 30 year period. A BOD/COD ratio of less than 0.25 is typical of the
methanogenic phase leachate. The maximum value of 0.21 for BOD/COD is typical of the
methanogenic phase leachate. Other contaminants analysed are within the scale in terms of
leachate strength as defined in the EPA Landfill Site Design Manual.
Table 4.1 Comparison of Typical Leachate Composition Values and Values at
Roscommon Landfill Determinant Unit High values
(young landfill) Low values (old landfill)
Values at Roscommon Landfill for H2 2009
pH - 6-8 6-8 7.32 Conductivity µS/cm 5,000-20,000 2,500-10,000 712.3 COD mg/l 8,000-12,000 4,000-6,000 59.23 BOD5 mg/l 7,000-10,000 2,000-3,000 2.39 Tot – P mg/l 10-25 1-5 0.2 Chloride mg/l 1,000-5,000 100-1,000 19.05 Magnesium mg/l 50-1,500 10-50 10.87 Potassium mg/l 500-1,500 50-200 13.16 Chromium mg/l <1 <0.1 0.33* Manganese mg/l <5 <0.5 941.07 Iron mg/l 10-150 1-5 477.97 Copper mg/l <1 <1 2 Zinc mg/l 10 1-5 119.7 Cadmium mg/l <0.1 <0.01 BLD Mercury mg/l <0.01 <0.001 0.03 Lead mg/l 1-2 <1 0.1*
BLD – Below Limits of Detection *These values are from LMH3 only. Levels were below limits of detection at LMH1 and LMH2.
Roscommon Landfill Waste Licence Compliance - AER 2009 Waste Licence 0073-01
MGE0016RP0036 Rev D01 13
Figure 4.3 Mean Concentrations of Key Leachate Parameters Over the Reporting Period
0
100
200
300
400
Mean BOD Mean COD
mg/
l
H1
H2
Figure 4.4 BOD/COD Ratio in Leachate over the Reporting Period
BOD/COD Ratio
00.050.1
0.150.2
0.250.3
0.350.4
H1 H2
Monitoring Period
mg/
l
Roscommon Landfill Waste Licence Compliance - AER 2009 Waste Licence 0073-01
MGE0016RP0036 Rev D01 14
4.3.2 Proposals Monitoring of leachate will continue in 3 no. leachate chambers on the interceptor drain as
agreed with the EPA.
4.4 DUST As the facility is a closed and capped landfill and since no construction work is ongoing at the
site, it was agreed with the EPA in 2004 that dust monitoring could cease at the facility.
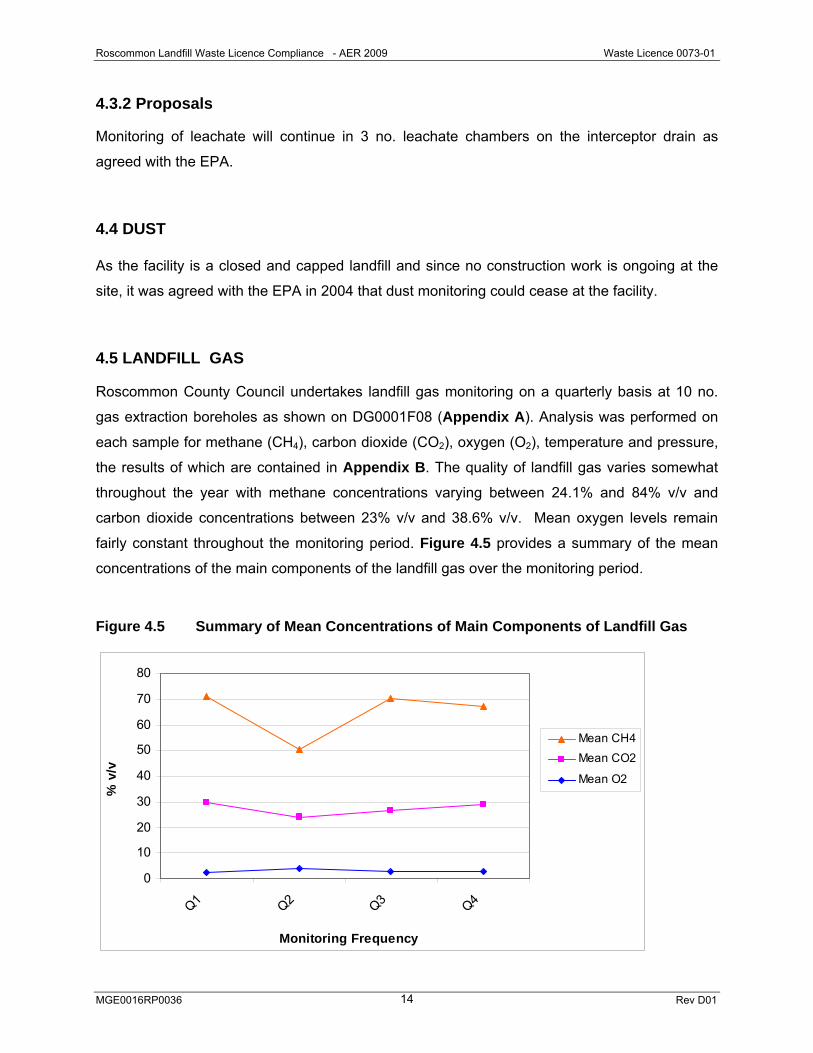
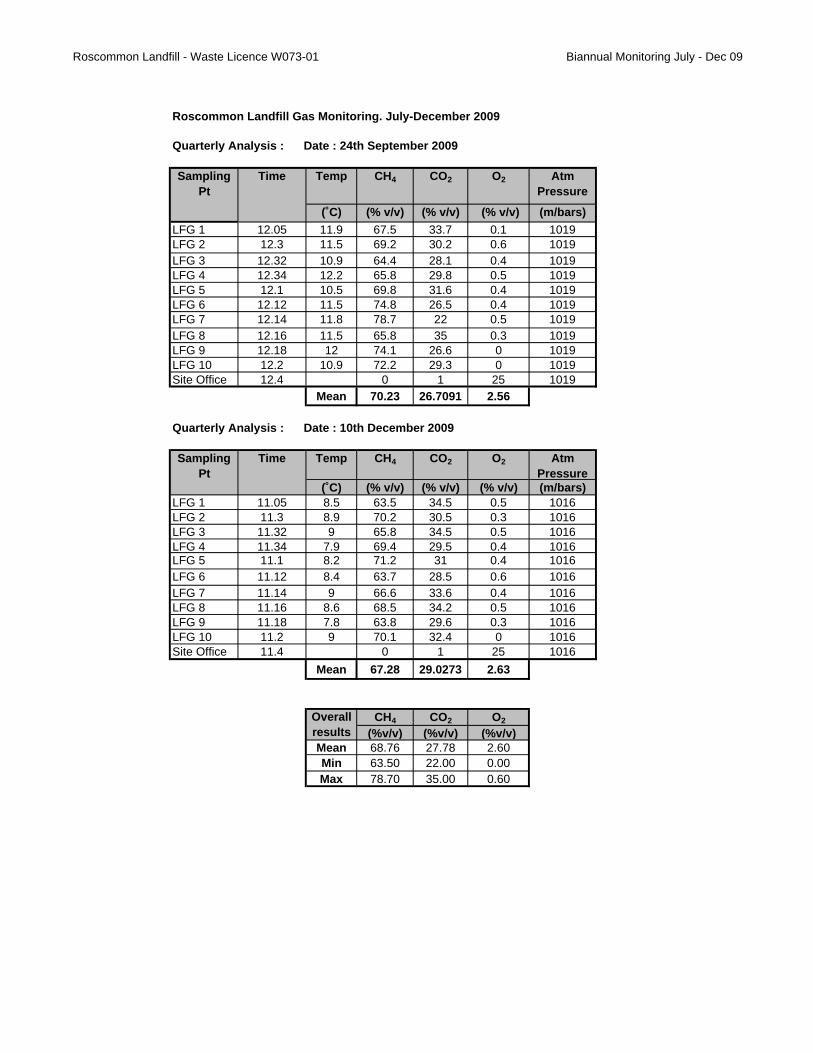
4.5 LANDFILL GAS
Roscommon County Council undertakes landfill gas monitoring on a quarterly basis at 10 no.
gas extraction boreholes as shown on DG0001F08 (Appendix A). Analysis was performed on
each sample for methane (CH4), carbon dioxide (CO2), oxygen (O2), temperature and pressure,
the results of which are contained in Appendix B. The quality of landfill gas varies somewhat
throughout the year with methane concentrations varying between 24.1% and 84% v/v and
carbon dioxide concentrations between 23% v/v and 38.6% v/v. Mean oxygen levels remain
fairly constant throughout the monitoring period. Figure 4.5 provides a summary of the mean
concentrations of the main components of the landfill gas over the monitoring period.
Figure 4.5 Summary of Mean Concentrations of Main Components of Landfill Gas
0
10
20
30
40
50
60
70
80
Q1 Q2 Q3 Q4
Monitoring Frequency
% v
/v
Mean CH4Mean CO2
Mean O2
Roscommon Landfill Waste Licence Compliance - AER 2009 Waste Licence 0073-01
MGE0016RP0036 Rev D01 15
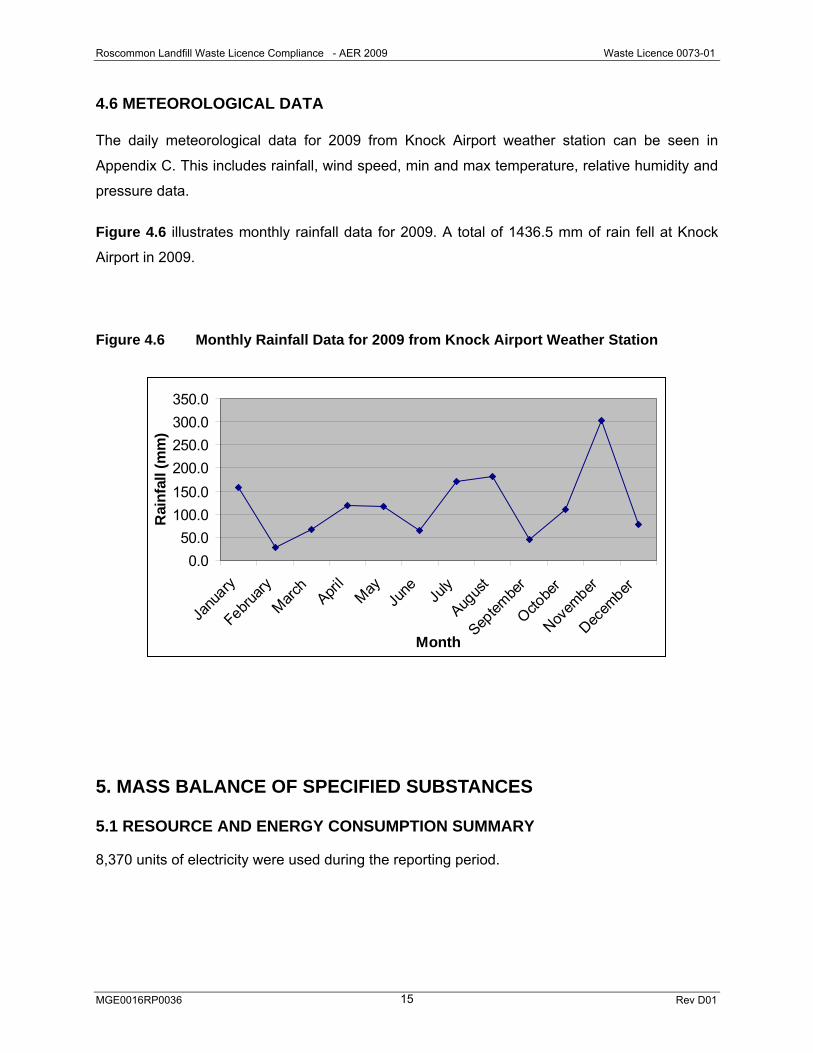
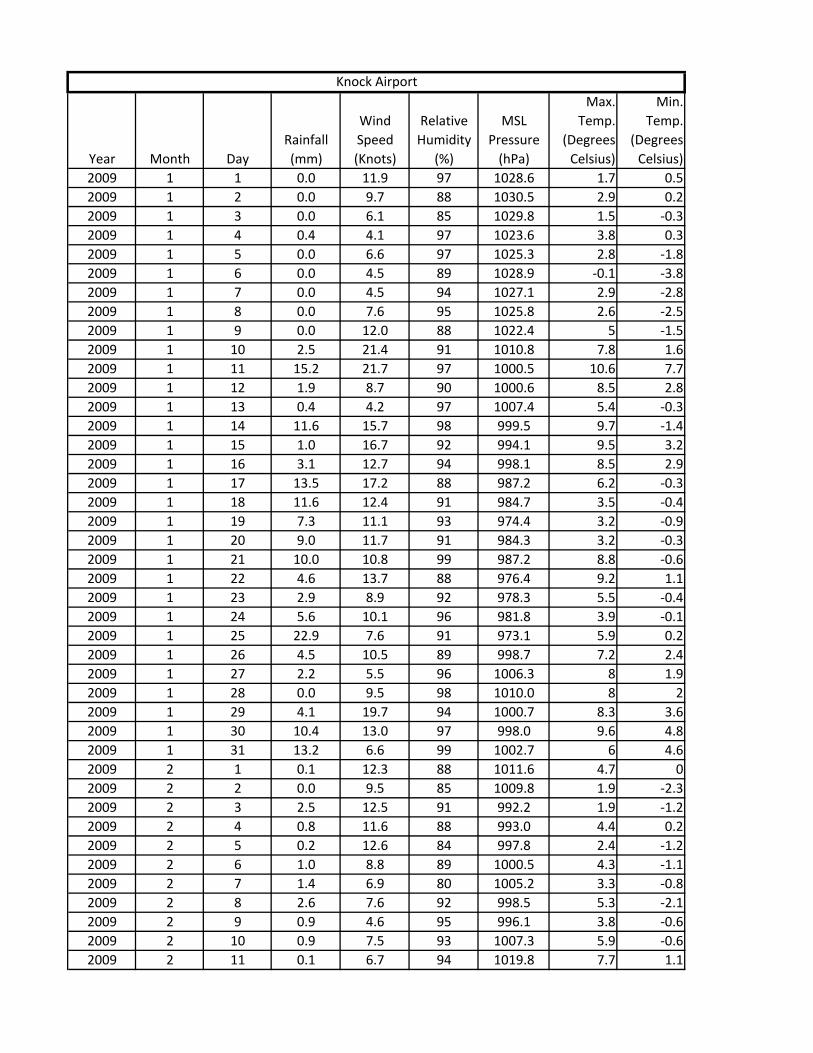
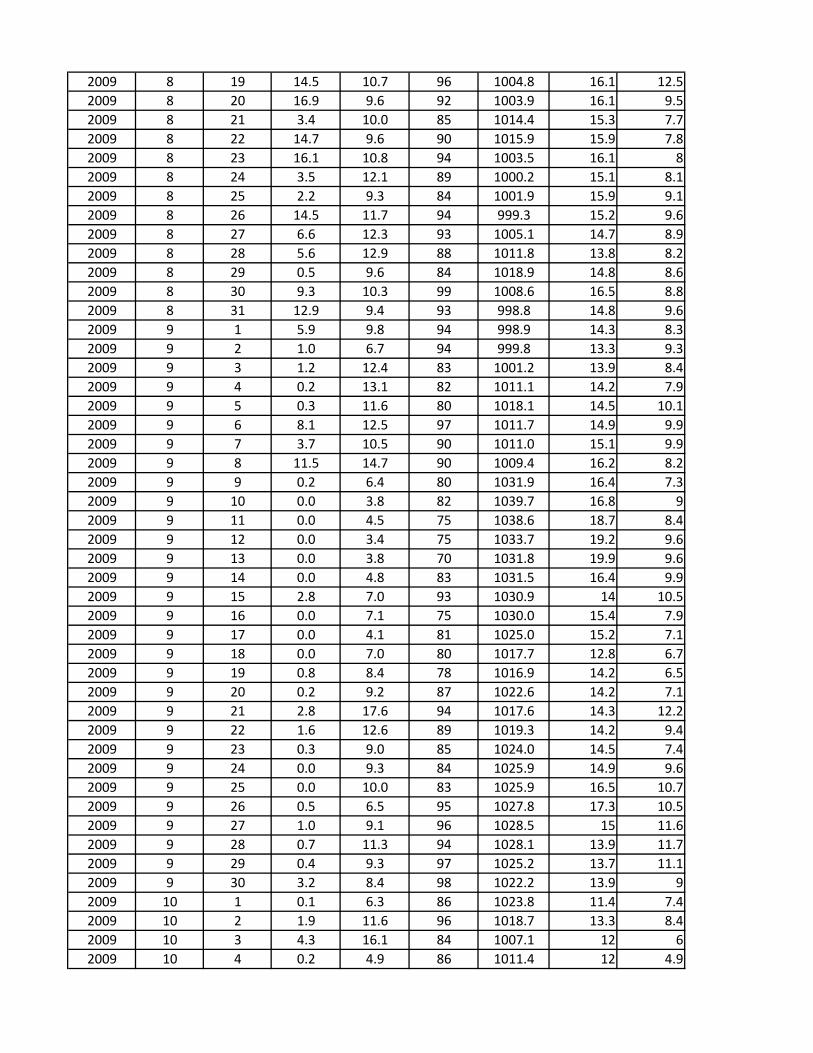
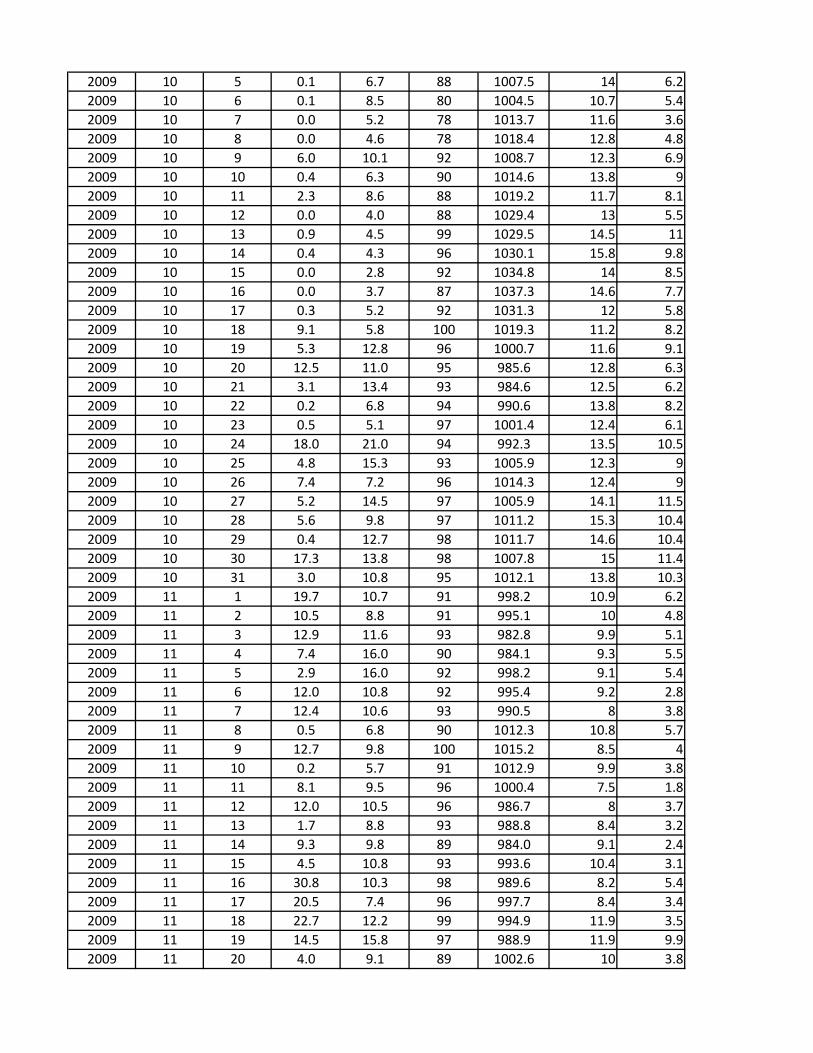
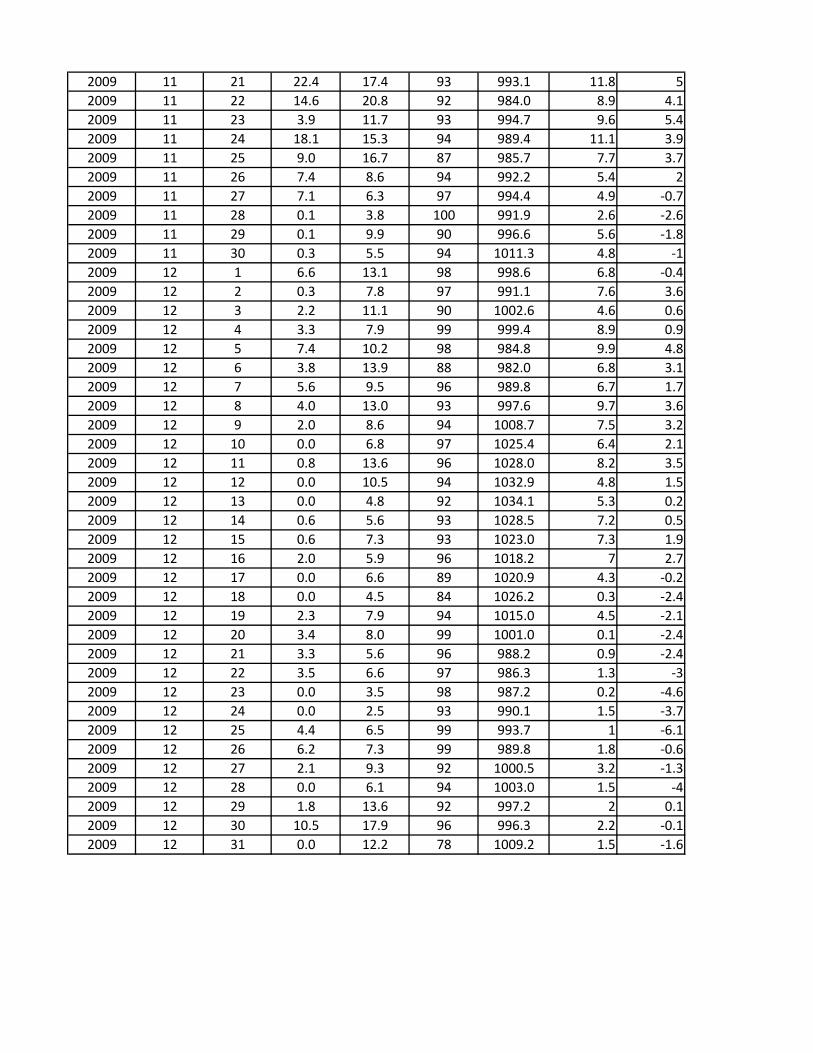
4.6 METEOROLOGICAL DATA The daily meteorological data for 2009 from Knock Airport weather station can be seen in
Appendix C. This includes rainfall, wind speed, min and max temperature, relative humidity and
pressure data.
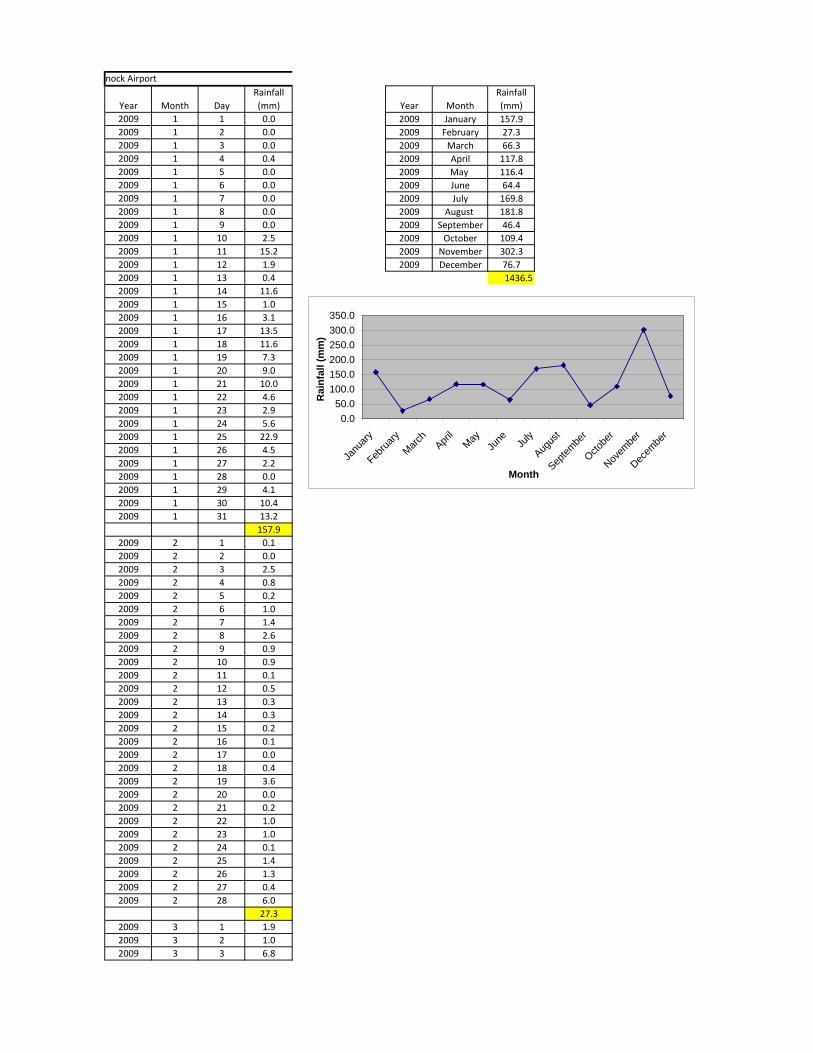
Figure 4.6 illustrates monthly rainfall data for 2009. A total of 1436.5 mm of rain fell at Knock
Airport in 2009.
Figure 4.6 Monthly Rainfall Data for 2009 from Knock Airport Weather Station
0.050.0
100.0150.0200.0250.0300.0350.0
Janu
ary
February
March
April
May
June Ju
ly
Augus
t
Septem
ber
Octobe
r
Novem
ber
Decem
ber
Month
Rai
nfal
l (m
m)
5. MASS BALANCE OF SPECIFIED SUBSTANCES
5.1 RESOURCE AND ENERGY CONSUMPTION SUMMARY
8,370 units of electricity were used during the reporting period.
Roscommon Landfill Waste Licence Compliance - AER 2009 Waste Licence 0073-01
MGE0016RP0036 Rev D01 16
5.2 EMISSIONS TO GROUNDWATER
The landfill operated on a ‘’dilute and disperse’’ basis with no leachate containment measures
put in place whereby the leachate generated was allowed to drain into surface and groundwater,
becoming diluted and attenuated. The layers of peat and marl below the waste appear to have
been effectively acting as a natural liner. The quality of the groundwater should improve as the
landfill is capped and leachate abstraction continues in the leachate interceptor drain being
provided around the landfill perimeter.
5.3 MONTHLY WATER BALANCE CALCULATION AND INTERPRETATION Monthly rainfall data obtained from the nearest Met Eireann weather station at Knock, Co. Mayo
estimated that the site received approximately 1436.5 mm of rainfall for the year 2009.
Prior to capping, it is estimated that, on average, approximately 22,700 m3 of leachate was
generated on an annual basis at Roscommon Landfill. Records for 2009 indicate that 899.12 m3
of leachate were tankered to Roscommon WWTP in the period.
5.4 LANDFILL GAS VOLUMES
Under optimum conditions one tonne of degradable waste can theoretically produce 400-500m3
of landfill gas (including moisture content). In practical terms the rate at which landfill gas which
may be collected for utilisation purposes may be much lower.
It is estimated that the waste disposed of in Roscommon Landfill contains on average 50%
biodegradable waste. It is therefore assumed that the gas production is approximately 200 Nm3
of gas per tonne of waste over a 30 year period.
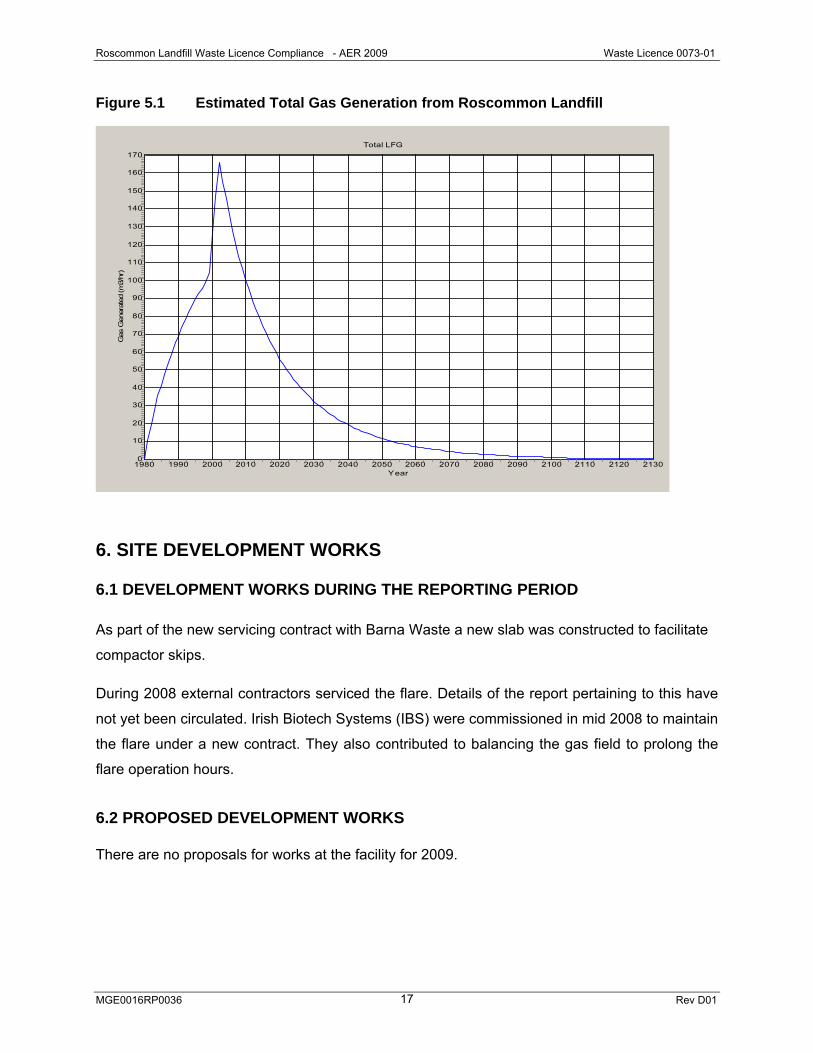
Gas volumes have been estimated using GASSIM, a gas modelling programme developed by
the UK Environment Agency. Total bulk landfill gas generated is estimated at 120m3/hr,
equating to 1.05 million m3/yr. The estimated rate of gas generation at this landfill since 1980 is
graphed in Figure 5.1.
A 100 m3/hr enclosed gas flare, 10 no. landfill gas extraction wells and connecting pipework
were installed at the landfill in 2003. The gas management system was commissioned during
the summer of 2004.
Roscommon Landfill Waste Licence Compliance - AER 2009 Waste Licence 0073-01
MGE0016RP0036 Rev D01 17
Figure 5.1 Estimated Total Gas Generation from Roscommon Landfill
Total LFG
Year2130212021102100209020802070206020502040203020202010200019901980
Gas
Gen
erat
ed (m
3/hr
)
170
160
150
140
130
120
110
100
90
80
70
60
50
40
30
20
10
0
6. SITE DEVELOPMENT WORKS
6.1 DEVELOPMENT WORKS DURING THE REPORTING PERIOD
As part of the new servicing contract with Barna Waste a new slab was constructed to facilitate
compactor skips.
During 2008 external contractors serviced the flare. Details of the report pertaining to this have
not yet been circulated. Irish Biotech Systems (IBS) were commissioned in mid 2008 to maintain
the flare under a new contract. They also contributed to balancing the gas field to prolong the
flare operation hours.
6.2 PROPOSED DEVELOPMENT WORKS There are no proposals for works at the facility for 2009.
Roscommon Landfill Waste Licence Compliance - AER 2009 Waste Licence 0073-01
MGE0016RP0036 Rev D01 18
7. PROCEDURES A revised Environmental Management Plan (EMP) for the facility was issued in December 2004.
8. STAFFING AT ROSCOMMON LANDFILL
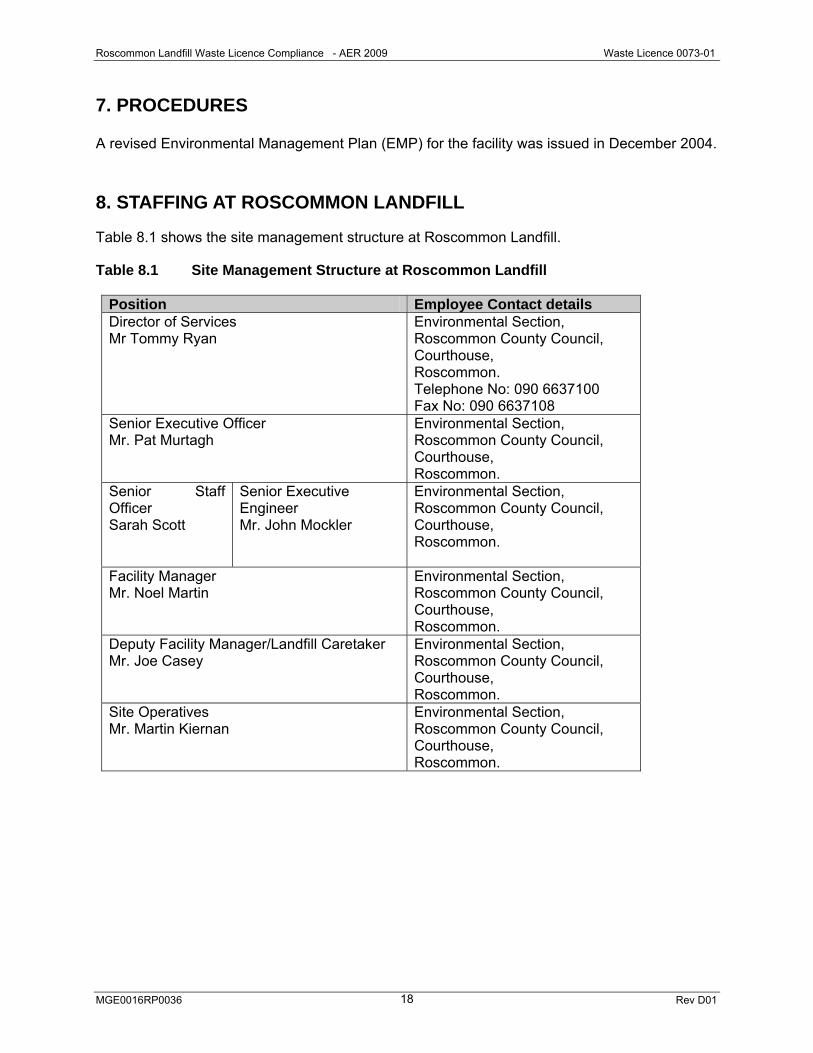
Table 8.1 shows the site management structure at Roscommon Landfill.
Table 8.1 Site Management Structure at Roscommon Landfill
Position Employee Contact details Director of Services Mr Tommy Ryan
Environmental Section, Roscommon County Council, Courthouse, Roscommon. Telephone No: 090 6637100 Fax No: 090 6637108
Senior Executive Officer Mr. Pat Murtagh
Environmental Section, Roscommon County Council, Courthouse, Roscommon.
Senior Staff Officer Sarah Scott
Senior Executive Engineer Mr. John Mockler
Environmental Section, Roscommon County Council, Courthouse, Roscommon.
Facility Manager Mr. Noel Martin
Environmental Section, Roscommon County Council, Courthouse, Roscommon.
Deputy Facility Manager/Landfill Caretaker Mr. Joe Casey
Environmental Section, Roscommon County Council, Courthouse, Roscommon.
Site Operatives Mr. Martin Kiernan
Environmental Section, Roscommon County Council, Courthouse, Roscommon.
Roscommon Landfill Waste Licence Compliance - AER 2009 Waste Licence 0073-01
MGE0016RP0036 Rev D01 19
9. REVIEW OF NUISANCE CONTROLS
9.1 LITTER ABATEMENT
As waste is no longer being accepted at the site and all landfilled waste is covered, there
is no litter problem at the facility. The Recycling Centre is continuously maintained and
monitored by Council operatives and all recyclables are deposited into covered, lockable
containers. Any loose litter around the facility and its environs is collected.
9.2 NOISE AND DUST
With the closure of the landfill, there is no heavy machinery and little heavy vehicular
traffic to the site. Noise and dust do not pose any problems and monitoring ceased in
2004 with the agreement of the Agency.
9.3 VERMIN CONTROL
Capping of the landfill has included the installation of a geosynthetic clay liner tying into
the leachate interceptor drain around the waste, thus forming a continuous barrier
around the main waste body. This barrier is augmented by a clay cover which is 1m
thick resulting in little or no access to the waste for nuisances such as vermin or birds. In
addition, Roscommon County Council employs ECOLAB to operate a vermin control
programme. During the summer months, AOK pest control are engaged in the control of
flies for Roscommon County Council.
9.4 ODOUR
As waste is no longer being accepted at the site and any landfilled waste is covered,
there is no odour problem at the facility. The gas flare treats landfill gas at the facility.
10. REPORTS ON FINANCIAL PROVISIONS
Roscommon County Council allocates funding on an annual basis from general
resources. The funding will be maintained in an amount always sufficient to underwrite
the current Restoration and Aftercare Plan in accordance with Condition 11 of the Waste
Licence.
Roscommon Landfill Waste Licence Compliance - AER 2009 Waste Licence 0073-01
MGE0016RP0036 Rev D01 20
11. ENVIRONMENTAL INCIDENTS AND COMPLAINTS
No incidents or complaints were reported for the year 2009.
APPENDIX A
SITE LAYOUT LOCATIONS OF MONITORING POINTS (DG0001-01F08)

APPENDIX B
Monitoring Results
Roscommon Landfill - Waste Licence W073-01 Biannual Monitoring Jan - June 09
Surface Water Results Leachate Results
Roscommon County Council, Roscommon County Council,
Roscommon Landfill Roscommon Landfill
Date of Monitoring : 23rd June 2009 Date of Monitoring : 23rd June 2009
Sampling point
Am
monia m
g/l N
BO
D m
g/l
CO
D m
g/l
Chloride m
g/l CL
Conductivity @
20°C
DO
mg/l
pH
Suspended Solids mg/l
Temperature °C
Sampling point
Am
monia m
g/l N
BO
D m
g/l
CO
D m
g/l
Chloride m
g/l CL
Conductivity @
20°C
Depth m
bgl
pH
Temperature °C
SW1 0.039 1.45 6.3 16.3 779 8.40 7.77 2.80 16.3 LMH1 44.20 3.34 49.00 76.40 1561 2.9 6.99 13.0SW3 0.212 8.31 61.0 30.8 740 2.58 7.41 23.20 21.3 LMH2 5.34 2.68 11.00 33.10 1048 2.0 6.81 17.8SW7 0.213 5.44 60.0 31.6 780 8.20 7.51 12.80 15.9 LMH3 7.23 8.70 9.00 34.90 764 2.4 7.56 15.7
Standard 0.20 5.00 40.00 250.00 1000.00
100%>72S
100%>52C 5.5-8.51 25.00 25.00
Mean 0.15 5.07 42.43 26.23 766.33 6.39 7.56 12.93 17.83 Mean 18.92 4.91 23.00 48.13 1124.33 2.43 7.12 15.50Min 0.039 1.45 6.30 16.30 740.00 2.58 7.41 2.80 15.90 Min 5.34 2.68 9.00 33.10 764.00 2.00 6.81 13.00Max 0.213 8.31 61.00 31.60 780.00 8.40 7.77 23.20 21.30 Max 44.20 8.70 49.00 76.40 1561.00 2.90 7.56 17.801Surface Water Regulations 1989 A1 unless otherwise specified2Freshwater Fish Directive 78/659/EEC as amended Mean 18.92 4.91 23.00 48.13 1124.33 2.43 7.12 15.502SFreshwater Fish Directive 78/659/EEC as amended (Salmon)2CFreshwater Fish Directive 78/659/EEC as amended (Cyprinid)
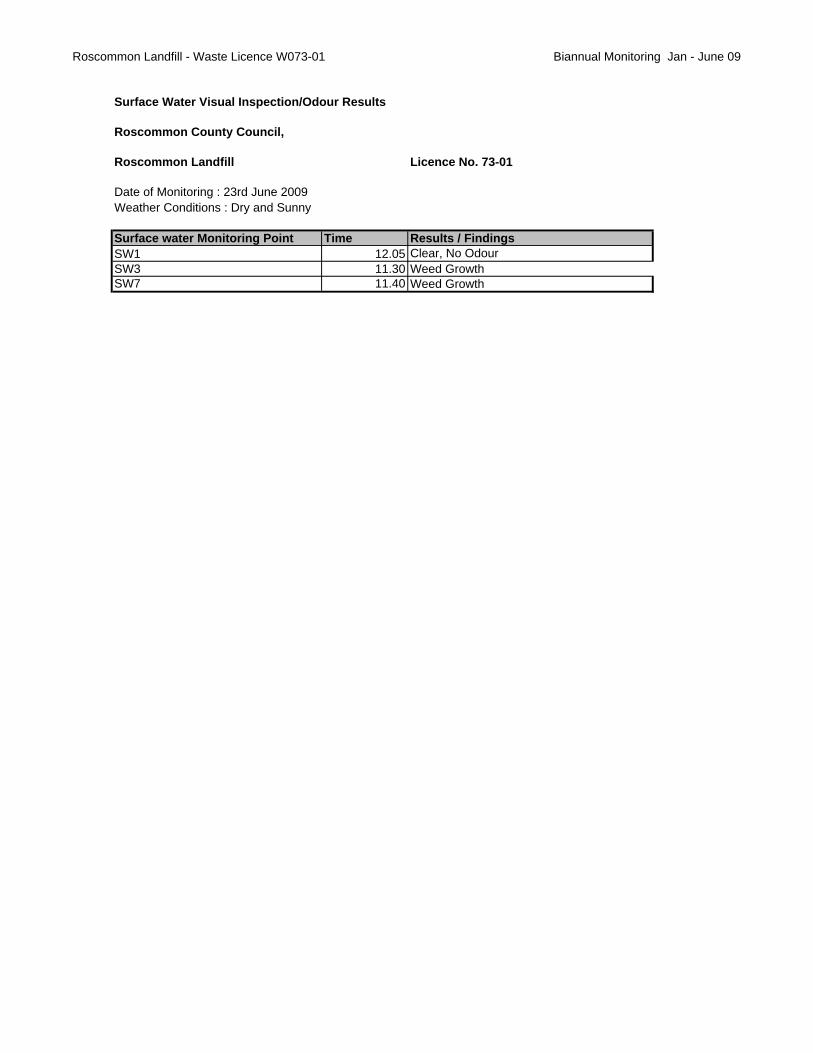
Roscommon Landfill - Waste Licence W073-01 Biannual Monitoring Jan - June 09
Surface Water Visual Inspection/Odour Results
Roscommon County Council,
Roscommon Landfill Licence No. 73-01
Date of Monitoring : 23rd June 2009Weather Conditions : Dry and Sunny
Surface water Monitoring Point Time Results / FindingsSW1 12.05 Clear, No OdourSW3 11.30 Weed GrowthSW7 11.40 Weed Growth
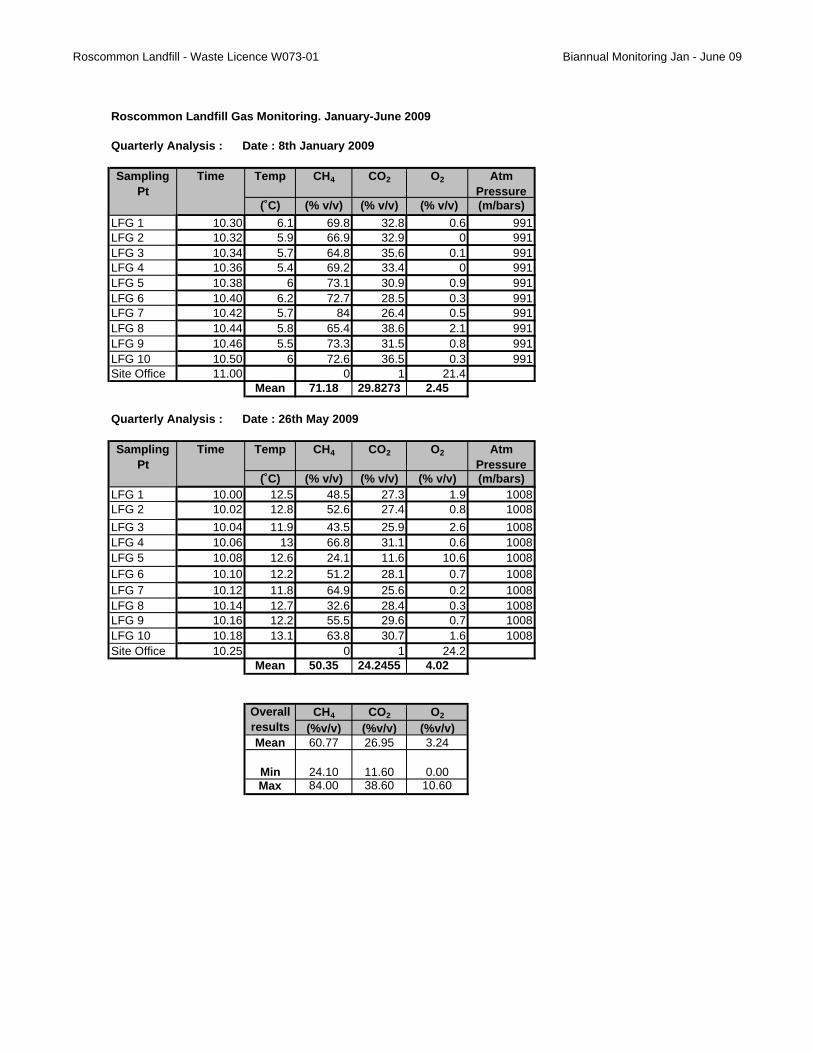
Roscommon Landfill - Waste Licence W073-01 Biannual Monitoring Jan - June 09
Roscommon Landfill Gas Monitoring. January-June 2009
Quarterly Analysis : Date : 8th January 2009
Temp CH4 CO2 O2 Atm Pressure
(˚C) (% v/v) (% v/v) (% v/v) (m/bars)LFG 1 10.30 6.1 69.8 32.8 0.6 991LFG 2 10.32 5.9 66.9 32.9 0 991LFG 3 10.34 5.7 64.8 35.6 0.1 991LFG 4 10.36 5.4 69.2 33.4 0 991LFG 5 10.38 6 73.1 30.9 0.9 991LFG 6 10.40 6.2 72.7 28.5 0.3 991LFG 7 10.42 5.7 84 26.4 0.5 991LFG 8 10.44 5.8 65.4 38.6 2.1 991LFG 9 10.46 5.5 73.3 31.5 0.8 991LFG 10 10.50 6 72.6 36.5 0.3 991Site Office 11.00 0 1 21.4
Mean 71.18 29.8273 2.45
Quarterly Analysis : Date : 26th May 2009
Temp CH4 CO2 O2 Atm Pressure
(˚C) (% v/v) (% v/v) (% v/v) (m/bars)LFG 1 10.00 12.5 48.5 27.3 1.9 1008LFG 2 10.02 12.8 52.6 27.4 0.8 1008LFG 3 10.04 11.9 43.5 25.9 2.6 1008LFG 4 10.06 13 66.8 31.1 0.6 1008LFG 5 10.08 12.6 24.1 11.6 10.6 1008LFG 6 10.10 12.2 51.2 28.1 0.7 1008LFG 7 10.12 11.8 64.9 25.6 0.2 1008LFG 8 10.14 12.7 32.6 28.4 0.3 1008LFG 9 10.16 12.2 55.5 29.6 0.7 1008LFG 10 10.18 13.1 63.8 30.7 1.6 1008Site Office 10.25 0 1 24.2
Mean 50.35 24.2455 4.02
CH4 CO2 O2
(%v/v) (%v/v) (%v/v)Mean 60.77 26.95 3.24
Min 24.10 11.60 0.00Max 84.00 38.60 10.60
Sampling Pt
Time
Overall results
Sampling Pt
Time
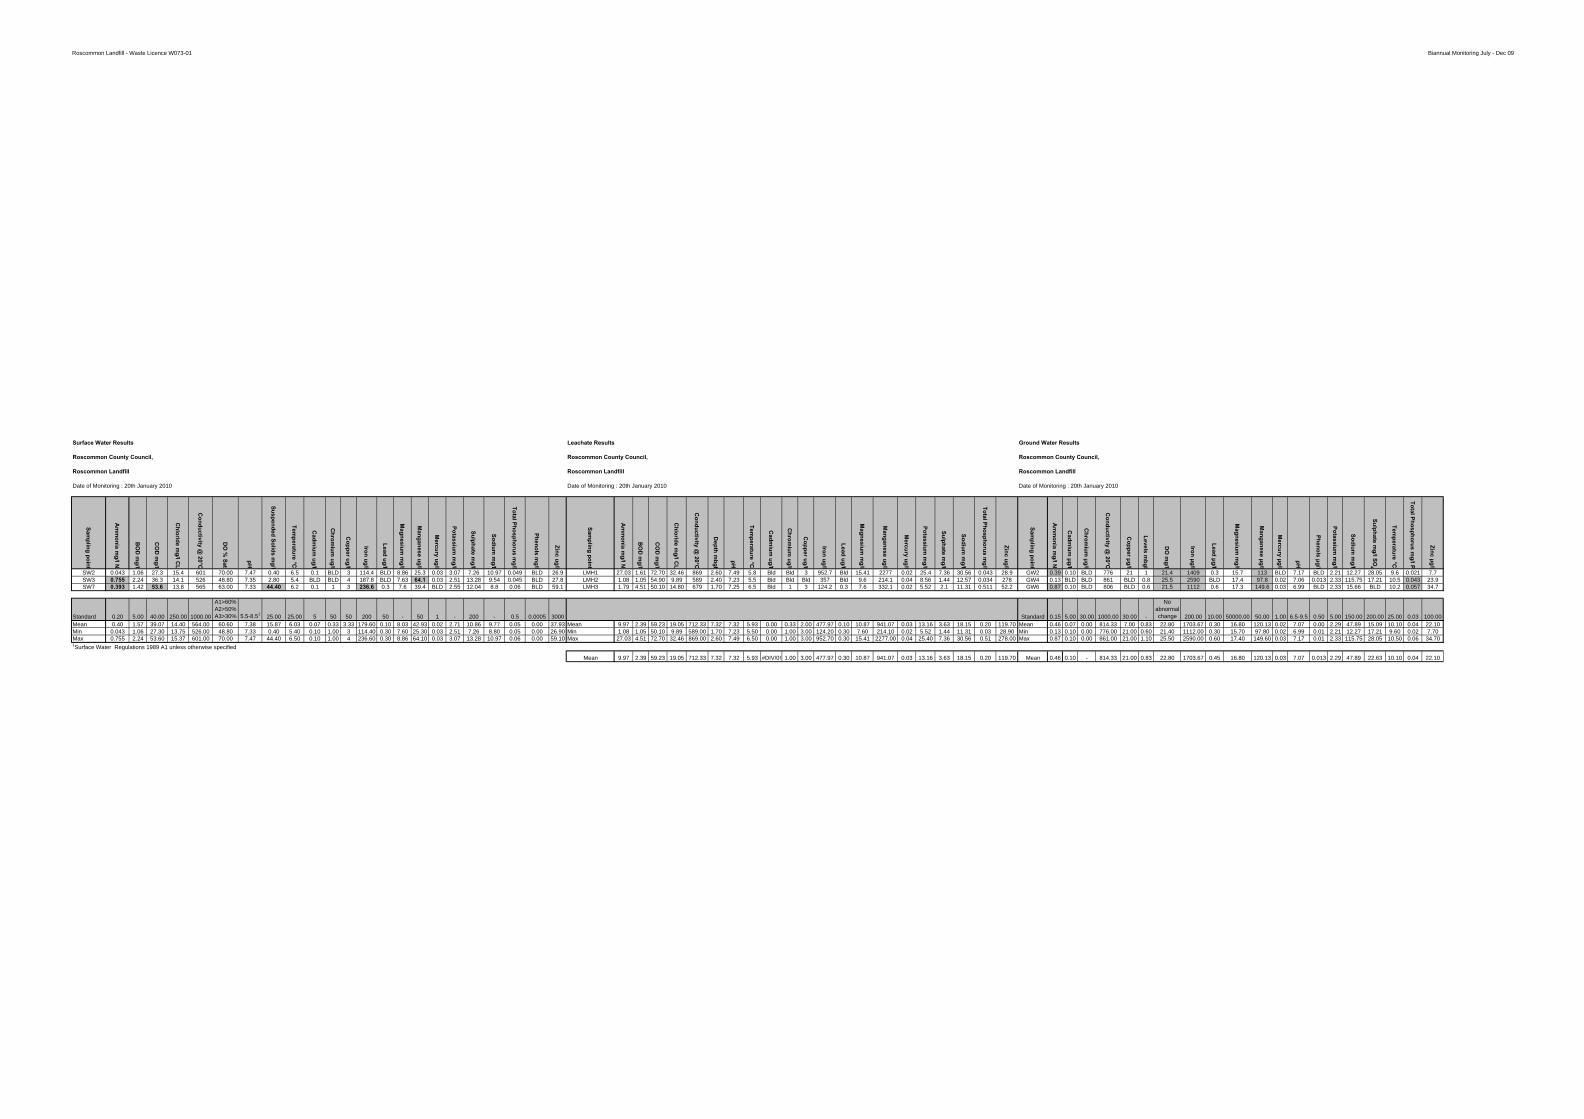
Roscommon Landfill - Waste Licence W073-01 Biannual Monitoring July - Dec 09
Surface Water Results Leachate Results Ground Water Results
Roscommon County Council, Roscommon County Council, Roscommon County Council,
Roscommon Landfill Roscommon Landfill Roscommon Landfill
Date of Monitoring : 20th January 2010 Date of Monitoring : 20th January 2010 Date of Monitoring : 20th January 2010
Sampling point
Am
monia m
g/l N
BO
D m
g/l
CO
D m
g/l
Chloride m
g/l CL
Conductivity @
20°C
DO
% Sat
pH
Suspended Solids mg/l
Temperature °C
Cadm
ium ug/l
Chrom
ium ug/l
Copper ug/l
Iron ug/l
Lead ug/l
Magnesium
mg/l
Manganese ug/l
Mercury ug/l
Potassium m
g/l
Sulphate mg/l
Sodium m
g/l
Total Phosphorus mg/l
Phenols mg/l
Zinc ug/l
Sampling point
Am
monia m
g/l N
BO
D m
g/l
CO
D m
g/l
Chloride m
g/l CL
Conductivity @
20°C
Depth m
bgl
pH
Temperature °C
Cadm
ium ug/l
Chrom
ium ug/l
Copper ug/l
Iron ug/l
Lead ug/l
Magnesium
mg/l
Manganese ug/l
Mercury ug/l
Potassium m
g/l
Sulphate mg/l
Sodium m
g/l
Total Phosphorus mg/l
Zinc ug/l
Sampling point
Am
monia m
g/l N
Cadm
ium μg/l
Chrom
ium μg/l
Conductivity @
20°C
Copper μg/l
Levels mbgl
DO
mg/l
Iron μg/l
Lead μg/l
Magnesium
mg/l
Manganese μg/l
Mercury μg/l
pH
Phenols μg/l
Potassium m
g/l
Sodium m
g/l
Sulphate mg/l SO
4
Temperature °C
Total Phosphorus mg/l P
Zinc μg/l
SW2 0.043 1.06 27.3 15.4 601 70.00 7.47 0.40 6.5 0.1 BLD 3 114.4 BLD 8.86 25.3 0.03 3.07 7.26 10.97 0.049 BLD 26.9 LMH1 27.03 1.61 72.70 32.46 869 2.60 7.49 5.8 Bld Bld 3 952.7 Bld 15.41 2277 0.02 25.4 7.36 30.56 0.043 28.9 GW2 0.39 0.10 BLD 776 21 1 21.4 1409 0.3 15.7 113 BLD 7.17 BLD 2.21 12.27 28.05 9.6 0.021 7.7SW3 0.755 2.24 36.3 14.1 526 48.80 7.35 2.80 5.4 BLD BLD 4 187.8 BLD 7.63 64.1 0.03 2.51 13.28 9.54 0.045 BLD 27.8 LMH2 1.08 1.05 54.90 9.89 589 2.40 7.23 5.5 Bld Bld Bld 357 Bld 9.6 214.1 0.04 8.56 1.44 12.57 0.034 278 GW4 0.13 BLD BLD 861 BLD 0.8 25.5 2590 BLD 17.4 97.8 0.02 7.06 0.013 2.33 115.75 17.21 10.5 0.043 23.9SW7 0.393 1.42 53.6 13.8 565 63.00 7.33 44.40 6.2 0.1 1 3 236.6 0.3 7.6 39.4 BLD 2.55 12.04 8.8 0.06 BLD 59.1 LMH3 1.79 4.51 50.10 14.80 679 1.70 7.25 6.5 Bld 1 3 124.2 0.3 7.6 332.1 0.02 5.52 2.1 11.31 0.511 52.2 GW6 0.87 0.10 BLD 806 BLD 0.6 21.5 1112 0.6 17.3 149.6 0.03 6.99 BLD 2.33 15.66 BLD 10.2 0.057 34.7
Standard 0.20 5.00 40.00 250.00 1000.00
A1>60% A2>50% A3>30% 5.5-8.51 25.00 25.00 5 50 50 200 50 - 50 1 - 200 - 0.5 0.0005 3000 Standard 0.15 5.00 30.00 1000.00 30.00 -
No abnormal change 200.00 10.00 50000.00 50.00 1.00 6.5-9.5 0.50 5.00 150.00 200.00 25.00 0.03 100.00
Mean 0.40 1.57 39.07 14.40 564.00 60.60 7.38 15.87 6.03 0.07 0.33 3.33 179.60 0.10 8.03 42.93 0.02 2.71 10.86 9.77 0.05 0.00 37.93 Mean 9.97 2.39 59.23 19.05 712.33 7.32 7.32 5.93 0.00 0.33 2.00 477.97 0.10 10.87 941.07 0.03 13.16 3.63 18.15 0.20 119.70 Mean 0.46 0.07 0.00 814.33 7.00 0.83 22.80 1703.67 0.30 16.80 120.13 0.02 7.07 0.00 2.29 47.89 15.09 10.10 0.04 22.10Min 0.043 1.06 27.30 13.75 526.00 48.80 7.33 0.40 5.40 0.10 1.00 3 114.40 0.30 7.60 25.30 0.03 2.51 7.26 8.80 0.05 0.00 26.90 Min 1.08 1.05 50.10 9.89 589.00 1.70 7.23 5.50 0.00 1.00 3.00 124.20 0.30 7.60 214.10 0.02 5.52 1.44 11.31 0.03 28.90 Min 0.13 0.10 0.00 776.00 21.00 0.60 21.40 1112.00 0.30 15.70 97.80 0.02 6.99 0.01 2.21 12.27 17.21 9.60 0.02 7.70Max 0.755 2.24 53.60 15.37 601.00 70.00 7.47 44.40 6.50 0.10 1.00 4 236.60 0.30 8.86 64.10 0.03 3.07 13.28 10.97 0.06 0.00 59.10 Max 27.03 4.51 72.70 32.46 869.00 2.60 7.49 6.50 0.00 1.00 3.00 952.70 0.30 15.41 2277.00 0.04 25.40 7.36 30.56 0.51 278.00 Max 0.87 0.10 0.00 861.00 21.00 1.10 25.50 2590.00 0.60 17.40 149.60 0.03 7.17 0.01 2.33 115.75 28.05 10.50 0.06 34.701Surface Water Regulations 1989 A1 unless otherwise specified
Mean 9.97 2.39 59.23 19.05 712.33 7.32 7.32 5.93 #DIV/0! 1.00 3.00 477.97 0.30 10.87 941.07 0.03 13.16 3.63 18.15 0.20 119.70 Mean 0.46 0.10 - 814.33 21.00 0.83 22.80 1703.67 0.45 16.80 120.13 0.03 7.07 0.013 2.29 47.89 22.63 10.10 0.04 22.10
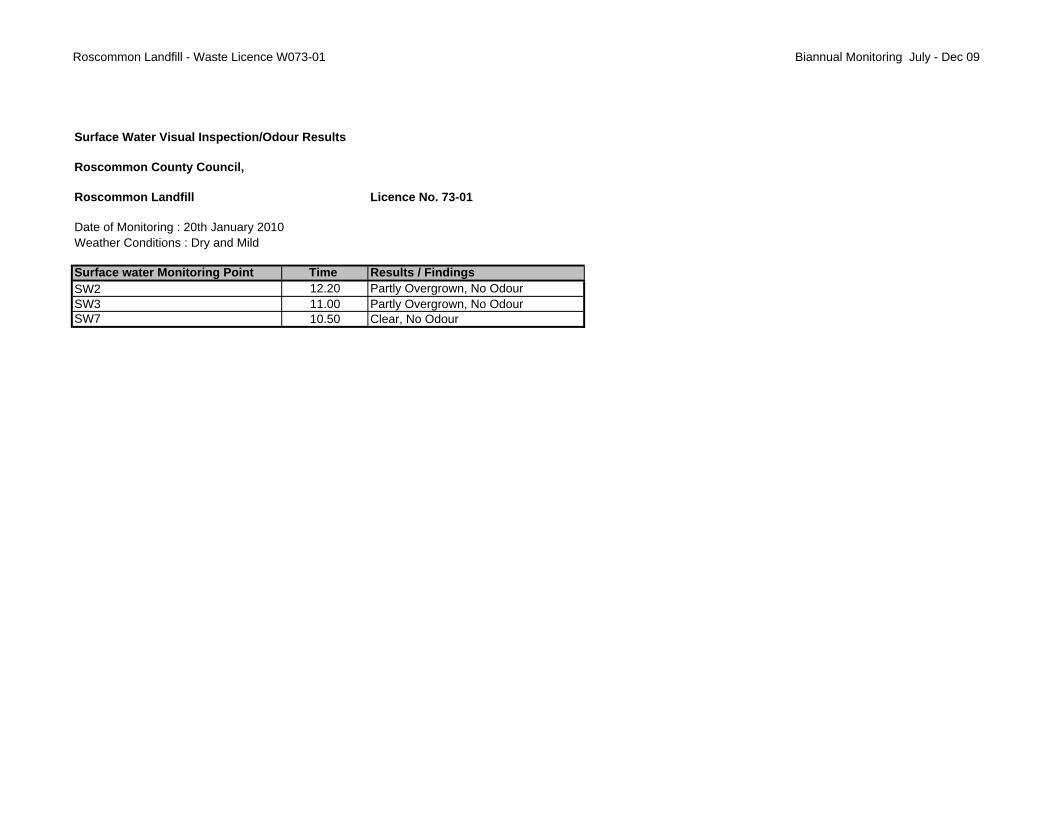
Roscommon Landfill - Waste Licence W073-01 Biannual Monitoring July - Dec 09
Surface Water Visual Inspection/Odour Results
Roscommon County Council,
Roscommon Landfill Licence No. 73-01
Date of Monitoring : 20th January 2010Weather Conditions : Dry and Mild
Surface water Monitoring Point Time Results / FindingsSW2 12.20 Partly Overgrown, No OdourSW3 11.00 Partly Overgrown, No OdourSW7 10.50 Clear, No Odour
Roscommon Landfill - Waste Licence W073-01 Biannual Monitoring July - Dec 09
Roscommon Landfill Gas Monitoring. July-December 2009
Quarterly Analysis : Date : 24th September 2009
Temp CH4 CO2 O2 Atm Pressure
(˚C) (% v/v) (% v/v) (% v/v) (m/bars)LFG 1 12.05 11.9 67.5 33.7 0.1 1019LFG 2 12.3 11.5 69.2 30.2 0.6 1019LFG 3 12.32 10.9 64.4 28.1 0.4 1019LFG 4 12.34 12.2 65.8 29.8 0.5 1019LFG 5 12.1 10.5 69.8 31.6 0.4 1019LFG 6 12.12 11.5 74.8 26.5 0.4 1019LFG 7 12.14 11.8 78.7 22 0.5 1019LFG 8 12.16 11.5 65.8 35 0.3 1019LFG 9 12.18 12 74.1 26.6 0 1019LFG 10 12.2 10.9 72.2 29.3 0 1019Site Office 12.4 0 1 25 1019
Mean 70.23 26.7091 2.56
Quarterly Analysis : Date : 10th December 2009
Temp CH4 CO2 O2 Atm Pressure
(˚C) (% v/v) (% v/v) (% v/v) (m/bars)LFG 1 11.05 8.5 63.5 34.5 0.5 1016LFG 2 11.3 8.9 70.2 30.5 0.3 1016LFG 3 11.32 9 65.8 34.5 0.5 1016LFG 4 11.34 7.9 69.4 29.5 0.4 1016LFG 5 11.1 8.2 71.2 31 0.4 1016LFG 6 11.12 8.4 63.7 28.5 0.6 1016LFG 7 11.14 9 66.6 33.6 0.4 1016LFG 8 11.16 8.6 68.5 34.2 0.5 1016LFG 9 11.18 7.8 63.8 29.6 0.3 1016LFG 10 11.2 9 70.1 32.4 0 1016Site Office 11.4 0 1 25 1016
Mean 67.28 29.0273 2.63
CH4 CO2 O2
(%v/v) (%v/v) (%v/v)Mean 68.76 27.78 2.60Min 63.50 22.00 0.00Max 78.70 35.00 0.60
Sampling Pt
Time
Overall results
Sampling Pt
Time
2009
Sampling point
Cadm
ium ug/l
Chrom
ium ug/l
Copper ug/l
Iron ug/l
Lead ug/l
Magnesium
mg/l
Manganese ug/l
Mercury ug/l
Potassium m
g/l
Sulphate mg/l
Sodium m
g/l
Phenols mg/l
Total Phosphorus mg/l
Zinc ug/l
SW2 0.1 BLD 3 114.4 BLD 8.86 25.3 0.03 3.07 7.26 10.97 BLD 0.049 26.9SW3 BLD BLD 4 187.8 BLD 7.63 64.1 0.03 2.51 13.28 9.54 BLD 0.045 27.8SW7 0.1 1 3 236.6 0.3 7.6 39.4 BLD 2.55 12.04 8.8 BLD 0.06 59.1
179.6 0.1 8.0 42.9 0.0 2.7 10.9 9.8 0.0 0.1 37.92008
Sampling point
Cadm
ium μg/l
Chrom
ium μg/l
Copper μg/l
Iron μg/l
Lead μg/l
Magnesium
mg/l
Manganese μg/l
Mercury μg/l
Potassium m
g/l
Sulphate mg/l SO
4
Sodium m
g/l
Phenols μg/l
Total Phosphorus m
g/l P
Zinc μg/l
SW2 BLD 1.00 7.00 38.20 BLD 7.10 24.10 BLD 2.40 8.97 10.00 BLD 0.03 8.30SW3 BLD BLD 7.00 141.00 BLD 7.50 85.00 BLD 2.40 20.74 10.90 BLD 0.03 7.50SW7 BLD BLD 6.00 124.00 BLD 7.60 54.90 BLD 2.80 18.15 9.20 0.01 0.05 8.60
drop 101.1 0.0 7.4 54.7 0.0 2.5 16.0 10.0 0.0 0.0 8.1
2009 2nd half
Sampling point
Am
monia m
g/l N
BO
D m
g/l
CO
D m
g/l
Chloride m
g/l CL
Conductivity @
20°C
DO
% Sat
pH
Suspended Solids mg/l
Temperature °C
SW2 0.043 1.06 27.3 15.4 601 70.00 7.47 0.40 6.5SW3 0.755 2.24 36.3 14.1 526 48.80 7.35 2.80 5.4SW7 0.393 1.42 53.6 13.8 565 63.00 7.33 44.40 6.2
2009 1st half
Sampling point
Am
monia m
g/l N
BO
D m
g/l
CO
D m
g/l
Chloride m
g/l CL
Conductivity @
20°C
DO
mg/l
pH
Suspended Solids m
g/l
Temperature °C
SW1 0.039 1.45 6.3 16.3 779 8.40 7.77 2.80 16.3SW3 0.212 8.31 61.0 30.8 740 2.58 7.41 23.20 21.3SW7 0.213 5.44 60.0 31.6 780 8.20 7.51 12.80 15.9SW7 high low low low low high low
2008
Sampling point
Am
monia m
g/l N
BO
D m
g/l
CO
D m
g/l
Chloride m
g/l C
L
Conductivity @
20°C
DO
mg/l
pH
Suspended Solids m
g/l
Temperature °C
SW2 0.09 0.74 44.00 17.30 653.00 7.97 7.73 2.00 6.70SW3 0.67 1.59 90.00 19.76 591.00 4.49 7.51 7.00 5.80SW7 0.41 0.65 74.00 16.48 613.00 6.68 7.66 1.00 6.20
SW7 lower higher lower lower lower higher
2009
Sampling point
Am
monia m
g/l N
Cadm
ium μg/l
Chrom
ium μg/l
Conductivity @
20°C
Copper μg/l
Levels mbgl
DO
mg/l
Iron μg/l
Lead μg/l
Magnesium
mg/l
Manganese μg/l
Mercury μg/l
pH
Phenols μg/l
Potassium m
g/l
Sodium m
g/l
Sulphate mg/l SO
4
Temperature °C
Total Phosphorus m
g/l P
GW2 0.39 0.10 BLD 776 21 1 21.4 1409 0.3 15.7 113 BLD 7.17 BLD 2.21 12.27 28.05 9.6 0.021GW4 0.13 BLD BLD 861 BLD 0.8 25.5 2590 BLD 17.4 97.8 0.02 7.06 0.013 2.33 115.75 17.21 10.5 0.043GW6 0.87 0.10 BLD 806 BLD 0.6 21.5 1112 0.6 17.3 149.6 0.03 6.99 BLD 2.33 15.66 BLD 10.2 0.057
MEAN 0.46 0.07 0.00 814.33 7.00 0.83 22.80 1703.67 0.30 16.80 120.13 0.02 7.07 0.00 2.29 47.89 15.09 10.10 0.042008
Sampling point
Am
monia m
g/l N
Cadm
ium μg/l
Chrom
ium μg/l
Conductivity @
20°C
Copper μg/l
Levels mbgl
DO
mg/l
Iron μg/l
Lead μg/l
Magnesium
mg/l
Manganese μg/l
Mercury μg/l
pH
Phenols μg/l
Potassium m
g/l
Sodium m
g/l
Sulphate mg/l
SO4
Temperature °C
Total Phosphorus m
g/l P
GW2 0.37 BLD BLD 793.00 8.00 1.00 2.10 52.70 BLD 16.20 93.50 BLD 7.12 BLD 2.20 12.60 31.24 9.30 0.01GW4 0.79 0.10 3.20 823.00 7.00 0.55 4.33 106.00 BLD 16.40 104.00 BLD 7.21 BLD 2.40 16.60 23.11 9.10 NTGW6 1.72 BLD 1.80 843.00 6.00 0.45 3.78 308.00 BLD 12.90 129.00 BLD 7.19 BLD 1.20 17.00 0.99 9.70 NT
MEAN 0.96 0.03 1.67 819.67 7.00 0.67 3.40 155.57 0.00 15.17 108.83 0.00 7.17 0.00 1.93 15.40 18.45 9.37 0.00low high low high high high high high high high low high
same same
2009
Cadm
ium ug/l
Chrom
ium ug/l
Copper ug/l
Iron ug/l
Lead ug/l
Magnesium
mg/l
Manganese ug/l
Mercury ug/l
Potassium m
g/l
Sulphate mg/l
Sodium m
g/l
Total Phosphorus m
g/l
Zinc ug/l
Bld Bld 3 952.7 Bld 15.41 2277 0.02 25.4 7.36 30.56 0.043 28.9Bld Bld Bld 357 Bld 9.6 214.1 0.04 8.56 1.44 12.57 0.034 278Bld 1 3 124.2 0.3 7.6 332.1 0.02 5.52 2.1 11.31 0.511 52.2
0.00 0.33 2.00 477.97 0.10 10.87 941.07 0.03 13.16 3.63 18.15 0.20 119.70
2008
Cadm
ium μg/l
Chrom
ium μg/l
Copper μg/l
Iron μg/l
Lead μg/l
Magnesium
mg/l
Manganese μg/l
Mercury μg/l
Potassium m
g/l
Sulphate mg/l SO
4
Sodium m
g/l
Total Phosphorus mg/l P
Zinc μg/l
BLD 4.30 7.00 6447.00 BLD 20.70 780.00 BLD 34.60 BLD 67.00 0.43 13.00BLD 1.20 6.00 10930.00 BLD 7.80 763.00 BLD 3.90 BLD 10.10 0.07 4.800.10 1.60 6.00 36.80 0.30 11.50 1162.00 BLD 11.60 5.48 28.80 0.04 9.60
0.03 2.37 6.33 5804.60 0.10 13.33 901.67 0.00 16.70 1.83 35.30 0.14 6.85
dec dec dec dec dec dec/inc inc dec inc dec inc inc
APPENDIX C
Meteorological Data
Year Month DayRainfall (mm)
Wind Speed (Knots)
Relative Humidity
(%)
MSL Pressure (hPa)
Max. Temp.
(Degrees Celsius)
Min. Temp.
(Degrees Celsius)
2009 1 1 0.0 11.9 97 1028.6 1.7 0.52009 1 2 0.0 9.7 88 1030.5 2.9 0.22009 1 3 0.0 6.1 85 1029.8 1.5 ‐0.32009 1 4 0.4 4.1 97 1023.6 3.8 0.32009 1 5 0.0 6.6 97 1025.3 2.8 ‐1.82009 1 6 0.0 4.5 89 1028.9 ‐0.1 ‐3.82009 1 7 0.0 4.5 94 1027.1 2.9 ‐2.82009 1 8 0.0 7.6 95 1025.8 2.6 ‐2.52009 1 9 0.0 12.0 88 1022.4 5 ‐1.52009 1 10 2.5 21.4 91 1010.8 7.8 1.62009 1 11 15.2 21.7 97 1000.5 10.6 7.72009 1 12 1.9 8.7 90 1000.6 8.5 2.82009 1 13 0.4 4.2 97 1007.4 5.4 ‐0.32009 1 14 11.6 15.7 98 999.5 9.7 ‐1.42009 1 15 1.0 16.7 92 994.1 9.5 3.22009 1 16 3.1 12.7 94 998.1 8.5 2.92009 1 17 13.5 17.2 88 987.2 6.2 ‐0.32009 1 18 11.6 12.4 91 984.7 3.5 ‐0.42009 1 19 7.3 11.1 93 974.4 3.2 ‐0.92009 1 20 9.0 11.7 91 984.3 3.2 ‐0.32009 1 21 10.0 10.8 99 987.2 8.8 ‐0.62009 1 22 4.6 13.7 88 976.4 9.2 1.12009 1 23 2.9 8.9 92 978.3 5.5 ‐0.42009 1 24 5.6 10.1 96 981.8 3.9 ‐0.12009 1 25 22.9 7.6 91 973.1 5.9 0.22009 1 26 4.5 10.5 89 998.7 7.2 2.42009 1 27 2.2 5.5 96 1006.3 8 1.92009 1 28 0.0 9.5 98 1010.0 8 22009 1 29 4.1 19.7 94 1000.7 8.3 3.62009 1 30 10.4 13.0 97 998.0 9.6 4.82009 1 31 13.2 6.6 99 1002.7 6 4.62009 2 1 0.1 12.3 88 1011.6 4.7 02009 2 2 0.0 9.5 85 1009.8 1.9 ‐2.32009 2 3 2.5 12.5 91 992.2 1.9 ‐1.22009 2 4 0.8 11.6 88 993.0 4.4 0.22009 2 5 0.2 12.6 84 997.8 2.4 ‐1.22009 2 6 1.0 8.8 89 1000.5 4.3 ‐1.12009 2 7 1.4 6.9 80 1005.2 3.3 ‐0.82009 2 8 2.6 7.6 92 998.5 5.3 ‐2.12009 2 9 0.9 4.6 95 996.1 3.8 ‐0.62009 2 10 0.9 7.5 93 1007.3 5.9 ‐0.62009 2 11 0.1 6.7 94 1019.8 7.7 1.1
Knock Airport
2009 2 12 0.5 7.9 97 1024.7 9.9 2.12009 2 13 0.3 4.9 94 1025.2 9.4 4.22009 2 14 0.3 7.3 95 1025.6 8.4 4.32009 2 15 0.2 6.8 96 1026.8 9.6 4.32009 2 16 0.1 7.1 94 1027.1 9.6 4.22009 2 17 0.0 4.8 91 1029.6 8.8 3.12009 2 18 0.4 6.5 92 1026.5 6.3 52009 2 19 3.6 5.2 90 1029.8 8.3 2.52009 2 20 0.0 5.4 89 1032.3 8.6 0.92009 2 21 0.2 10.8 91 1032.3 10.2 4.62009 2 22 1.0 9.2 95 1031.6 10 5.72009 2 23 1.0 7.5 98 1029.5 9.3 5.82009 2 24 0.1 5.1 92 1028.1 8.7 5.22009 2 25 1.4 9.2 85 1027.0 8.8 3.72009 2 26 1.3 12.9 90 1022.8 9.5 3.72009 2 27 0.4 10.9 93 1016.9 8.9 6.12009 2 28 6.0 10.5 97 1007.2 9.7 4.72009 3 1 1.9 9.3 90 1008.8 8.7 2.12009 3 2 1.0 11.8 93 1012.6 9.2 2.22009 3 3 6.8 10.3 92 992.6 4.4 ‐1.62009 3 4 4.2 6.6 98 981.3 2.2 ‐2.32009 3 5 2.9 8.5 87 997.7 6.5 ‐0.92009 3 6 1.7 10.4 91 1003.2 8.8 0.72009 3 7 5.2 13.7 91 1000.9 10.4 1.62009 3 8 7.2 15.4 85 998.8 5 ‐0.22009 3 9 8.1 13.3 87 1006.7 7.8 2.42009 3 10 1.3 7.2 90 1010.5 9.8 4.62009 3 11 4.9 14.2 98 1016.0 10.5 7.12009 3 12 0.1 10.6 80 1018.3 10.4 3.52009 3 13 2.0 13.4 95 1009.5 9.2 3.62009 3 14 1.3 15.8 76 1016.8 10.4 5.12009 3 15 0.0 9.3 89 1028.6 9.2 5.12009 3 16 1.3 8.2 95 1030.0 8.9 6.12009 3 17 0.1 9.3 85 1032.0 13.2 4.92009 3 18 0.0 7.5 76 1029.5 15.6 2.12009 3 19 0.0 9.8 85 1026.6 13.9 0.52009 3 20 0.0 9.7 85 1027.2 13 2.82009 3 21 0.0 8.5 82 1035.3 11.1 4.22009 3 22 0.0 10.5 83 1035.5 12.1 5.22009 3 23 0.9 16.4 79 1024.9 9 2.32009 3 24 0.5 13.0 87 1018.8 10.9 22009 3 25 1.3 18.1 79 1009.8 10.1 4.92009 3 26 4.2 19.8 80 1001.0 9.1 3.22009 3 27 6.9 17.1 83 999.0 7.5 1.92009 3 28 0.9 13.8 65 1011.7 6.4 1.22009 3 29 1.3 9.9 94 1009.1 9 0.82009 3 30 0.0 7.7 89 1017.2 12.9 6.1
2009 3 31 0.3 5.9 90 1021.4 12.9 62009 4 1 0.0 7.3 84 1022.1 11.7 5.92009 4 2 0.0 9.5 73 1019.5 14.8 2.12009 4 3 8.3 9.1 97 1011.8 10.6 2.92009 4 4 1.6 11.1 79 1017.2 10 3.52009 4 5 0.4 11.8 82 1016.6 10.5 32009 4 6 3.9 15.4 87 1000.3 10.3 4.42009 4 7 16.3 13.0 94 993.4 8.7 3.72009 4 8 1.1 12.0 78 999.5 10.7 4.32009 4 9 18.9 11.8 97 992.1 10.3 4.52009 4 10 4.5 6.6 88 998.9 8.2 2.12009 4 11 1.6 6.5 86 1007.2 11 1.62009 4 12 0.0 6.9 80 1011.7 12.3 2.22009 4 13 17.1 9.0 96 1003.9 10.7 5.92009 4 14 1.0 8.1 87 1005.7 12.2 4.42009 4 15 1.7 8.5 93 1010.2 9.9 5.12009 4 16 0.0 12.6 73 1009.4 15.9 82009 4 17 0.0 10.5 83 1013.8 10.4 6.32009 4 18 0.0 8.8 74 1020.2 14.7 5.52009 4 19 0.0 8.1 77 1023.9 14.5 3.32009 4 20 0.8 7.0 89 1026.6 14.4 7.62009 4 21 1.2 7.5 76 1026.3 13.3 62009 4 22 3.0 12.8 86 1019.8 12.6 3.32009 4 23 6.8 6.5 87 1015.7 12.6 5.52009 4 24 8.6 6.1 92 1009.7 9.7 5.22009 4 25 0.8 13.8 86 1007.3 10.4 5.42009 4 26 5.2 9.4 93 1003.6 9.8 52009 4 27 3.6 8.1 84 995.0 10.6 1.92009 4 28 0.9 8.0 86 1004.2 12.2 4.32009 4 29 8.8 6.8 91 1002.1 11.6 7.22009 4 30 1.7 8.0 77 1010.5 13.8 5.72009 5 1 5.0 14.6 80 1016.1 12.7 4.72009 5 2 3.3 9.6 79 1025.8 12.5 3.42009 5 3 2.0 11.1 82 1029.5 10.8 2.12009 5 4 1.6 15.6 98 1022.7 11.4 6.82009 5 5 8.0 18.1 99 1017.6 11.8 8.82009 5 6 8.6 16.1 96 1009.9 11.1 5.32009 5 7 6.1 17.3 86 1001.7 9.3 4.12009 5 8 4.2 16.9 82 1002.6 10.7 4.62009 5 9 4.3 10.6 82 1010.0 11.8 3.82009 5 10 0.0 4.3 71 1020.4 14.6 4.52009 5 11 0.0 11.5 60 1024.7 15.5 5.52009 5 12 0.0 12.7 70 1023.3 13.6 4.22009 5 13 0.4 12.2 80 1014.9 14.5 4.92009 5 14 5.7 7.2 99 1008.7 11.6 8.22009 5 15 14.0 8.5 97 1000.1 10.1 4.52009 5 16 13.2 13.0 92 989.6 10.5 4.5
2009 5 17 5.2 10.8 93 995.1 10.2 4.52009 5 18 2.5 5.5 88 1000.6 12.1 6.72009 5 19 2.5 5.3 90 1008.5 12.8 5.62009 5 20 2.7 6.8 81 1013.3 13.8 5.22009 5 21 2.8 9.0 83 1013.1 13.2 5.42009 5 22 4.1 7.2 93 1011.4 16.4 7.62009 5 23 10.2 10.4 84 1014.0 13.3 6.62009 5 24 0.1 11.8 93 1017.7 12 62009 5 25 3.8 9.9 89 1015.0 13.2 6.12009 5 26 0.9 13.3 78 1016.0 12.5 4.52009 5 27 4.6 15.8 99 1015.3 13 7.82009 5 28 0.1 10.2 92 1027.8 14.9 9.82009 5 29 0.0 11.4 84 1025.9 19.9 10.32009 5 30 0.5 9.0 81 1023.3 21.4 10.92009 5 31 0.0 6.6 64 1027.1 22.7 11.32009 6 1 0.0 5.6 65 1027.6 23.7 11.22009 6 2 0.0 4.8 60 1027.5 25.2 13.22009 6 3 0.0 6.3 68 1024.2 20.7 12.62009 6 4 0.0 6.1 72 1019.6 18.7 82009 6 5 0.0 10.3 65 1013.2 13.8 5.82009 6 6 0.5 10.7 71 1008.4 12.4 4.92009 6 7 0.0 6.6 74 1007.2 13.9 5.82009 6 8 0.2 8.3 66 1008.6 15.5 7.32009 6 9 0.0 6.3 68 1011.6 15.1 6.52009 6 10 0.0 6.6 74 1012.9 14.6 6.62009 6 11 0.0 5.2 65 1019.1 15.5 62009 6 12 11.8 8.4 89 1016.7 16.2 7.52009 6 13 2.5 8.5 85 1014.8 17.5 9.42009 6 14 2.0 6.5 82 1015.9 17.7 9.32009 6 15 0.4 4.6 79 1016.1 18.1 9.92009 6 16 6.0 8.3 84 1017.8 18.5 9.42009 6 17 12.0 13.0 82 1010.3 14.8 8.22009 6 18 4.6 15.3 84 1013.5 13.7 8.32009 6 19 0.0 13.5 78 1022.5 13.5 82009 6 20 0.8 11.0 81 1026.8 16.2 10.22009 6 21 0.4 7.3 96 1027.1 17 10.92009 6 22 0.0 4.7 81 1028.8 20.9 13.22009 6 23 0.0 7.4 75 1027.1 23.9 14.32009 6 24 2.3 9.5 67 1020.7 22.5 12.42009 6 25 0.0 9.7 72 1014.9 20.8 10.72009 6 26 6.4 8.4 87 1012.5 19.7 13.62009 6 27 0.1 6.0 81 1014.2 22.1 13.62009 6 28 4.5 10.1 82 1013.5 20.8 11.62009 6 29 1.0 5.5 78 1015.1 21.3 12.62009 6 30 8.9 8.8 94 1017.6 17.7 11.12009 7 1 3.0 2.7 95 1019.8 19.7 13.62009 7 2 0.2 8.2 95 1015.3 19.9 15.9
2009 7 3 5.3 8.6 82 1008.5 19.3 12.12009 7 4 19.5 9.0 87 1005.4 18.3 10.82009 7 5 7.1 7.4 88 1001.8 18.6 9.92009 7 6 16.1 9.5 92 1003.1 16.9 11.92009 7 7 0.2 12.7 82 1010.8 17 102009 7 8 0.1 8.9 75 1018.0 16 10.12009 7 9 0.0 6.6 72 1019.8 16.6 10.22009 7 10 3.9 6.3 86 1015.4 14.3 8.22009 7 11 8.6 12.2 98 1002.9 16.9 13.12009 7 12 0.6 12.4 80 999.7 17.2 112009 7 13 15.2 6.6 95 1000.8 14.5 9.82009 7 14 4.9 4.5 91 1002.0 17.6 8.22009 7 15 7.2 6.0 88 1009.2 17 11.42009 7 16 1.2 7.0 82 1015.7 17.2 9.42009 7 17 0.0 11.5 77 1016.5 16.8 9.22009 7 18 3.3 5.5 91 1011.3 14 10.62009 7 19 6.8 7.9 89 1009.0 15.8 9.42009 7 20 2.1 8.2 89 1009.5 17.1 9.62009 7 21 9.2 10.0 94 996.2 17.6 10.12009 7 22 1.0 8.3 91 992.5 16.7 8.22009 7 23 12.6 6.4 96 998.2 13.6 112009 7 24 2.2 6.4 89 1009.2 17.1 10.52009 7 25 3.1 8.0 85 1016.5 18.1 8.42009 7 26 12.4 16.1 93 1003.9 15.6 11.42009 7 27 3.4 10.9 83 1006.3 16.3 10.52009 7 28 6.4 13.2 92 1004.4 14.8 10.52009 7 29 1.7 9.7 80 1007.5 17.1 9.32009 7 30 6.1 9.0 79 1016.2 16.3 8.12009 7 31 6.4 16.3 95 1007.4 14.2 10.52009 8 1 2.6 14.4 88 1004.4 14.1 10.12009 8 2 6.3 8.5 91 1008.1 15.2 9.22009 8 3 8.2 13.2 95 1002.6 17 12.32009 8 4 2.0 13.1 83 1004.2 17.8 11.92009 8 5 1.3 15.4 83 1010.2 16.9 10.62009 8 6 0.8 8.9 84 1017.5 17.4 9.92009 8 7 0.3 8.5 81 1020.0 16.9 8.92009 8 8 1.7 7.1 89 1018.5 16.7 12.22009 8 9 2.0 7.7 90 1016.1 15.3 11.22009 8 10 2.5 9.3 92 1013.6 17.9 12.42009 8 11 4.3 8.2 96 1021.2 15.8 12.12009 8 12 2.1 7.9 91 1020.5 16.5 11.82009 8 13 0.2 3.7 81 1020.3 16.1 11.22009 8 14 11.0 13.3 98 1009.1 16.5 12.42009 8 15 6.8 12.5 87 1007.7 16.8 122009 8 16 3.7 12.3 93 1011.5 15.8 122009 8 17 0.7 8.1 87 1013.2 17 11.72009 8 18 4.6 11.8 97 1009.4 18.3 12.7
2009 8 19 14.5 10.7 96 1004.8 16.1 12.52009 8 20 16.9 9.6 92 1003.9 16.1 9.52009 8 21 3.4 10.0 85 1014.4 15.3 7.72009 8 22 14.7 9.6 90 1015.9 15.9 7.82009 8 23 16.1 10.8 94 1003.5 16.1 82009 8 24 3.5 12.1 89 1000.2 15.1 8.12009 8 25 2.2 9.3 84 1001.9 15.9 9.12009 8 26 14.5 11.7 94 999.3 15.2 9.62009 8 27 6.6 12.3 93 1005.1 14.7 8.92009 8 28 5.6 12.9 88 1011.8 13.8 8.22009 8 29 0.5 9.6 84 1018.9 14.8 8.62009 8 30 9.3 10.3 99 1008.6 16.5 8.82009 8 31 12.9 9.4 93 998.8 14.8 9.62009 9 1 5.9 9.8 94 998.9 14.3 8.32009 9 2 1.0 6.7 94 999.8 13.3 9.32009 9 3 1.2 12.4 83 1001.2 13.9 8.42009 9 4 0.2 13.1 82 1011.1 14.2 7.92009 9 5 0.3 11.6 80 1018.1 14.5 10.12009 9 6 8.1 12.5 97 1011.7 14.9 9.92009 9 7 3.7 10.5 90 1011.0 15.1 9.92009 9 8 11.5 14.7 90 1009.4 16.2 8.22009 9 9 0.2 6.4 80 1031.9 16.4 7.32009 9 10 0.0 3.8 82 1039.7 16.8 92009 9 11 0.0 4.5 75 1038.6 18.7 8.42009 9 12 0.0 3.4 75 1033.7 19.2 9.62009 9 13 0.0 3.8 70 1031.8 19.9 9.62009 9 14 0.0 4.8 83 1031.5 16.4 9.92009 9 15 2.8 7.0 93 1030.9 14 10.52009 9 16 0.0 7.1 75 1030.0 15.4 7.92009 9 17 0.0 4.1 81 1025.0 15.2 7.12009 9 18 0.0 7.0 80 1017.7 12.8 6.72009 9 19 0.8 8.4 78 1016.9 14.2 6.52009 9 20 0.2 9.2 87 1022.6 14.2 7.12009 9 21 2.8 17.6 94 1017.6 14.3 12.22009 9 22 1.6 12.6 89 1019.3 14.2 9.42009 9 23 0.3 9.0 85 1024.0 14.5 7.42009 9 24 0.0 9.3 84 1025.9 14.9 9.62009 9 25 0.0 10.0 83 1025.9 16.5 10.72009 9 26 0.5 6.5 95 1027.8 17.3 10.52009 9 27 1.0 9.1 96 1028.5 15 11.62009 9 28 0.7 11.3 94 1028.1 13.9 11.72009 9 29 0.4 9.3 97 1025.2 13.7 11.12009 9 30 3.2 8.4 98 1022.2 13.9 92009 10 1 0.1 6.3 86 1023.8 11.4 7.42009 10 2 1.9 11.6 96 1018.7 13.3 8.42009 10 3 4.3 16.1 84 1007.1 12 62009 10 4 0.2 4.9 86 1011.4 12 4.9
2009 10 5 0.1 6.7 88 1007.5 14 6.22009 10 6 0.1 8.5 80 1004.5 10.7 5.42009 10 7 0.0 5.2 78 1013.7 11.6 3.62009 10 8 0.0 4.6 78 1018.4 12.8 4.82009 10 9 6.0 10.1 92 1008.7 12.3 6.92009 10 10 0.4 6.3 90 1014.6 13.8 92009 10 11 2.3 8.6 88 1019.2 11.7 8.12009 10 12 0.0 4.0 88 1029.4 13 5.52009 10 13 0.9 4.5 99 1029.5 14.5 112009 10 14 0.4 4.3 96 1030.1 15.8 9.82009 10 15 0.0 2.8 92 1034.8 14 8.52009 10 16 0.0 3.7 87 1037.3 14.6 7.72009 10 17 0.3 5.2 92 1031.3 12 5.82009 10 18 9.1 5.8 100 1019.3 11.2 8.22009 10 19 5.3 12.8 96 1000.7 11.6 9.12009 10 20 12.5 11.0 95 985.6 12.8 6.32009 10 21 3.1 13.4 93 984.6 12.5 6.22009 10 22 0.2 6.8 94 990.6 13.8 8.22009 10 23 0.5 5.1 97 1001.4 12.4 6.12009 10 24 18.0 21.0 94 992.3 13.5 10.52009 10 25 4.8 15.3 93 1005.9 12.3 92009 10 26 7.4 7.2 96 1014.3 12.4 92009 10 27 5.2 14.5 97 1005.9 14.1 11.52009 10 28 5.6 9.8 97 1011.2 15.3 10.42009 10 29 0.4 12.7 98 1011.7 14.6 10.42009 10 30 17.3 13.8 98 1007.8 15 11.42009 10 31 3.0 10.8 95 1012.1 13.8 10.32009 11 1 19.7 10.7 91 998.2 10.9 6.22009 11 2 10.5 8.8 91 995.1 10 4.82009 11 3 12.9 11.6 93 982.8 9.9 5.12009 11 4 7.4 16.0 90 984.1 9.3 5.52009 11 5 2.9 16.0 92 998.2 9.1 5.42009 11 6 12.0 10.8 92 995.4 9.2 2.82009 11 7 12.4 10.6 93 990.5 8 3.82009 11 8 0.5 6.8 90 1012.3 10.8 5.72009 11 9 12.7 9.8 100 1015.2 8.5 42009 11 10 0.2 5.7 91 1012.9 9.9 3.82009 11 11 8.1 9.5 96 1000.4 7.5 1.82009 11 12 12.0 10.5 96 986.7 8 3.72009 11 13 1.7 8.8 93 988.8 8.4 3.22009 11 14 9.3 9.8 89 984.0 9.1 2.42009 11 15 4.5 10.8 93 993.6 10.4 3.12009 11 16 30.8 10.3 98 989.6 8.2 5.42009 11 17 20.5 7.4 96 997.7 8.4 3.42009 11 18 22.7 12.2 99 994.9 11.9 3.52009 11 19 14.5 15.8 97 988.9 11.9 9.92009 11 20 4.0 9.1 89 1002.6 10 3.8
2009 11 21 22.4 17.4 93 993.1 11.8 52009 11 22 14.6 20.8 92 984.0 8.9 4.12009 11 23 3.9 11.7 93 994.7 9.6 5.42009 11 24 18.1 15.3 94 989.4 11.1 3.92009 11 25 9.0 16.7 87 985.7 7.7 3.72009 11 26 7.4 8.6 94 992.2 5.4 22009 11 27 7.1 6.3 97 994.4 4.9 ‐0.72009 11 28 0.1 3.8 100 991.9 2.6 ‐2.62009 11 29 0.1 9.9 90 996.6 5.6 ‐1.82009 11 30 0.3 5.5 94 1011.3 4.8 ‐12009 12 1 6.6 13.1 98 998.6 6.8 ‐0.42009 12 2 0.3 7.8 97 991.1 7.6 3.62009 12 3 2.2 11.1 90 1002.6 4.6 0.62009 12 4 3.3 7.9 99 999.4 8.9 0.92009 12 5 7.4 10.2 98 984.8 9.9 4.82009 12 6 3.8 13.9 88 982.0 6.8 3.12009 12 7 5.6 9.5 96 989.8 6.7 1.72009 12 8 4.0 13.0 93 997.6 9.7 3.62009 12 9 2.0 8.6 94 1008.7 7.5 3.22009 12 10 0.0 6.8 97 1025.4 6.4 2.12009 12 11 0.8 13.6 96 1028.0 8.2 3.52009 12 12 0.0 10.5 94 1032.9 4.8 1.52009 12 13 0.0 4.8 92 1034.1 5.3 0.22009 12 14 0.6 5.6 93 1028.5 7.2 0.52009 12 15 0.6 7.3 93 1023.0 7.3 1.92009 12 16 2.0 5.9 96 1018.2 7 2.72009 12 17 0.0 6.6 89 1020.9 4.3 ‐0.22009 12 18 0.0 4.5 84 1026.2 0.3 ‐2.42009 12 19 2.3 7.9 94 1015.0 4.5 ‐2.12009 12 20 3.4 8.0 99 1001.0 0.1 ‐2.42009 12 21 3.3 5.6 96 988.2 0.9 ‐2.42009 12 22 3.5 6.6 97 986.3 1.3 ‐32009 12 23 0.0 3.5 98 987.2 0.2 ‐4.62009 12 24 0.0 2.5 93 990.1 1.5 ‐3.72009 12 25 4.4 6.5 99 993.7 1 ‐6.12009 12 26 6.2 7.3 99 989.8 1.8 ‐0.62009 12 27 2.1 9.3 92 1000.5 3.2 ‐1.32009 12 28 0.0 6.1 94 1003.0 1.5 ‐42009 12 29 1.8 13.6 92 997.2 2 0.12009 12 30 10.5 17.9 96 996.3 2.2 ‐0.12009 12 31 0.0 12.2 78 1009.2 1.5 ‐1.6
Knock Airport
Year Month DayRainfall (mm) Year Month
Rainfall (mm)
2009 1 1 0.0 2009 January 157.92009 1 2 0.0 2009 February 27.32009 1 3 0.0 2009 March 66.32009 1 4 0.4 2009 April 117.82009 1 5 0.0 2009 May 116.42009 1 6 0.0 2009 June 64.42009 1 7 0.0 2009 July 169.82009 1 8 0.0 2009 August 181.82009 1 9 0.0 2009 September 46.42009 1 10 2.5 2009 October 109.42009 1 11 15.2 2009 November 302.32009 1 12 1.9 2009 December 76.72009 1 13 0.4 1436.52009 1 14 11.62009 1 15 1.02009 1 16 3.12009 1 17 13.52009 1 18 11.62009 1 19 7.32009 1 20 9.02009 1 21 10.02009 1 22 4.62009 1 23 2.92009 1 24 5.62009 1 25 22.92009 1 26 4.52009 1 27 2.22009 1 28 0.02009 1 29 4.12009 1 30 10.42009 1 31 13.2
157.92009 2 1 0.12009 2 2 0.02009 2 3 2.52009 2 4 0.82009 2 5 0.22009 2 6 1.02009 2 7 1.42009 2 8 2.62009 2 9 0.92009 2 10 0.92009 2 11 0.12009 2 12 0.52009 2 13 0.32009 2 14 0.32009 2 15 0.22009 2 16 0.12009 2 17 0.02009 2 18 0.42009 2 19 3.62009 2 20 0.02009 2 21 0.22009 2 22 1.02009 2 23 1.02009 2 24 0.12009 2 25 1.42009 2 26 1.32009 2 27 0.42009 2 28 6.0
27.32009 3 1 1.92009 3 2 1.02009 3 3 6.8
0.050.0
100.0150.0200.0250.0300.0350.0
Janu
ary
Februa
ryMarc
hApri
lMay
Ju
ne July
Augus
t
Septem
ber
Octobe
r
Novem
ber
Decem
ber
Month
Rai
nfal
l (m
m)
2009 3 4 4.22009 3 5 2.92009 3 6 1.72009 3 7 5.22009 3 8 7.22009 3 9 8.12009 3 10 1.32009 3 11 4.92009 3 12 0.12009 3 13 2.02009 3 14 1.32009 3 15 0.02009 3 16 1.32009 3 17 0.12009 3 18 0.02009 3 19 0.02009 3 20 0.02009 3 21 0.02009 3 22 0.02009 3 23 0.92009 3 24 0.52009 3 25 1.32009 3 26 4.22009 3 27 6.92009 3 28 0.92009 3 29 1.32009 3 30 0.02009 3 31 0.3
66.32009 4 1 0.02009 4 2 0.02009 4 3 8.32009 4 4 1.62009 4 5 0.42009 4 6 3.92009 4 7 16.32009 4 8 1.12009 4 9 18.92009 4 10 4.52009 4 11 1.62009 4 12 0.02009 4 13 17.12009 4 14 1.02009 4 15 1.72009 4 16 0.02009 4 17 0.02009 4 18 0.02009 4 19 0.02009 4 20 0.82009 4 21 1.22009 4 22 3.02009 4 23 6.82009 4 24 8.62009 4 25 0.82009 4 26 5.22009 4 27 3.62009 4 28 0.92009 4 29 8.82009 4 30 1.7
117.82009 5 1 5.02009 5 2 3.32009 5 3 2.02009 5 4 1.62009 5 5 8.02009 5 6 8.62009 5 7 6.1
2009 5 8 4.22009 5 9 4.32009 5 10 0.02009 5 11 0.02009 5 12 0.02009 5 13 0.42009 5 14 5.72009 5 15 14.02009 5 16 13.22009 5 17 5.22009 5 18 2.52009 5 19 2.52009 5 20 2.72009 5 21 2.82009 5 22 4.12009 5 23 10.22009 5 24 0.12009 5 25 3.82009 5 26 0.92009 5 27 4.62009 5 28 0.12009 5 29 0.02009 5 30 0.52009 5 31 0.0
116.42009 6 1 0.02009 6 2 0.02009 6 3 0.02009 6 4 0.02009 6 5 0.02009 6 6 0.52009 6 7 0.02009 6 8 0.22009 6 9 0.02009 6 10 0.02009 6 11 0.02009 6 12 11.82009 6 13 2.52009 6 14 2.02009 6 15 0.42009 6 16 6.02009 6 17 12.02009 6 18 4.62009 6 19 0.02009 6 20 0.82009 6 21 0.42009 6 22 0.02009 6 23 0.02009 6 24 2.32009 6 25 0.02009 6 26 6.42009 6 27 0.12009 6 28 4.52009 6 29 1.02009 6 30 8.9
64.42009 7 1 3.02009 7 2 0.22009 7 3 5.32009 7 4 19.52009 7 5 7.12009 7 6 16.12009 7 7 0.22009 7 8 0.12009 7 9 0.02009 7 10 3.92009 7 11 8.6
2009 7 12 0.62009 7 13 15.22009 7 14 4.92009 7 15 7.22009 7 16 1.22009 7 17 0.02009 7 18 3.32009 7 19 6.82009 7 20 2.12009 7 21 9.22009 7 22 1.02009 7 23 12.62009 7 24 2.22009 7 25 3.12009 7 26 12.42009 7 27 3.42009 7 28 6.42009 7 29 1.72009 7 30 6.12009 7 31 6.4
169.82009 8 1 2.62009 8 2 6.32009 8 3 8.22009 8 4 2.02009 8 5 1.32009 8 6 0.82009 8 7 0.32009 8 8 1.72009 8 9 2.02009 8 10 2.52009 8 11 4.32009 8 12 2.12009 8 13 0.22009 8 14 11.02009 8 15 6.82009 8 16 3.72009 8 17 0.72009 8 18 4.62009 8 19 14.52009 8 20 16.92009 8 21 3.42009 8 22 14.72009 8 23 16.12009 8 24 3.52009 8 25 2.22009 8 26 14.52009 8 27 6.62009 8 28 5.62009 8 29 0.52009 8 30 9.32009 8 31 12.9
181.82009 9 1 5.92009 9 2 1.02009 9 3 1.22009 9 4 0.22009 9 5 0.32009 9 6 8.12009 9 7 3.72009 9 8 11.52009 9 9 0.22009 9 10 0.02009 9 11 0.02009 9 12 0.02009 9 13 0.02009 9 14 0.0
2009 9 15 2.82009 9 16 0.02009 9 17 0.02009 9 18 0.02009 9 19 0.82009 9 20 0.22009 9 21 2.82009 9 22 1.62009 9 23 0.32009 9 24 0.02009 9 25 0.02009 9 26 0.52009 9 27 1.02009 9 28 0.72009 9 29 0.42009 9 30 3.2
46.42009 10 1 0.12009 10 2 1.92009 10 3 4.32009 10 4 0.22009 10 5 0.12009 10 6 0.12009 10 7 0.02009 10 8 0.02009 10 9 6.02009 10 10 0.42009 10 11 2.32009 10 12 0.02009 10 13 0.92009 10 14 0.42009 10 15 0.02009 10 16 0.02009 10 17 0.32009 10 18 9.12009 10 19 5.32009 10 20 12.52009 10 21 3.12009 10 22 0.22009 10 23 0.52009 10 24 18.02009 10 25 4.82009 10 26 7.42009 10 27 5.22009 10 28 5.62009 10 29 0.42009 10 30 17.32009 10 31 3.0
109.42009 11 1 19.72009 11 2 10.52009 11 3 12.92009 11 4 7.42009 11 5 2.92009 11 6 12.02009 11 7 12.42009 11 8 0.52009 11 9 12.72009 11 10 0.22009 11 11 8.12009 11 12 12.02009 11 13 1.72009 11 14 9.32009 11 15 4.52009 11 16 30.82009 11 17 20.52009 11 18 22.7
2009 11 19 14.52009 11 20 4.02009 11 21 22.42009 11 22 14.62009 11 23 3.92009 11 24 18.12009 11 25 9.02009 11 26 7.42009 11 27 7.12009 11 28 0.12009 11 29 0.12009 11 30 0.3
302.32009 12 1 6.62009 12 2 0.32009 12 3 2.22009 12 4 3.32009 12 5 7.42009 12 6 3.82009 12 7 5.62009 12 8 4.02009 12 9 2.02009 12 10 0.02009 12 11 0.82009 12 12 0.02009 12 13 0.02009 12 14 0.62009 12 15 0.62009 12 16 2.02009 12 17 0.02009 12 18 0.02009 12 19 2.32009 12 20 3.42009 12 21 3.32009 12 22 3.52009 12 23 0.02009 12 24 0.02009 12 25 4.42009 12 26 6.22009 12 27 2.12009 12 28 0.02009 12 29 1.82009 12 30 10.52009 12 31 0.0
76.7