Embed Size (px)
Citation preview
Rosemont Copper Company Emission Inventory Information Years 1, 5, 10, 15, and 20 Volume II: Appendix H - Emission Tables Rosemont Copper Project Southeastern Arizona
Submitted to: Arizona Department of Environmental Quality 1110 West Washington Street Phoenix, Arizona 85007
Submitted by: Rosemont Copper Company P.O. Box 35130 Tucson, Arizona 85740 Contact: 520.495.3502
Prepared by: JBR Environmental Consultants, Inc. 1553 W. Elna Rae, Ste. 101 Tempe, Arizona 85281 Contact: 480.829.0457
November 15, 2011
AZRP00181
APPENDIX H
EMISSION TABLES
AZRP00182
Rosemont Copper Project November 2011 Emission Inventory Information Page H1
JBR ENVIRONMENTAL CONSULTANTS, INC.
YEAR 1
AZRP00183
PM/TSP PM10 PM2.5 Unitsk
(PM/TSP)
k (PM10) k (PM2.5) A (ft2) U (mph) M (%) W (tons) s (%) S (mph) P (days/yr)a
(PM/TSP)
a (PM10) a (PM2.5)b
(PM/TSP)
b (PM10) b (PM2.5) u* ut* e f (%) PE
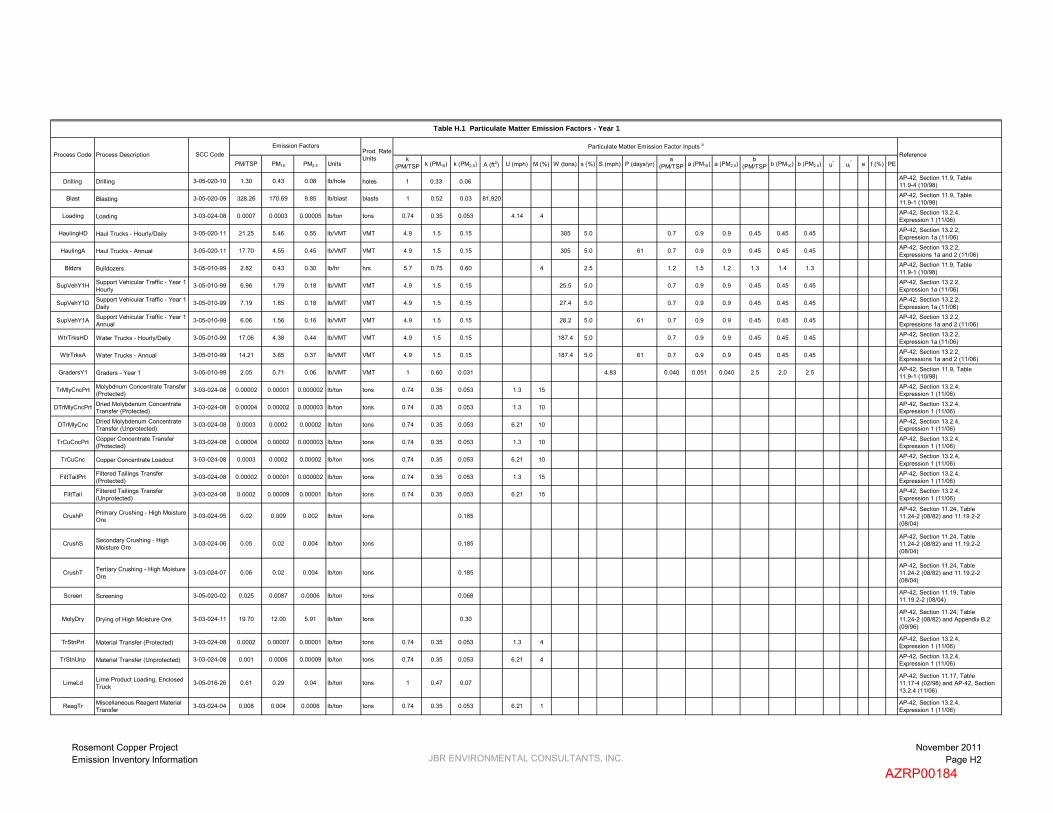
Drilling Drilling 3-05-020-10 1.30 0.43 0.08 lb/hole holes 1 0.33 0.06 AP-42, Section 11.9, Table11.9-4 (10/98)
Blast Blasting 3-05-020-09 328.26 170.69 9.85 lb/blast blasts 1 0.52 0.03 81,920 AP-42, Section 11.9, Table11.9-1 (10/98)
Loading Loading 3-03-024-08 0.0007 0.0003 0.00005 lb/ton tons 0.74 0.35 0.053 4.14 4 AP-42, Section 13.2.4,Expression 1 (11/06)
HaulingHD Haul Trucks - Hourly/Daily 3-05-020-11 21.25 5.46 0.55 lb/VMT VMT 4.9 1.5 0.15 305 5.0 0.7 0.9 0.9 0.45 0.45 0.45 AP-42, Section 13.2.2,Expression 1a (11/06)
HaulingA Haul Trucks - Annual 3-05-020-11 17.70 4.55 0.45 lb/VMT VMT 4.9 1.5 0.15 305 5.0 61 0.7 0.9 0.9 0.45 0.45 0.45 AP-42, Section 13.2.2,Expressions 1a and 2 (11/06)
Bldzrs Bulldozers 3-05-010-99 2.82 0.43 0.30 lb/hr hrs 5.7 0.75 0.60 4 2.5 1.2 1.5 1.2 1.3 1.4 1.3 AP-42, Section 11.9, Table11.9-1 (10/98)
SupVehY1H Support Vehicular Traffic - Year 1 Hourly 3-05-010-99 6.96 1.79 0.18 lb/VMT VMT 4.9 1.5 0.15 25.5 5.0 0.7 0.9 0.9 0.45 0.45 0.45 AP-42, Section 13.2.2,
Expression 1a (11/06)
SupVehY1D Support Vehicular Traffic - Year 1 Daily 3-05-010-99 7.19 1.85 0.18 lb/VMT VMT 4.9 1.5 0.15 27.4 5.0 0.7 0.9 0.9 0.45 0.45 0.45 AP-42, Section 13.2.2,
Expression 1a (11/06)
SupVehY1A Support Vehicular Traffic - Year 1 Annual 3-05-010-99 6.06 1.56 0.16 lb/VMT VMT 4.9 1.5 0.15 28.2 5.0 61 0.7 0.9 0.9 0.45 0.45 0.45 AP-42, Section 13.2.2,
Expressions 1a and 2 (11/06)
WtrTrksHD Water Trucks - Hourly/Daily 3-05-010-99 17.06 4.38 0.44 lb/VMT VMT 4.9 1.5 0.15 187.4 5.0 0.7 0.9 0.9 0.45 0.45 0.45 AP-42, Section 13.2.2,Expression 1a (11/06)
WtrTrksA Water Trucks - Annual 3-05-010-99 14.21 3.65 0.37 lb/VMT VMT 4.9 1.5 0.15 187.4 5.0 61 0.7 0.9 0.9 0.45 0.45 0.45 AP-42, Section 13.2.2,Expressions 1a and 2 (11/06)
GradersY1 Graders - Year 1 3-05-010-99 2.05 0.71 0.06 lb/VMT VMT 1 0.60 0.031 4.83 0.040 0.051 0.040 2.5 2.0 2.5 AP-42, Section 11.9, Table11.9-1 (10/98)
TrMlyCncPrt Molybdnum Concentrate Transfer(Protected) 3-03-024-08 0.00002 0.00001 0.000002 lb/ton tons 0.74 0.35 0.053 1.3 15 AP-42, Section 13.2.4,
Expression 1 (11/06)
DTrMlyCncPrt Dried Molybdenum Concentrate Transfer (Protected) 3-03-024-08 0.00004 0.00002 0.000003 lb/ton tons 0.74 0.35 0.053 1.3 10 AP-42, Section 13.2.4,
Expression 1 (11/06)
DTrMlyCnc Dried Molybdenum Concentrate Transfer (Unprotected) 3-03-024-08 0.0003 0.0002 0.00002 lb/ton tons 0.74 0.35 0.053 6.21 10 AP-42, Section 13.2.4,
Expression 1 (11/06)
TrCuCncPrt Copper Concentrate Transfer (Protected) 3-03-024-08 0.00004 0.00002 0.000003 lb/ton tons 0.74 0.35 0.053 1.3 10 AP-42, Section 13.2.4,
Expression 1 (11/06)
TrCuCnc Copper Concentrate Loadout 3-03-024-08 0.0003 0.0002 0.00002 lb/ton tons 0.74 0.35 0.053 6.21 10 AP-42, Section 13.2.4,Expression 1 (11/06)
FiltTailPrt Filtered Tailings Transfer (Protected) 3-03-024-08 0.00002 0.00001 0.000002 lb/ton tons 0.74 0.35 0.053 1.3 15 AP-42, Section 13.2.4,
Expression 1 (11/06)
FiltTail Filtered Tailings Transfer (Unprotected) 3-03-024-08 0.0002 0.00009 0.00001 lb/ton tons 0.74 0.35 0.053 6.21 15 AP-42, Section 13.2.4,
Expression 1 (11/06)
CrushP Primary Crushing - High Moisture Ore 3-03-024-05 0.02 0.009 0.002 lb/ton tons 0.185
AP-42, Section 11.24, Table11.24-2 (08/82) and 11.19.2-2 (08/04)
CrushS Secondary Crushing - High Moisture Ore 3-03-024-06 0.05 0.02 0.004 lb/ton tons 0.185
AP-42, Section 11.24, Table11.24-2 (08/82) and 11.19.2-2 (08/04)
CrushT Tertiary Crushing - High Moisture Ore 3-03-024-07 0.06 0.02 0.004 lb/ton tons 0.185
AP-42, Section 11.24, Table11.24-2 (08/82) and 11.19.2-2(08/04)
Screen Screening 3-05-020-02 0.025 0.0087 0.0006 lb/ton tons 0.068 AP-42, Section 11.19, Table11.19.2-2 (08/04)
MolyDry Drying of High Moisture Ore 3-03-024-11 19.70 12.00 5.91 lb/ton tons 0.30AP-42, Section 11.24, Table11.24-2 (08/82) and Appendix B.2 (09/96)
TrStnPrt Material Transfer (Protected) 3-03-024-08 0.0002 0.00007 0.00001 lb/ton tons 0.74 0.35 0.053 1.3 4 AP-42, Section 13.2.4,Expression 1 (11/06)
TrStnUnp Material Transfer (Unprotected) 3-03-024-08 0.001 0.0006 0.00009 lb/ton tons 0.74 0.35 0.053 6.21 4 AP-42, Section 13.2.4,Expression 1 (11/06)
LimeLd Lime Product Loading, Enclosed Truck 3-05-016-26 0.61 0.29 0.04 lb/ton tons 1 0.47 0.07
AP-42, Section 11.17, Table11.17-4 (02/98) and AP-42, Section 13.2.4 (11/06)
ReagTr Miscellaneous Reagent Material Transfer 3-03-024-04 0.008 0.004 0.0006 lb/ton tons 0.74 0.35 0.053 6.21 1 AP-42, Section 13.2.4,
Expression 1 (11/06)
Process Code Process DescriptionParticulate Matter Emission Factor Inputs a
Table H.1 Particulate Matter Emission Factors - Year 1
SCC Code Prod. Rate Units Reference
Emission Factors
Rosemont Copper ProjectEmission Inventory Information JBR ENVIRONMENTAL CONSULTANTS, INC.
November 2011Page H2
AZRP00184

PM/TSP PM10 PM2.5 Unitsk
(PM/TSP)
k (PM10) k (PM2.5) A (ft2) U (mph) M (%) W (tons) s (%) S (mph) P (days/yr)a
(PM/TSP)
a (PM10) a (PM2.5)b
(PM/TSP)
b (PM10) b (PM2.5) u* ut* e f (%) PE
Process Code Process DescriptionParticulate Matter Emission Factor Inputs a
Table H.1 Particulate Matter Emission Factors - Year 1
SCC Code Prod. Rate Units Reference
Emission Factors
ICDE1 Internal Combustion Diesel Engine 37 ≤ kW > 75 2-02-001-02 0.40 0.40 0.40 g/kW-hr hours 1 1 1 NSPS Emission Standard
ICDE2 Internal Combustion Diesel Engine 225 ≤ kW > 450 2-02-001-02 0.20 0.20 0.20 g/kW-hr hours 1 1 1 NSPS Emission Standard
ICDE3 Internal Combustion Diesel Engine > 560 kW 2-02-001-02 0.20 0.20 0.20 g/kW-hr hours 1 1 1 NSPS Emission Standard
DFB Diesel (Distillate Oil) Fired Boiler <100 MMBtu/hr 1-02-005-03 3.30 2.30 1.54 lb/1000 gal hours 1 0.5 0.12 AP-42, Section 1.3, Tables
1.3-1, 1.3-2 and 1.3-6 (09/98)
CAS Crushing Area Scrubber none 1.29 1.28 1.13 lb/hr hours 1.01 1.00 0.88Voluntarily Accepted PM10
Emission Limit, PM and PM2.5
fractions of PM10 emissions
SAS Stockpile Area Scrubber none 2.61 2.59 2.10 lb/hr hours 1.01 1.00 0.81Voluntarily Accepted PM10
Emission Limit, PM and PM2.5
fractions of PM10 emissions
RTS Reclaim Tunnel Scrubber none 1.08 1.07 0.87 lb/hr hours 1.01 1.00 0.81Voluntarily Accepted PM10
Emission Limit, PM and PM2.5
fractions of PM10 emissions
PCAS Pebble Crusher Area Scrubber none 1.58 1.56 1.31 lb/hr hours 1.02 1.00 0.84Voluntarily Accepted PM10
Emission Limit, PM and PM2.5
fractions of PM10 emissions
CCS Copper Concentrate Scrubbers none 3.59 3.55 3.04 lb/hr hours 1.01 1.00 0.86Voluntarily Accepted PM10
Emission Limit, PM and PM2.5
fractions of PM10 emissions
MS/EP Molybdenum Scrubber / Electrostatic Precipitator none 0.015 0.014 0.013 lb/hr hours 1.10 1.00 0.94
Voluntarily Accepted PM10
Emission Limit, PM and PM2.5
fractions of PM10 emissions
MDC Molybdenum Dust Collector none 0.021 0.010 0.002 gr/dscf dscf 2.11 1.00 0.15Voluntarily Accepted PM10
Emission Limit, PM and PM2.5
fractions of PM10 emissions
LDC Laboratory Dust Collectors none 0.008 0.005 0.002 gr/dscf dscf 1.65 1.00 0.49Voluntarily Accepted PM10
Emission Limit, PM and PM2.5
fractions of PM10 emissions
WindROM Wind Erosion - Run of MineStockpile 3-03-888-01 0.21 0.11 0.02 ton/acre-yr acres 1 0.5 0.075 2.5 38 4.77 22
FDEMIb (07/83), p. 51-57, MRIEquation, AP-42, Section 13.2.5 (11/06) and Table 13.2.4-1 (11/06)
WindCvd Wind Erosion - Covered Stockpile 3-03-888-01 0 0 0 ton/acre-yr acres Assumed
TailStrg Wind Erosion - Tailings Storage 3-03-888-01 0.02 0.01 0.002 ton/acre-yr acres 1 0.5 0.075 0.57 0.43 AP-42, Section 13.2.5 (11/06)
b FDEMI = Fugitive Dust Emission Factors for the Mining Industry
a k = particle size multiplier, A = horizonal area of blasting surface, U = mean wind speed, M = material moisture content, W = mean vehicle weight, s = surface material silt content, S = mean vehicle speed, P = number of days per year with at least 0.01 inches of precipitation, a = constant based on particle size,b = constant based on particle size, u* = friction velocity, ut
* = threshold friction velocity, e = surface erodibility, f = percentage of time the wind speed exceeds 12 mph, PE = Thornthwaite's Precipitation-Evaporation Index
Rosemont Copper ProjectEmission Inventory Information JBR ENVIRONMENTAL CONSULTANTS, INC.
November 2011Page H3
AZRP00185
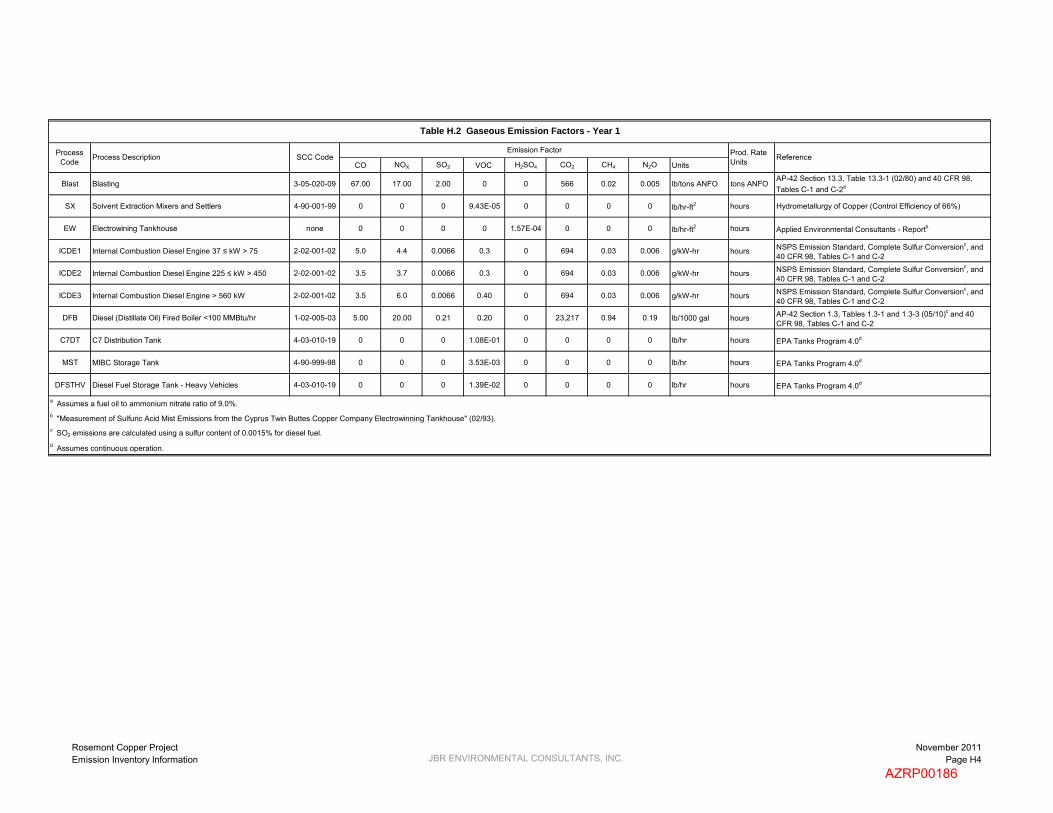
CO NOX SO2 VOC H2SO4 CO2 CH4 N2O Units
Blast Blasting 3-05-020-09 67.00 17.00 2.00 0 0 566 0.02 0.005 lb/tons ANFO tons ANFOAP-42 Section 13.3, Table 13.3-1 (02/80) and 40 CFR 98, Tables C-1 and C-2a
SX Solvent Extraction Mixers and Settlers 4-90-001-99 0 0 0 9.43E-05 0 0 0 0 lb/hr-ft2 hours Hydrometallurgy of Copper (Control Efficiency of 66%)
EW Electrowining Tankhouse none 0 0 0 0 1.57E-04 0 0 0 lb/hr-ft2 hours Applied Environmental Consultants - Reportb
ICDE1 Internal Combustion Diesel Engine 37 ≤ kW > 75 2-02-001-02 5.0 4.4 0.0066 0.3 0 694 0.03 0.006 g/kW-hr hours NSPS Emission Standard, Complete Sulfur Conversionc, and 40 CFR 98, Tables C-1 and C-2
ICDE2 Internal Combustion Diesel Engine 225 ≤ kW > 450 2-02-001-02 3.5 3.7 0.0066 0.3 0 694 0.03 0.006 g/kW-hr hours NSPS Emission Standard, Complete Sulfur Conversionc, and 40 CFR 98, Tables C-1 and C-2
ICDE3 Internal Combustion Diesel Engine > 560 kW 2-02-001-02 3.5 6.0 0.0066 0.40 0 694 0.03 0.006 g/kW-hr hours NSPS Emission Standard, Complete Sulfur Conversionc, and 40 CFR 98, Tables C-1 and C-2
DFB Diesel (Distillate Oil) Fired Boiler <100 MMBtu/hr 1-02-005-03 5.00 20.00 0.21 0.20 0 23,217 0.94 0.19 lb/1000 gal hours AP-42 Section 1.3, Tables 1.3-1 and 1.3-3 (05/10)c and 40 CFR 98, Tables C-1 and C-2
C7DT C7 Distribution Tank 4-03-010-19 0 0 0 1.08E-01 0 0 0 0 lb/hr hours EPA Tanks Program 4.0d
MST MIBC Storage Tank 4-90-999-98 0 0 0 3.53E-03 0 0 0 0 lb/hr hours EPA Tanks Program 4.0d
DFSTHV Diesel Fuel Storage Tank - Heavy Vehicles 4-03-010-19 0 0 0 1.39E-02 0 0 0 0 lb/hr hours EPA Tanks Program 4.0d
b "Measurement of Sulfuric Acid Mist Emissions from the Cyprus Twin Buttes Copper Company Electrowinning Tankhouse" (02/93).
d Assumes continuous operation.
a Assumes a fuel oil to ammonium nitrate ratio of 9.0%.
c SO2 emissions are calculated using a sulfur content of 0.0015% for diesel fuel.
Table H.2 Gaseous Emission Factors - Year 1
Process DescriptionProcess Code SCC Code Prod. Rate
Units ReferenceEmission Factor
Rosemont Copper ProjectEmission Inventory Information JBR ENVIRONMENTAL CONSULTANTS, INC.
November 2011Page H4
AZRP00186

Control Code Control Description Pick-up Efficiency (%)
Control Efficiency (%) Reference
CAS Crushing Area Scrubber (PC-CAS) 100% -- Assumed
SAS Stockpile Area Scrubber (PC-SAS) 100% -- Assumed
RTS Reclaim Tunnel Scrubber (PC-RTS) 100% -- Assumed
PCAS Pebble Crusher Area Scrubber (PC-PCAS) 100% -- Assumed
CCS Copper Concentrate Scrubbers (PC-CCS1/CCS2) 100% -- Assumed
MS/EP Molybdenum Scrubber (PC-MS) / Electrostatic Precipitator (PC-EP) 100% -- Assumed
BPLSV Bulk Pebble Lime Silo Bin Vent (PC-BPLBV) 100% 90% Vendor Specification
LSV Lime Storage Bin Vent (PC-LSBV) 100% 90% Vendor Specification
SMSV Sodium Metasilicate Storage Bin Vent (PC-SMSBV) 100% 90% Vendor Specification
CVS EW Cell Ventilation Scrubbers (PC-CVS) 100% 99% Engineering Design
MDC Molybdenum Dust Collector (PC-MDC) 100% -- Assumed
HaulRdUI Road Watering (Inside the Pit) N/A 90% Control of Open Fugitive Dust Sources (09/88) a
HaulRdUO Road Watering (Outside the Pit) N/A 90% Control of Open Fugitive Dust Sources (09/88) a
HaulRdWTI Road Watering - Water Trucks (Inside the Pit) N/A 90% Control of Open Fugitive Dust Sources (09/88) a
HaulRdWTO Road Watering - Water Trucks (Outside the Pit) N/A 90% Control of Open Fugitive Dust Sources (09/88) a
Water Addition of Process Water N/A 100% Assumed
WSpry Water Spray at Unprotected Points N/A 82.5% Average Value of AP-42, p. 11.19.1-5 (11/95)
Wet Wet Process N/A 100% Assumed
Clean Wet, Cleaned Ore (no fines) N/A 100% Assumed
Enclosed Totally Enclosed Transfer Point N/A 100% Assumed
UndrGrd Underground Transfer Point N/A 100% Assumed
None No Pollution Controls 0% 0% Assumed
Table H.3 Particulate Matter Control Efficiencies - Year 1
a EPA Document gives methods for calculating efficiencies - pages 5-9 to 5-14
Rosemont Copper ProjectEmission Inventory Information JBR ENVIRONMENTAL CONSULTANTS, INC.
November 2011Page H5
AZRP00187
PM/TSP PM10 PM2.5 Uncontrolled Controlled Uncontrolled Controlled Uncontrolled Controlled
Mining
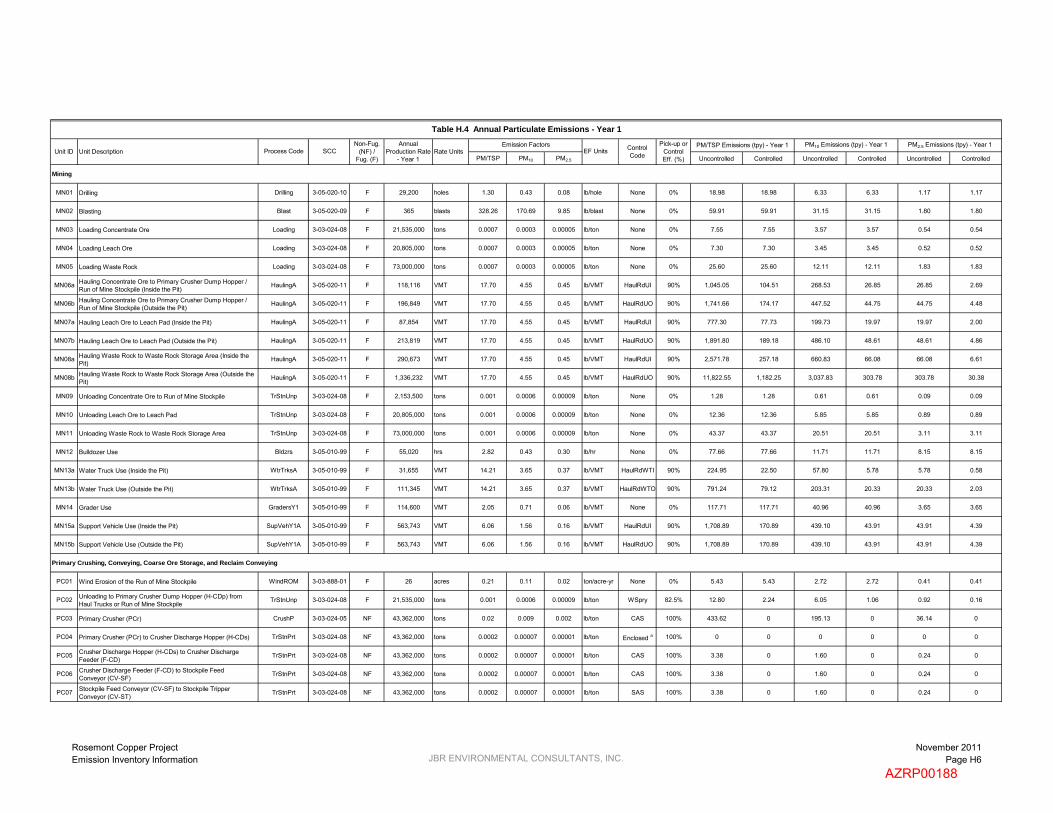
MN01 Drilling Drilling 3-05-020-10 F 29,200 holes 1.30 0.43 0.08 lb/hole None 0% 18.98 18.98 6.33 6.33 1.17 1.17
MN02 Blasting Blast 3-05-020-09 F 365 blasts 328.26 170.69 9.85 lb/blast None 0% 59.91 59.91 31.15 31.15 1.80 1.80
MN03 Loading Concentrate Ore Loading 3-03-024-08 F 21,535,000 tons 0.0007 0.0003 0.00005 lb/ton None 0% 7.55 7.55 3.57 3.57 0.54 0.54
MN04 Loading Leach Ore Loading 3-03-024-08 F 20,805,000 tons 0.0007 0.0003 0.00005 lb/ton None 0% 7.30 7.30 3.45 3.45 0.52 0.52
MN05 Loading Waste Rock Loading 3-03-024-08 F 73,000,000 tons 0.0007 0.0003 0.00005 lb/ton None 0% 25.60 25.60 12.11 12.11 1.83 1.83
MN06a Hauling Concentrate Ore to Primary Crusher Dump Hopper / Run of Mine Stockpile (Inside the Pit)
HaulingA 3-05-020-11 F 118,116 VMT 17.70 4.55 0.45 lb/VMT HaulRdUI 90% 1,045.05 104.51 268.53 26.85 26.85 2.69
MN06b Hauling Concentrate Ore to Primary Crusher Dump Hopper / Run of Mine Stockpile (Outside the Pit)
HaulingA 3-05-020-11 F 196,849 VMT 17.70 4.55 0.45 lb/VMT HaulRdUO 90% 1,741.66 174.17 447.52 44.75 44.75 4.48
MN07a Hauling Leach Ore to Leach Pad (Inside the Pit) HaulingA 3-05-020-11 F 87,854 VMT 17.70 4.55 0.45 lb/VMT HaulRdUI 90% 777.30 77.73 199.73 19.97 19.97 2.00
MN07b Hauling Leach Ore to Leach Pad (Outside the Pit) HaulingA 3-05-020-11 F 213,819 VMT 17.70 4.55 0.45 lb/VMT HaulRdUO 90% 1,891.80 189.18 486.10 48.61 48.61 4.86
MN08a Hauling Waste Rock to Waste Rock Storage Area (Inside the Pit)
HaulingA 3-05-020-11 F 290,673 VMT 17.70 4.55 0.45 lb/VMT HaulRdUI 90% 2,571.78 257.18 660.83 66.08 66.08 6.61
MN08b Hauling Waste Rock to Waste Rock Storage Area (Outside the Pit)
HaulingA 3-05-020-11 F 1,336,232 VMT 17.70 4.55 0.45 lb/VMT HaulRdUO 90% 11,822.55 1,182.25 3,037.83 303.78 303.78 30.38
MN09 Unloading Concentrate Ore to Run of Mine Stockpile TrStnUnp 3-03-024-08 F 2,153,500 tons 0.001 0.0006 0.00009 lb/ton None 0% 1.28 1.28 0.61 0.61 0.09 0.09
MN10 Unloading Leach Ore to Leach Pad TrStnUnp 3-03-024-08 F 20,805,000 tons 0.001 0.0006 0.00009 lb/ton None 0% 12.36 12.36 5.85 5.85 0.89 0.89
MN11 Unloading Waste Rock to Waste Rock Storage Area TrStnUnp 3-03-024-08 F 73,000,000 tons 0.001 0.0006 0.00009 lb/ton None 0% 43.37 43.37 20.51 20.51 3.11 3.11
MN12 Bulldozer Use Bldzrs 3-05-010-99 F 55,020 hrs 2.82 0.43 0.30 lb/hr None 0% 77.66 77.66 11.71 11.71 8.15 8.15
MN13a Water Truck Use (Inside the Pit) WtrTrksA 3-05-010-99 F 31,655 VMT 14.21 3.65 0.37 lb/VMT HaulRdWTI 90% 224.95 22.50 57.80 5.78 5.78 0.58
MN13b Water Truck Use (Outside the Pit) WtrTrksA 3-05-010-99 F 111,345 VMT 14.21 3.65 0.37 lb/VMT HaulRdWTO 90% 791.24 79.12 203.31 20.33 20.33 2.03
MN14 Grader Use GradersY1 3-05-010-99 F 114,600 VMT 2.05 0.71 0.06 lb/VMT None 0% 117.71 117.71 40.96 40.96 3.65 3.65
MN15a Support Vehicle Use (Inside the Pit) SupVehY1A 3-05-010-99 F 563,743 VMT 6.06 1.56 0.16 lb/VMT HaulRdUI 90% 1,708.89 170.89 439.10 43.91 43.91 4.39
MN15b Support Vehicle Use (Outside the Pit) SupVehY1A 3-05-010-99 F 563,743 VMT 6.06 1.56 0.16 lb/VMT HaulRdUO 90% 1,708.89 170.89 439.10 43.91 43.91 4.39
Primary Crushing, Conveying, Coarse Ore Storage, and Reclaim Conveying
PC01 Wind Erosion of the Run of Mine Stockpile WindROM 3-03-888-01 F 26 acres 0.21 0.11 0.02 ton/acre-yr None 0% 5.43 5.43 2.72 2.72 0.41 0.41
PC02 Unloading to Primary Crusher Dump Hopper (H-CDp) fromHaul Trucks or Run of Mine Stockpile
TrStnUnp 3-03-024-08 F 21,535,000 tons 0.001 0.0006 0.00009 lb/ton WSpry 82.5% 12.80 2.24 6.05 1.06 0.92 0.16
PC03 Primary Crusher (PCr) CrushP 3-03-024-05 NF 43,362,000 tons 0.02 0.009 0.002 lb/ton CAS 100% 433.62 0 195.13 0 36.14 0
PC04 Primary Crusher (PCr) to Crusher Discharge Hopper (H-CDs) TrStnPrt 3-03-024-08 NF 43,362,000 tons 0.0002 0.00007 0.00001 lb/ton Enclosed a 100% 0 0 0 0 0 0
PC05 Crusher Discharge Hopper (H-CDs) to Crusher DischargeFeeder (F-CD)
TrStnPrt 3-03-024-08 NF 43,362,000 tons 0.0002 0.00007 0.00001 lb/ton CAS 100% 3.38 0 1.60 0 0.24 0
PC06 Crusher Discharge Feeder (F-CD) to Stockpile FeedConveyor (CV-SF)
TrStnPrt 3-03-024-08 NF 43,362,000 tons 0.0002 0.00007 0.00001 lb/ton CAS 100% 3.38 0 1.60 0 0.24 0
PC07 Stockpile Feed Conveyor (CV-SF) to Stockpile TripperConveyor (CV-ST)
TrStnPrt 3-03-024-08 NF 43,362,000 tons 0.0002 0.00007 0.00001 lb/ton SAS 100% 3.38 0 1.60 0 0.24 0
Table H.4 Annual Particulate Emissions - Year 1
SCCNon-Fug.
(NF) / Fug. (F)
Pick-up or Control Eff. (%)
Emission FactorsAnnual Production Rate
- Year 1
PM2.5 Emissions (tpy) - Year 1Unit ID Unit Description Process Code
PM10 Emissions (tpy) - Year 1EF Units
PM/TSP Emissions (tpy) - Year 1Control CodeRate Units
Rosemont Copper ProjectEmission Inventory Information JBR ENVIRONMENTAL CONSULTANTS, INC.
November 2011Page H6
AZRP00188

PM/TSP PM10 PM2.5 Uncontrolled Controlled Uncontrolled Controlled Uncontrolled Controlled
Table H.4 Annual Particulate Emissions - Year 1
SCCNon-Fug.
(NF) / Fug. (F)
Pick-up or Control Eff. (%)
Emission FactorsAnnual Production Rate
- Year 1
PM2.5 Emissions (tpy) - Year 1Unit ID Unit Description Process Code
PM10 Emissions (tpy) - Year 1EF Units
PM/TSP Emissions (tpy) - Year 1Control CodeRate Units
PC08 Stockpile Tripper Conveyor (CV-ST) to Covered Coarse Ore Stockpile
TrStnPrt 3-03-024-08 F 43,362,000 tons 0.0002 0.00007 0.00001 lb/ton SAS 100% 3.38 0 1.60 0 0.24 0
PC09 Wind Erosion of the Coarse Ore Stockpile WindCvd 3-03-888-01 F 5 acres 0 0 0 ton/acre-yr Enclosed a 100% 0 0 0 0 0 0
PC10 Coarse Ore Stockpile to Reclaim Feeders (F-R1/R4) TrStnPrt 3-03-024-08 NF 43,362,000 tons 0.0002 0.00007 0.00001 lb/ton UndrGrd a 100% 0 0 0 0 0 0
PC11 Reclaim Feeders (F-R1/R4) to Reclaim Conveyor (CV-R) TrStnPrt 3-03-024-08 NF 43,362,000 tons 0.0002 0.00007 0.00001 lb/ton RTS 100% 3.38 0 1.60 0 0.24 0
PC12 Reclaim Conveyor (CV-R) to SAG Mill Feed Conveyor(CV-SMF) TrStnPrt 3-03-024-08 NF 43,362,000 tons 0.0002 0.00007 0.00001 lb/ton PCAS 100% 3.38 0 1.60 0 0.24 0
PC13 Pebble Conveyor No. 3 (CV-Pb3) to SAG Mill Feed Conveyor (CV-SMF)
TrStnPrt 3-03-024-08 NF 6,269,400 tons 0.0002 0.00007 0.00001 lb/ton PCAS 100% 0.49 0 0.23 0 0.03 0
PC14 SAG Mill Feed Conveyor (CV-SMF) to SAG Mill (M-SAG) TrStnPrt 3-03-024-08 NF 49,669,200 tons 0.0002 0.00007 0.00001 lb/ton Water a 100% 0 0 0 0 0 0
Milling
M01 SAG Mill (M-SAG) CrushS 3-03-024-06 NF 49,669,200 tons 0.05 0.02 0.004 lb/ton Wet a 100% 0 0 0 0 0 0
M02 SAG Mill (M-SAG) to Trommel Screen (Sn-T) TrStnPrt 3-03-024-08 NF 49,669,200 tons 0.0002 0.00007 0.00001 lb/ton Enclosed a 100% 0 0 0 0 0 0
M03 Trommel Screen (Sn-T) Screen 3-05-020-02 NF 49,669,200 tons 0.025 0.0087 0.0006 lb/ton Wet a 100% 0 0 0 0 0 0
M04 Trommel Screen (Sn-T) to Pebble Conveyor No. 1 (CV-Pb1) TrStnPrt 3-03-024-08 NF 10,505,042 tons 0.0002 0.00007 0.00001 lb/ton Clean a 100% 0 0 0 0 0 0
M05 Pebble Conveyor No. 1 (CV-Pb1) to Pebble Wash Screen(Sn-PbW)
TrStnPrt 3-03-024-08 NF 10,505,042 tons 0.0002 0.00007 0.00001 lb/ton Clean a 100% 0 0 0 0 0 0
M06 Pebble Wash Screen (Sn-PbW) Screen 3-05-020-02 NF 10,505,042 tons 0.025 0.0087 0.0006 lb/ton Wet a 100% 0 0 0 0 0 0
M07 Pebble Wash Screen (Sn-PbW) to Pebble Conveyor No. 2 TrStnPrt 3-03-024-08 NF 6,269,400 tons 0.0002 0.00007 0.00001 lb/ton Clean a 100% 0 0 0 0 0 0
M08 Pebble Conveyor No. 2 (CV-Pb2) to SAG Oversize Surge Bin(B-SAGOS) TrStnPrt 3-03-024-08 NF 6,269,400 tons 0.0002 0.00007 0.00001 lb/ton PCAS 100% 0.49 0 0.23 0 0.03 0
M09 SAG Oversize Surge Bin (B-SAGOS) to Pebble CrusherFeeder (F-PbC)
TrStnPrt 3-03-024-08 NF 6,269,400 tons 0.0002 0.00007 0.00001 lb/ton PCAS 100% 0.49 0 0.23 0 0.03 0
M10 Pebble Crusher Feeder (F-PbC) to Pebble Crusher (PbC) TrStnPrt 3-03-024-08 NF 6,269,400 tons 0.0002 0.00007 0.00001 lb/ton Enclosed a 100% 0 0 0 0 0 0
M11 Pebble Crusher (PbC) CrushT 3-03-024-07 NF 6,269,400 tons 0.06 0.02 0.004 lb/ton PCAS 100% 188.08 0 62.69 0 11.61 0
M12 Pebble Crusher (PbC) to Pebble Conveyor No. 3 (CV-Pb3) TrStnPrt 3-03-024-08 NF 6,269,400 tons 0.0002 0.00007 0.00001 lb/ton PCAS 100% 0.49 0 0.23 0 0.03 0
Copper Concentrate Dewatering and Stacking
CCD01 Copper Concentrate Filters (Ft-CC1/CC4) to Copper Concentrate Conveyor (CV-CC) TrCuCncPrt 3-03-024-08 NF 550,936 tons 0.00004 0.00002 0.000003 lb/ton Enclosed a 100% 0 0 0 0 0 0
CCD02 Copper Concentrate Conveyor (CV-CC) to Copper Concentrate Loadout Stockpile
TrCuCncPrt 3-03-024-08 F 550,936 tons 0.00004 0.00002 0.000003 lb/ton CCS 100% 0.01 0 0.006 0 0.0009 0
CCD03 Wind Erosion of Copper Concentrate Loadout Stockpile WindCvd 3-03-888-01 F 1.17 acres 0 0 0 ton/acre-yr Enclosed a 100% 0 0 0 0 0 0
CCD04 Copper Concentrate Loadout Stockpile to Shipment Truck via Front End Loaders
TrCuCncPrt 3-03-024-08 F 550,936 tons 0.00004 0.00002 0.000003 lb/ton CCS 100% 0.01 0 0.006 0 0.0009 0
Molybdenum Dewatering and Packaging
MD01 Molybdenum Concentrate Filter (Ft-MC) to Molybdenum Concentrate Dryer (D-MC)
TrMlyCncPrt 3-03-024-08 NF 6,377 tons 0.00002 0.00001 0.000002 lb/ton Enclosed a 100% 0 0 0 0 0 0
MD02 Molybdenum Concentrate Dryer MolyDry 3-03-024-11 NF 6,377 tons 19.70 12.00 5.91 lb/ton MS/EP 100% 62.81 0 38.26 0 18.84 0
MD03 Molybdenum Concentrate Dryer (D-MC) to MolybdenumConcentrate Bin (B-MC)
DTrMlyCncPrt 3-03-024-08 NF 6,377 tons 0.00004 0.00002 0.000003 lb/ton MDC 100% 0.0001 0 0.00007 0 0.00001 0
Rosemont Copper ProjectEmission Inventory Information JBR ENVIRONMENTAL CONSULTANTS, INC.
November 2011Page H7
AZRP00189

PM/TSP PM10 PM2.5 Uncontrolled Controlled Uncontrolled Controlled Uncontrolled Controlled
Table H.4 Annual Particulate Emissions - Year 1
SCCNon-Fug.
(NF) / Fug. (F)
Pick-up or Control Eff. (%)
Emission FactorsAnnual Production Rate
- Year 1
PM2.5 Emissions (tpy) - Year 1Unit ID Unit Description Process Code
PM10 Emissions (tpy) - Year 1EF Units
PM/TSP Emissions (tpy) - Year 1Control CodeRate Units
MD04 Molybdenum Concentrate Bin (B-MC) to MolybdenumConcentrate Hopper (H-MC)
DTrMlyCnc 3-03-024-08 NF 6,377 tons 0.0003 0.0002 0.00002 lb/ton None 0% 0.001 0.001 0.0005 0.0005 0.00008 0.00008
MD05 Molybdenum Concentrate Hopper (H-MC) to MolybdenumConcentrate Conveyor (CV-MC)
DTrMlyCncPrt 3-03-024-08 NF 6,377 tons 0.00004 0.00002 0.000003 lb/ton Enclosed a 100% 0 0 0 0 0 0
MD06 Molybdenum Concentrate Conveyor (CV-MC) to Molybdenum Packaging and Weigh System (MPS)
DTrMlyCnc 3-03-024-08 NF 6,377 tons 0.0003 0.0002 0.00002 lb/ton MDC 100% 0.001 0 0.0005 0 0.00008 0
Tailings Dewatering and Placement
TDS01 Tailings Filters (Ft-T1/T14) to Tailings Belt Feeders (F-T1/T14) FiltTailPrt 3-03-024-08 NF 42,804,687 tons 0.00002 0.00001 0.000002 lb/ton Enclosed a 100% 0 0 0 0 0 0
TDS02 Tailings Belt Feeders (F-T1/T14) to Fixed Tailings ConveyorNo. 1 (CV-F1)
FiltTailPrt 3-03-024-08 NF 42,804,687 tons 0.00002 0.00001 0.000002 lb/ton Enclosed a 100% 0 0 0 0 0 0
TDS03 Fixed Tailings Conveyor No. 1 (CV-F1) to Fixed TailingsConveyor No. 2 (CV-F2)
FiltTailPrt 3-03-024-08 NF 42,804,687 tons 0.00002 0.00001 0.000002 lb/ton Enclosed a 100% 0 0 0 0 0 0
TDS04 Fixed Tailings Conveyor No. 2 (CV-F2) to Fixed Tailings Conveyor No. 3 (CV-F3)
FiltTailPrt 3-03-024-08 NF 42,804,687 tons 0.00002 0.00001 0.000002 lb/ton None 0% 0.52 0.52 0.25 0.25 0.04 0.04
TDS05 Fixed Tailings Conveyor No. 3 (CV-F3) to RelocatableConveyor (CV-R1)
FiltTailPrt 3-03-024-08 F 42,804,687 tons 0.00002 0.00001 0.000002 lb/ton None 0% 0.52 0.52 0.25 0.25 0.04 0.04
TDS06 Relocatable Conveyor (CV-R1) to Shiftable Conveyor (CV-S1) FiltTailPrt 3-03-024-08 F 42,804,687 tons 0.00002 0.00001 0.000002 lb/ton None 0% 0.52 0.52 0.25 0.25 0.04 0.04
TDS07 Shiftable Conveyor (CV-S1) to Belt Wagon Conveyor(CV-BW1)
FiltTail 3-03-024-08 F 42,804,687 tons 0.0002 0.00009 0.00001 lb/ton None 0% 4.00 4.00 1.89 1.89 0.29 0.29
TDS08 Belt Wagon Conveyor (CV-BW1) to Spreader Crawler Mounted Conveyor (CV-SP1)
FiltTail 3-03-024-08 F 42,804,687 tons 0.0002 0.00009 0.00001 lb/ton None 0% 4.00 4.00 1.89 1.89 0.29 0.29
TDS09 Spreader Crawler Mounted Conveyor (CV-SP1) to Tailings Storage
FiltTail 3-03-024-08 F 42,804,687 tons 0.0002 0.00009 0.00001 lb/ton None 0% 4.00 4.00 1.89 1.89 0.29 0.29
TDS10 Wind Erosion of Tailings Storage TailStrg 3-03-888-01 F 1,500 acres 0.02 0.01 0.002 ton/acre-yr None 0% 30.23 30.23 15.11 15.11 2.27 2.27
Fuel Burning Equipment
FB01 Diesel Electrowinning Hot Water Generator (HWG) DFB 1-02-005-03 NF 8,760 hours 3.30 2.30 1.54 lb/1000 gal None 0% 0.63 0.63 0.44 0.44 0.30 0.30
6.0 MMBtu/hr
FB02 Thickener Area Emergency Generator (TEG) ICDE3 2-02-001-02 NF 500 hours 0.20 0.20 0.20 g/kW-hr None 0% 0.11 0.11 0.11 0.11 0.11 0.11
1,000 kW
FB03 PLS Pond Area Emergency Generator (PEG) ICDE3 2-02-001-02 NF 500 hours 0.20 0.20 0.20 g/kW-hr None 0% 0.11 0.11 0.11 0.11 0.11 0.11
1,000 kW
FB04 Main Substation Emergency Generator (MEG) ICDE3 2-02-001-02 NF 500 hours 0.20 0.20 0.20 g/kW-hr None 0% 0.08 0.08 0.08 0.08 0.08 0.08
750 kW
FB05 Administration Building Emergency Generator (AEG) ICDE3 2-02-001-02 NF 500 hours 0.20 0.20 0.20 g/kW-hr None 0% 0.08 0.08 0.08 0.08 0.08 0.08
750 kW
FB06 Electrowinning Building Emergency Generator (EWEG) ICDE1 2-02-001-02 NF 500 hours 0.40 0.40 0.40 g/kW-hr None 0% 0.01 0.01 0.01 0.01 0.01 0.01
50 kW
FB07 Primary Crusher Fire Water Pump (PCFWP) ICDE2 2-02-001-02 NF 500 hours 0.20 0.20 0.20 g/kW-hr None 0% 0.03 0.03 0.03 0.03 0.03 0.03
400 hp
Rosemont Copper ProjectEmission Inventory Information JBR ENVIRONMENTAL CONSULTANTS, INC.
November 2011Page H8
AZRP00190

PM/TSP PM10 PM2.5 Uncontrolled Controlled Uncontrolled Controlled Uncontrolled Controlled
Table H.4 Annual Particulate Emissions - Year 1
SCCNon-Fug.
(NF) / Fug. (F)
Pick-up or Control Eff. (%)
Emission FactorsAnnual Production Rate
- Year 1
PM2.5 Emissions (tpy) - Year 1Unit ID Unit Description Process Code
PM10 Emissions (tpy) - Year 1EF Units
PM/TSP Emissions (tpy) - Year 1Control CodeRate Units
FB08 SX/EW Fire Water Pump (SXFWP) ICDE2 2-02-001-02 NF 500 hours 0.20 0.20 0.20 g/kW-hr None 0% 0.03 0.03 0.03 0.03 0.03 0.03
400 hp
Miscellaneous Sources
MS01 Transfer of Bulk Pebble Lime to the Bulk Pebble Lime Silo(S-BPL) LimeLd 3-05-016-26 NF 37,800 tons 0.61 0.29 0.04 lb/ton BPLSV a 90% 1.15 1.15 0.55 0.55 0.08 0.08
MS02 Bulk Pebble Lime Silo (S-BPL) to Bulk Pebble Lime Silo Screw Conveyor (CV-BPLS) ReagTr 3-03-024-04 NF 37,800 tons 0.008 0.004 0.0006 lb/ton Enclosed a 100% 0 0 0 0 0 0
MS03 Bulk Pebble Lime Silo Screw Conveyor (CV-BPLS) to SAGMill Feed Conveyor (CV-SMF)
ReagTr 3-03-024-04 NF 37,800 tons 0.008 0.004 0.0006 lb/ton None 0% 0.16 0.16 0.07 0.07 0.01 0.01
MS04 Transfer of Lime to the Lime Storage Bin (B-L) LimeLd 3-05-016-26 NF 18,900 tons 0.61 0.29 0.04 lb/ton LSV a 90% 0.58 0.58 0.27 0.27 0.04 0.04
MS05 Transfer of Sodium Metasilicate to the Sodium MetasilicateStorage Bin (B-SM)
ReagTr 3-03-024-04 NF 3,000 tons 0.008 0.004 0.0006 lb/ton SMSV a 90% 0.001 0.001 0.0006 0.0006 0.00009 0.00009
MS06 Transfer of Flocculant from Supersacks to Flocculant Storage Bins (B-F1/F2)
ReagTr 3-03-024-04 NF 1,100 tons 0.008 0.004 0.0006 lb/ton None 0% 0.005 0.005 0.002 0.002 0.0003 0.0003
MS07 Transfer of Guar from Bags to Guar Feeder (F-Gu) ReagTr 3-03-024-04 NF 150 tons 0.008 0.004 0.0006 lb/ton None 0% 0.0006 0.0006 0.0003 0.0003 0.00004 0.00004
MS08 Transfer of Granular Cobalt Sulfate from Bags to CobaltSulfate Feeder (F-CoS)
ReagTr 3-03-024-04 NF 6 tons 0.008 0.004 0.0006 lb/ton None 0% 0.00002 0.00002 0.00001 0.00001 0.000002 0.000002
Particulate Matter Pollution Control Equipment with Emission Limits
PCL01 Crushing Area Scrubber (PC-CAS) CAS none NF 8,760 hours 1.29 1.28 1.13 lb/hr -- -- -- 5.65 -- 5.61 -- 4.94
PCL02 Stockpile Area Scrubber (PC-SAS) SAS none NF 8,760 hours 2.61 2.59 2.10 lb/hr -- -- -- 11.45 -- 11.34 -- 9.18
PCL03 Reclaim Tunnel Scrubber (PC-RTS) RTS none NF 8,760 hours 1.08 1.07 0.87 lb/hr -- -- -- 4.73 -- 4.69 -- 3.79
PCL04 Pebble Crusher Area Scrubber (PC-PCAS) PCAS none NF 8,760 hours 1.58 1.56 1.31 lb/hr -- -- -- 6.94 -- 6.83 -- 5.75
PCL05 Copper Concentrate Scrubber 1 (PC-CCS1) CCS none NF 8,760 hours 3.59 3.55 3.04 lb/hr -- -- -- 15.71 -- 15.55 -- 13.33
PCL06 Copper Concentrate Scrubber 2 (PC-CCS2) CCS none NF 8,760 hours 3.59 3.55 3.04 lb/hr -- -- -- 15.71 -- 15.55 -- 13.33
PCL07 Molybdenum Scrubber (PC-MS) / Electrostatic Precipitator (PC-EP) MS/EP none NF 8,760 hours 0.015 0.014 0.013 lb/hr -- -- -- 0.07 -- 0.06 -- 0.06
PCL08 Molybdenum Dust Collector (PC-MDC) MDC none NF 653,597,276 dscf 0.02 0.010 0.002 gr/dscf -- -- -- 0.99 -- 0.47 -- 0.07
PCL09 Laboratory Dust Collector 1 (PC-L1) LDC none NF 4,357,315,176 dscf 0.008 0.005 0.002 gr/dscf -- -- -- 2.56 -- 1.56 -- 0.76
PCL10 Laboratory Dust Collector 2 (PC-L2) LDC none NF 4,357,315,176 dscf 0.008 0.005 0.002 gr/dscf -- -- -- 2.56 -- 1.56 -- 0.76
PCL11 Laboratory Dust Collector 3 (PC-L3) LDC none NF 4,357,315,176 dscf 0.008 0.005 0.002 gr/dscf -- -- -- 2.56 -- 1.56 -- 0.76
706.86 72.44 307.04 66.81 68.87 53.68
24,720.75 2,851.09 6,407.78 785.29 650.51 87.92
25,427.62 2,923.53 6,714.81 852.11 719.38 141.60
33.85 33.85 33.85 33.85 33.85 33.85
a The control efficiency for this emission unit is inherent to the process. Therefore, the control efficiency is applied to both uncontrolled and controlled emissions.
Tailpipe Emissions (see Tables H.10-H.12):
Total Emissions (excluding tailpipe emissions):
Total Non-Fugitive Emissions (excluding tailpipe emissions):
Total Fugitive Emissions (excluding tailpipe emissions):
Rosemont Copper ProjectEmission Inventory Information JBR ENVIRONMENTAL CONSULTANTS, INC.
November 2011Page H9
AZRP00191

PM/TSP PM10 PM2.5 Uncontrolled Controlled Uncontrolled Controlled Uncontrolled Controlled
Mining
MN01 Drilling Drilling 3-05-020-10 F 80 holes 1.30 0.43 0.08 lb/hole None 0% 0.05 0.05 0.02 0.02 0.003 0.003
MN02 Blasting Blast 3-05-020-09 F 1.0 blasts 328.26 170.69 9.85 lb/blast None 0% 0.16 0.16 0.09 0.09 0.005 0.005
MN03 Loading Concentrate Ore Loading 3-03-024-08 F 59,000 tons 0.0007 0.0003 0.00005 lb/ton None 0% 0.02 0.02 0.01 0.01 0.001 0.001
MN04 Loading Leach Ore Loading 3-03-024-08 F 57,000 tons 0.0007 0.0003 0.00005 lb/ton None 0% 0.02 0.02 0.01 0.01 0.00 0.00
MN05 Loading Waste Rock Loading 3-03-024-08 F 200,000 tons 0.0007 0.0003 0.00005 lb/ton None 0% 0.07 0.07 0.03 0.03 0.005 0.005
MN06a Hauling Concentrate Ore to Primary Crusher Dump Hopper / Run of Mine Stockpile (Inside the Pit)
HaulingHD 3-05-020-11 F 324 VMT 21.25 5.46 0.55 lb/VMT HaulRdUI 90% 3.44 0.34 0.88 0.09 0.09 0.01
MN06b Hauling Concentrate Ore to Primary Crusher Dump Hopper / Run of Mine Stockpile (Outside the Pit)
HaulingHD 3-05-020-11 F 539 VMT 21.25 5.46 0.55 lb/VMT HaulRdUO 90% 5.73 0.57 1.47 0.15 0.15 0.01
MN07a Hauling Leach Ore to Leach Pad (Inside the Pit) HaulingHD 3-05-020-11 F 241 VMT 21.25 5.46 0.55 lb/VMT HaulRdUI 90% 2.56 0.26 0.66 0.07 0.07 0.01
MN07b Hauling Leach Ore to Leach Pad (Outside the Pit) HaulingHD 3-05-020-11 F 586 VMT 21.25 5.46 0.55 lb/VMT HaulRdUO 90% 6.22 0.62 1.60 0.16 0.16 0.02
MN08a Hauling Waste Rock to Waste Rock Storage Area (Inside the Pit)
HaulingHD 3-05-020-11 F 796 VMT 21.25 5.46 0.55 lb/VMT HaulRdUI 90% 8.46 0.85 2.17 0.22 0.22 0.02
MN08b Hauling Waste Rock to Waste Rock Storage Area (Outside the Pit)
HaulingHD 3-05-020-11 F 3,661 VMT 21.25 5.46 0.55 lb/VMT HaulRdUO 90% 38.89 3.89 9.99 1.00 1.00 0.10
MN09 Unloading Concentrate Ore to Run of Mine Stockpile TrStnUnp 3-03-024-08 F 59,000 tons 0.001 0.0006 0.00009 lb/ton None 0% 0.04 0.04 0.02 0.02 0.003 0.003
MN10 Unloading Leach Ore to Leach Pad TrStnUnp 3-03-024-08 F 57,000 tons 0.001 0.0006 0.00009 lb/ton None 0% 0.03 0.03 0.02 0.02 0.002 0.002
MN11 Unloading Waste Rock to Waste Rock Storage Area TrStnUnp 3-03-024-08 F 200,000 tons 0.001 0.0006 0.00009 lb/ton None 0% 0.12 0.12 0.06 0.06 0.009 0.009
MN12 Bulldozer Use Bldzrs 3-05-010-99 F 151 hrs 2.82 0.43 0.30 lb/hr None 0% 0.21 0.21 0.03 0.03 0.02 0.02
MN13a Water Truck Use (Inside the Pit) WtrTrksHD 3-05-010-99 F 87 VMT 17.06 4.38 0.44 lb/VMT HaulRdWTI 90% 0.74 0.07 0.19 0.02 0.02 0.002
MN13b Water Truck Use (Outside the Pit) WtrTrksHD 3-05-010-99 F 305 VMT 17.06 4.38 0.44 lb/VMT HaulRdWTO 90% 2.60 0.26 0.67 0.07 0.07 0.007
MN14 Grader Use GradersY1 3-05-010-99 F 314 VMT 2.05 0.71 0.06 lb/VMT None 0% 0.32 0.32 0.11 0.11 0.01 0.01
MN15a Support Vehicle Use (Inside the Pit) SupVehY1D 3-05-010-99 F 1,857 VMT 7.19 1.85 0.18 lb/VMT HaulRdUI 90% 6.67 0.67 1.71 0.17 0.17 0.02
MN15b Support Vehicle Use (Outside the Pit) SupVehY1D 3-05-010-99 F 1,857 VMT 7.19 1.85 0.18 lb/VMT HaulRdUO 90% 6.67 0.67 1.71 0.17 0.17 0.02
Primary Crushing, Conveying, Coarse Ore Storage, and Reclaim Conveying
PC01 Wind Erosion of the Run of Mine Stockpile WindROM 3-03-888-01 F 26 acres 0.21 0.11 0.02 ton/acre-yr None 0% 0.01 0.01 0.007 0.007 0.001 0.001
PC02 Unloading to Primary Crusher Dump Hopper (H-CDp) fromHaul Trucks or Run of Mine Stockpile
TrStnUnp 3-03-024-08 F 166,800 tons 0.001 0.0006 0.00009 lb/ton WSpry 82.5% 0.10 0.02 0.05 0.008 0.007 0.001
PC03 Primary Crusher (PCr) CrushP 3-03-024-05 NF 166,800 tons 0.02 0.009 0.002 lb/ton CAS 100% 1.67 0 0.75 0 0.14 0
PC04 Primary Crusher (PCr) to Crusher Discharge Hopper (H-CDs) TrStnPrt 3-03-024-08 NF 166,800 tons 0.0002 0.00007 0.00001 lb/ton Enclosed a 100% 0 0 0 0 0 0
PC05 Crusher Discharge Hopper (H-CDs) to Crusher DischargeFeeder (F-CD)
TrStnPrt 3-03-024-08 NF 166,800 tons 0.0002 0.00007 0.00001 lb/ton CAS 100% 0.01 0 0.006 0 0.0009 0
PC06 Crusher Discharge Feeder (F-CD) to Stockpile FeedConveyor (CV-SF)
TrStnPrt 3-03-024-08 NF 166,800 tons 0.0002 0.00007 0.00001 lb/ton CAS 100% 0.01 0 0.006 0 0.0009 0
PC07 Stockpile Feed Conveyor (CV-SF) to Stockpile TripperConveyor (CV-ST)
TrStnPrt 3-03-024-08 NF 166,800 tons 0.0002 0.00007 0.00001 lb/ton SAS 100% 0.01 0 0.006 0 0.0009 0
PM/TSP Emissions (tpd) - Year 1 PM2.5 Emissions (tpd) - Year 1
Table H.5 Maximum Daily Particulate Emissions - Year 1Pick-up or
Control Eff. (%)
Daily Production Rate - Year 1
PM10 Emissions (tpd) - Year 1Rate Units
Non-Fug. (NF) /
Fug. (F)
Emission FactorsUnit ID Unit Description Process Code SCC EF Units Control
Code
Rosemont Copper ProjectEmission Inventory Information JBR ENVIRONMENTAL CONSULTANTS, INC.
November 2011Page H10
AZRP00192

PM/TSP PM10 PM2.5 Uncontrolled Controlled Uncontrolled Controlled Uncontrolled Controlled
PM/TSP Emissions (tpd) - Year 1 PM2.5 Emissions (tpd) - Year 1
Table H.5 Maximum Daily Particulate Emissions - Year 1Pick-up or
Control Eff. (%)
Daily Production Rate - Year 1
PM10 Emissions (tpd) - Year 1Rate Units
Non-Fug. (NF) /
Fug. (F)
Emission FactorsUnit ID Unit Description Process Code SCC EF Units Control
Code
PC08 Stockpile Tripper Conveyor (CV-ST) to Covered Coarse Ore Stockpile
TrStnPrt 3-03-024-08 F 166,800 tons 0.0002 0.00007 0.00001 lb/ton SAS 100% 0.01 0 0.006 0 0.0009 0
PC09 Wind Erosion of the Coarse Ore Stockpile WindCvd 3-03-888-01 F 5 acres 0 0 0 ton/acre-yr Enclosed a 100% 0 0 0 0 0 0
PC10 Coarse Ore Stockpile to Reclaim Feeders (F-R1/R4) TrStnPrt 3-03-024-08 NF 166,800 tons 0.0002 0.00007 0.00001 lb/ton UndrGrd a 100% 0 0 0 0 0 0
PC11 Reclaim Feeders (F-R1/R4) to Reclaim Conveyor (CV-R) TrStnPrt 3-03-024-08 NF 166,800 tons 0.0002 0.00007 0.00001 lb/ton RTS 100% 0.01 0 0.006 0 0.0009 0
PC12 Reclaim Conveyor (CV-R) to SAG Mill Feed Conveyor(CV-SMF) TrStnPrt 3-03-024-08 NF 166,800 tons 0.0002 0.00007 0.00001 lb/ton PCAS 100% 0.01 0 0.006 0 0.0009 0
PC13 Pebble Conveyor No. 3 (CV-Pb3) to SAG Mill Feed Conveyor (CV-SMF)
TrStnPrt 3-03-024-08 NF 42,508 tons 0.0002 0.00007 0.00001 lb/ton PCAS 100% 0.003 0 0.002 0 0.0002 0
PC14 SAG Mill Feed Conveyor (CV-SMF) to SAG Mill (M-SAG) TrStnPrt 3-03-024-08 NF 209,432 tons 0.0002 0.00007 0.00001 lb/ton Water a 100% 0 0 0 0 0 0
Milling
M01 SAG Mill (M-SAG) CrushS 3-03-024-06 NF 209,432 tons 0.05 0.02 0.004 lb/ton Wet a 100% 0 0 0 0 0 0
M02 SAG Mill (M-SAG) to Trommel Screen (Sn-T) TrStnPrt 3-03-024-08 NF 209,432 tons 0.0002 0.00007 0.00001 lb/ton Enclosed a 100% 0 0 0 0 0 0
M03 Trommel Screen (Sn-T) Screen 3-05-020-02 NF 209,432 tons 0.025 0.0087 0.0006 lb/ton Wet a 100% 0 0 0 0 0 0
M04 Trommel Screen (Sn-T) to Pebble Conveyor No. 1 (CV-Pb1) TrStnPrt 3-03-024-08 NF 44,426 tons 0.0002 0.00007 0.00001 lb/ton Clean a 100% 0 0 0 0 0 0
M05 Pebble Conveyor No. 1 (CV-Pb1) to Pebble Wash Screen(Sn-PbW)
TrStnPrt 3-03-024-08 NF 44,426 tons 0.0002 0.00007 0.00001 lb/ton Clean a 100% 0 0 0 0 0 0
M06 Pebble Wash Screen (Sn-PbW) Screen 3-05-020-02 NF 44,426 tons 0.025 0.0087 0.0006 lb/ton Wet a 100% 0 0 0 0 0 0
M07 Pebble Wash Screen (Sn-PbW) to Pebble Conveyor No. 2 TrStnPrt 3-03-024-08 NF 42,508 tons 0.0002 0.00007 0.00001 lb/ton Clean a 100% 0 0 0 0 0 0
M08 Pebble Conveyor No. 2 (CV-Pb2) to SAG Oversize Surge Bin(B-SAGOS) TrStnPrt 3-03-024-08 NF 42,508 tons 0.0002 0.00007 0.00001 lb/ton PCAS 100% 0.003 0 0.002 0 0.0002 0
M09 SAG Oversize Surge Bin (B-SAGOS) to Pebble CrusherFeeder (F-PbC)
TrStnPrt 3-03-024-08 NF 42,508 tons 0.0002 0.00007 0.00001 lb/ton PCAS 100% 0.003 0 0.002 0 0.0002 0
M10 Pebble Crusher Feeder (F-PbC) to Pebble Crusher (PbC) TrStnPrt 3-03-024-08 NF 42,508 tons 0.0002 0.00007 0.00001 lb/ton Enclosed a 100% 0 0 0 0 0 0
M11 Pebble Crusher (PbC) CrushT 3-03-024-07 NF 42,508 tons 0.06 0.02 0.004 lb/ton PCAS 100% 1.28 0 0.43 0 0.08 0
M12 Pebble Crusher (PbC) to Pebble Conveyor No. 3 (CV-Pb3) TrStnPrt 3-03-024-08 NF 42,508 tons 0.0002 0.00007 0.00001 lb/ton PCAS 100% 0.003 0 0.002 0 0.0002 0
Copper Concentrate Dewatering and Stacking
CCD01 Copper Concentrate Filters (Ft-CC1/CC4) to Copper Concentrate Conveyor (CV-CC) TrCuCncPrt 3-03-024-08 NF 3,312 tons 0.00004 0.00002 0.000003 lb/ton Enclosed a 100% 0 0 0 0 0 0
CCD02 Copper Concentrate Conveyor (CV-CC) to Copper Concentrate Loadout Stockpile
TrCuCncPrt 3-03-024-08 F 3,312 tons 0.00004 0.00002 0.000003 lb/ton CCS 100% 0.00007 0 0.00003 0 0.000005 0
CCD03 Wind Erosion of Copper Concentrate Loadout Stockpile WindCvd 3-03-888-01 F 1.17 acres 0 0 0 ton/acre-yr Enclosed a 100% 0 0 0 0 0 0
CCD04 Copper Concentrate Loadout Stockpile to Shipment Truck via Front End Loaders
TrCuCncPrt 3-03-024-08 F 3,312 tons 0.00004 0.00002 0.000003 lb/ton CCS 100% 0.00007 0 0.00003 0 0.000005 0
Molybdenum Dewatering and Packaging
MD01 Molybdenum Concentrate Filter (Ft-MC) to Molybdenum Concentrate Dryer (D-MC)
TrMlyCncPrt 3-03-024-08 NF 45.6 tons 0.00002 0.00001 0.000002 lb/ton Enclosed a 100% 0 0 0 0 0 0
MD02 Molybdenum Concentrate Dryer MolyDry 3-03-024-11 NF 45.6 tons 19.70 12.00 5.91 lb/ton MS/EP 100% 0.45 0 0.27 0 0.13 0
MD03 Molybdenum Concentrate Dryer (D-MC) to MolybdenumConcentrate Bin (B-MC)
DTrMlyCncPrt 3-03-024-08 NF 45.6 tons 0.00004 0.00002 0.000003 lb/ton MDC 100% 0.000001 0 0.0000005 0 0.00000007 0
Rosemont Copper ProjectEmission Inventory Information JBR ENVIRONMENTAL CONSULTANTS, INC.
November 2011Page H11
AZRP00193

PM/TSP PM10 PM2.5 Uncontrolled Controlled Uncontrolled Controlled Uncontrolled Controlled
PM/TSP Emissions (tpd) - Year 1 PM2.5 Emissions (tpd) - Year 1
Table H.5 Maximum Daily Particulate Emissions - Year 1Pick-up or
Control Eff. (%)
Daily Production Rate - Year 1
PM10 Emissions (tpd) - Year 1Rate Units
Non-Fug. (NF) /
Fug. (F)
Emission FactorsUnit ID Unit Description Process Code SCC EF Units Control
Code
MD04 Molybdenum Concentrate Bin (B-MC) to MolybdenumConcentrate Hopper (H-MC)
DTrMlyCnc 3-03-024-08 NF 45.6 tons 0.0003 0.0002 0.00002 lb/ton None 0% 0.000008 0.000008 0.000004 0.000004 0.0000005 0.0000005
MD05 Molybdenum Concentrate Hopper (H-MC) to MolybdenumConcentrate Conveyor (CV-MC)
DTrMlyCncPrt 3-03-024-08 NF 45.6 tons 0.00004 0.00002 0.000003 lb/ton Enclosed a 100% 0 0 0 0 0 0
MD06 Molybdenum Concentrate Conveyor (CV-MC) to Molybdenum Packaging and Weigh System (MPS)
DTrMlyCnc 3-03-024-08 NF 45.6 tons 0.0003 0.0002 0.00002 lb/ton MDC 100% 0.000008 0 0.000004 0 0.0000005 0
Tailings Dewatering and Placement
TDS01 Tailings Filters (Ft-T1/T14) to Tailings Belt Feeders (F-T1/T14) FiltTailPrt 3-03-024-08 NF 257,328 tons 0.00002 0.00001 0.000002 lb/ton Enclosed a 100% 0 0 0 0 0 0
TDS02 Tailings Belt Feeders (F-T1/T14) to Fixed Tailings ConveyorNo. 1 (CV-F1)
FiltTailPrt 3-03-024-08 NF 257,328 tons 0.00002 0.00001 0.000002 lb/ton Enclosed a 100% 0 0 0 0 0 0
TDS03 Fixed Tailings Conveyor No. 1 (CV-F1) to Fixed TailingsConveyor No. 2 (CV-F2)
FiltTailPrt 3-03-024-08 NF 257,328 tons 0.00002 0.00001 0.000002 lb/ton Enclosed a 100% 0 0 0 0 0 0
TDS04 Fixed Tailings Conveyor No. 2 (CV-F2) to Fixed Tailings Conveyor No. 3 (CV-F3)
FiltTailPrt 3-03-024-08 NF 257,328 tons 0.00002 0.00001 0.000002 lb/ton None 0% 0.003 0.003 0.001 0.001 0.0002 0.0002
TDS05 Fixed Tailings Conveyor No. 3 (CV-F3) to RelocatableConveyor (CV-R1)
FiltTailPrt 3-03-024-08 F 257,328 tons 0.00002 0.00001 0.000002 lb/ton None 0% 0.003 0.003 0.001 0.001 0.0002 0.0002
TDS06 Relocatable Conveyor (CV-R1) to Shiftable Conveyor (CV-S1) FiltTailPrt 3-03-024-08 F 257,328 tons 0.00002 0.00001 0.000002 lb/ton None 0% 0.003 0.003 0.001 0.001 0.0002 0.0002
TDS07 Shiftable Conveyor (CV-S1) to Belt Wagon Conveyor(CV-BW1)
FiltTail 3-03-024-08 F 257,328 tons 0.0002 0.00009 0.00001 lb/ton None 0% 0.02 0.02 0.01 0.01 0.002 0.002
TDS08 Belt Wagon Conveyor (CV-BW1) to Spreader Crawler Mounted Conveyor (CV-SP1)
FiltTail 3-03-024-08 F 257,328 tons 0.0002 0.00009 0.00001 lb/ton None 0% 0.02 0.02 0.01 0.01 0.002 0.002
TDS09 Spreader Crawler Mounted Conveyor (CV-SP1) to Tailings Storage
FiltTail 3-03-024-08 F 257,328 tons 0.0002 0.00009 0.00001 lb/ton None 0% 0.02 0.02 0.01 0.01 0.002 0.002
TDS10 Wind Erosion of Tailings Storage TailStrg 3-03-888-01 F 1,500 acres 0.02 0.01 0.002 ton/acre-yr None 0% 0.08 0.08 0.04 0.04 0.006 0.006
Fuel Burning Equipment
FB01 Diesel Electrowinning Hot Water Generator (HWG) DFB 1-02-005-03 NF 24 hours 3.30 2.30 1.54 lb/1000 gal None 0% 0.002 0.002 0.001 0.001 0.0008 0.0008
6.0 MMBtu/hr
FB02 Thickener Area Emergency Generator (TEG) ICDE3 2-02-001-02 NF 24 hours 0.20 0.20 0.20 g/kW-hr None 0% 0.005 0.005 0.005 0.005 0.005 0.005
1,000 kW
FB03 PLS Pond Area Emergency Generator (PEG) ICDE3 2-02-001-02 NF 24 hours 0.20 0.20 0.20 g/kW-hr None 0% 0.005 0.005 0.005 0.005 0.005 0.005
1,000 kW
FB04 Main Substation Emergency Generator (MEG) ICDE3 2-02-001-02 NF 24 hours 0.20 0.20 0.20 g/kW-hr None 0% 0.004 0.004 0.004 0.004 0.004 0.004
750 kW
FB05 Administration Building Emergency Generator (AEG) ICDE3 2-02-001-02 NF 24 hours 0.20 0.20 0.20 g/kW-hr None 0% 0.004 0.004 0.004 0.004 0.004 0.004
750 kW
FB06 Electrowinning Building Emergency Generator (EWEG) ICDE1 2-02-001-02 NF 24 hours 0.40 0.40 0.40 g/kW-hr None 0% 0.0005 0.0005 0.0005 0.0005 0.0005 0.0005
50 kW
FB07 Primary Crusher Fire Water Pump (PCFWP) ICDE2 2-02-001-02 NF 24 hours 0.20 0.20 0.20 g/kW-hr None 0% 0.002 0.002 0.002 0.002 0.002 0.002
400 hp
Rosemont Copper ProjectEmission Inventory Information JBR ENVIRONMENTAL CONSULTANTS, INC.
November 2011Page H12
AZRP00194

PM/TSP PM10 PM2.5 Uncontrolled Controlled Uncontrolled Controlled Uncontrolled Controlled
PM/TSP Emissions (tpd) - Year 1 PM2.5 Emissions (tpd) - Year 1
Table H.5 Maximum Daily Particulate Emissions - Year 1Pick-up or
Control Eff. (%)
Daily Production Rate - Year 1
PM10 Emissions (tpd) - Year 1Rate Units
Non-Fug. (NF) /
Fug. (F)
Emission FactorsUnit ID Unit Description Process Code SCC EF Units Control
Code
FB08 SX/EW Fire Water Pump (SXFWP) ICDE2 2-02-001-02 NF 24 hours 0.20 0.20 0.20 g/kW-hr None 0% 0.002 0.002 0.002 0.002 0.002 0.002
400 hp
Miscellaneous Sources
MS01 Transfer of Bulk Pebble Lime to the Bulk Pebble Lime Silo(S-BPL) LimeLd 3-05-016-26 NF 124.27 tons 0.61 0.29 0.04 lb/ton BPLSV a 90% 0.004 0.004 0.002 0.002 0.0003 0.0003
MS02 Bulk Pebble Lime Silo (S-BPL) to Bulk Pebble Lime Silo Screw Conveyor (CV-BPLS) ReagTr 3-03-024-04 NF 124.27 tons 0.008 0.004 0.0006 lb/ton Enclosed a 100% 0 0 0 0 0 0
MS03 Bulk Pebble Lime Silo Screw Conveyor (CV-BPLS) to SAGMill Feed Conveyor (CV-SMF)
ReagTr 3-03-024-04 NF 124.27 tons 0.008 0.004 0.0006 lb/ton None 0% 0.0005 0.0005 0.0002 0.0002 0.00004 0.00004
MS04 Transfer of Lime to the Lime Storage Bin (B-L) LimeLd 3-05-016-26 NF 62.14 tons 0.61 0.29 0.04 lb/ton LSV a 90% 0.002 0.002 0.0009 0.0009 0.0001 0.0001
MS05 Transfer of Sodium Metasilicate to the Sodium MetasilicateStorage Bin (B-SM)
ReagTr 3-03-024-04 NF 9.86 tons 0.008 0.004 0.0006 lb/ton SMSV a 90% 0.000004 0.000004 0.000002 0.000002 0.0000003 0.0000003
MS06 Transfer of Flocculant from Supersacks to Flocculant Storage Bins (B-F1/F2)
ReagTr 3-03-024-04 NF 3.62 tons 0.008 0.004 0.0006 lb/ton None 0% 0.00001 0.00001 0.000007 0.000007 0.000001 0.000001
MS07 Transfer of Guar from Bags to Guar Feeder (F-Gu) ReagTr 3-03-024-04 NF 0.49 tons 0.008 0.004 0.0006 lb/ton None 0% 0.000002 0.000002 0.000001 0.000001 0.0000001 0.0000001
MS08 Transfer of Granular Cobalt Sulfate from Bags to CobaltSulfate Feeder (F-CoS)
ReagTr 3-03-024-04 NF 0.02 tons 0.008 0.004 0.0006 lb/ton None 0% 0.00000008 0.00000008 0.00000004 0.00000004 0.000000006 0.000000006
Particulate Matter Pollution Control Equipment with Emission Limits
PCL01 Crushing Area Scrubber (PC-CAS) CAS none NF 24 hours 1.29 1.28 1.13 lb/hr -- -- -- 0.02 -- 0.02 -- 0.01
PCL02 Stockpile Area Scrubber (PC-SAS) SAS none NF 24 hours 2.61 2.59 2.10 lb/hr -- -- -- 0.03 -- 0.03 -- 0.03
PCL03 Reclaim Tunnel Scrubber (PC-RTS) RTS none NF 24 hours 1.08 1.07 0.87 lb/hr -- -- -- 0.01 -- 0.01 -- 0.01
PCL04 Pebble Crusher Area Scrubber (PC-PCAS) PCAS none NF 24 hours 1.58 1.56 1.31 lb/hr -- -- -- 0.02 -- 0.02 -- 0.02
PCL05 Copper Concentrate Scrubber 1 (PC-CCS1) CCS none NF 24 hours 3.59 3.55 3.04 lb/hr -- -- -- 0.04 -- 0.04 -- 0.04
PCL06 Copper Concentrate Scrubber 2 (PC-CCS2) CCS none NF 24 hours 3.59 3.55 3.04 lb/hr -- -- -- 0.04 -- 0.04 -- 0.04
PCL07 Molybdenum Scrubber (PC-MS) / Electrostatic Precipitator (PC-EP) MS/EP none NF 24 hours 0.015 0.014 0.013 lb/hr -- -- -- 0.0002 -- 0.0002 -- 0.0002
PCL08 Molybdenum Dust Collector (PC-MDC) MDC none NF 1,790,677 dscf 0.02 0.010 0.002 gr/dscf -- -- -- 0.003 -- 0.001 -- 0.0002
PCL09 Laboratory Dust Collector 1 (PC-L1) LDC none NF 11,937,850 dscf 0.008 0.005 0.002 gr/dscf -- -- -- 0.007 -- 0.004 -- 0.002
PCL10 Laboratory Dust Collector 2 (PC-L2) LDC none NF 11,937,850 dscf 0.008 0.005 0.002 gr/dscf -- -- -- 0.007 -- 0.004 -- 0.002
PCL11 Laboratory Dust Collector 3 (PC-L3) LDC none NF 11,937,850 dscf 0.008 0.005 0.002 gr/dscf -- -- -- 0.007 -- 0.004 -- 0.002
3.50 0.22 1.51 0.21 0.38 0.17
83.32 9.44 21.59 2.59 2.19 0.29
86.83 9.66 23.11 2.79 2.57 0.45
0.12 0.12 0.12 0.12 0.12 0.12
a The control efficiency for this emission unit is inherent to the process. Therefore, the control efficiency is applied to both uncontrolled and controlled emissions.
Tailpipe Emissions (see Tables H.10-H.12):
Total Emissions (excluding tailpipe emissions):
Total Non-Fugitive Emissions (excluding tailpipe emissions):
Total Fugitive Emissions (excluding tailpipe emissions):
Rosemont Copper ProjectEmission Inventory Information JBR ENVIRONMENTAL CONSULTANTS, INC.
November 2011Page H13
AZRP00195

PM/TSP PM10 PM2.5 Uncontrolled Controlled Uncontrolled Controlled Uncontrolled Controlled
Mining
MN01 Drilling Drilling 3-05-020-10 F 80 holes 1.30 0.43 0.08 lb/hole None 0% 104.00 104.00 34.67 34.67 6.42 6.42
MN02 Blasting Blast 3-05-020-09 F 1.00 blasts 328.26 170.69 9.85 lb/blast None 0% 328.26 328.26 170.69 170.69 9.85 9.85
MN03 Loading Concentrate Ore Loading 3-03-024-08 F 2,458 tons 0.0007 0.0003 0.00005 lb/ton None 0% 1.72 1.72 0.82 0.82 0.12 0.12
MN04 Loading Leach Ore Loading 3-03-024-08 F 2,375 tons 0.0007 0.0003 0.00005 lb/ton None 0% 1.67 1.67 0.79 0.79 0.12 0.12
MN05 Loading Waste Rock Loading 3-03-024-08 F 8,333 tons 0.0007 0.0003 0.00005 lb/ton None 0% 5.85 5.85 2.76 2.76 0.42 0.42
MN06a Hauling Concentrate Ore to Primary Crusher Dump Hopper / Run of Mine Stockpile (Inside the Pit)
HaulingHD 3-05-020-11 F 13 VMT 21.25 5.46 0.55 lb/VMT HaulRdUI 90% 286.47 28.65 73.61 7.36 7.36 0.74
MN06b Hauling Concentrate Ore to Primary Crusher Dump Hopper / Run of Mine Stockpile (Outside the Pit)
HaulingHD 3-05-020-11 F 22 VMT 21.25 5.46 0.55 lb/VMT HaulRdUO 90% 477.43 47.74 122.68 12.27 12.27 1.23
MN07a Hauling Leach Ore to Leach Pad (Inside the Pit) HaulingHD 3-05-020-11 F 10 VMT 21.25 5.46 0.55 lb/VMT HaulRdUI 90% 213.08 21.31 54.75 5.48 5.48 0.55
MN07b Hauling Leach Ore to Leach Pad (Outside the Pit) HaulingHD 3-05-020-11 F 24 VMT 21.25 5.46 0.55 lb/VMT HaulRdUO 90% 518.59 51.86 133.25 13.33 13.33 1.33
MN08a Hauling Waste Rock to Waste Rock Storage Area (Inside the Pit)
HaulingHD 3-05-020-11 F 33 VMT 21.25 5.46 0.55 lb/VMT HaulRdUI 90% 704.98 70.50 181.15 18.11 18.11 1.81
MN08b Hauling Waste Rock to Waste Rock Storage Area (Outside the Pit)
HaulingHD 3-05-020-11 F 153 VMT 21.25 5.46 0.55 lb/VMT HaulRdUO 90% 3,240.83 324.08 832.74 83.27 83.27 8.33
MN09 Unloading Concentrate Ore to Run of Mine Stockpile TrStnUnp 3-03-024-08 F 2,458 tons 0.001 0.0006 0.00009 lb/ton None 0% 2.92 2.92 1.38 1.38 0.21 0.21
MN10 Unloading Leach Ore to Leach Pad TrStnUnp 3-03-024-08 F 2,375 tons 0.001 0.0006 0.00009 lb/ton None 0% 2.82 2.82 1.33 1.33 0.20 0.20
MN11 Unloading Waste Rock to Waste Rock Storage Area TrStnUnp 3-03-024-08 F 8,333 tons 0.001 0.0006 0.00009 lb/ton None 0% 9.90 9.90 4.68 4.68 0.71 0.71
MN12 Bulldozer Use Bldzrs 3-05-010-99 F 6 hrs 2.82 0.43 0.30 lb/hr None 0% 17.73 17.73 2.67 2.67 1.86 1.86
MN13a Water Truck Use (Inside the Pit) WtrTrksHD 3-05-010-99 F 4 VMT 17.06 4.38 0.44 lb/VMT HaulRdWTI 90% 61.66 6.17 15.84 1.58 1.58 0.16
MN13b Water Truck Use (Outside the Pit) WtrTrksHD 3-05-010-99 F 13 VMT 17.06 4.38 0.44 lb/VMT HaulRdWTO 90% 216.90 21.69 55.73 5.57 5.57 0.56
MN14 Grader Use GradersY1 3-05-010-99 F 13 VMT 2.05 0.71 0.06 lb/VMT None 0% 26.88 26.88 9.35 9.35 0.83 0.83
MN15a Support Vehicle Use (Inside the Pit) SupVehY1H 3-05-010-99 F 118 VMT 6.96 1.79 0.18 lb/VMT HaulRdUI 90% 823.98 82.40 211.72 21.17 21.17 2.12
MN15b Support Vehicle Use (Outside the Pit) SupVehY1H 3-05-010-99 F 118 VMT 6.96 1.79 0.18 lb/VMT HaulRdUO 90% 823.98 82.40 211.72 21.17 21.17 2.12
Primary Crushing, Conveying, Coarse Ore Storage, and Reclaim Conveying
PC01 Wind Erosion of the Run of Mine Stockpile WindROM 3-03-888-01 F 26 acres 0.21 0.11 0.02 ton/acre-yr None 0% 1.24 1.24 0.62 0.62 0.09 0.09
PC02 Unloading to Primary Crusher Dump Hopper (H-CDp) fromHaul Trucks or Run of Mine Stockpile
TrStnUnp 3-03-024-08 F 6,950 tons 0.001 0.0006 0.00009 lb/ton WSpry 82.5% 8.26 1.45 3.91 0.68 0.59 0.10
PC03 Primary Crusher (PCr) CrushP 3-03-024-05 NF 6,950 tons 0.02 0.009 0.002 lb/ton CAS 100% 139.00 0 62.55 0 11.58 0
PC04 Primary Crusher (PCr) to Crusher Discharge Hopper (H-CDs) TrStnPrt 3-03-024-08 NF 6,950 tons 0.0002 0.00007 0.00001 lb/ton Enclosed a 100% 0 0 0 0 0 0
PC05 Crusher Discharge Hopper (H-CDs) to Crusher DischargeFeeder (F-CD)
TrStnPrt 3-03-024-08 NF 6,950 tons 0.0002 0.00007 0.00001 lb/ton CAS 100% 1.08 0 0.51 0 0.08 0
PC06 Crusher Discharge Feeder (F-CD) to Stockpile FeedConveyor (CV-SF)
TrStnPrt 3-03-024-08 NF 6,950 tons 0.0002 0.00007 0.00001 lb/ton CAS 100% 1.08 0 0.51 0 0.08 0
PC07 Stockpile Feed Conveyor (CV-SF) to Stockpile TripperConveyor (CV-ST)
TrStnPrt 3-03-024-08 NF 6,950 tons 0.0002 0.00007 0.00001 lb/ton SAS 100% 1.08 0 0.51 0 0.08 0
Table H.6 Maximum Hourly Particulate Emissions - Year 1
Emission Factors PM/TSP Emissions (lb/hr) - Year 1 PM10 Emissions (lb/hr) - Year 1 PM2.5 Emissions (lb/hr) - Year 1Unit Description Control
CodeProcess Code SCC EF UnitsUnit ID
Pick-up or Control Eff. (%)
Non-Fug. (NF) /
Fug. (F)Rate Units
Hourly Production Rate
- Year 1
Rosemont Copper ProjectEmission Inventory Information JBR ENVIRONMENTAL CONSULTANTS, INC.
November 2011Page H14
AZRP00196

PM/TSP PM10 PM2.5 Uncontrolled Controlled Uncontrolled Controlled Uncontrolled Controlled
Table H.6 Maximum Hourly Particulate Emissions - Year 1
Emission Factors PM/TSP Emissions (lb/hr) - Year 1 PM10 Emissions (lb/hr) - Year 1 PM2.5 Emissions (lb/hr) - Year 1Unit Description Control
CodeProcess Code SCC EF UnitsUnit ID
Pick-up or Control Eff. (%)
Non-Fug. (NF) /
Fug. (F)Rate Units
Hourly Production Rate
- Year 1
PC08 Stockpile Tripper Conveyor (CV-ST) to Covered Coarse Ore Stockpile
TrStnPrt 3-03-024-08 F 6,950 tons 0.0002 0.00007 0.00001 lb/ton SAS 100% 1.08 0 0.51 0 0.08 0
PC09 Wind Erosion of the Coarse Ore Stockpile WindCvd 3-03-888-01 F 5 acres 0 0 0 ton/acre-yr Enclosed a 100% 0 0 0 0 0 0
PC10 Coarse Ore Stockpile to Reclaim Feeders (F-R1/R4) TrStnPrt 3-03-024-08 NF 6,950 tons 0.0002 0.00007 0.00001 lb/ton UndrGrd a 100% 0 0 0 0 0 0
PC11 Reclaim Feeders (F-R1/R4) to Reclaim Conveyor (CV-R) TrStnPrt 3-03-024-08 NF 6,950 tons 0.0002 0.00007 0.00001 lb/ton RTS 100% 1.08 0 0.51 0 0.08 0
PC12 Reclaim Conveyor (CV-R) to SAG Mill Feed Conveyor(CV-SMF) TrStnPrt 3-03-024-08 NF 6,950 tons 0.0002 0.00007 0.00001 lb/ton PCAS 100% 1.08 0 0.51 0 0.08 0
PC13 Pebble Conveyor No. 3 (CV-Pb3) to SAG Mill Feed Conveyor (CV-SMF)
TrStnPrt 3-03-024-08 NF 1,771 tons 0.0002 0.00007 0.00001 lb/ton PCAS 100% 0.28 0 0.13 0 0.02 0
PC14 SAG Mill Feed Conveyor (CV-SMF) to SAG Mill (M-SAG) TrStnPrt 3-03-024-08 NF 8,726 tons 0.0002 0.00007 0.00001 lb/ton Water a 100% 0 0 0 0 0 0
Milling
M01 SAG Mill (M-SAG) CrushS 3-03-024-06 NF 8,726 tons 0.05 0.02 0.004 lb/ton Wet a 100% 0 0 0 0 0 0
M02 SAG Mill (M-SAG) to Trommel Screen (Sn-T) TrStnPrt 3-03-024-08 NF 8,726 tons 0.0002 0.00007 0.00001 lb/ton Enclosed a 100% 0 0 0 0 0 0
M03 Trommel Screen (Sn-T) Screen 3-05-020-02 NF 8,726 tons 0.025 0.0087 0.0006 lb/ton Wet a 100% 0 0 0 0 0 0
M04 Trommel Screen (Sn-T) to Pebble Conveyor No. 1 (CV-Pb1) TrStnPrt 3-03-024-08 NF 1,851 tons 0.0002 0.00007 0.00001 lb/ton Clean a 100% 0 0 0 0 0 0
M05 Pebble Conveyor No. 1 (CV-Pb1) to Pebble Wash Screen(Sn-PbW)
TrStnPrt 3-03-024-08 NF 1,851 tons 0.0002 0.00007 0.00001 lb/ton Clean a 100% 0 0 0 0 0 0
M06 Pebble Wash Screen (Sn-PbW) Screen 3-05-020-02 NF 1,851 tons 0.025 0.0087 0.0006 lb/ton Wet a 100% 0 0 0 0 0 0
M07 Pebble Wash Screen (Sn-PbW) to Pebble Conveyor No. 2 TrStnPrt 3-03-024-08 NF 1,771 tons 0.0002 0.00007 0.00001 lb/ton Clean a 100% 0 0 0 0 0 0
M08 Pebble Conveyor No. 2 (CV-Pb2) to SAG Oversize Surge Bin(B-SAGOS) TrStnPrt 3-03-024-08 NF 1,771 tons 0.0002 0.00007 0.00001 lb/ton PCAS 100% 0.28 0 0.13 0 0.02 0
M09 SAG Oversize Surge Bin (B-SAGOS) to Pebble CrusherFeeder (F-PbC)
TrStnPrt 3-03-024-08 NF 1,771 tons 0.0002 0.00007 0.00001 lb/ton PCAS 100% 0.28 0 0.13 0 0.02 0
M10 Pebble Crusher Feeder (F-PbC) to Pebble Crusher (PbC) TrStnPrt 3-03-024-08 NF 1,771 tons 0.0002 0.00007 0.00001 lb/ton Enclosed a 100% 0 0 0 0 0 0
M11 Pebble Crusher (PbC) CrushT 3-03-024-07 NF 1,771 tons 0.06 0.02 0.00 lb/ton PCAS 100% 106.27 0 35.42 0 6.56 0
M12 Pebble Crusher (PbC) to Pebble Conveyor No. 3 (CV-Pb3) TrStnPrt 3-03-024-08 NF 1,771 tons 0.0002 0.00007 0.00001 lb/ton PCAS 100% 0.28 0 0.13 0 0.02 0
Copper Concentrate Dewatering and Stacking
CCD01 Copper Concentrate Filters (Ft-CC1/CC4) to Copper Concentrate Conveyor (CV-CC) TrCuCncPrt 3-03-024-08 NF 138 tons 0.00004 0.00002 0.000003 lb/ton Enclosed a 100% 0 0 0 0 0 0
CCD02 Copper Concentrate Conveyor (CV-CC) to Copper Concentrate Loadout Stockpile
TrCuCncPrt 3-03-024-08 F 138 tons 0.00004 0.00002 0.000003 lb/ton CCS 100% 0.006 0 0.003 0 0.0004 0
CCD03 Wind Erosion of Copper Concentrate Loadout Stockpile WindCvd 3-03-888-01 F 1.17 acres 0 0 0 ton/acre-yr Enclosed a 100% 0 0 0 0 0 0
CCD04 Copper Concentrate Loadout Stockpile to Shipment Truck via Front End Loaders
TrCuCncPrt 3-03-024-08 F 138 tons 0.00004 0.00002 0.000003 lb/ton CCS 100% 0.006 0 0.003 0 0.0004 0
Molybdenum Dewatering and Packaging
MD01 Molybdenum Concentrate Filter (Ft-MC) to Molybdenum Concentrate Dryer (D-MC)
TrMlyCncPrt 3-03-024-08 NF 1.9 tons 0.00002 0.00001 0.000002 lb/ton Enclosed a 100% 0 0 0 0 0 0
MD02 Molybdenum Concentrate Dryer MolyDry 3-03-024-11 NF 1.9 tons 19.70 12.00 5.91 lb/ton MS/EP 100% 37.43 0 22.80 0 11.23 0
MD03 Molybdenum Concentrate Dryer (D-MC) to MolybdenumConcentrate Bin (B-MC)
DTrMlyCncPrt 3-03-024-08 NF 1.9 tons 0.00004 0.00002 0.000003 lb/ton MDC 100% 0.00008 0 0.00004 0 0.000006 0
Rosemont Copper ProjectEmission Inventory Information JBR ENVIRONMENTAL CONSULTANTS, INC.
November 2011Page H15
AZRP00197

PM/TSP PM10 PM2.5 Uncontrolled Controlled Uncontrolled Controlled Uncontrolled Controlled
Table H.6 Maximum Hourly Particulate Emissions - Year 1
Emission Factors PM/TSP Emissions (lb/hr) - Year 1 PM10 Emissions (lb/hr) - Year 1 PM2.5 Emissions (lb/hr) - Year 1Unit Description Control
CodeProcess Code SCC EF UnitsUnit ID
Pick-up or Control Eff. (%)
Non-Fug. (NF) /
Fug. (F)Rate Units
Hourly Production Rate
- Year 1
MD04 Molybdenum Concentrate Bin (B-MC) to MolybdenumConcentrate Hopper (H-MC)
DTrMlyCnc 3-03-024-08 NF 1.9 tons 0.0003 0.0002 0.00002 lb/ton None 0% 0.0006 0.0006 0.0003 0.0003 0.00004 0.00004
MD05 Molybdenum Concentrate Hopper (H-MC) to MolybdenumConcentrate Conveyor (CV-MC)
DTrMlyCncPrt 3-03-024-08 NF 1.9 tons 0.00004 0.00002 0.000003 lb/ton Enclosed a 100% 0 0 0 0 0 0
MD06 Molybdenum Concentrate Conveyor (CV-MC) to Molybdenum Packaging and Weigh System (MPS)
DTrMlyCnc 3-03-024-08 NF 1.9 tons 0.0003 0.0002 0.00002 lb/ton MDC 100% 0.0006 0 0.0003 0 0.00004 0
Tailings Dewatering and Placement
TDS01 Tailings Filters (Ft-T1/T14) to Tailings Belt Feeders (F-T1/T14) FiltTailPrt 3-03-024-08 NF 10,722 tons 0.00002 0.00001 0.000002 lb/ton Enclosed a 100% 0 0 0 0 0 0
TDS02 Tailings Belt Feeders (F-T1/T14) to Fixed Tailings ConveyorNo. 1 (CV-F1)
FiltTailPrt 3-03-024-08 NF 10,722 tons 0.00002 0.00001 0.000002 lb/ton Enclosed a 100% 0 0 0 0 0 0
TDS03 Fixed Tailings Conveyor No. 1 (CV-F1) to Fixed TailingsConveyor No. 2 (CV-F2)
FiltTailPrt 3-03-024-08 NF 10,722 tons 0.00002 0.00001 0.000002 lb/ton Enclosed a 100% 0 0 0 0 0 0
TDS04 Fixed Tailings Conveyor No. 2 (CV-F2) to Fixed Tailings Conveyor No. 3 (CV-F3)
FiltTailPrt 3-03-024-08 NF 10,722 tons 0.00002 0.00001 0.000002 lb/ton None 0% 0.26 0.26 0.12 0.12 0.02 0.02
TDS05 Fixed Tailings Conveyor No. 3 (CV-F3) to RelocatableConveyor (CV-R1)
FiltTailPrt 3-03-024-08 F 10,722 tons 0.00002 0.00001 0.000002 lb/ton None 0% 0.26 0.26 0.12 0.12 0.02 0.02
TDS06 Relocatable Conveyor (CV-R1) to Shiftable Conveyor (CV-S1) FiltTailPrt 3-03-024-08 F 10,722 tons 0.00002 0.00001 0.000002 lb/ton None 0% 0.26 0.26 0.12 0.12 0.02 0.02
TDS07 Shiftable Conveyor (CV-S1) to Belt Wagon Conveyor(CV-BW1)
FiltTail 3-03-024-08 F 10,722 tons 0.0002 0.00009 0.00001 lb/ton None 0% 2.00 2.00 0.95 0.95 0.14 0.14
TDS08 Belt Wagon Conveyor (CV-BW1) to Spreader Crawler Mounted Conveyor (CV-SP1)
FiltTail 3-03-024-08 F 10,722 tons 0.0002 0.00009 0.00001 lb/ton None 0% 2.00 2.00 0.95 0.95 0.14 0.14
TDS09 Spreader Crawler Mounted Conveyor (CV-SP1) to Tailings Storage
FiltTail 3-03-024-08 F 10,722 tons 0.0002 0.00009 0.00001 lb/ton None 0% 2.00 2.00 0.95 0.95 0.14 0.14
TDS10 Wind Erosion of Tailings Storage TailStrg 3-03-888-01 F 1,500 acres 0.02 0.01 0.002 ton/acre-yr None 0% 6.90 6.90 3.45 3.45 0.52 0.52
Fuel Burning Equipment
FB01 Diesel Electrowinning Hot Water Generator (HWG) DFB 1-02-005-03 NF 1 hours 3.30 2.30 1.54 lb/1000 gal None 0% 0.14 0.14 0.10 0.10 0.07 0.07
6.0 MMBtu/hr
FB02 Thickener Area Emergency Generator (TEG) ICDE3 2-02-001-02 NF 1 hours 0.20 0.20 0.20 g/kW-hr None 0% 0.44 0.44 0.44 0.44 0.44 0.44
1,000 kW
FB03 PLS Pond Area Emergency Generator (PEG) ICDE3 2-02-001-02 NF 1 hours 0.20 0.20 0.20 g/kW-hr None 0% 0.44 0.44 0.44 0.44 0.44 0.44
1,000 kW
FB04 Main Substation Emergency Generator (MEG) ICDE3 2-02-001-02 NF 1 hours 0.20 0.20 0.20 g/kW-hr None 0% 0.33 0.33 0.33 0.33 0.33 0.33
750 kW
FB05 Administration Building Emergency Generator (AEG) ICDE3 2-02-001-02 NF 1 hours 0.20 0.20 0.20 g/kW-hr None 0% 0.33 0.33 0.33 0.33 0.33 0.33
750 kW
FB06 Electrowinning Building Emergency Generator (EWEG) ICDE1 2-02-001-02 NF 1 hours 0.40 0.40 0.40 g/kW-hr None 0% 0.04 0.04 0.04 0.04 0.04 0.04
50 kW
FB07 Primary Crusher Fire Water Pump (PCFWP) ICDE2 2-02-001-02 NF 1 hours 0.20 0.20 0.20 g/kW-hr None 0% 0.13 0.13 0.13 0.13 0.13 0.13
400 hp
Rosemont Copper ProjectEmission Inventory Information JBR ENVIRONMENTAL CONSULTANTS, INC.
November 2011Page H16
AZRP00198

PM/TSP PM10 PM2.5 Uncontrolled Controlled Uncontrolled Controlled Uncontrolled Controlled
Table H.6 Maximum Hourly Particulate Emissions - Year 1
Emission Factors PM/TSP Emissions (lb/hr) - Year 1 PM10 Emissions (lb/hr) - Year 1 PM2.5 Emissions (lb/hr) - Year 1Unit Description Control
CodeProcess Code SCC EF UnitsUnit ID
Pick-up or Control Eff. (%)
Non-Fug. (NF) /
Fug. (F)Rate Units
Hourly Production Rate
- Year 1
FB08 SX/EW Fire Water Pump (SXFWP) ICDE2 2-02-001-02 NF 1 hours 0.20 0.20 0.20 g/kW-hr None 0% 0.13 0.13 0.13 0.13 0.13 0.13
400 hp
Miscellaneous Sources
MS01 Transfer of Bulk Pebble Lime to the Bulk Pebble Lime Silo(S-BPL) LimeLd 3-05-016-26 NF 5.18 tons 0.61 0.29 0.04 lb/ton BPLSV a 90% 0.32 0.32 0.15 0.15 0.02 0.02
MS02 Bulk Pebble Lime Silo (S-BPL) to Bulk Pebble Lime Silo Screw Conveyor (CV-BPLS) ReagTr 3-03-024-04 NF 5.18 tons 0.008 0.004 0.0006 lb/ton Enclosed a 100% 0 0 0 0 0 0
MS03 Bulk Pebble Lime Silo Screw Conveyor (CV-BPLS) to SAGMill Feed Conveyor (CV-SMF)
ReagTr 3-03-024-04 NF 5.18 tons 0.008 0.004 0.0006 lb/ton None 0% 0.04 0.04 0.02 0.02 0.003 0.003
MS04 Transfer of Lime to the Lime Storage Bin (B-L) LimeLd 3-05-016-26 NF 2.59 tons 0.61 0.29 0.04 lb/ton LSV a 90% 0.16 0.16 0.07 0.07 0.01 0.01
MS05 Transfer of Sodium Metasilicate to the Sodium MetasilicateStorage Bin (B-SM)
ReagTr 3-03-024-04 NF 0.41 tons 0.008 0.004 0.0006 lb/ton SMSV a 90% 0.0003 0.0003 0.0002 0.0002 0.00002 0.00002
MS06 Transfer of Flocculant from Supersacks to Flocculant Storage Bins (B-F1/F2)
ReagTr 3-03-024-04 NF 0.15 tons 0.008 0.004 0.0006 lb/ton None 0% 0.001 0.001 0.0006 0.0006 0.00009 0.00009
MS07 Transfer of Guar from Bags to Guar Feeder (F-Gu) ReagTr 3-03-024-04 NF 0.02 tons 0.008 0.004 0.0006 lb/ton None 0% 0.0002 0.0002 0.00008 0.00008 0.00001 0.00001
MS08 Transfer of Granular Cobalt Sulfate from Bags to CobaltSulfate Feeder (F-CoS)
ReagTr 3-03-024-04 NF 0.0008 tons 0.008 0.004 0.0006 lb/ton None 0% 0.000007 0.000007 0.000003 0.000003 0.0000005 0.0000005
Particulate Matter Pollution Control Equipment with Emission Limits
PCL01 Crushing Area Scrubber (PC-CAS) CAS none NF 1 hours 1.29 1.28 1.13 lb/hr -- -- -- 1.29 -- 1.28 -- 1.13
PCL02 Stockpile Area Scrubber (PC-SAS) SAS none NF 1 hours 2.61 2.59 2.10 lb/hr -- -- -- 2.61 -- 2.59 -- 2.10
PCL03 Reclaim Tunnel Scrubber (PC-RTS) RTS none NF 1 hours 1.08 1.07 0.87 lb/hr -- -- -- 1.08 -- 1.07 -- 0.87
PCL04 Pebble Crusher Area Scrubber (PC-PCAS) PCAS none NF 1 hours 1.58 1.56 1.31 lb/hr -- -- -- 1.58 -- 1.56 -- 1.31
PCL05 Copper Concentrate Scrubber 1 (PC-CCS1) CCS none NF 1 hours 3.59 3.55 3.04 lb/hr -- -- -- 3.59 -- 3.55 -- 3.04
PCL06 Copper Concentrate Scrubber 2 (PC-CCS2) CCS none NF 1 hours 3.59 3.55 3.04 lb/hr -- -- -- 3.59 -- 3.55 -- 3.04
PCL07 Molybdenum Scrubber (PC-MS) / Electrostatic Precipitator (PC-EP) MS/EP none NF 1 hours 0.015 0.014 0.013 lb/hr -- -- -- 0.02 -- 0.01 -- 0.01
PCL08 Molybdenum Dust Collector (PC-MDC) MDC none NF 74,612 dscf 0.02 0.010 0.002 gr/dscf -- -- -- 0.23 -- 0.11 -- 0.02
PCL09 Laboratory Dust Collector 1 (PC-L1) LDC none NF 497,410 dscf 0.008 0.005 0.002 gr/dscf -- -- -- 0.58 -- 0.36 -- 0.17
PCL10 Laboratory Dust Collector 2 (PC-L2) LDC none NF 497,410 dscf 0.008 0.005 0.002 gr/dscf -- -- -- 0.58 -- 0.36 -- 0.17
PCL11 Laboratory Dust Collector 3 (PC-L3) LDC none NF 497,410 dscf 0.008 0.005 0.002 gr/dscf -- -- -- 0.58 -- 0.36 -- 0.17
291.99 18.51 126.18 17.11 31.81 14.02
7,893.68 1,254.66 2,133.94 426.32 211.81 40.86
8,185.67 1,273.17 2,260.12 443.43 243.63 54.88
9.93 9.93 9.93 9.93 9.93 9.93
a The control efficiency for this emission unit is inherent to the process. Therefore, the control efficiency is applied to both uncontrolled and controlled emissions.
Tailpipe Emissions (see Tables H.10-H.12):
Total Emissions (excluding tailpipe emissions):
Total Fugitive Emissions (excluding tailpipe emissions):
Total Non-Fugitive Emissions (excluding tailpipe emissions):
Rosemont Copper ProjectEmission Inventory Information JBR ENVIRONMENTAL CONSULTANTS, INC.
November 2011Page H17
AZRP00199

CO NOX SO2 VOC H2SO4 CO2 CH4 N2O HAP Name HAP EF CO NOX SO2 VOC H2SO4 CO2a CH4
a N2O a HAP b
Mining
MN02 Blasting Blast 3-05-020-09 F 18,980 tons ANFO 67.00 17.00 2.00 0 0 566 0.02 0.005 -- -- lb/tons ANFO 635.83 161.33 18.98 0 0 5,375.60 0.22 0.04 --
Solvent Extraction and Electrowinning
SXE01 Solvent Extraction SX 4-90-001-99 F 8,760 hours 0 0 0 9.43E-05 0 0 0 0 Benzene 3.37E-07 lb/hr-ft2 0 0 0 3.77 0 0 0 0 1.35E-02
4 Primary Mix Tanks (7.75' D x 9.75' H each) 4 @ 47.2 = 188.7 ft2 9,132.9 ft2 Total Surface Area of Solvent Extraction Toluene 4.82E-06 lb/hr-ft2 1.93E-01
4 Secondary Mix Tanks (9.5' D x 9.75' H each) 4 @ 70.9 = 283.5 ft2 Ethylbenzene 2.05E-05 lb/hr-ft2 8.21E-01
3 Tertiary Mix Tanks (9.5' D x 9.75' H each) 3 @ 70.9 = 212.6 ft2 Xylenes 2.80E-05 lb/hr-ft2 1.12E+00
4 Extraction Settlers (64' L x 33' W x 3.33' H each) 4 @ 2,112 = 8,448 ft2 Others (including Hexane) 2.94E-05 lb/hr-ft2 1.18E+00
SXE02 Electrowinning Commercial Cells (EWCC) EW none NF 8,760 hours 0 0 0 0 1.57E-04 0 0 0 Cobalt Compounds 2.36E-08 lb/hr-ft2 0 0 0 0 0.02 0 0 0 2.72E-06
Controlled by Cell Ventilation Scrubbers(PC-EWCVS1/EWCVS6)
2,640 ft2
99 Control Efficiency (%)
Fuel Burning Equipment
FB01 Diesel Electrowinning Hot Water Generator (HWG) DFB 1-02-005-03 NF 8,760 hours 5.00 20.00 0.21 0.20 0 23,217 0.94 0.19 POM 3.30E-03 lb/1000 gal 0.96 3.84 0.04 0.04 0 4,453.51 0.18 0.04 6.33E-04
6.0 MMBtu/hr Formaldehyde 6.10E-02 lb/1000 gal 1.17E-02
Arsenic 4.00 lb/1012 Btu 1.05E-04
Beryllium 3.00 lb/1012 Btu 7.88E-05
Cadmium 3.00 lb/1012 Btu 7.88E-05
Chromium 3.00 lb/1012 Btu 7.88E-05
Lead 9.00 lb/1012 Btu 2.37E-04
Mercury 3.00 lb/1012 Btu 7.88E-05
Manganese 6.00 lb/1012 Btu 1.58E-04
Nickel 3.00 lb/1012 Btu 7.88E-05
Selenium 15.00 lb/1012 Btu 3.94E-04
FB02 Thickener Area Emergency Generator (TEG) ICDE3 2-02-001-02 NF 500 hours 3.50 6.00 0.0066 0.40 0 694 0.03 0.006 -- -- g/kW-hr 1.93 3.31 0.004 0.22 0 382.65 0.02 0.003 --
1,000 kW Benzene 7.76E-04 lb/MMBtu 1.82E-03
Toluene 2.81E-04 lb/MMBtu 6.59E-04
Xylenes 1.93E-04 lb/MMBtu 4.53E-04
Formaldehyde 7.89E-05 lb/MMBtu 1.85E-04
Acetaldehyde 2.52E-05 lb/MMBtu 5.91E-05
Acrolein 7.88E-06 lb/MMBtu 1.85E-05
Naphthalene 1.30E-04 lb/MMBtu 3.05E-04
Acenaphthylene 9.23E-06 lb/MMBtu 2.17E-05
Acenaphthene 4.68E-06 lb/MMBtu 1.10E-05
Fluorene 1.28E-05 lb/MMBtu 3.00E-05
Phenanthrene 4.08E-05 lb/MMBtu 9.57E-05
Anthracene 1.23E-06 lb/MMBtu 2.89E-06
Fluoranthene 4.03E-06 lb/MMBtu 9.46E-06
Pyrene 3.71E-06 lb/MMBtu 8.71E-06
Benz(a)anthracene 6.22E-07 lb/MMBtu 1.46E-06
Chrysene 1.53E-06 lb/MMBtu 3.59E-06
Emissions (tpy) - Year 1
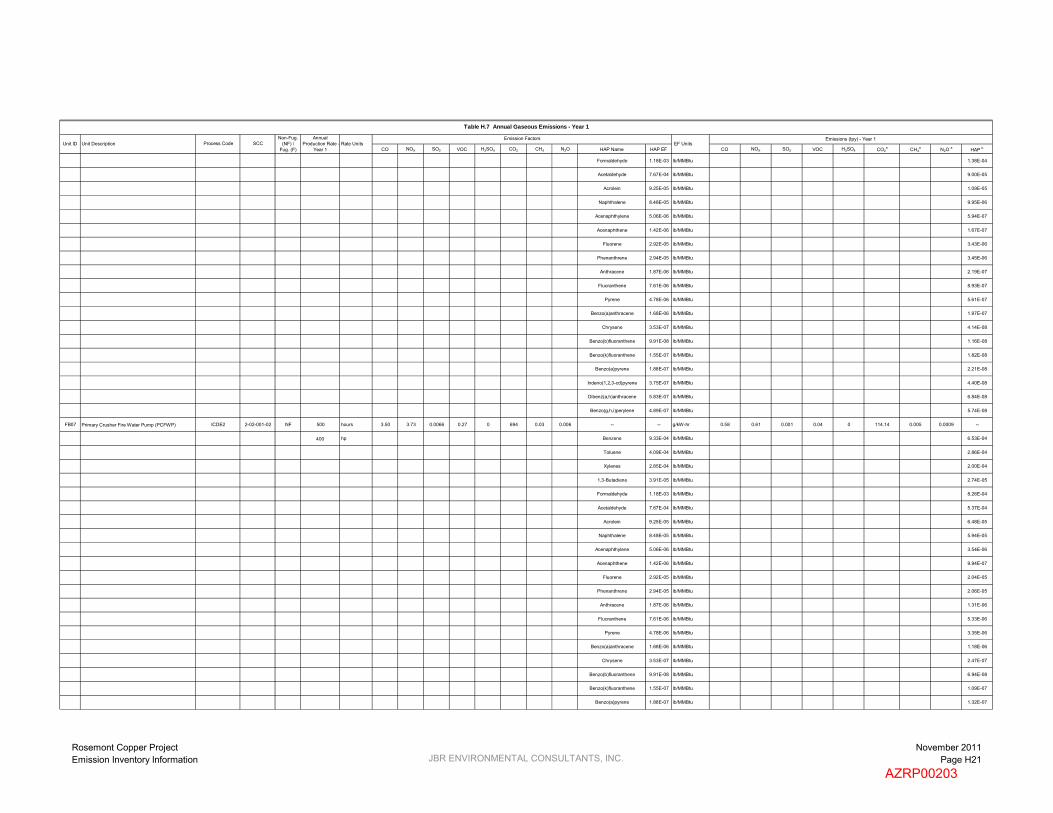
Table H.7 Annual Gaseous Emissions - Year 1
Emission FactorsSCCUnit ID EF UnitsUnit Description Process Code
Non-Fug. (NF) /
Fug. (F)Rate Units
Annual Production Rate -
Year 1
Rosemont Copper ProjectEmission Inventory Information JBR ENVIRONMENTAL CONSULTANTS, INC.
November 2011Page H18
AZRP00200

CO NOX SO2 VOC H2SO4 CO2 CH4 N2O HAP Name HAP EF CO NOX SO2 VOC H2SO4 CO2a CH4
a N2O a HAP b
Emissions (tpy) - Year 1
Table H.7 Annual Gaseous Emissions - Year 1
Emission FactorsSCCUnit ID EF UnitsUnit Description Process Code
Non-Fug. (NF) /
Fug. (F)Rate Units
Annual Production Rate -
Year 1
Benzo(b)fluoranthene 1.11E-06 lb/MMBtu 2.60E-06
Benzo(k)fluoranthene 2.18E-07 lb/MMBtu 5.12E-07
Benzo(a)pyrene 2.57E-07 lb/MMBtu 6.03E-07
Indeno(1,2,3-cd)pyrene 4.14E-07 lb/MMBtu 9.72E-07
Dibenz(a,h)anthracene 3.46E-07 lb/MMBtu 8.12E-07
Benzo(g,h,i)perylene 5.56E-07 lb/MMBtu 1.30E-06
FB03 PLS Pond Area Emergency Generator (PEG) ICDE3 2-02-001-02 NF 500 hours 3.50 6.00 0.0066 0.40 0 694 0.03 0.006 -- -- g/kW-hr 1.93 3.31 0.004 0.22 0 382.65 0.02 0.003 --
1,000 kW Benzene 7.76E-04 lb/MMBtu 1.82E-03
Toluene 2.81E-04 lb/MMBtu 6.59E-04
Xylenes 1.93E-04 lb/MMBtu 4.53E-04
Formaldehyde 7.89E-05 lb/MMBtu 1.85E-04
Acetaldehyde 2.52E-05 lb/MMBtu 5.91E-05
Acrolein 7.88E-06 lb/MMBtu 1.85E-05
Naphthalene 1.30E-04 lb/MMBtu 3.05E-04
Acenaphthylene 9.23E-06 lb/MMBtu 2.17E-05
Acenaphthene 4.68E-06 lb/MMBtu 1.10E-05
Fluorene 1.28E-05 lb/MMBtu 3.00E-05
Phenanthrene 4.08E-05 lb/MMBtu 9.57E-05
Anthracene 1.23E-06 lb/MMBtu 2.89E-06
Fluoranthene 4.03E-06 lb/MMBtu 9.46E-06
Pyrene 3.71E-06 lb/MMBtu 8.71E-06
Benz(a)anthracene 6.22E-07 lb/MMBtu 1.46E-06
Chrysene 1.53E-06 lb/MMBtu 3.59E-06
Benzo(b)fluoranthene 1.11E-06 lb/MMBtu 2.60E-06
Benzo(k)fluoranthene 2.18E-07 lb/MMBtu 5.12E-07
Benzo(a)pyrene 2.57E-07 lb/MMBtu 6.03E-07
Indeno(1,2,3-cd)pyrene 4.14E-07 lb/MMBtu 9.72E-07
Dibenz(a,h)anthracene 3.46E-07 lb/MMBtu 8.12E-07
Benzo(g,h,i)perylene 5.56E-07 lb/MMBtu 1.30E-06
FB04 Main Substation Emergency Generator (MEG) ICDE3 2-02-001-02 NF 500 hours 3.50 6.00 0.0066 0.40 0 694 0.03 0.006 -- -- g/kW-hr 1.45 2.48 0.003 0.17 0 286.99 0.01 0.002 --
750 kW Benzene 7.76E-04 lb/MMBtu 1.37E-03
Toluene 2.81E-04 lb/MMBtu 4.95E-04
Xylenes 1.93E-04 lb/MMBtu 3.40E-04
Formaldehyde 7.89E-05 lb/MMBtu 1.39E-04
Acetaldehyde 2.52E-05 lb/MMBtu 4.44E-05
Acrolein 7.88E-06 lb/MMBtu 1.39E-05
Naphthalene 1.30E-04 lb/MMBtu 2.29E-04
Acenaphthylene 9.23E-06 lb/MMBtu 1.62E-05
Acenaphthene 4.68E-06 lb/MMBtu 8.24E-06
Fluorene 1.28E-05 lb/MMBtu 2.25E-05
Rosemont Copper ProjectEmission Inventory Information JBR ENVIRONMENTAL CONSULTANTS, INC.
November 2011Page H19
AZRP00201

CO NOX SO2 VOC H2SO4 CO2 CH4 N2O HAP Name HAP EF CO NOX SO2 VOC H2SO4 CO2a CH4
a N2O a HAP b
Emissions (tpy) - Year 1
Table H.7 Annual Gaseous Emissions - Year 1
Emission FactorsSCCUnit ID EF UnitsUnit Description Process Code
Non-Fug. (NF) /
Fug. (F)Rate Units
Annual Production Rate -
Year 1
Phenanthrene 4.08E-05 lb/MMBtu 7.18E-05
Anthracene 1.23E-06 lb/MMBtu 2.16E-06
Fluoranthene 4.03E-06 lb/MMBtu 7.09E-06
Pyrene 3.71E-06 lb/MMBtu 6.53E-06
Benz(a)anthracene 6.22E-07 lb/MMBtu 1.09E-06
Chrysene 1.53E-06 lb/MMBtu 2.69E-06
Benzo(b)fluoranthene 1.11E-06 lb/MMBtu 1.95E-06
Benzo(k)fluoranthene 2.18E-07 lb/MMBtu 3.84E-07
Benzo(a)pyrene 2.57E-07 lb/MMBtu 4.52E-07
Indeno(1,2,3-cd)pyrene 4.14E-07 lb/MMBtu 7.29E-07
Dibenz(a,h)anthracene 3.46E-07 lb/MMBtu 6.09E-07
Benzo(g,h,i)perylene 5.56E-07 lb/MMBtu 9.79E-07
FB05 Administration Building Emergency Generator (AEG) ICDE3 2-02-001-02 NF 500 hours 3.50 6.00 0.0066 0.40 0 694 0.03 0.006 -- -- g/kW-hr 1.45 2.48 0.003 0.17 0 286.99 0.01 0.002 --
750 kW Benzene 7.76E-04 lb/MMBtu 1.37E-03
Toluene 2.81E-04 lb/MMBtu 4.95E-04
Xylenes 1.93E-04 lb/MMBtu 3.40E-04
Formaldehyde 7.89E-05 lb/MMBtu 1.39E-04
Acetaldehyde 2.52E-05 lb/MMBtu 4.44E-05
Acrolein 7.88E-06 lb/MMBtu 1.39E-05
Naphthalene 1.30E-04 lb/MMBtu 2.29E-04
Acenaphthylene 9.23E-06 lb/MMBtu 1.62E-05
Acenaphthene 4.68E-06 lb/MMBtu 8.24E-06
Fluorene 1.28E-05 lb/MMBtu 2.25E-05
Phenanthrene 4.08E-05 lb/MMBtu 7.18E-05
Anthracene 1.23E-06 lb/MMBtu 2.16E-06
Fluoranthene 4.03E-06 lb/MMBtu 7.09E-06
Pyrene 3.71E-06 lb/MMBtu 6.53E-06
Benz(a)anthracene 6.22E-07 lb/MMBtu 1.09E-06
Chrysene 1.53E-06 lb/MMBtu 2.69E-06
Benzo(b)fluoranthene 1.11E-06 lb/MMBtu 1.95E-06
Benzo(k)fluoranthene 2.18E-07 lb/MMBtu 3.84E-07
Benzo(a)pyrene 2.57E-07 lb/MMBtu 4.52E-07
Indeno(1,2,3-cd)pyrene 4.14E-07 lb/MMBtu 7.29E-07
Dibenz(a,h)anthracene 3.46E-07 lb/MMBtu 6.09E-07
Benzo(g,h,i)perylene 5.56E-07 lb/MMBtu 9.79E-07
FB06 Electrowinning Building Emergency Generator (EWEG)
ICDE1 2-02-001-02 NF 500 hours 5.00 4.43 0.0066 0.27 0 694 0.03 0.006 -- -- g/kW-hr 0.14 0.12 0.0002 0.007 0 19.13 0.0008 0.0002 --
50 kW Benzene 9.33E-04 lb/MMBtu 1.09E-04
Toluene 4.09E-04 lb/MMBtu 4.80E-05
Xylenes 2.85E-04 lb/MMBtu 3.34E-05
1,3-Butadiene 3.91E-05 lb/MMBtu 4.59E-06
Rosemont Copper ProjectEmission Inventory Information JBR ENVIRONMENTAL CONSULTANTS, INC.
November 2011Page H20
AZRP00202
CO NOX SO2 VOC H2SO4 CO2 CH4 N2O HAP Name HAP EF CO NOX SO2 VOC H2SO4 CO2a CH4
a N2O a HAP b
Emissions (tpy) - Year 1
Table H.7 Annual Gaseous Emissions - Year 1
Emission FactorsSCCUnit ID EF UnitsUnit Description Process Code
Non-Fug. (NF) /
Fug. (F)Rate Units
Annual Production Rate -
Year 1
Formaldehyde 1.18E-03 lb/MMBtu 1.38E-04
Acetaldehyde 7.67E-04 lb/MMBtu 9.00E-05
Acrolein 9.25E-05 lb/MMBtu 1.09E-05
Naphthalene 8.48E-05 lb/MMBtu 9.95E-06
Acenaphthylene 5.06E-06 lb/MMBtu 5.94E-07
Acenaphthene 1.42E-06 lb/MMBtu 1.67E-07
Fluorene 2.92E-05 lb/MMBtu 3.43E-06
Phenanthrene 2.94E-05 lb/MMBtu 3.45E-06
Anthracene 1.87E-06 lb/MMBtu 2.19E-07
Fluoranthene 7.61E-06 lb/MMBtu 8.93E-07
Pyrene 4.78E-06 lb/MMBtu 5.61E-07
Benzo(a)anthracene 1.68E-06 lb/MMBtu 1.97E-07
Chrysene 3.53E-07 lb/MMBtu 4.14E-08
Benzo(b)fluoranthene 9.91E-08 lb/MMBtu 1.16E-08
Benzo(k)fluoranthene 1.55E-07 lb/MMBtu 1.82E-08
Benzo(a)pyrene 1.88E-07 lb/MMBtu 2.21E-08
Indeno(1,2,3-cd)pyrene 3.75E-07 lb/MMBtu 4.40E-08
Dibenz(a,h)anthracene 5.83E-07 lb/MMBtu 6.84E-08
Benzo(g,h,i)perylene 4.89E-07 lb/MMBtu 5.74E-08
FB07 Primary Crusher Fire Water Pump (PCFWP) ICDE2 2-02-001-02 NF 500 hours 3.50 3.73 0.0066 0.27 0 694 0.03 0.006 -- -- g/kW-hr 0.58 0.61 0.001 0.04 0 114.14 0.005 0.0009 --
400 hp Benzene 9.33E-04 lb/MMBtu 6.53E-04
Toluene 4.09E-04 lb/MMBtu 2.86E-04
Xylenes 2.85E-04 lb/MMBtu 2.00E-04
1,3-Butadiene 3.91E-05 lb/MMBtu 2.74E-05
Formaldehyde 1.18E-03 lb/MMBtu 8.26E-04
Acetaldehyde 7.67E-04 lb/MMBtu 5.37E-04
Acrolein 9.25E-05 lb/MMBtu 6.48E-05
Naphthalene 8.48E-05 lb/MMBtu 5.94E-05
Acenaphthylene 5.06E-06 lb/MMBtu 3.54E-06
Acenaphthene 1.42E-06 lb/MMBtu 9.94E-07
Fluorene 2.92E-05 lb/MMBtu 2.04E-05
Phenanthrene 2.94E-05 lb/MMBtu 2.06E-05
Anthracene 1.87E-06 lb/MMBtu 1.31E-06
Fluoranthene 7.61E-06 lb/MMBtu 5.33E-06
Pyrene 4.78E-06 lb/MMBtu 3.35E-06
Benzo(a)anthracene 1.68E-06 lb/MMBtu 1.18E-06
Chrysene 3.53E-07 lb/MMBtu 2.47E-07
Benzo(b)fluoranthene 9.91E-08 lb/MMBtu 6.94E-08
Benzo(k)fluoranthene 1.55E-07 lb/MMBtu 1.09E-07
Benzo(a)pyrene 1.88E-07 lb/MMBtu 1.32E-07
Rosemont Copper ProjectEmission Inventory Information JBR ENVIRONMENTAL CONSULTANTS, INC.
November 2011Page H21
AZRP00203

CO NOX SO2 VOC H2SO4 CO2 CH4 N2O HAP Name HAP EF CO NOX SO2 VOC H2SO4 CO2a CH4
a N2O a HAP b
Emissions (tpy) - Year 1
Table H.7 Annual Gaseous Emissions - Year 1
Emission FactorsSCCUnit ID EF UnitsUnit Description Process Code
Non-Fug. (NF) /
Fug. (F)Rate Units
Annual Production Rate -
Year 1
Indeno(1,2,3-cd)pyrene 3.75E-07 lb/MMBtu 2.63E-07
Dibenz(a,h)anthracene 5.83E-07 lb/MMBtu 4.08E-07
Benzo(g,h,i)perylene 4.89E-07 lb/MMBtu 3.42E-07
FB08 SX/EW Fire Water Pump (SXFWP) ICDE2 2-02-001-02 NF 500 hours 3.50 3.73 0.0066 0.27 0 694 0.03 0.006 -- -- g/kW-hr 0.58 0.61 0.001 0.04 0 114.14 0.005 0.0009 --
400 hp Benzene 9.33E-04 lb/MMBtu 6.53E-04
Toluene 4.09E-04 lb/MMBtu 2.86E-04
Xylenes 2.85E-04 lb/MMBtu 2.00E-04
1,3-Butadiene 3.91E-05 lb/MMBtu 2.74E-05
Formaldehyde 1.18E-03 lb/MMBtu 8.26E-04
Acetaldehyde 7.67E-04 lb/MMBtu 5.37E-04
Acrolein 9.25E-05 lb/MMBtu 6.48E-05
Naphthalene 8.48E-05 lb/MMBtu 5.94E-05
Acenaphthylene 5.06E-06 lb/MMBtu 3.54E-06
Acenaphthene 1.42E-06 lb/MMBtu 9.94E-07
Fluorene 2.92E-05 lb/MMBtu 2.04E-05
Phenanthrene 2.94E-05 lb/MMBtu 2.06E-05
Anthracene 1.87E-06 lb/MMBtu 1.31E-06
Fluoranthene 7.61E-06 lb/MMBtu 5.33E-06
Pyrene 4.78E-06 lb/MMBtu 3.35E-06
Benzo(a)anthracene 1.68E-06 lb/MMBtu 1.18E-06
Chrysene 3.53E-07 lb/MMBtu 2.47E-07
Benzo(b)fluoranthene 9.91E-08 lb/MMBtu 6.94E-08
Benzo(k)fluoranthene 1.55E-07 lb/MMBtu 1.09E-07
Benzo(a)pyrene 1.88E-07 lb/MMBtu 1.32E-07
Indeno(1,2,3-cd)pyrene 3.75E-07 lb/MMBtu 2.63E-07
Dibenz(a,h)anthracene 5.83E-07 lb/MMBtu 4.08E-07
Benzo(g,h,i)perylene 4.89E-07 lb/MMBtu 3.42E-07
Tanks
T01 C7 Distribution Tank (T-C7D) C7DT 4-03-010-19 NF 8,760 hours 0 0 0 1.08E-01 0 0 0 0 -- -- lb/hr 0 0 0 0.47 0 0 0 0 --
T02 MIBC Storage Tank (T-MIBCS) MST 4-90-999-98 NF 8,760 hours 0 0 0 3.53E-03 0 0 0 0 -- -- lb/hr 0 0 0 0.02 0 0 0 0 --
T03 Diesel Fuel Storage Tank - Heavy Vehicles 1(T-DFS-HV1)
DFSTHV 4-03-010-19 NF 8,760 hours 0 0 0 1.39E-02 0 0 0 0 n-Hexane 5.71E-06 lb/hr 0 0 0 0.06 0 0 0 0 2.50E-05
Benzene 2.74E-05 lb/hr 1.20E-04
Toluene 3.18E-04 lb/hr 1.40E-03
Ethylbenzene 4.45E-05 lb/hr 1.95E-04
m-Xylene 8.23E-04 lb/hr 3.61E-03
1,2,4-Trimethylbenzene 6.76E-04 lb/hr 2.96E-03
T04 Diesel Fuel Storage Tank - Heavy Vehicles 2(T-DFS-HV2)
DFSTHV 4-03-010-19 NF 8,760 hours 0 0 0 1.39E-02 0 0 0 0 n-Hexane 5.71E-06 lb/hr 0 0 0 0.06 0 0 0 0 2.50E-05
Benzene 2.74E-05 lb/hr 1.20E-04
Toluene 3.18E-04 lb/hr 1.40E-03
Ethylbenzene 4.45E-05 lb/hr 1.95E-04
Rosemont Copper ProjectEmission Inventory Information JBR ENVIRONMENTAL CONSULTANTS, INC.
November 2011Page H22
AZRP00204

CO NOX SO2 VOC H2SO4 CO2 CH4 N2O HAP Name HAP EF CO NOX SO2 VOC H2SO4 CO2a CH4
a N2O a HAP b
Emissions (tpy) - Year 1
Table H.7 Annual Gaseous Emissions - Year 1
Emission FactorsSCCUnit ID EF UnitsUnit Description Process Code
Non-Fug. (NF) /
Fug. (F)Rate Units
Annual Production Rate -
Year 1
m-Xylene 8.23E-04 lb/hr 3.61E-03
1,2,4-Trimethylbenzene 6.76E-04 lb/hr 2.96E-03
9.00 16.76 0.06 1.51 0.02 6,040.20 0.25 0.05 0.05
635.83 161.33 18.98 3.77 0 5,375.60 0.22 0.04 3.32
644.83 178.09 19.04 5.28 0.02 11,415.81 0.46 0.09 3.37
831.98 1,086.65 1.54 78.70 -- 163,786.04 -- -- --
a CO2e emissions are calculcated by summing the individual greenhouse gas emissions multiplied by their global warming potential (GWP). GWP of CO2 = 1, GWP of CH4 = 21, GWP of N2O = 310.
b All HAP emissions are included in the facility-wide potential to emit, regardless of if they are fugitive or non-fugitive emissions.
Tailpipe Emissions (see Tables H.13-H.17):
Total Emissions (excluding tailpipe emissions):
Total Non-Fugitive Emissions (excluding tailpipe emissions):
Total Fugitive Emissions (excluding tailpipe emissions):
Rosemont Copper ProjectEmission Inventory Information JBR ENVIRONMENTAL CONSULTANTS, INC.
November 2011Page H23
AZRP00205

CO NOX SO2 VOC H2SO4 CO2 CH4 N2O HAP Name HAP EF CO NOX SO2 VOC H2SO4 CO2a CH4
a N2O a HAP b
Mining
MN02 Blasting Blast 3-05-020-09 F 52 tons ANFO 67.00 17.00 2.00 0 0 566 0.02 0.005 -- -- lb/tons ANFO 1.74 0.44 0.05 0 0 14.73 0.0006 0.0001 --
Solvent Extraction and Electrowinning
SXE01 Solvent Extraction SX 4-90-001-99 F 24 hours 0 0 0 9.43E-05 0 0 0 0 Benzene 3.37E-07 lb/hr-ft2 0 0 0 0.01 0 0 0 0 3.69E-05
4 Primary Mix Tanks (7.75' D x 9.75' H each) 4 @ 47.2 = 188.7 ft2 9,132.9 ft2 Total Surface Area of Solvent Extraction Toluene 4.82E-06 lb/hr-ft2 5.28E-04
4 Secondary Mix Tanks (9.5' D x 9.75' H each) 4 @ 70.9 = 283.5 ft2 Ethylbenzene 2.05E-05 lb/hr-ft2 2.25E-03
3 Tertiary Mix Tanks (9.5' D x 9.75' H each) 3 @ 70.9 = 212.6 ft2 Xylenes 2.80E-05 lb/hr-ft2 3.07E-03
4 Extraction Settlers (64' L x 33' W x 3.33' H each) 4 @ 2,112 = 8,448 ft2 Others (including Hexane) 2.94E-05 lb/hr-ft2 3.22E-03
SXE02 Electrowinning Commercial Cells (EWCC) EW none NF 24 hours 0 0 0 0 1.57E-04 0 0 0 Cobalt Compounds 2.36E-08 lb/hr-ft2 0 0 0 0 0.00005 0 0 0 7.46E-09
Controlled by Cell Ventilation Scrubbers(PC-EWCVS1/EWCVS6)
2,640 ft2
99 Control Efficiency (%)
Fuel Burning Equipment
FB01 Diesel Electrowinning Hot Water Generator (HWG) DFB 1-02-005-03 NF 24 hours 5.00 20.00 0.21 0.20 0 23,217 0.94 0.19 POM 3.30E-03 lb/1000 gal 0.003 0.01 0.0001 0.0001 0 12.20 0.0005 0.0001 1.73E-06
6.0 MMBtu/hr Formaldehyde 6.10E-02 lb/1000 gal 3.21E-05
Arsenic 4.00 lb/1012 Btu 2.88E-07
Beryllium 3.00 lb/1012 Btu 2.16E-07
Cadmium 3.00 lb/1012 Btu 2.16E-07
Chromium 3.00 lb/1012 Btu 2.16E-07
Lead 9.00 lb/1012 Btu 6.48E-07
Mercury 3.00 lb/1012 Btu 2.16E-07
Manganese 6.00 lb/1012 Btu 4.32E-07
Nickel 3.00 lb/1012 Btu 2.16E-07
Selenium 15.00 lb/1012 Btu 1.08E-06
FB02 Thickener Area Emergency Generator (TEG) ICDE3 2-02-001-02 NF 24 hours 3.50 6.00 0.0066 0.40 0 694 0.03 0.006 -- -- g/kW-hr 0.09 0.16 0.0002 0.01 0 18.37 0.0007 0.0001 --
1,000 kW Benzene 7.76E-04 lb/MMBtu 8.74E-05
Toluene 2.81E-04 lb/MMBtu 3.17E-05
Xylenes 1.93E-04 lb/MMBtu 2.17E-05
Formaldehyde 7.89E-05 lb/MMBtu 8.89E-06
Acetaldehyde 2.52E-05 lb/MMBtu 2.84E-06
Acrolein 7.88E-06 lb/MMBtu 8.88E-07
Naphthalene 1.30E-04 lb/MMBtu 1.46E-05
Acenaphthylene 9.23E-06 lb/MMBtu 1.04E-06
Acenaphthene 4.68E-06 lb/MMBtu 5.27E-07
Fluorene 1.28E-05 lb/MMBtu 1.44E-06
Phenanthrene 4.08E-05 lb/MMBtu 4.60E-06
Anthracene 1.23E-06 lb/MMBtu 1.39E-07
Fluoranthene 4.03E-06 lb/MMBtu 4.54E-07
Pyrene 3.71E-06 lb/MMBtu 4.18E-07
Benz(a)anthracene 6.22E-07 lb/MMBtu 7.01E-08
Chrysene 1.53E-06 lb/MMBtu 1.72E-07
Table H.8 Maximum Daily Gaseous Emissions - Year 1
SCCEmission Factors Emissions (tpd) - Year 1
Unit ID EF UnitsUnit Description Process CodeNon-Fug.
(NF) / Fug. (F)
Rate UnitsDaily Production Rate - Year 1
Rosemont Copper ProjectEmission Inventory Information JBR ENVIRONMENTAL CONSULTANTS, INC.
November 2011Page H24
AZRP00206

CO NOX SO2 VOC H2SO4 CO2 CH4 N2O HAP Name HAP EF CO NOX SO2 VOC H2SO4 CO2a CH4
a N2O a HAP b
Table H.8 Maximum Daily Gaseous Emissions - Year 1
SCCEmission Factors Emissions (tpd) - Year 1
Unit ID EF UnitsUnit Description Process CodeNon-Fug.
(NF) / Fug. (F)
Rate UnitsDaily Production Rate - Year 1
Benzo(b)fluoranthene 1.11E-06 lb/MMBtu 1.25E-07
Benzo(k)fluoranthene 2.18E-07 lb/MMBtu 2.46E-08
Benzo(a)pyrene 2.57E-07 lb/MMBtu 2.89E-08
Indeno(1,2,3-cd)pyrene 4.14E-07 lb/MMBtu 4.66E-08
Dibenz(a,h)anthracene 3.46E-07 lb/MMBtu 3.90E-08
Benzo(g,h,i)perylene 5.56E-07 lb/MMBtu 6.26E-08
FB03 PLS Pond Area Emergency Generator (PEG) ICDE3 2-02-001-02 NF 24 hours 3.50 6.00 0.0066 0.40 0 694 0.03 0.006 -- -- g/kW-hr 0.09 0.16 0.0002 0.01 0 18.37 0.0007 0.0001 --
1,000 kW Benzene 7.76E-04 lb/MMBtu 8.74E-05
Toluene 2.81E-04 lb/MMBtu 3.17E-05
Xylenes 1.93E-04 lb/MMBtu 2.17E-05
Formaldehyde 7.89E-05 lb/MMBtu 8.89E-06
Acetaldehyde 2.52E-05 lb/MMBtu 2.84E-06
Acrolein 7.88E-06 lb/MMBtu 8.88E-07
Naphthalene 1.30E-04 lb/MMBtu 1.46E-05
Acenaphthylene 9.23E-06 lb/MMBtu 1.04E-06
Acenaphthene 4.68E-06 lb/MMBtu 5.27E-07
Fluorene 1.28E-05 lb/MMBtu 1.44E-06
Phenanthrene 4.08E-05 lb/MMBtu 4.60E-06
Anthracene 1.23E-06 lb/MMBtu 1.39E-07
Fluoranthene 4.03E-06 lb/MMBtu 4.54E-07
Pyrene 3.71E-06 lb/MMBtu 4.18E-07
Benz(a)anthracene 6.22E-07 lb/MMBtu 7.01E-08
Chrysene 1.53E-06 lb/MMBtu 1.72E-07
Benzo(b)fluoranthene 1.11E-06 lb/MMBtu 1.25E-07
Benzo(k)fluoranthene 2.18E-07 lb/MMBtu 2.46E-08
Benzo(a)pyrene 2.57E-07 lb/MMBtu 2.89E-08
Indeno(1,2,3-cd)pyrene 4.14E-07 lb/MMBtu 4.66E-08
Dibenz(a,h)anthracene 3.46E-07 lb/MMBtu 3.90E-08
Benzo(g,h,i)perylene 5.56E-07 lb/MMBtu 6.26E-08
FB04 Main Substation Emergency Generator (MEG) ICDE3 2-02-001-02 NF 24 hours 3.50 6.00 0.0066 0.40 0 694 0.03 0.006 -- -- g/kW-hr 0.07 0.12 0.0001 0.008 0 13.78 0.0006 0.0001 --
750 kW Benzene 7.76E-04 lb/MMBtu 6.56E-05
Toluene 2.81E-04 lb/MMBtu 2.37E-05
Xylenes 1.93E-04 lb/MMBtu 1.63E-05
Formaldehyde 7.89E-05 lb/MMBtu 6.67E-06
Acetaldehyde 2.52E-05 lb/MMBtu 2.13E-06
Acrolein 7.88E-06 lb/MMBtu 6.66E-07
Naphthalene 1.30E-04 lb/MMBtu 1.10E-05
Acenaphthylene 9.23E-06 lb/MMBtu 7.80E-07
Acenaphthene 4.68E-06 lb/MMBtu 3.95E-07
Fluorene 1.28E-05 lb/MMBtu 1.08E-06
Rosemont Copper ProjectEmission Inventory Information JBR ENVIRONMENTAL CONSULTANTS, INC.
November 2011Page H25
AZRP00207

CO NOX SO2 VOC H2SO4 CO2 CH4 N2O HAP Name HAP EF CO NOX SO2 VOC H2SO4 CO2a CH4
a N2O a HAP b
Table H.8 Maximum Daily Gaseous Emissions - Year 1
SCCEmission Factors Emissions (tpd) - Year 1
Unit ID EF UnitsUnit Description Process CodeNon-Fug.
(NF) / Fug. (F)
Rate UnitsDaily Production Rate - Year 1
Phenanthrene 4.08E-05 lb/MMBtu 3.45E-06
Anthracene 1.23E-06 lb/MMBtu 1.04E-07
Fluoranthene 4.03E-06 lb/MMBtu 3.40E-07
Pyrene 3.71E-06 lb/MMBtu 3.13E-07
Benz(a)anthracene 6.22E-07 lb/MMBtu 5.25E-08
Chrysene 1.53E-06 lb/MMBtu 1.29E-07
Benzo(b)fluoranthene 1.11E-06 lb/MMBtu 9.38E-08
Benzo(k)fluoranthene 2.18E-07 lb/MMBtu 1.84E-08
Benzo(a)pyrene 2.57E-07 lb/MMBtu 2.17E-08
Indeno(1,2,3-cd)pyrene 4.14E-07 lb/MMBtu 3.50E-08
Dibenz(a,h)anthracene 3.46E-07 lb/MMBtu 2.92E-08
Benzo(g,h,i)perylene 5.56E-07 lb/MMBtu 4.70E-08
FB05 Administration Building Emergency Generator (AEG) ICDE3 2-02-001-02 NF 24 hours 3.50 6.00 0.0066 0.40 0 694 0.03 0.006 -- -- g/kW-hr 0.07 0.12 0.0001 0.008 0 13.78 0.0006 0.0001 --
750 kW Benzene 7.76E-04 lb/MMBtu 6.56E-05
Toluene 2.81E-04 lb/MMBtu 2.37E-05
Xylenes 1.93E-04 lb/MMBtu 1.63E-05
Formaldehyde 7.89E-05 lb/MMBtu 6.67E-06
Acetaldehyde 2.52E-05 lb/MMBtu 2.13E-06
Acrolein 7.88E-06 lb/MMBtu 6.66E-07
Naphthalene 1.30E-04 lb/MMBtu 1.10E-05
Acenaphthylene 9.23E-06 lb/MMBtu 7.80E-07
Acenaphthene 4.68E-06 lb/MMBtu 3.95E-07
Fluorene 1.28E-05 lb/MMBtu 1.08E-06
Phenanthrene 4.08E-05 lb/MMBtu 3.45E-06
Anthracene 1.23E-06 lb/MMBtu 1.04E-07
Fluoranthene 4.03E-06 lb/MMBtu 3.40E-07
Pyrene 3.71E-06 lb/MMBtu 3.13E-07
Benz(a)anthracene 6.22E-07 lb/MMBtu 5.25E-08
Chrysene 1.53E-06 lb/MMBtu 1.29E-07
Benzo(b)fluoranthene 1.11E-06 lb/MMBtu 9.38E-08
Benzo(k)fluoranthene 2.18E-07 lb/MMBtu 1.84E-08
Benzo(a)pyrene 2.57E-07 lb/MMBtu 2.17E-08
Indeno(1,2,3-cd)pyrene 4.14E-07 lb/MMBtu 3.50E-08
Dibenz(a,h)anthracene 3.46E-07 lb/MMBtu 2.92E-08
Benzo(g,h,i)perylene 5.56E-07 lb/MMBtu 4.70E-08
FB06 Electrowinning Building Emergency Generator (EWEG)
ICDE1 2-02-001-02 NF 24 hours 5.00 4.43 0.0066 0.27 0 694 0.03 0.006 -- -- g/kW-hr 0.007 0.006 0.000009 0.0004 0 0.92 0.00004 0.000007 --
50 kW Benzene 9.33E-04 lb/MMBtu 5.25E-06
Toluene 4.09E-04 lb/MMBtu 2.30E-06
Xylenes 2.85E-04 lb/MMBtu 1.61E-06
1,3-Butadiene 3.91E-05 lb/MMBtu 2.20E-07
Rosemont Copper ProjectEmission Inventory Information JBR ENVIRONMENTAL CONSULTANTS, INC.
November 2011Page H26
AZRP00208
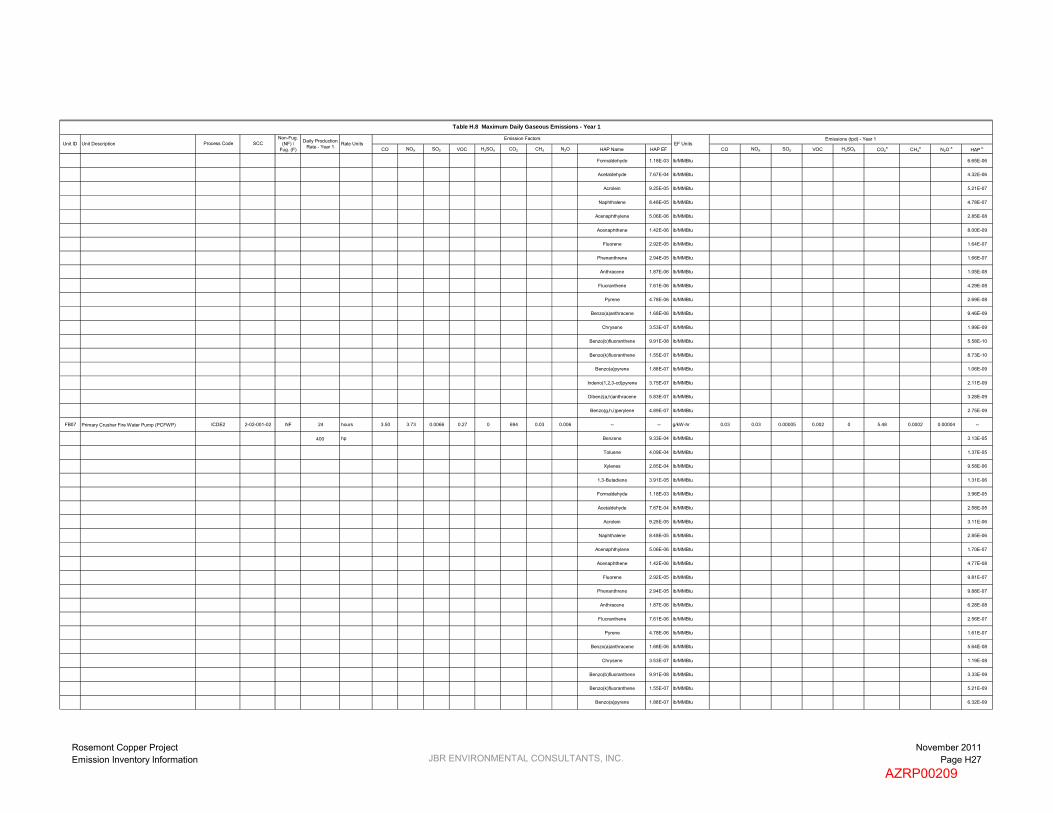
CO NOX SO2 VOC H2SO4 CO2 CH4 N2O HAP Name HAP EF CO NOX SO2 VOC H2SO4 CO2a CH4
a N2O a HAP b
Table H.8 Maximum Daily Gaseous Emissions - Year 1
SCCEmission Factors Emissions (tpd) - Year 1
Unit ID EF UnitsUnit Description Process CodeNon-Fug.
(NF) / Fug. (F)
Rate UnitsDaily Production Rate - Year 1
Formaldehyde 1.18E-03 lb/MMBtu 6.65E-06
Acetaldehyde 7.67E-04 lb/MMBtu 4.32E-06
Acrolein 9.25E-05 lb/MMBtu 5.21E-07
Naphthalene 8.48E-05 lb/MMBtu 4.78E-07
Acenaphthylene 5.06E-06 lb/MMBtu 2.85E-08
Acenaphthene 1.42E-06 lb/MMBtu 8.00E-09
Fluorene 2.92E-05 lb/MMBtu 1.64E-07
Phenanthrene 2.94E-05 lb/MMBtu 1.66E-07
Anthracene 1.87E-06 lb/MMBtu 1.05E-08
Fluoranthene 7.61E-06 lb/MMBtu 4.29E-08
Pyrene 4.78E-06 lb/MMBtu 2.69E-08
Benzo(a)anthracene 1.68E-06 lb/MMBtu 9.46E-09
Chrysene 3.53E-07 lb/MMBtu 1.99E-09
Benzo(b)fluoranthene 9.91E-08 lb/MMBtu 5.58E-10
Benzo(k)fluoranthene 1.55E-07 lb/MMBtu 8.73E-10
Benzo(a)pyrene 1.88E-07 lb/MMBtu 1.06E-09
Indeno(1,2,3-cd)pyrene 3.75E-07 lb/MMBtu 2.11E-09
Dibenz(a,h)anthracene 5.83E-07 lb/MMBtu 3.28E-09
Benzo(g,h,i)perylene 4.89E-07 lb/MMBtu 2.75E-09
FB07 Primary Crusher Fire Water Pump (PCFWP) ICDE2 2-02-001-02 NF 24 hours 3.50 3.73 0.0066 0.27 0 694 0.03 0.006 -- -- g/kW-hr 0.03 0.03 0.00005 0.002 0 5.48 0.0002 0.00004 --
400 hp Benzene 9.33E-04 lb/MMBtu 3.13E-05
Toluene 4.09E-04 lb/MMBtu 1.37E-05
Xylenes 2.85E-04 lb/MMBtu 9.58E-06
1,3-Butadiene 3.91E-05 lb/MMBtu 1.31E-06
Formaldehyde 1.18E-03 lb/MMBtu 3.96E-05
Acetaldehyde 7.67E-04 lb/MMBtu 2.58E-05
Acrolein 9.25E-05 lb/MMBtu 3.11E-06
Naphthalene 8.48E-05 lb/MMBtu 2.85E-06
Acenaphthylene 5.06E-06 lb/MMBtu 1.70E-07
Acenaphthene 1.42E-06 lb/MMBtu 4.77E-08
Fluorene 2.92E-05 lb/MMBtu 9.81E-07
Phenanthrene 2.94E-05 lb/MMBtu 9.88E-07
Anthracene 1.87E-06 lb/MMBtu 6.28E-08
Fluoranthene 7.61E-06 lb/MMBtu 2.56E-07
Pyrene 4.78E-06 lb/MMBtu 1.61E-07
Benzo(a)anthracene 1.68E-06 lb/MMBtu 5.64E-08
Chrysene 3.53E-07 lb/MMBtu 1.19E-08
Benzo(b)fluoranthene 9.91E-08 lb/MMBtu 3.33E-09
Benzo(k)fluoranthene 1.55E-07 lb/MMBtu 5.21E-09
Benzo(a)pyrene 1.88E-07 lb/MMBtu 6.32E-09
Rosemont Copper ProjectEmission Inventory Information JBR ENVIRONMENTAL CONSULTANTS, INC.
November 2011Page H27
AZRP00209

CO NOX SO2 VOC H2SO4 CO2 CH4 N2O HAP Name HAP EF CO NOX SO2 VOC H2SO4 CO2a CH4
a N2O a HAP b
Table H.8 Maximum Daily Gaseous Emissions - Year 1
SCCEmission Factors Emissions (tpd) - Year 1
Unit ID EF UnitsUnit Description Process CodeNon-Fug.
(NF) / Fug. (F)
Rate UnitsDaily Production Rate - Year 1
Indeno(1,2,3-cd)pyrene 3.75E-07 lb/MMBtu 1.26E-08
Dibenz(a,h)anthracene 5.83E-07 lb/MMBtu 1.96E-08
Benzo(g,h,i)perylene 4.89E-07 lb/MMBtu 1.64E-08
FB08 SX/EW Fire Water Pump (SXFWP) ICDE2 2-02-001-02 NF 24 hours 3.50 3.73 0.0066 0.27 0 694 0.03 0.006 -- -- g/kW-hr 0.03 0.03 0.00005 0.002 0 5.48 0.0002 0.00004 --
400 hp Benzene 9.33E-04 lb/MMBtu 3.13E-05
Toluene 4.09E-04 lb/MMBtu 1.37E-05
Xylenes 2.85E-04 lb/MMBtu 9.58E-06
1,3-Butadiene 3.91E-05 lb/MMBtu 1.31E-06
Formaldehyde 1.18E-03 lb/MMBtu 3.96E-05
Acetaldehyde 7.67E-04 lb/MMBtu 2.58E-05
Acrolein 9.25E-05 lb/MMBtu 3.11E-06
Naphthalene 8.48E-05 lb/MMBtu 2.85E-06
Acenaphthylene 5.06E-06 lb/MMBtu 1.70E-07
Acenaphthene 1.42E-06 lb/MMBtu 4.77E-08
Fluorene 2.92E-05 lb/MMBtu 9.81E-07
Phenanthrene 2.94E-05 lb/MMBtu 9.88E-07
Anthracene 1.87E-06 lb/MMBtu 6.28E-08
Fluoranthene 7.61E-06 lb/MMBtu 2.56E-07
Pyrene 4.78E-06 lb/MMBtu 1.61E-07
Benzo(a)anthracene 1.68E-06 lb/MMBtu 5.64E-08
Chrysene 3.53E-07 lb/MMBtu 1.19E-08
Benzo(b)fluoranthene 9.91E-08 lb/MMBtu 3.33E-09
Benzo(k)fluoranthene 1.55E-07 lb/MMBtu 5.21E-09
Benzo(a)pyrene 1.88E-07 lb/MMBtu 6.32E-09
Indeno(1,2,3-cd)pyrene 3.75E-07 lb/MMBtu 1.26E-08
Dibenz(a,h)anthracene 5.83E-07 lb/MMBtu 1.96E-08
Benzo(g,h,i)perylene 4.89E-07 lb/MMBtu 1.64E-08
Tanks
T01 C7 Distribution Tank (T-C7D) C7DT 4-03-010-19 NF 24 hours 0 0 0 1.08E-01 0 0 0 0 -- -- lb/hr 0 0 0 0.001 0 0 0 0 --
T02 MIBC Storage Tank (T-MIBCS) MST 4-90-999-98 NF 24 hours 0 0 0 3.53E-03 0 0 0 0 -- -- lb/hr 0 0 0 0.00004 0 0 0 0 --
T03 Diesel Fuel Storage Tank - Heavy Vehicles 1(T-DFS-HV1)
DFSTHV 4-03-010-19 NF 24 hours 0 0 0 1.39E-02 0 0 0 0 n-Hexane 5.71E-06 lb/hr 0 0 0 0.0002 0 0 0 0 6.85E-08
Benzene 2.74E-05 lb/hr 3.29E-07
Toluene 3.18E-04 lb/hr 3.82E-06
Ethylbenzene 4.45E-05 lb/hr 5.34E-07
m-Xylene 8.23E-04 lb/hr 9.88E-06
1,2,4-Trimethylbenzene 6.76E-04 lb/hr 8.11E-06
T04 Diesel Fuel Storage Tank - Heavy Vehicles 2(T-DFS-HV2)
DFSTHV 4-03-010-19 NF 24 hours 0 0 0 1.39E-02 0 0 0 0 n-Hexane 5.71E-06 lb/hr 0 0 0 0.0002 0 0 0 0 6.85E-08
Benzene 2.74E-05 lb/hr 3.29E-07
Toluene 3.18E-04 lb/hr 3.82E-06
Ethylbenzene 4.45E-05 lb/hr 5.34E-07
Rosemont Copper ProjectEmission Inventory Information JBR ENVIRONMENTAL CONSULTANTS, INC.
November 2011Page H28
AZRP00210
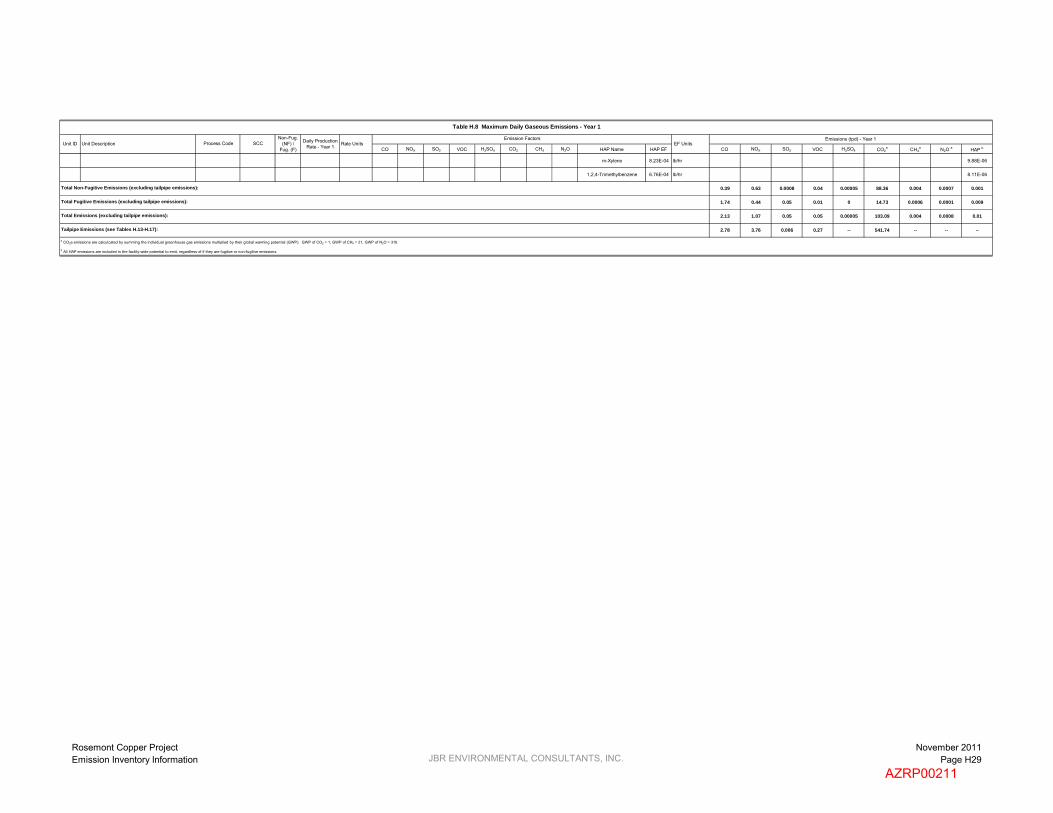
CO NOX SO2 VOC H2SO4 CO2 CH4 N2O HAP Name HAP EF CO NOX SO2 VOC H2SO4 CO2a CH4
a N2O a HAP b
Table H.8 Maximum Daily Gaseous Emissions - Year 1
SCCEmission Factors Emissions (tpd) - Year 1
Unit ID EF UnitsUnit Description Process CodeNon-Fug.
(NF) / Fug. (F)
Rate UnitsDaily Production Rate - Year 1
m-Xylene 8.23E-04 lb/hr 9.88E-06
1,2,4-Trimethylbenzene 6.76E-04 lb/hr 8.11E-06
0.39 0.63 0.0008 0.04 0.00005 88.36 0.004 0.0007 0.001
1.74 0.44 0.05 0.01 0 14.73 0.0006 0.0001 0.009
2.13 1.07 0.05 0.05 0.00005 103.09 0.004 0.0008 0.01
2.78 3.76 0.006 0.27 -- 541.74 -- -- --
a CO2e emissions are calculcated by summing the individual greenhouse gas emissions multiplied by their global warming potential (GWP). GWP of CO2 = 1, GWP of CH4 = 21, GWP of N2O = 310.
b All HAP emissions are included in the facility-wide potential to emit, regardless of if they are fugitive or non-fugitive emissions.
Total Emissions (excluding tailpipe emissions):
Total Non-Fugitive Emissions (excluding tailpipe emissions):
Total Fugitive Emissions (excluding tailpipe emissions):
Tailpipe Emissions (see Tables H.13-H.17):
Rosemont Copper ProjectEmission Inventory Information JBR ENVIRONMENTAL CONSULTANTS, INC.
November 2011Page H29
AZRP00211

CO NOX SO2 VOC H2SO4 CO2 CH4 N2O HAP Name HAP EF CO NOX SO2 VOC H2SO4 CO2a CH4
a N2O a HAP b
Mining
MN02 Blasting Blast 3-05-020-09 F 52 tons ANFO 67.00 17.00 2.00 0 0 566 0.02 0.005 -- -- lb/tons ANFO 3,484.00 884.00 104.00 0 0 29,455.36 1.19 0.24 --
Solvent Extraction and Electrowinning
SXE01 Solvent Extraction SX 4-90-001-99 F 1 hours 0 0 0 9.43E-05 0 0 0 0 Benzene 3.37E-07 lb/hr-ft2 0 0 0 0.86 0 0 0 0 3.08E-03
4 Primary Mix Tanks (7.75' D x 9.75' H each) 4 @ 47.2 = 188.7 ft2 9,132.9 ft2 Total Surface Area of Solvent Extraction Toluene 4.82E-06 lb/hr-ft2 4.40E-02
4 Secondary Mix Tanks (9.5' D x 9.75' H each) 4 @ 70.9 = 283.5 ft2 Ethylbenzene 2.05E-05 lb/hr-ft2 1.87E-01
3 Tertiary Mix Tanks (9.5' D x 9.75' H each) 3 @ 70.9 = 212.6 ft2 Xylenes 2.80E-05 lb/hr-ft2 2.56E-01
4 Extraction Settlers (64' L x 33' W x 3.33' H each) 4 @ 2,112 = 8,448 ft2 Others (including Hexane) 2.94E-05 lb/hr-ft2 2.69E-01
SXE02 Electrowinning Commercial Cells (EWCC) EW none NF 1 hours 0 0 0 0 1.57E-04 0 0 0 Cobalt Compounds 2.36E-08 lb/hr-ft2 0 0 0 0 0.004 0 0 0 6.22E-07
Controlled by Cell Ventilation Scrubbers(PC-EWCVS1/EWCVS6)
2,640 ft2
99 Control Efficiency (%)
Fuel Burning Equipment
FB01 Diesel Electrowinning Hot Water Generator (HWG) DFB 1-02-005-03 NF 1 hours 5.00 20.00 0.21 0.20 0 23,217 0.94 0.19 POM 3.30E-03 lb/1000 gal 0.22 0.88 0.009 0.009 0 1,016.78 0.04 0.008 1.45E-04
6.0 MMBtu/hr Formaldehyde 6.10E-02 lb/1000 gal 2.67E-03
Arsenic 4.00 lb/1012 Btu 2.40E-05
Beryllium 3.00 lb/1012 Btu 1.80E-05
Cadmium 3.00 lb/1012 Btu 1.80E-05
Chromium 3.00 lb/1012 Btu 1.80E-05
Lead 9.00 lb/1012 Btu 5.40E-05
Mercury 3.00 lb/1012 Btu 1.80E-05
Manganese 6.00 lb/1012 Btu 3.60E-05
Nickel 3.00 lb/1012 Btu 1.80E-05
Selenium 15.00 lb/1012 Btu 9.00E-05
FB02 Thickener Area Emergency Generator (TEG) ICDE3 2-02-001-02 NF 1 hours 3.50 6.00 0.0066 0.40 0 694 0.03 0.006 -- -- g/kW-hr 7.72 13.23 0.01 0.88 0 1,530.61 0.06 0.01 --
1,000 kW Benzene 7.76E-04 lb/MMBtu 7.28E-03
Toluene 2.81E-04 lb/MMBtu 2.64E-03
Xylenes 1.93E-04 lb/MMBtu 1.81E-03
Formaldehyde 7.89E-05 lb/MMBtu 7.41E-04
Acetaldehyde 2.52E-05 lb/MMBtu 2.37E-04
Acrolein 7.88E-06 lb/MMBtu 7.40E-05
Naphthalene 1.30E-04 lb/MMBtu 1.22E-03
Acenaphthylene 9.23E-06 lb/MMBtu 8.66E-05
Acenaphthene 4.68E-06 lb/MMBtu 4.39E-05
Fluorene 1.28E-05 lb/MMBtu 1.20E-04
Phenanthrene 4.08E-05 lb/MMBtu 3.83E-04
Anthracene 1.23E-06 lb/MMBtu 1.15E-05
Fluoranthene 4.03E-06 lb/MMBtu 3.78E-05
Pyrene 3.71E-06 lb/MMBtu 3.48E-05
Benz(a)anthracene 6.22E-07 lb/MMBtu 5.84E-06
Chrysene 1.53E-06 lb/MMBtu 1.44E-05
Table H.9 Hourly Gaseous Emissions - Year 1
SCCEmission Factors Emissions (lb/hr) - Year 1
Unit ID EF UnitsUnit Description Process CodeNon-Fug.
(NF) / Fug. (F)
Rate UnitsHourly
Production Rate - Year 1
Rosemont Copper ProjectEmission Inventory Information JBR ENVIRONMENTAL CONSULTANTS, INC.
November 2011Page H30
AZRP00212

CO NOX SO2 VOC H2SO4 CO2 CH4 N2O HAP Name HAP EF CO NOX SO2 VOC H2SO4 CO2a CH4
a N2O a HAP b
Table H.9 Hourly Gaseous Emissions - Year 1
SCCEmission Factors Emissions (lb/hr) - Year 1
Unit ID EF UnitsUnit Description Process CodeNon-Fug.
(NF) / Fug. (F)
Rate UnitsHourly
Production Rate - Year 1
Benzo(b)fluoranthene 1.11E-06 lb/MMBtu 1.04E-05
Benzo(k)fluoranthene 2.18E-07 lb/MMBtu 2.05E-06
Benzo(a)pyrene 2.57E-07 lb/MMBtu 2.41E-06
Indeno(1,2,3-cd)pyrene 4.14E-07 lb/MMBtu 3.89E-06
Dibenz(a,h)anthracene 3.46E-07 lb/MMBtu 3.25E-06
Benzo(g,h,i)perylene 5.56E-07 lb/MMBtu 5.22E-06
FB03 PLS Pond Area Emergency Generator (PEG) ICDE3 2-02-001-02 NF 1 hours 3.50 6.00 0.0066 0.40 0 694 0.03 0.006 -- -- g/kW-hr 7.72 13.23 0.01 0.88 0 1,530.61 0.06 0.01 --
1,000 kW Benzene 7.76E-04 lb/MMBtu 7.28E-03
Toluene 2.81E-04 lb/MMBtu 2.64E-03
Xylenes 1.93E-04 lb/MMBtu 1.81E-03
Formaldehyde 7.89E-05 lb/MMBtu 7.41E-04
Acetaldehyde 2.52E-05 lb/MMBtu 2.37E-04
Acrolein 7.88E-06 lb/MMBtu 7.40E-05
Naphthalene 1.30E-04 lb/MMBtu 1.22E-03
Acenaphthylene 9.23E-06 lb/MMBtu 8.66E-05
Acenaphthene 4.68E-06 lb/MMBtu 4.39E-05
Fluorene 1.28E-05 lb/MMBtu 1.20E-04
Phenanthrene 4.08E-05 lb/MMBtu 3.83E-04
Anthracene 1.23E-06 lb/MMBtu 1.15E-05
Fluoranthene 4.03E-06 lb/MMBtu 3.78E-05
Pyrene 3.71E-06 lb/MMBtu 3.48E-05
Benz(a)anthracene 6.22E-07 lb/MMBtu 5.84E-06
Chrysene 1.53E-06 lb/MMBtu 1.44E-05
Benzo(b)fluoranthene 1.11E-06 lb/MMBtu 1.04E-05
Benzo(k)fluoranthene 2.18E-07 lb/MMBtu 2.05E-06
Benzo(a)pyrene 2.57E-07 lb/MMBtu 2.41E-06
Indeno(1,2,3-cd)pyrene 4.14E-07 lb/MMBtu 3.89E-06
Dibenz(a,h)anthracene 3.46E-07 lb/MMBtu 3.25E-06
Benzo(g,h,i)perylene 5.56E-07 lb/MMBtu 5.22E-06
FB04 Main Substation Emergency Generator (MEG) ICDE3 2-02-001-02 NF 1 hours 3.50 6.00 0.0066 0.40 0 694 0.03 0.006 -- -- g/kW-hr 5.79 9.92 0.01 0.66 0 1,147.96 0.05 0.009 --
750 kW Benzene 7.76E-04 lb/MMBtu 5.46E-03
Toluene 2.81E-04 lb/MMBtu 1.98E-03
Xylenes 1.93E-04 lb/MMBtu 1.36E-03
Formaldehyde 7.89E-05 lb/MMBtu 5.55E-04
Acetaldehyde 2.52E-05 lb/MMBtu 1.77E-04
Acrolein 7.88E-06 lb/MMBtu 5.55E-05
Naphthalene 1.30E-04 lb/MMBtu 9.15E-04
Acenaphthylene 9.23E-06 lb/MMBtu 6.50E-05
Acenaphthene 4.68E-06 lb/MMBtu 3.29E-05
Fluorene 1.28E-05 lb/MMBtu 9.01E-05
Rosemont Copper ProjectEmission Inventory Information JBR ENVIRONMENTAL CONSULTANTS, INC.
November 2011Page H31
AZRP00213

CO NOX SO2 VOC H2SO4 CO2 CH4 N2O HAP Name HAP EF CO NOX SO2 VOC H2SO4 CO2a CH4
a N2O a HAP b
Table H.9 Hourly Gaseous Emissions - Year 1
SCCEmission Factors Emissions (lb/hr) - Year 1
Unit ID EF UnitsUnit Description Process CodeNon-Fug.
(NF) / Fug. (F)
Rate UnitsHourly
Production Rate - Year 1
Phenanthrene 4.08E-05 lb/MMBtu 2.87E-04
Anthracene 1.23E-06 lb/MMBtu 8.66E-06
Fluoranthene 4.03E-06 lb/MMBtu 2.84E-05
Pyrene 3.71E-06 lb/MMBtu 2.61E-05
Benz(a)anthracene 6.22E-07 lb/MMBtu 4.38E-06
Chrysene 1.53E-06 lb/MMBtu 1.08E-05
Benzo(b)fluoranthene 1.11E-06 lb/MMBtu 7.81E-06
Benzo(k)fluoranthene 2.18E-07 lb/MMBtu 1.53E-06
Benzo(a)pyrene 2.57E-07 lb/MMBtu 1.81E-06
Indeno(1,2,3-cd)pyrene 4.14E-07 lb/MMBtu 2.91E-06
Dibenz(a,h)anthracene 3.46E-07 lb/MMBtu 2.44E-06
Benzo(g,h,i)perylene 5.56E-07 lb/MMBtu 3.91E-06
FB05 Administration Building Emergency Generator (AEG) ICDE3 2-02-001-02 NF 1 hours 3.50 6.00 0.0066 0.40 0 694 0.03 0.006 -- -- g/kW-hr 5.79 9.92 0.01 0.66 0 1,147.96 0.05 0.009 --
750 kW Benzene 7.76E-04 lb/MMBtu 5.46E-03
Toluene 2.81E-04 lb/MMBtu 1.98E-03
Xylenes 1.93E-04 lb/MMBtu 1.36E-03
Formaldehyde 7.89E-05 lb/MMBtu 5.55E-04
Acetaldehyde 2.52E-05 lb/MMBtu 1.77E-04
Acrolein 7.88E-06 lb/MMBtu 5.55E-05
Naphthalene 1.30E-04 lb/MMBtu 9.15E-04
Acenaphthylene 9.23E-06 lb/MMBtu 6.50E-05
Acenaphthene 4.68E-06 lb/MMBtu 3.29E-05
Fluorene 1.28E-05 lb/MMBtu 9.01E-05
Phenanthrene 4.08E-05 lb/MMBtu 2.87E-04
Anthracene 1.23E-06 lb/MMBtu 8.66E-06
Fluoranthene 4.03E-06 lb/MMBtu 2.84E-05
Pyrene 3.71E-06 lb/MMBtu 2.61E-05
Benz(a)anthracene 6.22E-07 lb/MMBtu 4.38E-06
Chrysene 1.53E-06 lb/MMBtu 1.08E-05
Benzo(b)fluoranthene 1.11E-06 lb/MMBtu 7.81E-06
Benzo(k)fluoranthene 2.18E-07 lb/MMBtu 1.53E-06
Benzo(a)pyrene 2.57E-07 lb/MMBtu 1.81E-06
Indeno(1,2,3-cd)pyrene 4.14E-07 lb/MMBtu 2.91E-06
Dibenz(a,h)anthracene 3.46E-07 lb/MMBtu 2.44E-06
Benzo(g,h,i)perylene 5.56E-07 lb/MMBtu 3.91E-06
FB06 Electrowinning Building Emergency Generator (EWEG)
ICDE1 2-02-001-02 NF 1 hours 5.00 4.43 0.0066 0.27 0 694 0.03 0.006 -- -- g/kW-hr 0.55 0.49 0.0007 0.03 0 76.53 0.003 0.0006 --
50 kW Benzene 9.33E-04 lb/MMBtu 4.38E-04
Toluene 4.09E-04 lb/MMBtu 1.92E-04
Xylenes 2.85E-04 lb/MMBtu 1.34E-04
1,3-Butadiene 3.91E-05 lb/MMBtu 1.84E-05
Rosemont Copper ProjectEmission Inventory Information JBR ENVIRONMENTAL CONSULTANTS, INC.
November 2011Page H32
AZRP00214

CO NOX SO2 VOC H2SO4 CO2 CH4 N2O HAP Name HAP EF CO NOX SO2 VOC H2SO4 CO2a CH4
a N2O a HAP b
Table H.9 Hourly Gaseous Emissions - Year 1
SCCEmission Factors Emissions (lb/hr) - Year 1
Unit ID EF UnitsUnit Description Process CodeNon-Fug.
(NF) / Fug. (F)
Rate UnitsHourly
Production Rate - Year 1
Formaldehyde 1.18E-03 lb/MMBtu 5.54E-04
Acetaldehyde 7.67E-04 lb/MMBtu 3.60E-04
Acrolein 9.25E-05 lb/MMBtu 4.34E-05
Naphthalene 8.48E-05 lb/MMBtu 3.98E-05
Acenaphthylene 5.06E-06 lb/MMBtu 2.37E-06
Acenaphthene 1.42E-06 lb/MMBtu 6.66E-07
Fluorene 2.92E-05 lb/MMBtu 1.37E-05
Phenanthrene 2.94E-05 lb/MMBtu 1.38E-05
Anthracene 1.87E-06 lb/MMBtu 8.78E-07
Fluoranthene 7.61E-06 lb/MMBtu 3.57E-06
Pyrene 4.78E-06 lb/MMBtu 2.24E-06
Benzo(a)anthracene 1.68E-06 lb/MMBtu 7.89E-07
Chrysene 3.53E-07 lb/MMBtu 1.66E-07
Benzo(b)fluoranthene 9.91E-08 lb/MMBtu 4.65E-08
Benzo(k)fluoranthene 1.55E-07 lb/MMBtu 7.28E-08
Benzo(a)pyrene 1.88E-07 lb/MMBtu 8.82E-08
Indeno(1,2,3-cd)pyrene 3.75E-07 lb/MMBtu 1.76E-07
Dibenz(a,h)anthracene 5.83E-07 lb/MMBtu 2.74E-07
Benzo(g,h,i)perylene 4.89E-07 lb/MMBtu 2.30E-07
FB07 Primary Crusher Fire Water Pump (PCFWP) ICDE2 2-02-001-02 NF 1 hours 3.50 3.73 0.0066 0.27 0 694 0.03 0.006 -- -- g/kW-hr 2.30 2.46 0.004 0.18 0 456.55 0.02 0.004 --
400 hp Benzene 9.33E-04 lb/MMBtu 2.61E-03
Toluene 4.09E-04 lb/MMBtu 1.15E-03
Xylenes 2.85E-04 lb/MMBtu 7.98E-04
1,3-Butadiene 3.91E-05 lb/MMBtu 1.09E-04
Formaldehyde 1.18E-03 lb/MMBtu 3.30E-03
Acetaldehyde 7.67E-04 lb/MMBtu 2.15E-03
Acrolein 9.25E-05 lb/MMBtu 2.59E-04
Naphthalene 8.48E-05 lb/MMBtu 2.37E-04
Acenaphthylene 5.06E-06 lb/MMBtu 1.42E-05
Acenaphthene 1.42E-06 lb/MMBtu 3.98E-06
Fluorene 2.92E-05 lb/MMBtu 8.18E-05
Phenanthrene 2.94E-05 lb/MMBtu 8.23E-05
Anthracene 1.87E-06 lb/MMBtu 5.24E-06
Fluoranthene 7.61E-06 lb/MMBtu 2.13E-05
Pyrene 4.78E-06 lb/MMBtu 1.34E-05
Benzo(a)anthracene 1.68E-06 lb/MMBtu 4.70E-06
Chrysene 3.53E-07 lb/MMBtu 9.88E-07
Benzo(b)fluoranthene 9.91E-08 lb/MMBtu 2.77E-07
Benzo(k)fluoranthene 1.55E-07 lb/MMBtu 4.34E-07
Benzo(a)pyrene 1.88E-07 lb/MMBtu 5.26E-07
Rosemont Copper ProjectEmission Inventory Information JBR ENVIRONMENTAL CONSULTANTS, INC.
November 2011Page H33
AZRP00215

CO NOX SO2 VOC H2SO4 CO2 CH4 N2O HAP Name HAP EF CO NOX SO2 VOC H2SO4 CO2a CH4
a N2O a HAP b
Table H.9 Hourly Gaseous Emissions - Year 1
SCCEmission Factors Emissions (lb/hr) - Year 1
Unit ID EF UnitsUnit Description Process CodeNon-Fug.
(NF) / Fug. (F)
Rate UnitsHourly
Production Rate - Year 1
Indeno(1,2,3-cd)pyrene 3.75E-07 lb/MMBtu 1.05E-06
Dibenz(a,h)anthracene 5.83E-07 lb/MMBtu 1.63E-06
Benzo(g,h,i)perylene 4.89E-07 lb/MMBtu 1.37E-06
FB08 SX/EW Fire Water Pump (SXFWP) ICDE2 2-02-001-02 NF 1 hours 3.50 3.73 0.0066 0.27 0 694 0.03 0.006 -- -- g/kW-hr 2.30 2.46 0.004 0.18 0 456.55 0.02 0.004 --
400 hp Benzene 9.33E-04 lb/MMBtu 2.61E-03
Toluene 4.09E-04 lb/MMBtu 1.15E-03
Xylenes 2.85E-04 lb/MMBtu 7.98E-04
1,3-Butadiene 3.91E-05 lb/MMBtu 1.09E-04
Formaldehyde 1.18E-03 lb/MMBtu 3.30E-03
Acetaldehyde 7.67E-04 lb/MMBtu 2.15E-03
Acrolein 9.25E-05 lb/MMBtu 2.59E-04
Naphthalene 8.48E-05 lb/MMBtu 2.37E-04
Acenaphthylene 5.06E-06 lb/MMBtu 1.42E-05
Acenaphthene 1.42E-06 lb/MMBtu 3.98E-06
Fluorene 2.92E-05 lb/MMBtu 8.18E-05
Phenanthrene 2.94E-05 lb/MMBtu 8.23E-05
Anthracene 1.87E-06 lb/MMBtu 5.24E-06
Fluoranthene 7.61E-06 lb/MMBtu 2.13E-05
Pyrene 4.78E-06 lb/MMBtu 1.34E-05
Benzo(a)anthracene 1.68E-06 lb/MMBtu 4.70E-06
Chrysene 3.53E-07 lb/MMBtu 9.88E-07
Benzo(b)fluoranthene 9.91E-08 lb/MMBtu 2.77E-07
Benzo(k)fluoranthene 1.55E-07 lb/MMBtu 4.34E-07
Benzo(a)pyrene 1.88E-07 lb/MMBtu 5.26E-07
Indeno(1,2,3-cd)pyrene 3.75E-07 lb/MMBtu 1.05E-06
Dibenz(a,h)anthracene 5.83E-07 lb/MMBtu 1.63E-06
Benzo(g,h,i)perylene 4.89E-07 lb/MMBtu 1.37E-06
Tanks
T01 C7 Distribution Tank (T-C7D) C7DT 4-03-010-19 NF 1 hours 0 0 0 1.08E-01 0 0 0 0 -- -- lb/hr 0 0 0 0.11 0 0 0 0 --
T02 MIBC Storage Tank (T-MIBCS) MST 4-90-999-98 NF 1 hours 0 0 0 3.53E-03 0 0 0 0 -- -- lb/hr 0 0 0 0.004 0 0 0 0 --
T03 Diesel Fuel Storage Tank - Heavy Vehicles 1(T-DFS-HV1)
DFSTHV 4-03-010-19 NF 1 hours 0 0 0 1.39E-02 0 0 0 0 n-Hexane 5.71E-06 lb/hr 0 0 0 0.01 0 0 0 0 5.71E-06
Benzene 2.74E-05 lb/hr 2.74E-05
Toluene 3.18E-04 lb/hr 3.18E-04
Ethylbenzene 4.45E-05 lb/hr 4.45E-05
m-Xylene 8.23E-04 lb/hr 8.23E-04
1,2,4-Trimethylbenzene 6.76E-04 lb/hr 6.76E-04
T04 Diesel Fuel Storage Tank - Heavy Vehicles 2(T-DFS-HV2)
DFSTHV 4-03-010-19 NF 1 hours 0 0 0 1.39E-02 0 0 0 0 n-Hexane 5.71E-06 lb/hr 0 0 0 0.01 0 0 0 0 5.71E-06
Benzene 2.74E-05 lb/hr 2.74E-05
Toluene 3.18E-04 lb/hr 3.18E-04
Ethylbenzene 4.45E-05 lb/hr 4.45E-05
Rosemont Copper ProjectEmission Inventory Information JBR ENVIRONMENTAL CONSULTANTS, INC.
November 2011Page H34
AZRP00216

CO NOX SO2 VOC H2SO4 CO2 CH4 N2O HAP Name HAP EF CO NOX SO2 VOC H2SO4 CO2a CH4
a N2O a HAP b
Table H.9 Hourly Gaseous Emissions - Year 1
SCCEmission Factors Emissions (lb/hr) - Year 1
Unit ID EF UnitsUnit Description Process CodeNon-Fug.
(NF) / Fug. (F)
Rate UnitsHourly
Production Rate - Year 1
m-Xylene 8.23E-04 lb/hr 8.23E-04
1,2,4-Trimethylbenzene 6.76E-04 lb/hr 6.76E-04
32.38 52.57 0.07 3.61 0.004 7,363.56 0.30 0.06 0.08
3,484.00 884.00 104.00 0.86 0 29,455.36 1.19 0.24 0.76
3,516.38 936.57 104.07 4.48 0.004 36,818.92 1.49 0.30 0.84
231.70 314.52 1.00 22.53 -- 46,981.76 -- -- --
a CO2e emissions are calculcated by summing the individual greenhouse gas emissions multiplied by their global warming potential (GWP). GWP of CO2 = 1, GWP of CH4 = 21, GWP of N2O = 310.
b All HAP emissions are included in the facility-wide potential to emit, regardless of if they are fugitive or non-fugitive emissions.
Total Emissions (excluding tailpipe emissions):
Total Non-Fugitive Emissions (excluding tailpipe emissions):
Total Fugitive Emissions (excluding tailpipe emissions):
Tailpipe Emissions (see Tables H.13-H.17):
Rosemont Copper ProjectEmission Inventory Information JBR ENVIRONMENTAL CONSULTANTS, INC.
November 2011Page H35
AZRP00217

Hourly Daily AnnualTier 2/Tier 4 (Final) Emission Standards or Mobile 6 Output
Units lb/hr tpd tpy
Haulage Trucks, 250 tons 31 2,650 1.00 24 6,600 hours 0.32 0.15 g/hp-hr 8.69 0.10 28.69
Crawler Dozers, D11T Class 3 850 0.46 11 4,000 hours 0.575 0.03 g/hp-hr 0.04 0.0005 0.19
Crawler Dozers, D10T Class 3 580 0.68 16 6,000 hours 0.575 0.01 g/hp-hr 0.02 0.0002 0.07
Crawler Dozer, D8T Class 1 310 0.75 18 6,570 hours 0.575 0.01 g/hp-hr 0.003 0.00004 0.01
Rubber Tired Dozers, 834H Class 3 498 0.70 17 6,150 hours 0.575 0.01 g/hp-hr 0.01 0.0002 0.06
Motor Graders, 24M Class 1 533 0.68 16 6,000 hours 0.575 0.01 g/hp-hr 0.005 0.00006 0.02
Motor Graders, 16M Class 3 297 0.68 16 6,000 hours 0.575 0.01 g/hp-hr 0.008 0.00009 0.03
Water Trucks, 30,000 gallons 4 1,348 0.37 9 3,250 hours 0.35 0.03 g/hp-hr 0.05 0.0006 0.20
Diesel Blasthole Drill, 12.25 inches 2 1,500 0.75 18 6,570 hours 0.43 0.03 g/hp-hr 0.06 0.0008 0.28
Hydraulic DML 45 Drill 1 425 0.75 18 6,570 hours 0.43 0.01 g/hp-hr 0.003 0.00004 0.01
Front End Loaders 2 2,000 0.90 22 7,884 hours 0.59 0.15 g/hp-hr 0.70 0.008 3.08
Stemming Truck 2 450 0.75 18 6,570 hours 0.43 0.01 g/hp-hr 0.006 0.00008 0.03
ANFO/Slurry Truck, 20 tons 2 450 0.75 18 6,570 hours 0.43 0.01 g/hp-hr 0.006 0.00008 0.03
Powder Truck, 2 tons 2 350 0.75 18 6,570 hours 0.43 0.01 g/hp-hr 0.005 0.00006 0.02
Front End Loaders, 8 yd3 2 262 0.75 18 6,570 hours 0.575 0.01 g/hp-hr 0.005 0.00006 0.02
Hydraulic Excavator, 385 Cat CL 2 513 0.90 22 7,884 hours 0.35 0.01 g/hp-hr 0.007 0.00009 0.03
Backhoe/Loader, 2 yd3 1 124 0.75 18 6,570 hours 0.35 0.01 g/hp-hr 0.0007 0.000009 0.003
Load Factor
PM/TSP Emission Factors PM/TSP Emissions - Year 1
Table H.10 PM/TSP Emissions from Fuel Burning Mobile Engines - Year 1
Fuel Burning Mobile Engine Description a
Fleet Size
HP Rating
Process Rates b - Year 1
Units
Rosemont Copper ProjectEmission Inventory Information JBR ENVIRONMENTAL CONSULTANTS, INC.
November 2011Page H36
AZRP00218

Hourly Daily AnnualTier 2/Tier 4 (Final) Emission Standards or Mobile 6 Output
Units lb/hr tpd tpyLoad
Factor
PM/TSP Emission Factors PM/TSP Emissions - Year 1
Table H.10 PM/TSP Emissions from Fuel Burning Mobile Engines - Year 1
Fuel Burning Mobile Engine Description a
Fleet Size
HP Rating
Process Rates b - Year 1
Units
All-Terrain Crane, 75 tons 1 230 0.75 18 6,570 hours 0.43 0.01 g/hp-hr 0.002 0.00002 0.007
Transporter with Tractor, 200 tons 1 1,350 0.75 18 6,570 hours 0.59 0.03 g/hp-hr 0.04 0.0005 0.17
Fuel/Lube Trucks, 6,000 gallons 2 703 0.75 18 6,570 hours 0.35 0.01 g/hp-hr 0.008 0.0001 0.04
Mechanic Field Service Trucks 5 370 1.71 41 15,000 VMT 0.43 0.2117 g/mile 0.004 0.00005 0.02
Tire Handler 1 90 0.11 3 1,000 VMT 0.43 0.2117 g/mile 0.00005 0.0000006 0.0002
Shop Forklift, 12,000 lbs 1 90 0.75 18 6,570 hours 0.59 0.01 g/hp-hr 0.0009 0.00001 0.004
Integrated Tool Carrier, 140 hp 1 138 0.75 18 6,570 hours 0.59 0.01 g/hp-hr 0.001 0.00002 0.006
Light Plant, 6 kW 15 35 0.40 10 3,504 hours 0.43 0.02 g/hp-hr 0.004 0.00005 0.02
Primary Crushing Mobile Crane - 400 tons 1 320 0.75 18 6,570 hours 0.43 0.01 g/hp-hr 0.002 0.00003 0.01
Copper Concentrate Area Front End Loader - Cat 930 1 160 0.75 18 6,570 hours 0.59 0.01 g/hp-hr 0.002 0.00002 0.007
Molybdenum Packaging Forklift, 7,000 lbs 1 93 0.75 18 6,570 hours 0.59 0.01 g/hp-hr 0.0009 0.00001 0.004
Copper Cathode Forklift 1 93 0.75 18 6,570 hours 0.59 0.01 g/hp-hr 0.0009 0.00001 0.004
Boom Trucks 10 tons, 45 foot boom 1 200 0.75 18 6,570 hours 0.21 0.01 g/hp-hr 0.0007 0.000008 0.003
Boom Trucks 15 tons, 60 foot boom 1 210 0.75 18 6,570 hours 0.21 0.01 g/hp-hr 0.0007 0.000009 0.003
Front End Loader, 6 yd3 1 349 0.75 18 6,570 hours 0.35 0.01 g/hp-hr 0.002 0.00002 0.009
Front End Loader, 5 yd3 1 149 0.75 18 6,570 hours 0.25 0.01 g/hp-hr 0.0006 0.000007 0.003
Bob Cats, 2,400 lbs 2 82 0.75 18 6,570 hours 0.59 0.01 g/hp-hr 0.002 0.00002 0.007
Rosemont Copper ProjectEmission Inventory Information JBR ENVIRONMENTAL CONSULTANTS, INC.
November 2011Page H37
AZRP00219

Hourly Daily AnnualTier 2/Tier 4 (Final) Emission Standards or Mobile 6 Output
Units lb/hr tpd tpyLoad
Factor
PM/TSP Emission Factors PM/TSP Emissions - Year 1
Table H.10 PM/TSP Emissions from Fuel Burning Mobile Engines - Year 1
Fuel Burning Mobile Engine Description a
Fleet Size
HP Rating
Process Rates b - Year 1
Units
Fork Lift, 2,000 lbs 1 50 0.75 18 6,570 hours 0.59 0.02 g/hp-hr 0.001 0.00001 0.004
Fork Lift, 5,000 lbs 1 63 0.75 18 6,570 hours 0.59 0.02 g/hp-hr 0.001 0.00001 0.005
Fork Lift, 3,000 lbs 2 50 0.75 18 6,570 hours 0.59 0.02 g/hp-hr 0.002 0.00002 0.009
Flat Bed Trucks, 10 tons 2 350 0.75 18 6,570 hours 0.43 0.01 g/hp-hr 0.005 0.00006 0.02
Dump Truck, 10 tons 1 250 0.34 8 3,000 VMT 0.43 0.2117 g/mile 0.0002 0.000002 0.0007
Mobile Hydraulic Crane, 60 tons 1 267 0.75 18 6,570 hours 0.43 0.01 g/hp-hr 0.002 0.00002 0.008
Truck Shop Bridge Crane, 60 tons 1 75 0.75 18 6,570 hours 0.43 0.01 g/hp-hr 0.0005 0.000006 0.002
Truck Shop Bridge Crane, 25 tons 1 24 0.75 18 6,570 hours 0.43 0.30 g/hp-hr 0.005 0.00006 0.02
CS683 Soil Compactor / Roller 2 173 0.75 18 6,570 hours 0.4 0.01 g/hp-hr 0.002 0.00003 0.01
246C Skid Steer Loader 2 73 0.75 18 6,570 hours 0.3 0.02 g/hp-hr 0.001 0.00002 0.006
RH200/340 O & K Shovel / Hitachi EX5500 1 2,520 0.75 18 6,570 hours 0.59 0.03 g/hp-hr 0.07 0.0009 0.32
Off-Road Tire Handling Truck 1 450 0.86 21 7,500 VMT 0.43 0.2117 g/mile 0.0004 0.000005 0.002
Contractor Haul Trucks, 25 tons 2 511 2.74 66 24,000 VMT 0.43 0.2117 g/mile 0.003 0.00003 0.01
Motivator for Mine Shovels 1 3,308 0.91 22 8,000 hours 0.43 0.02 g/hp-hr 0.06 0.0007 0.25
Storm Water Pond Pump 1 200 1.00 24 500 hours 1 0.01 g/hp-hr 0.004 0.00005 0.001
Mine Pit Dewatering Pump 4 100 1.00 24 500 hours 1 0.01 g/hp-hr 0.009 0.0001 0.002
Copper Concentrate Shipment Vehicles -- 450 29.60 1,021 169,872 VMT 0.43 0.2117 g/mile 0.01 0.0002 0.04
Rosemont Copper ProjectEmission Inventory Information JBR ENVIRONMENTAL CONSULTANTS, INC.
November 2011Page H38
AZRP00220

Hourly Daily AnnualTier 2/Tier 4 (Final) Emission Standards or Mobile 6 Output
Units lb/hr tpd tpyLoad
Factor
PM/TSP Emission Factors PM/TSP Emissions - Year 1
Table H.10 PM/TSP Emissions from Fuel Burning Mobile Engines - Year 1
Fuel Burning Mobile Engine Description a
Fleet Size
HP Rating
Process Rates b - Year 1
Units
Molybdenum Concentrate Shipment Vehicles -- 450 7.40 15 2,145 VMT 0.43 0.2117 g/mile 0.003 0.000004 0.0005
Sulfuric Acid Delivery Vehicles -- 450 22.20 143 52,021 VMT 0.43 0.2117 g/mile 0.01 0.00003 0.01
Lime Delivery Vehicles -- 450 14.80 52 19,072 VMT 0.43 0.2117 g/mile 0.007 0.00001 0.004
SAG Mill and Ball Mill Grinding Balls Delivery Vehicles -- 450 14.80 23 5,858 VMT 0.43 0.2117 g/mile 0.007 0.000005 0.001
Diesel Fuel Delivery Vehicles -- 500 14.80 47 17,136 VMT 0.43 0.2117 g/mile 0.007 0.00001 0.004
Copper Cathode Shipment Vehicles -- 450 14.80 42 4,997 VMT 0.43 0.2117 g/mile 0.007 0.00001 0.001
Ammonium Nitrate Delivery Vehicles -- 450 7.40 25 6,384 VMT 0.43 0.2117 g/mile 0.003 0.000006 0.001
Miscellaneous Consumables Delivery Vehicles -- 450 7.40 48 12,486 VMT 0.43 0.2117 g/mile 0.003 0.00001 0.003
Miscellaneous Fuels and Lubricants Delivery Vehicles -- 450 7.40 7 1,110 VMT 0.43 0.2117 g/mile 0.003 0.000002 0.0003
Pickup Trucks (gasoline) 20 350 1.37 33 12,000 VMT 0.54 0.0255 g/mile 0.002 0.00002 0.007
Crew Van (gasoline) 3 350 0.91 22 8,000 VMT 0.54 0.0255 g/mile 0.0002 0.000002 0.0007
Lot Pick-Up Trucks (gasoline) 20 250 0.34 8 3,000 VMT 0.54 0.0255 g/mile 0.0004 0.000005 0.002
8.69 0.10 28.69
1.24 0.01 5.16
9.93 0.12 33.85
a Fuel burning mobile engines are diesel fuel fired unless otherwise noted.
b Except for the shipment and delivery vehicles, the process rates are for a single mobile engine. The process rates for the shipment and delivery vehicles are representative of the entire fleet.
Total Emissions from Haul Truck Engines:
Total Emissions from Other Mobile Engines:
Total Emissions from All Mobile Engines:
Rosemont Copper ProjectEmission Inventory Information JBR ENVIRONMENTAL CONSULTANTS, INC.
November 2011Page H39
AZRP00221

Hourly Daily AnnualTier 2/Tier 4 (Final) Emission Standards or Mobile 6 Output
Units lb/hr tpd tpy
Haulage Trucks, 250 tons 31 2,650 1.00 24 6,600 hours 0.32 0.15 g/hp-hr 8.69 0.10 28.69
Crawler Dozers, D11T Class 3 850 0.46 11 4,000 hours 0.575 0.03 g/hp-hr 0.04 0.0005 0.19
Crawler Dozers, D10T Class 3 580 0.68 16 6,000 hours 0.575 0.01 g/hp-hr 0.02 0.0002 0.07
Crawler Dozer, D8T Class 1 310 0.75 18 6,570 hours 0.575 0.01 g/hp-hr 0.003 0.00004 0.01
Rubber Tired Dozers, 834H Class 3 498 0.70 17 6,150 hours 0.575 0.01 g/hp-hr 0.01 0.0002 0.06
Motor Graders, 24M Class 1 533 0.68 16 6,000 hours 0.575 0.01 g/hp-hr 0.005 0.00006 0.02
Motor Graders, 16M Class 3 297 0.68 16 6,000 hours 0.575 0.01 g/hp-hr 0.008 0.00009 0.03
Water Trucks, 30,000 gallons 4 1,348 0.37 9 3,250 hours 0.35 0.03 g/hp-hr 0.05 0.0006 0.20
Diesel Blasthole Drill, 12.25 inches 2 1,500 0.75 18 6,570 hours 0.43 0.03 g/hp-hr 0.06 0.0008 0.28
Hydraulic DML 45 Drill 1 425 0.75 18 6,570 hours 0.43 0.01 g/hp-hr 0.003 0.00004 0.01
Front End Loaders 2 2,000 0.90 22 7,884 hours 0.59 0.15 g/hp-hr 0.70 0.008 3.08
Stemming Truck 2 450 0.75 18 6,570 hours 0.43 0.01 g/hp-hr 0.006 0.00008 0.03
ANFO/Slurry Truck, 20 tons 2 450 0.75 18 6,570 hours 0.43 0.01 g/hp-hr 0.006 0.00008 0.03
Powder Truck, 2 tons 2 350 0.75 18 6,570 hours 0.43 0.01 g/hp-hr 0.005 0.00006 0.02
Front End Loaders, 8 yd3 2 262 0.75 18 6,570 hours 0.575 0.01 g/hp-hr 0.005 0.00006 0.02
Hydraulic Excavator, 385 Cat CL 2 513 0.90 22 7,884 hours 0.35 0.01 g/hp-hr 0.007 0.00009 0.03
Backhoe/Loader, 2 yd3 1 124 0.75 18 6,570 hours 0.35 0.01 g/hp-hr 0.0007 0.000009 0.003
Load Factor
PM10 Emission Factor PM10 Emissions - Year 1
Table H.11 PM10 Emissions from Fuel Burning Mobile Engines - Year 1
Fuel Burning Mobile Engine Description a
Fleet Size
HP Rating
Process Rates b - Year 1
Units
Rosemont Copper ProjectEmission Inventory Information JBR ENVIRONMENTAL CONSULTANTS, INC.
November 2011Page H40
AZRP00222

Hourly Daily AnnualTier 2/Tier 4 (Final) Emission Standards or Mobile 6 Output
Units lb/hr tpd tpyLoad
Factor
PM10 Emission Factor PM10 Emissions - Year 1
Table H.11 PM10 Emissions from Fuel Burning Mobile Engines - Year 1
Fuel Burning Mobile Engine Description a
Fleet Size
HP Rating
Process Rates b - Year 1
Units
All-Terrain Crane, 75 tons 1 230 0.75 18 6,570 hours 0.43 0.01 g/hp-hr 0.002 0.00002 0.007
Transporter with Tractor, 200 tons 1 1,350 0.75 18 6,570 hours 0.59 0.03 g/hp-hr 0.04 0.0005 0.17
Fuel/Lube Trucks, 6,000 gallons 2 703 0.75 18 6,570 hours 0.35 0.01 g/hp-hr 0.008 0.0001 0.04
Mechanic Field Service Trucks 5 370 1.71 41 15,000 VMT 0.43 0.2117 g/mile 0.004 0.00005 0.02
Tire Handler 1 90 0.11 3 1,000 VMT 0.43 0.2117 g/mile 0.00005 0.0000006 0.0002
Shop Forklift, 12,000 lbs 1 90 0.75 18 6,570 hours 0.59 0.01 g/hp-hr 0.0009 0.00001 0.004
Integrated Tool Carrier, 140 hp 1 138 0.75 18 6,570 hours 0.59 0.01 g/hp-hr 0.001 0.00002 0.006
Light Plant, 6 kW 15 35 0.40 10 3,504 hours 0.43 0.02 g/hp-hr 0.004 0.00005 0.02
Primary Crushing Mobile Crane - 400 tons 1 320 0.75 18 6,570 hours 0.43 0.01 g/hp-hr 0.002 0.00003 0.01
Copper Concentrate Area Front End Loader - Cat 930 1 160 0.75 18 6,570 hours 0.59 0.01 g/hp-hr 0.002 0.00002 0.007
Molybdenum Packaging Forklift, 7,000 lbs 1 93 0.75 18 6,570 hours 0.59 0.01 g/hp-hr 0.0009 0.00001 0.004
Copper Cathode Forklift 1 92.5 0.75 18 6,570 hours 0.59 0.01 g/hp-hr 0.0009 0.00001 0.004
Boom Trucks 10 tons, 45 foot boom 1 200 0.75 18 6,570 hours 0.21 0.01 g/hp-hr 0.0007 0.000008 0.003
Boom Trucks 15 tons, 60 foot boom 1 210 0.75 18 6,570 hours 0.21 0.01 g/hp-hr 0.0007 0.000009 0.003
Front End Loader, 6 yd3 1 349 0.75 18 6,570 hours 0.35 0.01 g/hp-hr 0.002 0.00002 0.009
Front End Loader, 5 yd3 1 149 0.75 18 6,570 hours 0.25 0.01 g/hp-hr 0.0006 0.000007 0.003
Bob Cats, 2,400 lbs 2 82 0.75 18 6,570 hours 0.59 0.01 g/hp-hr 0.002 0.00002 0.007
Rosemont Copper ProjectEmission Inventory Information JBR ENVIRONMENTAL CONSULTANTS, INC.
November 2011Page H41
AZRP00223

Hourly Daily AnnualTier 2/Tier 4 (Final) Emission Standards or Mobile 6 Output
Units lb/hr tpd tpyLoad
Factor
PM10 Emission Factor PM10 Emissions - Year 1
Table H.11 PM10 Emissions from Fuel Burning Mobile Engines - Year 1
Fuel Burning Mobile Engine Description a
Fleet Size
HP Rating
Process Rates b - Year 1
Units
Fork Lift, 2,000 lbs 1 50 0.75 18 6,570 hours 0.59 0.02 g/hp-hr 0.001 0.00001 0.004
Fork Lift, 5,000 lbs 1 63 0.75 18 6,570 hours 0.59 0.02 g/hp-hr 0.001 0.00001 0.005
Fork Lift, 3,000 lbs 2 50 0.75 18 6,570 hours 0.59 0.02 g/hp-hr 0.002 0.00002 0.009
Flat Bed Trucks, 10 tons 2 350 0.75 18 6,570 hours 0.43 0.01 g/hp-hr 0.005 0.00006 0.02
Dump Truck, 10 tons 1 250 0.34 8 3,000 VMT 0.43 0.2117 g/mile 0.0002 0.000002 0.0007
Mobile Hydraulic Crane, 60 tons 1 267 0.75 18 6,570 hours 0.43 0.01 g/hp-hr 0.002 0.00002 0.008
Truck Shop Bridge Crane, 60 tons 1 75 0.75 18 6,570 hours 0.43 0.01 g/hp-hr 0.0005 0.000006 0.002
Truck Shop Bridge Crane, 25 tons 1 24.1 0.75 18 6,570 hours 0.43 0.30 g/hp-hr 0.005 0.00006 0.02
CS683 Soil Compactor / Roller 2 173 0.75 18 6,570 hours 0.40 0.01 g/hp-hr 0.002 0.00003 0.01
246C Skid Steer Loader 2 73 0.75 18 6,570 hours 0.30 0.02 g/hp-hr 0.001 0.00002 0.006
RH200/340 O & K Shovel / Hitachi EX5500 1 2,520 0.75 18 6,570 hours 0.59 0.03 g/hp-hr 0.07 0.0009 0.32
Off-Road Tire Handling Truck 1 450 0.86 21 7,500 VMT 0.43 0.2117 g/mile 0.0004 0.000005 0.002
Contractor Haul Trucks, 25 tons 2 511 2.74 66 24,000 VMT 0.43 0.2117 g/mile 0.003 0.00003 0.01
Motivator for Mine Shovels 1 3,308 0.91 22 8,000 hours 0.43 0.02 g/hp-hr 0.06 0.0007 0.25
Storm Water Pond Pump 1 200 1.00 24 500 hours 1 0.01 g/hp-hr 0.004 0.00005 0.001
Mine Pit Dewatering Pump 4 100 1.00 24 500 hours 1 0.01 g/hp-hr 0.009 0.0001 0.002
Copper Concentrate Shipment Vehicles -- 450 29.60 1,021 169,872 VMT 0.43 0.2117 g/mile 0.01 0.0002 0.04
Rosemont Copper ProjectEmission Inventory Information JBR ENVIRONMENTAL CONSULTANTS, INC.
November 2011Page H42
AZRP00224

Hourly Daily AnnualTier 2/Tier 4 (Final) Emission Standards or Mobile 6 Output
Units lb/hr tpd tpyLoad
Factor
PM10 Emission Factor PM10 Emissions - Year 1
Table H.11 PM10 Emissions from Fuel Burning Mobile Engines - Year 1
Fuel Burning Mobile Engine Description a
Fleet Size
HP Rating
Process Rates b - Year 1
Units
Molybdenum Concentrate Shipment Vehicles -- 450 7.40 15 2,145 VMT 0.43 0.2117 g/mile 0.003 0.000004 0.0005
Sulfuric Acid Delivery Vehicles -- 450 22.20 143 52,021 VMT 0.43 0.2117 g/mile 0.01 0.00003 0.01
Lime Delivery Vehicles -- 450 14.80 52 19,072 VMT 0.43 0.2117 g/mile 0.007 0.00001 0.004
SAG Mill and Ball Mill Grinding Balls Delivery Vehicles -- 450 14.80 23 5,858 VMT 0.43 0.2117 g/mile 0.007 0.000005 0.001
Diesel Fuel Delivery Vehicles -- 500 14.80 47 17,136 VMT 0.43 0.2117 g/mile 0.007 0.00001 0.004
Copper Cathode Shipment Vehicles -- 450 14.80 42 4,997 VMT 0.43 0.2117 g/mile 0.007 0.00001 0.001
Ammonium Nitrate Delivery Vehicles -- 450 7.40 25 6,384 VMT 0.43 0.2117 g/mile 0.003 0.000006 0.001
Miscellaneous Consumables Delivery Vehicles -- 450 7.40 48 12,486 VMT 0.43 0.2117 g/mile 0.003 0.00001 0.003
Miscellaneous Fuels and Lubricants Delivery Vehicles -- 450 7.40 7 1,110 VMT 0.43 0.2117 g/mile 0.003 0.000002 0.0003
Pickup Trucks (gasoline) 20 350 1.37 33 12,000 VMT 0.54 0.0255 g/mile 0.002 0.00002 0.007
Crew Van (gasoline) 3 350 0.91 22 8,000 VMT 0.54 0.0255 g/mile 0.0002 0.000002 0.0007
Lot Pick-Up Trucks (gasoline) 20 250 0.34 8 3,000 VMT 0.54 0.0255 g/mile 0.0004 0.000005 0.002
8.69 0.10 28.69
1.24 0.01 5.16
9.93 0.12 33.85
a Fuel burning mobile engines are diesel fuel fired unless otherwise noted.
b Except for the shipment and delivery vehicles, the process rates are for a single mobile engine. The process rates for the shipment and delivery vehicles are representative of the entire fleet.
Total Emissions from Haul Truck Engines:
Total Emissions from Other Mobile Engines:
Total Emissions from All Mobile Engies:
Rosemont Copper ProjectEmission Inventory Information JBR ENVIRONMENTAL CONSULTANTS, INC.
November 2011Page H43
AZRP00225

Hourly Daily AnnualTier 2/Tier 4 (Final) Emission Standards or Mobile 6 Output
Units lb/hr tpd tpy
Haulage Trucks, 250 tons 31 2,650 1.00 24 6,600 hours 0.32 0.15 g/hp-hr 8.69 0.10 28.69
Crawler Dozers, D11T Class 3 850 0.46 11 4,000 hours 0.575 0.03 g/hp-hr 0.04 0.0005 0.19
Crawler Dozers, D10T Class 3 580 0.68 16 6,000 hours 0.575 0.01 g/hp-hr 0.02 0.0002 0.07
Crawler Dozer, D8T Class 1 310 0.75 18 6,570 hours 0.575 0.01 g/hp-hr 0.003 0.00004 0.01
Rubber Tired Dozers, 834H Class 3 498 0.70 17 6,150 hours 0.575 0.01 g/hp-hr 0.01 0.0002 0.06
Motor Graders, 24M Class 1 533 0.68 16 6,000 hours 0.575 0.01 g/hp-hr 0.005 0.00006 0.02
Motor Graders, 16M Class 3 297 0.68 16 6,000 hours 0.575 0.01 g/hp-hr 0.008 0.00009 0.03
Water Trucks, 30,000 gallons 4 1,348 0.37 9 3,250 hours 0.35 0.03 g/hp-hr 0.05 0.0006 0.20
Diesel Blasthole Drill, 12.25 inches 2 1,500 0.75 18 6,570 hours 0.43 0.03 g/hp-hr 0.06 0.0008 0.28
Hydraulic DML 45 Drill 1 425 0.75 18 6,570 hours 0.43 0.01 g/hp-hr 0.003 0.00004 0.01
Front End Loaders 2 2,000 0.90 22 7,884 hours 0.59 0.15 g/hp-hr 0.70 0.008 3.08
Stemming Truck 2 450 0.75 18 6,570 hours 0.43 0.01 g/hp-hr 0.006 0.00008 0.03
ANFO/Slurry Truck, 20 tons 2 450 0.75 18 6,570 hours 0.43 0.01 g/hp-hr 0.006 0.00008 0.03
Powder Truck, 2 tons 2 350 0.75 18 6,570 hours 0.43 0.01 g/hp-hr 0.005 0.00006 0.02
Front End Loaders, 8 yd3 2 262 0.75 18 6,570 hours 0.575 0.01 g/hp-hr 0.005 0.00006 0.02
Hydraulic Excavator, 385 Cat CL 2 513 0.90 22 7,884 hours 0.35 0.01 g/hp-hr 0.007 0.00009 0.03
Backhoe/Loader, 2 yd3 1 124 0.75 18 6,570 hours 0.35 0.01 g/hp-hr 0.0007 0.000009 0.003
Load Factor
PM2.5 Emission Factor PM2.5 Emissions - Year 1
Table H.12 PM2.5 Emissions from Fuel Burning Mobile Engines - Year 1
Fuel Burning Mobile Engine Description a
Fleet Size
HP Rating
Process Rates b - Year 1
Units
Rosemont Copper ProjectEmission Inventory Information JBR ENVIRONMENTAL CONSULTANTS, INC.
November 2011Page H44
AZRP00226

Hourly Daily AnnualTier 2/Tier 4 (Final) Emission Standards or Mobile 6 Output
Units lb/hr tpd tpyLoad
Factor
PM2.5 Emission Factor PM2.5 Emissions - Year 1
Table H.12 PM2.5 Emissions from Fuel Burning Mobile Engines - Year 1
Fuel Burning Mobile Engine Description a
Fleet Size
HP Rating
Process Rates b - Year 1
Units
All-Terrain Crane, 75 tons 1 230 0.75 18 6,570 hours 0.43 0.01 g/hp-hr 0.002 0.00002 0.007
Transporter with Tractor, 200 tons 1 1,350 0.75 18 6,570 hours 0.59 0.03 g/hp-hr 0.04 0.0005 0.17
Fuel/Lube Trucks, 6,000 gallons 2 703 0.75 18 6,570 hours 0.35 0.01 g/hp-hr 0.008 0.0001 0.04
Mechanic Field Service Trucks 5 370 1.71 41 15,000 VMT 0.43 0.2117 g/mile 0.004 0.00005 0.02
Tire Handler 1 90 0.11 3 1,000 VMT 0.43 0.2117 g/mile 0.00005 0.0000006 0.0002
Shop Forklift, 12,000 lbs 1 90 0.75 18 6,570 hours 0.59 0.01 g/hp-hr 0.0009 0.00001 0.004
Integrated Tool Carrier, 140 hp 1 138 0.75 18 6,570 hours 0.59 0.01 g/hp-hr 0.001 0.00002 0.006
Light Plant, 6 kW 15 35 0.40 10 3,504 hours 0.43 0.02 g/hp-hr 0.004 0.00005 0.02
Primary Crushing Mobile Crane - 400 tons 1 320 0.75 18 6,570 hours 0.43 0.01 g/hp-hr 0.002 0.00003 0.01
Copper Concentrate Area Front End Loader - Cat 930 1 160 0.75 18 6,570 hours 0.59 0.01 g/hp-hr 0.002 0.00002 0.007
Molybdenum Packaging Forklift, 7,000 lbs 1 93 0.75 18 6,570 hours 0.59 0.01 g/hp-hr 0.0009 0.00001 0.004
Copper Cathode Forklift 1 93 0.75 18 6,570 hours 0.59 0.01 g/hp-hr 0.0009 0.00001 0.004
Boom Trucks 10 tons, 45 foot boom 1 200 0.75 18 6,570 hours 0.21 0.01 g/hp-hr 0.0007 0.000008 0.003
Boom Trucks 15 tons, 60 foot boom 1 210 0.75 18 6,570 hours 0.21 0.01 g/hp-hr 0.0007 0.000009 0.003
Front End Loader, 6 yd3 1 349 0.75 18 6,570 hours 0.35 0.01 g/hp-hr 0.002 0.00002 0.009
Front End Loader, 5 yd3 1 149 0.75 18 6,570 hours 0.25 0.01 g/hp-hr 0.0006 0.000007 0.003
Bob Cats, 2,400 lbs 2 82 0.75 18 6,570 hours 0.59 0.01 g/hp-hr 0.002 0.00002 0.007
Rosemont Copper ProjectEmission Inventory Information JBR ENVIRONMENTAL CONSULTANTS, INC.
November 2011Page H45
AZRP00227

Hourly Daily AnnualTier 2/Tier 4 (Final) Emission Standards or Mobile 6 Output
Units lb/hr tpd tpyLoad
Factor
PM2.5 Emission Factor PM2.5 Emissions - Year 1
Table H.12 PM2.5 Emissions from Fuel Burning Mobile Engines - Year 1
Fuel Burning Mobile Engine Description a
Fleet Size
HP Rating
Process Rates b - Year 1
Units
Fork Lift, 2,000 lbs 1 50 0.75 18 6,570 hours 0.59 0.02 g/hp-hr 0.001 0.00001 0.004
Fork Lift, 5,000 lbs 1 63 0.75 18 6,570 hours 0.59 0.02 g/hp-hr 0.001 0.00001 0.005
Fork Lift, 3,000 lbs 2 50 0.75 18 6,570 hours 0.59 0.02 g/hp-hr 0.002 0.00002 0.009
Flat Bed Trucks, 10 tons 2 350 0.75 18 6,570 hours 0.43 0.01 g/hp-hr 0.005 0.00006 0.02
Dump Truck, 10 tons 1 250 0.34 8 3,000 VMT 0.43 0.2117 g/mile 0.0002 0.000002 0.0007
Mobile Hydraulic Crane, 60 tons 1 267 0.75 18 6,570 hours 0.43 0.01 g/hp-hr 0.002 0.00002 0.008
Truck Shop Bridge Crane, 60 tons 1 75 0.75 18 6,570 hours 0.43 0.01 g/hp-hr 0.0005 0.000006 0.002
Truck Shop Bridge Crane, 25 tons 1 24 0.75 18 6,570 hours 0.43 0.30 g/hp-hr 0.005 0.00006 0.02
CS683 Soil Compactor / Roller 2 173 0.75 18 6,570 hours 0.4 0.01 g/hp-hr 0.002 0.00003 0.01
246C Skid Steer Loader 2 73 0.75 18 6,570 hours 0.3 0.02 g/hp-hr 0.001 0.00002 0.006
RH200/340 O & K Shovel / Hitachi EX5500 1 2,520 0.75 18 6,570 hours 0.59 0.03 g/hp-hr 0.07 0.0009 0.32
Off-Road Tire Handling Truck 1 450 0.86 21 7,500 VMT 0.43 0.2117 g/mile 0.0004 0.000005 0.002
Contractor Haul Trucks, 25 tons 2 511 2.74 66 24,000 VMT 0.43 0.2117 g/mile 0.003 0.00003 0.01
Motivator for Mine Shovels 1 3,308 0.91 22 8,000 hours 0.43 0.02 g/hp-hr 0.06 0.0007 0.25
Storm Water Pond Pump 1 200 1.00 24 500 hours 1 0.01 g/hp-hr 0.004 0.00005 0.001
Mine Pit Dewatering Pump 4 100 1.00 24 500 hours 1 0.01 g/hp-hr 0.009 0.0001 0.002
Copper Concentrate Shipment Vehicles -- 450 29.60 1,021 169,872 VMT 0.43 0.2117 g/mile 0.01 0.0002 0.04
Rosemont Copper ProjectEmission Inventory Information JBR ENVIRONMENTAL CONSULTANTS, INC.
November 2011Page H46
AZRP00228

Hourly Daily AnnualTier 2/Tier 4 (Final) Emission Standards or Mobile 6 Output
Units lb/hr tpd tpyLoad
Factor
PM2.5 Emission Factor PM2.5 Emissions - Year 1
Table H.12 PM2.5 Emissions from Fuel Burning Mobile Engines - Year 1
Fuel Burning Mobile Engine Description a
Fleet Size
HP Rating
Process Rates b - Year 1
Units
Molybdenum Concentrate Shipment Vehicles -- 450 7.40 15 2,145 VMT 0.43 0.2117 g/mile 0.003 0.000004 0.0005
Sulfuric Acid Delivery Vehicles -- 450 22.20 143 52,021 VMT 0.43 0.2117 g/mile 0.01 0.00003 0.01
Lime Delivery Vehicles -- 450 14.80 52 19,072 VMT 0.43 0.2117 g/mile 0.007 0.00001 0.004
SAG Mill and Ball Mill Grinding Balls Delivery Vehicles -- 450 14.80 23 5,858 VMT 0.43 0.2117 g/mile 0.007 0.000005 0.001
Diesel Fuel Delivery Vehicles -- 500 14.80 47 17,136 VMT 0.43 0.2117 g/mile 0.007 0.00001 0.004
Copper Cathode Shipment Vehicles -- 450 14.80 42 4,997 VMT 0.43 0.2117 g/mile 0.007 0.00001 0.001
Ammonium Nitrate Delivery Vehicles -- 450 7.40 25 6,384 VMT 0.43 0.2117 g/mile 0.003 0.000006 0.001
Miscellaneous Consumables Delivery Vehicles -- 450 7.40 48 12,486 VMT 0.43 0.2117 g/mile 0.003 0.00001 0.003
Miscellaneous Fuels and Lubricants Delivery Vehicles -- 450 7.40 7 1,110 VMT 0.43 0.2117 g/mile 0.003 0.000002 0.0003
Pickup Trucks (gasoline) 20 350 1.37 33 12,000 VMT 0.54 0.0255 g/mile 0.002 0.00002 0.007
Crew Van (gasoline) 3 350 0.91 22 8,000 VMT 0.54 0.0255 g/mile 0.0002 0.000002 0.0007
Lot Pick-Up Trucks (gasoline) 20 250 0.34 8 3,000 VMT 0.54 0.0255 g/mile 0.0004 0.000005 0.002
8.69 0.10 28.69
1.24 0.01 5.16
9.93 0.12 33.85
a Fuel burning mobile engines are diesel fuel fired unless otherwise noted.
b Except for the shipment and delivery vehicles, the process rates are for a single mobile engine. The process rates for the shipment and delivery vehicles are representative of the entire fleet.
Total Emissions from Haul Truck Engines:
Total Emissions from Other Mobile Engines:
Total Emissions from All Mobile Engines:
Rosemont Copper ProjectEmission Inventory Information JBR ENVIRONMENTAL CONSULTANTS, INC.
November 2011Page H47
AZRP00229

Hourly Daily AnnualTier 2/Tier 3 Emission Standards or Mobile 6
OutputUnits lb/hr tpd tpy
Haulage Trucks, 250 tons 31 2,650 1.00 24 6,600 hours 0.32 2.60 g/hp-hr 150.68 1.81 497.25
Crawler Dozers, D11T Class 3 850 0.46 11 4,000 hours 0.575 2.60 g/hp-hr 3.84 0.05 16.81
Crawler Dozers, D10T Class 3 580 0.68 16 6,000 hours 0.575 2.60 g/hp-hr 3.93 0.05 17.20
Crawler Dozer, D8T Class 1 310 0.75 18 6,570 hours 0.575 2.60 g/hp-hr 0.77 0.009 3.36
Rubber Tired Dozers, 834H Class 3 498 0.70 17 6,150 hours 0.575 2.60 g/hp-hr 3.46 0.04 15.14
Motor Graders, 24M Class 1 533 0.68 16 6,000 hours 0.575 2.60 g/hp-hr 1.20 0.01 5.27
Motor Graders, 16M Class 3 297 0.68 16 6,000 hours 0.575 2.60 g/hp-hr 2.01 0.02 8.81
Water Trucks, 30,000 gallons 4 1,348 0.37 9 3,250 hours 0.35 2.60 g/hp-hr 4.01 0.05 17.58
Diesel Blasthole Drill, 12.25 inches 2 1,500 0.75 18 6,570 hours 0.43 2.60 g/hp-hr 5.55 0.07 24.29
Hydraulic DML 45 Drill 1 425 0.75 18 6,570 hours 0.43 2.60 g/hp-hr 0.79 0.009 3.44
Front End Loaders 2 2,000 0.90 22 7,884 hours 0.59 2.60 g/hp-hr 12.17 0.15 53.33
Stemming Truck 2 450 0.75 18 6,570 hours 0.43 2.60 g/hp-hr 1.66 0.02 7.29
ANFO/Slurry Truck, 20 tons 2 450 0.75 18 6,570 hours 0.43 2.60 g/hp-hr 1.66 0.02 7.29
Powder Truck, 2 tons 2 350 0.75 18 6,570 hours 0.43 2.60 g/hp-hr 1.29 0.02 5.67
Front End Loaders, 8 yd3 2 262 0.75 18 6,570 hours 0.575 2.60 g/hp-hr 1.30 0.02 5.67
Hydraulic Excavator, 385 Cat CL 2 513 0.90 22 7,884 hours 0.35 2.60 g/hp-hr 1.85 0.02 8.11
Backhoe/Loader, 2 yd3 1 124 0.75 18 6,570 hours 0.35 3.70 g/hp-hr 0.27 0.003 1.16
Load Factor
CO Emission Factor CO Emissions - Year 1
Table H.13 CO Emissions from Fuel Burning Mobile Engines - Year 1
Fuel Burning Mobile Engine Description a
Fleet Size
HP Rating
Process Rates b - Year 1
Units
Rosemont Copper ProjectEmission Inventory Information JBR ENVIRONMENTAL CONSULTANTS, INC.
November 2011Page H48
AZRP00230
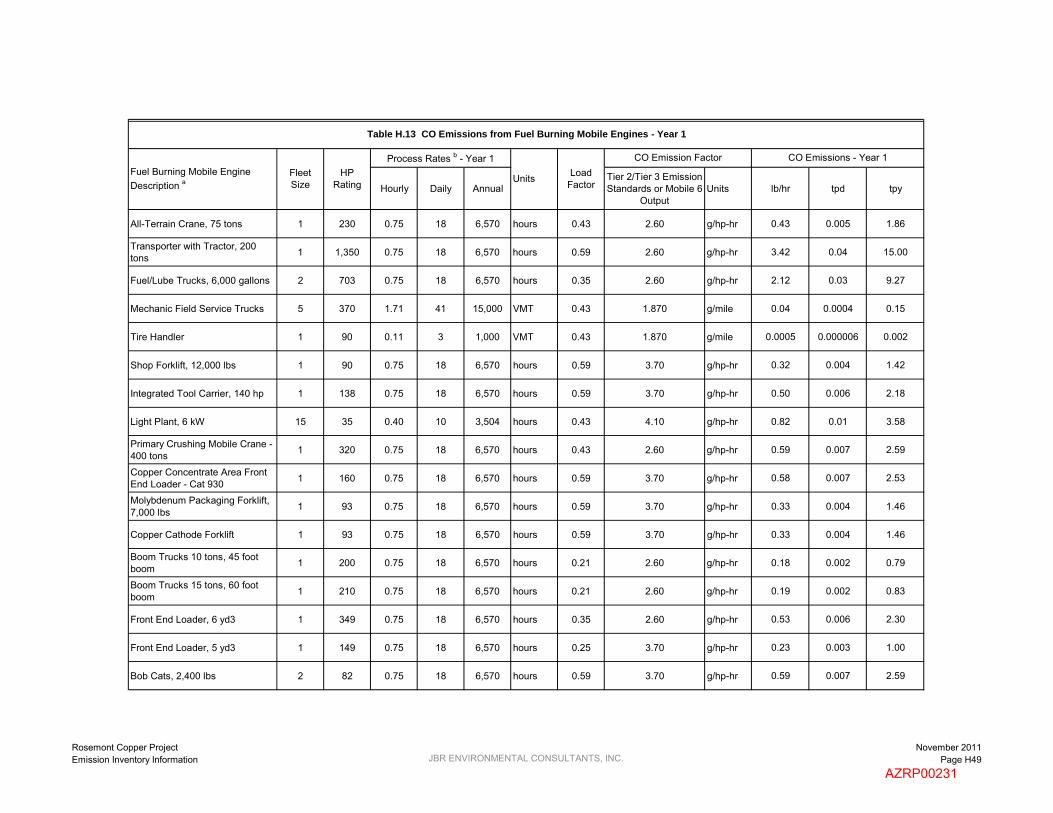
Hourly Daily AnnualTier 2/Tier 3 Emission Standards or Mobile 6
OutputUnits lb/hr tpd tpy
Load Factor
CO Emission Factor CO Emissions - Year 1
Table H.13 CO Emissions from Fuel Burning Mobile Engines - Year 1
Fuel Burning Mobile Engine Description a
Fleet Size
HP Rating
Process Rates b - Year 1
Units
All-Terrain Crane, 75 tons 1 230 0.75 18 6,570 hours 0.43 2.60 g/hp-hr 0.43 0.005 1.86
Transporter with Tractor, 200 tons 1 1,350 0.75 18 6,570 hours 0.59 2.60 g/hp-hr 3.42 0.04 15.00
Fuel/Lube Trucks, 6,000 gallons 2 703 0.75 18 6,570 hours 0.35 2.60 g/hp-hr 2.12 0.03 9.27
Mechanic Field Service Trucks 5 370 1.71 41 15,000 VMT 0.43 1.870 g/mile 0.04 0.0004 0.15
Tire Handler 1 90 0.11 3 1,000 VMT 0.43 1.870 g/mile 0.0005 0.000006 0.002
Shop Forklift, 12,000 lbs 1 90 0.75 18 6,570 hours 0.59 3.70 g/hp-hr 0.32 0.004 1.42
Integrated Tool Carrier, 140 hp 1 138 0.75 18 6,570 hours 0.59 3.70 g/hp-hr 0.50 0.006 2.18
Light Plant, 6 kW 15 35 0.40 10 3,504 hours 0.43 4.10 g/hp-hr 0.82 0.01 3.58
Primary Crushing Mobile Crane - 400 tons 1 320 0.75 18 6,570 hours 0.43 2.60 g/hp-hr 0.59 0.007 2.59
Copper Concentrate Area Front End Loader - Cat 930 1 160 0.75 18 6,570 hours 0.59 3.70 g/hp-hr 0.58 0.007 2.53
Molybdenum Packaging Forklift, 7,000 lbs 1 93 0.75 18 6,570 hours 0.59 3.70 g/hp-hr 0.33 0.004 1.46
Copper Cathode Forklift 1 93 0.75 18 6,570 hours 0.59 3.70 g/hp-hr 0.33 0.004 1.46
Boom Trucks 10 tons, 45 foot boom 1 200 0.75 18 6,570 hours 0.21 2.60 g/hp-hr 0.18 0.002 0.79
Boom Trucks 15 tons, 60 foot boom 1 210 0.75 18 6,570 hours 0.21 2.60 g/hp-hr 0.19 0.002 0.83
Front End Loader, 6 yd3 1 349 0.75 18 6,570 hours 0.35 2.60 g/hp-hr 0.53 0.006 2.30
Front End Loader, 5 yd3 1 149 0.75 18 6,570 hours 0.25 3.70 g/hp-hr 0.23 0.003 1.00
Bob Cats, 2,400 lbs 2 82 0.75 18 6,570 hours 0.59 3.70 g/hp-hr 0.59 0.007 2.59
Rosemont Copper ProjectEmission Inventory Information JBR ENVIRONMENTAL CONSULTANTS, INC.
November 2011Page H49
AZRP00231

Hourly Daily AnnualTier 2/Tier 3 Emission Standards or Mobile 6
OutputUnits lb/hr tpd tpy
Load Factor
CO Emission Factor CO Emissions - Year 1
Table H.13 CO Emissions from Fuel Burning Mobile Engines - Year 1
Fuel Burning Mobile Engine Description a
Fleet Size
HP Rating
Process Rates b - Year 1
Units
Fork Lift, 2,000 lbs 1 50 0.75 18 6,570 hours 0.59 3.70 g/hp-hr 0.18 0.002 0.79
Fork Lift, 5,000 lbs 1 63 0.75 18 6,570 hours 0.59 3.70 g/hp-hr 0.23 0.003 1.00
Fork Lift, 3,000 lbs 2 50 0.75 18 6,570 hours 0.59 3.70 g/hp-hr 0.36 0.004 1.58
Flat Bed Trucks, 10 tons 2 350 0.75 18 6,570 hours 0.43 2.60 g/hp-hr 1.29 0.02 5.67
Dump Truck, 10 tons 1 250 0.34 8 3,000 VMT 0.43 1.870 g/mile 0.001 0.00002 0.006
Mobile Hydraulic Crane, 60 tons 1 267 0.75 18 6,570 hours 0.43 2.60 g/hp-hr 0.49 0.006 2.16
Truck Shop Bridge Crane, 60 tons 1 75 0.75 18 6,570 hours 0.43 3.70 g/hp-hr 0.20 0.002 0.86
Truck Shop Bridge Crane, 25 tons 1 24 0.75 18 6,570 hours 0.43 4.90 g/hp-hr 0.08 0.001 0.37
CS683 Soil Compactor / Roller 2 173 0.75 18 6,570 hours 0.4 3.70 g/hp-hr 0.85 0.01 3.71
246C Skid Steer Loader 2 73 0.75 18 6,570 hours 0.3 3.70 g/hp-hr 0.27 0.003 1.17
RH200/340 O & K Shovel / Hitachi EX5500 1 2,520 0.75 18 6,570 hours 0.59 2.60 g/hp-hr 6.39 0.08 28.00
Off-Road Tire Handling Truck 1 450 0.86 21 7,500 VMT 0.43 1.870 g/mile 0.004 0.00004 0.02
Contractor Haul Trucks, 25 tons 2 511 2.74 66 24,000 VMT 0.43 1.870 g/mile 0.02 0.0003 0.10
Motivator for Mine Shovels 1 3,308 0.91 22 8,000 hours 0.43 2.60 g/hp-hr 7.45 0.09 32.61
Storm Water Pond Pump 1 200 1.00 24 500 hours 1 2.60 g/hp-hr 1.15 0.01 0.29
Mine Pit Dewatering Pump 4 100 1.00 24 500 hours 1 3.70 g/hp-hr 3.26 0.04 0.82
Copper Concentrate Shipment Vehicles -- 450 29.60 1,021 169,872 VMT 0.43 1.870 g/mile 0.12 0.002 0.35
Rosemont Copper ProjectEmission Inventory Information JBR ENVIRONMENTAL CONSULTANTS, INC.
November 2011Page H50
AZRP00232

Hourly Daily AnnualTier 2/Tier 3 Emission Standards or Mobile 6
OutputUnits lb/hr tpd tpy
Load Factor
CO Emission Factor CO Emissions - Year 1
Table H.13 CO Emissions from Fuel Burning Mobile Engines - Year 1
Fuel Burning Mobile Engine Description a
Fleet Size
HP Rating
Process Rates b - Year 1
Units
Molybdenum Concentrate Shipment Vehicles -- 450 7.40 15 2,145 VMT 0.43 1.870 g/mile 0.03 0.00003 0.004
Sulfuric Acid Delivery Vehicles -- 450 22.20 143 52,021 VMT 0.43 1.870 g/mile 0.09 0.0003 0.11
Lime Delivery Vehicles -- 450 14.80 52 19,072 VMT 0.43 1.870 g/mile 0.06 0.0001 0.04
SAG Mill and Ball Mill Grinding Balls Delivery Vehicles -- 450 14.80 23 5,858 VMT 0.43 1.870 g/mile 0.06 0.00005 0.01
Diesel Fuel Delivery Vehicles -- 500 14.80 47 17,136 VMT 0.43 1.870 g/mile 0.06 0.0001 0.04
Copper Cathode Shipment Vehicles -- 450 14.80 42 4,997 VMT 0.43 1.870 g/mile 0.06 0.00009 0.01
Ammonium Nitrate Delivery Vehicles -- 450 7.40 25 6,384 VMT 0.43 1.870 g/mile 0.03 0.00005 0.01
Miscellaneous Consumables Delivery Vehicles -- 450 7.40 48 12,486 VMT 0.43 1.870 g/mile 0.03 0.0001 0.03
Miscellaneous Fuels and Lubricants Delivery Vehicles -- 450 7.40 7 1,110 VMT 0.43 1.870 g/mile 0.03 0.00002 0.002
Pickup Trucks (gasoline) 20 350 1.37 33 12,000 VMT 0.54 15.51 g/mile 0.94 0.01 4.10
Crew Van (gasoline) 3 350 0.91 22 8,000 VMT 0.54 15.51 g/mile 0.09 0.001 0.41
Lot Pick-Up Trucks (gasoline) 20 250 0.34 8 3,000 VMT 0.54 15.51 g/mile 0.23 0.003 1.03
150.68 1.81 497.25
81.02 0.97 334.72
231.70 2.78 831.98
a Fuel burning mobile engines are diesel fuel fired unless otherwise noted.
b Except for the shipment and delivery vehicles, the process rates are for a single mobile engine. The process rates for the shipment and delivery vehicles are representative of the entire fleet.
Total Emissions from Haul Truck Engines:
Total Emissions from Other Mobile Engines:
Total Emissions from All Mobile Engines:
Rosemont Copper ProjectEmission Inventory Information JBR ENVIRONMENTAL CONSULTANTS, INC.
November 2011Page H51
AZRP00233
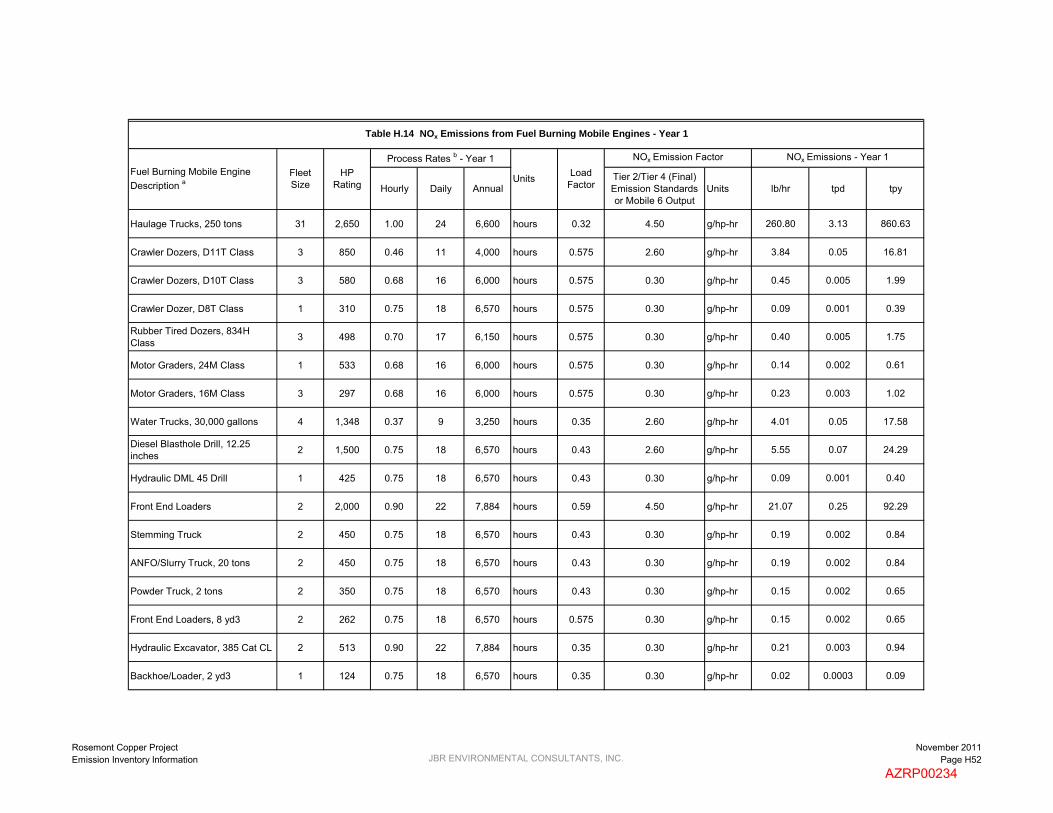
Hourly Daily AnnualTier 2/Tier 4 (Final) Emission Standards or Mobile 6 Output
Units lb/hr tpd tpy
Haulage Trucks, 250 tons 31 2,650 1.00 24 6,600 hours 0.32 4.50 g/hp-hr 260.80 3.13 860.63
Crawler Dozers, D11T Class 3 850 0.46 11 4,000 hours 0.575 2.60 g/hp-hr 3.84 0.05 16.81
Crawler Dozers, D10T Class 3 580 0.68 16 6,000 hours 0.575 0.30 g/hp-hr 0.45 0.005 1.99
Crawler Dozer, D8T Class 1 310 0.75 18 6,570 hours 0.575 0.30 g/hp-hr 0.09 0.001 0.39
Rubber Tired Dozers, 834H Class 3 498 0.70 17 6,150 hours 0.575 0.30 g/hp-hr 0.40 0.005 1.75
Motor Graders, 24M Class 1 533 0.68 16 6,000 hours 0.575 0.30 g/hp-hr 0.14 0.002 0.61
Motor Graders, 16M Class 3 297 0.68 16 6,000 hours 0.575 0.30 g/hp-hr 0.23 0.003 1.02
Water Trucks, 30,000 gallons 4 1,348 0.37 9 3,250 hours 0.35 2.60 g/hp-hr 4.01 0.05 17.58
Diesel Blasthole Drill, 12.25 inches 2 1,500 0.75 18 6,570 hours 0.43 2.60 g/hp-hr 5.55 0.07 24.29
Hydraulic DML 45 Drill 1 425 0.75 18 6,570 hours 0.43 0.30 g/hp-hr 0.09 0.001 0.40
Front End Loaders 2 2,000 0.90 22 7,884 hours 0.59 4.50 g/hp-hr 21.07 0.25 92.29
Stemming Truck 2 450 0.75 18 6,570 hours 0.43 0.30 g/hp-hr 0.19 0.002 0.84
ANFO/Slurry Truck, 20 tons 2 450 0.75 18 6,570 hours 0.43 0.30 g/hp-hr 0.19 0.002 0.84
Powder Truck, 2 tons 2 350 0.75 18 6,570 hours 0.43 0.30 g/hp-hr 0.15 0.002 0.65
Front End Loaders, 8 yd3 2 262 0.75 18 6,570 hours 0.575 0.30 g/hp-hr 0.15 0.002 0.65
Hydraulic Excavator, 385 Cat CL 2 513 0.90 22 7,884 hours 0.35 0.30 g/hp-hr 0.21 0.003 0.94
Backhoe/Loader, 2 yd3 1 124 0.75 18 6,570 hours 0.35 0.30 g/hp-hr 0.02 0.0003 0.09
Load Factor
NOx Emission Factor NOx Emissions - Year 1
Table H.14 NOx Emissions from Fuel Burning Mobile Engines - Year 1
Fuel Burning Mobile Engine Description a
Fleet Size
HP Rating
Process Rates b - Year 1
Units
Rosemont Copper ProjectEmission Inventory Information JBR ENVIRONMENTAL CONSULTANTS, INC.
November 2011Page H52
AZRP00234

Hourly Daily AnnualTier 2/Tier 4 (Final) Emission Standards or Mobile 6 Output
Units lb/hr tpd tpyLoad
Factor
NOx Emission Factor NOx Emissions - Year 1
Table H.14 NOx Emissions from Fuel Burning Mobile Engines - Year 1
Fuel Burning Mobile Engine Description a
Fleet Size
HP Rating
Process Rates b - Year 1
Units
All-Terrain Crane, 75 tons 1 230 0.75 18 6,570 hours 0.43 0.30 g/hp-hr 0.05 0.0006 0.21
Transporter with Tractor, 200 tons 1 1,350 0.75 18 6,570 hours 0.59 2.60 g/hp-hr 3.42 0.04 15.00
Fuel/Lube Trucks, 6,000 gallons 2 703 0.75 18 6,570 hours 0.35 0.30 g/hp-hr 0.24 0.003 1.07
Mechanic Field Service Trucks 5 370 1.71 41 15,000 VMT 0.43 7.394 g/mile 0.14 0.002 0.61
Tire Handler 1 90 0.11 3 1,000 VMT 0.43 7.394 g/mile 0.002 0.00002 0.008
Shop Forklift, 12,000 lbs 1 90 0.75 18 6,570 hours 0.59 0.30 g/hp-hr 0.03 0.0003 0.12
Integrated Tool Carrier, 140 hp 1 138 0.75 18 6,570 hours 0.59 0.30 g/hp-hr 0.04 0.0005 0.18
Light Plant, 6 kW 15 35 0.40 10 3,504 hours 0.43 3.30 g/hp-hr 0.66 0.008 2.88
Primary Crushing Mobile Crane - 400 tons 1 320 0.75 18 6,570 hours 0.43 0.30 g/hp-hr 0.07 0.0008 0.30
Copper Concentrate Area Front End Loader - Cat 930 1 160 0.75 18 6,570 hours 0.59 0.30 g/hp-hr 0.05 0.0006 0.21
Molybdenum Packaging Forklift, 7,000 lbs 1 93 0.75 18 6,570 hours 0.59 0.30 g/hp-hr 0.03 0.0003 0.12
Copper Cathode Forklift 1 93 0.75 18 6,570 hours 0.59 0.30 g/hp-hr 0.03 0.0003 0.12
Boom Trucks 10 tons, 45 foot boom 1 200 0.75 18 6,570 hours 0.21 0.30 g/hp-hr 0.02 0.0003 0.09
Boom Trucks 15 tons, 60 foot boom 1 210 0.75 18 6,570 hours 0.21 0.30 g/hp-hr 0.02 0.0003 0.10
Front End Loader, 6 yd3 1 349 0.75 18 6,570 hours 0.35 0.30 g/hp-hr 0.06 0.0007 0.27
Front End Loader, 5 yd3 1 149 0.75 18 6,570 hours 0.25 0.30 g/hp-hr 0.02 0.0002 0.08
Bob Cats, 2,400 lbs 2 82 0.75 18 6,570 hours 0.59 0.30 g/hp-hr 0.05 0.0006 0.21
Rosemont Copper ProjectEmission Inventory Information JBR ENVIRONMENTAL CONSULTANTS, INC.
November 2011Page H53
AZRP00235

Hourly Daily AnnualTier 2/Tier 4 (Final) Emission Standards or Mobile 6 Output
Units lb/hr tpd tpyLoad
Factor
NOx Emission Factor NOx Emissions - Year 1
Table H.14 NOx Emissions from Fuel Burning Mobile Engines - Year 1
Fuel Burning Mobile Engine Description a
Fleet Size
HP Rating
Process Rates b - Year 1
Units
Fork Lift, 2,000 lbs 1 50 0.75 18 6,570 hours 0.59 3.30 g/hp-hr 0.16 0.002 0.71
Fork Lift, 5,000 lbs 1 63 0.75 18 6,570 hours 0.59 3.30 g/hp-hr 0.20 0.002 0.89
Fork Lift, 3,000 lbs 2 50 0.75 18 6,570 hours 0.59 3.30 g/hp-hr 0.32 0.004 1.41
Flat Bed Trucks, 10 tons 2 350 0.75 18 6,570 hours 0.43 0.30 g/hp-hr 0.15 0.002 0.65
Dump Truck, 10 tons 1 250 0.34 8 3,000 VMT 0.43 7.394 g/mile 0.006 0.00007 0.02
Mobile Hydraulic Crane, 60 tons 1 267 0.75 18 6,570 hours 0.43 0.30 g/hp-hr 0.06 0.0007 0.25
Truck Shop Bridge Crane, 60 tons 1 75 0.75 18 6,570 hours 0.43 0.30 g/hp-hr 0.02 0.0002 0.07
Truck Shop Bridge Crane, 25 tons 1 24 0.75 18 6,570 hours 0.43 5.00 g/hp-hr 0.09 0.001 0.38
CS683 Soil Compactor / Roller 2 173 0.75 18 6,570 hours 0.4 0.30 g/hp-hr 0.07 0.0008 0.30
246C Skid Steer Loader 2 73 0.75 18 6,570 hours 0.3 3.30 g/hp-hr 0.24 0.003 1.05
RH200/340 O & K Shovel / Hitachi EX5500 1 2,520 0.75 18 6,570 hours 0.59 2.60 g/hp-hr 6.39 0.08 28.00
Off-Road Tire Handling Truck 1 450 0.86 21 7,500 VMT 0.43 7.394 g/mile 0.01 0.0002 0.06
Contractor Haul Trucks, 25 tons 2 511 2.74 66 24,000 VMT 0.43 7.394 g/mile 0.09 0.001 0.39
Motivator for Mine Shovels 1 3,308 0.91 22 8,000 hours 0.43 0.50 g/hp-hr 1.43 0.02 6.27
Storm Water Pond Pump 1 200 1.00 24 500 hours 1 0.30 g/hp-hr 0.13 0.002 0.03
Mine Pit Dewatering Pump 4 100 1.00 24 500 hours 1 0.30 g/hp-hr 0.26 0.003 0.07
Copper Concentrate Shipment Vehicles -- 450 29.60 1,021 169,872 VMT 0.43 7.394 g/mile 0.48 0.008 1.38
Rosemont Copper ProjectEmission Inventory Information JBR ENVIRONMENTAL CONSULTANTS, INC.
November 2011Page H54
AZRP00236

Hourly Daily AnnualTier 2/Tier 4 (Final) Emission Standards or Mobile 6 Output
Units lb/hr tpd tpyLoad
Factor
NOx Emission Factor NOx Emissions - Year 1
Table H.14 NOx Emissions from Fuel Burning Mobile Engines - Year 1
Fuel Burning Mobile Engine Description a
Fleet Size
HP Rating
Process Rates b - Year 1
Units
Molybdenum Concentrate Shipment Vehicles -- 450 7.40 15 2,145 VMT 0.43 7.394 g/mile 0.12 0.0001 0.02
Sulfuric Acid Delivery Vehicles -- 450 22.20 143 52,021 VMT 0.43 7.394 g/mile 0.36 0.001 0.42
Lime Delivery Vehicles -- 450 14.80 52 19,072 VMT 0.43 7.394 g/mile 0.24 0.0004 0.16
SAG Mill and Ball Mill Grinding Balls Delivery Vehicles -- 450 14.80 23 5,858 VMT 0.43 7.394 g/mile 0.24 0.0002 0.05
Diesel Fuel Delivery Vehicles -- 500 14.80 47 17,136 VMT 0.43 7.394 g/mile 0.24 0.0004 0.14
Copper Cathode Shipment Vehicles -- 450 14.80 42 4,997 VMT 0.43 7.394 g/mile 0.24 0.0003 0.04
Ammonium Nitrate Delivery Vehicles -- 450 7.40 25 6,384 VMT 0.43 7.394 g/mile 0.12 0.0002 0.05
Miscellaneous Consumables Delivery Vehicles -- 450 7.40 48 12,486 VMT 0.43 7.394 g/mile 0.12 0.0004 0.10
Miscellaneous Fuels and Lubricants Delivery Vehicles -- 450 7.40 7 1,110 VMT 0.43 7.394 g/mile 0.12 0.00006 0.009
Pickup Trucks (gasoline) 20 350 1.37 33 12,000 VMT 0.54 1.145 g/mile 0.07 0.0008 0.30
Crew Van (gasoline) 3 350 0.91 22 8,000 VMT 0.54 1.145 g/mile 0.007 0.00008 0.03
Lot Pick-Up Trucks (gasoline) 20 250 0.34 8 3,000 VMT 0.54 1.145 g/mile 0.02 0.0002 0.08
260.80 3.13 860.63
53.73 0.63 226.01
314.52 3.76 1,086.65
a Fuel burning mobile engines are diesel fuel fired unless otherwise noted.
b Except for the shipment and delivery vehicles, the process rates are for a single mobile engine. The process rates for the shipment and delivery vehicles are representative of the entire fleet.
Total Emissions from Haul Truck Engines:
Total Emissions from Other Mobile Engines:
Total Emissions from All Mobile Engines:
Rosemont Copper ProjectEmission Inventory Information JBR ENVIRONMENTAL CONSULTANTS, INC.
November 2011Page H55
AZRP00237
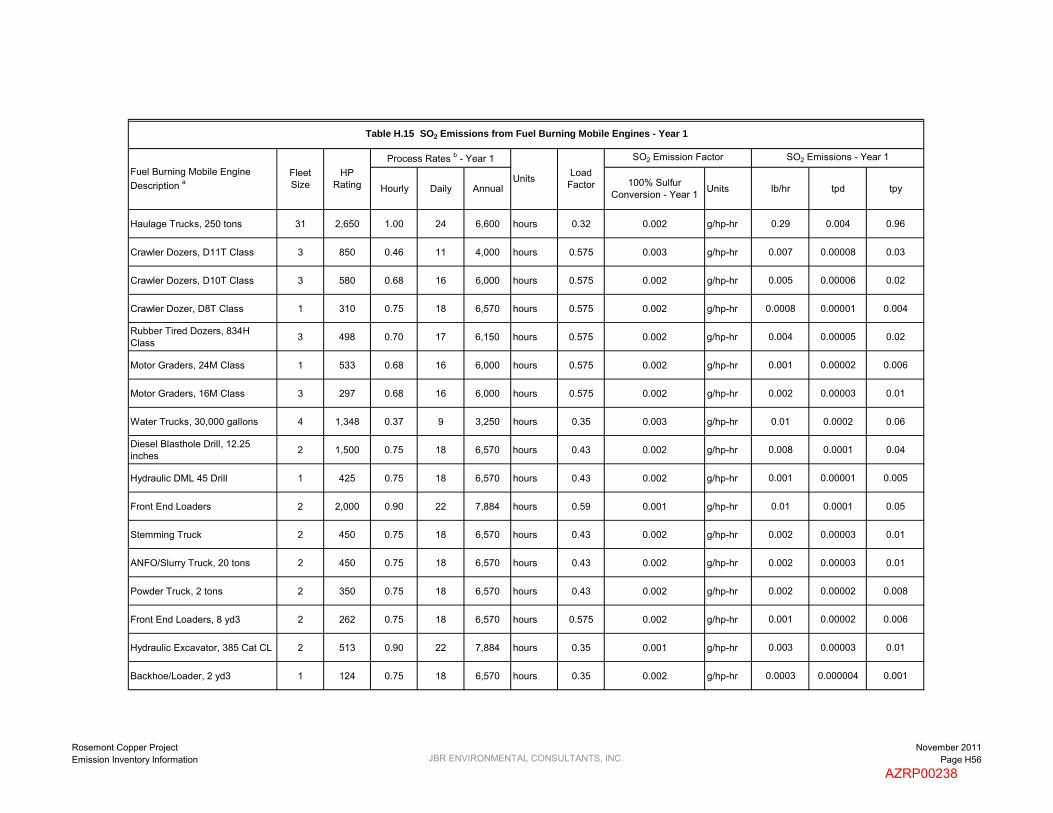
Hourly Daily Annual 100% Sulfur Conversion - Year 1 Units lb/hr tpd tpy
Haulage Trucks, 250 tons 31 2,650 1.00 24 6,600 hours 0.32 0.002 g/hp-hr 0.29 0.004 0.96
Crawler Dozers, D11T Class 3 850 0.46 11 4,000 hours 0.575 0.003 g/hp-hr 0.007 0.00008 0.03
Crawler Dozers, D10T Class 3 580 0.68 16 6,000 hours 0.575 0.002 g/hp-hr 0.005 0.00006 0.02
Crawler Dozer, D8T Class 1 310 0.75 18 6,570 hours 0.575 0.002 g/hp-hr 0.0008 0.00001 0.004
Rubber Tired Dozers, 834H Class 3 498 0.70 17 6,150 hours 0.575 0.002 g/hp-hr 0.004 0.00005 0.02
Motor Graders, 24M Class 1 533 0.68 16 6,000 hours 0.575 0.002 g/hp-hr 0.001 0.00002 0.006
Motor Graders, 16M Class 3 297 0.68 16 6,000 hours 0.575 0.002 g/hp-hr 0.002 0.00003 0.01
Water Trucks, 30,000 gallons 4 1,348 0.37 9 3,250 hours 0.35 0.003 g/hp-hr 0.01 0.0002 0.06
Diesel Blasthole Drill, 12.25 inches 2 1,500 0.75 18 6,570 hours 0.43 0.002 g/hp-hr 0.008 0.0001 0.04
Hydraulic DML 45 Drill 1 425 0.75 18 6,570 hours 0.43 0.002 g/hp-hr 0.001 0.00001 0.005
Front End Loaders 2 2,000 0.90 22 7,884 hours 0.59 0.001 g/hp-hr 0.01 0.0001 0.05
Stemming Truck 2 450 0.75 18 6,570 hours 0.43 0.002 g/hp-hr 0.002 0.00003 0.01
ANFO/Slurry Truck, 20 tons 2 450 0.75 18 6,570 hours 0.43 0.002 g/hp-hr 0.002 0.00003 0.01
Powder Truck, 2 tons 2 350 0.75 18 6,570 hours 0.43 0.002 g/hp-hr 0.002 0.00002 0.008
Front End Loaders, 8 yd3 2 262 0.75 18 6,570 hours 0.575 0.002 g/hp-hr 0.001 0.00002 0.006
Hydraulic Excavator, 385 Cat CL 2 513 0.90 22 7,884 hours 0.35 0.001 g/hp-hr 0.003 0.00003 0.01
Backhoe/Loader, 2 yd3 1 124 0.75 18 6,570 hours 0.35 0.002 g/hp-hr 0.0003 0.000004 0.001
Units Load Factor
SO2 Emission Factor SO2 Emissions - Year 1
Table H.15 SO2 Emissions from Fuel Burning Mobile Engines - Year 1
Fuel Burning Mobile Engine Description a
Fleet Size
HP Rating
Process Rates b - Year 1
Rosemont Copper ProjectEmission Inventory Information JBR ENVIRONMENTAL CONSULTANTS, INC.
November 2011Page H56
AZRP00238

Hourly Daily Annual 100% Sulfur Conversion - Year 1 Units lb/hr tpd tpy
Units Load Factor
SO2 Emission Factor SO2 Emissions - Year 1
Table H.15 SO2 Emissions from Fuel Burning Mobile Engines - Year 1
Fuel Burning Mobile Engine Description a
Fleet Size
HP Rating
Process Rates b - Year 1
All-Terrain Crane, 75 tons 1 230 0.75 18 6,570 hours 0.43 0.002 g/hp-hr 0.0006 0.000007 0.003
Transporter with Tractor, 200 tons 1 1,350 0.75 18 6,570 hours 0.59 0.002 g/hp-hr 0.004 0.00004 0.02
Fuel/Lube Trucks, 6,000 gallons 2 703 0.75 18 6,570 hours 0.35 0.002 g/hp-hr 0.004 0.00005 0.02
Mechanic Field Service Trucks 5 370 0.75 18 6,570 hours 0.43 0.002 g/hp-hr 0.005 0.00006 0.02
Tire Handler 1 90 0.75 18 6,570 hours 0.43 0.002 g/hp-hr 0.0002 0.000003 0.001
Shop Forklift, 12,000 lbs 1 90 0.75 18 6,570 hours 0.59 0.002 g/hp-hr 0.0002 0.000003 0.001
Integrated Tool Carrier, 140 hp 1 138 0.75 18 6,570 hours 0.59 0.002 g/hp-hr 0.0004 0.000004 0.002
Light Plant, 6 kW 15 35 0.40 10 3,504 hours 0.43 0.003 g/hp-hr 0.001 0.00002 0.006
Primary Crushing Mobile Crane - 400 tons 1 320 0.75 18 6,570 hours 0.43 0.002 g/hp-hr 0.0009 0.00001 0.004
Copper Concentrate Area Front End Loader - Cat 930 1 160 0.75 18 6,570 hours 0.59 0.002 g/hp-hr 0.0004 0.000005 0.002
Molybdenum Packaging Forklift, 7,000 lbs 1 93 0.75 18 6,570 hours 0.59 0.002 g/hp-hr 0.0002 0.000003 0.001
Copper Cathode Forklift 1 93 0.75 18 6,570 hours 0.59 0.002 g/hp-hr 0.0002 0.000003 0.001
Boom Trucks 10 tons, 45 foot boom 1 200 0.75 18 6,570 hours 0.21 0.002 g/hp-hr 0.0005 0.000006 0.002
Boom Trucks 15 tons, 60 foot boom 1 210 0.75 18 6,570 hours 0.21 0.002 g/hp-hr 0.0006 0.000007 0.002
Front End Loader, 6 yd3 1 349 0.75 18 6,570 hours 0.35 0.002 g/hp-hr 0.0009 0.00001 0.004
Front End Loader, 5 yd3 1 149 0.75 18 6,570 hours 0.25 0.002 g/hp-hr 0.0004 0.000005 0.002
Bob Cats, 2,400 lbs 2 82 0.75 18 6,570 hours 0.59 0.002 g/hp-hr 0.0004 0.000005 0.002
Rosemont Copper ProjectEmission Inventory Information JBR ENVIRONMENTAL CONSULTANTS, INC.
November 2011Page H57
AZRP00239

Hourly Daily Annual 100% Sulfur Conversion - Year 1 Units lb/hr tpd tpy
Units Load Factor
SO2 Emission Factor SO2 Emissions - Year 1
Table H.15 SO2 Emissions from Fuel Burning Mobile Engines - Year 1
Fuel Burning Mobile Engine Description a
Fleet Size
HP Rating
Process Rates b - Year 1
Fork Lift, 2,000 lbs 1 50 0.75 18 6,570 hours 0.59 0.002 g/hp-hr 0.0001 0.000002 0.0006
Fork Lift, 5,000 lbs 1 63 0.75 18 6,570 hours 0.59 0.002 g/hp-hr 0.0002 0.000002 0.0007
Fork Lift, 3,000 lbs 2 50 0.75 18 6,570 hours 0.59 0.002 g/hp-hr 0.0003 0.000003 0.001
Flat Bed Trucks, 10 tons 2 350 0.75 18 6,570 hours 0.43 0.002 g/hp-hr 0.002 0.00002 0.008
Dump Truck, 10 tons 1 250 0.75 18 6,570 hours 0.43 0.002 g/hp-hr 0.0007 0.000008 0.003
Mobile Hydraulic Crane, 60 tons 1 267 0.75 18 6,570 hours 0.43 0.002 g/hp-hr 0.0007 0.000009 0.003
Truck Shop Bridge Crane, 60 tons 1 75 0.75 18 6,570 hours 0.43 0.002 g/hp-hr 0.0002 0.000002 0.0009
Truck Shop Bridge Crane, 25 tons 1 24 0.75 18 6,570 hours 0.43 0.002 g/hp-hr 0.00006 0.0000008 0.0003
CS683 Soil Compactor / Roller 2 173 0.75 18 6,570 hours 0.40 0.002 g/hp-hr 0.0009 0.00001 0.004
246C Skid Steer Loader 2 73 0.75 18 6,570 hours 0.3 0.002 g/hp-hr 0.0004 0.000005 0.002
RH200/340 O & K Shovel / Hitachi EX5500 1 2,520 0.75 18 6,570 hours 0.59 0.002 g/hp-hr 0.007 0.00008 0.03
Off-Road Tire Handling Truck 1 450 0.75 18 6,570 hours 0.43 0.002 g/hp-hr 0.001 0.00001 0.005
Contractor Haul Trucks, 25 tons 2 511 0.75 18 6,570 hours 0.43 0.002 g/hp-hr 0.003 0.00003 0.01
Motivator for Mine Shovels 1 3,308 0.91 22 8,000 hours 0.43 0.001 g/hp-hr 0.009 0.0001 0.04
Storm Water Pond Pump 1 200 1.00 24 500 hours 1 0.021 g/hp-hr 0.009 0.0001 0.002
Mine Pit Dewatering Pump 4 100 1.00 24 500 hours 1 0.021 g/hp-hr 0.02 0.0002 0.005
Copper Concentrate Shipment Vehicles -- 450 1.00 19 6,795 hours 0.43 0.002 g/hp-hr 0.002 0.00001 0.005
Rosemont Copper ProjectEmission Inventory Information JBR ENVIRONMENTAL CONSULTANTS, INC.
November 2011Page H58
AZRP00240

Hourly Daily Annual 100% Sulfur Conversion - Year 1 Units lb/hr tpd tpy
Units Load Factor
SO2 Emission Factor SO2 Emissions - Year 1
Table H.15 SO2 Emissions from Fuel Burning Mobile Engines - Year 1
Fuel Burning Mobile Engine Description a
Fleet Size
HP Rating
Process Rates b - Year 1
Molybdenum Concentrate Shipment Vehicles -- 450 1.00 1 86 hours 0.43 0.124 g/hp-hr 0.12 0.00006 0.005
Sulfuric Acid Delivery Vehicles -- 450 1.00 6 2,081 hours 0.43 0.005 g/hp-hr 0.005 0.00001 0.005
Lime Delivery Vehicles -- 450 1.00 2 763 hours 0.43 0.014 g/hp-hr 0.01 0.00001 0.005
SAG Mill and Ball Mill Grinding Balls Delivery Vehicles -- 450 1.00 1 234 hours 0.43 0.045 g/hp-hr 0.05 0.00002 0.005
Diesel Fuel Delivery Vehicles -- 500 1.00 2 685 hours 0.43 0.016 g/hp-hr 0.02 0.00002 0.006
Copper Cathode Shipment Vehicles -- 450 1.00 1 200 hours 0.43 0.053 g/hp-hr 0.05 0.00003 0.005
Ammonium Nitrate Delivery Vehicles -- 450 1.00 1 255 hours 0.43 0.042 g/hp-hr 0.04 0.00002 0.005
Miscellaneous Consumables Delivery Vehicles -- 450 1.00 1 499 hours 0.43 0.021 g/hp-hr 0.02 0.00001 0.005
Miscellaneous Fuels and Lubricants Delivery Vehicles -- 450 1.00 1 44 hours 0.43 0.240 g/hp-hr 0.24 0.0001 0.005
Pickup Trucks (gasoline) 20 350 0.25 6 2,190 hours 0.54 0.017 g/hp-hr 0.003 0.00004 0.01
Crew Van (gasoline) 3 350 0.25 6 2,190 hours 0.54 0.0025 g/hp-hr 0.0005 0.000006 0.002
Lot Pick-Up Trucks (gasoline) 20 250 0.25 6 2,190 hours 0.54 0.017 g/hp-hr 0.002 0.00003 0.01
0.29 0.004 0.96
0.70 0.002 0.57
1.00 0.006 1.54
a Fuel burning mobile engines are diesel fuel fired unless otherwise noted.
b Except for the shipment and delivery vehicles, the process rates are for a single mobile engine. The process rates for the shipment and delivery vehicles are representative of the entire fleet.
Total Emissions from All Mobile Engines:
Total Emissions from Haul Truck Engines:
Total Emissions from Other Mobile Engines:
Rosemont Copper ProjectEmission Inventory Information JBR ENVIRONMENTAL CONSULTANTS, INC.
November 2011Page H59
AZRP00241

Hourly Daily AnnualTier 2/Tier 4 (Final) Emission Standards or Mobile 6 Output
Units lb/hr tpd tpy
Haulage Trucks, 250 tons 31 2,650 1.00 24 6,600 hours 0.32 0.30 g/hp-hr 17.39 0.21 57.38
Crawler Dozers, D11T Class 3 850 0.46 11 4,000 hours 0.575 0.14 g/hp-hr 0.21 0.002 0.91
Crawler Dozers, D10T Class 3 580 0.68 16 6,000 hours 0.575 0.14 g/hp-hr 0.21 0.003 0.93
Crawler Dozer, D8T Class 1 310 0.75 18 6,570 hours 0.575 0.14 g/hp-hr 0.04 0.0005 0.18
Rubber Tired Dozers, 834H Class 3 498 0.70 17 6,150 hours 0.575 0.14 g/hp-hr 0.19 0.002 0.82
Motor Graders, 24M Class 1 533 0.68 16 6,000 hours 0.575 0.14 g/hp-hr 0.06 0.0008 0.28
Motor Graders, 16M Class 3 297 0.68 16 6,000 hours 0.575 0.14 g/hp-hr 0.11 0.001 0.47
Water Trucks, 30,000 gallons 4 1,348 0.37 9 3,250 hours 0.35 0.14 g/hp-hr 0.22 0.003 0.95
Diesel Blasthole Drill, 12.25 inches 2 1,500 0.75 18 6,570 hours 0.43 0.14 g/hp-hr 0.30 0.004 1.31
Hydraulic DML 45 Drill 1 425 0.75 18 6,570 hours 0.43 0.14 g/hp-hr 0.04 0.0005 0.19
Front End Loaders 2 2,000 0.90 22 7,884 hours 0.59 0.30 g/hp-hr 1.40 0.02 6.15
Stemming Truck 2 450 0.75 18 6,570 hours 0.43 0.14 g/hp-hr 0.09 0.001 0.39
ANFO/Slurry Truck, 20 tons 2 450 0.75 18 6,570 hours 0.43 0.14 g/hp-hr 0.09 0.001 0.39
Powder Truck, 2 tons 2 350 0.75 18 6,570 hours 0.43 0.14 g/hp-hr 0.07 0.0008 0.31
Front End Loaders, 8 yd3 2 262 0.75 18 6,570 hours 0.575 0.14 g/hp-hr 0.07 0.0008 0.31
Hydraulic Excavator, 385 Cat CL 2 513 0.90 22 7,884 hours 0.35 0.14 g/hp-hr 0.10 0.001 0.44
Backhoe/Loader, 2 yd3 1 124 0.75 18 6,570 hours 0.35 0.14 g/hp-hr 0.01 0.0001 0.04
Load Factor
VOC Emission Factor VOC Emissions - Year 1
Table H.16 VOC Emissions from Fuel Burning Mobile Engines - Year 1
Fuel Burning Mobile Engine Description a
Fleet Size
HP Rating
Process Rates b - Year 1
Units
Rosemont Copper ProjectEmission Inventory Information JBR ENVIRONMENTAL CONSULTANTS, INC.
November 2011Page H60
AZRP00242

Hourly Daily AnnualTier 2/Tier 4 (Final) Emission Standards or Mobile 6 Output
Units lb/hr tpd tpyLoad
Factor
VOC Emission Factor VOC Emissions - Year 1
Table H.16 VOC Emissions from Fuel Burning Mobile Engines - Year 1
Fuel Burning Mobile Engine Description a
Fleet Size
HP Rating
Process Rates b - Year 1
Units
All-Terrain Crane, 75 tons 1 230 0.75 18 6,570 hours 0.43 0.14 g/hp-hr 0.02 0.0003 0.10
Transporter with Tractor, 200 tons 1 1,350 0.75 18 6,570 hours 0.59 0.14 g/hp-hr 0.18 0.002 0.81
Fuel/Lube Trucks, 6,000 gallons 2 703 0.75 18 6,570 hours 0.35 0.14 g/hp-hr 0.11 0.001 0.50
Mechanic Field Service Trucks 5 370 1.71 41 15,000 VMT 0.43 0.403 g/mile 0.008 0.00009 0.03
Tire Handler 1 90 0.11 3 1,000 VMT 0.43 0.403 g/mile 0.0001 0.000001 0.0004
Shop Forklift, 12,000 lbs 1 90 0.75 18 6,570 hours 0.59 0.14 g/hp-hr 0.01 0.0001 0.05
Integrated Tool Carrier, 140 hp 1 138 0.75 18 6,570 hours 0.59 0.14 g/hp-hr 0.02 0.0002 0.08
Light Plant, 6 kW 15 35 0.40 10 3,504 hours 0.43 0.20 g/hp-hr 0.04 0.0005 0.17
Primary Crushing Mobile Crane - 400 tons 1 320 0.75 18 6,570 hours 0.43 0.14 g/hp-hr 0.03 0.0004 0.14
Copper Concentrate Area Front End Loader - Cat 930 1 160 0.75 18 6,570 hours 0.59 0.14 g/hp-hr 0.02 0.0003 0.10
Molybdenum Packaging Forklift, 7,000 lbs 1 93 0.75 18 6,570 hours 0.59 0.14 g/hp-hr 0.01 0.0002 0.06
Copper Cathode Forklift 1 93 0.75 18 6,570 hours 0.59 0.14 g/hp-hr 0.01 0.0002 0.06
Boom Trucks 10 tons, 45 foot boom 1 200 0.75 18 6,570 hours 0.21 0.14 g/hp-hr 0.01 0.0001 0.04
Boom Trucks 15 tons, 60 foot boom 1 210 0.75 18 6,570 hours 0.21 0.14 g/hp-hr 0.01 0.0001 0.04
Front End Loader, 6 yd3 1 349 0.75 18 6,570 hours 0.35 0.14 g/hp-hr 0.03 0.0003 0.12
Front End Loader, 5 yd3 1 149 0.75 18 6,570 hours 0.25 0.14 g/hp-hr 0.009 0.0001 0.04
Bob Cats, 2,400 lbs 2 82 0.75 18 6,570 hours 0.59 0.14 g/hp-hr 0.02 0.0003 0.10
Rosemont Copper ProjectEmission Inventory Information JBR ENVIRONMENTAL CONSULTANTS, INC.
November 2011Page H61
AZRP00243

Hourly Daily AnnualTier 2/Tier 4 (Final) Emission Standards or Mobile 6 Output
Units lb/hr tpd tpyLoad
Factor
VOC Emission Factor VOC Emissions - Year 1
Table H.16 VOC Emissions from Fuel Burning Mobile Engines - Year 1
Fuel Burning Mobile Engine Description a
Fleet Size
HP Rating
Process Rates b - Year 1
Units
Fork Lift, 2,000 lbs 1 50 0.75 18 6,570 hours 0.59 0.20 g/hp-hr 0.01 0.0001 0.04
Fork Lift, 5,000 lbs 1 63 0.75 18 6,570 hours 0.59 0.20 g/hp-hr 0.01 0.0001 0.05
Fork Lift, 3,000 lbs 2 50 0.75 18 6,570 hours 0.59 0.20 g/hp-hr 0.02 0.0002 0.09
Flat Bed Trucks, 10 tons 2 350 0.75 18 6,570 hours 0.43 0.14 g/hp-hr 0.07 0.0008 0.31
Dump Truck, 10 tons 1 250 0.34 8 3,000 VMT 0.43 0.403 g/mile 0.0003 0.000004 0.001
Mobile Hydraulic Crane, 60 tons 1 267 0.75 18 6,570 hours 0.43 0.14 g/hp-hr 0.03 0.0003 0.12
Truck Shop Bridge Crane, 60 tons 1 75 0.75 18 6,570 hours 0.43 0.14 g/hp-hr 0.007 0.00009 0.03
Truck Shop Bridge Crane, 25 tons 1 24 0.75 18 6,570 hours 0.43 0.60 g/hp-hr 0.01 0.0001 0.05
CS683 Soil Compactor / Roller 2 173 0.75 18 6,570 hours 0.4 0.14 g/hp-hr 0.03 0.0004 0.14
246C Skid Steer Loader 2 73 0.75 18 6,570 hours 0.3 0.20 g/hp-hr 0.01 0.0002 0.06
RH200/340 O & K Shovel / Hitachi EX5500 1 2,520 0.75 18 6,570 hours 0.59 0.14 g/hp-hr 0.34 0.004 1.51
Off-Road Tire Handling Truck 1 450 0.86 21 7,500 VMT 0.43 0.403 g/mile 0.0008 0.000009 0.003
Contractor Haul Trucks, 25 tons 2 511 2.74 66 24,000 VMT 0.43 0.403 g/mile 0.005 0.00006 0.02
Motivator for Mine Shovels 1 3,308 0.91 22 8,000 hours 0.43 0.14 g/hp-hr 0.40 0.005 1.76
Storm Water Pond Pump 1 200 1.00 24 500 hours 1 0.14 g/hp-hr 0.06 0.0007 0.02
Mine Pit Dewatering Pump 4 100 1.00 24 500 hours 1 0.14 g/hp-hr 0.12 0.001 0.03
Copper Concentrate Shipment Vehicles -- 450 29.60 1,021 169,872 VMT 0.43 0.403 g/mile 0.03 0.0005 0.08
Rosemont Copper ProjectEmission Inventory Information JBR ENVIRONMENTAL CONSULTANTS, INC.
November 2011Page H62
AZRP00244

Hourly Daily AnnualTier 2/Tier 4 (Final) Emission Standards or Mobile 6 Output
Units lb/hr tpd tpyLoad
Factor
VOC Emission Factor VOC Emissions - Year 1
Table H.16 VOC Emissions from Fuel Burning Mobile Engines - Year 1
Fuel Burning Mobile Engine Description a
Fleet Size
HP Rating
Process Rates b - Year 1
Units
Molybdenum Concentrate Shipment Vehicles -- 450 7.40 15 2,145 VMT 0.43 0.403 g/mile 0.007 0.000007 0.001
Sulfuric Acid Delivery Vehicles -- 450 22.20 143 52,021 VMT 0.43 0.403 g/mile 0.02 0.00006 0.02
Lime Delivery Vehicles -- 450 14.80 52 19,072 VMT 0.43 0.403 g/mile 0.01 0.00002 0.008
SAG Mill and Ball Mill Grinding Balls Delivery Vehicles -- 450 14.80 23 5,858 VMT 0.43 0.403 g/mile 0.01 0.00001 0.003
Diesel Fuel Delivery Vehicles -- 500 14.80 47 17,136 VMT 0.43 0.403 g/mile 0.01 0.00002 0.008
Copper Cathode Shipment Vehicles -- 450 14.80 42 4,997 VMT 0.43 0.403 g/mile 0.01 0.00002 0.002
Ammonium Nitrate Delivery Vehicles -- 450 7.40 25 6,384 VMT 0.43 0.403 g/mile 0.007 0.00001 0.003
Miscellaneous Consumables Delivery Vehicles -- 450 7.40 48 12,486 VMT 0.43 0.403 g/mile 0.007 0.00002 0.006
Miscellaneous Fuels and Lubricants Delivery Vehicles -- 450 7.40 7 1,110 VMT 0.43 0.403 g/mile 0.007 0.000003 0.0005
Pickup Trucks (gasoline) 20 350 1.37 33 12,000 VMT 0.54 1.329 g/mile 0.08 0.001 0.35
Crew Van (gasoline) 3 350 0.91 22 8,000 VMT 0.54 1.329 g/mile 0.008 0.0001 0.04
Lot Pick-Up Trucks (gasoline) 20 250 0.34 8 3,000 VMT 0.54 1.329 g/mile 0.02 0.0002 0.09
17.39 0.21 57.38
5.14 0.06 21.32
22.53 0.27 78.70
a Fuel burning mobile engines are diesel fuel fired unless otherwise noted.
b Except for the shipment and delivery vehicles, the process rates are for a single mobile engine. The process rates for the shipment and delivery vehicles are representative of the entire fleet.
Total Emissions from Haul Truck Engines:
Total Emissions from Other Mobile Engines:
Total Emissions from All Mobile Engines:
Rosemont Copper ProjectEmission Inventory Information JBR ENVIRONMENTAL CONSULTANTS, INC.
November 2011Page H63
AZRP00245

Hourly Daily Annual 99% Conversion(g/hp-hr) Units lb/hr tpd tpy
Haulage Trucks, 250 tons 31 2,650 1.00 24 6,600 hours 0.32 497 g/hp-hr 28,820.00 345.84 95,105.99
Crawler Dozers, D11T Class 3 850 0.46 11 4,000 hours 0.575 497 g/hp-hr 734.01 8.81 3,214.95
Crawler Dozers, D10T Class 3 580 0.68 16 6,000 hours 0.575 497 g/hp-hr 751.28 9.02 3,290.60
Crawler Dozer, D8T Class 1 310 0.75 18 6,570 hours 0.575 497 g/hp-hr 146.56 1.76 641.95
Rubber Tired Dozers, 834H Class 3 498 0.70 17 6,150 hours 0.575 497 g/hp-hr 661.19 7.93 2,896.01
Motor Graders, 24M Class 1 533 0.68 16 6,000 hours 0.575 497 g/hp-hr 230.13 2.76 1,007.98
Motor Graders, 16M Class 3 297 0.68 16 6,000 hours 0.575 497 g/hp-hr 384.71 4.62 1,685.01
Water Trucks, 30,000 gallons 4 1,348 0.37 9 3,250 hours 0.35 497 g/hp-hr 767.60 9.21 3,362.08
Diesel Blasthole Drill, 12.25 inches 2 1,500 0.75 18 6,570 hours 0.43 497 g/hp-hr 1,060.69 12.73 4,645.81
Hydraulic DML 45 Drill 1 425 0.75 18 6,570 hours 0.43 497 g/hp-hr 150.26 1.80 658.16
Front End Loaders 2 2,000 0.90 22 7,884 hours 0.59 497 g/hp-hr 2,328.58 27.94 10,199.17
Stemming Truck 2 450 0.75 18 6,570 hours 0.43 497 g/hp-hr 318.21 3.82 1,393.74
ANFO/Slurry Truck, 20 tons 2 450 0.75 18 6,570 hours 0.43 497 g/hp-hr 318.21 3.82 1,393.74
Powder Truck, 2 tons 2 350 0.75 18 6,570 hours 0.43 497 g/hp-hr 247.49 2.97 1,084.02
Front End Loaders, 8 yd3 2 262 0.75 18 6,570 hours 0.575 497 g/hp-hr 247.74 2.97 1,085.10
Hydraulic Excavator, 385 Cat CL 2 513 0.90 22 7,884 hours 0.35 497 g/hp-hr 354.32 4.25 1,551.92
Backhoe/Loader, 2 yd3 1 124 0.75 18 6,570 hours 0.35 497 g/hp-hr 35.69 0.43 156.30
Load Factor
CO2 Emission Factor CO2 Emissions - Year 1
Table H.17 CO2 Emissions from Fuel Burning Mobile Engines - Year 1
Fuel Burning Mobile Engine Description a
Fleet Size
HP Rating
Process Rates b - Year 1
Units
Rosemont Copper ProjectEmission Inventory Information JBR ENVIRONMENTAL CONSULTANTS, INC.
November 2011Page H64
AZRP00246

Hourly Daily Annual 99% Conversion(g/hp-hr) Units lb/hr tpd tpy
Load Factor
CO2 Emission Factor CO2 Emissions - Year 1
Table H.17 CO2 Emissions from Fuel Burning Mobile Engines - Year 1
Fuel Burning Mobile Engine Description a
Fleet Size
HP Rating
Process Rates b - Year 1
Units
All-Terrain Crane, 75 tons 1 230 0.75 18 6,570 hours 0.43 497 g/hp-hr 81.32 0.98 356.18
Transporter with Tractor, 200 tons 1 1,350 0.75 18 6,570 hours 0.59 497 g/hp-hr 654.91 7.86 2,868.52
Fuel/Lube Trucks, 6,000 gallons 2 703 0.75 18 6,570 hours 0.35 497 g/hp-hr 404.62 4.86 1,772.25
Mechanic Field Service Trucks 5 370 0.75 18 6,570 hours 0.43 497 g/hp-hr 654.09 7.85 2,864.92
Tire Handler 1 90 0.75 18 6,570 hours 0.43 497 g/hp-hr 31.82 0.38 139.37
Shop Forklift, 12,000 lbs 1 90 0.75 18 6,570 hours 0.59 497 g/hp-hr 43.66 0.52 191.23
Integrated Tool Carrier, 140 hp 1 138 0.75 18 6,570 hours 0.59 497 g/hp-hr 66.95 0.80 293.23
Light Plant, 6 kW 15 35 0.40 10 3,504 hours 0.43 497 g/hp-hr 99.00 1.19 433.61
Primary Crushing Mobile Crane - 400 tons 1 320 0.75 18 6,570 hours 0.43 497 g/hp-hr 113.14 1.36 495.55
Copper Concentrate Area Front End Loader - Cat 930 1 160 0.75 18 6,570 hours 0.59 497 g/hp-hr 77.62 0.93 339.97
Molybdenum Packaging Forklift, 7,000 lbs 1 93 0.75 18 6,570 hours 0.59 497 g/hp-hr 44.87 0.54 196.55
Copper Cathode Forklift 1 93 0.75 18 6,570 hours 0.59 497 g/hp-hr 44.87 0.54 196.55
Boom Trucks 10 tons, 45 foot boom 1 200 0.75 18 6,570 hours 0.21 497 g/hp-hr 34.53 0.41 151.26
Boom Trucks 15 tons, 60 foot boom 1 210 0.75 18 6,570 hours 0.21 497 g/hp-hr 36.26 0.44 158.82
Front End Loader, 6 yd3 1 349 0.75 18 6,570 hours 0.35 497 g/hp-hr 100.44 1.21 439.91
Front End Loader, 5 yd3 1 149 0.75 18 6,570 hours 0.25 497 g/hp-hr 30.63 0.37 134.15
Bob Cats, 2,400 lbs 2 82 0.75 18 6,570 hours 0.59 497 g/hp-hr 79.56 0.95 348.47
Rosemont Copper ProjectEmission Inventory Information JBR ENVIRONMENTAL CONSULTANTS, INC.
November 2011Page H65
AZRP00247

Hourly Daily Annual 99% Conversion(g/hp-hr) Units lb/hr tpd tpy
Load Factor
CO2 Emission Factor CO2 Emissions - Year 1
Table H.17 CO2 Emissions from Fuel Burning Mobile Engines - Year 1
Fuel Burning Mobile Engine Description a
Fleet Size
HP Rating
Process Rates b - Year 1
Units
Fork Lift, 2,000 lbs 1 50 0.75 18 6,570 hours 0.59 497 g/hp-hr 24.26 0.29 106.24
Fork Lift, 5,000 lbs 1 63 0.75 18 6,570 hours 0.59 497 g/hp-hr 30.56 0.37 133.86
Fork Lift, 3,000 lbs 2 50 0.75 18 6,570 hours 0.59 497 g/hp-hr 48.51 0.58 212.48
Flat Bed Trucks, 10 tons 2 350 0.75 18 6,570 hours 0.43 497 g/hp-hr 247.49 2.97 1,084.02
Dump Truck, 10 tons 1 250 0.75 18 6,570 hours 0.43 497 g/hp-hr 88.39 1.06 387.15
Mobile Hydraulic Crane, 60 tons 1 267 0.75 18 6,570 hours 0.43 497 g/hp-hr 94.40 1.13 413.48
Truck Shop Bridge Crane, 60 tons 1 75 0.75 18 6,570 hours 0.43 497 g/hp-hr 26.52 0.32 116.15
Truck Shop Bridge Crane, 25 tons 1 24 0.75 18 6,570 hours 0.43 497 g/hp-hr 8.52 0.10 37.32
CS683 Soil Compactor / Roller 2 173 0.75 18 6,570 hours 0.4 497 g/hp-hr 113.80 1.37 498.43
246C Skid Steer Loader 2 73 0.75 18 6,570 hours 0.3 497 g/hp-hr 36.01 0.43 157.74
RH200/340 O & K Shovel / Hitachi EX5500 1 2,520 0.75 18 6,570 hours 0.59 497 g/hp-hr 1,222.50 14.67 5,354.57
Off-Road Tire Handling Truck 1 450 0.75 18 6,570 hours 0.43 497 g/hp-hr 159.10 1.91 696.87
Contractor Haul Trucks, 25 tons 2 511 0.75 18 6,570 hours 0.43 497 g/hp-hr 361.34 4.34 1,582.67
Motivator for Mine Shovels 1 3,308 0.91 22 8,000 hours 0.43 497 g/hp-hr 1,424.15 17.09 6,237.78
Storm Water Pond Pump 1 200 1.00 24 500 hours 1 497 g/hp-hr 219.26 2.63 54.82
Mine Pit Dewatering Pump 4 100 1.00 24 500 hours 1 497 g/hp-hr 438.53 5.26 109.63
Copper Concentrate Shipment Vehicles -- 450 1.00 19 6,795 hours 0.43 497 g/hp-hr 212.14 1.97 720.72
Rosemont Copper ProjectEmission Inventory Information JBR ENVIRONMENTAL CONSULTANTS, INC.
November 2011Page H66
AZRP00248
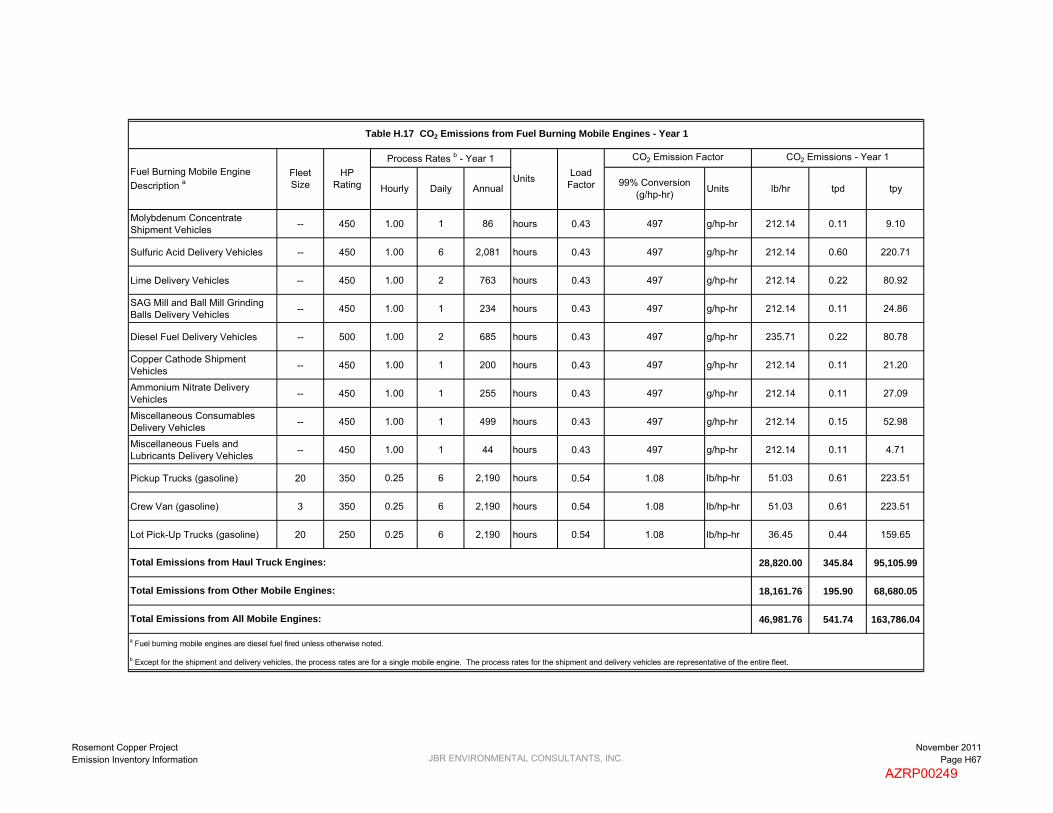
Hourly Daily Annual 99% Conversion(g/hp-hr) Units lb/hr tpd tpy
Load Factor
CO2 Emission Factor CO2 Emissions - Year 1
Table H.17 CO2 Emissions from Fuel Burning Mobile Engines - Year 1
Fuel Burning Mobile Engine Description a
Fleet Size
HP Rating
Process Rates b - Year 1
Units
Molybdenum Concentrate Shipment Vehicles -- 450 1.00 1 86 hours 0.43 497 g/hp-hr 212.14 0.11 9.10
Sulfuric Acid Delivery Vehicles -- 450 1.00 6 2,081 hours 0.43 497 g/hp-hr 212.14 0.60 220.71
Lime Delivery Vehicles -- 450 1.00 2 763 hours 0.43 497 g/hp-hr 212.14 0.22 80.92
SAG Mill and Ball Mill Grinding Balls Delivery Vehicles -- 450 1.00 1 234 hours 0.43 497 g/hp-hr 212.14 0.11 24.86
Diesel Fuel Delivery Vehicles -- 500 1.00 2 685 hours 0.43 497 g/hp-hr 235.71 0.22 80.78
Copper Cathode Shipment Vehicles -- 450 1.00 1 200 hours 0.43 497 g/hp-hr 212.14 0.11 21.20
Ammonium Nitrate Delivery Vehicles -- 450 1.00 1 255 hours 0.43 497 g/hp-hr 212.14 0.11 27.09
Miscellaneous Consumables Delivery Vehicles -- 450 1.00 1 499 hours 0.43 497 g/hp-hr 212.14 0.15 52.98
Miscellaneous Fuels and Lubricants Delivery Vehicles -- 450 1.00 1 44 hours 0.43 497 g/hp-hr 212.14 0.11 4.71
Pickup Trucks (gasoline) 20 350 0.25 6 2,190 hours 0.54 1.08 lb/hp-hr 51.03 0.61 223.51
Crew Van (gasoline) 3 350 0.25 6 2,190 hours 0.54 1.08 lb/hp-hr 51.03 0.61 223.51
Lot Pick-Up Trucks (gasoline) 20 250 0.25 6 2,190 hours 0.54 1.08 lb/hp-hr 36.45 0.44 159.65
28,820.00 345.84 95,105.99
18,161.76 195.90 68,680.05
46,981.76 541.74 163,786.04
a Fuel burning mobile engines are diesel fuel fired unless otherwise noted.
b Except for the shipment and delivery vehicles, the process rates are for a single mobile engine. The process rates for the shipment and delivery vehicles are representative of the entire fleet.
Total Emissions from Haul Truck Engines:
Total Emissions from Other Mobile Engines:
Total Emissions from All Mobile Engines:
Rosemont Copper ProjectEmission Inventory Information JBR ENVIRONMENTAL CONSULTANTS, INC.
November 2011Page H67
AZRP00249

Hourly Daily Annual 2% Sulfur Conversion - Year 1 Units lb/hr tpd tpy
Haulage Trucks, 250 tons 31 2,650 1.00 24 6,600 hours 0.32 0.00003 g/hp-hr 0.006 0.00007 0.02
Crawler Dozers, D11T Class 3 850 0.46 11 4,000 hours 0.575 0.00005 g/hp-hr 0.0001 0.000002 0.0006
Crawler Dozers, D10T Class 3 580 0.68 16 6,000 hours 0.575 0.00004 g/hp-hr 0.00009 0.000001 0.0004
Crawler Dozer, D8T Class 1 310 0.75 18 6,570 hours 0.575 0.00003 g/hp-hr 0.00002 0.0000002 0.00007
Rubber Tired Dozers, 834H Class 3 498 0.70 17 6,150 hours 0.575 0.00003 g/hp-hr 0.00008 0.000001 0.0004
Motor Graders, 24M Class 1 533 0.68 16 6,000 hours 0.575 0.00004 g/hp-hr 0.00003 0.0000003 0.0001
Motor Graders, 16M Class 3 297 0.68 16 6,000 hours 0.575 0.00004 g/hp-hr 0.00005 0.0000006 0.0002
Water Trucks, 30,000 gallons 4 1,348 0.37 9 3,250 hours 0.35 0.00007 g/hp-hr 0.0003 0.000003 0.001
Diesel Blasthole Drill, 12.25 inches 2 1,500 0.75 18 6,570 hours 0.43 0.00003 g/hp-hr 0.0002 0.000002 0.0007
Hydraulic DML 45 Drill 1 425 0.75 18 6,570 hours 0.43 0.00003 g/hp-hr 0.00002 0.0000003 0.0001
Front End Loaders 2 2,000 0.90 22 7,884 hours 0.59 0.00003 g/hp-hr 0.0002 0.000003 0.0009
Stemming Truck 2 450 0.75 18 6,570 hours 0.43 0.00003 g/hp-hr 0.00005 0.0000006 0.0002
ANFO/Slurry Truck, 20 tons 2 450 0.75 18 6,570 hours 0.43 0.00003 g/hp-hr 0.00005 0.0000006 0.0002
Powder Truck, 2 tons 2 350 0.75 18 6,570 hours 0.43 0.00003 g/hp-hr 0.00004 0.0000005 0.0002
Front End Loaders, 8 yd3 2 262 0.75 18 6,570 hours 0.575 0.00003 g/hp-hr 0.00003 0.0000003 0.0001
Hydraulic Excavator, 385 Cat CL 2 513 0.90 22 7,884 hours 0.35 0.00003 g/hp-hr 0.00005 0.0000007 0.0002
Backhoe/Loader, 2 yd3 1 124 0.75 18 6,570 hours 0.35 0.00003 g/hp-hr 0.000007 0.00000008 0.00003
Units Load Factor
SO4 Emission Factor SO4 Emissions - Year 1
Table H.18 SO4 Emissions from Fuel Burning Mobile Engines (Diesel Engines Only) - Year 1
Fuel Burning Mobile Engine Description a
Fleet Size
HP Rating
Process Rates b - Year 1
Rosemont Copper ProjectEmission Inventory Information JBR ENVIRONMENTAL CONSULTANTS, INC.
November 2011Page H68
AZRP00250

Hourly Daily Annual 2% Sulfur Conversion - Year 1 Units lb/hr tpd tpy
Units Load Factor
SO4 Emission Factor SO4 Emissions - Year 1
Table H.18 SO4 Emissions from Fuel Burning Mobile Engines (Diesel Engines Only) - Year 1
Fuel Burning Mobile Engine Description a
Fleet Size
HP Rating
Process Rates b - Year 1
All-Terrain Crane, 75 tons 1 230 0.75 18 6,570 hours 0.43 0.00003 g/hp-hr 0.00001 0.0000001 0.00005
Transporter with Tractor, 200 tons 1 1,350 0.75 18 6,570 hours 0.59 0.00003 g/hp-hr 0.00007 0.0000009 0.0003
Fuel/Lube Trucks, 6,000 gallons 2 703 0.75 18 6,570 hours 0.35 0.00003 g/hp-hr 0.00008 0.0000009 0.0003
Mechanic Field Service Trucks 5 370 0.75 18 6,570 hours 0.43 0.00003 g/hp-hr 0.0001 0.000001 0.0004
Tire Handler 1 90 0.75 18 6,570 hours 0.43 0.00003 g/hp-hr 0.000005 0.00000006 0.00002
Shop Forklift, 12,000 lbs 1 90 0.75 18 6,570 hours 0.59 0.00003 g/hp-hr 0.000005 0.00000006 0.00002
Integrated Tool Carrier, 140 hp 1 138 0.75 18 6,570 hours 0.59 0.00003 g/hp-hr 0.000007 0.00000009 0.00003
Light Plant, 6 kW 15 35 0.40 10 3,504 hours 0.43 0.00006 g/hp-hr 0.00003 0.0000003 0.0001
Primary Crushing Mobile Crane - 400 tons 1 320 0.75 18 6,570 hours 0.43 0.00003 g/hp-hr 0.00002 0.0000002 0.00008
Copper Concentrate Area Front End Loader - Cat 930 1 160 0.75 18 6,570 hours 0.59 0.00003 g/hp-hr 0.000009 0.0000001 0.00004
Molybdenum Packaging Forklift, 7,000 lbs 1 93 0.75 18 6,570 hours 0.59 0.00003 g/hp-hr 0.000005 0.00000006 0.00002
Copper Cathode Forklift 1 93 0.75 18 6,570 hours 0.59 0.00003 g/hp-hr 0.000005 0.00000006 0.00002
Boom Trucks 10 tons, 45 foot boom 1 200 0.75 18 6,570 hours 0.21 0.00003 g/hp-hr 0.00001 0.0000001 0.00005
Boom Trucks 15 tons, 60 foot boom 1 210 0.75 18 6,570 hours 0.21 0.00003 g/hp-hr 0.00001 0.0000001 0.00005
Front End Loader, 6 yd3 1 349 0.75 18 6,570 hours 0.35 0.00003 g/hp-hr 0.00002 0.0000002 0.00008
Front End Loader, 5 yd3 1 149 0.75 18 6,570 hours 0.25 0.00003 g/hp-hr 0.000008 0.0000001 0.00003
Bob Cats, 2,400 lbs 2 82 0.75 18 6,570 hours 0.59 0.00003 g/hp-hr 0.000009 0.0000001 0.00004
Rosemont Copper ProjectEmission Inventory Information JBR ENVIRONMENTAL CONSULTANTS, INC.
November 2011Page H69
AZRP00251

Hourly Daily Annual 2% Sulfur Conversion - Year 1 Units lb/hr tpd tpy
Units Load Factor
SO4 Emission Factor SO4 Emissions - Year 1
Table H.18 SO4 Emissions from Fuel Burning Mobile Engines (Diesel Engines Only) - Year 1
Fuel Burning Mobile Engine Description a
Fleet Size
HP Rating
Process Rates b - Year 1
Fork Lift, 2,000 lbs 1 50 0.75 18 6,570 hours 0.59 0.00003 g/hp-hr 0.000003 0.00000003 0.00001
Fork Lift, 5,000 lbs 1 63 0.75 18 6,570 hours 0.59 0.00003 g/hp-hr 0.000003 0.00000004 0.00001
Fork Lift, 3,000 lbs 2 50 0.75 18 6,570 hours 0.59 0.00003 g/hp-hr 0.000005 0.00000006 0.00002
Flat Bed Trucks, 10 tons 2 350 0.75 18 6,570 hours 0.43 0.00003 g/hp-hr 0.00004 0.0000005 0.0002
Dump Truck, 10 tons 1 250 0.75 18 6,570 hours 0.43 0.00003 g/hp-hr 0.00001 0.0000002 0.00006
Mobile Hydraulic Crane, 60 tons 1 267 0.75 18 6,570 hours 0.43 0.00003 g/hp-hr 0.00001 0.0000002 0.00006
Truck Shop Bridge Crane, 60 tons 1 75 0.75 18 6,570 hours 0.43 0.00003 g/hp-hr 0.000004 0.00000005 0.00002
Truck Shop Bridge Crane, 25 tons 1 24 0.75 18 6,570 hours 0.43 0.00003 g/hp-hr 0.000001 0.00000002 0.000006
CS683 Soil Compactor / Roller 2 173 0.75 18 6,570 hours 0.40 0.00003 g/hp-hr 0.00002 0.0000002 0.00008
246C Skid Steer Loader 2 73 0.75 18 6,570 hours 0.3 0.00003 g/hp-hr 0.000008 0.00000009 0.00003
RH200/340 O & K Shovel / Hitachi EX5500 1 2,520 0.75 18 6,570 hours 0.59 0.00003 g/hp-hr 0.0001 0.000002 0.0006
Off-Road Tire Handling Truck 1 450 0.75 18 6,570 hours 0.43 0.00003 g/hp-hr 0.00002 0.0000003 0.0001
Contractor Haul Trucks, 25 tons 2 511 0.75 18 6,570 hours 0.43 0.00003 g/hp-hr 0.00005 0.0000007 0.0002
Motivator for Mine Shovels 1 3,308 0.91 22 8,000 hours 0.43 0.00003 g/hp-hr 0.0002 0.000002 0.0008
Storm Water Pond Pump 1 200 1.00 24 500 hours 1 0.0004 g/hp-hr 0.0002 0.000002 0.00005
Mine Pit Dewatering Pump 4 100 1.00 24 500 hours 1 0.0004 g/hp-hr 0.0004 0.000005 0.00009
Copper Concentrate Shipment Vehicles -- 450 1.00 19 6,795 hours 0.43 0.00003 g/hp-hr 0.00003 0.0000003 0.0001
Rosemont Copper ProjectEmission Inventory Information JBR ENVIRONMENTAL CONSULTANTS, INC.
November 2011Page H70
AZRP00252

Hourly Daily Annual 2% Sulfur Conversion - Year 1 Units lb/hr tpd tpy
Units Load Factor
SO4 Emission Factor SO4 Emissions - Year 1
Table H.18 SO4 Emissions from Fuel Burning Mobile Engines (Diesel Engines Only) - Year 1
Fuel Burning Mobile Engine Description a
Fleet Size
HP Rating
Process Rates b - Year 1
Molybdenum Concentrate Shipment Vehicles -- 450 1.00 1 86 hours 0.43 0.002 g/hp-hr 0.002 0.000001 0.0001
Sulfuric Acid Delivery Vehicles -- 450 1.00 6 2,081 hours 0.43 0.0001 g/hp-hr 0.0001 0.0000003 0.0001
Lime Delivery Vehicles -- 450 1.00 2 763 hours 0.43 0.0003 g/hp-hr 0.0003 0.0000003 0.0001
SAG Mill and Ball Mill Grinding Balls Delivery Vehicles -- 450 1.00 1 234 hours 0.43 0.0009 g/hp-hr 0.0009 0.0000005 0.0001
Diesel Fuel Delivery Vehicles -- 500 1.00 2 685 hours 0.43 0.0003 g/hp-hr 0.0003 0.0000003 0.0001
Copper Cathode Shipment Vehicles -- 450 1.00 1 200 hours 0.43 0.001 g/hp-hr 0.001 0.0000005 0.0001
Ammonium Nitrate Delivery Vehicles -- 450 1.00 1 255 hours 0.43 0.0008 g/hp-hr 0.0008 0.0000004 0.0001
Miscellaneous Consumables Delivery Vehicles -- 450 1.00 1 499 hours 0.43 0.0004 g/hp-hr 0.0004 0.0000003 0.0001
Miscellaneous Fuels and Lubricants Delivery Vehicles -- 450 1.00 1 44 hours 0.43 0.005 g/hp-hr 0.005 0.000002 0.0001
Pickup Trucks (gasoline) 20 350 0.25 6 2,190 hours 0.54 -- -- -- -- --
Crew Van (gasoline) 3 350 0.25 6 2,190 hours 0.54 -- -- -- -- --
Lot Pick-Up Trucks (gasoline) 20 250 0.25 6 2,190 hours 0.54 -- -- -- -- --
0.006 0.00007 0.02
0.01 0.00004 0.01
0.02 0.0001 0.03
a Fuel burning mobile engines are diesel fuel fired unless otherwise noted.
b Except for the shipment and delivery vehicles, the process rates are for a single mobile engine. The process rates for the shipment and delivery vehicles are representative of the entire fleet.
Total Emissions from All Mobile Engines:
Total Emissions from Haul Truck Engines:
Total Emissions from Other Mobile Engines:
Rosemont Copper ProjectEmission Inventory Information JBR ENVIRONMENTAL CONSULTANTS, INC.
November 2011Page H71
AZRP00253

Hourly Daily Annual lb/hr tpd tpy lb/hr tpd tpy
Haulage Trucks, 250 tons 31 2,650 1.00 24 6,600 hours 0.24 2.08 0.03 6.88 6.60 0.08 21.79
Crawler Dozers, D11T Class 3 850 0.46 11 4,000 hours 0.24 0.01 0.0001 0.05 0.03 0.0004 0.15
Crawler Dozers, D10T Class 3 580 0.68 16 6,000 hours 0.24 0.004 0.00004 0.02 0.01 0.0001 0.05
Crawler Dozer, D8T Class 1 310 0.75 18 6,570 hours 0.24 0.0007 0.000008 0.003 0.002 0.00003 0.01
Rubber Tired Dozers, 834H Class 3 498 0.70 17 6,150 hours 0.24 0.003 0.00004 0.01 0.01 0.0001 0.04
Motor Graders, 24M Class 1 533 0.68 16 6,000 hours 0.24 0.001 0.00001 0.005 0.003 0.00004 0.02
Motor Graders, 16M Class 3 297 0.68 16 6,000 hours 0.24 0.002 0.00002 0.008 0.006 0.00007 0.03
Water Trucks, 30,000 gallons 4 1,348 0.37 9 3,250 hours 0.24 0.01 0.0001 0.05 0.03 0.0004 0.15
Diesel Blasthole Drill, 12.25 inches 2 1,500 0.75 18 6,570 hours 0.24 0.02 0.0002 0.07 0.05 0.0006 0.21
Hydraulic DML 45 Drill 1 425 0.75 18 6,570 hours 0.24 0.0007 0.000009 0.003 0.002 0.00003 0.01
Front End Loaders 2 2,000 0.90 22 7,884 hours 0.24 0.17 0.002 0.74 0.53 0.006 2.34
Stemming Truck 2 450 0.75 18 6,570 hours 0.24 0.002 0.00002 0.007 0.005 0.00006 0.02
ANFO/Slurry Truck, 20 tons 2 450 0.75 18 6,570 hours 0.24 0.002 0.00002 0.007 0.005 0.00006 0.02
Powder Truck, 2 tons 2 350 0.75 18 6,570 hours 0.44 0.002 0.00003 0.01 0.003 0.00003 0.01
Front End Loaders, 8 yd3 2 262 0.75 18 6,570 hours 0.24 0.001 0.00001 0.005 0.004 0.00005 0.02
Hydraulic Excavator, 385 Cat CL 2 513 0.90 22 7,884 hours 0.24 0.002 0.00002 0.007 0.005 0.00006 0.02
Backhoe/Loader, 2 yd3 1 124 0.75 18 6,570 hours 0.44 0.0003 0.000004 0.001 0.0004 0.000005 0.002
Soot Emissions - Year 1
Table H.19 Soot (Elemental Carbon) Emissions from Fuel Burning Mobile Engines (Diesel Engines Only) - Year 1
Fuel Burning Mobile Engine Description a
Fleet Size
HP Rating
Process Rates b - Year 1
UnitsOrganic Carbon Fraction
Organic Carbon Emissions - Year 1
Rosemont Copper ProjectEmission Inventory Information JBR ENVIRONMENTAL CONSULTANTS, INC.
November 2011Page H72
AZRP00254
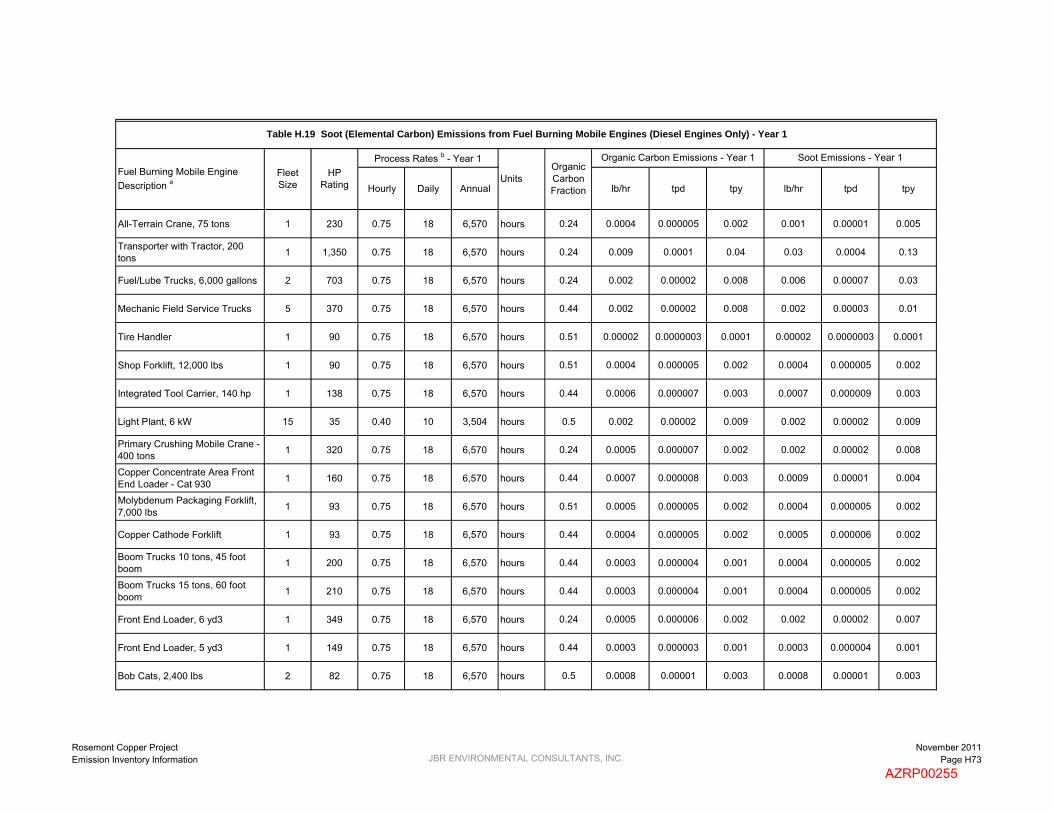
Hourly Daily Annual lb/hr tpd tpy lb/hr tpd tpy
Soot Emissions - Year 1
Table H.19 Soot (Elemental Carbon) Emissions from Fuel Burning Mobile Engines (Diesel Engines Only) - Year 1
Fuel Burning Mobile Engine Description a
Fleet Size
HP Rating
Process Rates b - Year 1
UnitsOrganic Carbon Fraction
Organic Carbon Emissions - Year 1
All-Terrain Crane, 75 tons 1 230 0.75 18 6,570 hours 0.24 0.0004 0.000005 0.002 0.001 0.00001 0.005
Transporter with Tractor, 200 tons 1 1,350 0.75 18 6,570 hours 0.24 0.009 0.0001 0.04 0.03 0.0004 0.13
Fuel/Lube Trucks, 6,000 gallons 2 703 0.75 18 6,570 hours 0.24 0.002 0.00002 0.008 0.006 0.00007 0.03
Mechanic Field Service Trucks 5 370 0.75 18 6,570 hours 0.44 0.002 0.00002 0.008 0.002 0.00003 0.01
Tire Handler 1 90 0.75 18 6,570 hours 0.51 0.00002 0.0000003 0.0001 0.00002 0.0000003 0.0001
Shop Forklift, 12,000 lbs 1 90 0.75 18 6,570 hours 0.51 0.0004 0.000005 0.002 0.0004 0.000005 0.002
Integrated Tool Carrier, 140 hp 1 138 0.75 18 6,570 hours 0.44 0.0006 0.000007 0.003 0.0007 0.000009 0.003
Light Plant, 6 kW 15 35 0.40 10 3,504 hours 0.5 0.002 0.00002 0.009 0.002 0.00002 0.009
Primary Crushing Mobile Crane - 400 tons 1 320 0.75 18 6,570 hours 0.24 0.0005 0.000007 0.002 0.002 0.00002 0.008
Copper Concentrate Area Front End Loader - Cat 930 1 160 0.75 18 6,570 hours 0.44 0.0007 0.000008 0.003 0.0009 0.00001 0.004
Molybdenum Packaging Forklift, 7,000 lbs 1 93 0.75 18 6,570 hours 0.51 0.0005 0.000005 0.002 0.0004 0.000005 0.002
Copper Cathode Forklift 1 93 0.75 18 6,570 hours 0.44 0.0004 0.000005 0.002 0.0005 0.000006 0.002
Boom Trucks 10 tons, 45 foot boom 1 200 0.75 18 6,570 hours 0.44 0.0003 0.000004 0.001 0.0004 0.000005 0.002
Boom Trucks 15 tons, 60 foot boom 1 210 0.75 18 6,570 hours 0.44 0.0003 0.000004 0.001 0.0004 0.000005 0.002
Front End Loader, 6 yd3 1 349 0.75 18 6,570 hours 0.24 0.0005 0.000006 0.002 0.002 0.00002 0.007
Front End Loader, 5 yd3 1 149 0.75 18 6,570 hours 0.44 0.0003 0.000003 0.001 0.0003 0.000004 0.001
Bob Cats, 2,400 lbs 2 82 0.75 18 6,570 hours 0.5 0.0008 0.00001 0.003 0.0008 0.00001 0.003
Rosemont Copper ProjectEmission Inventory Information JBR ENVIRONMENTAL CONSULTANTS, INC.
November 2011Page H73
AZRP00255
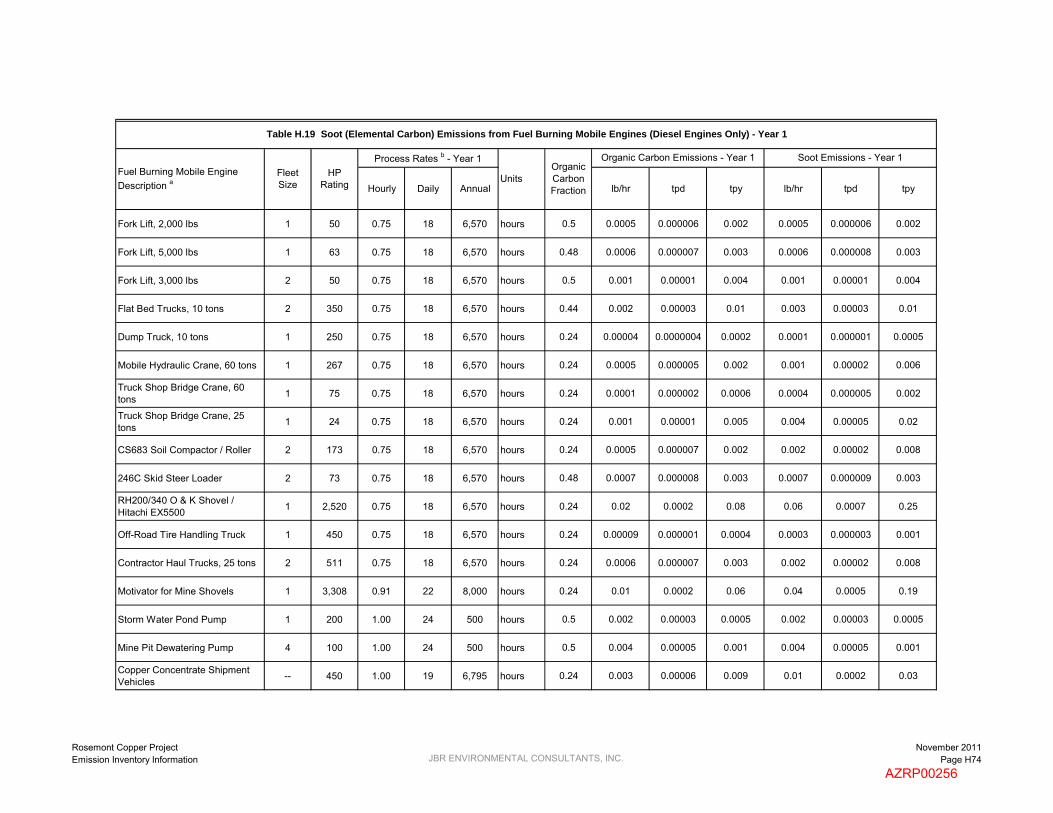
Hourly Daily Annual lb/hr tpd tpy lb/hr tpd tpy
Soot Emissions - Year 1
Table H.19 Soot (Elemental Carbon) Emissions from Fuel Burning Mobile Engines (Diesel Engines Only) - Year 1
Fuel Burning Mobile Engine Description a
Fleet Size
HP Rating
Process Rates b - Year 1
UnitsOrganic Carbon Fraction
Organic Carbon Emissions - Year 1
Fork Lift, 2,000 lbs 1 50 0.75 18 6,570 hours 0.5 0.0005 0.000006 0.002 0.0005 0.000006 0.002
Fork Lift, 5,000 lbs 1 63 0.75 18 6,570 hours 0.48 0.0006 0.000007 0.003 0.0006 0.000008 0.003
Fork Lift, 3,000 lbs 2 50 0.75 18 6,570 hours 0.5 0.001 0.00001 0.004 0.001 0.00001 0.004
Flat Bed Trucks, 10 tons 2 350 0.75 18 6,570 hours 0.44 0.002 0.00003 0.01 0.003 0.00003 0.01
Dump Truck, 10 tons 1 250 0.75 18 6,570 hours 0.24 0.00004 0.0000004 0.0002 0.0001 0.000001 0.0005
Mobile Hydraulic Crane, 60 tons 1 267 0.75 18 6,570 hours 0.24 0.0005 0.000005 0.002 0.001 0.00002 0.006
Truck Shop Bridge Crane, 60 tons 1 75 0.75 18 6,570 hours 0.24 0.0001 0.000002 0.0006 0.0004 0.000005 0.002
Truck Shop Bridge Crane, 25 tons 1 24 0.75 18 6,570 hours 0.24 0.001 0.00001 0.005 0.004 0.00005 0.02
CS683 Soil Compactor / Roller 2 173 0.75 18 6,570 hours 0.24 0.0005 0.000007 0.002 0.002 0.00002 0.008
246C Skid Steer Loader 2 73 0.75 18 6,570 hours 0.48 0.0007 0.000008 0.003 0.0007 0.000009 0.003
RH200/340 O & K Shovel / Hitachi EX5500 1 2,520 0.75 18 6,570 hours 0.24 0.02 0.0002 0.08 0.06 0.0007 0.25
Off-Road Tire Handling Truck 1 450 0.75 18 6,570 hours 0.24 0.00009 0.000001 0.0004 0.0003 0.000003 0.001
Contractor Haul Trucks, 25 tons 2 511 0.75 18 6,570 hours 0.24 0.0006 0.000007 0.003 0.002 0.00002 0.008
Motivator for Mine Shovels 1 3,308 0.91 22 8,000 hours 0.24 0.01 0.0002 0.06 0.04 0.0005 0.19
Storm Water Pond Pump 1 200 1.00 24 500 hours 0.5 0.002 0.00003 0.0005 0.002 0.00003 0.0005
Mine Pit Dewatering Pump 4 100 1.00 24 500 hours 0.5 0.004 0.00005 0.001 0.004 0.00005 0.001
Copper Concentrate Shipment Vehicles -- 450 1.00 19 6,795 hours 0.24 0.003 0.00006 0.009 0.01 0.0002 0.03
Rosemont Copper ProjectEmission Inventory Information JBR ENVIRONMENTAL CONSULTANTS, INC.
November 2011Page H74
AZRP00256

Hourly Daily Annual lb/hr tpd tpy lb/hr tpd tpy
Soot Emissions - Year 1
Table H.19 Soot (Elemental Carbon) Emissions from Fuel Burning Mobile Engines (Diesel Engines Only) - Year 1
Fuel Burning Mobile Engine Description a
Fleet Size
HP Rating
Process Rates b - Year 1
UnitsOrganic Carbon Fraction
Organic Carbon Emissions - Year 1
Molybdenum Concentrate Shipment Vehicles -- 450 1.00 1 86 hours 0.24 0.0002 0.0000006 0.00009 0.0008 0.000002 0.0003
Sulfuric Acid Delivery Vehicles -- 450 1.00 6 2,081 hours 0.24 0.002 0.000008 0.003 0.008 0.00003 0.009
Lime Delivery Vehicles -- 450 1.00 2 763 hours 0.24 0.002 0.000003 0.001 0.005 0.000009 0.003
SAG Mill and Ball Mill Grinding Balls Delivery Vehicles -- 450 1.00 1 234 hours 0.24 0.001 0.000001 0.0003 0.005 0.000004 0.001
Diesel Fuel Delivery Vehicles -- 500 1.00 2 685 hours 0.24 0.002 0.000003 0.0009 0.005 0.000008 0.003
Copper Cathode Shipment Vehicles -- 450 1.00 1 200 hours 0.24 0.001 0.000002 0.0003 0.004 0.000007 0.0008
Ammonium Nitrate Delivery Vehicles -- 450 1.00 1 255 hours 0.44 0.001 0.000002 0.0006 0.001 0.000003 0.0008
Miscellaneous Consumables Delivery Vehicles -- 450 1.00 1 499 hours 0.44 0.001 0.000005 0.001 0.002 0.000006 0.002
Miscellaneous Fuels and Lubricants Delivery Vehicles -- 450 1.00 1 44 hours 0.44 0.00 0.00 0.00 0.00 0.00 0.00
Pickup Trucks (gasoline) 20 350 0.25 6 2,190 hours -- -- -- -- -- -- --
Crew Van (gasoline) 3 350 0.25 6 2,190 hours -- -- -- -- -- -- --
Lot Pick-Up Trucks (gasoline) 20 250 0.25 6 2,190 hours -- -- -- -- -- -- --
6.60 0.08 21.79
0.92 0.01 3.87
7.52 0.09 25.66
a Fuel burning mobile engines are diesel fuel fired unless otherwise noted.
b Except for the shipment and delivery vehicles, the process rates are for a single mobile engine. The process rates for the shipment and delivery vehicles are representative of the entire fleet.
Total Emissions from Haul Truck Engines:
Total Emissions from Other Mobile Engines:
Total Emissions from All Mobile Engines:
Rosemont Copper ProjectEmission Inventory Information JBR ENVIRONMENTAL CONSULTANTS, INC.
November 2011Page H75
AZRP00257

Rosemont Copper Project November 2011 Emission Inventory Information Page H76
JBR ENVIRONMENTAL CONSULTANTS, INC.
YEAR 5
AZRP00258

PM/TSP PM10 PM2.5 Unitsk
(PM/TSP)
k (PM10) k (PM2.5) A (ft2) U (mph) M (%) W (tons) s (%) S (mph) P (days/yr)a
(PM/TSP)
a (PM10) a (PM2.5)b
(PM/TSP)
b (PM10) b (PM2.5) u* ut* e f (%) PE
Drilling Drilling 3-05-020-10 1.30 0.43 0.08 lb/hole holes 1 0.33 0.06 AP-42, Section 11.9, Table11.9-4 (10/98)
Blast Blasting 3-05-020-09 328.26 170.69 9.85 lb/blast blasts 1 0.52 0.03 81,920 AP-42, Section 11.9, Table11.9-1 (10/98)
Loading Loading 3-03-024-08 0.0007 0.0003 0.00005 lb/ton tons 0.74 0.35 0.053 4.14 4 AP-42, Section 13.2.4,Expression 1 (11/06)
HaulingHD Haul Trucks - Hourly/Daily 3-05-020-11 21.25 5.46 0.55 lb/VMT VMT 4.9 1.5 0.15 305 5.0 0.7 0.9 0.9 0.45 0.45 0.45 AP-42, Section 13.2.2,Expression 1a (11/06)
HaulingA Haul Trucks - Annual 3-05-020-11 17.70 4.55 0.45 lb/VMT VMT 4.9 1.5 0.15 305 5.0 61 0.7 0.9 0.9 0.45 0.45 0.45 AP-42, Section 13.2.2,Expressions 1a and 2 (11/06)
Bldzrs Bulldozers 3-05-010-99 2.82 0.43 0.30 lb/hr hrs 5.7 0.75 0.60 4 2.5 1.2 1.5 1.2 1.3 1.4 1.3 AP-42, Section 11.9, Table11.9-1 (10/98)
SupVehY5H Support Vehicular Traffic - Year 5 Hourly 3-05-010-99 6.96 1.79 0.18 lb/VMT VMT 4.9 1.5 0.15 25.5 5.0 0.7 0.9 0.9 0.45 0.45 0.45 AP-42, Section 13.2.2,
Expression 1a (11/06)
SupVehY5D Support Vehicular Traffic - Year 5 Daily 3-05-010-99 7.19 1.85 0.18 lb/VMT VMT 4.9 1.5 0.15 27.4 5.0 0.7 0.9 0.9 0.45 0.45 0.45 AP-42, Section 13.2.2,
Expression 1a (11/06)
SupVehY5A Support Vehicular Traffic - Year 5 Annual 3-05-010-99 6.06 1.56 0.16 lb/VMT VMT 4.9 1.5 0.15 28.2 5.0 61 0.7 0.9 0.9 0.45 0.45 0.45 AP-42, Section 13.2.2,
Expressions 1a and 2 (11/06)
WtrTrksHD Water Trucks - Hourly/Daily 3-05-010-99 17.06 4.38 0.44 lb/VMT VMT 4.9 1.5 0.15 187.4 5.0 0.7 0.9 0.9 0.45 0.45 0.45 AP-42, Section 13.2.2,Expression 1a (11/06)
WtrTrksA Water Trucks - Annual 3-05-010-99 14.21 3.65 0.37 lb/VMT VMT 4.9 1.5 0.15 187.4 5.0 61 0.7 0.9 0.9 0.45 0.45 0.45 AP-42, Section 13.2.2,Expressions 1a and 2 (11/06)
GradersY5 Graders - Year 5 3-05-010-99 1.99 0.70 0.06 lb/VMT VMT 1 0.60 0.031 4.78 0.040 0.051 0.040 2.5 2.0 2.5 AP-42, Section 11.9, Table11.9-1 (10/98)
TrMlyCncPrt Molybdnum Concentrate Transfer(Protected) 3-03-024-08 0.00002 0.00001 0.000002 lb/ton tons 0.74 0.35 0.053 1.3 15 AP-42, Section 13.2.4,
Expression 1 (11/06)
DTrMlyCncPrt Dried Molybdenum Concentrate Transfer (Protected) 3-03-024-08 0.00004 0.00002 0.000003 lb/ton tons 0.74 0.35 0.053 1.3 10 AP-42, Section 13.2.4,
Expression 1 (11/06)
DTrMlyCnc Dried Molybdenum Concentrate Transfer (Unprotected) 3-03-024-08 0.0003 0.0002 0.00002 lb/ton tons 0.74 0.35 0.053 6.21 10 AP-42, Section 13.2.4,
Expression 1 (11/06)
TrCuCncPrt Copper Concentrate Transfer (Protected) 3-03-024-08 0.00004 0.00002 0.000003 lb/ton tons 0.74 0.35 0.053 1.3 10 AP-42, Section 13.2.4,
Expression 1 (11/06)
TrCuCnc Copper Concentrate Loadout 3-03-024-08 0.0003 0.0002 0.00002 lb/ton tons 0.74 0.35 0.053 6.21 10 AP-42, Section 13.2.4,Expression 1 (11/06)
FiltTailPrt Filtered Tailings Transfer (Protected) 3-03-024-08 0.00002 0.00001 0.000002 lb/ton tons 0.74 0.35 0.053 1.3 15 AP-42, Section 13.2.4,
Expression 1 (11/06)
FiltTail Filtered Tailings Transfer (Unprotected) 3-03-024-08 0.0002 0.00009 0.00001 lb/ton tons 0.74 0.35 0.053 6.21 15 AP-42, Section 13.2.4,
Expression 1 (11/06)
CrushP Primary Crushing - High Moisture Ore 3-03-024-05 0.02 0.009 0.002 lb/ton tons 0.185
AP-42, Section 11.24, Table11.24-2 (08/82) and 11.19.2-2 (08/04)
CrushS Secondary Crushing - High Moisture Ore 3-03-024-06 0.05 0.02 0.004 lb/ton tons 0.185
AP-42, Section 11.24, Table11.24-2 (08/82) and 11.19.2-2 (08/04)
CrushT Tertiary Crushing - High Moisture Ore 3-03-024-07 0.06 0.02 0.004 lb/ton tons 0.185
AP-42, Section 11.24, Table11.24-2 (08/82) and 11.19.2-2(08/04)
Screen Screening 3-05-020-02 0.025 0.0087 0.0006 lb/ton tons 0.068 AP-42, Section 11.19, Table11.19.2-2 (08/04)
MolyDry Drying of High Moisture Ore 3-03-024-11 19.70 12.00 5.91 lb/ton tons 0.30AP-42, Section 11.24, Table11.24-2 (08/82) and Appendix B.2 (09/96)
TrStnPrt Material Transfer (Protected) 3-03-024-08 0.0002 0.00007 0.00001 lb/ton tons 0.74 0.35 0.053 1.3 4 AP-42, Section 13.2.4,Expression 1 (11/06)
TrStnUnp Material Transfer (Unprotected) 3-03-024-08 0.001 0.0006 0.00009 lb/ton tons 0.74 0.35 0.053 6.21 4 AP-42, Section 13.2.4,Expression 1 (11/06)
LimeLd Lime Product Loading, Enclosed Truck 3-05-016-26 0.61 0.29 0.04 lb/ton tons 1 0.47 0.07
AP-42, Section 11.17, Table11.17-4 (02/98) and AP-42, Section 13.2.4 (11/06)
ReagTr Miscellaneous Reagent Material Transfer 3-03-024-04 0.008 0.004 0.0006 lb/ton tons 0.74 0.35 0.053 6.21 1 AP-42, Section 13.2.4,
Expression 1 (11/06)
Process Code Process DescriptionParticulate Matter Emission Factor Inputs a
Table H.20 Particulate Matter Emission Factors - Year 5
SCC Code Prod. Rate Units Reference
Emission Factors
Rosemont Copper ProjectEmission Inventory Information JBR ENVIRONMENTAL CONSULTANTS, INC.
November 2011Page H77
AZRP00259

PM/TSP PM10 PM2.5 Unitsk
(PM/TSP)
k (PM10) k (PM2.5) A (ft2) U (mph) M (%) W (tons) s (%) S (mph) P (days/yr)a
(PM/TSP)
a (PM10) a (PM2.5)b
(PM/TSP)
b (PM10) b (PM2.5) u* ut* e f (%) PE
Process Code Process DescriptionParticulate Matter Emission Factor Inputs a
Table H.20 Particulate Matter Emission Factors - Year 5
SCC Code Prod. Rate Units Reference
Emission Factors
ICDE1 Internal Combustion Diesel Engine 37 ≤ kW > 75 2-02-001-02 0.40 0.40 0.40 g/kW-hr hours 1 1 1 NSPS Emission Standard
ICDE2 Internal Combustion Diesel Engine 225 ≤ kW > 450 2-02-001-02 0.20 0.20 0.20 g/kW-hr hours 1 1 1 NSPS Emission Standard
ICDE3 Internal Combustion Diesel Engine > 560 kW 2-02-001-02 0.20 0.20 0.20 g/kW-hr hours 1 1 1 NSPS Emission Standard
DFB Diesel (Distillate Oil) Fired Boiler <100 MMBtu/hr 1-02-005-03 3.30 2.30 1.54 lb/1000 gal hours 1 0.5 0.12 AP-42, Section 1.3, Tables
1.3-1, 1.3-2 and 1.3-6 (09/98)
CAS Crushing Area Scrubber none 1.29 1.28 1.13 lb/hr hours 1.01 1.00 0.88Voluntarily Accepted PM10
Emission Limit, PM and PM2.5
fractions of PM10 emissions
SAS Stockpile Area Scrubber none 2.61 2.59 2.10 lb/hr hours 1.01 1.00 0.81Voluntarily Accepted PM10
Emission Limit, PM and PM2.5
fractions of PM10 emissions
RTS Reclaim Tunnel Scrubber none 1.08 1.07 0.87 lb/hr hours 1.01 1.00 0.81Voluntarily Accepted PM10
Emission Limit, PM and PM2.5
fractions of PM10 emissions
PCAS Pebble Crusher Area Scrubber none 1.58 1.56 1.31 lb/hr hours 1.02 1.00 0.84Voluntarily Accepted PM10
Emission Limit, PM and PM2.5
fractions of PM10 emissions
CCS Copper Concentrate Scrubbers none 3.59 3.55 3.04 lb/hr hours 1.01 1.00 0.86Voluntarily Accepted PM10
Emission Limit, PM and PM2.5
fractions of PM10 emissions
MS/EP Molybdenum Scrubber / Electrostatic Precipitator none 0.015 0.014 0.013 lb/hr hours 1.10 1.00 0.94
Voluntarily Accepted PM10
Emission Limit, PM and PM2.5
fractions of PM10 emissions
MDC Molybdenum Dust Collector none 0.021 0.010 0.002 gr/dscf dscf 2.11 1.00 0.15Voluntarily Accepted PM10
Emission Limit, PM and PM2.5
fractions of PM10 emissions
LDC Laboratory Dust Collectors none 0.008 0.005 0.002 gr/dscf dscf 1.65 1.00 0.49Voluntarily Accepted PM10
Emission Limit, PM and PM2.5
fractions of PM10 emissions
WindROM Wind Erosion - Run of MineStockpile 3-03-888-01 0.21 0.11 0.02 ton/acre-yr acres 1 0.5 0.075 2.5 38 4.77 22
FDEMIb (07/83), p. 51-57, MRIEquation, AP-42, Section 13.2.5 (11/06) and Table 13.2.4-1 (11/06)
WindCvd Wind Erosion - Covered Stockpile 3-03-888-01 0 0 0 ton/acre-yr acres Assumed
TailStrg Wind Erosion - Tailings Storage 3-03-888-01 0.02 0.01 0.002 ton/acre-yr acres 1 0.5 0.075 0.57 0.43 AP-42, Section 13.2.5 (11/06)
b FDEMI = Fugitive Dust Emission Factors for the Mining Industry
a k = particle size multiplier, A = horizonal area of blasting surface, U = mean wind speed, M = material moisture content, W = mean vehicle weight, s = surface material silt content, S = mean vehicle speed, P = number of days per year with at least 0.01 inches of precipitation, a = constant based on particle size,b = constant based on particle size, u* = friction velocity, ut
* = threshold friction velocity, e = surface erodibility, f = percentage of time the wind speed exceeds 12 mph, PE = Thornthwaite's Precipitation-Evaporation Index
Rosemont Copper ProjectEmission Inventory Information JBR ENVIRONMENTAL CONSULTANTS, INC.
November 2011Page H78
AZRP00260

CO NOX SO2 VOC H2SO4 CO2 CH4 N2O Units
Blast Blasting 3-05-020-09 67.00 17.00 2.00 0 0 566 0.02 0.005 lb/tons ANFO tons ANFOAP-42 Section 13.3, Table 13.3-1 (02/80) and 40 CFR 98, Tables C-1 and C-2a
SX Solvent Extraction Mixers and Settlers 4-90-001-99 0 0 0 9.43E-05 0 0 0 0 lb/hr-ft2 hours Hydrometallurgy of Copper (Control Efficiency of 66%)
EW Electrowining Tankhouse none 0 0 0 0 1.57E-04 0 0 0 lb/hr-ft2 hours Applied Environmental Consultants - Reportb
ICDE1 Internal Combustion Diesel Engine 37 ≤ kW > 75 2-02-001-02 5.0 4.4 0.0066 0.3 0 694 0.03 0.006 g/kW-hr hours NSPS Emission Standard, Complete Sulfur Conversionc, and 40 CFR 98, Tables C-1 and C-2
ICDE2 Internal Combustion Diesel Engine 225 ≤ kW > 450 2-02-001-02 3.5 3.7 0.0066 0.3 0 694 0.03 0.006 g/kW-hr hours NSPS Emission Standard, Complete Sulfur Conversionc, and 40 CFR 98, Tables C-1 and C-2
ICDE3 Internal Combustion Diesel Engine > 560 kW 2-02-001-02 3.5 6.0 0.0066 0.40 0 694 0.03 0.006 g/kW-hr hours NSPS Emission Standard, Complete Sulfur Conversionc, and 40 CFR 98, Tables C-1 and C-2
DFB Diesel (Distillate Oil) Fired Boiler <100 MMBtu/hr 1-02-005-03 5.00 20.00 0.21 0.20 0 23,217 0.94 0.19 lb/1000 gal hours AP-42 Section 1.3, Tables 1.3-1 and 1.3-3 (05/10)c and 40 CFR 98, Tables C-1 and C-2
C7DT C7 Distribution Tank 4-03-010-19 0 0 0 1.08E-01 0 0 0 0 lb/hr hours EPA Tanks Program 4.0d
MST MIBC Storage Tank 4-90-999-98 0 0 0 3.53E-03 0 0 0 0 lb/hr hours EPA Tanks Program 4.0d
DFSTHV Diesel Fuel Storage Tank - Heavy Vehicles 4-03-010-19 0 0 0 1.39E-02 0 0 0 0 lb/hr hours EPA Tanks Program 4.0d
b "Measurement of Sulfuric Acid Mist Emissions from the Cyprus Twin Buttes Copper Company Electrowinning Tankhouse" (02/93).
d Assumes continuous operation.
a Assumes a fuel oil to ammonium nitrate ratio of 9.0%.
c SO2 emissions are calculated using a sulfur content of 0.0015% for diesel fuel.
Table H.21 Gaseous Emission Factors - Year 5
Process DescriptionProcess Code SCC Code Prod. Rate
Units ReferenceEmission Factor
Rosemont Copper ProjectEmission Inventory Information JBR ENVIRONMENTAL CONSULTANTS, INC.
November 2011Page H79
AZRP00261

Control Code Control Description Pick-up Efficiency (%)
Control Efficiency (%) Reference
CAS Crushing Area Scrubber (PC-CAS) 100% -- Assumed
SAS Stockpile Area Scrubber (PC-SAS) 100% -- Assumed
RTS Reclaim Tunnel Scrubber (PC-RTS) 100% -- Assumed
PCAS Pebble Crusher Area Scrubber (PC-PCAS) 100% -- Assumed
CCS Copper Concentrate Scrubbers (PC-CCS1/CCS2) 100% -- Assumed
MS/EP Molybdenum Scrubber (PC-MS) / Electrostatic Precipitator (PC-EP) 100% -- Assumed
BPLSV Bulk Pebble Lime Silo Bin Vent (PC-BPLBV) 100% 90% Vendor Specification
LSV Lime Storage Bin Vent (PC-LSBV) 100% 90% Vendor Specification
SMSV Sodium Metasilicate Storage Bin Vent (PC-SMSBV) 100% 90% Vendor Specification
CVS EW Cell Ventilation Scrubbers (PC-CVS) 100% 99% Engineering Design
MDC Molybdenum Dust Collector (PC-MDC) 100% -- Assumed
HaulRdUI Road Watering (Inside the Pit) N/A 90% Control of Open Fugitive Dust Sources (09/88) a
HaulRdUO Road Watering (Outside the Pit) N/A 90% Control of Open Fugitive Dust Sources (09/88) a
HaulRdWTI Road Watering - Water Trucks (Inside the Pit) N/A 90% Control of Open Fugitive Dust Sources (09/88) a
HaulRdWTO Road Watering - Water Trucks (Outside the Pit) N/A 90% Control of Open Fugitive Dust Sources (09/88) a
Water Addition of Process Water N/A 100% Assumed
WSpry Water Spray at Unprotected Points N/A 82.5% Average Value of AP-42, p. 11.19.1-5 (11/95)
Wet Wet Process N/A 100% Assumed
Clean Wet, Cleaned Ore (no fines) N/A 100% Assumed
Enclosed Totally Enclosed Transfer Point N/A 100% Assumed
UndrGrd Underground Transfer Point N/A 100% Assumed
None No Pollution Controls 0% 0% Assumed
Table H.22 Particulate Matter Control Efficiencies - Year 5
a EPA Document gives methods for calculating efficiencies - pages 5-9 to 5-14
Rosemont Copper ProjectEmission Inventory Information JBR ENVIRONMENTAL CONSULTANTS, INC.
November 2011Page H80
AZRP00262
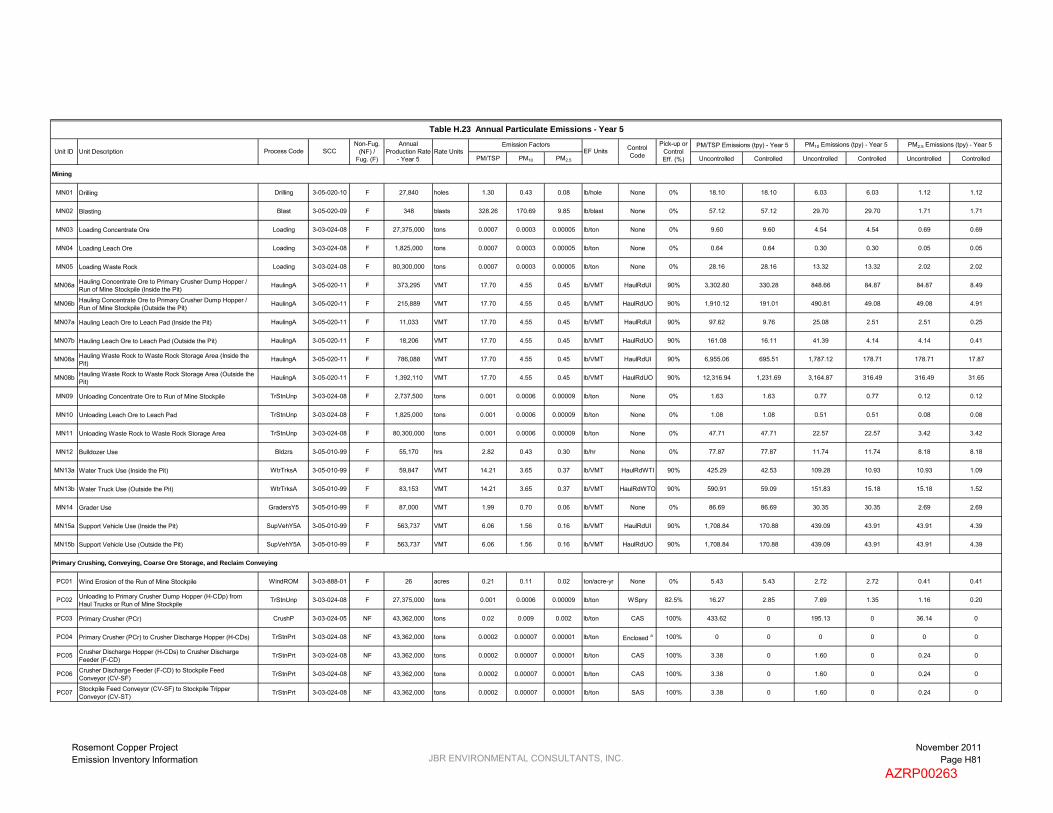
PM/TSP PM10 PM2.5 Uncontrolled Controlled Uncontrolled Controlled Uncontrolled Controlled
Mining
MN01 Drilling Drilling 3-05-020-10 F 27,840 holes 1.30 0.43 0.08 lb/hole None 0% 18.10 18.10 6.03 6.03 1.12 1.12
MN02 Blasting Blast 3-05-020-09 F 348 blasts 328.26 170.69 9.85 lb/blast None 0% 57.12 57.12 29.70 29.70 1.71 1.71
MN03 Loading Concentrate Ore Loading 3-03-024-08 F 27,375,000 tons 0.0007 0.0003 0.00005 lb/ton None 0% 9.60 9.60 4.54 4.54 0.69 0.69
MN04 Loading Leach Ore Loading 3-03-024-08 F 1,825,000 tons 0.0007 0.0003 0.00005 lb/ton None 0% 0.64 0.64 0.30 0.30 0.05 0.05
MN05 Loading Waste Rock Loading 3-03-024-08 F 80,300,000 tons 0.0007 0.0003 0.00005 lb/ton None 0% 28.16 28.16 13.32 13.32 2.02 2.02
MN06a Hauling Concentrate Ore to Primary Crusher Dump Hopper / Run of Mine Stockpile (Inside the Pit)
HaulingA 3-05-020-11 F 373,295 VMT 17.70 4.55 0.45 lb/VMT HaulRdUI 90% 3,302.80 330.28 848.66 84.87 84.87 8.49
MN06b Hauling Concentrate Ore to Primary Crusher Dump Hopper / Run of Mine Stockpile (Outside the Pit)
HaulingA 3-05-020-11 F 215,889 VMT 17.70 4.55 0.45 lb/VMT HaulRdUO 90% 1,910.12 191.01 490.81 49.08 49.08 4.91
MN07a Hauling Leach Ore to Leach Pad (Inside the Pit) HaulingA 3-05-020-11 F 11,033 VMT 17.70 4.55 0.45 lb/VMT HaulRdUI 90% 97.62 9.76 25.08 2.51 2.51 0.25
MN07b Hauling Leach Ore to Leach Pad (Outside the Pit) HaulingA 3-05-020-11 F 18,206 VMT 17.70 4.55 0.45 lb/VMT HaulRdUO 90% 161.08 16.11 41.39 4.14 4.14 0.41
MN08a Hauling Waste Rock to Waste Rock Storage Area (Inside the Pit)
HaulingA 3-05-020-11 F 786,088 VMT 17.70 4.55 0.45 lb/VMT HaulRdUI 90% 6,955.06 695.51 1,787.12 178.71 178.71 17.87
MN08b Hauling Waste Rock to Waste Rock Storage Area (Outside the Pit)
HaulingA 3-05-020-11 F 1,392,110 VMT 17.70 4.55 0.45 lb/VMT HaulRdUO 90% 12,316.94 1,231.69 3,164.87 316.49 316.49 31.65
MN09 Unloading Concentrate Ore to Run of Mine Stockpile TrStnUnp 3-03-024-08 F 2,737,500 tons 0.001 0.0006 0.00009 lb/ton None 0% 1.63 1.63 0.77 0.77 0.12 0.12
MN10 Unloading Leach Ore to Leach Pad TrStnUnp 3-03-024-08 F 1,825,000 tons 0.001 0.0006 0.00009 lb/ton None 0% 1.08 1.08 0.51 0.51 0.08 0.08
MN11 Unloading Waste Rock to Waste Rock Storage Area TrStnUnp 3-03-024-08 F 80,300,000 tons 0.001 0.0006 0.00009 lb/ton None 0% 47.71 47.71 22.57 22.57 3.42 3.42
MN12 Bulldozer Use Bldzrs 3-05-010-99 F 55,170 hrs 2.82 0.43 0.30 lb/hr None 0% 77.87 77.87 11.74 11.74 8.18 8.18
MN13a Water Truck Use (Inside the Pit) WtrTrksA 3-05-010-99 F 59,847 VMT 14.21 3.65 0.37 lb/VMT HaulRdWTI 90% 425.29 42.53 109.28 10.93 10.93 1.09
MN13b Water Truck Use (Outside the Pit) WtrTrksA 3-05-010-99 F 83,153 VMT 14.21 3.65 0.37 lb/VMT HaulRdWTO 90% 590.91 59.09 151.83 15.18 15.18 1.52
MN14 Grader Use GradersY5 3-05-010-99 F 87,000 VMT 1.99 0.70 0.06 lb/VMT None 0% 86.69 86.69 30.35 30.35 2.69 2.69
MN15a Support Vehicle Use (Inside the Pit) SupVehY5A 3-05-010-99 F 563,737 VMT 6.06 1.56 0.16 lb/VMT HaulRdUI 90% 1,708.84 170.88 439.09 43.91 43.91 4.39
MN15b Support Vehicle Use (Outside the Pit) SupVehY5A 3-05-010-99 F 563,737 VMT 6.06 1.56 0.16 lb/VMT HaulRdUO 90% 1,708.84 170.88 439.09 43.91 43.91 4.39
Primary Crushing, Conveying, Coarse Ore Storage, and Reclaim Conveying
PC01 Wind Erosion of the Run of Mine Stockpile WindROM 3-03-888-01 F 26 acres 0.21 0.11 0.02 ton/acre-yr None 0% 5.43 5.43 2.72 2.72 0.41 0.41
PC02 Unloading to Primary Crusher Dump Hopper (H-CDp) fromHaul Trucks or Run of Mine Stockpile
TrStnUnp 3-03-024-08 F 27,375,000 tons 0.001 0.0006 0.00009 lb/ton WSpry 82.5% 16.27 2.85 7.69 1.35 1.16 0.20
PC03 Primary Crusher (PCr) CrushP 3-03-024-05 NF 43,362,000 tons 0.02 0.009 0.002 lb/ton CAS 100% 433.62 0 195.13 0 36.14 0
PC04 Primary Crusher (PCr) to Crusher Discharge Hopper (H-CDs) TrStnPrt 3-03-024-08 NF 43,362,000 tons 0.0002 0.00007 0.00001 lb/ton Enclosed a 100% 0 0 0 0 0 0
PC05 Crusher Discharge Hopper (H-CDs) to Crusher DischargeFeeder (F-CD)
TrStnPrt 3-03-024-08 NF 43,362,000 tons 0.0002 0.00007 0.00001 lb/ton CAS 100% 3.38 0 1.60 0 0.24 0
PC06 Crusher Discharge Feeder (F-CD) to Stockpile FeedConveyor (CV-SF)
TrStnPrt 3-03-024-08 NF 43,362,000 tons 0.0002 0.00007 0.00001 lb/ton CAS 100% 3.38 0 1.60 0 0.24 0
PC07 Stockpile Feed Conveyor (CV-SF) to Stockpile TripperConveyor (CV-ST)
TrStnPrt 3-03-024-08 NF 43,362,000 tons 0.0002 0.00007 0.00001 lb/ton SAS 100% 3.38 0 1.60 0 0.24 0
SCCNon-Fug.
(NF) / Fug. (F)
PM10 Emissions (tpy) - Year 5Pick-up or Control Eff. (%)
Annual Production Rate
- Year 5
Emission FactorsEF Units
Table H.23 Annual Particulate Emissions - Year 5
PM2.5 Emissions (tpy) - Year 5PM/TSP Emissions (tpy) - Year 5Control CodeRate UnitsUnit ID Unit Description Process Code
Rosemont Copper ProjectEmission Inventory Information JBR ENVIRONMENTAL CONSULTANTS, INC.
November 2011Page H81
AZRP00263
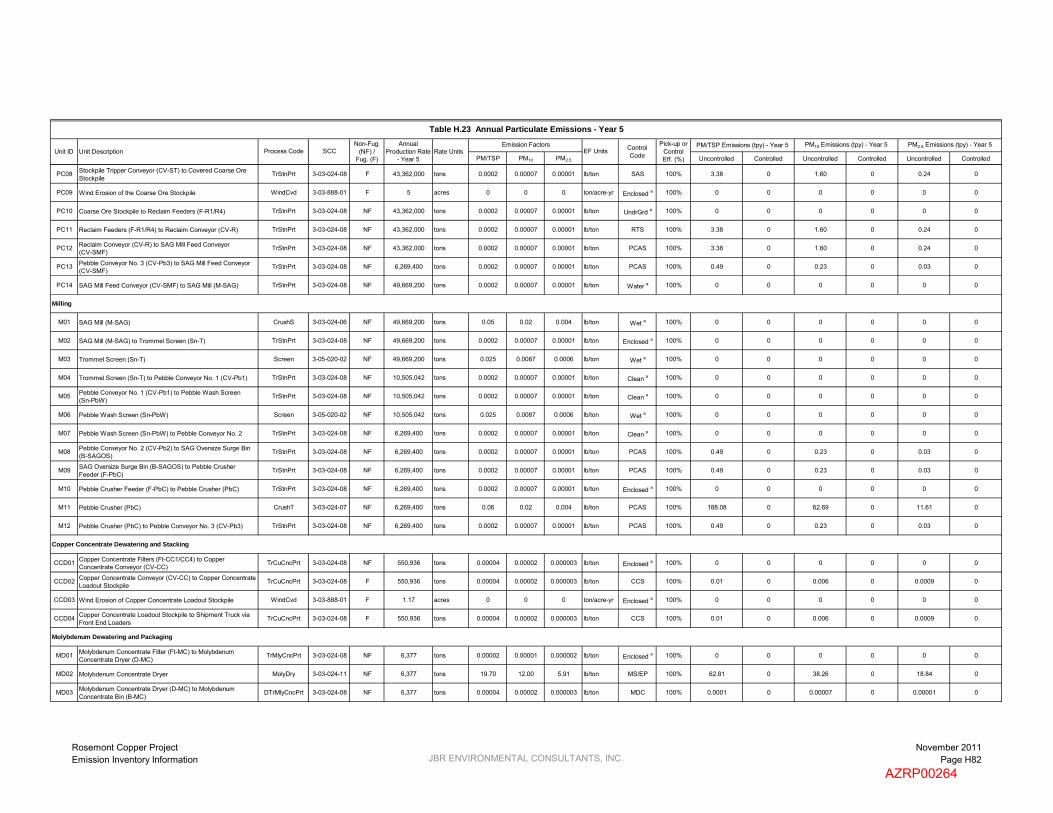
PM/TSP PM10 PM2.5 Uncontrolled Controlled Uncontrolled Controlled Uncontrolled ControlledSCC
Non-Fug. (NF) /
Fug. (F)
PM10 Emissions (tpy) - Year 5Pick-up or Control Eff. (%)
Annual Production Rate
- Year 5
Emission FactorsEF Units
Table H.23 Annual Particulate Emissions - Year 5
PM2.5 Emissions (tpy) - Year 5PM/TSP Emissions (tpy) - Year 5Control CodeRate UnitsUnit ID Unit Description Process Code
PC08 Stockpile Tripper Conveyor (CV-ST) to Covered Coarse Ore Stockpile
TrStnPrt 3-03-024-08 F 43,362,000 tons 0.0002 0.00007 0.00001 lb/ton SAS 100% 3.38 0 1.60 0 0.24 0
PC09 Wind Erosion of the Coarse Ore Stockpile WindCvd 3-03-888-01 F 5 acres 0 0 0 ton/acre-yr Enclosed a 100% 0 0 0 0 0 0
PC10 Coarse Ore Stockpile to Reclaim Feeders (F-R1/R4) TrStnPrt 3-03-024-08 NF 43,362,000 tons 0.0002 0.00007 0.00001 lb/ton UndrGrd a 100% 0 0 0 0 0 0
PC11 Reclaim Feeders (F-R1/R4) to Reclaim Conveyor (CV-R) TrStnPrt 3-03-024-08 NF 43,362,000 tons 0.0002 0.00007 0.00001 lb/ton RTS 100% 3.38 0 1.60 0 0.24 0
PC12 Reclaim Conveyor (CV-R) to SAG Mill Feed Conveyor(CV-SMF) TrStnPrt 3-03-024-08 NF 43,362,000 tons 0.0002 0.00007 0.00001 lb/ton PCAS 100% 3.38 0 1.60 0 0.24 0
PC13 Pebble Conveyor No. 3 (CV-Pb3) to SAG Mill Feed Conveyor (CV-SMF)
TrStnPrt 3-03-024-08 NF 6,269,400 tons 0.0002 0.00007 0.00001 lb/ton PCAS 100% 0.49 0 0.23 0 0.03 0
PC14 SAG Mill Feed Conveyor (CV-SMF) to SAG Mill (M-SAG) TrStnPrt 3-03-024-08 NF 49,669,200 tons 0.0002 0.00007 0.00001 lb/ton Water a 100% 0 0 0 0 0 0
Milling
M01 SAG Mill (M-SAG) CrushS 3-03-024-06 NF 49,669,200 tons 0.05 0.02 0.004 lb/ton Wet a 100% 0 0 0 0 0 0
M02 SAG Mill (M-SAG) to Trommel Screen (Sn-T) TrStnPrt 3-03-024-08 NF 49,669,200 tons 0.0002 0.00007 0.00001 lb/ton Enclosed a 100% 0 0 0 0 0 0
M03 Trommel Screen (Sn-T) Screen 3-05-020-02 NF 49,669,200 tons 0.025 0.0087 0.0006 lb/ton Wet a 100% 0 0 0 0 0 0
M04 Trommel Screen (Sn-T) to Pebble Conveyor No. 1 (CV-Pb1) TrStnPrt 3-03-024-08 NF 10,505,042 tons 0.0002 0.00007 0.00001 lb/ton Clean a 100% 0 0 0 0 0 0
M05 Pebble Conveyor No. 1 (CV-Pb1) to Pebble Wash Screen(Sn-PbW)
TrStnPrt 3-03-024-08 NF 10,505,042 tons 0.0002 0.00007 0.00001 lb/ton Clean a 100% 0 0 0 0 0 0
M06 Pebble Wash Screen (Sn-PbW) Screen 3-05-020-02 NF 10,505,042 tons 0.025 0.0087 0.0006 lb/ton Wet a 100% 0 0 0 0 0 0
M07 Pebble Wash Screen (Sn-PbW) to Pebble Conveyor No. 2 TrStnPrt 3-03-024-08 NF 6,269,400 tons 0.0002 0.00007 0.00001 lb/ton Clean a 100% 0 0 0 0 0 0
M08 Pebble Conveyor No. 2 (CV-Pb2) to SAG Oversize Surge Bin(B-SAGOS) TrStnPrt 3-03-024-08 NF 6,269,400 tons 0.0002 0.00007 0.00001 lb/ton PCAS 100% 0.49 0 0.23 0 0.03 0
M09 SAG Oversize Surge Bin (B-SAGOS) to Pebble CrusherFeeder (F-PbC)
TrStnPrt 3-03-024-08 NF 6,269,400 tons 0.0002 0.00007 0.00001 lb/ton PCAS 100% 0.49 0 0.23 0 0.03 0
M10 Pebble Crusher Feeder (F-PbC) to Pebble Crusher (PbC) TrStnPrt 3-03-024-08 NF 6,269,400 tons 0.0002 0.00007 0.00001 lb/ton Enclosed a 100% 0 0 0 0 0 0
M11 Pebble Crusher (PbC) CrushT 3-03-024-07 NF 6,269,400 tons 0.06 0.02 0.004 lb/ton PCAS 100% 188.08 0 62.69 0 11.61 0
M12 Pebble Crusher (PbC) to Pebble Conveyor No. 3 (CV-Pb3) TrStnPrt 3-03-024-08 NF 6,269,400 tons 0.0002 0.00007 0.00001 lb/ton PCAS 100% 0.49 0 0.23 0 0.03 0
Copper Concentrate Dewatering and Stacking
CCD01 Copper Concentrate Filters (Ft-CC1/CC4) to Copper Concentrate Conveyor (CV-CC) TrCuCncPrt 3-03-024-08 NF 550,936 tons 0.00004 0.00002 0.000003 lb/ton Enclosed a 100% 0 0 0 0 0 0
CCD02 Copper Concentrate Conveyor (CV-CC) to Copper Concentrate Loadout Stockpile
TrCuCncPrt 3-03-024-08 F 550,936 tons 0.00004 0.00002 0.000003 lb/ton CCS 100% 0.01 0 0.006 0 0.0009 0
CCD03 Wind Erosion of Copper Concentrate Loadout Stockpile WindCvd 3-03-888-01 F 1.17 acres 0 0 0 ton/acre-yr Enclosed a 100% 0 0 0 0 0 0
CCD04 Copper Concentrate Loadout Stockpile to Shipment Truck via Front End Loaders
TrCuCncPrt 3-03-024-08 F 550,936 tons 0.00004 0.00002 0.000003 lb/ton CCS 100% 0.01 0 0.006 0 0.0009 0
Molybdenum Dewatering and Packaging
MD01 Molybdenum Concentrate Filter (Ft-MC) to Molybdenum Concentrate Dryer (D-MC)
TrMlyCncPrt 3-03-024-08 NF 6,377 tons 0.00002 0.00001 0.000002 lb/ton Enclosed a 100% 0 0 0 0 0 0
MD02 Molybdenum Concentrate Dryer MolyDry 3-03-024-11 NF 6,377 tons 19.70 12.00 5.91 lb/ton MS/EP 100% 62.81 0 38.26 0 18.84 0
MD03 Molybdenum Concentrate Dryer (D-MC) to MolybdenumConcentrate Bin (B-MC)
DTrMlyCncPrt 3-03-024-08 NF 6,377 tons 0.00004 0.00002 0.000003 lb/ton MDC 100% 0.0001 0 0.00007 0 0.00001 0
Rosemont Copper ProjectEmission Inventory Information JBR ENVIRONMENTAL CONSULTANTS, INC.
November 2011Page H82
AZRP00264

PM/TSP PM10 PM2.5 Uncontrolled Controlled Uncontrolled Controlled Uncontrolled ControlledSCC
Non-Fug. (NF) /
Fug. (F)
PM10 Emissions (tpy) - Year 5Pick-up or Control Eff. (%)
Annual Production Rate
- Year 5
Emission FactorsEF Units
Table H.23 Annual Particulate Emissions - Year 5
PM2.5 Emissions (tpy) - Year 5PM/TSP Emissions (tpy) - Year 5Control CodeRate UnitsUnit ID Unit Description Process Code
MD04 Molybdenum Concentrate Bin (B-MC) to MolybdenumConcentrate Hopper (H-MC)
DTrMlyCnc 3-03-024-08 NF 6,377 tons 0.0003 0.0002 0.00002 lb/ton None 0% 0.001 0.001 0.0005 0.0005 0.00008 0.00008
MD05 Molybdenum Concentrate Hopper (H-MC) to MolybdenumConcentrate Conveyor (CV-MC)
DTrMlyCncPrt 3-03-024-08 NF 6,377 tons 0.00004 0.00002 0.000003 lb/ton Enclosed a 100% 0 0 0 0 0 0
MD06 Molybdenum Concentrate Conveyor (CV-MC) to Molybdenum Packaging and Weigh System (MPS)
DTrMlyCnc 3-03-024-08 NF 6,377 tons 0.0003 0.0002 0.00002 lb/ton MDC 100% 0.001 0 0.0005 0 0.00008 0
Tailings Dewatering and Placement
TDS01 Tailings Filters (Ft-T1/T14) to Tailings Belt Feeders (F-T1/T14) FiltTailPrt 3-03-024-08 NF 42,804,687 tons 0.00002 0.00001 0.000002 lb/ton Enclosed a 100% 0 0 0 0 0 0
TDS02 Tailings Belt Feeders (F-T1/T14) to Fixed Tailings ConveyorNo. 1 (CV-F1)
FiltTailPrt 3-03-024-08 NF 42,804,687 tons 0.00002 0.00001 0.000002 lb/ton Enclosed a 100% 0 0 0 0 0 0
TDS03 Fixed Tailings Conveyor No. 1 (CV-F1) to Fixed TailingsConveyor No. 2 (CV-F2)
FiltTailPrt 3-03-024-08 NF 42,804,687 tons 0.00002 0.00001 0.000002 lb/ton Enclosed a 100% 0 0 0 0 0 0
TDS04 Fixed Tailings Conveyor No. 2 (CV-F2) to Fixed Tailings Conveyor No. 3 (CV-F3)
FiltTailPrt 3-03-024-08 NF 42,804,687 tons 0.00002 0.00001 0.000002 lb/ton None 0% 0.52 0.52 0.25 0.25 0.04 0.04
TDS05 Fixed Tailings Conveyor No. 3 (CV-F3) to RelocatableConveyor (CV-R1)
FiltTailPrt 3-03-024-08 F 42,804,687 tons 0.00002 0.00001 0.000002 lb/ton None 0% 0.52 0.52 0.25 0.25 0.04 0.04
TDS06 Relocatable Conveyor (CV-R1) to Shiftable Conveyor (CV-S1) FiltTailPrt 3-03-024-08 F 42,804,687 tons 0.00002 0.00001 0.000002 lb/ton None 0% 0.52 0.52 0.25 0.25 0.04 0.04
TDS07 Shiftable Conveyor (CV-S1) to Belt Wagon Conveyor(CV-BW1)
FiltTail 3-03-024-08 F 42,804,687 tons 0.0002 0.00009 0.00001 lb/ton None 0% 4.00 4.00 1.89 1.89 0.29 0.29
TDS08 Belt Wagon Conveyor (CV-BW1) to Spreader Crawler Mounted Conveyor (CV-SP1)
FiltTail 3-03-024-08 F 42,804,687 tons 0.0002 0.00009 0.00001 lb/ton None 0% 4.00 4.00 1.89 1.89 0.29 0.29
TDS09 Spreader Crawler Mounted Conveyor (CV-SP1) to Tailings Storage
FiltTail 3-03-024-08 F 42,804,687 tons 0.0002 0.00009 0.00001 lb/ton None 0% 4.00 4.00 1.89 1.89 0.29 0.29
TDS10 Wind Erosion of Tailings Storage TailStrg 3-03-888-01 F 1,500 acres 0.02 0.01 0.002 ton/acre-yr None 0% 30.23 30.23 15.11 15.11 2.27 2.27
Fuel Burning Equipment
FB01 Diesel Electrowinning Hot Water Generator (HWG) DFB 1-02-005-03 NF 8,760 hours 3.30 2.30 1.54 lb/1000 gal None 0% 0.63 0.63 0.44 0.44 0.30 0.30
6.0 MMBtu/hr
FB02 Thickener Area Emergency Generator (TEG) ICDE3 2-02-001-02 NF 500 hours 0.20 0.20 0.20 g/kW-hr None 0% 0.11 0.11 0.11 0.11 0.11 0.11
1,000 kW
FB03 PLS Pond Area Emergency Generator (PEG) ICDE3 2-02-001-02 NF 500 hours 0.20 0.20 0.20 g/kW-hr None 0% 0.11 0.11 0.11 0.11 0.11 0.11
1,000 kW
FB04 Main Substation Emergency Generator (MEG) ICDE3 2-02-001-02 NF 500 hours 0.20 0.20 0.20 g/kW-hr None 0% 0.08 0.08 0.08 0.08 0.08 0.08
750 kW
FB05 Administration Building Emergency Generator (AEG) ICDE3 2-02-001-02 NF 500 hours 0.20 0.20 0.20 g/kW-hr None 0% 0.08 0.08 0.08 0.08 0.08 0.08
750 kW
FB06 Electrowinning Building Emergency Generator (EWEG) ICDE1 2-02-001-02 NF 500 hours 0.40 0.40 0.40 g/kW-hr None 0% 0.01 0.01 0.01 0.01 0.01 0.01
50 kW
FB07 Primary Crusher Fire Water Pump (PCFWP) ICDE2 2-02-001-02 NF 500 hours 0.20 0.20 0.20 g/kW-hr None 0% 0.03 0.03 0.03 0.03 0.03 0.03
400 hp
Rosemont Copper ProjectEmission Inventory Information JBR ENVIRONMENTAL CONSULTANTS, INC.
November 2011Page H83
AZRP00265

PM/TSP PM10 PM2.5 Uncontrolled Controlled Uncontrolled Controlled Uncontrolled ControlledSCC
Non-Fug. (NF) /
Fug. (F)
PM10 Emissions (tpy) - Year 5Pick-up or Control Eff. (%)
Annual Production Rate
- Year 5
Emission FactorsEF Units
Table H.23 Annual Particulate Emissions - Year 5
PM2.5 Emissions (tpy) - Year 5PM/TSP Emissions (tpy) - Year 5Control CodeRate UnitsUnit ID Unit Description Process Code
FB08 SX/EW Fire Water Pump (SXFWP) ICDE2 2-02-001-02 NF 500 hours 0.20 0.20 0.20 g/kW-hr None 0% 0.03 0.03 0.03 0.03 0.03 0.03
400 hp
Miscellaneous Sources
MS01 Transfer of Bulk Pebble Lime to the Bulk Pebble Lime Silo(S-BPL) LimeLd 3-05-016-26 NF 37,800 tons 0.61 0.29 0.04 lb/ton BPLSV a 90% 1.15 1.15 0.55 0.55 0.08 0.08
MS02 Bulk Pebble Lime Silo (S-BPL) to Bulk Pebble Lime Silo Screw Conveyor (CV-BPLS) ReagTr 3-03-024-04 NF 37,800 tons 0.008 0.004 0.0006 lb/ton Enclosed a 100% 0 0 0 0 0 0
MS03 Bulk Pebble Lime Silo Screw Conveyor (CV-BPLS) to SAGMill Feed Conveyor (CV-SMF)
ReagTr 3-03-024-04 NF 37,800 tons 0.008 0.004 0.0006 lb/ton None 0% 0.16 0.16 0.07 0.07 0.01 0.01
MS04 Transfer of Lime to the Lime Storage Bin (B-L) LimeLd 3-05-016-26 NF 18,900 tons 0.61 0.29 0.04 lb/ton LSV a 90% 0.58 0.58 0.27 0.27 0.04 0.04
MS05 Transfer of Sodium Metasilicate to the Sodium MetasilicateStorage Bin (B-SM)
ReagTr 3-03-024-04 NF 3,000 tons 0.008 0.004 0.0006 lb/ton SMSV a 90% 0.001 0.001 0.0006 0.0006 0.00009 0.00009
MS06 Transfer of Flocculant from Supersacks to Flocculant Storage Bins (B-F1/F2)
ReagTr 3-03-024-04 NF 1,100 tons 0.008 0.004 0.0006 lb/ton None 0% 0.005 0.005 0.002 0.002 0.0003 0.0003
MS07 Transfer of Guar from Bags to Guar Feeder (F-Gu) ReagTr 3-03-024-04 NF 150 tons 0.008 0.004 0.0006 lb/ton None 0% 0.0006 0.0006 0.0003 0.0003 0.00004 0.00004
MS08 Transfer of Granular Cobalt Sulfate from Bags to CobaltSulfate Feeder (F-CoS)
ReagTr 3-03-024-04 NF 6 tons 0.008 0.004 0.0006 lb/ton None 0% 0.00002 0.00002 0.00001 0.00001 0.000002 0.000002
Particulate Matter Pollution Control Equipment with Emission Limits
PCL01 Crushing Area Scrubber (PC-CAS) CAS none NF 8,760 hours 1.29 1.28 1.13 lb/hr -- -- -- 5.65 -- 5.61 -- 4.94
PCL02 Stockpile Area Scrubber (PC-SAS) SAS none NF 8,760 hours 2.61 2.59 2.10 lb/hr -- -- -- 11.45 -- 11.34 -- 9.18
PCL03 Reclaim Tunnel Scrubber (PC-RTS) RTS none NF 8,760 hours 1.08 1.07 0.87 lb/hr -- -- -- 4.73 -- 4.69 -- 3.79
PCL04 Pebble Crusher Area Scrubber (PC-PCAS) PCAS none NF 8,760 hours 1.58 1.56 1.31 lb/hr -- -- -- 6.94 -- 6.83 -- 5.75
PCL05 Copper Concentrate Scrubber 1 (PC-CCS1) CCS none NF 8,760 hours 3.59 3.55 3.04 lb/hr -- -- -- 15.71 -- 15.55 -- 13.33
PCL06 Copper Concentrate Scrubber 2 (PC-CCS2) CCS none NF 8,760 hours 3.59 3.55 3.04 lb/hr -- -- -- 15.71 -- 15.55 -- 13.33
PCL07 Molybdenum Scrubber (PC-MS) / Electrostatic Precipitator (PC-EP) MS/EP none NF 8,760 hours 0.015 0.014 0.013 lb/hr -- -- -- 0.07 -- 0.06 -- 0.06
PCL08 Molybdenum Dust Collector (PC-MDC) MDC none NF 653,597,276 dscf 0.02 0.010 0.002 gr/dscf -- -- -- 0.99 -- 0.47 -- 0.07
PCL09 Laboratory Dust Collector 1 (PC-L1) LDC none NF 4,357,315,176 dscf 0.008 0.005 0.002 gr/dscf -- -- -- 2.56 -- 1.56 -- 0.76
PCL10 Laboratory Dust Collector 2 (PC-L2) LDC none NF 4,357,315,176 dscf 0.008 0.005 0.002 gr/dscf -- -- -- 2.56 -- 1.56 -- 0.76
PCL11 Laboratory Dust Collector 3 (PC-L3) LDC none NF 4,357,315,176 dscf 0.008 0.005 0.002 gr/dscf -- -- -- 2.56 -- 1.56 -- 0.76
706.86 72.44 307.04 66.81 68.87 53.68
29,574.45 3,297.90 7,650.36 894.91 774.80 98.84
30,281.31 3,370.34 7,957.40 961.72 843.66 152.52
33.84 33.84 33.84 33.84 33.84 33.84
a The control efficiency for this emission unit is inherent to the process. Therefore, the control efficiency is applied to both uncontrolled and controlled emissions.
Tailpipe Emissions (see Tables H.29-H.31):
Total Emissions (excluding tailpipe emissions):
Total Non-Fugitive Emissions (excluding tailpipe emissions):
Total Fugitive Emissions (excluding tailpipe emissions):
Rosemont Copper ProjectEmission Inventory Information JBR ENVIRONMENTAL CONSULTANTS, INC.
November 2011Page H84
AZRP00266
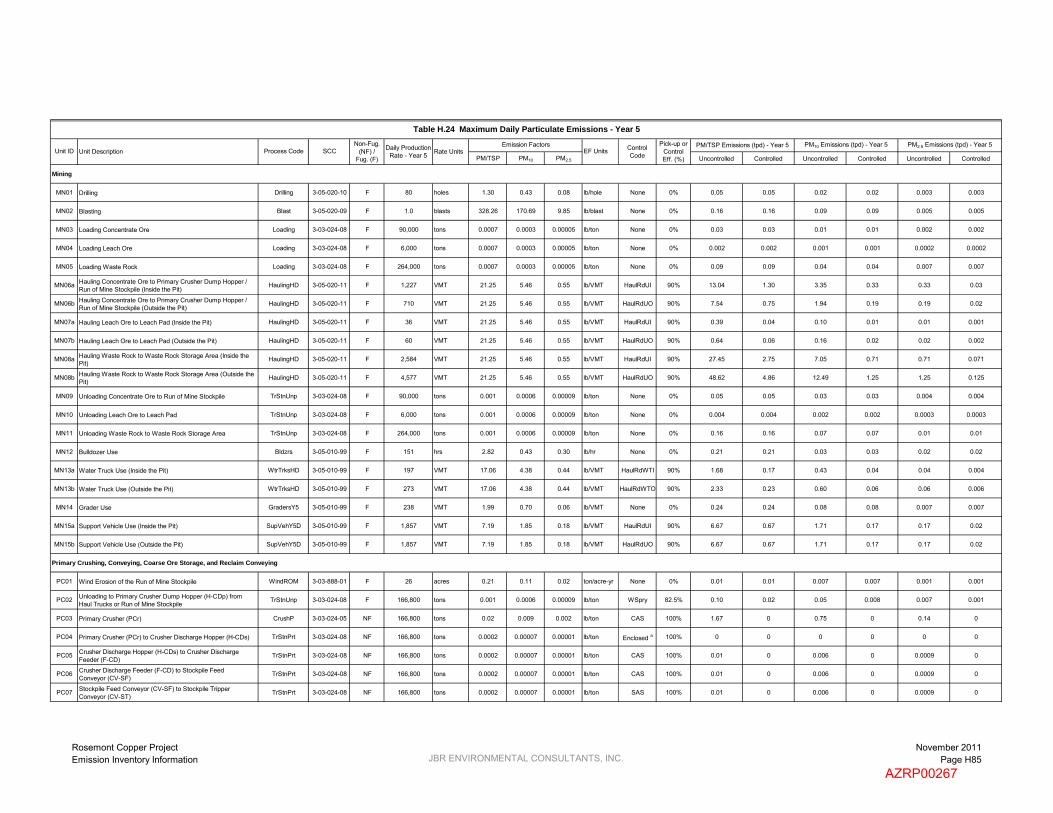
PM/TSP PM10 PM2.5 Uncontrolled Controlled Uncontrolled Controlled Uncontrolled Controlled
Mining
MN01 Drilling Drilling 3-05-020-10 F 80 holes 1.30 0.43 0.08 lb/hole None 0% 0.05 0.05 0.02 0.02 0.003 0.003
MN02 Blasting Blast 3-05-020-09 F 1.0 blasts 328.26 170.69 9.85 lb/blast None 0% 0.16 0.16 0.09 0.09 0.005 0.005
MN03 Loading Concentrate Ore Loading 3-03-024-08 F 90,000 tons 0.0007 0.0003 0.00005 lb/ton None 0% 0.03 0.03 0.01 0.01 0.002 0.002
MN04 Loading Leach Ore Loading 3-03-024-08 F 6,000 tons 0.0007 0.0003 0.00005 lb/ton None 0% 0.002 0.002 0.001 0.001 0.0002 0.0002
MN05 Loading Waste Rock Loading 3-03-024-08 F 264,000 tons 0.0007 0.0003 0.00005 lb/ton None 0% 0.09 0.09 0.04 0.04 0.007 0.007
MN06a Hauling Concentrate Ore to Primary Crusher Dump Hopper / Run of Mine Stockpile (Inside the Pit)
HaulingHD 3-05-020-11 F 1,227 VMT 21.25 5.46 0.55 lb/VMT HaulRdUI 90% 13.04 1.30 3.35 0.33 0.33 0.03
MN06b Hauling Concentrate Ore to Primary Crusher Dump Hopper / Run of Mine Stockpile (Outside the Pit)
HaulingHD 3-05-020-11 F 710 VMT 21.25 5.46 0.55 lb/VMT HaulRdUO 90% 7.54 0.75 1.94 0.19 0.19 0.02
MN07a Hauling Leach Ore to Leach Pad (Inside the Pit) HaulingHD 3-05-020-11 F 36 VMT 21.25 5.46 0.55 lb/VMT HaulRdUI 90% 0.39 0.04 0.10 0.01 0.01 0.001
MN07b Hauling Leach Ore to Leach Pad (Outside the Pit) HaulingHD 3-05-020-11 F 60 VMT 21.25 5.46 0.55 lb/VMT HaulRdUO 90% 0.64 0.06 0.16 0.02 0.02 0.002
MN08a Hauling Waste Rock to Waste Rock Storage Area (Inside the Pit)
HaulingHD 3-05-020-11 F 2,584 VMT 21.25 5.46 0.55 lb/VMT HaulRdUI 90% 27.45 2.75 7.05 0.71 0.71 0.071
MN08b Hauling Waste Rock to Waste Rock Storage Area (Outside the Pit)
HaulingHD 3-05-020-11 F 4,577 VMT 21.25 5.46 0.55 lb/VMT HaulRdUO 90% 48.62 4.86 12.49 1.25 1.25 0.125
MN09 Unloading Concentrate Ore to Run of Mine Stockpile TrStnUnp 3-03-024-08 F 90,000 tons 0.001 0.0006 0.00009 lb/ton None 0% 0.05 0.05 0.03 0.03 0.004 0.004
MN10 Unloading Leach Ore to Leach Pad TrStnUnp 3-03-024-08 F 6,000 tons 0.001 0.0006 0.00009 lb/ton None 0% 0.004 0.004 0.002 0.002 0.0003 0.0003
MN11 Unloading Waste Rock to Waste Rock Storage Area TrStnUnp 3-03-024-08 F 264,000 tons 0.001 0.0006 0.00009 lb/ton None 0% 0.16 0.16 0.07 0.07 0.01 0.01
MN12 Bulldozer Use Bldzrs 3-05-010-99 F 151 hrs 2.82 0.43 0.30 lb/hr None 0% 0.21 0.21 0.03 0.03 0.02 0.02
MN13a Water Truck Use (Inside the Pit) WtrTrksHD 3-05-010-99 F 197 VMT 17.06 4.38 0.44 lb/VMT HaulRdWTI 90% 1.68 0.17 0.43 0.04 0.04 0.004
MN13b Water Truck Use (Outside the Pit) WtrTrksHD 3-05-010-99 F 273 VMT 17.06 4.38 0.44 lb/VMT HaulRdWTO 90% 2.33 0.23 0.60 0.06 0.06 0.006
MN14 Grader Use GradersY5 3-05-010-99 F 238 VMT 1.99 0.70 0.06 lb/VMT None 0% 0.24 0.24 0.08 0.08 0.007 0.007
MN15a Support Vehicle Use (Inside the Pit) SupVehY5D 3-05-010-99 F 1,857 VMT 7.19 1.85 0.18 lb/VMT HaulRdUI 90% 6.67 0.67 1.71 0.17 0.17 0.02
MN15b Support Vehicle Use (Outside the Pit) SupVehY5D 3-05-010-99 F 1,857 VMT 7.19 1.85 0.18 lb/VMT HaulRdUO 90% 6.67 0.67 1.71 0.17 0.17 0.02
Primary Crushing, Conveying, Coarse Ore Storage, and Reclaim Conveying
PC01 Wind Erosion of the Run of Mine Stockpile WindROM 3-03-888-01 F 26 acres 0.21 0.11 0.02 ton/acre-yr None 0% 0.01 0.01 0.007 0.007 0.001 0.001
PC02 Unloading to Primary Crusher Dump Hopper (H-CDp) fromHaul Trucks or Run of Mine Stockpile
TrStnUnp 3-03-024-08 F 166,800 tons 0.001 0.0006 0.00009 lb/ton WSpry 82.5% 0.10 0.02 0.05 0.008 0.007 0.001
PC03 Primary Crusher (PCr) CrushP 3-03-024-05 NF 166,800 tons 0.02 0.009 0.002 lb/ton CAS 100% 1.67 0 0.75 0 0.14 0
PC04 Primary Crusher (PCr) to Crusher Discharge Hopper (H-CDs) TrStnPrt 3-03-024-08 NF 166,800 tons 0.0002 0.00007 0.00001 lb/ton Enclosed a 100% 0 0 0 0 0 0
PC05 Crusher Discharge Hopper (H-CDs) to Crusher DischargeFeeder (F-CD)
TrStnPrt 3-03-024-08 NF 166,800 tons 0.0002 0.00007 0.00001 lb/ton CAS 100% 0.01 0 0.006 0 0.0009 0
PC06 Crusher Discharge Feeder (F-CD) to Stockpile FeedConveyor (CV-SF)
TrStnPrt 3-03-024-08 NF 166,800 tons 0.0002 0.00007 0.00001 lb/ton CAS 100% 0.01 0 0.006 0 0.0009 0
PC07 Stockpile Feed Conveyor (CV-SF) to Stockpile TripperConveyor (CV-ST)
TrStnPrt 3-03-024-08 NF 166,800 tons 0.0002 0.00007 0.00001 lb/ton SAS 100% 0.01 0 0.006 0 0.0009 0
Table H.24 Maximum Daily Particulate Emissions - Year 5
PM/TSP Emissions (tpd) - Year 5 PM2.5 Emissions (tpd) - Year 5PM10 Emissions (tpd) - Year 5Pick-up or Control Eff. (%)
Rate UnitsNon-Fug.
(NF) / Fug. (F)
Emission FactorsUnit ID Unit Description Process Code SCC EF Units Control
CodeDaily Production
Rate - Year 5
Rosemont Copper ProjectEmission Inventory Information JBR ENVIRONMENTAL CONSULTANTS, INC.
November 2011Page H85
AZRP00267

PM/TSP PM10 PM2.5 Uncontrolled Controlled Uncontrolled Controlled Uncontrolled Controlled
Table H.24 Maximum Daily Particulate Emissions - Year 5
PM/TSP Emissions (tpd) - Year 5 PM2.5 Emissions (tpd) - Year 5PM10 Emissions (tpd) - Year 5Pick-up or Control Eff. (%)
Rate UnitsNon-Fug.
(NF) / Fug. (F)
Emission FactorsUnit ID Unit Description Process Code SCC EF Units Control
CodeDaily Production
Rate - Year 5
PC08 Stockpile Tripper Conveyor (CV-ST) to Covered Coarse Ore Stockpile
TrStnPrt 3-03-024-08 F 166,800 tons 0.0002 0.00007 0.00001 lb/ton SAS 100% 0.01 0 0.006 0 0.0009 0
PC09 Wind Erosion of the Coarse Ore Stockpile WindCvd 3-03-888-01 F 5 acres 0 0 0 ton/acre-yr Enclosed a 100% 0 0 0 0 0 0
PC10 Coarse Ore Stockpile to Reclaim Feeders (F-R1/R4) TrStnPrt 3-03-024-08 NF 166,800 tons 0.0002 0.00007 0.00001 lb/ton UndrGrd a 100% 0 0 0 0 0 0
PC11 Reclaim Feeders (F-R1/R4) to Reclaim Conveyor (CV-R) TrStnPrt 3-03-024-08 NF 166,800 tons 0.0002 0.00007 0.00001 lb/ton RTS 100% 0.01 0 0.006 0 0.0009 0
PC12 Reclaim Conveyor (CV-R) to SAG Mill Feed Conveyor(CV-SMF) TrStnPrt 3-03-024-08 NF 166,800 tons 0.0002 0.00007 0.00001 lb/ton PCAS 100% 0.01 0 0.006 0 0.0009 0
PC13 Pebble Conveyor No. 3 (CV-Pb3) to SAG Mill Feed Conveyor (CV-SMF)
TrStnPrt 3-03-024-08 NF 42,508 tons 0.0002 0.00007 0.00001 lb/ton PCAS 100% 0.003 0 0.002 0 0.0002 0
PC14 SAG Mill Feed Conveyor (CV-SMF) to SAG Mill (M-SAG) TrStnPrt 3-03-024-08 NF 209,432 tons 0.0002 0.00007 0.00001 lb/ton Water a 100% 0 0 0 0 0 0
Milling
M01 SAG Mill (M-SAG) CrushS 3-03-024-06 NF 209,432 tons 0.05 0.02 0.004 lb/ton Wet a 100% 0 0 0 0 0 0
M02 SAG Mill (M-SAG) to Trommel Screen (Sn-T) TrStnPrt 3-03-024-08 NF 209,432 tons 0.0002 0.00007 0.00001 lb/ton Enclosed a 100% 0 0 0 0 0 0
M03 Trommel Screen (Sn-T) Screen 3-05-020-02 NF 209,432 tons 0.025 0.0087 0.0006 lb/ton Wet a 100% 0 0 0 0 0 0
M04 Trommel Screen (Sn-T) to Pebble Conveyor No. 1 (CV-Pb1) TrStnPrt 3-03-024-08 NF 44,426 tons 0.0002 0.00007 0.00001 lb/ton Clean a 100% 0 0 0 0 0 0
M05 Pebble Conveyor No. 1 (CV-Pb1) to Pebble Wash Screen(Sn-PbW)
TrStnPrt 3-03-024-08 NF 44,426 tons 0.0002 0.00007 0.00001 lb/ton Clean a 100% 0 0 0 0 0 0
M06 Pebble Wash Screen (Sn-PbW) Screen 3-05-020-02 NF 44,426 tons 0.025 0.0087 0.0006 lb/ton Wet a 100% 0 0 0 0 0 0
M07 Pebble Wash Screen (Sn-PbW) to Pebble Conveyor No. 2 TrStnPrt 3-03-024-08 NF 42,508 tons 0.0002 0.00007 0.00001 lb/ton Clean a 100% 0 0 0 0 0 0
M08 Pebble Conveyor No. 2 (CV-Pb2) to SAG Oversize Surge Bin(B-SAGOS) TrStnPrt 3-03-024-08 NF 42,508 tons 0.0002 0.00007 0.00001 lb/ton PCAS 100% 0.003 0 0.002 0 0.0002 0
M09 SAG Oversize Surge Bin (B-SAGOS) to Pebble CrusherFeeder (F-PbC)
TrStnPrt 3-03-024-08 NF 42,508 tons 0.0002 0.00007 0.00001 lb/ton PCAS 100% 0.003 0 0.002 0 0.0002 0
M10 Pebble Crusher Feeder (F-PbC) to Pebble Crusher (PbC) TrStnPrt 3-03-024-08 NF 42,508 tons 0.0002 0.00007 0.00001 lb/ton Enclosed a 100% 0 0 0 0 0 0
M11 Pebble Crusher (PbC) CrushT 3-03-024-07 NF 42,508 tons 0.06 0.02 0.004 lb/ton PCAS 100% 1.28 0 0.43 0 0.08 0
M12 Pebble Crusher (PbC) to Pebble Conveyor No. 3 (CV-Pb3) TrStnPrt 3-03-024-08 NF 42,508 tons 0.0002 0.00007 0.00001 lb/ton PCAS 100% 0.003 0 0.002 0 0.0002 0
Copper Concentrate Dewatering and Stacking
CCD01 Copper Concentrate Filters (Ft-CC1/CC4) to Copper Concentrate Conveyor (CV-CC) TrCuCncPrt 3-03-024-08 NF 3,312 tons 0.00004 0.00002 0.000003 lb/ton Enclosed a 100% 0 0 0 0 0 0
CCD02 Copper Concentrate Conveyor (CV-CC) to Copper Concentrate Loadout Stockpile
TrCuCncPrt 3-03-024-08 F 3,312 tons 0.00004 0.00002 0.000003 lb/ton CCS 100% 0.00007 0 0.00003 0 0.000005 0
CCD03 Wind Erosion of Copper Concentrate Loadout Stockpile WindCvd 3-03-888-01 F 1.17 acres 0 0 0 ton/acre-yr Enclosed a 100% 0 0 0 0 0 0
CCD04 Copper Concentrate Loadout Stockpile to Shipment Truck via Front End Loaders
TrCuCncPrt 3-03-024-08 F 3,312 tons 0.00004 0.00002 0.000003 lb/ton CCS 100% 0.00007 0 0.00003 0 0.000005 0
Molybdenum Dewatering and Packaging
MD01 Molybdenum Concentrate Filter (Ft-MC) to Molybdenum Concentrate Dryer (D-MC)
TrMlyCncPrt 3-03-024-08 NF 45.6 tons 0.00002 0.00001 0.000002 lb/ton Enclosed a 100% 0 0 0 0 0 0
MD02 Molybdenum Concentrate Dryer MolyDry 3-03-024-11 NF 45.6 tons 19.70 12.00 5.91 lb/ton MS/EP 100% 0.45 0 0.27 0 0.13 0
MD03 Molybdenum Concentrate Dryer (D-MC) to MolybdenumConcentrate Bin (B-MC)
DTrMlyCncPrt 3-03-024-08 NF 45.6 tons 0.00004 0.00002 0.000003 lb/ton MDC 100% 0.000001 0 0.0000005 0 0.00000007 0
Rosemont Copper ProjectEmission Inventory Information JBR ENVIRONMENTAL CONSULTANTS, INC.
November 2011Page H86
AZRP00268

PM/TSP PM10 PM2.5 Uncontrolled Controlled Uncontrolled Controlled Uncontrolled Controlled
Table H.24 Maximum Daily Particulate Emissions - Year 5
PM/TSP Emissions (tpd) - Year 5 PM2.5 Emissions (tpd) - Year 5PM10 Emissions (tpd) - Year 5Pick-up or Control Eff. (%)
Rate UnitsNon-Fug.
(NF) / Fug. (F)
Emission FactorsUnit ID Unit Description Process Code SCC EF Units Control
CodeDaily Production
Rate - Year 5
MD04 Molybdenum Concentrate Bin (B-MC) to MolybdenumConcentrate Hopper (H-MC)
DTrMlyCnc 3-03-024-08 NF 45.6 tons 0.0003 0.0002 0.00002 lb/ton None 0% 0.000008 0.000008 0.000004 0.000004 0.0000005 0.0000005
MD05 Molybdenum Concentrate Hopper (H-MC) to MolybdenumConcentrate Conveyor (CV-MC)
DTrMlyCncPrt 3-03-024-08 NF 45.6 tons 0.00004 0.00002 0.000003 lb/ton Enclosed a 100% 0 0 0 0 0 0
MD06 Molybdenum Concentrate Conveyor (CV-MC) to Molybdenum Packaging and Weigh System (MPS)
DTrMlyCnc 3-03-024-08 NF 45.6 tons 0.0003 0.0002 0.00002 lb/ton MDC 100% 0.000008 0 0.000004 0 0.0000005 0
Tailings Dewatering and Placement
TDS01 Tailings Filters (Ft-T1/T14) to Tailings Belt Feeders (F-T1/T14) FiltTailPrt 3-03-024-08 NF 257,328 tons 0.00002 0.00001 0.000002 lb/ton Enclosed a 100% 0 0 0 0 0 0
TDS02 Tailings Belt Feeders (F-T1/T14) to Fixed Tailings ConveyorNo. 1 (CV-F1)
FiltTailPrt 3-03-024-08 NF 257,328 tons 0.00002 0.00001 0.000002 lb/ton Enclosed a 100% 0 0 0 0 0 0
TDS03 Fixed Tailings Conveyor No. 1 (CV-F1) to Fixed TailingsConveyor No. 2 (CV-F2)
FiltTailPrt 3-03-024-08 NF 257,328 tons 0.00002 0.00001 0.000002 lb/ton Enclosed a 100% 0 0 0 0 0 0
TDS04 Fixed Tailings Conveyor No. 2 (CV-F2) to Fixed Tailings Conveyor No. 3 (CV-F3)
FiltTailPrt 3-03-024-08 NF 257,328 tons 0.00002 0.00001 0.000002 lb/ton None 0% 0.003 0.003 0.001 0.001 0.0002 0.0002
TDS05 Fixed Tailings Conveyor No. 3 (CV-F3) to RelocatableConveyor (CV-R1)
FiltTailPrt 3-03-024-08 F 257,328 tons 0.00002 0.00001 0.000002 lb/ton None 0% 0.003 0.003 0.001 0.001 0.0002 0.0002
TDS06 Relocatable Conveyor (CV-R1) to Shiftable Conveyor (CV-S1) FiltTailPrt 3-03-024-08 F 257,328 tons 0.00002 0.00001 0.000002 lb/ton None 0% 0.003 0.003 0.001 0.001 0.0002 0.0002
TDS07 Shiftable Conveyor (CV-S1) to Belt Wagon Conveyor(CV-BW1)
FiltTail 3-03-024-08 F 257,328 tons 0.0002 0.00009 0.00001 lb/ton None 0% 0.02 0.02 0.01 0.01 0.002 0.002
TDS08 Belt Wagon Conveyor (CV-BW1) to Spreader Crawler Mounted Conveyor (CV-SP1)
FiltTail 3-03-024-08 F 257,328 tons 0.0002 0.00009 0.00001 lb/ton None 0% 0.02 0.02 0.01 0.01 0.002 0.002
TDS09 Spreader Crawler Mounted Conveyor (CV-SP1) to Tailings Storage
FiltTail 3-03-024-08 F 257,328 tons 0.0002 0.00009 0.00001 lb/ton None 0% 0.02 0.02 0.01 0.01 0.002 0.002
TDS10 Wind Erosion of Tailings Storage TailStrg 3-03-888-01 F 1,500 acres 0.02 0.01 0.002 ton/acre-yr None 0% 0.08 0.08 0.04 0.04 0.006 0.006
Fuel Burning Equipment
FB01 Diesel Electrowinning Hot Water Generator (HWG) DFB 1-02-005-03 NF 24 hours 3.30 2.30 1.54 lb/1000 gal None 0% 0.002 0.002 0.001 0.001 0.0008 0.0008
6.0 MMBtu/hr
FB02 Thickener Area Emergency Generator (TEG) ICDE3 2-02-001-02 NF 24 hours 0.20 0.20 0.20 g/kW-hr None 0% 0.005 0.005 0.005 0.005 0.005 0.005
1,000 kW
FB03 PLS Pond Area Emergency Generator (PEG) ICDE3 2-02-001-02 NF 24 hours 0.20 0.20 0.20 g/kW-hr None 0% 0.005 0.005 0.005 0.005 0.005 0.005
1,000 kW
FB04 Main Substation Emergency Generator (MEG) ICDE3 2-02-001-02 NF 24 hours 0.20 0.20 0.20 g/kW-hr None 0% 0.004 0.004 0.004 0.004 0.004 0.004
750 kW
FB05 Administration Building Emergency Generator (AEG) ICDE3 2-02-001-02 NF 24 hours 0.20 0.20 0.20 g/kW-hr None 0% 0.004 0.004 0.004 0.004 0.004 0.004
750 kW
FB06 Electrowinning Building Emergency Generator (EWEG) ICDE1 2-02-001-02 NF 24 hours 0.40 0.40 0.40 g/kW-hr None 0% 0.0005 0.0005 0.0005 0.0005 0.0005 0.0005
50 kW
FB07 Primary Crusher Fire Water Pump (PCFWP) ICDE2 2-02-001-02 NF 24 hours 0.20 0.20 0.20 g/kW-hr None 0% 0.002 0.002 0.002 0.002 0.002 0.002
400 hp
Rosemont Copper ProjectEmission Inventory Information JBR ENVIRONMENTAL CONSULTANTS, INC.
November 2011Page H87
AZRP00269

PM/TSP PM10 PM2.5 Uncontrolled Controlled Uncontrolled Controlled Uncontrolled Controlled
Table H.24 Maximum Daily Particulate Emissions - Year 5
PM/TSP Emissions (tpd) - Year 5 PM2.5 Emissions (tpd) - Year 5PM10 Emissions (tpd) - Year 5Pick-up or Control Eff. (%)
Rate UnitsNon-Fug.
(NF) / Fug. (F)
Emission FactorsUnit ID Unit Description Process Code SCC EF Units Control
CodeDaily Production
Rate - Year 5
FB08 SX/EW Fire Water Pump (SXFWP) ICDE2 2-02-001-02 NF 24 hours 0.20 0.20 0.20 g/kW-hr None 0% 0.002 0.002 0.002 0.002 0.002 0.002
400 hp
Miscellaneous Sources
MS01 Transfer of Bulk Pebble Lime to the Bulk Pebble Lime Silo(S-BPL) LimeLd 3-05-016-26 NF 124.27 tons 0.61 0.29 0.04 lb/ton BPLSV a 90% 0.004 0.004 0.002 0.002 0.0003 0.0003
MS02 Bulk Pebble Lime Silo (S-BPL) to Bulk Pebble Lime Silo Screw Conveyor (CV-BPLS) ReagTr 3-03-024-04 NF 124.27 tons 0.008 0.004 0.0006 lb/ton Enclosed a 100% 0 0 0 0 0 0
MS03 Bulk Pebble Lime Silo Screw Conveyor (CV-BPLS) to SAGMill Feed Conveyor (CV-SMF)
ReagTr 3-03-024-04 NF 124.27 tons 0.008 0.004 0.0006 lb/ton None 0% 0.0005 0.0005 0.0002 0.0002 0.00004 0.00004
MS04 Transfer of Lime to the Lime Storage Bin (B-L) LimeLd 3-05-016-26 NF 62.14 tons 0.61 0.29 0.04 lb/ton LSV a 90% 0.002 0.002 0.0009 0.0009 0.0001 0.0001
MS05 Transfer of Sodium Metasilicate to the Sodium MetasilicateStorage Bin (B-SM)
ReagTr 3-03-024-04 NF 9.86 tons 0.008 0.004 0.0006 lb/ton SMSV a 90% 0.000004 0.000004 0.000002 0.000002 0.0000003 0.0000003
MS06 Transfer of Flocculant from Supersacks to Flocculant Storage Bins (B-F1/F2)
ReagTr 3-03-024-04 NF 3.62 tons 0.008 0.004 0.0006 lb/ton None 0% 0.00001 0.00001 0.000007 0.000007 0.000001 0.000001
MS07 Transfer of Guar from Bags to Guar Feeder (F-Gu) ReagTr 3-03-024-04 NF 0.49 tons 0.008 0.004 0.0006 lb/ton None 0% 0.000002 0.000002 0.000001 0.000001 0.0000001 0.0000001
MS08 Transfer of Granular Cobalt Sulfate from Bags to CobaltSulfate Feeder (F-CoS)
ReagTr 3-03-024-04 NF 0.02 tons 0.008 0.004 0.0006 lb/ton None 0% 0.00000008 0.00000008 0.00000004 0.00000004 0.000000006 0.000000006
Particulate Matter Pollution Control Equipment with Emission Limits
PCL01 Crushing Area Scrubber (PC-CAS) CAS none NF 24 hours 1.29 1.28 1.13 lb/hr -- -- -- 0.02 -- 0.02 -- 0.01
PCL02 Stockpile Area Scrubber (PC-SAS) SAS none NF 24 hours 2.61 2.59 2.10 lb/hr -- -- -- 0.03 -- 0.03 -- 0.03
PCL03 Reclaim Tunnel Scrubber (PC-RTS) RTS none NF 24 hours 1.08 1.07 0.87 lb/hr -- -- -- 0.01 -- 0.01 -- 0.01
PCL04 Pebble Crusher Area Scrubber (PC-PCAS) PCAS none NF 24 hours 1.58 1.56 1.31 lb/hr -- -- -- 0.02 -- 0.02 -- 0.02
PCL05 Copper Concentrate Scrubber 1 (PC-CCS1) CCS none NF 24 hours 3.59 3.55 3.04 lb/hr -- -- -- 0.04 -- 0.04 -- 0.04
PCL06 Copper Concentrate Scrubber 2 (PC-CCS2) CCS none NF 24 hours 3.59 3.55 3.04 lb/hr -- -- -- 0.04 -- 0.04 -- 0.04
PCL07 Molybdenum Scrubber (PC-MS) / Electrostatic Precipitator (PC-EP) MS/EP none NF 24 hours 0.015 0.014 0.013 lb/hr -- -- -- 0.0002 -- 0.0002 -- 0.0002
PCL08 Molybdenum Dust Collector (PC-MDC) MDC none NF 1,790,677 dscf 0.02 0.010 0.002 gr/dscf -- -- -- 0.003 -- 0.001 -- 0.0002
PCL09 Laboratory Dust Collector 1 (PC-L1) LDC none NF 11,937,850 dscf 0.008 0.005 0.002 gr/dscf -- -- -- 0.007 -- 0.004 -- 0.002
PCL10 Laboratory Dust Collector 2 (PC-L2) LDC none NF 11,937,850 dscf 0.008 0.005 0.002 gr/dscf -- -- -- 0.007 -- 0.004 -- 0.002
PCL11 Laboratory Dust Collector 3 (PC-L3) LDC none NF 11,937,850 dscf 0.008 0.005 0.002 gr/dscf -- -- -- 0.007 -- 0.004 -- 0.002
3.50 0.22 1.5141 0.21 0.38 0.17
116.32 12.70 30.0746 3.43 3.04 0.37
119.83 12.93 31.59 3.63 3.42 0.54
0.12 0.12 0.12 0.12 0.12 0.12
a The control efficiency for this emission unit is inherent to the process. Therefore, the control efficiency is applied to both uncontrolled and controlled emissions.
Tailpipe Emissions (see Tables H.29-H.31):
Total Emissions (excluding tailpipe emissions):
Total Non-Fugitive Emissions (excluding tailpipe emissions):
Total Fugitive Emissions (excluding tailpipe emissions):
Rosemont Copper ProjectEmission Inventory Information JBR ENVIRONMENTAL CONSULTANTS, INC.
November 2011Page H88
AZRP00270

PM/TSP PM10 PM2.5 Uncontrolled Controlled Uncontrolled Controlled Uncontrolled Controlled
Mining
MN01 Drilling Drilling 3-05-020-10 F 80 holes 1.30 0.43 0.08 lb/hole None 0% 104.00 104.00 34.67 34.67 6.42 6.42
MN02 Blasting Blast 3-05-020-09 F 1.00 blasts 328.26 170.69 9.85 lb/blast None 0% 328.26 328.26 170.69 170.69 9.85 9.85
MN03 Loading Concentrate Ore Loading 3-03-024-08 F 3,750 tons 0.0007 0.0003 0.00005 lb/ton None 0% 2.63 2.63 1.24 1.24 0.19 0.19
MN04 Loading Leach Ore Loading 3-03-024-08 F 250 tons 0.0007 0.0003 0.00005 lb/ton None 0% 0.18 0.18 0.08 0.08 0.01 0.01
MN05 Loading Waste Rock Loading 3-03-024-08 F 11,000 tons 0.0007 0.0003 0.00005 lb/ton None 0% 7.72 7.72 3.65 3.65 0.55 0.55
MN06a Hauling Concentrate Ore to Primary Crusher Dump Hopper / Run of Mine Stockpile (Inside the Pit)
HaulingHD 3-05-020-11 F 51 VMT 21.25 5.46 0.55 lb/VMT HaulRdUI 90% 1086.45 108.64 279.17 27.92 27.92 2.79
MN06b Hauling Concentrate Ore to Primary Crusher Dump Hopper / Run of Mine Stockpile (Outside the Pit)
HaulingHD 3-05-020-11 F 30 VMT 21.25 5.46 0.55 lb/VMT HaulRdUO 90% 628.33 62.83 161.45 16.15 16.15 1.61
MN07a Hauling Leach Ore to Leach Pad (Inside the Pit) HaulingHD 3-05-020-11 F 2 VMT 21.25 5.46 0.55 lb/VMT HaulRdUI 90% 32.11 3.21 8.25 0.83 0.83 0.08
MN07b Hauling Leach Ore to Leach Pad (Outside the Pit) HaulingHD 3-05-020-11 F 2 VMT 21.25 5.46 0.55 lb/VMT HaulRdUO 90% 52.99 5.30 13.61 1.36 1.36 0.14
MN08a Hauling Waste Rock to Waste Rock Storage Area (Inside the Pit)
HaulingHD 3-05-020-11 F 108 VMT 21.25 5.46 0.55 lb/VMT HaulRdUI 90% 2,287.85 228.78 587.87 58.79 58.79 5.88
MN08b Hauling Waste Rock to Waste Rock Storage Area (Outside the Pit)
HaulingHD 3-05-020-11 F 191 VMT 21.25 5.46 0.55 lb/VMT HaulRdUO 90% 4,051.63 405.16 1,041.08 104.11 104.11 10.41
MN09 Unloading Concentrate Ore to Run of Mine Stockpile TrStnUnp 3-03-024-08 F 3,750 tons 0.001 0.0006 0.00009 lb/ton None 0% 4.46 4.46 2.11 2.11 0.32 0.32
MN10 Unloading Leach Ore to Leach Pad TrStnUnp 3-03-024-08 F 250 tons 0.001 0.0006 0.00009 lb/ton None 0% 0.30 0.30 0.14 0.14 0.02 0.02
MN11 Unloading Waste Rock to Waste Rock Storage Area TrStnUnp 3-03-024-08 F 11,000 tons 0.001 0.0006 0.00009 lb/ton None 0% 13.07 13.07 6.18 6.18 0.94 0.94
MN12 Bulldozer Use Bldzrs 3-05-010-99 F 6 hrs 2.82 0.43 0.30 lb/hr None 0% 17.78 17.78 2.68 2.68 1.87 1.87
MN13a Water Truck Use (Inside the Pit) WtrTrksHD 3-05-010-99 F 8 VMT 17.06 4.38 0.44 lb/VMT HaulRdWTI 90% 139.90 13.99 35.95 3.59 3.59 0.36
MN13b Water Truck Use (Outside the Pit) WtrTrksHD 3-05-010-99 F 11 VMT 17.06 4.38 0.44 lb/VMT HaulRdWTO 90% 194.38 19.44 49.95 4.99 4.99 0.50
MN14 Grader Use GradersY5 3-05-010-99 F 10 VMT 1.99 0.70 0.06 lb/VMT None 0% 19.79 19.79 6.93 6.93 0.61 0.61
MN15a Support Vehicle Use (Inside the Pit) SupVehY5H 3-05-010-99 F 118 VMT 6.96 1.79 0.18 lb/VMT HaulRdUI 90% 823.98 82.40 211.72 21.17 21.17 2.12
MN15b Support Vehicle Use (Outside the Pit) SupVehY5H 3-05-010-99 F 118 VMT 6.96 1.79 0.18 lb/VMT HaulRdUO 90% 823.98 82.40 211.72 21.17 21.17 2.12
Primary Crushing, Conveying, Coarse Ore Storage, and Reclaim Conveying
PC01 Wind Erosion of the Run of Mine Stockpile WindROM 3-03-888-01 F 26 acres 0.21 0.11 0.02 ton/acre-yr None 0% 1.24 1.24 0.62 0.62 0.09 0.09
PC02 Unloading to Primary Crusher Dump Hopper (H-CDp) fromHaul Trucks or Run of Mine Stockpile
TrStnUnp 3-03-024-08 F 6,950 tons 0.001 0.0006 0.00009 lb/ton WSpry 82.5% 8.26 1.45 3.91 0.68 0.59 0.10
PC03 Primary Crusher (PCr) CrushP 3-03-024-05 NF 6,950 tons 0.02 0.009 0.002 lb/ton CAS 100% 139.00 0 62.55 0 11.58 0
PC04 Primary Crusher (PCr) to Crusher Discharge Hopper (H-CDs) TrStnPrt 3-03-024-08 NF 6,950 tons 0.0002 0.00007 0.00001 lb/ton Enclosed a 100% 0 0 0 0 0 0
PC05 Crusher Discharge Hopper (H-CDs) to Crusher DischargeFeeder (F-CD)
TrStnPrt 3-03-024-08 NF 6,950 tons 0.0002 0.00007 0.00001 lb/ton CAS 100% 1.08 0 0.51 0 0.08 0
PC06 Crusher Discharge Feeder (F-CD) to Stockpile FeedConveyor (CV-SF)
TrStnPrt 3-03-024-08 NF 6,950 tons 0.0002 0.00007 0.00001 lb/ton CAS 100% 1.08 0 0.51 0 0.08 0
PC07 Stockpile Feed Conveyor (CV-SF) to Stockpile TripperConveyor (CV-ST)
TrStnPrt 3-03-024-08 NF 6,950 tons 0.0002 0.00007 0.00001 lb/ton SAS 100% 1.08 0 0.51 0 0.08 0
Process CodeHourly
Production Rate - Year 5
Table H.25 Maximum Hourly Particulate Emissions - Year 5
SCC EF UnitsUnit Description Control Code
Emission Factors PM2.5 Emissions (lb/hr) - Year 5PM10 Emissions (lb/hr) - Year 5PM/TSP Emissions (lb/hr) - Year 5Unit ID
Pick-up or Control Eff. (%)
Non-Fug. (NF) /
Fug. (F)Rate Units
Rosemont Copper ProjectEmission Inventory Information JBR ENVIRONMENTAL CONSULTANTS, INC.
November 2011Page H89
AZRP00271

PM/TSP PM10 PM2.5 Uncontrolled Controlled Uncontrolled Controlled Uncontrolled ControlledProcess Code
Hourly Production Rate
- Year 5
Table H.25 Maximum Hourly Particulate Emissions - Year 5
SCC EF UnitsUnit Description Control Code
Emission Factors PM2.5 Emissions (lb/hr) - Year 5PM10 Emissions (lb/hr) - Year 5PM/TSP Emissions (lb/hr) - Year 5Unit ID
Pick-up or Control Eff. (%)
Non-Fug. (NF) /
Fug. (F)Rate Units
PC08 Stockpile Tripper Conveyor (CV-ST) to Covered Coarse Ore Stockpile
TrStnPrt 3-03-024-08 F 6,950 tons 0.0002 0.00007 0.00001 lb/ton SAS 100% 1.08 0 0.51 0 0.08 0
PC09 Wind Erosion of the Coarse Ore Stockpile WindCvd 3-03-888-01 F 5 acres 0 0 0 ton/acre-yr Enclosed a 100% 0 0 0 0 0 0
PC10 Coarse Ore Stockpile to Reclaim Feeders (F-R1/R4) TrStnPrt 3-03-024-08 NF 6,950 tons 0.0002 0.00007 0.00001 lb/ton UndrGrd a 100% 0 0 0 0 0 0
PC11 Reclaim Feeders (F-R1/R4) to Reclaim Conveyor (CV-R) TrStnPrt 3-03-024-08 NF 6,950 tons 0.0002 0.00007 0.00001 lb/ton RTS 100% 1.08 0 0.51 0 0.08 0
PC12 Reclaim Conveyor (CV-R) to SAG Mill Feed Conveyor(CV-SMF) TrStnPrt 3-03-024-08 NF 6,950 tons 0.0002 0.00007 0.00001 lb/ton PCAS 100% 1.08 0 0.51 0 0.08 0
PC13 Pebble Conveyor No. 3 (CV-Pb3) to SAG Mill Feed Conveyor (CV-SMF)
TrStnPrt 3-03-024-08 NF 1,771 tons 0.0002 0.00007 0.00001 lb/ton PCAS 100% 0.28 0 0.13 0 0.02 0
PC14 SAG Mill Feed Conveyor (CV-SMF) to SAG Mill (M-SAG) TrStnPrt 3-03-024-08 NF 8,726 tons 0.0002 0.00007 0.00001 lb/ton Water a 100% 0 0 0 0 0 0
Milling
M01 SAG Mill (M-SAG) CrushS 3-03-024-06 NF 8,726 tons 0.05 0.02 0.004 lb/ton Wet a 100% 0 0 0 0 0 0
M02 SAG Mill (M-SAG) to Trommel Screen (Sn-T) TrStnPrt 3-03-024-08 NF 8,726 tons 0.0002 0.00007 0.00001 lb/ton Enclosed a 100% 0 0 0 0 0 0
M03 Trommel Screen (Sn-T) Screen 3-05-020-02 NF 8,726 tons 0.025 0.0087 0.0006 lb/ton Wet a 100% 0 0 0 0 0 0
M04 Trommel Screen (Sn-T) to Pebble Conveyor No. 1 (CV-Pb1) TrStnPrt 3-03-024-08 NF 1,851 tons 0.0002 0.00007 0.00001 lb/ton Clean a 100% 0 0 0 0 0 0
M05 Pebble Conveyor No. 1 (CV-Pb1) to Pebble Wash Screen(Sn-PbW)
TrStnPrt 3-03-024-08 NF 1,851 tons 0.0002 0.00007 0.00001 lb/ton Clean a 100% 0 0 0 0 0 0
M06 Pebble Wash Screen (Sn-PbW) Screen 3-05-020-02 NF 1,851 tons 0.025 0.0087 0.0006 lb/ton Wet a 100% 0 0 0 0 0 0
M07 Pebble Wash Screen (Sn-PbW) to Pebble Conveyor No. 2 TrStnPrt 3-03-024-08 NF 1,771 tons 0.0002 0.00007 0.00001 lb/ton Clean a 100% 0 0 0 0 0 0
M08 Pebble Conveyor No. 2 (CV-Pb2) to SAG Oversize Surge Bin(B-SAGOS) TrStnPrt 3-03-024-08 NF 1,771 tons 0.0002 0.00007 0.00001 lb/ton PCAS 100% 0.28 0 0.13 0 0.02 0
M09 SAG Oversize Surge Bin (B-SAGOS) to Pebble CrusherFeeder (F-PbC)
TrStnPrt 3-03-024-08 NF 1,771 tons 0.0002 0.00007 0.00001 lb/ton PCAS 100% 0.28 0 0.13 0 0.02 0
M10 Pebble Crusher Feeder (F-PbC) to Pebble Crusher (PbC) TrStnPrt 3-03-024-08 NF 1,771 tons 0.0002 0.00007 0.00001 lb/ton Enclosed a 100% 0 0 0 0 0 0
M11 Pebble Crusher (PbC) CrushT 3-03-024-07 NF 1,771 tons 0.06 0.02 0.00 lb/ton PCAS 100% 106.27 0 35.42 0 6.56 0
M12 Pebble Crusher (PbC) to Pebble Conveyor No. 3 (CV-Pb3) TrStnPrt 3-03-024-08 NF 1,771 tons 0.0002 0.00007 0.00001 lb/ton PCAS 100% 0.28 0 0.13 0 0.02 0
Copper Concentrate Dewatering and Stacking
CCD01 Copper Concentrate Filters (Ft-CC1/CC4) to Copper Concentrate Conveyor (CV-CC) TrCuCncPrt 3-03-024-08 NF 138 tons 0.00004 0.00002 0.000003 lb/ton Enclosed a 100% 0 0 0 0 0 0
CCD02 Copper Concentrate Conveyor (CV-CC) to Copper Concentrate Loadout Stockpile
TrCuCncPrt 3-03-024-08 F 138 tons 0.00004 0.00002 0.000003 lb/ton CCS 100% 0.006 0 0.003 0 0.0004 0
CCD03 Wind Erosion of Copper Concentrate Loadout Stockpile WindCvd 3-03-888-01 F 1.17 acres 0 0 0 ton/acre-yr Enclosed a 100% 0 0 0 0 0 0
CCD04 Copper Concentrate Loadout Stockpile to Shipment Truck via Front End Loaders
TrCuCncPrt 3-03-024-08 F 138 tons 0.00004 0.00002 0.000003 lb/ton CCS 100% 0.006 0 0.003 0 0.0004 0
Molybdenum Dewatering and Packaging
MD01 Molybdenum Concentrate Filter (Ft-MC) to Molybdenum Concentrate Dryer (D-MC)
TrMlyCncPrt 3-03-024-08 NF 1.9 tons 0.00002 0.00001 0.000002 lb/ton Enclosed a 100% 0 0 0 0 0 0
MD02 Molybdenum Concentrate Dryer MolyDry 3-03-024-11 NF 1.9 tons 19.70 12.00 5.91 lb/ton MS/EP 100% 37.43 0 22.80 0 11.23 0
MD03 Molybdenum Concentrate Dryer (D-MC) to MolybdenumConcentrate Bin (B-MC)
DTrMlyCncPrt 3-03-024-08 NF 1.9 tons 0.00004 0.00002 0.000003 lb/ton MDC 100% 0.00008 0 0.00004 0 0.000006 0
Rosemont Copper ProjectEmission Inventory Information JBR ENVIRONMENTAL CONSULTANTS, INC.
November 2011Page H90
AZRP00272

PM/TSP PM10 PM2.5 Uncontrolled Controlled Uncontrolled Controlled Uncontrolled ControlledProcess Code
Hourly Production Rate
- Year 5
Table H.25 Maximum Hourly Particulate Emissions - Year 5
SCC EF UnitsUnit Description Control Code
Emission Factors PM2.5 Emissions (lb/hr) - Year 5PM10 Emissions (lb/hr) - Year 5PM/TSP Emissions (lb/hr) - Year 5Unit ID
Pick-up or Control Eff. (%)
Non-Fug. (NF) /
Fug. (F)Rate Units
MD04 Molybdenum Concentrate Bin (B-MC) to MolybdenumConcentrate Hopper (H-MC)
DTrMlyCnc 3-03-024-08 NF 1.9 tons 0.0003 0.0002 0.00002 lb/ton None 0% 0.0006 0.0006 0.0003 0.0003 0.00004 0.00004
MD05 Molybdenum Concentrate Hopper (H-MC) to MolybdenumConcentrate Conveyor (CV-MC)
DTrMlyCncPrt 3-03-024-08 NF 1.9 tons 0.00004 0.00002 0.000003 lb/ton Enclosed a 100% 0 0 0 0 0 0
MD06 Molybdenum Concentrate Conveyor (CV-MC) to Molybdenum Packaging and Weigh System (MPS)
DTrMlyCnc 3-03-024-08 NF 1.9 tons 0.0003 0.0002 0.00002 lb/ton MDC 100% 0.0006 0 0.0003 0 0.00004 0
Tailings Dewatering and Placement
TDS01 Tailings Filters (Ft-T1/T14) to Tailings Belt Feeders (F-T1/T14) FiltTailPrt 3-03-024-08 NF 10,722 tons 0.00002 0.00001 0.000002 lb/ton Enclosed a 100% 0 0 0 0 0 0
TDS02 Tailings Belt Feeders (F-T1/T14) to Fixed Tailings ConveyorNo. 1 (CV-F1)
FiltTailPrt 3-03-024-08 NF 10,722 tons 0.00002 0.00001 0.000002 lb/ton Enclosed a 100% 0 0 0 0 0 0
TDS03 Fixed Tailings Conveyor No. 1 (CV-F1) to Fixed TailingsConveyor No. 2 (CV-F2)
FiltTailPrt 3-03-024-08 NF 10,722 tons 0.00002 0.00001 0.000002 lb/ton Enclosed a 100% 0 0 0 0 0 0
TDS04 Fixed Tailings Conveyor No. 2 (CV-F2) to Fixed Tailings Conveyor No. 3 (CV-F3)
FiltTailPrt 3-03-024-08 NF 10,722 tons 0.00002 0.00001 0.000002 lb/ton None 0% 0.26 0.26 0.12 0.12 0.02 0.02
TDS05 Fixed Tailings Conveyor No. 3 (CV-F3) to RelocatableConveyor (CV-R1)
FiltTailPrt 3-03-024-08 F 10,722 tons 0.00002 0.00001 0.000002 lb/ton None 0% 0.26 0.26 0.12 0.12 0.02 0.02
TDS06 Relocatable Conveyor (CV-R1) to Shiftable Conveyor (CV-S1) FiltTailPrt 3-03-024-08 F 10,722 tons 0.00002 0.00001 0.000002 lb/ton None 0% 0.26 0.26 0.12 0.12 0.02 0.02
TDS07 Shiftable Conveyor (CV-S1) to Belt Wagon Conveyor(CV-BW1)
FiltTail 3-03-024-08 F 10,722 tons 0.0002 0.00009 0.00001 lb/ton None 0% 2.00 2.00 0.95 0.95 0.14 0.14
TDS08 Belt Wagon Conveyor (CV-BW1) to Spreader Crawler Mounted Conveyor (CV-SP1)
FiltTail 3-03-024-08 F 10,722 tons 0.0002 0.00009 0.00001 lb/ton None 0% 2.00 2.00 0.95 0.95 0.14 0.14
TDS09 Spreader Crawler Mounted Conveyor (CV-SP1) to Tailings Storage
FiltTail 3-03-024-08 F 10,722 tons 0.0002 0.00009 0.00001 lb/ton None 0% 2.00 2.00 0.95 0.95 0.14 0.14
TDS10 Wind Erosion of Tailings Storage TailStrg 3-03-888-01 F 1,500 acres 0.02 0.01 0.002 ton/acre-yr None 0% 6.90 6.90 3.45 3.45 0.52 0.52
Fuel Burning Equipment
FB01 Diesel Electrowinning Hot Water Generator (HWG) DFB 1-02-005-03 NF 1 hours 3.30 2.30 1.54 lb/1000 gal None 0% 0.14 0.14 0.10 0.10 0.07 0.07
6.0 MMBtu/hr
FB02 Thickener Area Emergency Generator (TEG) ICDE3 2-02-001-02 NF 1 hours 0.20 0.20 0.20 g/kW-hr None 0% 0.44 0.44 0.44 0.44 0.44 0.44
1,000 kW
FB03 PLS Pond Area Emergency Generator (PEG) ICDE3 2-02-001-02 NF 1 hours 0.20 0.20 0.20 g/kW-hr None 0% 0.44 0.44 0.44 0.44 0.44 0.44
1,000 kW
FB04 Main Substation Emergency Generator (MEG) ICDE3 2-02-001-02 NF 1 hours 0.20 0.20 0.20 g/kW-hr None 0% 0.33 0.33 0.33 0.33 0.33 0.33
750 kW
FB05 Administration Building Emergency Generator (AEG) ICDE3 2-02-001-02 NF 1 hours 0.20 0.20 0.20 g/kW-hr None 0% 0.33 0.33 0.33 0.33 0.33 0.33
750 kW
FB06 Electrowinning Building Emergency Generator (EWEG) ICDE1 2-02-001-02 NF 1 hours 0.40 0.40 0.40 g/kW-hr None 0% 0.04 0.04 0.04 0.04 0.04 0.04
50 kW
FB07 Primary Crusher Fire Water Pump (PCFWP) ICDE2 2-02-001-02 NF 1 hours 0.20 0.20 0.20 g/kW-hr None 0% 0.13 0.13 0.13 0.13 0.13 0.13
400 hp
Rosemont Copper ProjectEmission Inventory Information JBR ENVIRONMENTAL CONSULTANTS, INC.
November 2011Page H91
AZRP00273

PM/TSP PM10 PM2.5 Uncontrolled Controlled Uncontrolled Controlled Uncontrolled ControlledProcess Code
Hourly Production Rate
- Year 5
Table H.25 Maximum Hourly Particulate Emissions - Year 5
SCC EF UnitsUnit Description Control Code
Emission Factors PM2.5 Emissions (lb/hr) - Year 5PM10 Emissions (lb/hr) - Year 5PM/TSP Emissions (lb/hr) - Year 5Unit ID
Pick-up or Control Eff. (%)
Non-Fug. (NF) /
Fug. (F)Rate Units
FB08 SX/EW Fire Water Pump (SXFWP) ICDE2 2-02-001-02 NF 1 hours 0.20 0.20 0.20 g/kW-hr None 0% 0.13 0.13 0.13 0.13 0.13 0.13
400 hp
Miscellaneous Sources
MS01 Transfer of Bulk Pebble Lime to the Bulk Pebble Lime Silo(S-BPL) LimeLd 3-05-016-26 NF 5.18 tons 0.61 0.29 0.04 lb/ton BPLSV a 90% 0.32 0.32 0.15 0.15 0.02 0.02
MS02 Bulk Pebble Lime Silo (S-BPL) to Bulk Pebble Lime Silo Screw Conveyor (CV-BPLS) ReagTr 3-03-024-04 NF 5.18 tons 0.008 0.004 0.0006 lb/ton Enclosed a 100% 0 0 0 0 0 0
MS03 Bulk Pebble Lime Silo Screw Conveyor (CV-BPLS) to SAGMill Feed Conveyor (CV-SMF)
ReagTr 3-03-024-04 NF 5.18 tons 0.008 0.004 0.0006 lb/ton None 0% 0.04 0.04 0.02 0.02 0.003 0.003
MS04 Transfer of Lime to the Lime Storage Bin (B-L) LimeLd 3-05-016-26 NF 2.59 tons 0.61 0.29 0.04 lb/ton LSV a 90% 0.16 0.16 0.07 0.07 0.01 0.01
MS05 Transfer of Sodium Metasilicate to the Sodium MetasilicateStorage Bin (B-SM)
ReagTr 3-03-024-04 NF 0.41 tons 0.008 0.004 0.0006 lb/ton SMSV a 90% 0.0003 0.0003 0.0002 0.0002 0.00002 0.00002
MS06 Transfer of Flocculant from Supersacks to Flocculant Storage Bins (B-F1/F2)
ReagTr 3-03-024-04 NF 0.15 tons 0.008 0.004 0.0006 lb/ton None 0% 0.001 0.001 0.0006 0.0006 0.00009 0.00009
MS07 Transfer of Guar from Bags to Guar Feeder (F-Gu) ReagTr 3-03-024-04 NF 0.02 tons 0.008 0.004 0.0006 lb/ton None 0% 0.0002 0.0002 0.00008 0.00008 0.00001 0.00001
MS08 Transfer of Granular Cobalt Sulfate from Bags to CobaltSulfate Feeder (F-CoS)
ReagTr 3-03-024-04 NF 0.0008 tons 0.008 0.004 0.0006 lb/ton None 0% 0.000007 0.000007 0.000003 0.000003 0.0000005 0.0000005
Particulate Matter Pollution Control Equipment with Emission Limits
PCL01 Crushing Area Scrubber (PC-CAS) CAS none NF 1 hours 1.29 1.28 1.13 lb/hr -- -- -- 1.29 -- 1.28 -- 1.13
PCL02 Stockpile Area Scrubber (PC-SAS) SAS none NF 1 hours 2.61 2.59 2.10 lb/hr -- -- -- 2.61 -- 2.59 -- 2.10
PCL03 Reclaim Tunnel Scrubber (PC-RTS) RTS none NF 1 hours 1.08 1.07 0.87 lb/hr -- -- -- 1.08 -- 1.07 -- 0.87
PCL04 Pebble Crusher Area Scrubber (PC-PCAS) PCAS none NF 1 hours 1.58 1.56 1.31 lb/hr -- -- -- 1.58 -- 1.56 -- 1.31
PCL05 Copper Concentrate Scrubber 1 (PC-CCS1) CCS none NF 1 hours 3.59 3.55 3.04 lb/hr -- -- -- 3.59 -- 3.55 -- 3.04
PCL06 Copper Concentrate Scrubber 2 (PC-CCS2) CCS none NF 1 hours 3.59 3.55 3.04 lb/hr -- -- -- 3.59 -- 3.55 -- 3.04
PCL07 Molybdenum Scrubber (PC-MS) / Electrostatic Precipitator (PC-EP) MS/EP none NF 1 hours 0.015 0.014 0.013 lb/hr -- -- -- 0.02 -- 0.01 -- 0.01
PCL08 Molybdenum Dust Collector (PC-MDC) MDC none NF 74,612 dscf 0.02 0.010 0.002 gr/dscf -- -- -- 0.23 -- 0.11 -- 0.02
PCL09 Laboratory Dust Collector 1 (PC-L1) LDC none NF 497,410 dscf 0.008 0.005 0.002 gr/dscf -- -- -- 0.58 -- 0.36 -- 0.17
PCL10 Laboratory Dust Collector 2 (PC-L2) LDC none NF 497,410 dscf 0.008 0.005 0.002 gr/dscf -- -- -- 0.58 -- 0.36 -- 0.17
PCL11 Laboratory Dust Collector 3 (PC-L3) LDC none NF 497,410 dscf 0.008 0.005 0.002 gr/dscf -- -- -- 0.58 -- 0.36 -- 0.17
291.99 18.51 126.18 17.11 31.81 14.02
10,643.79 1,526.45 2,840.73 496.30 282.60 47.97
10,935.78 1,544.97 2,966.91 513.41 314.42 61.98
9.94 9.94 9.94 9.94 9.94 9.94
a The control efficiency for this emission unit is inherent to the process. Therefore, the control efficiency is applied to both uncontrolled and controlled emissions.
Tailpipe Emissions (see Tables H.29-H.31):
Total Emissions (excluding tailpipe emissions):
Total Fugitive Emissions (excluding tailpipe emissions):
Total Non-Fugitive Emissions (excluding tailpipe emissions):
Rosemont Copper ProjectEmission Inventory Information JBR ENVIRONMENTAL CONSULTANTS, INC.
November 2011Page H92
AZRP00274

CO NOX SO2 VOC H2SO4 CO2 CH4 N2O HAP Name HAP EF CO NOX SO2 VOC H2SO4 CO2a CH4
a N2O a HAP b
Mining
MN02 Blasting Blast 3-05-020-09 F 18,096 tons ANFO 67.00 17.00 2.00 0 0 566 0.02 0.005 -- -- lb/tons ANFO 606.22 153.82 18.10 0 0 5,125.23 0.21 0.04 --
Solvent Extraction and Electrowinning
SXE01 Solvent Extraction SX 4-90-001-99 F 8,760 hours 0 0 0 9.43E-05 0 0 0 0 Benzene 3.37E-07 lb/hr-ft2 0 0 0 3.77 0 0 0 0 1.35E-02
4 Primary Mix Tanks (7.75' D x 9.75' H each) 4 @ 47.2 = 188.7 ft2 9,132.9 ft2 Total Surface Area of Solvent Extraction Toluene 4.82E-06 lb/hr-ft2 1.93E-01
4 Secondary Mix Tanks (9.5' D x 9.75' H each) 4 @ 70.9 = 283.5 ft2 Ethylbenzene 2.05E-05 lb/hr-ft2 8.21E-01
3 Tertiary Mix Tanks (9.5' D x 9.75' H each) 3 @ 70.9 = 212.6 ft2 Xylenes 2.80E-05 lb/hr-ft2 1.12E+00
4 Extraction Settlers (64' L x 33' W x 3.33' H each) 4 @ 2,112 = 8,448 ft2 Others (including Hexane) 2.94E-05 lb/hr-ft2 1.18E+00
SXE02 Electrowinning Commercial Cells (EWCC) EW none NF 8,760 hours 0 0 0 0 1.57E-04 0 0 0 Cobalt Compounds 2.36E-08 lb/hr-ft2 0 0 0 0 0.02 0 0 0 2.72E-06
Controlled by Cell Ventilation Scrubbers(PC-EWCVS1/EWCVS6)
2,640 ft2
99 Control Efficiency (%)
Fuel Burning Equipment
FB01 Diesel Electrowinning Hot Water Generator (HWG) DFB 1-02-005-03 NF 8,760 hours 5.00 20.00 0.21 0.20 0 23,217 0.94 0.19 POM 3.30E-03 lb/1000 gal 0.96 3.84 0.04 0.04 0 4,453.51 0.18 0.04 6.33E-04
6.0 MMBtu/hr Formaldehyde 6.10E-02 lb/1000 gal 1.17E-02
Arsenic 4.00 lb/1012 Btu 1.05E-04
Beryllium 3.00 lb/1012 Btu 7.88E-05
Cadmium 3.00 lb/1012 Btu 7.88E-05
Chromium 3.00 lb/1012 Btu 7.88E-05
Lead 9.00 lb/1012 Btu 2.37E-04
Mercury 3.00 lb/1012 Btu 7.88E-05
Manganese 6.00 lb/1012 Btu 1.58E-04
Nickel 3.00 lb/1012 Btu 7.88E-05
Selenium 15.00 lb/1012 Btu 3.94E-04
FB02 Thickener Area Emergency Generator (TEG) ICDE3 2-02-001-02 NF 500 hours 3.50 6.00 0.0066 0.40 0 694 0.03 0.006 -- -- g/kW-hr 1.93 3.31 0.004 0.22 0 382.65 0.02 0.003 --
1,000 kW Benzene 7.76E-04 lb/MMBtu 1.82E-03
Toluene 2.81E-04 lb/MMBtu 6.59E-04
Xylenes 1.93E-04 lb/MMBtu 4.53E-04
Formaldehyde 7.89E-05 lb/MMBtu 1.85E-04
Acetaldehyde 2.52E-05 lb/MMBtu 5.91E-05
Acrolein 7.88E-06 lb/MMBtu 1.85E-05
Naphthalene 1.30E-04 lb/MMBtu 3.05E-04
Acenaphthylene 9.23E-06 lb/MMBtu 2.17E-05
Acenaphthene 4.68E-06 lb/MMBtu 1.10E-05
Fluorene 1.28E-05 lb/MMBtu 3.00E-05
Phenanthrene 4.08E-05 lb/MMBtu 9.57E-05
Anthracene 1.23E-06 lb/MMBtu 2.89E-06
Fluoranthene 4.03E-06 lb/MMBtu 9.46E-06
Pyrene 3.71E-06 lb/MMBtu 8.71E-06
Benz(a)anthracene 6.22E-07 lb/MMBtu 1.46E-06
Chrysene 1.53E-06 lb/MMBtu 3.59E-06
Table H.26 Annual Gaseous Emissions - Year 5
Emissions (tpy) - Year 5Emission FactorsSCCUnit ID EF UnitsUnit Description Process Code
Non-Fug. (NF) /
Fug. (F)Rate Units
Annual Production Rate -
Year 5
Rosemont Copper ProjectEmission Inventory Information JBR ENVIRONMENTAL CONSULTANTS, INC.
November 2011Page H93
AZRP00275

CO NOX SO2 VOC H2SO4 CO2 CH4 N2O HAP Name HAP EF CO NOX SO2 VOC H2SO4 CO2a CH4
a N2O a HAP b
Table H.26 Annual Gaseous Emissions - Year 5
Emissions (tpy) - Year 5Emission FactorsSCCUnit ID EF UnitsUnit Description Process Code
Non-Fug. (NF) /
Fug. (F)Rate Units
Annual Production Rate -
Year 5
Benzo(b)fluoranthene 1.11E-06 lb/MMBtu 2.60E-06
Benzo(k)fluoranthene 2.18E-07 lb/MMBtu 5.12E-07
Benzo(a)pyrene 2.57E-07 lb/MMBtu 6.03E-07
Indeno(1,2,3-cd)pyrene 4.14E-07 lb/MMBtu 9.72E-07
Dibenz(a,h)anthracene 3.46E-07 lb/MMBtu 8.12E-07
Benzo(g,h,i)perylene 5.56E-07 lb/MMBtu 1.30E-06
FB03 PLS Pond Area Emergency Generator (PEG) ICDE3 2-02-001-02 NF 500 hours 3.50 6.00 0.0066 0.40 0 694 0.03 0.006 -- -- g/kW-hr 1.93 3.31 0.004 0.22 0 382.65 0.02 0.003 --
1,000 kW Benzene 7.76E-04 lb/MMBtu 1.82E-03
Toluene 2.81E-04 lb/MMBtu 6.59E-04
Xylenes 1.93E-04 lb/MMBtu 4.53E-04
Formaldehyde 7.89E-05 lb/MMBtu 1.85E-04
Acetaldehyde 2.52E-05 lb/MMBtu 5.91E-05
Acrolein 7.88E-06 lb/MMBtu 1.85E-05
Naphthalene 1.30E-04 lb/MMBtu 3.05E-04
Acenaphthylene 9.23E-06 lb/MMBtu 2.17E-05
Acenaphthene 4.68E-06 lb/MMBtu 1.10E-05
Fluorene 1.28E-05 lb/MMBtu 3.00E-05
Phenanthrene 4.08E-05 lb/MMBtu 9.57E-05
Anthracene 1.23E-06 lb/MMBtu 2.89E-06
Fluoranthene 4.03E-06 lb/MMBtu 9.46E-06
Pyrene 3.71E-06 lb/MMBtu 8.71E-06
Benz(a)anthracene 6.22E-07 lb/MMBtu 1.46E-06
Chrysene 1.53E-06 lb/MMBtu 3.59E-06
Benzo(b)fluoranthene 1.11E-06 lb/MMBtu 2.60E-06
Benzo(k)fluoranthene 2.18E-07 lb/MMBtu 5.12E-07
Benzo(a)pyrene 2.57E-07 lb/MMBtu 6.03E-07
Indeno(1,2,3-cd)pyrene 4.14E-07 lb/MMBtu 9.72E-07
Dibenz(a,h)anthracene 3.46E-07 lb/MMBtu 8.12E-07
Benzo(g,h,i)perylene 5.56E-07 lb/MMBtu 1.30E-06
FB04 Main Substation Emergency Generator (MEG) ICDE3 2-02-001-02 NF 500 hours 3.50 6.00 0.0066 0.40 0 694 0.03 0.006 -- -- g/kW-hr 1.45 2.48 0.003 0.17 0 286.99 0.01 0.002 --
750 kW Benzene 7.76E-04 lb/MMBtu 1.37E-03
Toluene 2.81E-04 lb/MMBtu 4.95E-04
Xylenes 1.93E-04 lb/MMBtu 3.40E-04
Formaldehyde 7.89E-05 lb/MMBtu 1.39E-04
Acetaldehyde 2.52E-05 lb/MMBtu 4.44E-05
Acrolein 7.88E-06 lb/MMBtu 1.39E-05
Naphthalene 1.30E-04 lb/MMBtu 2.29E-04
Acenaphthylene 9.23E-06 lb/MMBtu 1.62E-05
Acenaphthene 4.68E-06 lb/MMBtu 8.24E-06
Fluorene 1.28E-05 lb/MMBtu 2.25E-05
Rosemont Copper ProjectEmission Inventory Information JBR ENVIRONMENTAL CONSULTANTS, INC.
November 2011Page H94
AZRP00276
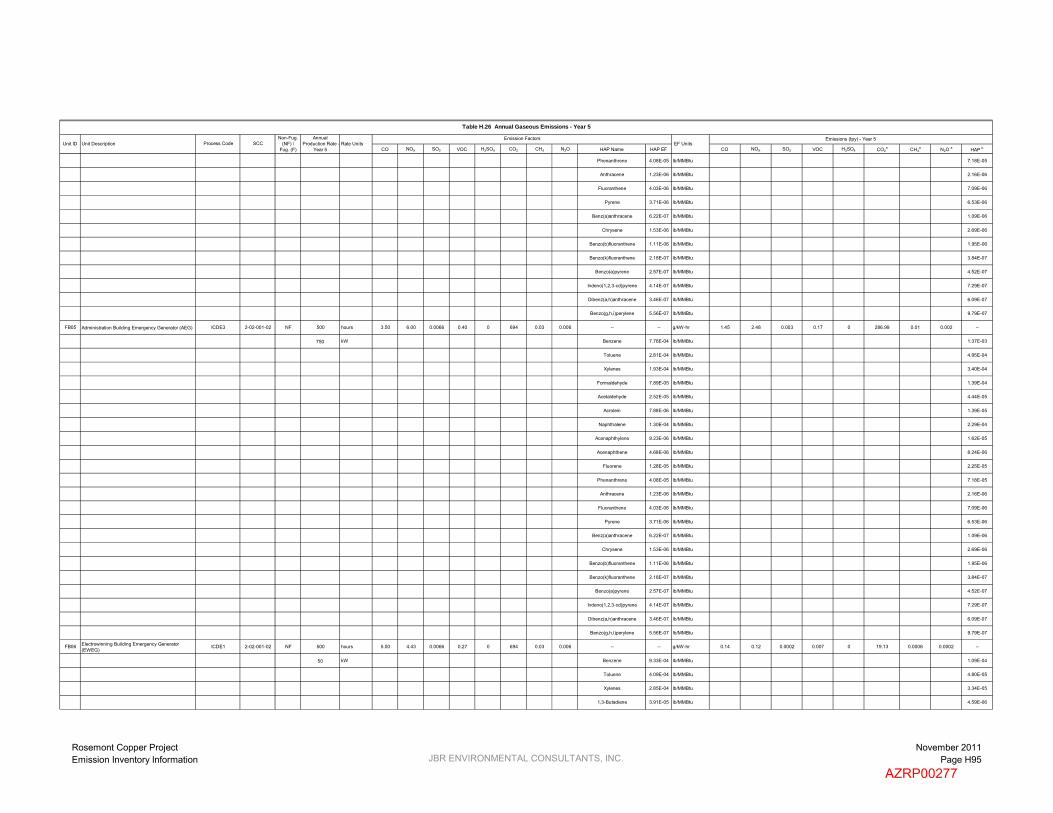
CO NOX SO2 VOC H2SO4 CO2 CH4 N2O HAP Name HAP EF CO NOX SO2 VOC H2SO4 CO2a CH4
a N2O a HAP b
Table H.26 Annual Gaseous Emissions - Year 5
Emissions (tpy) - Year 5Emission FactorsSCCUnit ID EF UnitsUnit Description Process Code
Non-Fug. (NF) /
Fug. (F)Rate Units
Annual Production Rate -
Year 5
Phenanthrene 4.08E-05 lb/MMBtu 7.18E-05
Anthracene 1.23E-06 lb/MMBtu 2.16E-06
Fluoranthene 4.03E-06 lb/MMBtu 7.09E-06
Pyrene 3.71E-06 lb/MMBtu 6.53E-06
Benz(a)anthracene 6.22E-07 lb/MMBtu 1.09E-06
Chrysene 1.53E-06 lb/MMBtu 2.69E-06
Benzo(b)fluoranthene 1.11E-06 lb/MMBtu 1.95E-06
Benzo(k)fluoranthene 2.18E-07 lb/MMBtu 3.84E-07
Benzo(a)pyrene 2.57E-07 lb/MMBtu 4.52E-07
Indeno(1,2,3-cd)pyrene 4.14E-07 lb/MMBtu 7.29E-07
Dibenz(a,h)anthracene 3.46E-07 lb/MMBtu 6.09E-07
Benzo(g,h,i)perylene 5.56E-07 lb/MMBtu 9.79E-07
FB05 Administration Building Emergency Generator (AEG) ICDE3 2-02-001-02 NF 500 hours 3.50 6.00 0.0066 0.40 0 694 0.03 0.006 -- -- g/kW-hr 1.45 2.48 0.003 0.17 0 286.99 0.01 0.002 --
750 kW Benzene 7.76E-04 lb/MMBtu 1.37E-03
Toluene 2.81E-04 lb/MMBtu 4.95E-04
Xylenes 1.93E-04 lb/MMBtu 3.40E-04
Formaldehyde 7.89E-05 lb/MMBtu 1.39E-04
Acetaldehyde 2.52E-05 lb/MMBtu 4.44E-05
Acrolein 7.88E-06 lb/MMBtu 1.39E-05
Naphthalene 1.30E-04 lb/MMBtu 2.29E-04
Acenaphthylene 9.23E-06 lb/MMBtu 1.62E-05
Acenaphthene 4.68E-06 lb/MMBtu 8.24E-06
Fluorene 1.28E-05 lb/MMBtu 2.25E-05
Phenanthrene 4.08E-05 lb/MMBtu 7.18E-05
Anthracene 1.23E-06 lb/MMBtu 2.16E-06
Fluoranthene 4.03E-06 lb/MMBtu 7.09E-06
Pyrene 3.71E-06 lb/MMBtu 6.53E-06
Benz(a)anthracene 6.22E-07 lb/MMBtu 1.09E-06
Chrysene 1.53E-06 lb/MMBtu 2.69E-06
Benzo(b)fluoranthene 1.11E-06 lb/MMBtu 1.95E-06
Benzo(k)fluoranthene 2.18E-07 lb/MMBtu 3.84E-07
Benzo(a)pyrene 2.57E-07 lb/MMBtu 4.52E-07
Indeno(1,2,3-cd)pyrene 4.14E-07 lb/MMBtu 7.29E-07
Dibenz(a,h)anthracene 3.46E-07 lb/MMBtu 6.09E-07
Benzo(g,h,i)perylene 5.56E-07 lb/MMBtu 9.79E-07
FB06 Electrowinning Building Emergency Generator (EWEG)
ICDE1 2-02-001-02 NF 500 hours 5.00 4.43 0.0066 0.27 0 694 0.03 0.006 -- -- g/kW-hr 0.14 0.12 0.0002 0.007 0 19.13 0.0008 0.0002 --
50 kW Benzene 9.33E-04 lb/MMBtu 1.09E-04
Toluene 4.09E-04 lb/MMBtu 4.80E-05
Xylenes 2.85E-04 lb/MMBtu 3.34E-05
1,3-Butadiene 3.91E-05 lb/MMBtu 4.59E-06
Rosemont Copper ProjectEmission Inventory Information JBR ENVIRONMENTAL CONSULTANTS, INC.
November 2011Page H95
AZRP00277

CO NOX SO2 VOC H2SO4 CO2 CH4 N2O HAP Name HAP EF CO NOX SO2 VOC H2SO4 CO2a CH4
a N2O a HAP b
Table H.26 Annual Gaseous Emissions - Year 5
Emissions (tpy) - Year 5Emission FactorsSCCUnit ID EF UnitsUnit Description Process Code
Non-Fug. (NF) /
Fug. (F)Rate Units
Annual Production Rate -
Year 5
Formaldehyde 1.18E-03 lb/MMBtu 1.38E-04
Acetaldehyde 7.67E-04 lb/MMBtu 9.00E-05
Acrolein 9.25E-05 lb/MMBtu 1.09E-05
Naphthalene 8.48E-05 lb/MMBtu 9.95E-06
Acenaphthylene 5.06E-06 lb/MMBtu 5.94E-07
Acenaphthene 1.42E-06 lb/MMBtu 1.67E-07
Fluorene 2.92E-05 lb/MMBtu 3.43E-06
Phenanthrene 2.94E-05 lb/MMBtu 3.45E-06
Anthracene 1.87E-06 lb/MMBtu 2.19E-07
Fluoranthene 7.61E-06 lb/MMBtu 8.93E-07
Pyrene 4.78E-06 lb/MMBtu 5.61E-07
Benzo(a)anthracene 1.68E-06 lb/MMBtu 1.97E-07
Chrysene 3.53E-07 lb/MMBtu 4.14E-08
Benzo(b)fluoranthene 9.91E-08 lb/MMBtu 1.16E-08
Benzo(k)fluoranthene 1.55E-07 lb/MMBtu 1.82E-08
Benzo(a)pyrene 1.88E-07 lb/MMBtu 2.21E-08
Indeno(1,2,3-cd)pyrene 3.75E-07 lb/MMBtu 4.40E-08
Dibenz(a,h)anthracene 5.83E-07 lb/MMBtu 6.84E-08
Benzo(g,h,i)perylene 4.89E-07 lb/MMBtu 5.74E-08
FB07 Primary Crusher Fire Water Pump (PCFWP) ICDE2 2-02-001-02 NF 500 hours 3.50 3.73 0.0066 0.27 0 694 0.03 0.006 -- -- g/kW-hr 0.58 0.61 0.001 0.04 0 114.14 0.005 0.0009 --
400 hp Benzene 9.33E-04 lb/MMBtu 6.53E-04
Toluene 4.09E-04 lb/MMBtu 2.86E-04
Xylenes 2.85E-04 lb/MMBtu 2.00E-04
1,3-Butadiene 3.91E-05 lb/MMBtu 2.74E-05
Formaldehyde 1.18E-03 lb/MMBtu 8.26E-04
Acetaldehyde 7.67E-04 lb/MMBtu 5.37E-04
Acrolein 9.25E-05 lb/MMBtu 6.48E-05
Naphthalene 8.48E-05 lb/MMBtu 5.94E-05
Acenaphthylene 5.06E-06 lb/MMBtu 3.54E-06
Acenaphthene 1.42E-06 lb/MMBtu 9.94E-07
Fluorene 2.92E-05 lb/MMBtu 2.04E-05
Phenanthrene 2.94E-05 lb/MMBtu 2.06E-05
Anthracene 1.87E-06 lb/MMBtu 1.31E-06
Fluoranthene 7.61E-06 lb/MMBtu 5.33E-06
Pyrene 4.78E-06 lb/MMBtu 3.35E-06
Benzo(a)anthracene 1.68E-06 lb/MMBtu 1.18E-06
Chrysene 3.53E-07 lb/MMBtu 2.47E-07
Benzo(b)fluoranthene 9.91E-08 lb/MMBtu 6.94E-08
Benzo(k)fluoranthene 1.55E-07 lb/MMBtu 1.09E-07
Benzo(a)pyrene 1.88E-07 lb/MMBtu 1.32E-07
Rosemont Copper ProjectEmission Inventory Information JBR ENVIRONMENTAL CONSULTANTS, INC.
November 2011Page H96
AZRP00278

CO NOX SO2 VOC H2SO4 CO2 CH4 N2O HAP Name HAP EF CO NOX SO2 VOC H2SO4 CO2a CH4
a N2O a HAP b
Table H.26 Annual Gaseous Emissions - Year 5
Emissions (tpy) - Year 5Emission FactorsSCCUnit ID EF UnitsUnit Description Process Code
Non-Fug. (NF) /
Fug. (F)Rate Units
Annual Production Rate -
Year 5
Indeno(1,2,3-cd)pyrene 3.75E-07 lb/MMBtu 2.63E-07
Dibenz(a,h)anthracene 5.83E-07 lb/MMBtu 4.08E-07
Benzo(g,h,i)perylene 4.89E-07 lb/MMBtu 3.42E-07
FB08 SX/EW Fire Water Pump (SXFWP) ICDE2 2-02-001-02 NF 500 hours 3.50 3.73 0.0066 0.27 0 694 0.03 0.006 -- -- g/kW-hr 0.58 0.61 0.001 0.04 0 114.14 0.005 0.0009 --
400 hp Benzene 9.33E-04 lb/MMBtu 6.53E-04
Toluene 4.09E-04 lb/MMBtu 2.86E-04
Xylenes 2.85E-04 lb/MMBtu 2.00E-04
1,3-Butadiene 3.91E-05 lb/MMBtu 2.74E-05
Formaldehyde 1.18E-03 lb/MMBtu 8.26E-04
Acetaldehyde 7.67E-04 lb/MMBtu 5.37E-04
Acrolein 9.25E-05 lb/MMBtu 6.48E-05
Naphthalene 8.48E-05 lb/MMBtu 5.94E-05
Acenaphthylene 5.06E-06 lb/MMBtu 3.54E-06
Acenaphthene 1.42E-06 lb/MMBtu 9.94E-07
Fluorene 2.92E-05 lb/MMBtu 2.04E-05
Phenanthrene 2.94E-05 lb/MMBtu 2.06E-05
Anthracene 1.87E-06 lb/MMBtu 1.31E-06
Fluoranthene 7.61E-06 lb/MMBtu 5.33E-06
Pyrene 4.78E-06 lb/MMBtu 3.35E-06
Benzo(a)anthracene 1.68E-06 lb/MMBtu 1.18E-06
Chrysene 3.53E-07 lb/MMBtu 2.47E-07
Benzo(b)fluoranthene 9.91E-08 lb/MMBtu 6.94E-08
Benzo(k)fluoranthene 1.55E-07 lb/MMBtu 1.09E-07
Benzo(a)pyrene 1.88E-07 lb/MMBtu 1.32E-07
Indeno(1,2,3-cd)pyrene 3.75E-07 lb/MMBtu 2.63E-07
Dibenz(a,h)anthracene 5.83E-07 lb/MMBtu 4.08E-07
Benzo(g,h,i)perylene 4.89E-07 lb/MMBtu 3.42E-07
Tanks
T01 C7 Distribution Tank (T-C7D) C7DT 4-03-010-19 NF 8,760 hours 0 0 0 1.08E-01 0 0 0 0 -- -- lb/hr 0 0 0 0.47 0 0 0 0 --
T02 MIBC Storage Tank (T-MIBCS) MST 4-90-999-98 NF 8,760 hours 0 0 0 3.53E-03 0 0 0 0 -- -- lb/hr 0 0 0 0.02 0 0 0 0 --
T03 Diesel Fuel Storage Tank - Heavy Vehicles 1(T-DFS-HV1)
DFSTHV 4-03-010-19 NF 8,760 hours 0 0 0 1.39E-02 0 0 0 0 n-Hexane 5.71E-06 lb/hr 0 0 0 0.06 0 0 0 0 2.50E-05
Benzene 2.74E-05 lb/hr 1.20E-04
Toluene 3.18E-04 lb/hr 1.40E-03
Ethylbenzene 4.45E-05 lb/hr 1.95E-04
m-Xylene 8.23E-04 lb/hr 3.61E-03
1,2,4-Trimethylbenzene 6.76E-04 lb/hr 2.96E-03
T04 Diesel Fuel Storage Tank - Heavy Vehicles 2(T-DFS-HV2)
DFSTHV 4-03-010-19 NF 8,760 hours 0 0 0 1.39E-02 0 0 0 0 n-Hexane 5.71E-06 lb/hr 0 0 0 0.06 0 0 0 0 2.50E-05
Benzene 2.74E-05 lb/hr 1.20E-04
Toluene 3.18E-04 lb/hr 1.40E-03
Ethylbenzene 4.45E-05 lb/hr 1.95E-04
Rosemont Copper ProjectEmission Inventory Information JBR ENVIRONMENTAL CONSULTANTS, INC.
November 2011Page H97
AZRP00279

CO NOX SO2 VOC H2SO4 CO2 CH4 N2O HAP Name HAP EF CO NOX SO2 VOC H2SO4 CO2a CH4
a N2O a HAP b
Table H.26 Annual Gaseous Emissions - Year 5
Emissions (tpy) - Year 5Emission FactorsSCCUnit ID EF UnitsUnit Description Process Code
Non-Fug. (NF) /
Fug. (F)Rate Units
Annual Production Rate -
Year 5
m-Xylene 8.23E-04 lb/hr 3.61E-03
1,2,4-Trimethylbenzene 6.76E-04 lb/hr 2.96E-03
9.00 16.76 0.06 1.51 0.02 6,040.20 0.25 0.05 0.05
606.22 153.82 18.10 3.77 0 5,125.23 0.21 0.04 3.32
615.22 170.58 18.15 5.28 0.02 11,165.44 0.45 0.09 3.37
829.16 1,086.32 1.54 78.55 -- 163,247.91 -- -- --
a CO2e emissions are calculcated by summing the individual greenhouse gas emissions multiplied by their global warming potential (GWP). GWP of CO2 = 1, GWP of CH4 = 21, GWP of N2O = 310.
b All HAP emissions are included in the facility-wide potential to emit, regardless of if they are fugitive or non-fugitive emissions.
Tailpipe Emissions (see Tables H.32-H.36):
Total Emissions (excluding tailpipe emissions):
Total Non-Fugitive Emissions (excluding tailpipe emissions):
Total Fugitive Emissions (excluding tailpipe emissions):
Rosemont Copper ProjectEmission Inventory Information JBR ENVIRONMENTAL CONSULTANTS, INC.
November 2011Page H98
AZRP00280

CO NOX SO2 VOC H2SO4 CO2 CH4 N2O HAP Name HAP EF CO NOX SO2 VOC H2SO4 CO2a CH4
a N2O a HAP b
Mining
MN02 Blasting Blast 3-05-020-09 F 52 tons ANFO 67.00 17.00 2.00 0 0 566 0.02 0.005 -- -- lb/tons ANFO 1.74 0.44 0.05 0 0 14.73 0.0006 0.0001 --
Solvent Extraction and Electrowinning
SXE01 Solvent Extraction SX 4-90-001-99 F 24 hours 0 0 0 9.43E-05 0 0 0 0 Benzene 3.37E-07 lb/hr-ft2 0 0 0 0.01 0 0 0 0 3.69E-05
4 Primary Mix Tanks (7.75' D x 9.75' H each) 4 @ 47.2 = 188.7 ft2 9,132.9 ft2 Total Surface Area of Solvent Extraction Toluene 4.82E-06 lb/hr-ft2 5.28E-04
4 Secondary Mix Tanks (9.5' D x 9.75' H each) 4 @ 70.9 = 283.5 ft2 Ethylbenzene 2.05E-05 lb/hr-ft2 2.25E-03
3 Tertiary Mix Tanks (9.5' D x 9.75' H each) 3 @ 70.9 = 212.6 ft2 Xylenes 2.80E-05 lb/hr-ft2 3.07E-03
4 Extraction Settlers (64' L x 33' W x 3.33' H each) 4 @ 2,112 = 8,448 ft2 Others (including Hexane) 2.94E-05 lb/hr-ft2 3.22E-03
SXE02 Electrowinning Commercial Cells (EWCC) EW none NF 24 hours 0 0 0 0 1.57E-04 0 0 0 Cobalt Compounds 2.36E-08 lb/hr-ft2 0 0 0 0 0.00005 0 0 0 7.46E-09
Controlled by Cell Ventilation Scrubbers(PC-EWCVS1/EWCVS6)
2,640 ft2
99 Control Efficiency (%)
Fuel Burning Equipment
FB01 Diesel Electrowinning Hot Water Generator (HWG) DFB 1-02-005-03 NF 24 hours 5.00 20.00 0.21 0.20 0 23,217 0.94 0.19 POM 3.30E-03 lb/1000 gal 0.003 0.01 0.0001 0.0001 0 12.20 0.0005 0.0001 1.73E-06
6.0 MMBtu/hr Formaldehyde 6.10E-02 lb/1000 gal 3.21E-05
Arsenic 4.00 lb/1012 Btu 2.88E-07
Beryllium 3.00 lb/1012 Btu 2.16E-07
Cadmium 3.00 lb/1012 Btu 2.16E-07
Chromium 3.00 lb/1012 Btu 2.16E-07
Lead 9.00 lb/1012 Btu 6.48E-07
Mercury 3.00 lb/1012 Btu 2.16E-07
Manganese 6.00 lb/1012 Btu 4.32E-07
Nickel 3.00 lb/1012 Btu 2.16E-07
Selenium 15.00 lb/1012 Btu 1.08E-06
FB02 Thickener Area Emergency Generator (TEG) ICDE3 2-02-001-02 NF 24 hours 3.50 6.00 0.0066 0.40 0 694 0.03 0.006 -- -- g/kW-hr 0.09 0.16 0.0002 0.01 0 18.37 0.0007 0.0001 --
1,000 kW Benzene 7.76E-04 lb/MMBtu 8.74E-05
Toluene 2.81E-04 lb/MMBtu 3.17E-05
Xylenes 1.93E-04 lb/MMBtu 2.17E-05
Formaldehyde 7.89E-05 lb/MMBtu 8.89E-06
Acetaldehyde 2.52E-05 lb/MMBtu 2.84E-06
Acrolein 7.88E-06 lb/MMBtu 8.88E-07
Naphthalene 1.30E-04 lb/MMBtu 1.46E-05
Acenaphthylene 9.23E-06 lb/MMBtu 1.04E-06
Acenaphthene 4.68E-06 lb/MMBtu 5.27E-07
Fluorene 1.28E-05 lb/MMBtu 1.44E-06
Phenanthrene 4.08E-05 lb/MMBtu 4.60E-06
Anthracene 1.23E-06 lb/MMBtu 1.39E-07
Fluoranthene 4.03E-06 lb/MMBtu 4.54E-07
Pyrene 3.71E-06 lb/MMBtu 4.18E-07
Benz(a)anthracene 6.22E-07 lb/MMBtu 7.01E-08
Chrysene 1.53E-06 lb/MMBtu 1.72E-07
SCCEmission Factors
Unit ID EF UnitsUnit Description Process CodeNon-Fug.
(NF) / Fug. (F)
Emissions (tpd) - Year 5
Table H.27 Maximum Daily Gaseous Emissions - Year 5
Daily Production Rate - Year 5 Rate Units
Rosemont Copper ProjectEmission Inventory Information JBR ENVIRONMENTAL CONSULTANTS, INC.
November 2011Page H99
AZRP00281

CO NOX SO2 VOC H2SO4 CO2 CH4 N2O HAP Name HAP EF CO NOX SO2 VOC H2SO4 CO2a CH4
a N2O a HAP bSCC
Emission FactorsUnit ID EF UnitsUnit Description Process Code
Non-Fug. (NF) /
Fug. (F)
Emissions (tpd) - Year 5
Table H.27 Maximum Daily Gaseous Emissions - Year 5
Daily Production Rate - Year 5 Rate Units
Benzo(b)fluoranthene 1.11E-06 lb/MMBtu 1.25E-07
Benzo(k)fluoranthene 2.18E-07 lb/MMBtu 2.46E-08
Benzo(a)pyrene 2.57E-07 lb/MMBtu 2.89E-08
Indeno(1,2,3-cd)pyrene 4.14E-07 lb/MMBtu 4.66E-08
Dibenz(a,h)anthracene 3.46E-07 lb/MMBtu 3.90E-08
Benzo(g,h,i)perylene 5.56E-07 lb/MMBtu 6.26E-08
FB03 PLS Pond Area Emergency Generator (PEG) ICDE3 2-02-001-02 NF 24 hours 3.50 6.00 0.0066 0.40 0 694 0.03 0.006 -- -- g/kW-hr 0.09 0.16 0.0002 0.01 0 18.37 0.0007 0.0001 --
1,000 kW Benzene 7.76E-04 lb/MMBtu 8.74E-05
Toluene 2.81E-04 lb/MMBtu 3.17E-05
Xylenes 1.93E-04 lb/MMBtu 2.17E-05
Formaldehyde 7.89E-05 lb/MMBtu 8.89E-06
Acetaldehyde 2.52E-05 lb/MMBtu 2.84E-06
Acrolein 7.88E-06 lb/MMBtu 8.88E-07
Naphthalene 1.30E-04 lb/MMBtu 1.46E-05
Acenaphthylene 9.23E-06 lb/MMBtu 1.04E-06
Acenaphthene 4.68E-06 lb/MMBtu 5.27E-07
Fluorene 1.28E-05 lb/MMBtu 1.44E-06
Phenanthrene 4.08E-05 lb/MMBtu 4.60E-06
Anthracene 1.23E-06 lb/MMBtu 1.39E-07
Fluoranthene 4.03E-06 lb/MMBtu 4.54E-07
Pyrene 3.71E-06 lb/MMBtu 4.18E-07
Benz(a)anthracene 6.22E-07 lb/MMBtu 7.01E-08
Chrysene 1.53E-06 lb/MMBtu 1.72E-07
Benzo(b)fluoranthene 1.11E-06 lb/MMBtu 1.25E-07
Benzo(k)fluoranthene 2.18E-07 lb/MMBtu 2.46E-08
Benzo(a)pyrene 2.57E-07 lb/MMBtu 2.89E-08
Indeno(1,2,3-cd)pyrene 4.14E-07 lb/MMBtu 4.66E-08
Dibenz(a,h)anthracene 3.46E-07 lb/MMBtu 3.90E-08
Benzo(g,h,i)perylene 5.56E-07 lb/MMBtu 6.26E-08
FB04 Main Substation Emergency Generator (MEG) ICDE3 2-02-001-02 NF 24 hours 3.50 6.00 0.0066 0.40 0 694 0.03 0.006 -- -- g/kW-hr 0.07 0.12 0.0001 0.008 0 13.78 0.0006 0.0001 --
750 kW Benzene 7.76E-04 lb/MMBtu 6.56E-05
Toluene 2.81E-04 lb/MMBtu 2.37E-05
Xylenes 1.93E-04 lb/MMBtu 1.63E-05
Formaldehyde 7.89E-05 lb/MMBtu 6.67E-06
Acetaldehyde 2.52E-05 lb/MMBtu 2.13E-06
Acrolein 7.88E-06 lb/MMBtu 6.66E-07
Naphthalene 1.30E-04 lb/MMBtu 1.10E-05
Acenaphthylene 9.23E-06 lb/MMBtu 7.80E-07
Acenaphthene 4.68E-06 lb/MMBtu 3.95E-07
Fluorene 1.28E-05 lb/MMBtu 1.08E-06
Rosemont Copper ProjectEmission Inventory Information JBR ENVIRONMENTAL CONSULTANTS, INC.
November 2011Page H100
AZRP00282

CO NOX SO2 VOC H2SO4 CO2 CH4 N2O HAP Name HAP EF CO NOX SO2 VOC H2SO4 CO2a CH4
a N2O a HAP bSCC
Emission FactorsUnit ID EF UnitsUnit Description Process Code
Non-Fug. (NF) /
Fug. (F)
Emissions (tpd) - Year 5
Table H.27 Maximum Daily Gaseous Emissions - Year 5
Daily Production Rate - Year 5 Rate Units
Phenanthrene 4.08E-05 lb/MMBtu 3.45E-06
Anthracene 1.23E-06 lb/MMBtu 1.04E-07
Fluoranthene 4.03E-06 lb/MMBtu 3.40E-07
Pyrene 3.71E-06 lb/MMBtu 3.13E-07
Benz(a)anthracene 6.22E-07 lb/MMBtu 5.25E-08
Chrysene 1.53E-06 lb/MMBtu 1.29E-07
Benzo(b)fluoranthene 1.11E-06 lb/MMBtu 9.38E-08
Benzo(k)fluoranthene 2.18E-07 lb/MMBtu 1.84E-08
Benzo(a)pyrene 2.57E-07 lb/MMBtu 2.17E-08
Indeno(1,2,3-cd)pyrene 4.14E-07 lb/MMBtu 3.50E-08
Dibenz(a,h)anthracene 3.46E-07 lb/MMBtu 2.92E-08
Benzo(g,h,i)perylene 5.56E-07 lb/MMBtu 4.70E-08
FB05 Administration Building Emergency Generator (AEG) ICDE3 2-02-001-02 NF 24 hours 3.50 6.00 0.0066 0.40 0 694 0.03 0.006 -- -- g/kW-hr 0.07 0.12 0.0001 0.008 0 13.78 0.0006 0.0001 --
750 kW Benzene 7.76E-04 lb/MMBtu 6.56E-05
Toluene 2.81E-04 lb/MMBtu 2.37E-05
Xylenes 1.93E-04 lb/MMBtu 1.63E-05
Formaldehyde 7.89E-05 lb/MMBtu 6.67E-06
Acetaldehyde 2.52E-05 lb/MMBtu 2.13E-06
Acrolein 7.88E-06 lb/MMBtu 6.66E-07
Naphthalene 1.30E-04 lb/MMBtu 1.10E-05
Acenaphthylene 9.23E-06 lb/MMBtu 7.80E-07
Acenaphthene 4.68E-06 lb/MMBtu 3.95E-07
Fluorene 1.28E-05 lb/MMBtu 1.08E-06
Phenanthrene 4.08E-05 lb/MMBtu 3.45E-06
Anthracene 1.23E-06 lb/MMBtu 1.04E-07
Fluoranthene 4.03E-06 lb/MMBtu 3.40E-07
Pyrene 3.71E-06 lb/MMBtu 3.13E-07
Benz(a)anthracene 6.22E-07 lb/MMBtu 5.25E-08
Chrysene 1.53E-06 lb/MMBtu 1.29E-07
Benzo(b)fluoranthene 1.11E-06 lb/MMBtu 9.38E-08
Benzo(k)fluoranthene 2.18E-07 lb/MMBtu 1.84E-08
Benzo(a)pyrene 2.57E-07 lb/MMBtu 2.17E-08
Indeno(1,2,3-cd)pyrene 4.14E-07 lb/MMBtu 3.50E-08
Dibenz(a,h)anthracene 3.46E-07 lb/MMBtu 2.92E-08
Benzo(g,h,i)perylene 5.56E-07 lb/MMBtu 4.70E-08
FB06 Electrowinning Building Emergency Generator (EWEG)
ICDE1 2-02-001-02 NF 24 hours 5.00 4.43 0.0066 0.27 0 694 0.03 0.006 -- -- g/kW-hr 0.007 0.006 0.000009 0.0004 0 0.92 0.00004 0.000007 --
50 kW Benzene 9.33E-04 lb/MMBtu 5.25E-06
Toluene 4.09E-04 lb/MMBtu 2.30E-06
Xylenes 2.85E-04 lb/MMBtu 1.61E-06
1,3-Butadiene 3.91E-05 lb/MMBtu 2.20E-07
Rosemont Copper ProjectEmission Inventory Information JBR ENVIRONMENTAL CONSULTANTS, INC.
November 2011Page H101
AZRP00283

CO NOX SO2 VOC H2SO4 CO2 CH4 N2O HAP Name HAP EF CO NOX SO2 VOC H2SO4 CO2a CH4
a N2O a HAP bSCC
Emission FactorsUnit ID EF UnitsUnit Description Process Code
Non-Fug. (NF) /
Fug. (F)
Emissions (tpd) - Year 5
Table H.27 Maximum Daily Gaseous Emissions - Year 5
Daily Production Rate - Year 5 Rate Units
Formaldehyde 1.18E-03 lb/MMBtu 6.65E-06
Acetaldehyde 7.67E-04 lb/MMBtu 4.32E-06
Acrolein 9.25E-05 lb/MMBtu 5.21E-07
Naphthalene 8.48E-05 lb/MMBtu 4.78E-07
Acenaphthylene 5.06E-06 lb/MMBtu 2.85E-08
Acenaphthene 1.42E-06 lb/MMBtu 8.00E-09
Fluorene 2.92E-05 lb/MMBtu 1.64E-07
Phenanthrene 2.94E-05 lb/MMBtu 1.66E-07
Anthracene 1.87E-06 lb/MMBtu 1.05E-08
Fluoranthene 7.61E-06 lb/MMBtu 4.29E-08
Pyrene 4.78E-06 lb/MMBtu 2.69E-08
Benzo(a)anthracene 1.68E-06 lb/MMBtu 9.46E-09
Chrysene 3.53E-07 lb/MMBtu 1.99E-09
Benzo(b)fluoranthene 9.91E-08 lb/MMBtu 5.58E-10
Benzo(k)fluoranthene 1.55E-07 lb/MMBtu 8.73E-10
Benzo(a)pyrene 1.88E-07 lb/MMBtu 1.06E-09
Indeno(1,2,3-cd)pyrene 3.75E-07 lb/MMBtu 2.11E-09
Dibenz(a,h)anthracene 5.83E-07 lb/MMBtu 3.28E-09
Benzo(g,h,i)perylene 4.89E-07 lb/MMBtu 2.75E-09
FB07 Primary Crusher Fire Water Pump (PCFWP) ICDE2 2-02-001-02 NF 24 hours 3.50 3.73 0.0066 0.27 0 694 0.03 0.006 -- -- g/kW-hr 0.03 0.03 0.00005 0.002 0 5.48 0.0002 0.00004 --
400 hp Benzene 9.33E-04 lb/MMBtu 3.13E-05
Toluene 4.09E-04 lb/MMBtu 1.37E-05
Xylenes 2.85E-04 lb/MMBtu 9.58E-06
1,3-Butadiene 3.91E-05 lb/MMBtu 1.31E-06
Formaldehyde 1.18E-03 lb/MMBtu 3.96E-05
Acetaldehyde 7.67E-04 lb/MMBtu 2.58E-05
Acrolein 9.25E-05 lb/MMBtu 3.11E-06
Naphthalene 8.48E-05 lb/MMBtu 2.85E-06
Acenaphthylene 5.06E-06 lb/MMBtu 1.70E-07
Acenaphthene 1.42E-06 lb/MMBtu 4.77E-08
Fluorene 2.92E-05 lb/MMBtu 9.81E-07
Phenanthrene 2.94E-05 lb/MMBtu 9.88E-07
Anthracene 1.87E-06 lb/MMBtu 6.28E-08
Fluoranthene 7.61E-06 lb/MMBtu 2.56E-07
Pyrene 4.78E-06 lb/MMBtu 1.61E-07
Benzo(a)anthracene 1.68E-06 lb/MMBtu 5.64E-08
Chrysene 3.53E-07 lb/MMBtu 1.19E-08
Benzo(b)fluoranthene 9.91E-08 lb/MMBtu 3.33E-09
Benzo(k)fluoranthene 1.55E-07 lb/MMBtu 5.21E-09
Benzo(a)pyrene 1.88E-07 lb/MMBtu 6.32E-09
Rosemont Copper ProjectEmission Inventory Information JBR ENVIRONMENTAL CONSULTANTS, INC.
November 2011Page H102
AZRP00284
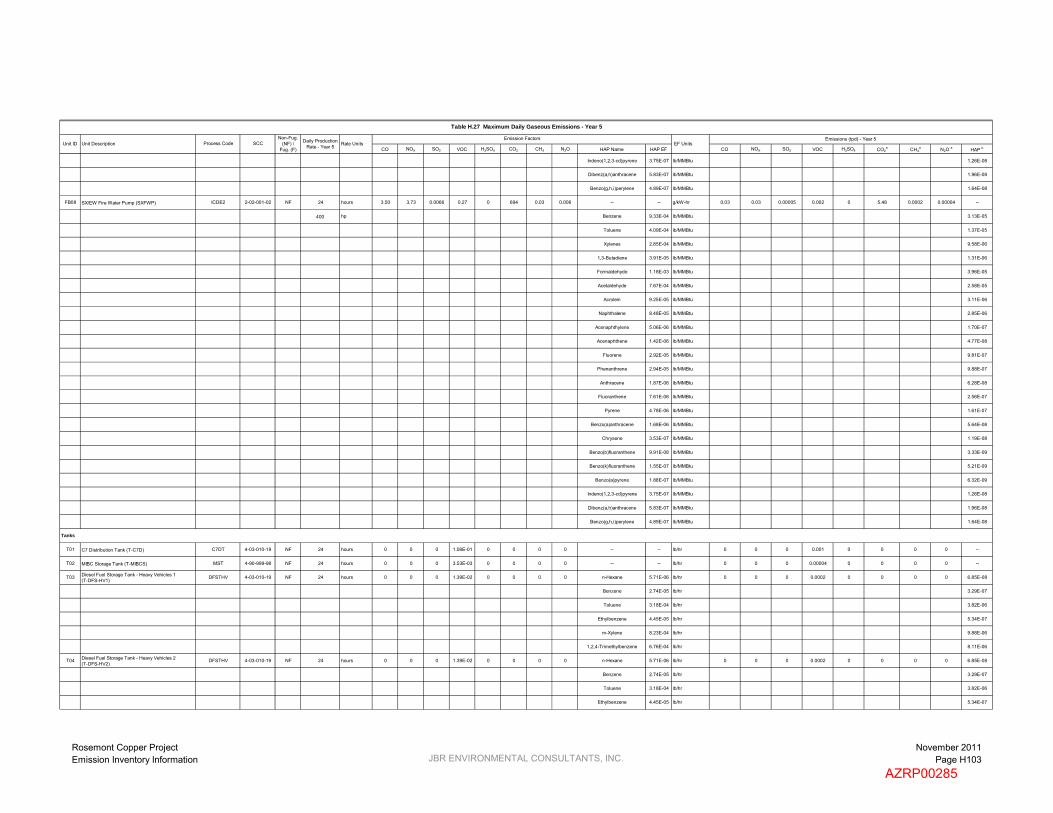
CO NOX SO2 VOC H2SO4 CO2 CH4 N2O HAP Name HAP EF CO NOX SO2 VOC H2SO4 CO2a CH4
a N2O a HAP bSCC
Emission FactorsUnit ID EF UnitsUnit Description Process Code
Non-Fug. (NF) /
Fug. (F)
Emissions (tpd) - Year 5
Table H.27 Maximum Daily Gaseous Emissions - Year 5
Daily Production Rate - Year 5 Rate Units
Indeno(1,2,3-cd)pyrene 3.75E-07 lb/MMBtu 1.26E-08
Dibenz(a,h)anthracene 5.83E-07 lb/MMBtu 1.96E-08
Benzo(g,h,i)perylene 4.89E-07 lb/MMBtu 1.64E-08
FB08 SX/EW Fire Water Pump (SXFWP) ICDE2 2-02-001-02 NF 24 hours 3.50 3.73 0.0066 0.27 0 694 0.03 0.006 -- -- g/kW-hr 0.03 0.03 0.00005 0.002 0 5.48 0.0002 0.00004 --
400 hp Benzene 9.33E-04 lb/MMBtu 3.13E-05
Toluene 4.09E-04 lb/MMBtu 1.37E-05
Xylenes 2.85E-04 lb/MMBtu 9.58E-06
1,3-Butadiene 3.91E-05 lb/MMBtu 1.31E-06
Formaldehyde 1.18E-03 lb/MMBtu 3.96E-05
Acetaldehyde 7.67E-04 lb/MMBtu 2.58E-05
Acrolein 9.25E-05 lb/MMBtu 3.11E-06
Naphthalene 8.48E-05 lb/MMBtu 2.85E-06
Acenaphthylene 5.06E-06 lb/MMBtu 1.70E-07
Acenaphthene 1.42E-06 lb/MMBtu 4.77E-08
Fluorene 2.92E-05 lb/MMBtu 9.81E-07
Phenanthrene 2.94E-05 lb/MMBtu 9.88E-07
Anthracene 1.87E-06 lb/MMBtu 6.28E-08
Fluoranthene 7.61E-06 lb/MMBtu 2.56E-07
Pyrene 4.78E-06 lb/MMBtu 1.61E-07
Benzo(a)anthracene 1.68E-06 lb/MMBtu 5.64E-08
Chrysene 3.53E-07 lb/MMBtu 1.19E-08
Benzo(b)fluoranthene 9.91E-08 lb/MMBtu 3.33E-09
Benzo(k)fluoranthene 1.55E-07 lb/MMBtu 5.21E-09
Benzo(a)pyrene 1.88E-07 lb/MMBtu 6.32E-09
Indeno(1,2,3-cd)pyrene 3.75E-07 lb/MMBtu 1.26E-08
Dibenz(a,h)anthracene 5.83E-07 lb/MMBtu 1.96E-08
Benzo(g,h,i)perylene 4.89E-07 lb/MMBtu 1.64E-08
Tanks
T01 C7 Distribution Tank (T-C7D) C7DT 4-03-010-19 NF 24 hours 0 0 0 1.08E-01 0 0 0 0 -- -- lb/hr 0 0 0 0.001 0 0 0 0 --
T02 MIBC Storage Tank (T-MIBCS) MST 4-90-999-98 NF 24 hours 0 0 0 3.53E-03 0 0 0 0 -- -- lb/hr 0 0 0 0.00004 0 0 0 0 --
T03 Diesel Fuel Storage Tank - Heavy Vehicles 1(T-DFS-HV1)
DFSTHV 4-03-010-19 NF 24 hours 0 0 0 1.39E-02 0 0 0 0 n-Hexane 5.71E-06 lb/hr 0 0 0 0.0002 0 0 0 0 6.85E-08
Benzene 2.74E-05 lb/hr 3.29E-07
Toluene 3.18E-04 lb/hr 3.82E-06
Ethylbenzene 4.45E-05 lb/hr 5.34E-07
m-Xylene 8.23E-04 lb/hr 9.88E-06
1,2,4-Trimethylbenzene 6.76E-04 lb/hr 8.11E-06
T04 Diesel Fuel Storage Tank - Heavy Vehicles 2(T-DFS-HV2)
DFSTHV 4-03-010-19 NF 24 hours 0 0 0 1.39E-02 0 0 0 0 n-Hexane 5.71E-06 lb/hr 0 0 0 0.0002 0 0 0 0 6.85E-08
Benzene 2.74E-05 lb/hr 3.29E-07
Toluene 3.18E-04 lb/hr 3.82E-06
Ethylbenzene 4.45E-05 lb/hr 5.34E-07
Rosemont Copper ProjectEmission Inventory Information JBR ENVIRONMENTAL CONSULTANTS, INC.
November 2011Page H103
AZRP00285

CO NOX SO2 VOC H2SO4 CO2 CH4 N2O HAP Name HAP EF CO NOX SO2 VOC H2SO4 CO2a CH4
a N2O a HAP bSCC
Emission FactorsUnit ID EF UnitsUnit Description Process Code
Non-Fug. (NF) /
Fug. (F)
Emissions (tpd) - Year 5
Table H.27 Maximum Daily Gaseous Emissions - Year 5
Daily Production Rate - Year 5 Rate Units
m-Xylene 8.23E-04 lb/hr 9.88E-06
1,2,4-Trimethylbenzene 6.76E-04 lb/hr 8.11E-06
0.39 0.63 0.0008 0.04 0.00005 88.36 0.004 0.0007 0.001
1.74 0.44 0.05 0.01 0 14.73 0.0006 0.0001 0.009
2.13 1.07 0.05 0.05 0.00005 103.09 0.004 0.0008 0.01
2.78 3.77 0.006 0.27 -- 542.11 -- -- --
a CO2e emissions are calculcated by summing the individual greenhouse gas emissions multiplied by their global warming potential (GWP). GWP of CO2 = 1, GWP of CH4 = 21, GWP of N2O = 310.
b All HAP emissions are included in the facility-wide potential to emit, regardless of if they are fugitive or non-fugitive emissions.
Tailpipe Emissions (see Tables H.32-H.36):
Total Emissions (excluding tailpipe emissions):
Total Non-Fugitive Emissions (excluding tailpipe emissions):
Total Fugitive Emissions (excluding tailpipe emissions):
Rosemont Copper ProjectEmission Inventory Information JBR ENVIRONMENTAL CONSULTANTS, INC.
November 2011Page H104
AZRP00286

CO NOX SO2 VOC H2SO4 CO2 CH4 N2O HAP Name HAP EF CO NOX SO2 VOC H2SO4 CO2a CH4
a N2O a HAP b
Mining
MN02 Blasting Blast 3-05-020-09 F 52 tons ANFO 67.00 17.00 2.00 0 0 566 0.02 0.005 -- -- lb/tons ANFO 3,484.00 884.00 104.00 0 0 29,455.36 1.19 0.24 --
Solvent Extraction and Electrowinning
SXE01 Solvent Extraction SX 4-90-001-99 F 1 hours 0 0 0 9.43E-05 0 0 0 0 Benzene 3.37E-07 lb/hr-ft2 0 0 0 0.86 0 0 0 0 3.08E-03
4 Primary Mix Tanks (7.75' D x 9.75' H each) 4 @ 47.2 = 188.7 ft2 9,132.9 ft2 Total Surface Area of Solvent Extraction Toluene 4.82E-06 lb/hr-ft2 4.40E-02
4 Secondary Mix Tanks (9.5' D x 9.75' H each) 4 @ 70.9 = 283.5 ft2 Ethylbenzene 2.05E-05 lb/hr-ft2 1.87E-01
3 Tertiary Mix Tanks (9.5' D x 9.75' H each) 3 @ 70.9 = 212.6 ft2 Xylenes 2.80E-05 lb/hr-ft2 2.56E-01
4 Extraction Settlers (64' L x 33' W x 3.33' H each) 4 @ 2,112 = 8,448 ft2 Others (including Hexane) 2.94E-05 lb/hr-ft2 2.69E-01
SXE02 Electrowinning Commercial Cells (EWCC) EW none NF 1 hours 0 0 0 0 1.57E-04 0 0 0 Cobalt Compounds 2.36E-08 lb/hr-ft2 0 0 0 0 0.004 0 0 0 6.22E-07
Controlled by Cell Ventilation Scrubbers(PC-EWCVS1/EWCVS6)
2,640 ft2
99 Control Efficiency (%)
Fuel Burning Equipment
FB01 Diesel Electrowinning Hot Water Generator (HWG) DFB 1-02-005-03 NF 1 hours 5.00 20.00 0.21 0.20 0 23,217 0.94 0.19 POM 3.30E-03 lb/1000 gal 0.22 0.88 0.009 0.009 0 1,016.78 0.04 0.008 1.45E-04
6.0 MMBtu/hr Formaldehyde 6.10E-02 lb/1000 gal 2.67E-03
Arsenic 4.00 lb/1012 Btu 2.40E-05
Beryllium 3.00 lb/1012 Btu 1.80E-05
Cadmium 3.00 lb/1012 Btu 1.80E-05
Chromium 3.00 lb/1012 Btu 1.80E-05
Lead 9.00 lb/1012 Btu 5.40E-05
Mercury 3.00 lb/1012 Btu 1.80E-05
Manganese 6.00 lb/1012 Btu 3.60E-05
Nickel 3.00 lb/1012 Btu 1.80E-05
Selenium 15.00 lb/1012 Btu 9.00E-05
FB02 Thickener Area Emergency Generator (TEG) ICDE3 2-02-001-02 NF 1 hours 3.50 6.00 0.0066 0.40 0 694 0.03 0.006 -- -- g/kW-hr 7.72 13.23 0.01 0.88 0 1,530.61 0.06 0.01 --
1,000 kW Benzene 7.76E-04 lb/MMBtu 7.28E-03
Toluene 2.81E-04 lb/MMBtu 2.64E-03
Xylenes 1.93E-04 lb/MMBtu 1.81E-03
Formaldehyde 7.89E-05 lb/MMBtu 7.41E-04
Acetaldehyde 2.52E-05 lb/MMBtu 2.37E-04
Acrolein 7.88E-06 lb/MMBtu 7.40E-05
Naphthalene 1.30E-04 lb/MMBtu 1.22E-03
Acenaphthylene 9.23E-06 lb/MMBtu 8.66E-05
Acenaphthene 4.68E-06 lb/MMBtu 4.39E-05
Fluorene 1.28E-05 lb/MMBtu 1.20E-04
Phenanthrene 4.08E-05 lb/MMBtu 3.83E-04
Anthracene 1.23E-06 lb/MMBtu 1.15E-05
Fluoranthene 4.03E-06 lb/MMBtu 3.78E-05
Pyrene 3.71E-06 lb/MMBtu 3.48E-05
Benz(a)anthracene 6.22E-07 lb/MMBtu 5.84E-06
Chrysene 1.53E-06 lb/MMBtu 1.44E-05
SCCEmission Factors
Unit ID EF UnitsUnit Description Process CodeNon-Fug.
(NF) / Fug. (F)
Emissions (lb/hr) - Year 5
Table H.28 Hourly Gaseous Emissions - Year 5
Hourly Production Rate -
Year 5Rate Units
Rosemont Copper ProjectEmission Inventory Information JBR ENVIRONMENTAL CONSULTANTS, INC.
November 2011Page H105
AZRP00287

CO NOX SO2 VOC H2SO4 CO2 CH4 N2O HAP Name HAP EF CO NOX SO2 VOC H2SO4 CO2a CH4
a N2O a HAP bSCC
Emission FactorsUnit ID EF UnitsUnit Description Process Code
Non-Fug. (NF) /
Fug. (F)
Emissions (lb/hr) - Year 5
Table H.28 Hourly Gaseous Emissions - Year 5
Hourly Production Rate -
Year 5Rate Units
Benzo(b)fluoranthene 1.11E-06 lb/MMBtu 1.04E-05
Benzo(k)fluoranthene 2.18E-07 lb/MMBtu 2.05E-06
Benzo(a)pyrene 2.57E-07 lb/MMBtu 2.41E-06
Indeno(1,2,3-cd)pyrene 4.14E-07 lb/MMBtu 3.89E-06
Dibenz(a,h)anthracene 3.46E-07 lb/MMBtu 3.25E-06
Benzo(g,h,i)perylene 5.56E-07 lb/MMBtu 5.22E-06
FB03 PLS Pond Area Emergency Generator (PEG) ICDE3 2-02-001-02 NF 1 hours 3.50 6.00 0.0066 0.40 0 694 0.03 0.006 -- -- g/kW-hr 7.72 13.23 0.01 0.88 0 1,530.61 0.06 0.01 --
1,000 kW Benzene 7.76E-04 lb/MMBtu 7.28E-03
Toluene 2.81E-04 lb/MMBtu 2.64E-03
Xylenes 1.93E-04 lb/MMBtu 1.81E-03
Formaldehyde 7.89E-05 lb/MMBtu 7.41E-04
Acetaldehyde 2.52E-05 lb/MMBtu 2.37E-04
Acrolein 7.88E-06 lb/MMBtu 7.40E-05
Naphthalene 1.30E-04 lb/MMBtu 1.22E-03
Acenaphthylene 9.23E-06 lb/MMBtu 8.66E-05
Acenaphthene 4.68E-06 lb/MMBtu 4.39E-05
Fluorene 1.28E-05 lb/MMBtu 1.20E-04
Phenanthrene 4.08E-05 lb/MMBtu 3.83E-04
Anthracene 1.23E-06 lb/MMBtu 1.15E-05
Fluoranthene 4.03E-06 lb/MMBtu 3.78E-05
Pyrene 3.71E-06 lb/MMBtu 3.48E-05
Benz(a)anthracene 6.22E-07 lb/MMBtu 5.84E-06
Chrysene 1.53E-06 lb/MMBtu 1.44E-05
Benzo(b)fluoranthene 1.11E-06 lb/MMBtu 1.04E-05
Benzo(k)fluoranthene 2.18E-07 lb/MMBtu 2.05E-06
Benzo(a)pyrene 2.57E-07 lb/MMBtu 2.41E-06
Indeno(1,2,3-cd)pyrene 4.14E-07 lb/MMBtu 3.89E-06
Dibenz(a,h)anthracene 3.46E-07 lb/MMBtu 3.25E-06
Benzo(g,h,i)perylene 5.56E-07 lb/MMBtu 5.22E-06
FB04 Main Substation Emergency Generator (MEG) ICDE3 2-02-001-02 NF 1 hours 3.50 6.00 0.0066 0.40 0 694 0.03 0.006 -- -- g/kW-hr 5.79 9.92 0.01 0.66 0 1,147.96 0.05 0.009 --
750 kW Benzene 7.76E-04 lb/MMBtu 5.46E-03
Toluene 2.81E-04 lb/MMBtu 1.98E-03
Xylenes 1.93E-04 lb/MMBtu 1.36E-03
Formaldehyde 7.89E-05 lb/MMBtu 5.55E-04
Acetaldehyde 2.52E-05 lb/MMBtu 1.77E-04
Acrolein 7.88E-06 lb/MMBtu 5.55E-05
Naphthalene 1.30E-04 lb/MMBtu 9.15E-04
Acenaphthylene 9.23E-06 lb/MMBtu 6.50E-05
Acenaphthene 4.68E-06 lb/MMBtu 3.29E-05
Fluorene 1.28E-05 lb/MMBtu 9.01E-05
Rosemont Copper ProjectEmission Inventory Information JBR ENVIRONMENTAL CONSULTANTS, INC.
November 2011Page H106
AZRP00288

CO NOX SO2 VOC H2SO4 CO2 CH4 N2O HAP Name HAP EF CO NOX SO2 VOC H2SO4 CO2a CH4
a N2O a HAP bSCC
Emission FactorsUnit ID EF UnitsUnit Description Process Code
Non-Fug. (NF) /
Fug. (F)
Emissions (lb/hr) - Year 5
Table H.28 Hourly Gaseous Emissions - Year 5
Hourly Production Rate -
Year 5Rate Units
Phenanthrene 4.08E-05 lb/MMBtu 2.87E-04
Anthracene 1.23E-06 lb/MMBtu 8.66E-06
Fluoranthene 4.03E-06 lb/MMBtu 2.84E-05
Pyrene 3.71E-06 lb/MMBtu 2.61E-05
Benz(a)anthracene 6.22E-07 lb/MMBtu 4.38E-06
Chrysene 1.53E-06 lb/MMBtu 1.08E-05
Benzo(b)fluoranthene 1.11E-06 lb/MMBtu 7.81E-06
Benzo(k)fluoranthene 2.18E-07 lb/MMBtu 1.53E-06
Benzo(a)pyrene 2.57E-07 lb/MMBtu 1.81E-06
Indeno(1,2,3-cd)pyrene 4.14E-07 lb/MMBtu 2.91E-06
Dibenz(a,h)anthracene 3.46E-07 lb/MMBtu 2.44E-06
Benzo(g,h,i)perylene 5.56E-07 lb/MMBtu 3.91E-06
FB05 Administration Building Emergency Generator (AEG) ICDE3 2-02-001-02 NF 1 hours 3.50 6.00 0.0066 0.40 0 694 0.03 0.006 -- -- g/kW-hr 5.79 9.92 0.01 0.66 0 1,147.96 0.05 0.009 --
750 kW Benzene 7.76E-04 lb/MMBtu 5.46E-03
Toluene 2.81E-04 lb/MMBtu 1.98E-03
Xylenes 1.93E-04 lb/MMBtu 1.36E-03
Formaldehyde 7.89E-05 lb/MMBtu 5.55E-04
Acetaldehyde 2.52E-05 lb/MMBtu 1.77E-04
Acrolein 7.88E-06 lb/MMBtu 5.55E-05
Naphthalene 1.30E-04 lb/MMBtu 9.15E-04
Acenaphthylene 9.23E-06 lb/MMBtu 6.50E-05
Acenaphthene 4.68E-06 lb/MMBtu 3.29E-05
Fluorene 1.28E-05 lb/MMBtu 9.01E-05
Phenanthrene 4.08E-05 lb/MMBtu 2.87E-04
Anthracene 1.23E-06 lb/MMBtu 8.66E-06
Fluoranthene 4.03E-06 lb/MMBtu 2.84E-05
Pyrene 3.71E-06 lb/MMBtu 2.61E-05
Benz(a)anthracene 6.22E-07 lb/MMBtu 4.38E-06
Chrysene 1.53E-06 lb/MMBtu 1.08E-05
Benzo(b)fluoranthene 1.11E-06 lb/MMBtu 7.81E-06
Benzo(k)fluoranthene 2.18E-07 lb/MMBtu 1.53E-06
Benzo(a)pyrene 2.57E-07 lb/MMBtu 1.81E-06
Indeno(1,2,3-cd)pyrene 4.14E-07 lb/MMBtu 2.91E-06
Dibenz(a,h)anthracene 3.46E-07 lb/MMBtu 2.44E-06
Benzo(g,h,i)perylene 5.56E-07 lb/MMBtu 3.91E-06
FB06 Electrowinning Building Emergency Generator (EWEG)
ICDE1 2-02-001-02 NF 1 hours 5.00 4.43 0.0066 0.27 0 694 0.03 0.006 -- -- g/kW-hr 0.55 0.49 0.0007 0.03 0 76.53 0.003 0.0006 --
50 kW Benzene 9.33E-04 lb/MMBtu 4.38E-04
Toluene 4.09E-04 lb/MMBtu 1.92E-04
Xylenes 2.85E-04 lb/MMBtu 1.34E-04
1,3-Butadiene 3.91E-05 lb/MMBtu 1.84E-05
Rosemont Copper ProjectEmission Inventory Information JBR ENVIRONMENTAL CONSULTANTS, INC.
November 2011Page H107
AZRP00289

CO NOX SO2 VOC H2SO4 CO2 CH4 N2O HAP Name HAP EF CO NOX SO2 VOC H2SO4 CO2a CH4
a N2O a HAP bSCC
Emission FactorsUnit ID EF UnitsUnit Description Process Code
Non-Fug. (NF) /
Fug. (F)
Emissions (lb/hr) - Year 5
Table H.28 Hourly Gaseous Emissions - Year 5
Hourly Production Rate -
Year 5Rate Units
Formaldehyde 1.18E-03 lb/MMBtu 5.54E-04
Acetaldehyde 7.67E-04 lb/MMBtu 3.60E-04
Acrolein 9.25E-05 lb/MMBtu 4.34E-05
Naphthalene 8.48E-05 lb/MMBtu 3.98E-05
Acenaphthylene 5.06E-06 lb/MMBtu 2.37E-06
Acenaphthene 1.42E-06 lb/MMBtu 6.66E-07
Fluorene 2.92E-05 lb/MMBtu 1.37E-05
Phenanthrene 2.94E-05 lb/MMBtu 1.38E-05
Anthracene 1.87E-06 lb/MMBtu 8.78E-07
Fluoranthene 7.61E-06 lb/MMBtu 3.57E-06
Pyrene 4.78E-06 lb/MMBtu 2.24E-06
Benzo(a)anthracene 1.68E-06 lb/MMBtu 7.89E-07
Chrysene 3.53E-07 lb/MMBtu 1.66E-07
Benzo(b)fluoranthene 9.91E-08 lb/MMBtu 4.65E-08
Benzo(k)fluoranthene 1.55E-07 lb/MMBtu 7.28E-08
Benzo(a)pyrene 1.88E-07 lb/MMBtu 8.82E-08
Indeno(1,2,3-cd)pyrene 3.75E-07 lb/MMBtu 1.76E-07
Dibenz(a,h)anthracene 5.83E-07 lb/MMBtu 2.74E-07
Benzo(g,h,i)perylene 4.89E-07 lb/MMBtu 2.30E-07
FB07 Primary Crusher Fire Water Pump (PCFWP) ICDE2 2-02-001-02 NF 1 hours 3.50 3.73 0.0066 0.27 0 694 0.03 0.006 -- -- g/kW-hr 2.30 2.46 0.004 0.18 0 456.55 0.02 0.004 --
400 hp Benzene 9.33E-04 lb/MMBtu 2.61E-03
Toluene 4.09E-04 lb/MMBtu 1.15E-03
Xylenes 2.85E-04 lb/MMBtu 7.98E-04
1,3-Butadiene 3.91E-05 lb/MMBtu 1.09E-04
Formaldehyde 1.18E-03 lb/MMBtu 3.30E-03
Acetaldehyde 7.67E-04 lb/MMBtu 2.15E-03
Acrolein 9.25E-05 lb/MMBtu 2.59E-04
Naphthalene 8.48E-05 lb/MMBtu 2.37E-04
Acenaphthylene 5.06E-06 lb/MMBtu 1.42E-05
Acenaphthene 1.42E-06 lb/MMBtu 3.98E-06
Fluorene 2.92E-05 lb/MMBtu 8.18E-05
Phenanthrene 2.94E-05 lb/MMBtu 8.23E-05
Anthracene 1.87E-06 lb/MMBtu 5.24E-06
Fluoranthene 7.61E-06 lb/MMBtu 2.13E-05
Pyrene 4.78E-06 lb/MMBtu 1.34E-05
Benzo(a)anthracene 1.68E-06 lb/MMBtu 4.70E-06
Chrysene 3.53E-07 lb/MMBtu 9.88E-07
Benzo(b)fluoranthene 9.91E-08 lb/MMBtu 2.77E-07
Benzo(k)fluoranthene 1.55E-07 lb/MMBtu 4.34E-07
Benzo(a)pyrene 1.88E-07 lb/MMBtu 5.26E-07
Rosemont Copper ProjectEmission Inventory Information JBR ENVIRONMENTAL CONSULTANTS, INC.
November 2011Page H108
AZRP00290
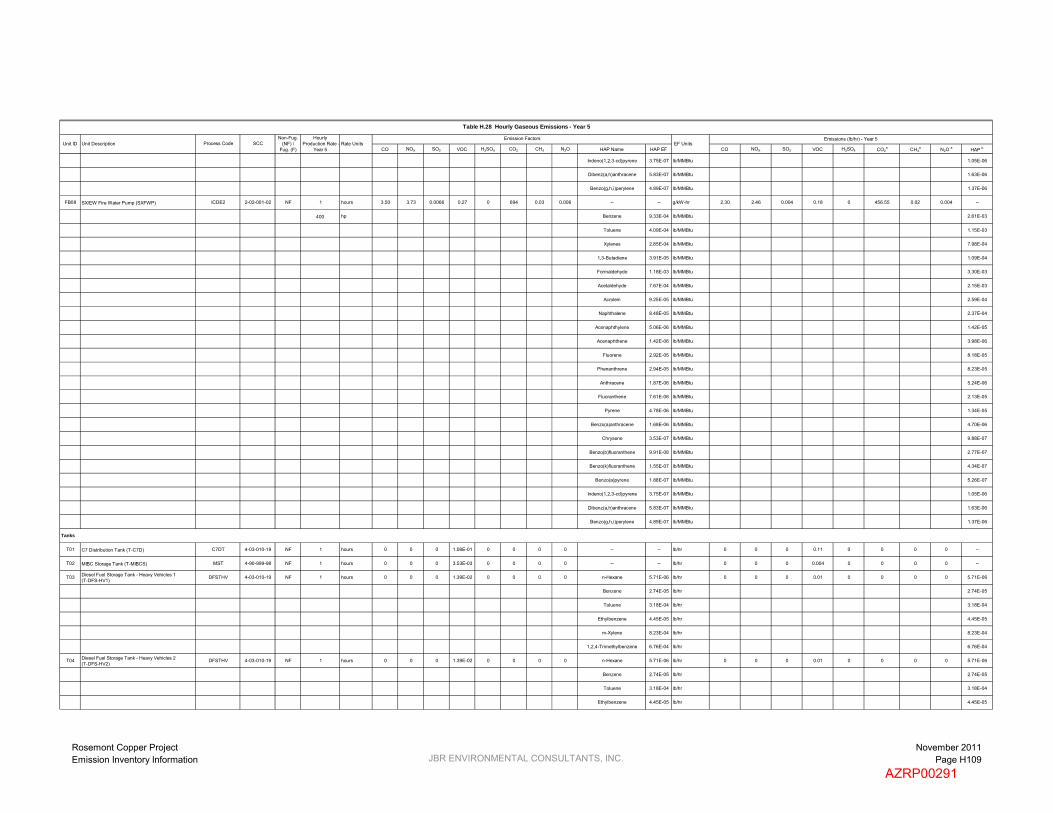
CO NOX SO2 VOC H2SO4 CO2 CH4 N2O HAP Name HAP EF CO NOX SO2 VOC H2SO4 CO2a CH4
a N2O a HAP bSCC
Emission FactorsUnit ID EF UnitsUnit Description Process Code
Non-Fug. (NF) /
Fug. (F)
Emissions (lb/hr) - Year 5
Table H.28 Hourly Gaseous Emissions - Year 5
Hourly Production Rate -
Year 5Rate Units
Indeno(1,2,3-cd)pyrene 3.75E-07 lb/MMBtu 1.05E-06
Dibenz(a,h)anthracene 5.83E-07 lb/MMBtu 1.63E-06
Benzo(g,h,i)perylene 4.89E-07 lb/MMBtu 1.37E-06
FB08 SX/EW Fire Water Pump (SXFWP) ICDE2 2-02-001-02 NF 1 hours 3.50 3.73 0.0066 0.27 0 694 0.03 0.006 -- -- g/kW-hr 2.30 2.46 0.004 0.18 0 456.55 0.02 0.004 --
400 hp Benzene 9.33E-04 lb/MMBtu 2.61E-03
Toluene 4.09E-04 lb/MMBtu 1.15E-03
Xylenes 2.85E-04 lb/MMBtu 7.98E-04
1,3-Butadiene 3.91E-05 lb/MMBtu 1.09E-04
Formaldehyde 1.18E-03 lb/MMBtu 3.30E-03
Acetaldehyde 7.67E-04 lb/MMBtu 2.15E-03
Acrolein 9.25E-05 lb/MMBtu 2.59E-04
Naphthalene 8.48E-05 lb/MMBtu 2.37E-04
Acenaphthylene 5.06E-06 lb/MMBtu 1.42E-05
Acenaphthene 1.42E-06 lb/MMBtu 3.98E-06
Fluorene 2.92E-05 lb/MMBtu 8.18E-05
Phenanthrene 2.94E-05 lb/MMBtu 8.23E-05
Anthracene 1.87E-06 lb/MMBtu 5.24E-06
Fluoranthene 7.61E-06 lb/MMBtu 2.13E-05
Pyrene 4.78E-06 lb/MMBtu 1.34E-05
Benzo(a)anthracene 1.68E-06 lb/MMBtu 4.70E-06
Chrysene 3.53E-07 lb/MMBtu 9.88E-07
Benzo(b)fluoranthene 9.91E-08 lb/MMBtu 2.77E-07
Benzo(k)fluoranthene 1.55E-07 lb/MMBtu 4.34E-07
Benzo(a)pyrene 1.88E-07 lb/MMBtu 5.26E-07
Indeno(1,2,3-cd)pyrene 3.75E-07 lb/MMBtu 1.05E-06
Dibenz(a,h)anthracene 5.83E-07 lb/MMBtu 1.63E-06
Benzo(g,h,i)perylene 4.89E-07 lb/MMBtu 1.37E-06
Tanks
T01 C7 Distribution Tank (T-C7D) C7DT 4-03-010-19 NF 1 hours 0 0 0 1.08E-01 0 0 0 0 -- -- lb/hr 0 0 0 0.11 0 0 0 0 --
T02 MIBC Storage Tank (T-MIBCS) MST 4-90-999-98 NF 1 hours 0 0 0 3.53E-03 0 0 0 0 -- -- lb/hr 0 0 0 0.004 0 0 0 0 --
T03 Diesel Fuel Storage Tank - Heavy Vehicles 1(T-DFS-HV1)
DFSTHV 4-03-010-19 NF 1 hours 0 0 0 1.39E-02 0 0 0 0 n-Hexane 5.71E-06 lb/hr 0 0 0 0.01 0 0 0 0 5.71E-06
Benzene 2.74E-05 lb/hr 2.74E-05
Toluene 3.18E-04 lb/hr 3.18E-04
Ethylbenzene 4.45E-05 lb/hr 4.45E-05
m-Xylene 8.23E-04 lb/hr 8.23E-04
1,2,4-Trimethylbenzene 6.76E-04 lb/hr 6.76E-04
T04 Diesel Fuel Storage Tank - Heavy Vehicles 2(T-DFS-HV2)
DFSTHV 4-03-010-19 NF 1 hours 0 0 0 1.39E-02 0 0 0 0 n-Hexane 5.71E-06 lb/hr 0 0 0 0.01 0 0 0 0 5.71E-06
Benzene 2.74E-05 lb/hr 2.74E-05
Toluene 3.18E-04 lb/hr 3.18E-04
Ethylbenzene 4.45E-05 lb/hr 4.45E-05
Rosemont Copper ProjectEmission Inventory Information JBR ENVIRONMENTAL CONSULTANTS, INC.
November 2011Page H109
AZRP00291

CO NOX SO2 VOC H2SO4 CO2 CH4 N2O HAP Name HAP EF CO NOX SO2 VOC H2SO4 CO2a CH4
a N2O a HAP bSCC
Emission FactorsUnit ID EF UnitsUnit Description Process Code
Non-Fug. (NF) /
Fug. (F)
Emissions (lb/hr) - Year 5
Table H.28 Hourly Gaseous Emissions - Year 5
Hourly Production Rate -
Year 5Rate Units
m-Xylene 8.23E-04 lb/hr 8.23E-04
1,2,4-Trimethylbenzene 6.76E-04 lb/hr 6.76E-04
32.38 52.57 0.07 3.61 0.004 7,363.56 0.30 0.06 0.08
3,484.00 884.00 104.00 0.86 0 29,455.36 1.19 0.24 0.76
3,516.38 936.57 104.07 4.48 0.004 36,818.92 1.49 0.30 0.84
231.86 315.25 1.00 22.53 -- 47,012.42 -- -- --
a CO2e emissions are calculcated by summing the individual greenhouse gas emissions multiplied by their global warming potential (GWP). GWP of CO2 = 1, GWP of CH4 = 21, GWP of N2O = 310.
b All HAP emissions are included in the facility-wide potential to emit, regardless of if they are fugitive or non-fugitive emissions.
Tailpipe Emissions (see Tables H.32-H.36):
Total Emissions (excluding tailpipe emissions):
Total Non-Fugitive Emissions (excluding tailpipe emissions):
Total Fugitive Emissions (excluding tailpipe emissions):
Rosemont Copper ProjectEmission Inventory Information JBR ENVIRONMENTAL CONSULTANTS, INC.
November 2011Page H110
AZRP00292

Hourly Daily AnnualTier 2/Tier 4 (Final) Emission Standards or Mobile 6 Output
Units lb/hr tpd tpy
Haulage Trucks, 250 tons 31 2,650 1.00 24 6,600 hours 0.32 0.15 g/hp-hr 8.69 0.10 28.69
Crawler Dozers, D11T Class 3 850 0.46 11 4,000 hours 0.575 0.03 g/hp-hr 0.04 0.0005 0.19
Crawler Dozers, D10T Class 3 580 0.68 16 6,000 hours 0.575 0.01 g/hp-hr 0.02 0.0002 0.07
Crawler Dozer, D8T Class 1 310 0.75 18 6,570 hours 0.575 0.01 g/hp-hr 0.003 0.00004 0.01
Rubber Tired Dozers, 834H Class 3 498 0.71 17 6,200 hours 0.575 0.01 g/hp-hr 0.01 0.0002 0.06
Motor Graders, 24M Class 1 533 0.68 16 6,000 hours 0.575 0.01 g/hp-hr 0.005 0.00006 0.02
Motor Graders, 16M Class 3 297 0.46 11 4,000 hours 0.575 0.01 g/hp-hr 0.005 0.00006 0.02
Water Trucks, 30,000 gallons 4 1,348 0.45 11 3,250 hours 0.35 0.03 g/hp-hr 0.06 0.0007 0.20
Diesel Blasthole Drill, 12.25 inches 2 1,500 0.75 18 6,570 hours 0.43 0.03 g/hp-hr 0.06 0.0008 0.28
Hydraulic DML 45 Drill 1 425 0.75 18 6,570 hours 0.43 0.01 g/hp-hr 0.003 0.00004 0.01
Front End Loaders 2 2,000 0.90 22 7,884 hours 0.59 0.15 g/hp-hr 0.70 0.008 3.08
Stemming Truck 2 450 0.75 18 6,570 hours 0.43 0.01 g/hp-hr 0.006 0.00008 0.03
ANFO/Slurry Truck, 20 tons 2 450 0.75 18 6,570 hours 0.43 0.01 g/hp-hr 0.006 0.00008 0.03
Powder Truck, 2 tons 2 350 0.75 18 6,570 hours 0.43 0.01 g/hp-hr 0.005 0.00006 0.02
Front End Loaders, 8 yd3 2 262 0.75 18 6,570 hours 0.575 0.01 g/hp-hr 0.005 0.00006 0.02
Hydraulic Excavator, 385 Cat CL 2 513 0.90 22 7,884 hours 0.35 0.01 g/hp-hr 0.007 0.00009 0.03
Backhoe/Loader, 2 yd3 1 124 0.75 18 6,570 hours 0.35 0.01 g/hp-hr 0.0007 0.000009 0.003
Load Factor
PM/TSP Emission Factors PM/TSP Emissions - Year 5
Units
Table H.29 PM/TSP Emissions from Fuel Burning Mobile Engines - Year 5
Fuel Burning Mobile Engine Description a
Fleet Size
HP Rating
Process Rates b - Year 5
Rosemont Copper ProjectEmission Inventory Information JBR ENVIRONMENTAL CONSULTANTS, INC.
November 2011Page H111
AZRP00293

Hourly Daily AnnualTier 2/Tier 4 (Final) Emission Standards or Mobile 6 Output
Units lb/hr tpd tpyLoad
Factor
PM/TSP Emission Factors PM/TSP Emissions - Year 5
Units
Table H.29 PM/TSP Emissions from Fuel Burning Mobile Engines - Year 5
Fuel Burning Mobile Engine Description a
Fleet Size
HP Rating
Process Rates b - Year 5
All-Terrain Crane, 75 tons 1 230 0.75 18 6,570 hours 0.43 0.01 g/hp-hr 0.002 0.00002 0.007
Transporter with Tractor, 200 tons 1 1,350 0.75 18 6,570 hours 0.59 0.03 g/hp-hr 0.04 0.0005 0.17
Fuel/Lube Trucks, 6,000 gallons 2 703 0.75 18 6,570 hours 0.35 0.01 g/hp-hr 0.008 0.0001 0.04
Mechanic Field Service Trucks 5 370 1.71 41 15,000 VMT 0.43 0.2117 g/mile 0.004 0.00005 0.02
Tire Handler 1 90 0.11 3 1,000 VMT 0.43 0.2117 g/mile 0.00005 0.0000006 0.0002
Shop Forklift, 12,000 lbs 1 90 0.75 18 6,570 hours 0.59 0.01 g/hp-hr 0.0009 0.00001 0.004
Integrated Tool Carrier, 140 hp 1 138 0.75 18 6,570 hours 0.59 0.01 g/hp-hr 0.001 0.00002 0.006
Light Plant, 6 kW 15 35 0.40 10 3,504 hours 0.43 0.02 g/hp-hr 0.004 0.00005 0.02
Primary Crushing Mobile Crane - 400 tons 1 320 0.75 18 6,570 hours 0.43 0.01 g/hp-hr 0.002 0.00003 0.01
Copper Concentrate Area Front End Loader - Cat 930 1 160 0.75 18 6,570 hours 0.59 0.01 g/hp-hr 0.002 0.00002 0.007
Molybdenum Packaging Forklift, 7,000 lbs 1 93 0.75 18 6,570 hours 0.59 0.01 g/hp-hr 0.0009 0.00001 0.004
Copper Cathode Forklift 1 93 0.75 18 6,570 hours 0.59 0.01 g/hp-hr 0.0009 0.00001 0.004
Boom Trucks 10 tons, 45 foot boom 1 200 0.75 18 6,570 hours 0.21 0.01 g/hp-hr 0.0007 0.000008 0.003
Boom Trucks 15 tons, 60 foot boom 1 210 0.75 18 6,570 hours 0.21 0.01 g/hp-hr 0.0007 0.000009 0.003
Front End Loader, 6 yd3 1 349 0.75 18 6,570 hours 0.35 0.01 g/hp-hr 0.002 0.00002 0.009
Front End Loader, 5 yd3 1 149 0.75 18 6,570 hours 0.25 0.01 g/hp-hr 0.0006 0.000007 0.003
Bob Cats, 2,400 lbs 2 82 0.75 18 6,570 hours 0.59 0.01 g/hp-hr 0.002 0.00002 0.007
Rosemont Copper ProjectEmission Inventory Information JBR ENVIRONMENTAL CONSULTANTS, INC.
November 2011Page H112
AZRP00294

Hourly Daily AnnualTier 2/Tier 4 (Final) Emission Standards or Mobile 6 Output
Units lb/hr tpd tpyLoad
Factor
PM/TSP Emission Factors PM/TSP Emissions - Year 5
Units
Table H.29 PM/TSP Emissions from Fuel Burning Mobile Engines - Year 5
Fuel Burning Mobile Engine Description a
Fleet Size
HP Rating
Process Rates b - Year 5
Fork Lift, 2,000 lbs 1 50 0.75 18 6,570 hours 0.59 0.02 g/hp-hr 0.001 0.00001 0.004
Fork Lift, 5,000 lbs 1 63 0.75 18 6,570 hours 0.59 0.02 g/hp-hr 0.001 0.00001 0.005
Fork Lift, 3,000 lbs 2 50 0.75 18 6,570 hours 0.59 0.02 g/hp-hr 0.002 0.00002 0.009
Flat Bed Trucks, 10 tons 2 350 0.75 18 6,570 hours 0.43 0.01 g/hp-hr 0.005 0.00006 0.02
Dump Truck, 10 tons 1 250 0.34 8 3,000 VMT 0.43 0.2117 g/mile 0.0002 0.000002 0.0007
Mobile Hydraulic Crane, 60 tons 1 267 0.75 18 6,570 hours 0.43 0.01 g/hp-hr 0.002 0.00002 0.008
Truck Shop Bridge Crane, 60 tons 1 75 0.75 18 6,570 hours 0.43 0.01 g/hp-hr 0.0005 0.000006 0.002
Truck Shop Bridge Crane, 25 tons 1 24 0.75 18 6,570 hours 0.43 0.30 g/hp-hr 0.005 0.00006 0.02
CS683 Soil Compactor / Roller 2 173 0.75 18 6,570 hours 0.4 0.01 g/hp-hr 0.002 0.00003 0.01
246C Skid Steer Loader 2 73 0.75 18 6,570 hours 0.3 0.02 g/hp-hr 0.001 0.00002 0.006
RH200/340 O & K Shovel / Hitachi EX5500 1 2,520 0.75 18 6,570 hours 0.59 0.03 g/hp-hr 0.07 0.0009 0.32
Off-Road Tire Handling Truck 1 450 0.86 21 7,500 VMT 0.43 0.2117 g/mile 0.0004 0.000005 0.002
Contractor Haul Trucks, 25 tons 2 511 2.74 66 24,000 VMT 0.43 0.2117 g/mile 0.003 0.00003 0.01
Motivator for Mine Shovels 1 3,308 0.91 22 8,000 hours 0.43 0.02 g/hp-hr 0.06 0.0007 0.25
Storm Water Pond Pump 1 200 1.00 24 500 hours 1 0.01 g/hp-hr 0.004 0.00005 0.001
Mine Pit Dewatering Pump 4 100 1.00 24 500 hours 1 0.01 g/hp-hr 0.009 0.0001 0.002
Copper Concentrate Shipment Vehicles -- 450 29.60 1,021 169,872 VMT 0.43 0.2117 g/mile 0.01 0.0002 0.04
Rosemont Copper ProjectEmission Inventory Information JBR ENVIRONMENTAL CONSULTANTS, INC.
November 2011Page H113
AZRP00295
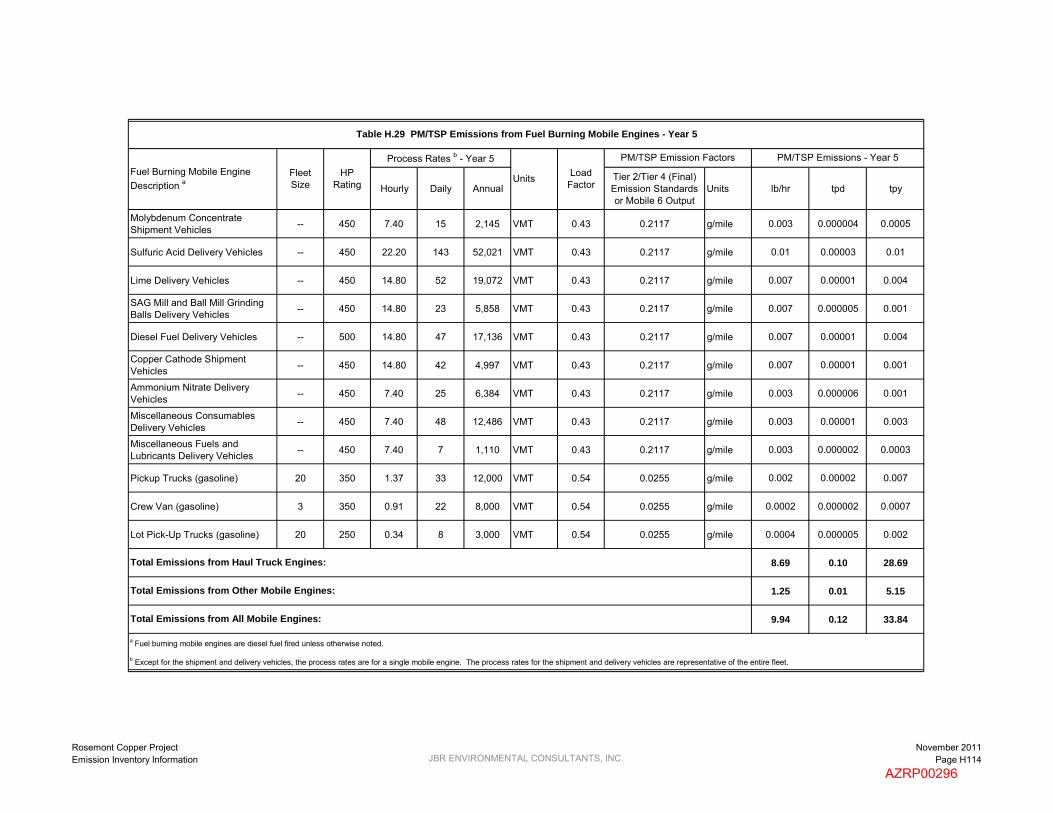
Hourly Daily AnnualTier 2/Tier 4 (Final) Emission Standards or Mobile 6 Output
Units lb/hr tpd tpyLoad
Factor
PM/TSP Emission Factors PM/TSP Emissions - Year 5
Units
Table H.29 PM/TSP Emissions from Fuel Burning Mobile Engines - Year 5
Fuel Burning Mobile Engine Description a
Fleet Size
HP Rating
Process Rates b - Year 5
Molybdenum Concentrate Shipment Vehicles -- 450 7.40 15 2,145 VMT 0.43 0.2117 g/mile 0.003 0.000004 0.0005
Sulfuric Acid Delivery Vehicles -- 450 22.20 143 52,021 VMT 0.43 0.2117 g/mile 0.01 0.00003 0.01
Lime Delivery Vehicles -- 450 14.80 52 19,072 VMT 0.43 0.2117 g/mile 0.007 0.00001 0.004
SAG Mill and Ball Mill Grinding Balls Delivery Vehicles -- 450 14.80 23 5,858 VMT 0.43 0.2117 g/mile 0.007 0.000005 0.001
Diesel Fuel Delivery Vehicles -- 500 14.80 47 17,136 VMT 0.43 0.2117 g/mile 0.007 0.00001 0.004
Copper Cathode Shipment Vehicles -- 450 14.80 42 4,997 VMT 0.43 0.2117 g/mile 0.007 0.00001 0.001
Ammonium Nitrate Delivery Vehicles -- 450 7.40 25 6,384 VMT 0.43 0.2117 g/mile 0.003 0.000006 0.001
Miscellaneous Consumables Delivery Vehicles -- 450 7.40 48 12,486 VMT 0.43 0.2117 g/mile 0.003 0.00001 0.003
Miscellaneous Fuels and Lubricants Delivery Vehicles -- 450 7.40 7 1,110 VMT 0.43 0.2117 g/mile 0.003 0.000002 0.0003
Pickup Trucks (gasoline) 20 350 1.37 33 12,000 VMT 0.54 0.0255 g/mile 0.002 0.00002 0.007
Crew Van (gasoline) 3 350 0.91 22 8,000 VMT 0.54 0.0255 g/mile 0.0002 0.000002 0.0007
Lot Pick-Up Trucks (gasoline) 20 250 0.34 8 3,000 VMT 0.54 0.0255 g/mile 0.0004 0.000005 0.002
8.69 0.10 28.69
1.25 0.01 5.15
9.94 0.12 33.84
a Fuel burning mobile engines are diesel fuel fired unless otherwise noted.
b Except for the shipment and delivery vehicles, the process rates are for a single mobile engine. The process rates for the shipment and delivery vehicles are representative of the entire fleet.
Total Emissions from Haul Truck Engines:
Total Emissions from Other Mobile Engines:
Total Emissions from All Mobile Engines:
Rosemont Copper ProjectEmission Inventory Information JBR ENVIRONMENTAL CONSULTANTS, INC.
November 2011Page H114
AZRP00296
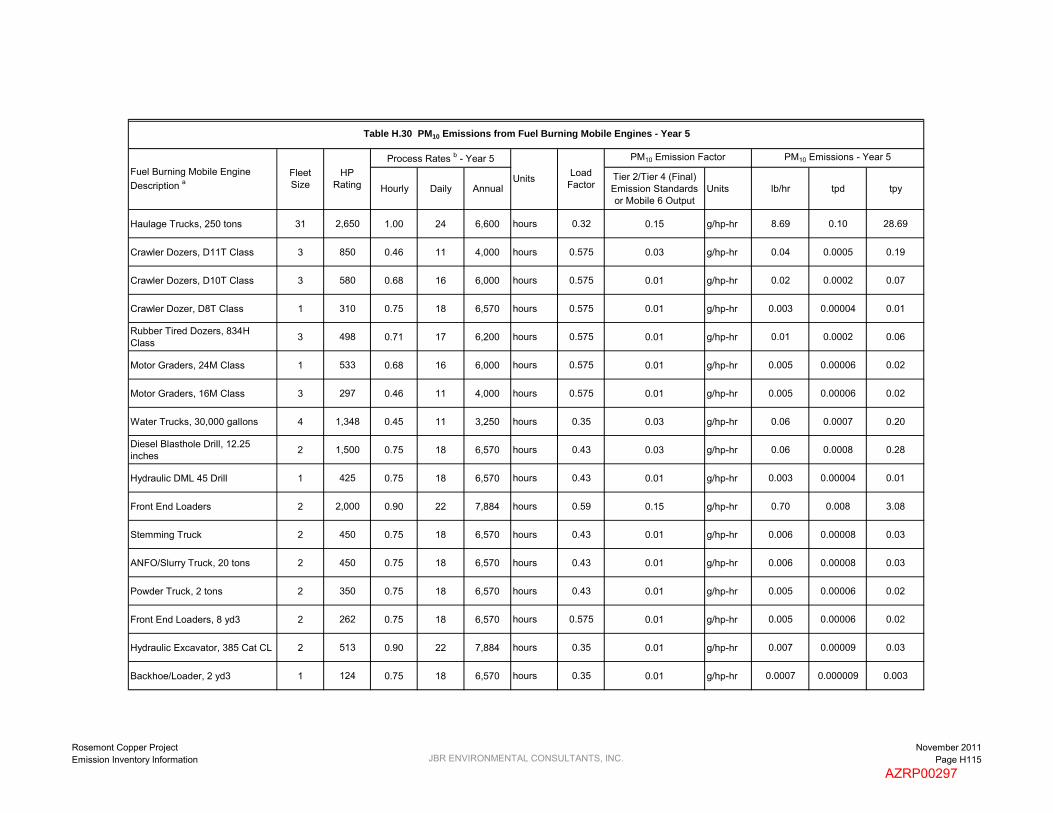
Hourly Daily AnnualTier 2/Tier 4 (Final) Emission Standards or Mobile 6 Output
Units lb/hr tpd tpy
Haulage Trucks, 250 tons 31 2,650 1.00 24 6,600 hours 0.32 0.15 g/hp-hr 8.69 0.10 28.69
Crawler Dozers, D11T Class 3 850 0.46 11 4,000 hours 0.575 0.03 g/hp-hr 0.04 0.0005 0.19
Crawler Dozers, D10T Class 3 580 0.68 16 6,000 hours 0.575 0.01 g/hp-hr 0.02 0.0002 0.07
Crawler Dozer, D8T Class 1 310 0.75 18 6,570 hours 0.575 0.01 g/hp-hr 0.003 0.00004 0.01
Rubber Tired Dozers, 834H Class 3 498 0.71 17 6,200 hours 0.575 0.01 g/hp-hr 0.01 0.0002 0.06
Motor Graders, 24M Class 1 533 0.68 16 6,000 hours 0.575 0.01 g/hp-hr 0.005 0.00006 0.02
Motor Graders, 16M Class 3 297 0.46 11 4,000 hours 0.575 0.01 g/hp-hr 0.005 0.00006 0.02
Water Trucks, 30,000 gallons 4 1,348 0.45 11 3,250 hours 0.35 0.03 g/hp-hr 0.06 0.0007 0.20
Diesel Blasthole Drill, 12.25 inches 2 1,500 0.75 18 6,570 hours 0.43 0.03 g/hp-hr 0.06 0.0008 0.28
Hydraulic DML 45 Drill 1 425 0.75 18 6,570 hours 0.43 0.01 g/hp-hr 0.003 0.00004 0.01
Front End Loaders 2 2,000 0.90 22 7,884 hours 0.59 0.15 g/hp-hr 0.70 0.008 3.08
Stemming Truck 2 450 0.75 18 6,570 hours 0.43 0.01 g/hp-hr 0.006 0.00008 0.03
ANFO/Slurry Truck, 20 tons 2 450 0.75 18 6,570 hours 0.43 0.01 g/hp-hr 0.006 0.00008 0.03
Powder Truck, 2 tons 2 350 0.75 18 6,570 hours 0.43 0.01 g/hp-hr 0.005 0.00006 0.02
Front End Loaders, 8 yd3 2 262 0.75 18 6,570 hours 0.575 0.01 g/hp-hr 0.005 0.00006 0.02
Hydraulic Excavator, 385 Cat CL 2 513 0.90 22 7,884 hours 0.35 0.01 g/hp-hr 0.007 0.00009 0.03
Backhoe/Loader, 2 yd3 1 124 0.75 18 6,570 hours 0.35 0.01 g/hp-hr 0.0007 0.000009 0.003
Table H.30 PM10 Emissions from Fuel Burning Mobile Engines - Year 5
Load Factor
PM10 Emission Factor PM10 Emissions - Year 5Fuel Burning Mobile Engine Description a
Fleet Size
HP Rating
Process Rates b - Year 5
Units
Rosemont Copper ProjectEmission Inventory Information JBR ENVIRONMENTAL CONSULTANTS, INC.
November 2011Page H115
AZRP00297

Hourly Daily AnnualTier 2/Tier 4 (Final) Emission Standards or Mobile 6 Output
Units lb/hr tpd tpy
Table H.30 PM10 Emissions from Fuel Burning Mobile Engines - Year 5
Load Factor
PM10 Emission Factor PM10 Emissions - Year 5Fuel Burning Mobile Engine Description a
Fleet Size
HP Rating
Process Rates b - Year 5
Units
All-Terrain Crane, 75 tons 1 230 0.75 18 6,570 hours 0.43 0.01 g/hp-hr 0.002 0.00002 0.007
Transporter with Tractor, 200 tons 1 1,350 0.75 18 6,570 hours 0.59 0.03 g/hp-hr 0.04 0.0005 0.17
Fuel/Lube Trucks, 6,000 gallons 2 703 0.75 18 6,570 hours 0.35 0.01 g/hp-hr 0.008 0.0001 0.04
Mechanic Field Service Trucks 5 370 1.71 41 15,000 VMT 0.43 0.2117 g/mile 0.004 0.00005 0.02
Tire Handler 1 90 0.11 3 1,000 VMT 0.43 0.2117 g/mile 0.00005 0.0000006 0.0002
Shop Forklift, 12,000 lbs 1 90 0.75 18 6,570 hours 0.59 0.01 g/hp-hr 0.0009 0.00001 0.004
Integrated Tool Carrier, 140 hp 1 138 0.75 18 6,570 hours 0.59 0.01 g/hp-hr 0.001 0.00002 0.006
Light Plant, 6 kW 15 35 0.40 10 3,504 hours 0.43 0.02 g/hp-hr 0.004 0.00005 0.02
Primary Crushing Mobile Crane - 400 tons 1 320 0.75 18 6,570 hours 0.43 0.01 g/hp-hr 0.002 0.00003 0.01
Copper Concentrate Area Front End Loader - Cat 930 1 160 0.75 18 6,570 hours 0.59 0.01 g/hp-hr 0.002 0.00002 0.007
Molybdenum Packaging Forklift, 7,000 lbs 1 93 0.75 18 6,570 hours 0.59 0.01 g/hp-hr 0.0009 0.00001 0.004
Copper Cathode Forklift 1 92.5 0.75 18 6,570 hours 0.59 0.01 g/hp-hr 0.0009 0.00001 0.004
Boom Trucks 10 tons, 45 foot boom 1 200 0.75 18 6,570 hours 0.21 0.01 g/hp-hr 0.0007 0.000008 0.003
Boom Trucks 15 tons, 60 foot boom 1 210 0.75 18 6,570 hours 0.21 0.01 g/hp-hr 0.0007 0.000009 0.003
Front End Loader, 6 yd3 1 349 0.75 18 6,570 hours 0.35 0.01 g/hp-hr 0.002 0.00002 0.009
Front End Loader, 5 yd3 1 149 0.75 18 6,570 hours 0.25 0.01 g/hp-hr 0.0006 0.000007 0.003
Bob Cats, 2,400 lbs 2 82 0.75 18 6,570 hours 0.59 0.01 g/hp-hr 0.002 0.00002 0.007
Rosemont Copper ProjectEmission Inventory Information JBR ENVIRONMENTAL CONSULTANTS, INC.
November 2011Page H116
AZRP00298

Hourly Daily AnnualTier 2/Tier 4 (Final) Emission Standards or Mobile 6 Output
Units lb/hr tpd tpy
Table H.30 PM10 Emissions from Fuel Burning Mobile Engines - Year 5
Load Factor
PM10 Emission Factor PM10 Emissions - Year 5Fuel Burning Mobile Engine Description a
Fleet Size
HP Rating
Process Rates b - Year 5
Units
Fork Lift, 2,000 lbs 1 50 0.75 18 6,570 hours 0.59 0.02 g/hp-hr 0.001 0.00001 0.004
Fork Lift, 5,000 lbs 1 63 0.75 18 6,570 hours 0.59 0.02 g/hp-hr 0.001 0.00001 0.005
Fork Lift, 3,000 lbs 2 50 0.75 18 6,570 hours 0.59 0.02 g/hp-hr 0.002 0.00002 0.009
Flat Bed Trucks, 10 tons 2 350 0.75 18 6,570 hours 0.43 0.01 g/hp-hr 0.005 0.00006 0.02
Dump Truck, 10 tons 1 250 0.34 8 3,000 VMT 0.43 0.2117 g/mile 0.0002 0.000002 0.0007
Mobile Hydraulic Crane, 60 tons 1 267 0.75 18 6,570 hours 0.43 0.01 g/hp-hr 0.002 0.00002 0.008
Truck Shop Bridge Crane, 60 tons 1 75 0.75 18 6,570 hours 0.43 0.01 g/hp-hr 0.0005 0.000006 0.002
Truck Shop Bridge Crane, 25 tons 1 24.1 0.75 18 6,570 hours 0.43 0.30 g/hp-hr 0.005 0.00006 0.02
CS683 Soil Compactor / Roller 2 173 0.75 18 6,570 hours 0.40 0.01 g/hp-hr 0.002 0.00003 0.01
246C Skid Steer Loader 2 73 0.75 18 6,570 hours 0.30 0.02 g/hp-hr 0.001 0.00002 0.006
RH200/340 O & K Shovel / Hitachi EX5500 1 2,520 0.75 18 6,570 hours 0.59 0.03 g/hp-hr 0.07 0.0009 0.32
Off-Road Tire Handling Truck 1 450 0.86 21 7,500 VMT 0.43 0.2117 g/mile 0.0004 0.000005 0.002
Contractor Haul Trucks, 25 tons 2 511 2.74 66 24,000 VMT 0.43 0.2117 g/mile 0.003 0.00003 0.01
Motivator for Mine Shovels 1 3,308 0.91 22 8,000 hours 0.43 0.02 g/hp-hr 0.06 0.0007 0.25
Storm Water Pond Pump 1 200 1.00 24 500 hours 1 0.01 g/hp-hr 0.004 0.00005 0.001
Mine Pit Dewatering Pump 4 100 1.00 24 500 hours 1 0.01 g/hp-hr 0.009 0.0001 0.002
Copper Concentrate Shipment Vehicles -- 450 29.60 1,021 169,872 VMT 0.43 0.2117 g/mile 0.01 0.0002 0.04
Rosemont Copper ProjectEmission Inventory Information JBR ENVIRONMENTAL CONSULTANTS, INC.
November 2011Page H117
AZRP00299

Hourly Daily AnnualTier 2/Tier 4 (Final) Emission Standards or Mobile 6 Output
Units lb/hr tpd tpy
Table H.30 PM10 Emissions from Fuel Burning Mobile Engines - Year 5
Load Factor
PM10 Emission Factor PM10 Emissions - Year 5Fuel Burning Mobile Engine Description a
Fleet Size
HP Rating
Process Rates b - Year 5
Units
Molybdenum Concentrate Shipment Vehicles -- 450 7.40 15 2,145 VMT 0.43 0.2117 g/mile 0.003 0.000004 0.0005
Sulfuric Acid Delivery Vehicles -- 450 22.20 143 52,021 VMT 0.43 0.2117 g/mile 0.01 0.00003 0.01
Lime Delivery Vehicles -- 450 14.80 52 19,072 VMT 0.43 0.2117 g/mile 0.007 0.00001 0.004
SAG Mill and Ball Mill Grinding Balls Delivery Vehicles -- 450 14.80 23 5,858 VMT 0.43 0.2117 g/mile 0.007 0.000005 0.001
Diesel Fuel Delivery Vehicles -- 500 14.80 47 17,136 VMT 0.43 0.2117 g/mile 0.007 0.00001 0.004
Copper Cathode Shipment Vehicles -- 450 14.80 42 4,997 VMT 0.43 0.2117 g/mile 0.007 0.00001 0.001
Ammonium Nitrate Delivery Vehicles -- 450 7.40 25 6,384 VMT 0.43 0.2117 g/mile 0.003 0.000006 0.001
Miscellaneous Consumables Delivery Vehicles -- 450 7.40 48 12,486 VMT 0.43 0.2117 g/mile 0.003 0.00001 0.003
Miscellaneous Fuels and Lubricants Delivery Vehicles -- 450 7.40 7 1,110 VMT 0.43 0.2117 g/mile 0.003 0.000002 0.0003
Pickup Trucks (gasoline) 20 350 1.37 33 12,000 VMT 0.54 0.0255 g/mile 0.002 0.00002 0.007
Crew Van (gasoline) 3 350 0.91 22 8,000 VMT 0.54 0.0255 g/mile 0.0002 0.000002 0.0007
Lot Pick-Up Trucks (gasoline) 20 250 0.34 8 3,000 VMT 0.54 0.0255 g/mile 0.0004 0.000005 0.002
8.69 0.10 28.69
1.25 0.01 5.15
9.94 0.12 33.84
a Fuel burning mobile engines are diesel fuel fired unless otherwise noted.
b Except for the shipment and delivery vehicles, the process rates are for a single mobile engine. The process rates for the shipment and delivery vehicles are representative of the entire fleet.
Total Emissions from Haul Truck Engines:
Total Emissions from Other Mobile Engines:
Total Emissions from All Mobile Engies:
Rosemont Copper ProjectEmission Inventory Information JBR ENVIRONMENTAL CONSULTANTS, INC.
November 2011Page H118
AZRP00300

Hourly Daily AnnualTier 2/Tier 4 (Final) Emission Standards or Mobile 6 Output
Units lb/hr tpd tpy
Haulage Trucks, 250 tons 31 2,650 1.00 24 6,600 hours 0.32 0.15 g/hp-hr 8.69 0.10 28.69
Crawler Dozers, D11T Class 3 850 0.46 11 4,000 hours 0.575 0.03 g/hp-hr 0.04 0.0005 0.19
Crawler Dozers, D10T Class 3 580 0.68 16 6,000 hours 0.575 0.01 g/hp-hr 0.02 0.0002 0.07
Crawler Dozer, D8T Class 1 310 0.75 18 6,570 hours 0.575 0.01 g/hp-hr 0.003 0.00004 0.01
Rubber Tired Dozers, 834H Class 3 498 0.71 17 6,200 hours 0.575 0.01 g/hp-hr 0.01 0.0002 0.06
Motor Graders, 24M Class 1 533 0.68 16 6,000 hours 0.575 0.01 g/hp-hr 0.005 0.00006 0.02
Motor Graders, 16M Class 3 297 0.46 11 4,000 hours 0.575 0.01 g/hp-hr 0.005 0.00006 0.02
Water Trucks, 30,000 gallons 4 1,348 0.45 11 3,250 hours 0.35 0.03 g/hp-hr 0.06 0.0007 0.20
Diesel Blasthole Drill, 12.25 inches 2 1,500 0.75 18 6,570 hours 0.43 0.03 g/hp-hr 0.06 0.0008 0.28
Hydraulic DML 45 Drill 1 425 0.75 18 6,570 hours 0.43 0.01 g/hp-hr 0.003 0.00004 0.01
Front End Loaders 2 2,000 0.90 22 7,884 hours 0.59 0.15 g/hp-hr 0.70 0.008 3.08
Stemming Truck 2 450 0.75 18 6,570 hours 0.43 0.01 g/hp-hr 0.006 0.00008 0.03
ANFO/Slurry Truck, 20 tons 2 450 0.75 18 6,570 hours 0.43 0.01 g/hp-hr 0.006 0.00008 0.03
Powder Truck, 2 tons 2 350 0.75 18 6,570 hours 0.43 0.01 g/hp-hr 0.005 0.00006 0.02
Front End Loaders, 8 yd3 2 262 0.75 18 6,570 hours 0.575 0.01 g/hp-hr 0.005 0.00006 0.02
Hydraulic Excavator, 385 Cat CL 2 513 0.90 22 7,884 hours 0.35 0.01 g/hp-hr 0.007 0.00009 0.03
Backhoe/Loader, 2 yd3 1 124 0.75 18 6,570 hours 0.35 0.01 g/hp-hr 0.0007 0.000009 0.003
Load Factor
PM2.5 Emission Factor PM2.5 Emissions - Year 5
Units
Table H.31 PM2.5 Emissions from Fuel Burning Mobile Engines - Year 5
Fuel Burning Mobile Engine Description a
Fleet Size
HP Rating
Process Rates b - Year 5
Rosemont Copper ProjectEmission Inventory Information JBR ENVIRONMENTAL CONSULTANTS, INC.
November 2011Page H119
AZRP00301

Hourly Daily AnnualTier 2/Tier 4 (Final) Emission Standards or Mobile 6 Output
Units lb/hr tpd tpyLoad
Factor
PM2.5 Emission Factor PM2.5 Emissions - Year 5
Units
Table H.31 PM2.5 Emissions from Fuel Burning Mobile Engines - Year 5
Fuel Burning Mobile Engine Description a
Fleet Size
HP Rating
Process Rates b - Year 5
All-Terrain Crane, 75 tons 1 230 0.75 18 6,570 hours 0.43 0.01 g/hp-hr 0.002 0.00002 0.007
Transporter with Tractor, 200 tons 1 1,350 0.75 18 6,570 hours 0.59 0.03 g/hp-hr 0.04 0.0005 0.17
Fuel/Lube Trucks, 6,000 gallons 2 703 0.75 18 6,570 hours 0.35 0.01 g/hp-hr 0.008 0.0001 0.04
Mechanic Field Service Trucks 5 370 1.71 41 15,000 VMT 0.43 0.2117 g/mile 0.004 0.00005 0.02
Tire Handler 1 90 0.11 3 1,000 VMT 0.43 0.2117 g/mile 0.00005 0.0000006 0.0002
Shop Forklift, 12,000 lbs 1 90 0.75 18 6,570 hours 0.59 0.01 g/hp-hr 0.0009 0.00001 0.004
Integrated Tool Carrier, 140 hp 1 138 0.75 18 6,570 hours 0.59 0.01 g/hp-hr 0.001 0.00002 0.006
Light Plant, 6 kW 15 35 0.40 10 3,504 hours 0.43 0.02 g/hp-hr 0.004 0.00005 0.02
Primary Crushing Mobile Crane - 400 tons 1 320 0.75 18 6,570 hours 0.43 0.01 g/hp-hr 0.002 0.00003 0.01
Copper Concentrate Area Front End Loader - Cat 930 1 160 0.75 18 6,570 hours 0.59 0.01 g/hp-hr 0.002 0.00002 0.007
Molybdenum Packaging Forklift, 7,000 lbs 1 93 0.75 18 6,570 hours 0.59 0.01 g/hp-hr 0.0009 0.00001 0.004
Copper Cathode Forklift 1 93 0.75 18 6,570 hours 0.59 0.01 g/hp-hr 0.0009 0.00001 0.004
Boom Trucks 10 tons, 45 foot boom 1 200 0.75 18 6,570 hours 0.21 0.01 g/hp-hr 0.0007 0.000008 0.003
Boom Trucks 15 tons, 60 foot boom 1 210 0.75 18 6,570 hours 0.21 0.01 g/hp-hr 0.0007 0.000009 0.003
Front End Loader, 6 yd3 1 349 0.75 18 6,570 hours 0.35 0.01 g/hp-hr 0.002 0.00002 0.009
Front End Loader, 5 yd3 1 149 0.75 18 6,570 hours 0.25 0.01 g/hp-hr 0.0006 0.000007 0.003
Bob Cats, 2,400 lbs 2 82 0.75 18 6,570 hours 0.59 0.01 g/hp-hr 0.002 0.00002 0.007
Rosemont Copper ProjectEmission Inventory Information JBR ENVIRONMENTAL CONSULTANTS, INC.
November 2011Page H120
AZRP00302

Hourly Daily AnnualTier 2/Tier 4 (Final) Emission Standards or Mobile 6 Output
Units lb/hr tpd tpyLoad
Factor
PM2.5 Emission Factor PM2.5 Emissions - Year 5
Units
Table H.31 PM2.5 Emissions from Fuel Burning Mobile Engines - Year 5
Fuel Burning Mobile Engine Description a
Fleet Size
HP Rating
Process Rates b - Year 5
Fork Lift, 2,000 lbs 1 50 0.75 18 6,570 hours 0.59 0.02 g/hp-hr 0.001 0.00001 0.004
Fork Lift, 5,000 lbs 1 63 0.75 18 6,570 hours 0.59 0.02 g/hp-hr 0.001 0.00001 0.005
Fork Lift, 3,000 lbs 2 50 0.75 18 6,570 hours 0.59 0.02 g/hp-hr 0.002 0.00002 0.009
Flat Bed Trucks, 10 tons 2 350 0.75 18 6,570 hours 0.43 0.01 g/hp-hr 0.005 0.00006 0.02
Dump Truck, 10 tons 1 250 0.34 8 3,000 VMT 0.43 0.2117 g/mile 0.0002 0.000002 0.0007
Mobile Hydraulic Crane, 60 tons 1 267 0.75 18 6,570 hours 0.43 0.01 g/hp-hr 0.002 0.00002 0.008
Truck Shop Bridge Crane, 60 tons 1 75 0.75 18 6,570 hours 0.43 0.01 g/hp-hr 0.0005 0.000006 0.002
Truck Shop Bridge Crane, 25 tons 1 24 0.75 18 6,570 hours 0.43 0.30 g/hp-hr 0.005 0.00006 0.02
CS683 Soil Compactor / Roller 2 173 0.75 18 6,570 hours 0.4 0.01 g/hp-hr 0.002 0.00003 0.01
246C Skid Steer Loader 2 73 0.75 18 6,570 hours 0.3 0.02 g/hp-hr 0.001 0.00002 0.006
RH200/340 O & K Shovel / Hitachi EX5500 1 2,520 0.75 18 6,570 hours 0.59 0.03 g/hp-hr 0.07 0.0009 0.32
Off-Road Tire Handling Truck 1 450 0.86 21 7,500 VMT 0.43 0.2117 g/mile 0.0004 0.000005 0.002
Contractor Haul Trucks, 25 tons 2 511 2.74 66 24,000 VMT 0.43 0.2117 g/mile 0.003 0.00003 0.01
Motivator for Mine Shovels 1 3,308 0.91 22 8,000 hours 0.43 0.02 g/hp-hr 0.06 0.0007 0.25
Storm Water Pond Pump 1 200 1.00 24 500 hours 1 0.01 g/hp-hr 0.004 0.00005 0.001
Mine Pit Dewatering Pump 4 100 1.00 24 500 hours 1 0.01 g/hp-hr 0.009 0.0001 0.002
Copper Concentrate Shipment Vehicles -- 450 29.60 1,021 169,872 VMT 0.43 0.2117 g/mile 0.01 0.0002 0.04
Rosemont Copper ProjectEmission Inventory Information JBR ENVIRONMENTAL CONSULTANTS, INC.
November 2011Page H121
AZRP00303
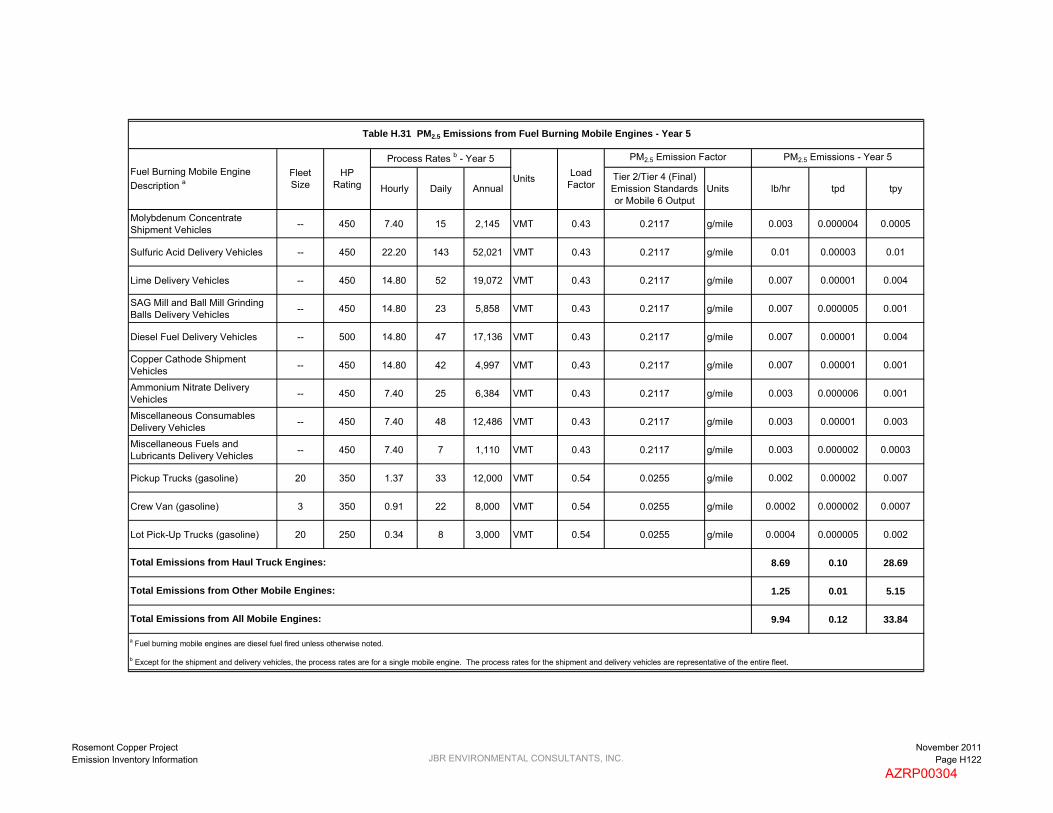
Hourly Daily AnnualTier 2/Tier 4 (Final) Emission Standards or Mobile 6 Output
Units lb/hr tpd tpyLoad
Factor
PM2.5 Emission Factor PM2.5 Emissions - Year 5
Units
Table H.31 PM2.5 Emissions from Fuel Burning Mobile Engines - Year 5
Fuel Burning Mobile Engine Description a
Fleet Size
HP Rating
Process Rates b - Year 5
Molybdenum Concentrate Shipment Vehicles -- 450 7.40 15 2,145 VMT 0.43 0.2117 g/mile 0.003 0.000004 0.0005
Sulfuric Acid Delivery Vehicles -- 450 22.20 143 52,021 VMT 0.43 0.2117 g/mile 0.01 0.00003 0.01
Lime Delivery Vehicles -- 450 14.80 52 19,072 VMT 0.43 0.2117 g/mile 0.007 0.00001 0.004
SAG Mill and Ball Mill Grinding Balls Delivery Vehicles -- 450 14.80 23 5,858 VMT 0.43 0.2117 g/mile 0.007 0.000005 0.001
Diesel Fuel Delivery Vehicles -- 500 14.80 47 17,136 VMT 0.43 0.2117 g/mile 0.007 0.00001 0.004
Copper Cathode Shipment Vehicles -- 450 14.80 42 4,997 VMT 0.43 0.2117 g/mile 0.007 0.00001 0.001
Ammonium Nitrate Delivery Vehicles -- 450 7.40 25 6,384 VMT 0.43 0.2117 g/mile 0.003 0.000006 0.001
Miscellaneous Consumables Delivery Vehicles -- 450 7.40 48 12,486 VMT 0.43 0.2117 g/mile 0.003 0.00001 0.003
Miscellaneous Fuels and Lubricants Delivery Vehicles -- 450 7.40 7 1,110 VMT 0.43 0.2117 g/mile 0.003 0.000002 0.0003
Pickup Trucks (gasoline) 20 350 1.37 33 12,000 VMT 0.54 0.0255 g/mile 0.002 0.00002 0.007
Crew Van (gasoline) 3 350 0.91 22 8,000 VMT 0.54 0.0255 g/mile 0.0002 0.000002 0.0007
Lot Pick-Up Trucks (gasoline) 20 250 0.34 8 3,000 VMT 0.54 0.0255 g/mile 0.0004 0.000005 0.002
8.69 0.10 28.69
1.25 0.01 5.15
9.94 0.12 33.84
a Fuel burning mobile engines are diesel fuel fired unless otherwise noted.
b Except for the shipment and delivery vehicles, the process rates are for a single mobile engine. The process rates for the shipment and delivery vehicles are representative of the entire fleet.
Total Emissions from Haul Truck Engines:
Total Emissions from Other Mobile Engines:
Total Emissions from All Mobile Engines:
Rosemont Copper ProjectEmission Inventory Information JBR ENVIRONMENTAL CONSULTANTS, INC.
November 2011Page H122
AZRP00304

Hourly Daily AnnualTier 2/Tier 3 Emission Standards or Mobile 6
OutputUnits lb/hr tpd tpy
Haulage Trucks, 250 tons 31 2,650 1.00 24 6,600 hours 0.32 2.60 g/hp-hr 150.68 1.81 497.25
Crawler Dozers, D11T Class 3 850 0.46 11 4,000 hours 0.575 2.60 g/hp-hr 3.84 0.05 16.81
Crawler Dozers, D10T Class 3 580 0.68 16 6,000 hours 0.575 2.60 g/hp-hr 3.93 0.05 17.20
Crawler Dozer, D8T Class 1 310 0.75 18 6,570 hours 0.575 2.60 g/hp-hr 0.77 0.009 3.36
Rubber Tired Dozers, 834H Class 3 498 0.71 17 6,200 hours 0.575 2.60 g/hp-hr 3.49 0.04 15.26
Motor Graders, 24M Class 1 533 0.68 16 6,000 hours 0.575 2.60 g/hp-hr 1.20 0.01 5.27
Motor Graders, 16M Class 3 297 0.46 11 4,000 hours 0.575 2.60 g/hp-hr 1.34 0.02 5.87
Water Trucks, 30,000 gallons 4 1,348 0.45 11 3,250 hours 0.35 2.60 g/hp-hr 4.82 0.06 17.58
Diesel Blasthole Drill, 12.25 inches 2 1,500 0.75 18 6,570 hours 0.43 2.60 g/hp-hr 5.55 0.07 24.29
Hydraulic DML 45 Drill 1 425 0.75 18 6,570 hours 0.43 2.60 g/hp-hr 0.79 0.009 3.44
Front End Loaders 2 2,000 0.90 22 7,884 hours 0.59 2.60 g/hp-hr 12.17 0.15 53.33
Stemming Truck 2 450 0.75 18 6,570 hours 0.43 2.60 g/hp-hr 1.66 0.02 7.29
ANFO/Slurry Truck, 20 tons 2 450 0.75 18 6,570 hours 0.43 2.60 g/hp-hr 1.66 0.02 7.29
Powder Truck, 2 tons 2 350 0.75 18 6,570 hours 0.43 2.60 g/hp-hr 1.29 0.02 5.67
Front End Loaders, 8 yd3 2 262 0.75 18 6,570 hours 0.575 2.60 g/hp-hr 1.30 0.02 5.67
Hydraulic Excavator, 385 Cat CL 2 513 0.90 22 7,884 hours 0.35 2.60 g/hp-hr 1.85 0.02 8.11
Backhoe/Loader, 2 yd3 1 124 0.75 18 6,570 hours 0.35 3.70 g/hp-hr 0.27 0.003 1.16
Load Factor
CO Emission Factor CO Emissions - Year 5
Units
Table H.32 CO Emissions from Fuel Burning Mobile Engines - Year 5
Fuel Burning Mobile Engine Description a
Fleet Size
HP Rating
Process Rates b - Year 5
Rosemont Copper ProjectEmission Inventory Information JBR ENVIRONMENTAL CONSULTANTS, INC.
November 2011Page H123
AZRP00305

Hourly Daily AnnualTier 2/Tier 3 Emission Standards or Mobile 6
OutputUnits lb/hr tpd tpy
Load Factor
CO Emission Factor CO Emissions - Year 5
Units
Table H.32 CO Emissions from Fuel Burning Mobile Engines - Year 5
Fuel Burning Mobile Engine Description a
Fleet Size
HP Rating
Process Rates b - Year 5
All-Terrain Crane, 75 tons 1 230 0.75 18 6,570 hours 0.43 2.60 g/hp-hr 0.43 0.005 1.86
Transporter with Tractor, 200 tons 1 1,350 0.75 18 6,570 hours 0.59 2.60 g/hp-hr 3.42 0.04 15.00
Fuel/Lube Trucks, 6,000 gallons 2 703 0.75 18 6,570 hours 0.35 2.60 g/hp-hr 2.12 0.03 9.27
Mechanic Field Service Trucks 5 370 1.71 41 15,000 VMT 0.43 1.870 g/mile 0.04 0.0004 0.15
Tire Handler 1 90 0.11 3 1,000 VMT 0.43 1.870 g/mile 0.0005 0.000006 0.002
Shop Forklift, 12,000 lbs 1 90 0.75 18 6,570 hours 0.59 3.70 g/hp-hr 0.32 0.004 1.42
Integrated Tool Carrier, 140 hp 1 138 0.75 18 6,570 hours 0.59 3.70 g/hp-hr 0.50 0.006 2.18
Light Plant, 6 kW 15 35 0.40 10 3,504 hours 0.43 4.10 g/hp-hr 0.82 0.01 3.58
Primary Crushing Mobile Crane - 400 tons 1 320 0.75 18 6,570 hours 0.43 2.60 g/hp-hr 0.59 0.007 2.59
Copper Concentrate Area Front End Loader - Cat 930 1 160 0.75 18 6,570 hours 0.59 3.70 g/hp-hr 0.58 0.007 2.53
Molybdenum Packaging Forklift, 7,000 lbs 1 93 0.75 18 6,570 hours 0.59 3.70 g/hp-hr 0.33 0.004 1.46
Copper Cathode Forklift 1 93 0.75 18 6,570 hours 0.59 3.70 g/hp-hr 0.33 0.004 1.46
Boom Trucks 10 tons, 45 foot boom 1 200 0.75 18 6,570 hours 0.21 2.60 g/hp-hr 0.18 0.002 0.79
Boom Trucks 15 tons, 60 foot boom 1 210 0.75 18 6,570 hours 0.21 2.60 g/hp-hr 0.19 0.002 0.83
Front End Loader, 6 yd3 1 349 0.75 18 6,570 hours 0.35 2.60 g/hp-hr 0.53 0.006 2.30
Front End Loader, 5 yd3 1 149 0.75 18 6,570 hours 0.25 3.70 g/hp-hr 0.23 0.003 1.00
Bob Cats, 2,400 lbs 2 82 0.75 18 6,570 hours 0.59 3.70 g/hp-hr 0.59 0.007 2.59
Rosemont Copper ProjectEmission Inventory Information JBR ENVIRONMENTAL CONSULTANTS, INC.
November 2011Page H124
AZRP00306

Hourly Daily AnnualTier 2/Tier 3 Emission Standards or Mobile 6
OutputUnits lb/hr tpd tpy
Load Factor
CO Emission Factor CO Emissions - Year 5
Units
Table H.32 CO Emissions from Fuel Burning Mobile Engines - Year 5
Fuel Burning Mobile Engine Description a
Fleet Size
HP Rating
Process Rates b - Year 5
Fork Lift, 2,000 lbs 1 50 0.75 18 6,570 hours 0.59 3.70 g/hp-hr 0.18 0.002 0.79
Fork Lift, 5,000 lbs 1 63 0.75 18 6,570 hours 0.59 3.70 g/hp-hr 0.23 0.003 1.00
Fork Lift, 3,000 lbs 2 50 0.75 18 6,570 hours 0.59 3.70 g/hp-hr 0.36 0.004 1.58
Flat Bed Trucks, 10 tons 2 350 0.75 18 6,570 hours 0.43 2.60 g/hp-hr 1.29 0.02 5.67
Dump Truck, 10 tons 1 250 0.34 8 3,000 VMT 0.43 1.870 g/mile 0.001 0.00002 0.006
Mobile Hydraulic Crane, 60 tons 1 267 0.75 18 6,570 hours 0.43 2.60 g/hp-hr 0.49 0.006 2.16
Truck Shop Bridge Crane, 60 tons 1 75 0.75 18 6,570 hours 0.43 3.70 g/hp-hr 0.20 0.002 0.86
Truck Shop Bridge Crane, 25 tons 1 24 0.75 18 6,570 hours 0.43 4.90 g/hp-hr 0.08 0.001 0.37
CS683 Soil Compactor / Roller 2 173 0.75 18 6,570 hours 0.4 3.70 g/hp-hr 0.85 0.01 3.71
246C Skid Steer Loader 2 73 0.75 18 6,570 hours 0.3 3.70 g/hp-hr 0.27 0.003 1.17
RH200/340 O & K Shovel / Hitachi EX5500 1 2,520 0.75 18 6,570 hours 0.59 2.60 g/hp-hr 6.39 0.08 28.00
Off-Road Tire Handling Truck 1 450 0.86 21 7,500 VMT 0.43 1.870 g/mile 0.004 0.00004 0.02
Contractor Haul Trucks, 25 tons 2 511 2.74 66 24,000 VMT 0.43 1.870 g/mile 0.02 0.0003 0.10
Motivator for Mine Shovels 1 3,308 0.91 22 8,000 hours 0.43 2.60 g/hp-hr 7.45 0.09 32.61
Storm Water Pond Pump 1 200 1.00 24 500 hours 1 2.60 g/hp-hr 1.15 0.01 0.29
Mine Pit Dewatering Pump 4 100 1.00 24 500 hours 1 3.70 g/hp-hr 3.26 0.04 0.82
Copper Concentrate Shipment Vehicles -- 450 29.60 1,021 169,872 VMT 0.43 1.870 g/mile 0.12 0.002 0.35
Rosemont Copper ProjectEmission Inventory Information JBR ENVIRONMENTAL CONSULTANTS, INC.
November 2011Page H125
AZRP00307

Hourly Daily AnnualTier 2/Tier 3 Emission Standards or Mobile 6
OutputUnits lb/hr tpd tpy
Load Factor
CO Emission Factor CO Emissions - Year 5
Units
Table H.32 CO Emissions from Fuel Burning Mobile Engines - Year 5
Fuel Burning Mobile Engine Description a
Fleet Size
HP Rating
Process Rates b - Year 5
Molybdenum Concentrate Shipment Vehicles -- 450 7.40 15 2,145 VMT 0.43 1.870 g/mile 0.03 0.00003 0.004
Sulfuric Acid Delivery Vehicles -- 450 22.20 143 52,021 VMT 0.43 1.870 g/mile 0.09 0.0003 0.11
Lime Delivery Vehicles -- 450 14.80 52 19,072 VMT 0.43 1.870 g/mile 0.06 0.0001 0.04
SAG Mill and Ball Mill Grinding Balls Delivery Vehicles -- 450 14.80 23 5,858 VMT 0.43 1.870 g/mile 0.06 0.00005 0.01
Diesel Fuel Delivery Vehicles -- 500 14.80 47 17,136 VMT 0.43 1.870 g/mile 0.06 0.0001 0.04
Copper Cathode Shipment Vehicles -- 450 14.80 42 4,997 VMT 0.43 1.870 g/mile 0.06 0.00009 0.01
Ammonium Nitrate Delivery Vehicles -- 450 7.40 25 6,384 VMT 0.43 1.870 g/mile 0.03 0.00005 0.01
Miscellaneous Consumables Delivery Vehicles -- 450 7.40 48 12,486 VMT 0.43 1.870 g/mile 0.03 0.0001 0.03
Miscellaneous Fuels and Lubricants Delivery Vehicles -- 450 7.40 7 1,110 VMT 0.43 1.870 g/mile 0.03 0.00002 0.002
Pickup Trucks (gasoline) 20 350 1.37 33 12,000 VMT 0.54 15.51 g/mile 0.94 0.01 4.10
Crew Van (gasoline) 3 350 0.91 22 8,000 VMT 0.54 15.51 g/mile 0.09 0.001 0.41
Lot Pick-Up Trucks (gasoline) 20 250 0.34 8 3,000 VMT 0.54 15.51 g/mile 0.23 0.003 1.03
150.68 1.81 497.25
81.18 0.97 331.91
231.86 2.78 829.16
a Fuel burning mobile engines are diesel fuel fired unless otherwise noted.
b Except for the shipment and delivery vehicles, the process rates are for a single mobile engine. The process rates for the shipment and delivery vehicles are representative of the entire fleet.
Total Emissions from Haul Truck Engines:
Total Emissions from Other Mobile Engines:
Total Emissions from All Mobile Engines:
Rosemont Copper ProjectEmission Inventory Information JBR ENVIRONMENTAL CONSULTANTS, INC.
November 2011Page H126
AZRP00308
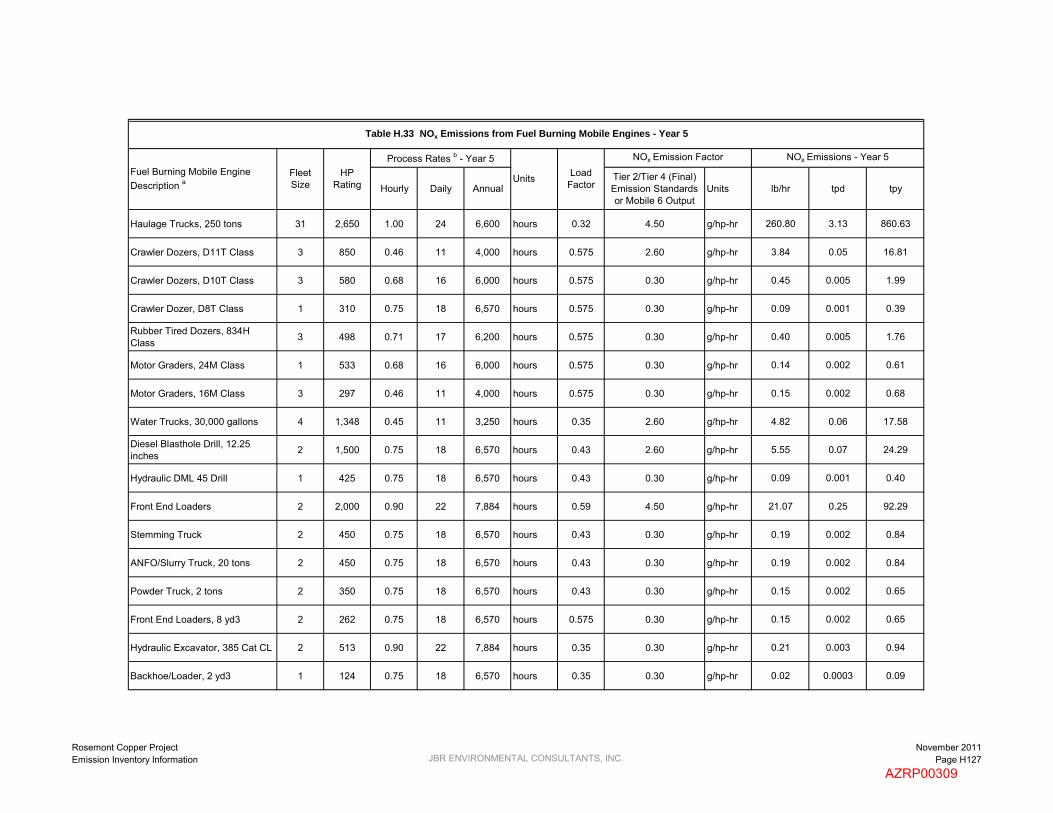
Hourly Daily AnnualTier 2/Tier 4 (Final) Emission Standards or Mobile 6 Output
Units lb/hr tpd tpy
Haulage Trucks, 250 tons 31 2,650 1.00 24 6,600 hours 0.32 4.50 g/hp-hr 260.80 3.13 860.63
Crawler Dozers, D11T Class 3 850 0.46 11 4,000 hours 0.575 2.60 g/hp-hr 3.84 0.05 16.81
Crawler Dozers, D10T Class 3 580 0.68 16 6,000 hours 0.575 0.30 g/hp-hr 0.45 0.005 1.99
Crawler Dozer, D8T Class 1 310 0.75 18 6,570 hours 0.575 0.30 g/hp-hr 0.09 0.001 0.39
Rubber Tired Dozers, 834H Class 3 498 0.71 17 6,200 hours 0.575 0.30 g/hp-hr 0.40 0.005 1.76
Motor Graders, 24M Class 1 533 0.68 16 6,000 hours 0.575 0.30 g/hp-hr 0.14 0.002 0.61
Motor Graders, 16M Class 3 297 0.46 11 4,000 hours 0.575 0.30 g/hp-hr 0.15 0.002 0.68
Water Trucks, 30,000 gallons 4 1,348 0.45 11 3,250 hours 0.35 2.60 g/hp-hr 4.82 0.06 17.58
Diesel Blasthole Drill, 12.25 inches 2 1,500 0.75 18 6,570 hours 0.43 2.60 g/hp-hr 5.55 0.07 24.29
Hydraulic DML 45 Drill 1 425 0.75 18 6,570 hours 0.43 0.30 g/hp-hr 0.09 0.001 0.40
Front End Loaders 2 2,000 0.90 22 7,884 hours 0.59 4.50 g/hp-hr 21.07 0.25 92.29
Stemming Truck 2 450 0.75 18 6,570 hours 0.43 0.30 g/hp-hr 0.19 0.002 0.84
ANFO/Slurry Truck, 20 tons 2 450 0.75 18 6,570 hours 0.43 0.30 g/hp-hr 0.19 0.002 0.84
Powder Truck, 2 tons 2 350 0.75 18 6,570 hours 0.43 0.30 g/hp-hr 0.15 0.002 0.65
Front End Loaders, 8 yd3 2 262 0.75 18 6,570 hours 0.575 0.30 g/hp-hr 0.15 0.002 0.65
Hydraulic Excavator, 385 Cat CL 2 513 0.90 22 7,884 hours 0.35 0.30 g/hp-hr 0.21 0.003 0.94
Backhoe/Loader, 2 yd3 1 124 0.75 18 6,570 hours 0.35 0.30 g/hp-hr 0.02 0.0003 0.09
Load Factor
NOx Emission Factor NOx Emissions - Year 5
Units
Table H.33 NOx Emissions from Fuel Burning Mobile Engines - Year 5
Fuel Burning Mobile Engine Description a
Fleet Size
HP Rating
Process Rates b - Year 5
Rosemont Copper ProjectEmission Inventory Information JBR ENVIRONMENTAL CONSULTANTS, INC.
November 2011Page H127
AZRP00309

Hourly Daily AnnualTier 2/Tier 4 (Final) Emission Standards or Mobile 6 Output
Units lb/hr tpd tpyLoad
Factor
NOx Emission Factor NOx Emissions - Year 5
Units
Table H.33 NOx Emissions from Fuel Burning Mobile Engines - Year 5
Fuel Burning Mobile Engine Description a
Fleet Size
HP Rating
Process Rates b - Year 5
All-Terrain Crane, 75 tons 1 230 0.75 18 6,570 hours 0.43 0.30 g/hp-hr 0.05 0.0006 0.21
Transporter with Tractor, 200 tons 1 1,350 0.75 18 6,570 hours 0.59 2.60 g/hp-hr 3.42 0.04 15.00
Fuel/Lube Trucks, 6,000 gallons 2 703 0.75 18 6,570 hours 0.35 0.30 g/hp-hr 0.24 0.003 1.07
Mechanic Field Service Trucks 5 370 1.71 41 15,000 VMT 0.43 7.394 g/mile 0.14 0.002 0.61
Tire Handler 1 90 0.11 3 1,000 VMT 0.43 7.394 g/mile 0.002 0.00002 0.008
Shop Forklift, 12,000 lbs 1 90 0.75 18 6,570 hours 0.59 0.30 g/hp-hr 0.03 0.0003 0.12
Integrated Tool Carrier, 140 hp 1 138 0.75 18 6,570 hours 0.59 0.30 g/hp-hr 0.04 0.0005 0.18
Light Plant, 6 kW 15 35 0.40 10 3,504 hours 0.43 3.30 g/hp-hr 0.66 0.008 2.88
Primary Crushing Mobile Crane - 400 tons 1 320 0.75 18 6,570 hours 0.43 0.30 g/hp-hr 0.07 0.0008 0.30
Copper Concentrate Area Front End Loader - Cat 930 1 160 0.75 18 6,570 hours 0.59 0.30 g/hp-hr 0.05 0.0006 0.21
Molybdenum Packaging Forklift, 7,000 lbs 1 93 0.75 18 6,570 hours 0.59 0.30 g/hp-hr 0.03 0.0003 0.12
Copper Cathode Forklift 1 93 0.75 18 6,570 hours 0.59 0.30 g/hp-hr 0.03 0.0003 0.12
Boom Trucks 10 tons, 45 foot boom 1 200 0.75 18 6,570 hours 0.21 0.30 g/hp-hr 0.02 0.0003 0.09
Boom Trucks 15 tons, 60 foot boom 1 210 0.75 18 6,570 hours 0.21 0.30 g/hp-hr 0.02 0.0003 0.10
Front End Loader, 6 yd3 1 349 0.75 18 6,570 hours 0.35 0.30 g/hp-hr 0.06 0.0007 0.27
Front End Loader, 5 yd3 1 149 0.75 18 6,570 hours 0.25 0.30 g/hp-hr 0.02 0.0002 0.08
Bob Cats, 2,400 lbs 2 82 0.75 18 6,570 hours 0.59 0.30 g/hp-hr 0.05 0.0006 0.21
Rosemont Copper ProjectEmission Inventory Information JBR ENVIRONMENTAL CONSULTANTS, INC.
November 2011Page H128
AZRP00310

Hourly Daily AnnualTier 2/Tier 4 (Final) Emission Standards or Mobile 6 Output
Units lb/hr tpd tpyLoad
Factor
NOx Emission Factor NOx Emissions - Year 5
Units
Table H.33 NOx Emissions from Fuel Burning Mobile Engines - Year 5
Fuel Burning Mobile Engine Description a
Fleet Size
HP Rating
Process Rates b - Year 5
Fork Lift, 2,000 lbs 1 50 0.75 18 6,570 hours 0.59 3.30 g/hp-hr 0.16 0.002 0.71
Fork Lift, 5,000 lbs 1 63 0.75 18 6,570 hours 0.59 3.30 g/hp-hr 0.20 0.002 0.89
Fork Lift, 3,000 lbs 2 50 0.75 18 6,570 hours 0.59 3.30 g/hp-hr 0.32 0.004 1.41
Flat Bed Trucks, 10 tons 2 350 0.75 18 6,570 hours 0.43 0.30 g/hp-hr 0.15 0.002 0.65
Dump Truck, 10 tons 1 250 0.34 8 3,000 VMT 0.43 7.394 g/mile 0.006 0.00007 0.02
Mobile Hydraulic Crane, 60 tons 1 267 0.75 18 6,570 hours 0.43 0.30 g/hp-hr 0.06 0.0007 0.25
Truck Shop Bridge Crane, 60 tons 1 75 0.75 18 6,570 hours 0.43 0.30 g/hp-hr 0.02 0.0002 0.07
Truck Shop Bridge Crane, 25 tons 1 24 0.75 18 6,570 hours 0.43 5.00 g/hp-hr 0.09 0.001 0.38
CS683 Soil Compactor / Roller 2 173 0.75 18 6,570 hours 0.4 0.30 g/hp-hr 0.07 0.0008 0.30
246C Skid Steer Loader 2 73 0.75 18 6,570 hours 0.3 3.30 g/hp-hr 0.24 0.003 1.05
RH200/340 O & K Shovel / Hitachi EX5500 1 2,520 0.75 18 6,570 hours 0.59 2.60 g/hp-hr 6.39 0.08 28.00
Off-Road Tire Handling Truck 1 450 0.86 21 7,500 VMT 0.43 7.394 g/mile 0.01 0.0002 0.06
Contractor Haul Trucks, 25 tons 2 511 2.74 66 24,000 VMT 0.43 7.394 g/mile 0.09 0.001 0.39
Motivator for Mine Shovels 1 3,308 0.91 22 8,000 hours 0.43 0.50 g/hp-hr 1.43 0.02 6.27
Storm Water Pond Pump 1 200 1.00 24 500 hours 1 0.30 g/hp-hr 0.13 0.002 0.03
Mine Pit Dewatering Pump 4 100 1.00 24 500 hours 1 0.30 g/hp-hr 0.26 0.003 0.07
Copper Concentrate Shipment Vehicles -- 450 29.60 1,021 169,872 VMT 0.43 7.394 g/mile 0.48 0.008 1.38
Rosemont Copper ProjectEmission Inventory Information JBR ENVIRONMENTAL CONSULTANTS, INC.
November 2011Page H129
AZRP00311

Hourly Daily AnnualTier 2/Tier 4 (Final) Emission Standards or Mobile 6 Output
Units lb/hr tpd tpyLoad
Factor
NOx Emission Factor NOx Emissions - Year 5
Units
Table H.33 NOx Emissions from Fuel Burning Mobile Engines - Year 5
Fuel Burning Mobile Engine Description a
Fleet Size
HP Rating
Process Rates b - Year 5
Molybdenum Concentrate Shipment Vehicles -- 450 7.40 15 2,145 VMT 0.43 7.394 g/mile 0.12 0.0001 0.02
Sulfuric Acid Delivery Vehicles -- 450 22.20 143 52,021 VMT 0.43 7.394 g/mile 0.36 0.001 0.42
Lime Delivery Vehicles -- 450 14.80 52 19,072 VMT 0.43 7.394 g/mile 0.24 0.0004 0.16
SAG Mill and Ball Mill Grinding Balls Delivery Vehicles -- 450 14.80 23 5,858 VMT 0.43 7.394 g/mile 0.24 0.0002 0.05
Diesel Fuel Delivery Vehicles -- 500 14.80 47 17,136 VMT 0.43 7.394 g/mile 0.24 0.0004 0.14
Copper Cathode Shipment Vehicles -- 450 14.80 42 4,997 VMT 0.43 7.394 g/mile 0.24 0.0003 0.04
Ammonium Nitrate Delivery Vehicles -- 450 7.40 25 6,384 VMT 0.43 7.394 g/mile 0.12 0.0002 0.05
Miscellaneous Consumables Delivery Vehicles -- 450 7.40 48 12,486 VMT 0.43 7.394 g/mile 0.12 0.0004 0.10
Miscellaneous Fuels and Lubricants Delivery Vehicles -- 450 7.40 7 1,110 VMT 0.43 7.394 g/mile 0.12 0.00006 0.009
Pickup Trucks (gasoline) 20 350 1.37 33 12,000 VMT 0.54 1.145 g/mile 0.07 0.0008 0.30
Crew Van (gasoline) 3 350 0.91 22 8,000 VMT 0.54 1.145 g/mile 0.007 0.00008 0.03
Lot Pick-Up Trucks (gasoline) 20 250 0.34 8 3,000 VMT 0.54 1.145 g/mile 0.02 0.0002 0.08
260.80 3.13 860.63
54.45 0.64 225.69
315.25 3.77 1,086.32
a Fuel burning mobile engines are diesel fuel fired unless otherwise noted.
b Except for the shipment and delivery vehicles, the process rates are for a single mobile engine. The process rates for the shipment and delivery vehicles are representative of the entire fleet.
Total Emissions from Haul Truck Engines:
Total Emissions from Other Mobile Engines:
Total Emissions from All Mobile Engines:
Rosemont Copper ProjectEmission Inventory Information JBR ENVIRONMENTAL CONSULTANTS, INC.
November 2011Page H130
AZRP00312
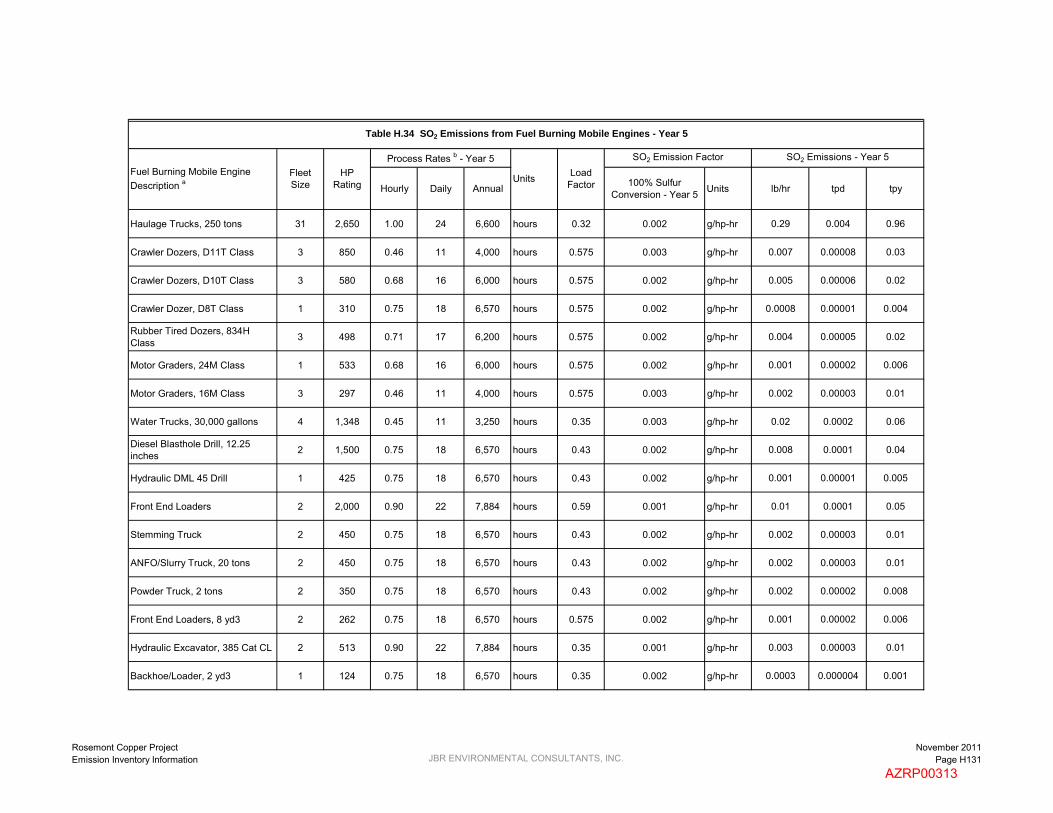
Hourly Daily Annual 100% Sulfur Conversion - Year 5 Units lb/hr tpd tpy
Haulage Trucks, 250 tons 31 2,650 1.00 24 6,600 hours 0.32 0.002 g/hp-hr 0.29 0.004 0.96
Crawler Dozers, D11T Class 3 850 0.46 11 4,000 hours 0.575 0.003 g/hp-hr 0.007 0.00008 0.03
Crawler Dozers, D10T Class 3 580 0.68 16 6,000 hours 0.575 0.002 g/hp-hr 0.005 0.00006 0.02
Crawler Dozer, D8T Class 1 310 0.75 18 6,570 hours 0.575 0.002 g/hp-hr 0.0008 0.00001 0.004
Rubber Tired Dozers, 834H Class 3 498 0.71 17 6,200 hours 0.575 0.002 g/hp-hr 0.004 0.00005 0.02
Motor Graders, 24M Class 1 533 0.68 16 6,000 hours 0.575 0.002 g/hp-hr 0.001 0.00002 0.006
Motor Graders, 16M Class 3 297 0.46 11 4,000 hours 0.575 0.003 g/hp-hr 0.002 0.00003 0.01
Water Trucks, 30,000 gallons 4 1,348 0.45 11 3,250 hours 0.35 0.003 g/hp-hr 0.02 0.0002 0.06
Diesel Blasthole Drill, 12.25 inches 2 1,500 0.75 18 6,570 hours 0.43 0.002 g/hp-hr 0.008 0.0001 0.04
Hydraulic DML 45 Drill 1 425 0.75 18 6,570 hours 0.43 0.002 g/hp-hr 0.001 0.00001 0.005
Front End Loaders 2 2,000 0.90 22 7,884 hours 0.59 0.001 g/hp-hr 0.01 0.0001 0.05
Stemming Truck 2 450 0.75 18 6,570 hours 0.43 0.002 g/hp-hr 0.002 0.00003 0.01
ANFO/Slurry Truck, 20 tons 2 450 0.75 18 6,570 hours 0.43 0.002 g/hp-hr 0.002 0.00003 0.01
Powder Truck, 2 tons 2 350 0.75 18 6,570 hours 0.43 0.002 g/hp-hr 0.002 0.00002 0.008
Front End Loaders, 8 yd3 2 262 0.75 18 6,570 hours 0.575 0.002 g/hp-hr 0.001 0.00002 0.006
Hydraulic Excavator, 385 Cat CL 2 513 0.90 22 7,884 hours 0.35 0.001 g/hp-hr 0.003 0.00003 0.01
Backhoe/Loader, 2 yd3 1 124 0.75 18 6,570 hours 0.35 0.002 g/hp-hr 0.0003 0.000004 0.001
Units Load Factor
SO2 Emission Factor
Table H.34 SO2 Emissions from Fuel Burning Mobile Engines - Year 5
SO2 Emissions - Year 5Fuel Burning Mobile Engine Description a
Fleet Size
HP Rating
Process Rates b - Year 5
Rosemont Copper ProjectEmission Inventory Information JBR ENVIRONMENTAL CONSULTANTS, INC.
November 2011Page H131
AZRP00313

Hourly Daily Annual 100% Sulfur Conversion - Year 5 Units lb/hr tpd tpy
Units Load Factor
SO2 Emission Factor
Table H.34 SO2 Emissions from Fuel Burning Mobile Engines - Year 5
SO2 Emissions - Year 5Fuel Burning Mobile Engine Description a
Fleet Size
HP Rating
Process Rates b - Year 5
All-Terrain Crane, 75 tons 1 230 0.75 18 6,570 hours 0.43 0.002 g/hp-hr 0.0006 0.000007 0.003
Transporter with Tractor, 200 tons 1 1,350 0.75 18 6,570 hours 0.59 0.002 g/hp-hr 0.004 0.00004 0.02
Fuel/Lube Trucks, 6,000 gallons 2 703 0.75 18 6,570 hours 0.35 0.002 g/hp-hr 0.004 0.00005 0.02
Mechanic Field Service Trucks 5 370 0.75 18 6,570 hours 0.43 0.002 g/hp-hr 0.005 0.00006 0.02
Tire Handler 1 90 0.75 18 6,570 hours 0.43 0.002 g/hp-hr 0.0002 0.000003 0.001
Shop Forklift, 12,000 lbs 1 90 0.75 18 6,570 hours 0.59 0.002 g/hp-hr 0.0002 0.000003 0.001
Integrated Tool Carrier, 140 hp 1 138 0.75 18 6,570 hours 0.59 0.002 g/hp-hr 0.0004 0.000004 0.002
Light Plant, 6 kW 15 35 0.40 10 3,504 hours 0.43 0.003 g/hp-hr 0.001 0.00002 0.006
Primary Crushing Mobile Crane - 400 tons 1 320 0.75 18 6,570 hours 0.43 0.002 g/hp-hr 0.0009 0.00001 0.004
Copper Concentrate Area Front End Loader - Cat 930 1 160 0.75 18 6,570 hours 0.59 0.002 g/hp-hr 0.0004 0.000005 0.002
Molybdenum Packaging Forklift, 7,000 lbs 1 93 0.75 18 6,570 hours 0.59 0.002 g/hp-hr 0.0002 0.000003 0.001
Copper Cathode Forklift 1 93 0.75 18 6,570 hours 0.59 0.002 g/hp-hr 0.0002 0.000003 0.001
Boom Trucks 10 tons, 45 foot boom 1 200 0.75 18 6,570 hours 0.21 0.002 g/hp-hr 0.0005 0.000006 0.002
Boom Trucks 15 tons, 60 foot boom 1 210 0.75 18 6,570 hours 0.21 0.002 g/hp-hr 0.0006 0.000007 0.002
Front End Loader, 6 yd3 1 349 0.75 18 6,570 hours 0.35 0.002 g/hp-hr 0.0009 0.00001 0.004
Front End Loader, 5 yd3 1 149 0.75 18 6,570 hours 0.25 0.002 g/hp-hr 0.0004 0.000005 0.002
Bob Cats, 2,400 lbs 2 82 0.75 18 6,570 hours 0.59 0.002 g/hp-hr 0.0004 0.000005 0.002
Rosemont Copper ProjectEmission Inventory Information JBR ENVIRONMENTAL CONSULTANTS, INC.
November 2011Page H132
AZRP00314

Hourly Daily Annual 100% Sulfur Conversion - Year 5 Units lb/hr tpd tpy
Units Load Factor
SO2 Emission Factor
Table H.34 SO2 Emissions from Fuel Burning Mobile Engines - Year 5
SO2 Emissions - Year 5Fuel Burning Mobile Engine Description a
Fleet Size
HP Rating
Process Rates b - Year 5
Fork Lift, 2,000 lbs 1 50 0.75 18 6,570 hours 0.59 0.002 g/hp-hr 0.0001 0.000002 0.0006
Fork Lift, 5,000 lbs 1 63 0.75 18 6,570 hours 0.59 0.002 g/hp-hr 0.0002 0.000002 0.0007
Fork Lift, 3,000 lbs 2 50 0.75 18 6,570 hours 0.59 0.002 g/hp-hr 0.0003 0.000003 0.001
Flat Bed Trucks, 10 tons 2 350 0.75 18 6,570 hours 0.43 0.002 g/hp-hr 0.002 0.00002 0.008
Dump Truck, 10 tons 1 250 0.75 18 6,570 hours 0.43 0.002 g/hp-hr 0.0007 0.000008 0.003
Mobile Hydraulic Crane, 60 tons 1 267 0.75 18 6,570 hours 0.43 0.002 g/hp-hr 0.0007 0.000009 0.003
Truck Shop Bridge Crane, 60 tons 1 75 0.75 18 6,570 hours 0.43 0.002 g/hp-hr 0.0002 0.000002 0.0009
Truck Shop Bridge Crane, 25 tons 1 24 0.75 18 6,570 hours 0.43 0.002 g/hp-hr 0.00006 0.0000008 0.0003
CS683 Soil Compactor / Roller 2 173 0.75 18 6,570 hours 0.40 0.002 g/hp-hr 0.0009 0.00001 0.004
246C Skid Steer Loader 2 73 0.75 18 6,570 hours 0.3 0.002 g/hp-hr 0.0004 0.000005 0.002
RH200/340 O & K Shovel / Hitachi EX5500 1 2,520 0.75 18 6,570 hours 0.59 0.002 g/hp-hr 0.007 0.00008 0.03
Off-Road Tire Handling Truck 1 450 0.75 18 6,570 hours 0.43 0.002 g/hp-hr 0.001 0.00001 0.005
Contractor Haul Trucks, 25 tons 2 511 0.75 18 6,570 hours 0.43 0.002 g/hp-hr 0.003 0.00003 0.01
Motivator for Mine Shovels 1 3,308 0.91 22 8,000 hours 0.43 0.001 g/hp-hr 0.009 0.0001 0.04
Storm Water Pond Pump 1 200 1.00 24 500 hours 1 0.021 g/hp-hr 0.009 0.0001 0.002
Mine Pit Dewatering Pump 4 100 1.00 24 500 hours 1 0.021 g/hp-hr 0.02 0.0002 0.005
Copper Concentrate Shipment Vehicles -- 450 1.00 19 6,795 hours 0.43 0.002 g/hp-hr 0.002 0.00001 0.005
Rosemont Copper ProjectEmission Inventory Information JBR ENVIRONMENTAL CONSULTANTS, INC.
November 2011Page H133
AZRP00315

Hourly Daily Annual 100% Sulfur Conversion - Year 5 Units lb/hr tpd tpy
Units Load Factor
SO2 Emission Factor
Table H.34 SO2 Emissions from Fuel Burning Mobile Engines - Year 5
SO2 Emissions - Year 5Fuel Burning Mobile Engine Description a
Fleet Size
HP Rating
Process Rates b - Year 5
Molybdenum Concentrate Shipment Vehicles -- 450 1.00 1 86 hours 0.43 0.124 g/hp-hr 0.12 0.00006 0.005
Sulfuric Acid Delivery Vehicles -- 450 1.00 6 2,081 hours 0.43 0.005 g/hp-hr 0.005 0.00001 0.005
Lime Delivery Vehicles -- 450 1.00 2 763 hours 0.43 0.014 g/hp-hr 0.01 0.00001 0.005
SAG Mill and Ball Mill Grinding Balls Delivery Vehicles -- 450 1.00 1 234 hours 0.43 0.045 g/hp-hr 0.05 0.00002 0.005
Diesel Fuel Delivery Vehicles -- 500 1.00 2 685 hours 0.43 0.016 g/hp-hr 0.02 0.00002 0.006
Copper Cathode Shipment Vehicles -- 450 1.00 1 200 hours 0.43 0.053 g/hp-hr 0.05 0.00003 0.005
Ammonium Nitrate Delivery Vehicles -- 450 1.00 1 255 hours 0.43 0.042 g/hp-hr 0.04 0.00002 0.005
Miscellaneous Consumables Delivery Vehicles -- 450 1.00 1 499 hours 0.43 0.021 g/hp-hr 0.02 0.00001 0.005
Miscellaneous Fuels and Lubricants Delivery Vehicles -- 450 1.00 1 44 hours 0.43 0.240 g/hp-hr 0.24 0.0001 0.005
Pickup Trucks (gasoline) 20 350 0.25 6 2,190 hours 0.54 0.017 g/hp-hr 0.003 0.00004 0.01
Crew Van (gasoline) 3 350 0.25 6 2,190 hours 0.54 0.0025 g/hp-hr 0.0005 0.000006 0.002
Lot Pick-Up Trucks (gasoline) 20 250 0.25 6 2,190 hours 0.54 0.017 g/hp-hr 0.002 0.00003 0.01
0.29 0.004 0.96
0.71 0.002 0.57
1.00 0.006 1.54
a Fuel burning mobile engines are diesel fuel fired unless otherwise noted.
b Except for the shipment and delivery vehicles, the process rates are for a single mobile engine. The process rates for the shipment and delivery vehicles are representative of the entire fleet.
Total Emissions from Haul Truck Engines:
Total Emissions from Other Mobile Engines:
Total Emissions from All Mobile Engines:
Rosemont Copper ProjectEmission Inventory Information JBR ENVIRONMENTAL CONSULTANTS, INC.
November 2011Page H134
AZRP00316

Hourly Daily AnnualTier 2/Tier 4 (Final) Emission Standards or Mobile 6 Output
Units lb/hr tpd tpy
Haulage Trucks, 250 tons 31 2,650 1.00 24 6,600 hours 0.32 0.30 g/hp-hr 17.39 0.21 57.38
Crawler Dozers, D11T Class 3 850 0.46 11 4,000 hours 0.575 0.14 g/hp-hr 0.21 0.002 0.91
Crawler Dozers, D10T Class 3 580 0.68 16 6,000 hours 0.575 0.14 g/hp-hr 0.21 0.003 0.93
Crawler Dozer, D8T Class 1 310 0.75 18 6,570 hours 0.575 0.14 g/hp-hr 0.04 0.0005 0.18
Rubber Tired Dozers, 834H Class 3 498 0.71 17 6,200 hours 0.575 0.14 g/hp-hr 0.19 0.002 0.82
Motor Graders, 24M Class 1 533 0.68 16 6,000 hours 0.575 0.14 g/hp-hr 0.06 0.0008 0.28
Motor Graders, 16M Class 3 297 0.46 11 4,000 hours 0.575 0.14 g/hp-hr 0.07 0.0009 0.32
Water Trucks, 30,000 gallons 4 1,348 0.45 11 3,250 hours 0.35 0.14 g/hp-hr 0.26 0.003 0.95
Diesel Blasthole Drill, 12.25 inches 2 1,500 0.75 18 6,570 hours 0.43 0.14 g/hp-hr 0.30 0.004 1.31
Hydraulic DML 45 Drill 1 425 0.75 18 6,570 hours 0.43 0.14 g/hp-hr 0.04 0.0005 0.19
Front End Loaders 2 2,000 0.90 22 7,884 hours 0.59 0.30 g/hp-hr 1.40 0.02 6.15
Stemming Truck 2 450 0.75 18 6,570 hours 0.43 0.14 g/hp-hr 0.09 0.001 0.39
ANFO/Slurry Truck, 20 tons 2 450 0.75 18 6,570 hours 0.43 0.14 g/hp-hr 0.09 0.001 0.39
Powder Truck, 2 tons 2 350 0.75 18 6,570 hours 0.43 0.14 g/hp-hr 0.07 0.0008 0.31
Front End Loaders, 8 yd3 2 262 0.75 18 6,570 hours 0.575 0.14 g/hp-hr 0.07 0.0008 0.31
Hydraulic Excavator, 385 Cat CL 2 513 0.90 22 7,884 hours 0.35 0.14 g/hp-hr 0.10 0.001 0.44
Backhoe/Loader, 2 yd3 1 124 0.75 18 6,570 hours 0.35 0.14 g/hp-hr 0.01 0.0001 0.04
Load Factor
VOC Emission Factor VOC Emissions - Year 5
Units
Table H.35 VOC Emissions from Fuel Burning Mobile Engines - Year 5
Fuel Burning Mobile Engine Description a
Fleet Size
HP Rating
Process Rates b - Year 5
Rosemont Copper ProjectEmission Inventory Information JBR ENVIRONMENTAL CONSULTANTS, INC.
November 2011Page H135
AZRP00317

Hourly Daily AnnualTier 2/Tier 4 (Final) Emission Standards or Mobile 6 Output
Units lb/hr tpd tpyLoad
Factor
VOC Emission Factor VOC Emissions - Year 5
Units
Table H.35 VOC Emissions from Fuel Burning Mobile Engines - Year 5
Fuel Burning Mobile Engine Description a
Fleet Size
HP Rating
Process Rates b - Year 5
All-Terrain Crane, 75 tons 1 230 0.75 18 6,570 hours 0.43 0.14 g/hp-hr 0.02 0.0003 0.10
Transporter with Tractor, 200 tons 1 1,350 0.75 18 6,570 hours 0.59 0.14 g/hp-hr 0.18 0.002 0.81
Fuel/Lube Trucks, 6,000 gallons 2 703 0.75 18 6,570 hours 0.35 0.14 g/hp-hr 0.11 0.001 0.50
Mechanic Field Service Trucks 5 370 1.71 41 15,000 VMT 0.43 0.403 g/mile 0.008 0.00009 0.03
Tire Handler 1 90 0.11 3 1,000 VMT 0.43 0.403 g/mile 0.0001 0.000001 0.0004
Shop Forklift, 12,000 lbs 1 90 0.75 18 6,570 hours 0.59 0.14 g/hp-hr 0.01 0.0001 0.05
Integrated Tool Carrier, 140 hp 1 138 0.75 18 6,570 hours 0.59 0.14 g/hp-hr 0.02 0.0002 0.08
Light Plant, 6 kW 15 35 0.40 10 3,504 hours 0.43 0.20 g/hp-hr 0.04 0.0005 0.17
Primary Crushing Mobile Crane - 400 tons 1 320 0.75 18 6,570 hours 0.43 0.14 g/hp-hr 0.03 0.0004 0.14
Copper Concentrate Area Front End Loader - Cat 930 1 160 0.75 18 6,570 hours 0.59 0.14 g/hp-hr 0.02 0.0003 0.10
Molybdenum Packaging Forklift, 7,000 lbs 1 93 0.75 18 6,570 hours 0.59 0.14 g/hp-hr 0.01 0.0002 0.06
Copper Cathode Forklift 1 93 0.75 18 6,570 hours 0.59 0.14 g/hp-hr 0.01 0.0002 0.06
Boom Trucks 10 tons, 45 foot boom 1 200 0.75 18 6,570 hours 0.21 0.14 g/hp-hr 0.01 0.0001 0.04
Boom Trucks 15 tons, 60 foot boom 1 210 0.75 18 6,570 hours 0.21 0.14 g/hp-hr 0.01 0.0001 0.04
Front End Loader, 6 yd3 1 349 0.75 18 6,570 hours 0.35 0.14 g/hp-hr 0.03 0.0003 0.12
Front End Loader, 5 yd3 1 149 0.75 18 6,570 hours 0.25 0.14 g/hp-hr 0.009 0.0001 0.04
Bob Cats, 2,400 lbs 2 82 0.75 18 6,570 hours 0.59 0.14 g/hp-hr 0.02 0.0003 0.10
Rosemont Copper ProjectEmission Inventory Information JBR ENVIRONMENTAL CONSULTANTS, INC.
November 2011Page H136
AZRP00318

Hourly Daily AnnualTier 2/Tier 4 (Final) Emission Standards or Mobile 6 Output
Units lb/hr tpd tpyLoad
Factor
VOC Emission Factor VOC Emissions - Year 5
Units
Table H.35 VOC Emissions from Fuel Burning Mobile Engines - Year 5
Fuel Burning Mobile Engine Description a
Fleet Size
HP Rating
Process Rates b - Year 5
Fork Lift, 2,000 lbs 1 50 0.75 18 6,570 hours 0.59 0.20 g/hp-hr 0.01 0.0001 0.04
Fork Lift, 5,000 lbs 1 63 0.75 18 6,570 hours 0.59 0.20 g/hp-hr 0.01 0.0001 0.05
Fork Lift, 3,000 lbs 2 50 0.75 18 6,570 hours 0.59 0.20 g/hp-hr 0.02 0.0002 0.09
Flat Bed Trucks, 10 tons 2 350 0.75 18 6,570 hours 0.43 0.14 g/hp-hr 0.07 0.0008 0.31
Dump Truck, 10 tons 1 250 0.34 8 3,000 VMT 0.43 0.403 g/mile 0.0003 0.000004 0.001
Mobile Hydraulic Crane, 60 tons 1 267 0.75 18 6,570 hours 0.43 0.14 g/hp-hr 0.03 0.0003 0.12
Truck Shop Bridge Crane, 60 tons 1 75 0.75 18 6,570 hours 0.43 0.14 g/hp-hr 0.007 0.00009 0.03
Truck Shop Bridge Crane, 25 tons 1 24 0.75 18 6,570 hours 0.43 0.60 g/hp-hr 0.01 0.0001 0.05
CS683 Soil Compactor / Roller 2 173 0.75 18 6,570 hours 0.4 0.14 g/hp-hr 0.03 0.0004 0.14
246C Skid Steer Loader 2 73 0.75 18 6,570 hours 0.3 0.20 g/hp-hr 0.01 0.0002 0.06
RH200/340 O & K Shovel / Hitachi EX5500 1 2,520 0.75 18 6,570 hours 0.59 0.14 g/hp-hr 0.34 0.004 1.51
Off-Road Tire Handling Truck 1 450 0.86 21 7,500 VMT 0.43 0.403 g/mile 0.0008 0.000009 0.003
Contractor Haul Trucks, 25 tons 2 511 2.74 66 24,000 VMT 0.43 0.403 g/mile 0.005 0.00006 0.02
Motivator for Mine Shovels 1 3,308 0.91 22 8,000 hours 0.43 0.14 g/hp-hr 0.40 0.005 1.76
Storm Water Pond Pump 1 200 1.00 24 500 hours 1 0.14 g/hp-hr 0.06 0.0007 0.02
Mine Pit Dewatering Pump 4 100 1.00 24 500 hours 1 0.14 g/hp-hr 0.12 0.001 0.03
Copper Concentrate Shipment Vehicles -- 450 29.60 1,021 169,872 VMT 0.43 0.403 g/mile 0.03 0.0005 0.08
Rosemont Copper ProjectEmission Inventory Information JBR ENVIRONMENTAL CONSULTANTS, INC.
November 2011Page H137
AZRP00319

Hourly Daily AnnualTier 2/Tier 4 (Final) Emission Standards or Mobile 6 Output
Units lb/hr tpd tpyLoad
Factor
VOC Emission Factor VOC Emissions - Year 5
Units
Table H.35 VOC Emissions from Fuel Burning Mobile Engines - Year 5
Fuel Burning Mobile Engine Description a
Fleet Size
HP Rating
Process Rates b - Year 5
Molybdenum Concentrate Shipment Vehicles -- 450 7.40 15 2,145 VMT 0.43 0.403 g/mile 0.007 0.000007 0.001
Sulfuric Acid Delivery Vehicles -- 450 22.20 143 52,021 VMT 0.43 0.403 g/mile 0.02 0.00006 0.02
Lime Delivery Vehicles -- 450 14.80 52 19,072 VMT 0.43 0.403 g/mile 0.01 0.00002 0.008
SAG Mill and Ball Mill Grinding Balls Delivery Vehicles -- 450 14.80 23 5,858 VMT 0.43 0.403 g/mile 0.01 0.00001 0.003
Diesel Fuel Delivery Vehicles -- 500 14.80 47 17,136 VMT 0.43 0.403 g/mile 0.01 0.00002 0.008
Copper Cathode Shipment Vehicles -- 450 14.80 42 4,997 VMT 0.43 0.403 g/mile 0.01 0.00002 0.002
Ammonium Nitrate Delivery Vehicles -- 450 7.40 25 6,384 VMT 0.43 0.403 g/mile 0.007 0.00001 0.003
Miscellaneous Consumables Delivery Vehicles -- 450 7.40 48 12,486 VMT 0.43 0.403 g/mile 0.007 0.00002 0.006
Miscellaneous Fuels and Lubricants Delivery Vehicles -- 450 7.40 7 1,110 VMT 0.43 0.403 g/mile 0.007 0.000003 0.0005
Pickup Trucks (gasoline) 20 350 1.37 33 12,000 VMT 0.54 1.329 g/mile 0.08 0.001 0.35
Crew Van (gasoline) 3 350 0.91 22 8,000 VMT 0.54 1.329 g/mile 0.008 0.0001 0.04
Lot Pick-Up Trucks (gasoline) 20 250 0.34 8 3,000 VMT 0.54 1.329 g/mile 0.02 0.0002 0.09
17.39 0.21 57.38
5.15 0.06 21.17
22.53 0.27 78.55
a Fuel burning mobile engines are diesel fuel fired unless otherwise noted.
b Except for the shipment and delivery vehicles, the process rates are for a single mobile engine. The process rates for the shipment and delivery vehicles are representative of the entire fleet.
Total Emissions from Haul Truck Engines:
Total Emissions from Other Mobile Engines:
Total Emissions from All Mobile Engines:
Rosemont Copper ProjectEmission Inventory Information JBR ENVIRONMENTAL CONSULTANTS, INC.
November 2011Page H138
AZRP00320

Hourly Daily Annual 99% Conversion(g/hp-hr) Units lb/hr tpd tpy
Haulage Trucks, 250 tons 31 2,650 1.00 24 6,600 hours 0.32 497 g/hp-hr 28,820.00 345.84 95,105.99
Crawler Dozers, D11T Class 3 850 0.46 11 4,000 hours 0.575 497 g/hp-hr 734.01 8.81 3,214.95
Crawler Dozers, D10T Class 3 580 0.68 16 6,000 hours 0.575 497 g/hp-hr 751.28 9.02 3,290.60
Crawler Dozer, D8T Class 1 310 0.75 18 6,570 hours 0.575 497 g/hp-hr 146.56 1.76 641.95
Rubber Tired Dozers, 834H Class 3 498 0.71 17 6,200 hours 0.575 497 g/hp-hr 666.56 8.00 2,919.55
Motor Graders, 24M Class 1 533 0.68 16 6,000 hours 0.575 497 g/hp-hr 230.13 2.76 1,007.98
Motor Graders, 16M Class 3 297 0.46 11 4,000 hours 0.575 497 g/hp-hr 256.47 3.08 1,123.34
Water Trucks, 30,000 gallons 4 1,348 0.45 11 3,250 hours 0.35 497 g/hp-hr 921.12 11.05 3,362.08
Diesel Blasthole Drill, 12.25 inches 2 1,500 0.75 18 6,570 hours 0.43 497 g/hp-hr 1,060.69 12.73 4,645.81
Hydraulic DML 45 Drill 1 425 0.75 18 6,570 hours 0.43 497 g/hp-hr 150.26 1.80 658.16
Front End Loaders 2 2,000 0.90 22 7,884 hours 0.59 497 g/hp-hr 2,328.58 27.94 10,199.17
Stemming Truck 2 450 0.75 18 6,570 hours 0.43 497 g/hp-hr 318.21 3.82 1,393.74
ANFO/Slurry Truck, 20 tons 2 450 0.75 18 6,570 hours 0.43 497 g/hp-hr 318.21 3.82 1,393.74
Powder Truck, 2 tons 2 350 0.75 18 6,570 hours 0.43 497 g/hp-hr 247.49 2.97 1,084.02
Front End Loaders, 8 yd3 2 262 0.75 18 6,570 hours 0.575 497 g/hp-hr 247.74 2.97 1,085.10
Hydraulic Excavator, 385 Cat CL 2 513 0.90 22 7,884 hours 0.35 497 g/hp-hr 354.32 4.25 1,551.92
Backhoe/Loader, 2 yd3 1 124 0.75 18 6,570 hours 0.35 497 g/hp-hr 35.69 0.43 156.30
Load Factor
CO2 Emission Factor CO2 Emissions - Year 5
Units
Table H.36 CO2 Emissions from Fuel Burning Mobile Engines - Year 5
Fuel Burning Mobile Engine Description a
Fleet Size
HP Rating
Process Rates b - Year 5
Rosemont Copper ProjectEmission Inventory Information JBR ENVIRONMENTAL CONSULTANTS, INC.
November 2011Page H139
AZRP00321
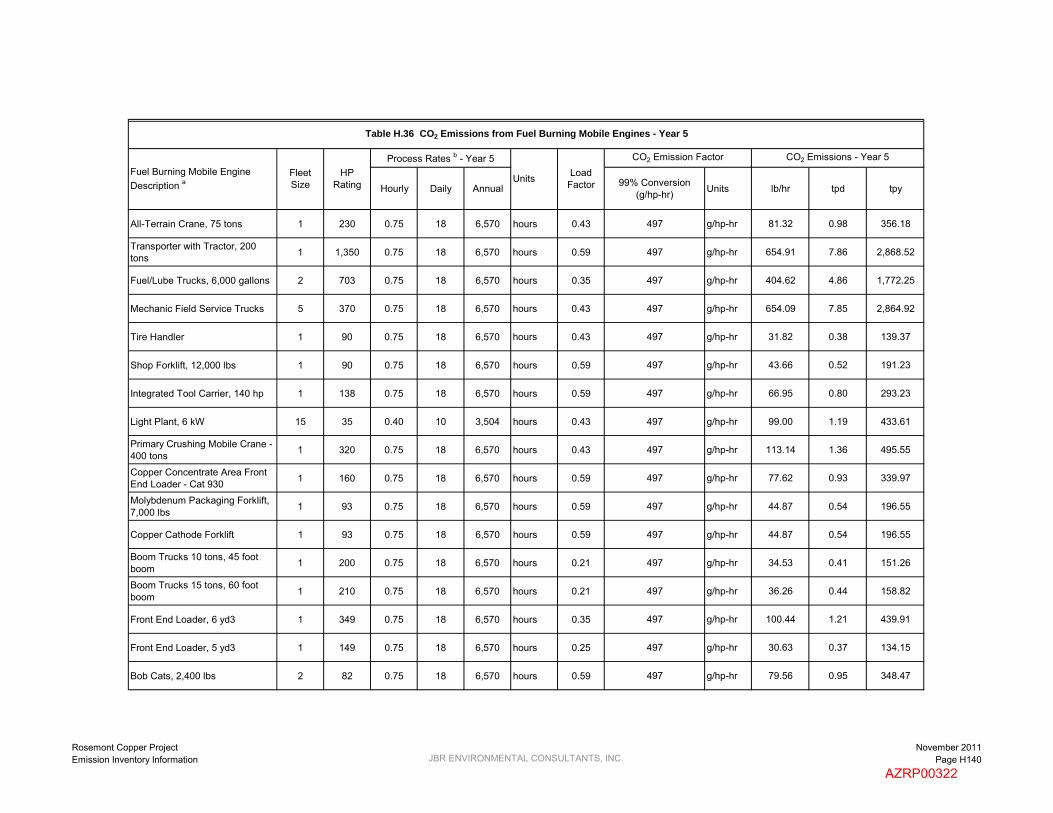
Hourly Daily Annual 99% Conversion(g/hp-hr) Units lb/hr tpd tpy
Load Factor
CO2 Emission Factor CO2 Emissions - Year 5
Units
Table H.36 CO2 Emissions from Fuel Burning Mobile Engines - Year 5
Fuel Burning Mobile Engine Description a
Fleet Size
HP Rating
Process Rates b - Year 5
All-Terrain Crane, 75 tons 1 230 0.75 18 6,570 hours 0.43 497 g/hp-hr 81.32 0.98 356.18
Transporter with Tractor, 200 tons 1 1,350 0.75 18 6,570 hours 0.59 497 g/hp-hr 654.91 7.86 2,868.52
Fuel/Lube Trucks, 6,000 gallons 2 703 0.75 18 6,570 hours 0.35 497 g/hp-hr 404.62 4.86 1,772.25
Mechanic Field Service Trucks 5 370 0.75 18 6,570 hours 0.43 497 g/hp-hr 654.09 7.85 2,864.92
Tire Handler 1 90 0.75 18 6,570 hours 0.43 497 g/hp-hr 31.82 0.38 139.37
Shop Forklift, 12,000 lbs 1 90 0.75 18 6,570 hours 0.59 497 g/hp-hr 43.66 0.52 191.23
Integrated Tool Carrier, 140 hp 1 138 0.75 18 6,570 hours 0.59 497 g/hp-hr 66.95 0.80 293.23
Light Plant, 6 kW 15 35 0.40 10 3,504 hours 0.43 497 g/hp-hr 99.00 1.19 433.61
Primary Crushing Mobile Crane - 400 tons 1 320 0.75 18 6,570 hours 0.43 497 g/hp-hr 113.14 1.36 495.55
Copper Concentrate Area Front End Loader - Cat 930 1 160 0.75 18 6,570 hours 0.59 497 g/hp-hr 77.62 0.93 339.97
Molybdenum Packaging Forklift, 7,000 lbs 1 93 0.75 18 6,570 hours 0.59 497 g/hp-hr 44.87 0.54 196.55
Copper Cathode Forklift 1 93 0.75 18 6,570 hours 0.59 497 g/hp-hr 44.87 0.54 196.55
Boom Trucks 10 tons, 45 foot boom 1 200 0.75 18 6,570 hours 0.21 497 g/hp-hr 34.53 0.41 151.26
Boom Trucks 15 tons, 60 foot boom 1 210 0.75 18 6,570 hours 0.21 497 g/hp-hr 36.26 0.44 158.82
Front End Loader, 6 yd3 1 349 0.75 18 6,570 hours 0.35 497 g/hp-hr 100.44 1.21 439.91
Front End Loader, 5 yd3 1 149 0.75 18 6,570 hours 0.25 497 g/hp-hr 30.63 0.37 134.15
Bob Cats, 2,400 lbs 2 82 0.75 18 6,570 hours 0.59 497 g/hp-hr 79.56 0.95 348.47
Rosemont Copper ProjectEmission Inventory Information JBR ENVIRONMENTAL CONSULTANTS, INC.
November 2011Page H140
AZRP00322
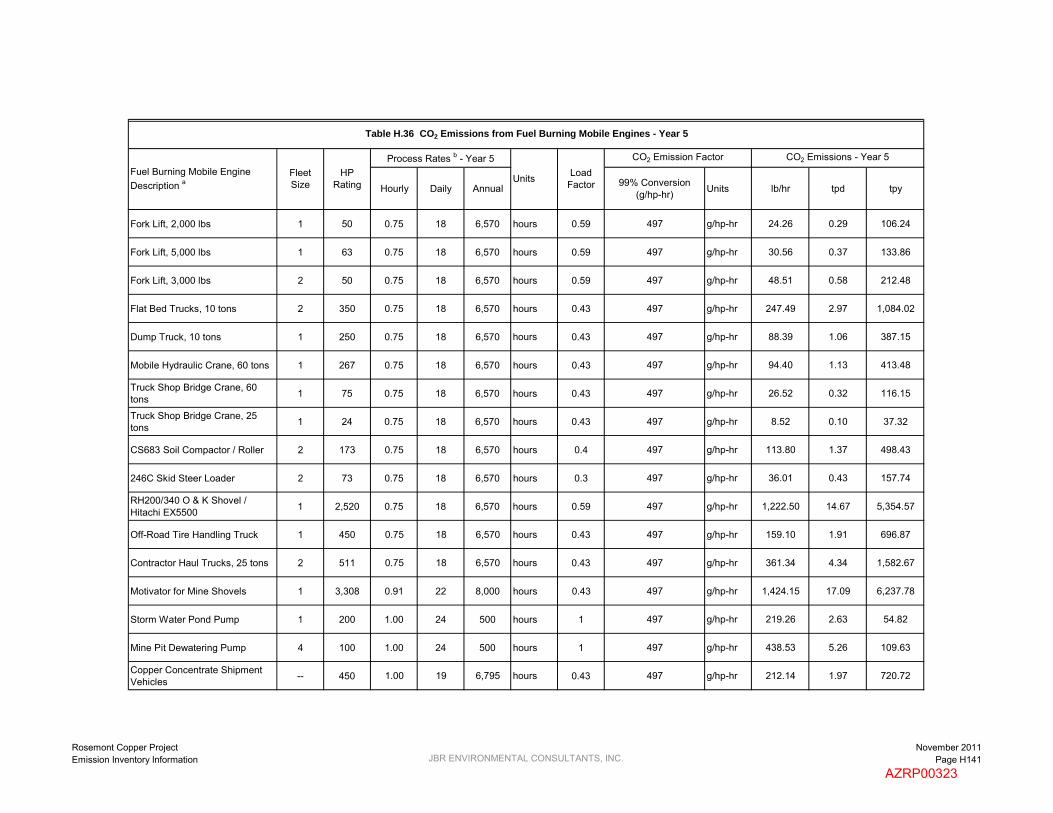
Hourly Daily Annual 99% Conversion(g/hp-hr) Units lb/hr tpd tpy
Load Factor
CO2 Emission Factor CO2 Emissions - Year 5
Units
Table H.36 CO2 Emissions from Fuel Burning Mobile Engines - Year 5
Fuel Burning Mobile Engine Description a
Fleet Size
HP Rating
Process Rates b - Year 5
Fork Lift, 2,000 lbs 1 50 0.75 18 6,570 hours 0.59 497 g/hp-hr 24.26 0.29 106.24
Fork Lift, 5,000 lbs 1 63 0.75 18 6,570 hours 0.59 497 g/hp-hr 30.56 0.37 133.86
Fork Lift, 3,000 lbs 2 50 0.75 18 6,570 hours 0.59 497 g/hp-hr 48.51 0.58 212.48
Flat Bed Trucks, 10 tons 2 350 0.75 18 6,570 hours 0.43 497 g/hp-hr 247.49 2.97 1,084.02
Dump Truck, 10 tons 1 250 0.75 18 6,570 hours 0.43 497 g/hp-hr 88.39 1.06 387.15
Mobile Hydraulic Crane, 60 tons 1 267 0.75 18 6,570 hours 0.43 497 g/hp-hr 94.40 1.13 413.48
Truck Shop Bridge Crane, 60 tons 1 75 0.75 18 6,570 hours 0.43 497 g/hp-hr 26.52 0.32 116.15
Truck Shop Bridge Crane, 25 tons 1 24 0.75 18 6,570 hours 0.43 497 g/hp-hr 8.52 0.10 37.32
CS683 Soil Compactor / Roller 2 173 0.75 18 6,570 hours 0.4 497 g/hp-hr 113.80 1.37 498.43
246C Skid Steer Loader 2 73 0.75 18 6,570 hours 0.3 497 g/hp-hr 36.01 0.43 157.74
RH200/340 O & K Shovel / Hitachi EX5500 1 2,520 0.75 18 6,570 hours 0.59 497 g/hp-hr 1,222.50 14.67 5,354.57
Off-Road Tire Handling Truck 1 450 0.75 18 6,570 hours 0.43 497 g/hp-hr 159.10 1.91 696.87
Contractor Haul Trucks, 25 tons 2 511 0.75 18 6,570 hours 0.43 497 g/hp-hr 361.34 4.34 1,582.67
Motivator for Mine Shovels 1 3,308 0.91 22 8,000 hours 0.43 497 g/hp-hr 1,424.15 17.09 6,237.78
Storm Water Pond Pump 1 200 1.00 24 500 hours 1 497 g/hp-hr 219.26 2.63 54.82
Mine Pit Dewatering Pump 4 100 1.00 24 500 hours 1 497 g/hp-hr 438.53 5.26 109.63
Copper Concentrate Shipment Vehicles -- 450 1.00 19 6,795 hours 0.43 497 g/hp-hr 212.14 1.97 720.72
Rosemont Copper ProjectEmission Inventory Information JBR ENVIRONMENTAL CONSULTANTS, INC.
November 2011Page H141
AZRP00323
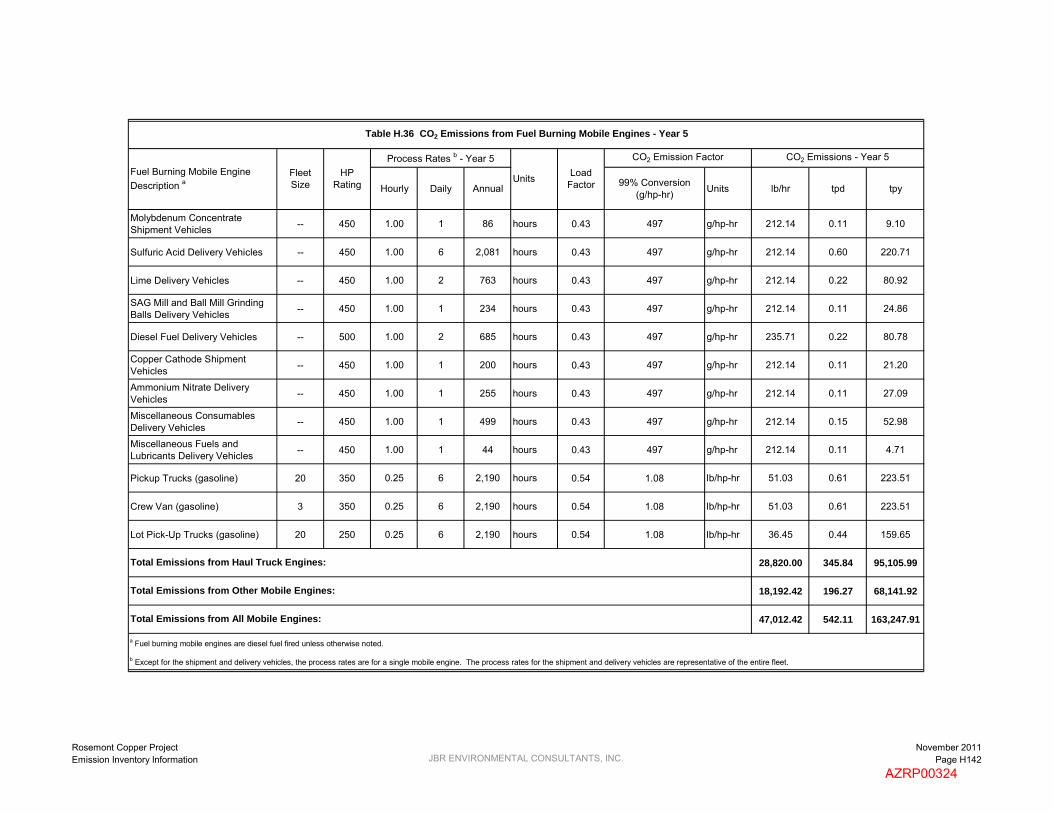
Hourly Daily Annual 99% Conversion(g/hp-hr) Units lb/hr tpd tpy
Load Factor
CO2 Emission Factor CO2 Emissions - Year 5
Units
Table H.36 CO2 Emissions from Fuel Burning Mobile Engines - Year 5
Fuel Burning Mobile Engine Description a
Fleet Size
HP Rating
Process Rates b - Year 5
Molybdenum Concentrate Shipment Vehicles -- 450 1.00 1 86 hours 0.43 497 g/hp-hr 212.14 0.11 9.10
Sulfuric Acid Delivery Vehicles -- 450 1.00 6 2,081 hours 0.43 497 g/hp-hr 212.14 0.60 220.71
Lime Delivery Vehicles -- 450 1.00 2 763 hours 0.43 497 g/hp-hr 212.14 0.22 80.92
SAG Mill and Ball Mill Grinding Balls Delivery Vehicles -- 450 1.00 1 234 hours 0.43 497 g/hp-hr 212.14 0.11 24.86
Diesel Fuel Delivery Vehicles -- 500 1.00 2 685 hours 0.43 497 g/hp-hr 235.71 0.22 80.78
Copper Cathode Shipment Vehicles -- 450 1.00 1 200 hours 0.43 497 g/hp-hr 212.14 0.11 21.20
Ammonium Nitrate Delivery Vehicles -- 450 1.00 1 255 hours 0.43 497 g/hp-hr 212.14 0.11 27.09
Miscellaneous Consumables Delivery Vehicles -- 450 1.00 1 499 hours 0.43 497 g/hp-hr 212.14 0.15 52.98
Miscellaneous Fuels and Lubricants Delivery Vehicles -- 450 1.00 1 44 hours 0.43 497 g/hp-hr 212.14 0.11 4.71
Pickup Trucks (gasoline) 20 350 0.25 6 2,190 hours 0.54 1.08 lb/hp-hr 51.03 0.61 223.51
Crew Van (gasoline) 3 350 0.25 6 2,190 hours 0.54 1.08 lb/hp-hr 51.03 0.61 223.51
Lot Pick-Up Trucks (gasoline) 20 250 0.25 6 2,190 hours 0.54 1.08 lb/hp-hr 36.45 0.44 159.65
28,820.00 345.84 95,105.99
18,192.42 196.27 68,141.92
47,012.42 542.11 163,247.91
a Fuel burning mobile engines are diesel fuel fired unless otherwise noted.
b Except for the shipment and delivery vehicles, the process rates are for a single mobile engine. The process rates for the shipment and delivery vehicles are representative of the entire fleet.
Total Emissions from Haul Truck Engines:
Total Emissions from Other Mobile Engines:
Total Emissions from All Mobile Engines:
Rosemont Copper ProjectEmission Inventory Information JBR ENVIRONMENTAL CONSULTANTS, INC.
November 2011Page H142
AZRP00324

Hourly Daily Annual 2% Sulfur Conversion - Year 5 Units lb/hr tpd tpy
Haulage Trucks, 250 tons 31 2,650 1.00 24 6,600 hours 0.32 0.00003 g/hp-hr 0.006 0.00007 0.02
Crawler Dozers, D11T Class 3 850 0.46 11 4,000 hours 0.575 0.00005 g/hp-hr 0.0001 0.000002 0.0006
Crawler Dozers, D10T Class 3 580 0.68 16 6,000 hours 0.575 0.00004 g/hp-hr 0.00009 0.000001 0.0004
Crawler Dozer, D8T Class 1 310 0.75 18 6,570 hours 0.575 0.00003 g/hp-hr 0.00002 0.0000002 0.00007
Rubber Tired Dozers, 834H Class 3 498 0.71 17 6,200 hours 0.575 0.00003 g/hp-hr 0.00008 0.000001 0.0004
Motor Graders, 24M Class 1 533 0.68 16 6,000 hours 0.575 0.00004 g/hp-hr 0.00003 0.0000003 0.0001
Motor Graders, 16M Class 3 297 0.46 11 4,000 hours 0.575 0.00005 g/hp-hr 0.00005 0.0000006 0.0002
Water Trucks, 30,000 gallons 4 1,348 0.45 11 3,250 hours 0.35 0.00007 g/hp-hr 0.0003 0.000004 0.001
Diesel Blasthole Drill, 12.25 inches 2 1,500 0.75 18 6,570 hours 0.43 0.00003 g/hp-hr 0.0002 0.000002 0.0007
Hydraulic DML 45 Drill 1 425 0.75 18 6,570 hours 0.43 0.00003 g/hp-hr 0.00002 0.0000003 0.0001
Front End Loaders 2 2,000 0.90 22 7,884 hours 0.59 0.00003 g/hp-hr 0.0002 0.000003 0.0009
Stemming Truck 2 450 0.75 18 6,570 hours 0.43 0.00003 g/hp-hr 0.00005 0.0000006 0.0002
ANFO/Slurry Truck, 20 tons 2 450 0.75 18 6,570 hours 0.43 0.00003 g/hp-hr 0.00005 0.0000006 0.0002
Powder Truck, 2 tons 2 350 0.75 18 6,570 hours 0.43 0.00003 g/hp-hr 0.00004 0.0000005 0.0002
Front End Loaders, 8 yd3 2 262 0.75 18 6,570 hours 0.575 0.00003 g/hp-hr 0.00003 0.0000003 0.0001
Hydraulic Excavator, 385 Cat CL 2 513 0.90 22 7,884 hours 0.35 0.00003 g/hp-hr 0.00005 0.0000007 0.0002
Backhoe/Loader, 2 yd3 1 124 0.75 18 6,570 hours 0.35 0.00003 g/hp-hr 0.000007 0.00000008 0.00003
Units Load Factor
SO4 Emission Factor
Table H.37 SO4 Emissions from Fuel Burning Mobile Engines (Diesel Engines Only) - Year 5
SO4 Emissions - Year 5Fuel Burning Mobile Engine Description a
Fleet Size
HP Rating
Process Rates b - Year 5
Rosemont Copper ProjectEmission Inventory Information JBR ENVIRONMENTAL CONSULTANTS, INC.
November 2011Page H143
AZRP00325

Hourly Daily Annual 2% Sulfur Conversion - Year 5 Units lb/hr tpd tpy
Units Load Factor
SO4 Emission Factor
Table H.37 SO4 Emissions from Fuel Burning Mobile Engines (Diesel Engines Only) - Year 5
SO4 Emissions - Year 5Fuel Burning Mobile Engine Description a
Fleet Size
HP Rating
Process Rates b - Year 5
All-Terrain Crane, 75 tons 1 230 0.75 18 6,570 hours 0.43 0.00003 g/hp-hr 0.00001 0.0000001 0.00005
Transporter with Tractor, 200 tons 1 1,350 0.75 18 6,570 hours 0.59 0.00003 g/hp-hr 0.00007 0.0000009 0.0003
Fuel/Lube Trucks, 6,000 gallons 2 703 0.75 18 6,570 hours 0.35 0.00003 g/hp-hr 0.00008 0.0000009 0.0003
Mechanic Field Service Trucks 5 370 0.75 18 6,570 hours 0.43 0.00003 g/hp-hr 0.0001 0.000001 0.0004
Tire Handler 1 90 0.75 18 6,570 hours 0.43 0.00003 g/hp-hr 0.000005 0.00000006 0.00002
Shop Forklift, 12,000 lbs 1 90 0.75 18 6,570 hours 0.59 0.00003 g/hp-hr 0.000005 0.00000006 0.00002
Integrated Tool Carrier, 140 hp 1 138 0.75 18 6,570 hours 0.59 0.00003 g/hp-hr 0.000007 0.00000009 0.00003
Light Plant, 6 kW 15 35 0.40 10 3,504 hours 0.43 0.00006 g/hp-hr 0.00003 0.0000003 0.0001
Primary Crushing Mobile Crane - 400 tons 1 320 0.75 18 6,570 hours 0.43 0.00003 g/hp-hr 0.00002 0.0000002 0.00008
Copper Concentrate Area Front End Loader - Cat 930 1 160 0.75 18 6,570 hours 0.59 0.00003 g/hp-hr 0.000009 0.0000001 0.00004
Molybdenum Packaging Forklift, 7,000 lbs 1 93 0.75 18 6,570 hours 0.59 0.00003 g/hp-hr 0.000005 0.00000006 0.00002
Copper Cathode Forklift 1 93 0.75 18 6,570 hours 0.59 0.00003 g/hp-hr 0.000005 0.00000006 0.00002
Boom Trucks 10 tons, 45 foot boom 1 200 0.75 18 6,570 hours 0.21 0.00003 g/hp-hr 0.00001 0.0000001 0.00005
Boom Trucks 15 tons, 60 foot boom 1 210 0.75 18 6,570 hours 0.21 0.00003 g/hp-hr 0.00001 0.0000001 0.00005
Front End Loader, 6 yd3 1 349 0.75 18 6,570 hours 0.35 0.00003 g/hp-hr 0.00002 0.0000002 0.00008
Front End Loader, 5 yd3 1 149 0.75 18 6,570 hours 0.25 0.00003 g/hp-hr 0.000008 0.0000001 0.00003
Bob Cats, 2,400 lbs 2 82 0.75 18 6,570 hours 0.59 0.00003 g/hp-hr 0.000009 0.0000001 0.00004
Rosemont Copper ProjectEmission Inventory Information JBR ENVIRONMENTAL CONSULTANTS, INC.
November 2011Page H144
AZRP00326

Hourly Daily Annual 2% Sulfur Conversion - Year 5 Units lb/hr tpd tpy
Units Load Factor
SO4 Emission Factor
Table H.37 SO4 Emissions from Fuel Burning Mobile Engines (Diesel Engines Only) - Year 5
SO4 Emissions - Year 5Fuel Burning Mobile Engine Description a
Fleet Size
HP Rating
Process Rates b - Year 5
Fork Lift, 2,000 lbs 1 50 0.75 18 6,570 hours 0.59 0.00003 g/hp-hr 0.000003 0.00000003 0.00001
Fork Lift, 5,000 lbs 1 63 0.75 18 6,570 hours 0.59 0.00003 g/hp-hr 0.000003 0.00000004 0.00001
Fork Lift, 3,000 lbs 2 50 0.75 18 6,570 hours 0.59 0.00003 g/hp-hr 0.000005 0.00000006 0.00002
Flat Bed Trucks, 10 tons 2 350 0.75 18 6,570 hours 0.43 0.00003 g/hp-hr 0.00004 0.0000005 0.0002
Dump Truck, 10 tons 1 250 0.75 18 6,570 hours 0.43 0.00003 g/hp-hr 0.00001 0.0000002 0.00006
Mobile Hydraulic Crane, 60 tons 1 267 0.75 18 6,570 hours 0.43 0.00003 g/hp-hr 0.00001 0.0000002 0.00006
Truck Shop Bridge Crane, 60 tons 1 75 0.75 18 6,570 hours 0.43 0.00003 g/hp-hr 0.000004 0.00000005 0.00002
Truck Shop Bridge Crane, 25 tons 1 24 0.75 18 6,570 hours 0.43 0.00003 g/hp-hr 0.000001 0.00000002 0.000006
CS683 Soil Compactor / Roller 2 173 0.75 18 6,570 hours 0.40 0.00003 g/hp-hr 0.00002 0.0000002 0.00008
246C Skid Steer Loader 2 73 0.75 18 6,570 hours 0.3 0.00003 g/hp-hr 0.000008 0.00000009 0.00003
RH200/340 O & K Shovel / Hitachi EX5500 1 2,520 0.75 18 6,570 hours 0.59 0.00003 g/hp-hr 0.0001 0.000002 0.0006
Off-Road Tire Handling Truck 1 450 0.75 18 6,570 hours 0.43 0.00003 g/hp-hr 0.00002 0.0000003 0.0001
Contractor Haul Trucks, 25 tons 2 511 0.75 18 6,570 hours 0.43 0.00003 g/hp-hr 0.00005 0.0000007 0.0002
Motivator for Mine Shovels 1 3,308 0.91 22 8,000 hours 0.43 0.00003 g/hp-hr 0.0002 0.000002 0.0008
Storm Water Pond Pump 1 200 1.00 24 500 hours 1 0.0004 g/hp-hr 0.0002 0.000002 0.00005
Mine Pit Dewatering Pump 4 100 1.00 24 500 hours 1 0.0004 g/hp-hr 0.0004 0.000005 0.00009
Copper Concentrate Shipment Vehicles -- 450 1.00 19 6,795 hours 0.43 0.00003 g/hp-hr 0.00003 0.0000003 0.0001
Rosemont Copper ProjectEmission Inventory Information JBR ENVIRONMENTAL CONSULTANTS, INC.
November 2011Page H145
AZRP00327
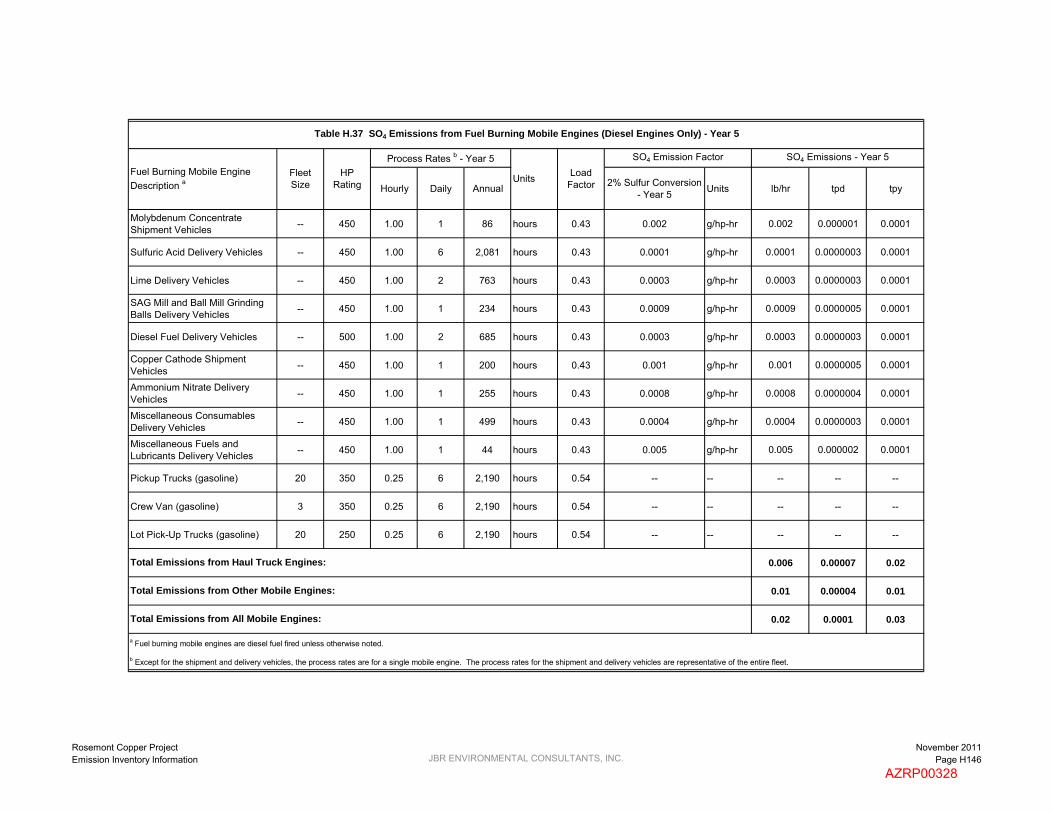
Hourly Daily Annual 2% Sulfur Conversion - Year 5 Units lb/hr tpd tpy
Units Load Factor
SO4 Emission Factor
Table H.37 SO4 Emissions from Fuel Burning Mobile Engines (Diesel Engines Only) - Year 5
SO4 Emissions - Year 5Fuel Burning Mobile Engine Description a
Fleet Size
HP Rating
Process Rates b - Year 5
Molybdenum Concentrate Shipment Vehicles -- 450 1.00 1 86 hours 0.43 0.002 g/hp-hr 0.002 0.000001 0.0001
Sulfuric Acid Delivery Vehicles -- 450 1.00 6 2,081 hours 0.43 0.0001 g/hp-hr 0.0001 0.0000003 0.0001
Lime Delivery Vehicles -- 450 1.00 2 763 hours 0.43 0.0003 g/hp-hr 0.0003 0.0000003 0.0001
SAG Mill and Ball Mill Grinding Balls Delivery Vehicles -- 450 1.00 1 234 hours 0.43 0.0009 g/hp-hr 0.0009 0.0000005 0.0001
Diesel Fuel Delivery Vehicles -- 500 1.00 2 685 hours 0.43 0.0003 g/hp-hr 0.0003 0.0000003 0.0001
Copper Cathode Shipment Vehicles -- 450 1.00 1 200 hours 0.43 0.001 g/hp-hr 0.001 0.0000005 0.0001
Ammonium Nitrate Delivery Vehicles -- 450 1.00 1 255 hours 0.43 0.0008 g/hp-hr 0.0008 0.0000004 0.0001
Miscellaneous Consumables Delivery Vehicles -- 450 1.00 1 499 hours 0.43 0.0004 g/hp-hr 0.0004 0.0000003 0.0001
Miscellaneous Fuels and Lubricants Delivery Vehicles -- 450 1.00 1 44 hours 0.43 0.005 g/hp-hr 0.005 0.000002 0.0001
Pickup Trucks (gasoline) 20 350 0.25 6 2,190 hours 0.54 -- -- -- -- --
Crew Van (gasoline) 3 350 0.25 6 2,190 hours 0.54 -- -- -- -- --
Lot Pick-Up Trucks (gasoline) 20 250 0.25 6 2,190 hours 0.54 -- -- -- -- --
0.006 0.00007 0.02
0.01 0.00004 0.01
0.02 0.0001 0.03
a Fuel burning mobile engines are diesel fuel fired unless otherwise noted.
b Except for the shipment and delivery vehicles, the process rates are for a single mobile engine. The process rates for the shipment and delivery vehicles are representative of the entire fleet.
Total Emissions from Haul Truck Engines:
Total Emissions from Other Mobile Engines:
Total Emissions from All Mobile Engines:
Rosemont Copper ProjectEmission Inventory Information JBR ENVIRONMENTAL CONSULTANTS, INC.
November 2011Page H146
AZRP00328
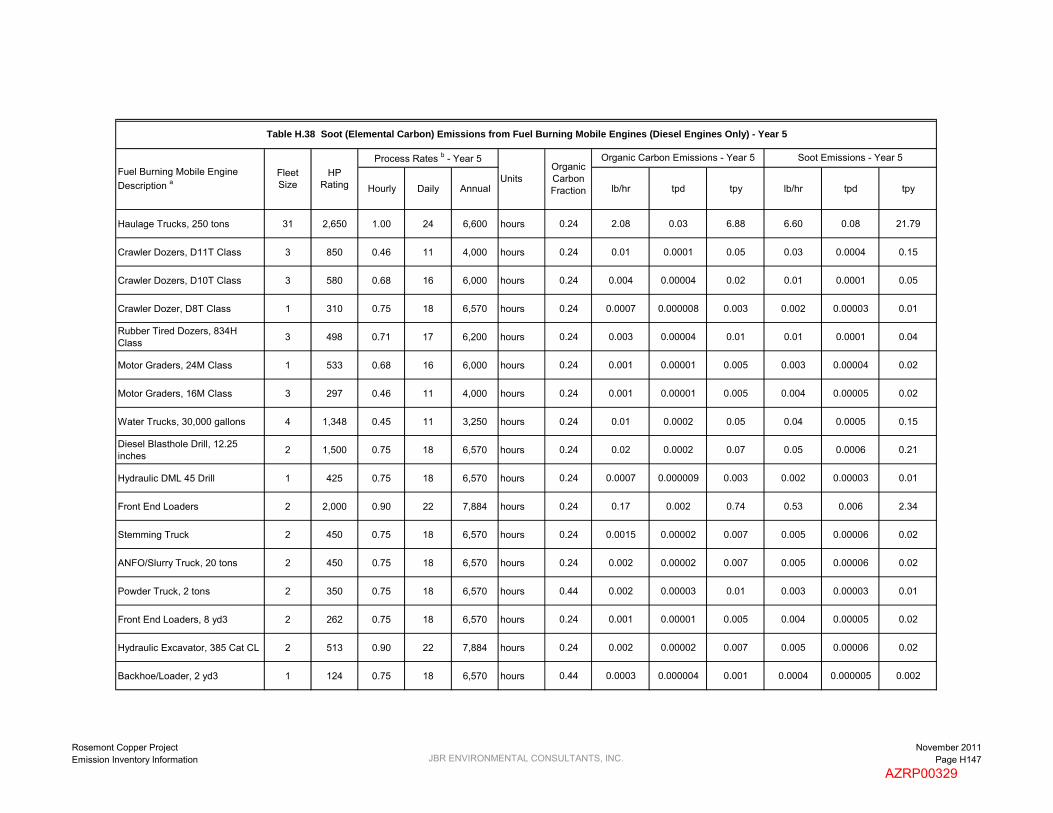
Hourly Daily Annual lb/hr tpd tpy lb/hr tpd tpy
Haulage Trucks, 250 tons 31 2,650 1.00 24 6,600 hours 0.24 2.08 0.03 6.88 6.60 0.08 21.79
Crawler Dozers, D11T Class 3 850 0.46 11 4,000 hours 0.24 0.01 0.0001 0.05 0.03 0.0004 0.15
Crawler Dozers, D10T Class 3 580 0.68 16 6,000 hours 0.24 0.004 0.00004 0.02 0.01 0.0001 0.05
Crawler Dozer, D8T Class 1 310 0.75 18 6,570 hours 0.24 0.0007 0.000008 0.003 0.002 0.00003 0.01
Rubber Tired Dozers, 834H Class 3 498 0.71 17 6,200 hours 0.24 0.003 0.00004 0.01 0.01 0.0001 0.04
Motor Graders, 24M Class 1 533 0.68 16 6,000 hours 0.24 0.001 0.00001 0.005 0.003 0.00004 0.02
Motor Graders, 16M Class 3 297 0.46 11 4,000 hours 0.24 0.001 0.00001 0.005 0.004 0.00005 0.02
Water Trucks, 30,000 gallons 4 1,348 0.45 11 3,250 hours 0.24 0.01 0.0002 0.05 0.04 0.0005 0.15
Diesel Blasthole Drill, 12.25 inches 2 1,500 0.75 18 6,570 hours 0.24 0.02 0.0002 0.07 0.05 0.0006 0.21
Hydraulic DML 45 Drill 1 425 0.75 18 6,570 hours 0.24 0.0007 0.000009 0.003 0.002 0.00003 0.01
Front End Loaders 2 2,000 0.90 22 7,884 hours 0.24 0.17 0.002 0.74 0.53 0.006 2.34
Stemming Truck 2 450 0.75 18 6,570 hours 0.24 0.0015 0.00002 0.007 0.005 0.00006 0.02
ANFO/Slurry Truck, 20 tons 2 450 0.75 18 6,570 hours 0.24 0.002 0.00002 0.007 0.005 0.00006 0.02
Powder Truck, 2 tons 2 350 0.75 18 6,570 hours 0.44 0.002 0.00003 0.01 0.003 0.00003 0.01
Front End Loaders, 8 yd3 2 262 0.75 18 6,570 hours 0.24 0.001 0.00001 0.005 0.004 0.00005 0.02
Hydraulic Excavator, 385 Cat CL 2 513 0.90 22 7,884 hours 0.24 0.002 0.00002 0.007 0.005 0.00006 0.02
Backhoe/Loader, 2 yd3 1 124 0.75 18 6,570 hours 0.44 0.0003 0.000004 0.001 0.0004 0.000005 0.002
Soot Emissions - Year 5
Table H.38 Soot (Elemental Carbon) Emissions from Fuel Burning Mobile Engines (Diesel Engines Only) - Year 5
Fuel Burning Mobile Engine Description a
Fleet Size
HP Rating
Process Rates b - Year 5
UnitsOrganic Carbon Fraction
Organic Carbon Emissions - Year 5
Rosemont Copper ProjectEmission Inventory Information JBR ENVIRONMENTAL CONSULTANTS, INC.
November 2011Page H147
AZRP00329

Hourly Daily Annual lb/hr tpd tpy lb/hr tpd tpy
Soot Emissions - Year 5
Table H.38 Soot (Elemental Carbon) Emissions from Fuel Burning Mobile Engines (Diesel Engines Only) - Year 5
Fuel Burning Mobile Engine Description a
Fleet Size
HP Rating
Process Rates b - Year 5
UnitsOrganic Carbon Fraction
Organic Carbon Emissions - Year 5
All-Terrain Crane, 75 tons 1 230 0.75 18 6,570 hours 0.24 0.0004 0.000005 0.002 0.001 0.00001 0.005
Transporter with Tractor, 200 tons 1 1,350 0.75 18 6,570 hours 0.24 0.009 0.0001 0.04 0.03 0.0004 0.13
Fuel/Lube Trucks, 6,000 gallons 2 703 0.75 18 6,570 hours 0.24 0.002 0.00002 0.008 0.006 0.00007 0.03
Mechanic Field Service Trucks 5 370 0.75 18 6,570 hours 0.44 0.002 0.00002 0.008 0.002 0.00003 0.01
Tire Handler 1 90 0.75 18 6,570 hours 0.51 0.00002 0.0000003 0.0001 0.00002 0.0000003 0.0001
Shop Forklift, 12,000 lbs 1 90 0.75 18 6,570 hours 0.51 0.0004 0.000005 0.002 0.0004 0.000005 0.002
Integrated Tool Carrier, 140 hp 1 138 0.75 18 6,570 hours 0.44 0.0006 0.000007 0.003 0.0007 0.000009 0.003
Light Plant, 6 kW 15 35 0.40 10 3,504 hours 0.5 0.002 0.00002 0.009 0.002 0.00002 0.009
Primary Crushing Mobile Crane - 400 tons 1 320 0.75 18 6,570 hours 0.24 0.0005 0.000007 0.002 0.002 0.00002 0.008
Copper Concentrate Area Front End Loader - Cat 930 1 160 0.75 18 6,570 hours 0.44 0.0007 0.000008 0.003 0.0009 0.00001 0.004
Molybdenum Packaging Forklift, 7,000 lbs 1 93 0.75 18 6,570 hours 0.51 0.0005 0.000005 0.002 0.0004 0.000005 0.002
Copper Cathode Forklift 1 93 0.75 18 6,570 hours 0.44 0.0004 0.000005 0.002 0.0005 0.000006 0.002
Boom Trucks 10 tons, 45 foot boom 1 200 0.75 18 6,570 hours 0.44 0.0003 0.000004 0.001 0.0004 0.000005 0.002
Boom Trucks 15 tons, 60 foot boom 1 210 0.75 18 6,570 hours 0.44 0.0003 0.000004 0.001 0.0004 0.000005 0.002
Front End Loader, 6 yd3 1 349 0.75 18 6,570 hours 0.24 0.0005 0.000006 0.002 0.002 0.00002 0.007
Front End Loader, 5 yd3 1 149 0.75 18 6,570 hours 0.44 0.0003 0.000003 0.001 0.0003 0.000004 0.001
Bob Cats, 2,400 lbs 2 82 0.75 18 6,570 hours 0.5 0.0008 0.00001 0.003 0.0008 0.00001 0.003
Rosemont Copper ProjectEmission Inventory Information JBR ENVIRONMENTAL CONSULTANTS, INC.
November 2011Page H148
AZRP00330
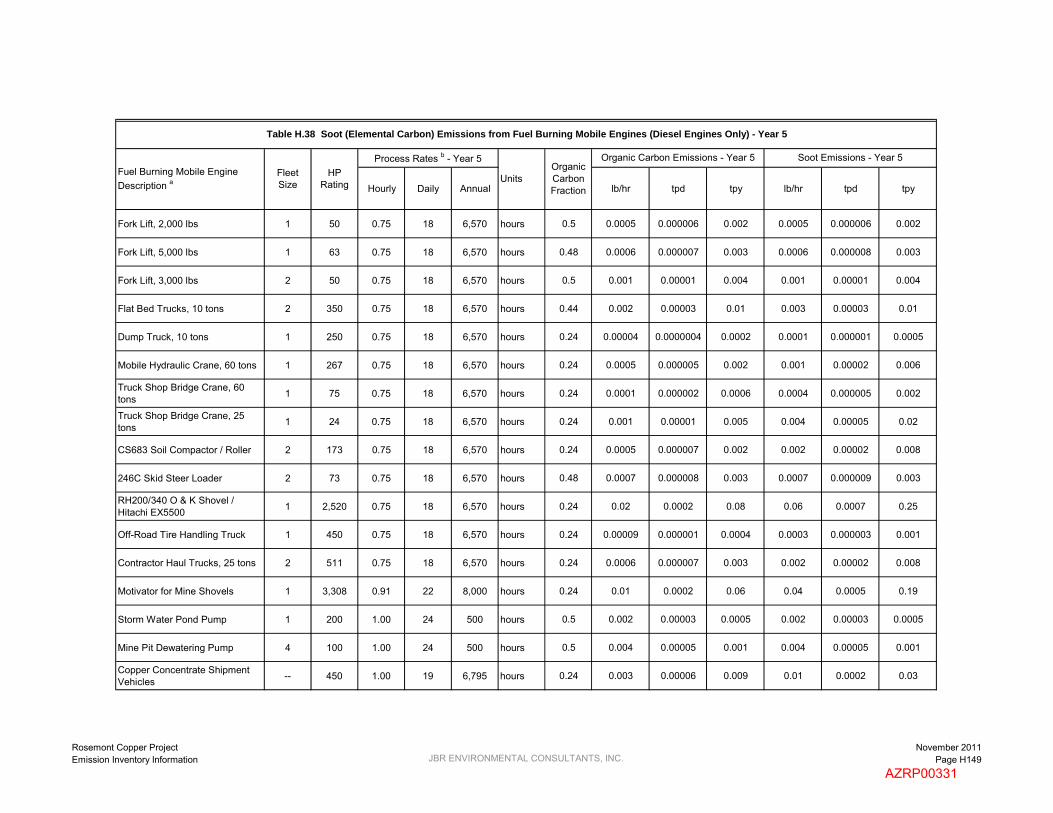
Hourly Daily Annual lb/hr tpd tpy lb/hr tpd tpy
Soot Emissions - Year 5
Table H.38 Soot (Elemental Carbon) Emissions from Fuel Burning Mobile Engines (Diesel Engines Only) - Year 5
Fuel Burning Mobile Engine Description a
Fleet Size
HP Rating
Process Rates b - Year 5
UnitsOrganic Carbon Fraction
Organic Carbon Emissions - Year 5
Fork Lift, 2,000 lbs 1 50 0.75 18 6,570 hours 0.5 0.0005 0.000006 0.002 0.0005 0.000006 0.002
Fork Lift, 5,000 lbs 1 63 0.75 18 6,570 hours 0.48 0.0006 0.000007 0.003 0.0006 0.000008 0.003
Fork Lift, 3,000 lbs 2 50 0.75 18 6,570 hours 0.5 0.001 0.00001 0.004 0.001 0.00001 0.004
Flat Bed Trucks, 10 tons 2 350 0.75 18 6,570 hours 0.44 0.002 0.00003 0.01 0.003 0.00003 0.01
Dump Truck, 10 tons 1 250 0.75 18 6,570 hours 0.24 0.00004 0.0000004 0.0002 0.0001 0.000001 0.0005
Mobile Hydraulic Crane, 60 tons 1 267 0.75 18 6,570 hours 0.24 0.0005 0.000005 0.002 0.001 0.00002 0.006
Truck Shop Bridge Crane, 60 tons 1 75 0.75 18 6,570 hours 0.24 0.0001 0.000002 0.0006 0.0004 0.000005 0.002
Truck Shop Bridge Crane, 25 tons 1 24 0.75 18 6,570 hours 0.24 0.001 0.00001 0.005 0.004 0.00005 0.02
CS683 Soil Compactor / Roller 2 173 0.75 18 6,570 hours 0.24 0.0005 0.000007 0.002 0.002 0.00002 0.008
246C Skid Steer Loader 2 73 0.75 18 6,570 hours 0.48 0.0007 0.000008 0.003 0.0007 0.000009 0.003
RH200/340 O & K Shovel / Hitachi EX5500 1 2,520 0.75 18 6,570 hours 0.24 0.02 0.0002 0.08 0.06 0.0007 0.25
Off-Road Tire Handling Truck 1 450 0.75 18 6,570 hours 0.24 0.00009 0.000001 0.0004 0.0003 0.000003 0.001
Contractor Haul Trucks, 25 tons 2 511 0.75 18 6,570 hours 0.24 0.0006 0.000007 0.003 0.002 0.00002 0.008
Motivator for Mine Shovels 1 3,308 0.91 22 8,000 hours 0.24 0.01 0.0002 0.06 0.04 0.0005 0.19
Storm Water Pond Pump 1 200 1.00 24 500 hours 0.5 0.002 0.00003 0.0005 0.002 0.00003 0.0005
Mine Pit Dewatering Pump 4 100 1.00 24 500 hours 0.5 0.004 0.00005 0.001 0.004 0.00005 0.001
Copper Concentrate Shipment Vehicles -- 450 1.00 19 6,795 hours 0.24 0.003 0.00006 0.009 0.01 0.0002 0.03
Rosemont Copper ProjectEmission Inventory Information JBR ENVIRONMENTAL CONSULTANTS, INC.
November 2011Page H149
AZRP00331

Hourly Daily Annual lb/hr tpd tpy lb/hr tpd tpy
Soot Emissions - Year 5
Table H.38 Soot (Elemental Carbon) Emissions from Fuel Burning Mobile Engines (Diesel Engines Only) - Year 5
Fuel Burning Mobile Engine Description a
Fleet Size
HP Rating
Process Rates b - Year 5
UnitsOrganic Carbon Fraction
Organic Carbon Emissions - Year 5
Molybdenum Concentrate Shipment Vehicles -- 450 1.00 1 86 hours 0.24 0.0002 0.0000006 0.00009 0.0008 0.000002 0.0003
Sulfuric Acid Delivery Vehicles -- 450 1.00 6 2,081 hours 0.24 0.002 0.000008 0.003 0.008 0.00003 0.009
Lime Delivery Vehicles -- 450 1.00 2 763 hours 0.24 0.002 0.000003 0.001 0.005 0.000009 0.003
SAG Mill and Ball Mill Grinding Balls Delivery Vehicles -- 450 1.00 1 234 hours 0.24 0.001 0.000001 0.0003 0.005 0.000004 0.001
Diesel Fuel Delivery Vehicles -- 500 1.00 2 685 hours 0.24 0.002 0.000003 0.0009 0.005 0.000008 0.003
Copper Cathode Shipment Vehicles -- 450 1.00 1 200 hours 0.24 0.001 0.000002 0.0003 0.004 0.000007 0.0008
Ammonium Nitrate Delivery Vehicles -- 450 1.00 1 255 hours 0.44 0.001 0.000002 0.0006 0.001 0.000003 0.0008
Miscellaneous Consumables Delivery Vehicles -- 450 1.00 1 499 hours 0.44 0.001 0.000005 0.001 0.002 0.000006 0.002
Miscellaneous Fuels and Lubricants Delivery Vehicles -- 450 1.00 1 44 hours 0.44 0.00 0.00 0.00 0.00 0.00 0.00
Pickup Trucks (gasoline) 20 350 0.25 6 2,190 hours -- -- -- -- -- -- --
Crew Van (gasoline) 3 350 0.25 6 2,190 hours -- -- -- -- -- -- --
Lot Pick-Up Trucks (gasoline) 20 250 0.25 6 2,190 hours -- -- -- -- -- -- --
6.60 0.08 21.79
0.92 0.01 3.86
7.53 0.09 25.65
a Fuel burning mobile engines are diesel fuel fired unless otherwise noted.
b Except for the shipment and delivery vehicles, the process rates are for a single mobile engine. The process rates for the shipment and delivery vehicles are representative of the entire fleet.
Total Emissions from Haul Truck Engines:
Total Emissions from Other Mobile Engines:
Total Emissions from All Mobile Engines:
Rosemont Copper ProjectEmission Inventory Information JBR ENVIRONMENTAL CONSULTANTS, INC.
November 2011Page H150
AZRP00332
Rosemont Copper Project November 2011 Emission Inventory Information Page H151
JBR ENVIRONMENTAL CONSULTANTS, INC.
YEAR 10
AZRP00333

PM/TSP PM10 PM2.5 Unitsk
(PM/TSP)
k (PM10) k (PM2.5) A (ft2) U (mph) M (%) W (tons) s (%) S (mph) P (days/yr)a
(PM/TSP)
a (PM10) a (PM2.5)b
(PM/TSP)
b (PM10) b (PM2.5) u* ut* e f (%) PE
Drilling Drilling 3-05-020-10 1.30 0.43 0.08 lb/hole holes 1 0.33 0.06 AP-42, Section 11.9, Table11.9-4 (10/98)
Blast Blasting 3-05-020-09 328.26 170.69 9.85 lb/blast blasts 1 0.52 0.03 81,920 AP-42, Section 11.9, Table11.9-1 (10/98)
Loading Loading 3-03-024-08 0.0007 0.0003 0.00005 lb/ton tons 0.74 0.35 0.053 4.14 4 AP-42, Section 13.2.4,Expression 1 (11/06)
HaulingHD Haul Trucks - Hourly/Daily 3-05-020-11 21.25 5.46 0.55 lb/VMT VMT 4.9 1.5 0.15 305 5.0 0.7 0.9 0.9 0.45 0.45 0.45 AP-42, Section 13.2.2,Expression 1a (11/06)
HaulingA Haul Trucks - Annual 3-05-020-11 17.70 4.55 0.45 lb/VMT VMT 4.9 1.5 0.15 305 5.0 61 0.7 0.9 0.9 0.45 0.45 0.45 AP-42, Section 13.2.2,Expressions 1a and 2 (11/06)
Bldzrs Bulldozers 3-05-010-99 2.82 0.43 0.30 lb/hr hrs 5.7 0.75 0.60 4 2.5 1.2 1.5 1.2 1.3 1.4 1.3 AP-42, Section 11.9, Table11.9-1 (10/98)
SupVehY10H Support Vehicular Traffic - Year 10 Hourly 3-05-010-99 6.96 1.79 0.18 lb/VMT VMT 4.9 1.5 0.15 25.5 5.0 0.7 0.9 0.9 0.45 0.45 0.45 AP-42, Section 13.2.2,
Expression 1a (11/06)
SupVehY10D Support Vehicular Traffic - Year 10 Daily 3-05-010-99 7.19 1.85 0.18 lb/VMT VMT 4.9 1.5 0.15 27.4 5.0 0.7 0.9 0.9 0.45 0.45 0.45 AP-42, Section 13.2.2,
Expression 1a (11/06)
SupVehY10A Support Vehicular Traffic - Year 10 Annual 3-05-010-99 6.06 1.56 0.16 lb/VMT VMT 4.9 1.5 0.15 28.2 5.0 61 0.7 0.9 0.9 0.45 0.45 0.45 AP-42, Section 13.2.2,
Expressions 1a and 2 (11/06)
WtrTrksHD Water Trucks - Hourly/Daily 3-05-010-99 17.06 4.38 0.44 lb/VMT VMT 4.9 1.5 0.15 187.4 5.0 0.7 0.9 0.9 0.45 0.45 0.45 AP-42, Section 13.2.2,Expression 1a (11/06)
WtrTrksA Water Trucks - Annual 3-05-010-99 14.21 3.65 0.37 lb/VMT VMT 4.9 1.5 0.15 187.4 5.0 61 0.7 0.9 0.9 0.45 0.45 0.45 AP-42, Section 13.2.2,Expressions 1a and 2 (11/06)
GradersY10 Graders - Year 10 3-05-010-99 2.05 0.71 0.06 lb/VMT VMT 1 0.60 0.031 4.83 0.040 0.051 0.040 2.5 2.0 2.5 AP-42, Section 11.9, Table11.9-1 (10/98)
TrMlyCncPrt Molybdnum Concentrate Transfer(Protected) 3-03-024-08 0.00002 0.00001 0.000002 lb/ton tons 0.74 0.35 0.053 1.3 15 AP-42, Section 13.2.4,
Expression 1 (11/06)
DTrMlyCncPrt Dried Molybdenum Concentrate Transfer (Protected) 3-03-024-08 0.00004 0.00002 0.000003 lb/ton tons 0.74 0.35 0.053 1.3 10 AP-42, Section 13.2.4,
Expression 1 (11/06)
DTrMlyCnc Dried Molybdenum Concentrate Transfer (Unprotected) 3-03-024-08 0.0003 0.0002 0.00002 lb/ton tons 0.74 0.35 0.053 6.21 10 AP-42, Section 13.2.4,
Expression 1 (11/06)
TrCuCncPrt Copper Concentrate Transfer (Protected) 3-03-024-08 0.00004 0.00002 0.000003 lb/ton tons 0.74 0.35 0.053 1.3 10 AP-42, Section 13.2.4,
Expression 1 (11/06)
TrCuCnc Copper Concentrate Loadout 3-03-024-08 0.0003 0.0002 0.00002 lb/ton tons 0.74 0.35 0.053 6.21 10 AP-42, Section 13.2.4,Expression 1 (11/06)
FiltTailPrt Filtered Tailings Transfer (Protected) 3-03-024-08 0.00002 0.00001 0.000002 lb/ton tons 0.74 0.35 0.053 1.3 15 AP-42, Section 13.2.4,
Expression 1 (11/06)
FiltTail Filtered Tailings Transfer (Unprotected) 3-03-024-08 0.0002 0.00009 0.00001 lb/ton tons 0.74 0.35 0.053 6.21 15 AP-42, Section 13.2.4,
Expression 1 (11/06)
CrushP Primary Crushing - High Moisture Ore 3-03-024-05 0.02 0.009 0.002 lb/ton tons 0.185
AP-42, Section 11.24, Table11.24-2 (08/82) and 11.19.2-2 (08/04)
CrushS Secondary Crushing - High Moisture Ore 3-03-024-06 0.05 0.02 0.004 lb/ton tons 0.185
AP-42, Section 11.24, Table11.24-2 (08/82) and 11.19.2-2 (08/04)
CrushT Tertiary Crushing - High Moisture Ore 3-03-024-07 0.06 0.02 0.004 lb/ton tons 0.185
AP-42, Section 11.24, Table11.24-2 (08/82) and 11.19.2-2(08/04)
Screen Screening 3-05-020-02 0.025 0.0087 0.0006 lb/ton tons 0.068 AP-42, Section 11.19, Table11.19.2-2 (08/04)
MolyDry Drying of High Moisture Ore 3-03-024-11 19.70 12.00 5.91 lb/ton tons 0.30AP-42, Section 11.24, Table11.24-2 (08/82) and Appendix B.2 (09/96)
TrStnPrt Material Transfer (Protected) 3-03-024-08 0.0002 0.00007 0.00001 lb/ton tons 0.74 0.35 0.053 1.3 4 AP-42, Section 13.2.4,Expression 1 (11/06)
TrStnUnp Material Transfer (Unprotected) 3-03-024-08 0.001 0.0006 0.00009 lb/ton tons 0.74 0.35 0.053 6.21 4 AP-42, Section 13.2.4,Expression 1 (11/06)
LimeLd Lime Product Loading, Enclosed Truck 3-05-016-26 0.61 0.29 0.04 lb/ton tons 1 0.47 0.07
AP-42, Section 11.17, Table11.17-4 (02/98) and AP-42, Section 13.2.4 (11/06)
ReagTr Miscellaneous Reagent Material Transfer 3-03-024-04 0.008 0.004 0.0006 lb/ton tons 0.74 0.35 0.053 6.21 1 AP-42, Section 13.2.4,
Expression 1 (11/06)
Table H.39 Particulate Matter Emission Factors - Year 10
SCC Code Prod. Rate Units Reference
Emission FactorsProcess Code Process Description
Particulate Matter Emission Factor Inputs a
Rosemont Copper ProjectEmission Inventory Information JBR ENVIRONMENTAL CONSULTANTS, INC.
November 2011Page H152
AZRP00334

PM/TSP PM10 PM2.5 Unitsk
(PM/TSP)
k (PM10) k (PM2.5) A (ft2) U (mph) M (%) W (tons) s (%) S (mph) P (days/yr)a
(PM/TSP)
a (PM10) a (PM2.5)b
(PM/TSP)
b (PM10) b (PM2.5) u* ut* e f (%) PE
Table H.39 Particulate Matter Emission Factors - Year 10
SCC Code Prod. Rate Units Reference
Emission FactorsProcess Code Process Description
Particulate Matter Emission Factor Inputs a
ICDE1 Internal Combustion Diesel Engine 37 ≤ kW > 75 2-02-001-02 0.40 0.40 0.40 g/kW-hr hours 1 1 1 NSPS Emission Standard
ICDE2 Internal Combustion Diesel Engine 225 ≤ kW > 450 2-02-001-02 0.20 0.20 0.20 g/kW-hr hours 1 1 1 NSPS Emission Standard
ICDE3 Internal Combustion Diesel Engine > 560 kW 2-02-001-02 0.20 0.20 0.20 g/kW-hr hours 1 1 1 NSPS Emission Standard
DFB Diesel (Distillate Oil) Fired Boiler <100 MMBtu/hr 1-02-005-03 3.30 2.30 1.54 lb/1000 gal hours 1 0.5 0.12 AP-42, Section 1.3, Tables
1.3-1, 1.3-2 and 1.3-6 (09/98)
CAS Crushing Area Scrubber none 1.29 1.28 1.13 lb/hr hours 1.01 1.00 0.88Voluntarily Accepted PM10
Emission Limit, PM and PM2.5
fractions of PM10 emissions
SAS Stockpile Area Scrubber none 2.61 2.59 2.10 lb/hr hours 1.01 1.00 0.81Voluntarily Accepted PM10
Emission Limit, PM and PM2.5
fractions of PM10 emissions
RTS Reclaim Tunnel Scrubber none 1.08 1.07 0.87 lb/hr hours 1.01 1.00 0.81Voluntarily Accepted PM10
Emission Limit, PM and PM2.5
fractions of PM10 emissions
PCAS Pebble Crusher Area Scrubber none 1.58 1.56 1.31 lb/hr hours 1.02 1.00 0.84Voluntarily Accepted PM10
Emission Limit, PM and PM2.5
fractions of PM10 emissions
CCS Copper Concentrate Scrubbers none 3.59 3.55 3.04 lb/hr hours 1.01 1.00 0.86Voluntarily Accepted PM10
Emission Limit, PM and PM2.5
fractions of PM10 emissions
MS/EP Molybdenum Scrubber / Electrostatic Precipitator none 0.015 0.014 0.013 lb/hr hours 1.10 1.00 0.94
Voluntarily Accepted PM10
Emission Limit, PM and PM2.5
fractions of PM10 emissions
MDC Molybdenum Dust Collector none 0.021 0.010 0.002 gr/dscf dscf 2.11 1.00 0.15Voluntarily Accepted PM10
Emission Limit, PM and PM2.5
fractions of PM10 emissions
LDC Laboratory Dust Collectors none 0.008 0.005 0.002 gr/dscf dscf 1.65 1.00 0.49Voluntarily Accepted PM10
Emission Limit, PM and PM2.5
fractions of PM10 emissions
WindROM Wind Erosion - Run of MineStockpile 3-03-888-01 0.21 0.11 0.02 ton/acre-yr acres 1 0.5 0.075 2.5 38 4.77 22
FDEMIb (07/83), p. 51-57, MRIEquation, AP-42, Section 13.2.5 (11/06) and Table 13.2.4-1 (11/06)
WindCvd Wind Erosion - Covered Stockpile 3-03-888-01 0 0 0 ton/acre-yr acres Assumed
TailStrg Wind Erosion - Tailings Storage 3-03-888-01 0.02 0.01 0.002 ton/acre-yr acres 1 0.5 0.075 0.57 0.43 AP-42, Section 13.2.5 (11/06)
b FDEMI = Fugitive Dust Emission Factors for the Mining Industry
a k = particle size multiplier, A = horizonal area of blasting surface, U = mean wind speed, M = material moisture content, W = mean vehicle weight, s = surface material silt content, S = mean vehicle speed, P = number of days per year with at least 0.01 inches of precipitation, a = constant based on particle size,b = constant based on particle size, u* = friction velocity, ut
* = threshold friction velocity, e = surface erodibility, f = percentage of time the wind speed exceeds 12 mph, PE = Thornthwaite's Precipitation-Evaporation Index
Rosemont Copper ProjectEmission Inventory Information JBR ENVIRONMENTAL CONSULTANTS, INC.
November 2011Page H153
AZRP00335

CO NOX SO2 VOC H2SO4 CO2 CH4 N2O Units
Blast Blasting 3-05-020-09 67.00 17.00 2.00 0 0 566 0.02 0.005 lb/tons ANFO tons ANFOAP-42 Section 13.3, Table 13.3-1 (02/80) and 40 CFR 98, Tables C-1 and C-2a
SX Solvent Extraction Mixers and Settlers 4-90-001-99 0 0 0 9.43E-05 0 0 0 0 lb/hr-ft2 hours Hydrometallurgy of Copper (Control Efficiency of 66%)
EW Electrowining Tankhouse none 0 0 0 0 1.57E-04 0 0 0 lb/hr-ft2 hours Applied Environmental Consultants - Reportb
ICDE1 Internal Combustion Diesel Engine 37 ≤ kW > 75 2-02-001-02 5.0 4.4 0.0066 0.3 0 694 0.03 0.006 g/kW-hr hours NSPS Emission Standard, Complete Sulfur Conversionc, and 40 CFR 98, Tables C-1 and C-2
ICDE2 Internal Combustion Diesel Engine 225 ≤ kW > 450 2-02-001-02 3.5 3.7 0.0066 0.3 0 694 0.03 0.006 g/kW-hr hours NSPS Emission Standard, Complete Sulfur Conversionc, and 40 CFR 98, Tables C-1 and C-2
ICDE3 Internal Combustion Diesel Engine > 560 kW 2-02-001-02 3.5 6.0 0.0066 0.40 0 694 0.03 0.006 g/kW-hr hours NSPS Emission Standard, Complete Sulfur Conversionc, and 40 CFR 98, Tables C-1 and C-2
DFB Diesel (Distillate Oil) Fired Boiler <100 MMBtu/hr 1-02-005-03 5.00 20.00 0.21 0.20 0 23,217 0.94 0.19 lb/1000 gal hours AP-42 Section 1.3, Tables 1.3-1 and 1.3-3 (05/10)c and 40 CFR 98, Tables C-1 and C-2
C7DT C7 Distribution Tank 4-03-010-19 0 0 0 1.08E-01 0 0 0 0 lb/hr hours EPA Tanks Program 4.0d
MST MIBC Storage Tank 4-90-999-98 0 0 0 3.53E-03 0 0 0 0 lb/hr hours EPA Tanks Program 4.0d
DFSTHV Diesel Fuel Storage Tank - Heavy Vehicles 4-03-010-19 0 0 0 1.39E-02 0 0 0 0 lb/hr hours EPA Tanks Program 4.0d
b "Measurement of Sulfuric Acid Mist Emissions from the Cyprus Twin Buttes Copper Company Electrowinning Tankhouse" (02/93).
d Assumes continuous operation.
a Assumes a fuel oil to ammonium nitrate ratio of 9.0%.
c SO2 emissions are calculated using a sulfur content of 0.0015% for diesel fuel.
Table H.40 Gaseous Emission Factors - Year 10
Process DescriptionProcess Code SCC Code Prod. Rate
Units ReferenceEmission Factor
Rosemont Copper ProjectEmission Inventory Information JBR ENVIRONMENTAL CONSULTANTS, INC.
November 2011Page H154
AZRP00336
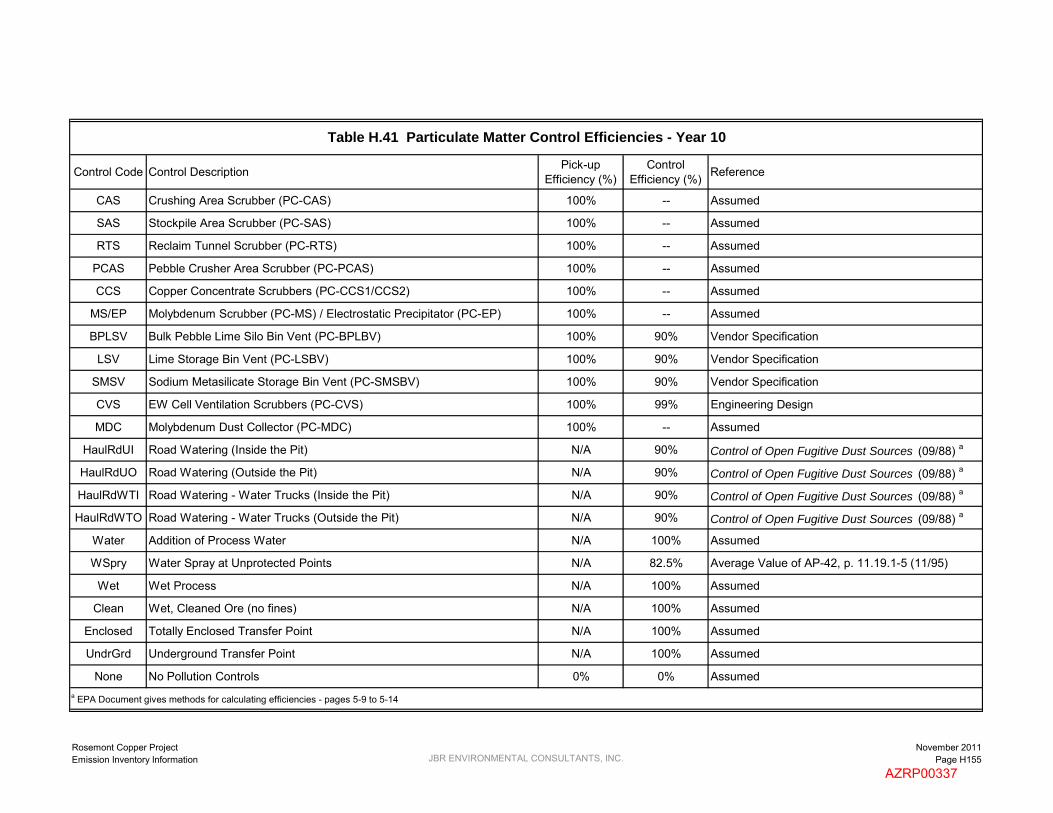
Control Code Control Description Pick-up Efficiency (%)
Control Efficiency (%) Reference
CAS Crushing Area Scrubber (PC-CAS) 100% -- Assumed
SAS Stockpile Area Scrubber (PC-SAS) 100% -- Assumed
RTS Reclaim Tunnel Scrubber (PC-RTS) 100% -- Assumed
PCAS Pebble Crusher Area Scrubber (PC-PCAS) 100% -- Assumed
CCS Copper Concentrate Scrubbers (PC-CCS1/CCS2) 100% -- Assumed
MS/EP Molybdenum Scrubber (PC-MS) / Electrostatic Precipitator (PC-EP) 100% -- Assumed
BPLSV Bulk Pebble Lime Silo Bin Vent (PC-BPLBV) 100% 90% Vendor Specification
LSV Lime Storage Bin Vent (PC-LSBV) 100% 90% Vendor Specification
SMSV Sodium Metasilicate Storage Bin Vent (PC-SMSBV) 100% 90% Vendor Specification
CVS EW Cell Ventilation Scrubbers (PC-CVS) 100% 99% Engineering Design
MDC Molybdenum Dust Collector (PC-MDC) 100% -- Assumed
HaulRdUI Road Watering (Inside the Pit) N/A 90% Control of Open Fugitive Dust Sources (09/88) a
HaulRdUO Road Watering (Outside the Pit) N/A 90% Control of Open Fugitive Dust Sources (09/88) a
HaulRdWTI Road Watering - Water Trucks (Inside the Pit) N/A 90% Control of Open Fugitive Dust Sources (09/88) a
HaulRdWTO Road Watering - Water Trucks (Outside the Pit) N/A 90% Control of Open Fugitive Dust Sources (09/88) a
Water Addition of Process Water N/A 100% Assumed
WSpry Water Spray at Unprotected Points N/A 82.5% Average Value of AP-42, p. 11.19.1-5 (11/95)
Wet Wet Process N/A 100% Assumed
Clean Wet, Cleaned Ore (no fines) N/A 100% Assumed
Enclosed Totally Enclosed Transfer Point N/A 100% Assumed
UndrGrd Underground Transfer Point N/A 100% Assumed
None No Pollution Controls 0% 0% Assumed
Table H.41 Particulate Matter Control Efficiencies - Year 10
a EPA Document gives methods for calculating efficiencies - pages 5-9 to 5-14
Rosemont Copper ProjectEmission Inventory Information JBR ENVIRONMENTAL CONSULTANTS, INC.
November 2011Page H155
AZRP00337
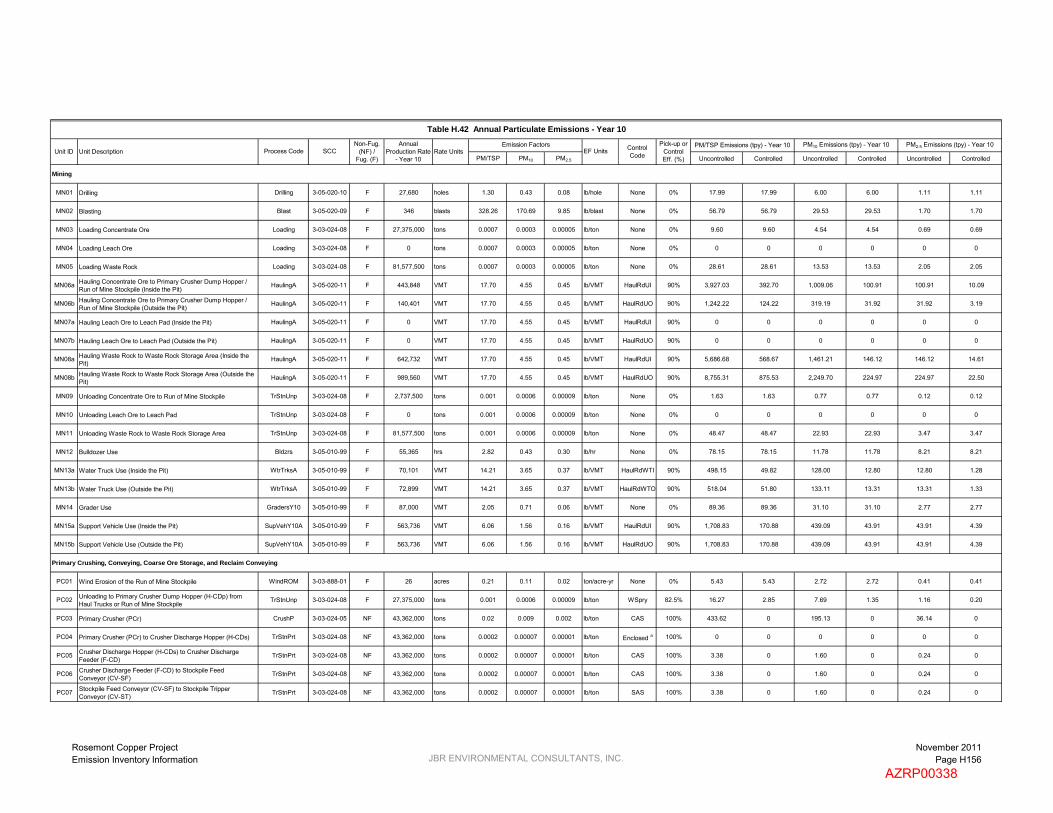
PM/TSP PM10 PM2.5 Uncontrolled Controlled Uncontrolled Controlled Uncontrolled Controlled
Mining
MN01 Drilling Drilling 3-05-020-10 F 27,680 holes 1.30 0.43 0.08 lb/hole None 0% 17.99 17.99 6.00 6.00 1.11 1.11
MN02 Blasting Blast 3-05-020-09 F 346 blasts 328.26 170.69 9.85 lb/blast None 0% 56.79 56.79 29.53 29.53 1.70 1.70
MN03 Loading Concentrate Ore Loading 3-03-024-08 F 27,375,000 tons 0.0007 0.0003 0.00005 lb/ton None 0% 9.60 9.60 4.54 4.54 0.69 0.69
MN04 Loading Leach Ore Loading 3-03-024-08 F 0 tons 0.0007 0.0003 0.00005 lb/ton None 0% 0 0 0 0 0 0
MN05 Loading Waste Rock Loading 3-03-024-08 F 81,577,500 tons 0.0007 0.0003 0.00005 lb/ton None 0% 28.61 28.61 13.53 13.53 2.05 2.05
MN06a Hauling Concentrate Ore to Primary Crusher Dump Hopper / Run of Mine Stockpile (Inside the Pit)
HaulingA 3-05-020-11 F 443,848 VMT 17.70 4.55 0.45 lb/VMT HaulRdUI 90% 3,927.03 392.70 1,009.06 100.91 100.91 10.09
MN06b Hauling Concentrate Ore to Primary Crusher Dump Hopper / Run of Mine Stockpile (Outside the Pit)
HaulingA 3-05-020-11 F 140,401 VMT 17.70 4.55 0.45 lb/VMT HaulRdUO 90% 1,242.22 124.22 319.19 31.92 31.92 3.19
MN07a Hauling Leach Ore to Leach Pad (Inside the Pit) HaulingA 3-05-020-11 F 0 VMT 17.70 4.55 0.45 lb/VMT HaulRdUI 90% 0 0 0 0 0 0
MN07b Hauling Leach Ore to Leach Pad (Outside the Pit) HaulingA 3-05-020-11 F 0 VMT 17.70 4.55 0.45 lb/VMT HaulRdUO 90% 0 0 0 0 0 0
MN08a Hauling Waste Rock to Waste Rock Storage Area (Inside the Pit)
HaulingA 3-05-020-11 F 642,732 VMT 17.70 4.55 0.45 lb/VMT HaulRdUI 90% 5,686.68 568.67 1,461.21 146.12 146.12 14.61
MN08b Hauling Waste Rock to Waste Rock Storage Area (Outside the Pit)
HaulingA 3-05-020-11 F 989,560 VMT 17.70 4.55 0.45 lb/VMT HaulRdUO 90% 8,755.31 875.53 2,249.70 224.97 224.97 22.50
MN09 Unloading Concentrate Ore to Run of Mine Stockpile TrStnUnp 3-03-024-08 F 2,737,500 tons 0.001 0.0006 0.00009 lb/ton None 0% 1.63 1.63 0.77 0.77 0.12 0.12
MN10 Unloading Leach Ore to Leach Pad TrStnUnp 3-03-024-08 F 0 tons 0.001 0.0006 0.00009 lb/ton None 0% 0 0 0 0 0 0
MN11 Unloading Waste Rock to Waste Rock Storage Area TrStnUnp 3-03-024-08 F 81,577,500 tons 0.001 0.0006 0.00009 lb/ton None 0% 48.47 48.47 22.93 22.93 3.47 3.47
MN12 Bulldozer Use Bldzrs 3-05-010-99 F 55,365 hrs 2.82 0.43 0.30 lb/hr None 0% 78.15 78.15 11.78 11.78 8.21 8.21
MN13a Water Truck Use (Inside the Pit) WtrTrksA 3-05-010-99 F 70,101 VMT 14.21 3.65 0.37 lb/VMT HaulRdWTI 90% 498.15 49.82 128.00 12.80 12.80 1.28
MN13b Water Truck Use (Outside the Pit) WtrTrksA 3-05-010-99 F 72,899 VMT 14.21 3.65 0.37 lb/VMT HaulRdWTO 90% 518.04 51.80 133.11 13.31 13.31 1.33
MN14 Grader Use GradersY10 3-05-010-99 F 87,000 VMT 2.05 0.71 0.06 lb/VMT None 0% 89.36 89.36 31.10 31.10 2.77 2.77
MN15a Support Vehicle Use (Inside the Pit) SupVehY10A 3-05-010-99 F 563,736 VMT 6.06 1.56 0.16 lb/VMT HaulRdUI 90% 1,708.83 170.88 439.09 43.91 43.91 4.39
MN15b Support Vehicle Use (Outside the Pit) SupVehY10A 3-05-010-99 F 563,736 VMT 6.06 1.56 0.16 lb/VMT HaulRdUO 90% 1,708.83 170.88 439.09 43.91 43.91 4.39
Primary Crushing, Conveying, Coarse Ore Storage, and Reclaim Conveying
PC01 Wind Erosion of the Run of Mine Stockpile WindROM 3-03-888-01 F 26 acres 0.21 0.11 0.02 ton/acre-yr None 0% 5.43 5.43 2.72 2.72 0.41 0.41
PC02 Unloading to Primary Crusher Dump Hopper (H-CDp) fromHaul Trucks or Run of Mine Stockpile
TrStnUnp 3-03-024-08 F 27,375,000 tons 0.001 0.0006 0.00009 lb/ton WSpry 82.5% 16.27 2.85 7.69 1.35 1.16 0.20
PC03 Primary Crusher (PCr) CrushP 3-03-024-05 NF 43,362,000 tons 0.02 0.009 0.002 lb/ton CAS 100% 433.62 0 195.13 0 36.14 0
PC04 Primary Crusher (PCr) to Crusher Discharge Hopper (H-CDs) TrStnPrt 3-03-024-08 NF 43,362,000 tons 0.0002 0.00007 0.00001 lb/ton Enclosed a 100% 0 0 0 0 0 0
PC05 Crusher Discharge Hopper (H-CDs) to Crusher DischargeFeeder (F-CD)
TrStnPrt 3-03-024-08 NF 43,362,000 tons 0.0002 0.00007 0.00001 lb/ton CAS 100% 3.38 0 1.60 0 0.24 0
PC06 Crusher Discharge Feeder (F-CD) to Stockpile FeedConveyor (CV-SF)
TrStnPrt 3-03-024-08 NF 43,362,000 tons 0.0002 0.00007 0.00001 lb/ton CAS 100% 3.38 0 1.60 0 0.24 0
PC07 Stockpile Feed Conveyor (CV-SF) to Stockpile TripperConveyor (CV-ST)
TrStnPrt 3-03-024-08 NF 43,362,000 tons 0.0002 0.00007 0.00001 lb/ton SAS 100% 3.38 0 1.60 0 0.24 0
Table H.42 Annual Particulate Emissions - Year 10Annual
Production Rate - Year 10
Control CodeRate UnitsUnit ID Unit Description Process Code SCC
Non-Fug. (NF) /
Fug. (F)
Pick-up or Control Eff. (%)
Emission FactorsEF Units
PM/TSP Emissions (tpy) - Year 10 PM2.5 Emissions (tpy) - Year 10PM10 Emissions (tpy) - Year 10
Rosemont Copper ProjectEmission Inventory Information JBR ENVIRONMENTAL CONSULTANTS, INC.
November 2011Page H156
AZRP00338

PM/TSP PM10 PM2.5 Uncontrolled Controlled Uncontrolled Controlled Uncontrolled Controlled
Table H.42 Annual Particulate Emissions - Year 10Annual
Production Rate - Year 10
Control CodeRate UnitsUnit ID Unit Description Process Code SCC
Non-Fug. (NF) /
Fug. (F)
Pick-up or Control Eff. (%)
Emission FactorsEF Units
PM/TSP Emissions (tpy) - Year 10 PM2.5 Emissions (tpy) - Year 10PM10 Emissions (tpy) - Year 10
PC08 Stockpile Tripper Conveyor (CV-ST) to Covered Coarse Ore Stockpile
TrStnPrt 3-03-024-08 F 43,362,000 tons 0.0002 0.00007 0.00001 lb/ton SAS 100% 3.38 0 1.60 0 0.24 0
PC09 Wind Erosion of the Coarse Ore Stockpile WindCvd 3-03-888-01 F 5 acres 0 0 0 ton/acre-yr Enclosed a 100% 0 0 0 0 0 0
PC10 Coarse Ore Stockpile to Reclaim Feeders (F-R1/R4) TrStnPrt 3-03-024-08 NF 43,362,000 tons 0.0002 0.00007 0.00001 lb/ton UndrGrd a 100% 0 0 0 0 0 0
PC11 Reclaim Feeders (F-R1/R4) to Reclaim Conveyor (CV-R) TrStnPrt 3-03-024-08 NF 43,362,000 tons 0.0002 0.00007 0.00001 lb/ton RTS 100% 3.38 0 1.60 0 0.24 0
PC12 Reclaim Conveyor (CV-R) to SAG Mill Feed Conveyor(CV-SMF) TrStnPrt 3-03-024-08 NF 43,362,000 tons 0.0002 0.00007 0.00001 lb/ton PCAS 100% 3.38 0 1.60 0 0.24 0
PC13 Pebble Conveyor No. 3 (CV-Pb3) to SAG Mill Feed Conveyor (CV-SMF)
TrStnPrt 3-03-024-08 NF 6,269,400 tons 0.0002 0.00007 0.00001 lb/ton PCAS 100% 0.49 0 0.23 0 0.03 0
PC14 SAG Mill Feed Conveyor (CV-SMF) to SAG Mill (M-SAG) TrStnPrt 3-03-024-08 NF 49,669,200 tons 0.0002 0.00007 0.00001 lb/ton Water a 100% 0 0 0 0 0 0
Milling
M01 SAG Mill (M-SAG) CrushS 3-03-024-06 NF 49,669,200 tons 0.05 0.02 0.004 lb/ton Wet a 100% 0 0 0 0 0 0
M02 SAG Mill (M-SAG) to Trommel Screen (Sn-T) TrStnPrt 3-03-024-08 NF 49,669,200 tons 0.0002 0.00007 0.00001 lb/ton Enclosed a 100% 0 0 0 0 0 0
M03 Trommel Screen (Sn-T) Screen 3-05-020-02 NF 49,669,200 tons 0.025 0.0087 0.0006 lb/ton Wet a 100% 0 0 0 0 0 0
M04 Trommel Screen (Sn-T) to Pebble Conveyor No. 1 (CV-Pb1) TrStnPrt 3-03-024-08 NF 10,505,042 tons 0.0002 0.00007 0.00001 lb/ton Clean a 100% 0 0 0 0 0 0
M05 Pebble Conveyor No. 1 (CV-Pb1) to Pebble Wash Screen(Sn-PbW)
TrStnPrt 3-03-024-08 NF 10,505,042 tons 0.0002 0.00007 0.00001 lb/ton Clean a 100% 0 0 0 0 0 0
M06 Pebble Wash Screen (Sn-PbW) Screen 3-05-020-02 NF 10,505,042 tons 0.025 0.0087 0.0006 lb/ton Wet a 100% 0 0 0 0 0 0
M07 Pebble Wash Screen (Sn-PbW) to Pebble Conveyor No. 2 TrStnPrt 3-03-024-08 NF 6,269,400 tons 0.0002 0.00007 0.00001 lb/ton Clean a 100% 0 0 0 0 0 0
M08 Pebble Conveyor No. 2 (CV-Pb2) to SAG Oversize Surge Bin(B-SAGOS) TrStnPrt 3-03-024-08 NF 6,269,400 tons 0.0002 0.00007 0.00001 lb/ton PCAS 100% 0.49 0 0.23 0 0.03 0
M09 SAG Oversize Surge Bin (B-SAGOS) to Pebble CrusherFeeder (F-PbC)
TrStnPrt 3-03-024-08 NF 6,269,400 tons 0.0002 0.00007 0.00001 lb/ton PCAS 100% 0.49 0 0.23 0 0.03 0
M10 Pebble Crusher Feeder (F-PbC) to Pebble Crusher (PbC) TrStnPrt 3-03-024-08 NF 6,269,400 tons 0.0002 0.00007 0.00001 lb/ton Enclosed a 100% 0 0 0 0 0 0
M11 Pebble Crusher (PbC) CrushT 3-03-024-07 NF 6,269,400 tons 0.06 0.02 0.004 lb/ton PCAS 100% 188.08 0 62.69 0 11.61 0
M12 Pebble Crusher (PbC) to Pebble Conveyor No. 3 (CV-Pb3) TrStnPrt 3-03-024-08 NF 6,269,400 tons 0.0002 0.00007 0.00001 lb/ton PCAS 100% 0.49 0 0.23 0 0.03 0
Copper Concentrate Dewatering and Stacking
CCD01 Copper Concentrate Filters (Ft-CC1/CC4) to Copper Concentrate Conveyor (CV-CC) TrCuCncPrt 3-03-024-08 NF 550,936 tons 0.00004 0.00002 0.000003 lb/ton Enclosed a 100% 0 0 0 0 0 0
CCD02 Copper Concentrate Conveyor (CV-CC) to Copper Concentrate Loadout Stockpile
TrCuCncPrt 3-03-024-08 F 550,936 tons 0.00004 0.00002 0.000003 lb/ton CCS 100% 0.01 0 0.006 0 0.0009 0
CCD03 Wind Erosion of Copper Concentrate Loadout Stockpile WindCvd 3-03-888-01 F 1.17 acres 0 0 0 ton/acre-yr Enclosed a 100% 0 0 0 0 0 0
CCD04 Copper Concentrate Loadout Stockpile to Shipment Truck via Front End Loaders
TrCuCncPrt 3-03-024-08 F 550,936 tons 0.00004 0.00002 0.000003 lb/ton CCS 100% 0.01 0 0.006 0 0.0009 0
Molybdenum Dewatering and Packaging
MD01 Molybdenum Concentrate Filter (Ft-MC) to Molybdenum Concentrate Dryer (D-MC)
TrMlyCncPrt 3-03-024-08 NF 6,377 tons 0.00002 0.00001 0.000002 lb/ton Enclosed a 100% 0 0 0 0 0 0
MD02 Molybdenum Concentrate Dryer MolyDry 3-03-024-11 NF 6,377 tons 19.70 12.00 5.91 lb/ton MS/EP 100% 62.81 0 38.26 0 18.84 0
MD03 Molybdenum Concentrate Dryer (D-MC) to MolybdenumConcentrate Bin (B-MC)
DTrMlyCncPrt 3-03-024-08 NF 6,377 tons 0.00004 0.00002 0.000003 lb/ton MDC 100% 0.0001 0 0.00007 0 0.00001 0
Rosemont Copper ProjectEmission Inventory Information JBR ENVIRONMENTAL CONSULTANTS, INC.
November 2011Page H157
AZRP00339

PM/TSP PM10 PM2.5 Uncontrolled Controlled Uncontrolled Controlled Uncontrolled Controlled
Table H.42 Annual Particulate Emissions - Year 10Annual
Production Rate - Year 10
Control CodeRate UnitsUnit ID Unit Description Process Code SCC
Non-Fug. (NF) /
Fug. (F)
Pick-up or Control Eff. (%)
Emission FactorsEF Units
PM/TSP Emissions (tpy) - Year 10 PM2.5 Emissions (tpy) - Year 10PM10 Emissions (tpy) - Year 10
MD04 Molybdenum Concentrate Bin (B-MC) to MolybdenumConcentrate Hopper (H-MC)
DTrMlyCnc 3-03-024-08 NF 6,377 tons 0.0003 0.0002 0.00002 lb/ton None 0% 0.001 0.001 0.0005 0.0005 0.00008 0.00008
MD05 Molybdenum Concentrate Hopper (H-MC) to MolybdenumConcentrate Conveyor (CV-MC)
DTrMlyCncPrt 3-03-024-08 NF 6,377 tons 0.00004 0.00002 0.000003 lb/ton Enclosed a 100% 0 0 0 0 0 0
MD06 Molybdenum Concentrate Conveyor (CV-MC) to Molybdenum Packaging and Weigh System (MPS)
DTrMlyCnc 3-03-024-08 NF 6,377 tons 0.0003 0.0002 0.00002 lb/ton MDC 100% 0.001 0 0.0005 0 0.00008 0
Tailings Dewatering and Placement
TDS01 Tailings Filters (Ft-T1/T14) to Tailings Belt Feeders (F-T1/T14) FiltTailPrt 3-03-024-08 NF 42,804,687 tons 0.00002 0.00001 0.000002 lb/ton Enclosed a 100% 0 0 0 0 0 0
TDS02 Tailings Belt Feeders (F-T1/T14) to Fixed Tailings ConveyorNo. 1 (CV-F1)
FiltTailPrt 3-03-024-08 NF 42,804,687 tons 0.00002 0.00001 0.000002 lb/ton Enclosed a 100% 0 0 0 0 0 0
TDS03 Fixed Tailings Conveyor No. 1 (CV-F1) to Fixed TailingsConveyor No. 2 (CV-F2)
FiltTailPrt 3-03-024-08 NF 42,804,687 tons 0.00002 0.00001 0.000002 lb/ton Enclosed a 100% 0 0 0 0 0 0
TDS04 Fixed Tailings Conveyor No. 2 (CV-F2) to Fixed Tailings Conveyor No. 3 (CV-F3)
FiltTailPrt 3-03-024-08 NF 42,804,687 tons 0.00002 0.00001 0.000002 lb/ton None 0% 0.52 0.52 0.25 0.25 0.04 0.04
TDS05 Fixed Tailings Conveyor No. 3 (CV-F3) to RelocatableConveyor (CV-R1)
FiltTailPrt 3-03-024-08 F 42,804,687 tons 0.00002 0.00001 0.000002 lb/ton None 0% 0.52 0.52 0.25 0.25 0.04 0.04
TDS06 Relocatable Conveyor (CV-R1) to Shiftable Conveyor (CV-S1) FiltTailPrt 3-03-024-08 F 42,804,687 tons 0.00002 0.00001 0.000002 lb/ton None 0% 0.52 0.52 0.25 0.25 0.04 0.04
TDS07 Shiftable Conveyor (CV-S1) to Belt Wagon Conveyor(CV-BW1)
FiltTail 3-03-024-08 F 42,804,687 tons 0.0002 0.00009 0.00001 lb/ton None 0% 4.00 4.00 1.89 1.89 0.29 0.29
TDS08 Belt Wagon Conveyor (CV-BW1) to Spreader Crawler Mounted Conveyor (CV-SP1)
FiltTail 3-03-024-08 F 42,804,687 tons 0.0002 0.00009 0.00001 lb/ton None 0% 4.00 4.00 1.89 1.89 0.29 0.29
TDS09 Spreader Crawler Mounted Conveyor (CV-SP1) to Tailings Storage
FiltTail 3-03-024-08 F 42,804,687 tons 0.0002 0.00009 0.00001 lb/ton None 0% 4.00 4.00 1.89 1.89 0.29 0.29
TDS10 Wind Erosion of Tailings Storage TailStrg 3-03-888-01 F 1,500 acres 0.02 0.01 0.002 ton/acre-yr None 0% 30.23 30.23 15.11 15.11 2.27 2.27
Fuel Burning Equipment
FB01 Diesel Electrowinning Hot Water Generator (HWG) DFB 1-02-005-03 NF 8,760 hours 3.30 2.30 1.54 lb/1000 gal None 0% 0.63 0.63 0.44 0.44 0.30 0.30
6.0 MMBtu/hr
FB02 Thickener Area Emergency Generator (TEG) ICDE3 2-02-001-02 NF 500 hours 0.20 0.20 0.20 g/kW-hr None 0% 0.11 0.11 0.11 0.11 0.11 0.11
1,000 kW
FB03 PLS Pond Area Emergency Generator (PEG) ICDE3 2-02-001-02 NF 500 hours 0.20 0.20 0.20 g/kW-hr None 0% 0.11 0.11 0.11 0.11 0.11 0.11
1,000 kW
FB04 Main Substation Emergency Generator (MEG) ICDE3 2-02-001-02 NF 500 hours 0.20 0.20 0.20 g/kW-hr None 0% 0.08 0.08 0.08 0.08 0.08 0.08
750 kW
FB05 Administration Building Emergency Generator (AEG) ICDE3 2-02-001-02 NF 500 hours 0.20 0.20 0.20 g/kW-hr None 0% 0.08 0.08 0.08 0.08 0.08 0.08
750 kW
FB06 Electrowinning Building Emergency Generator (EWEG) ICDE1 2-02-001-02 NF 500 hours 0.40 0.40 0.40 g/kW-hr None 0% 0.01 0.01 0.01 0.01 0.01 0.01
50 kW
FB07 Primary Crusher Fire Water Pump (PCFWP) ICDE2 2-02-001-02 NF 500 hours 0.20 0.20 0.20 g/kW-hr None 0% 0.03 0.03 0.03 0.03 0.03 0.03
400 hp
Rosemont Copper ProjectEmission Inventory Information JBR ENVIRONMENTAL CONSULTANTS, INC.
November 2011Page H158
AZRP00340
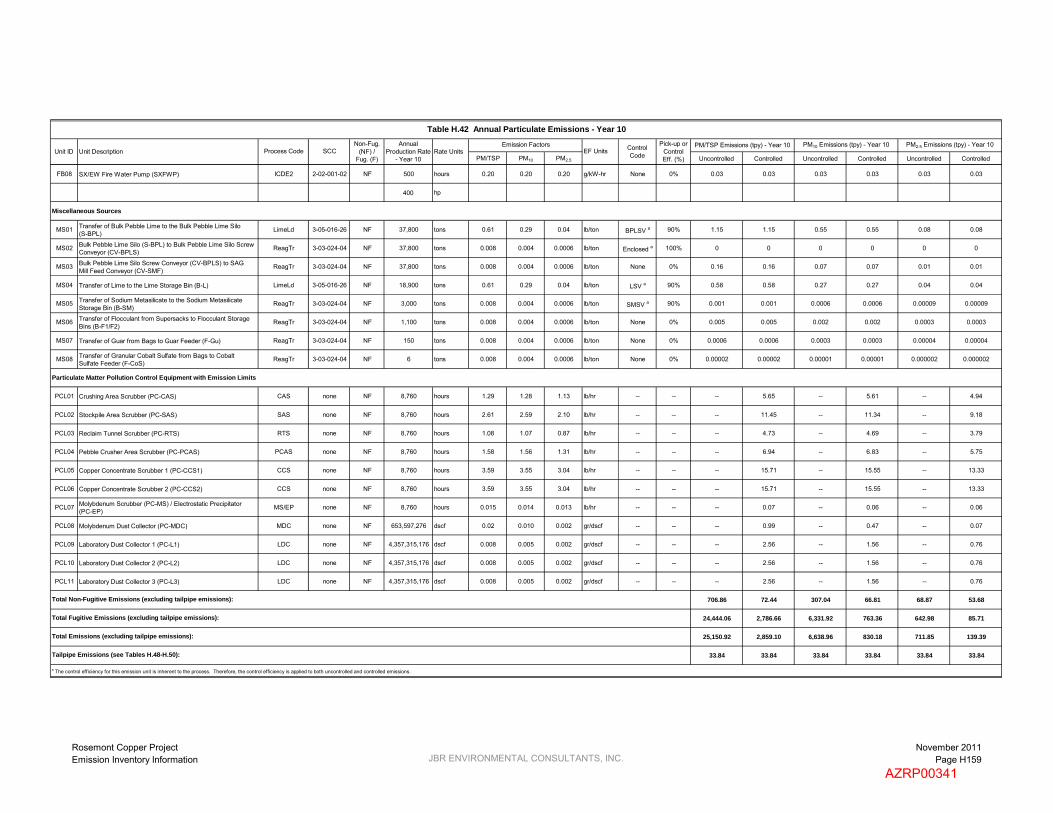
PM/TSP PM10 PM2.5 Uncontrolled Controlled Uncontrolled Controlled Uncontrolled Controlled
Table H.42 Annual Particulate Emissions - Year 10Annual
Production Rate - Year 10
Control CodeRate UnitsUnit ID Unit Description Process Code SCC
Non-Fug. (NF) /
Fug. (F)
Pick-up or Control Eff. (%)
Emission FactorsEF Units
PM/TSP Emissions (tpy) - Year 10 PM2.5 Emissions (tpy) - Year 10PM10 Emissions (tpy) - Year 10
FB08 SX/EW Fire Water Pump (SXFWP) ICDE2 2-02-001-02 NF 500 hours 0.20 0.20 0.20 g/kW-hr None 0% 0.03 0.03 0.03 0.03 0.03 0.03
400 hp
Miscellaneous Sources
MS01 Transfer of Bulk Pebble Lime to the Bulk Pebble Lime Silo(S-BPL) LimeLd 3-05-016-26 NF 37,800 tons 0.61 0.29 0.04 lb/ton BPLSV a 90% 1.15 1.15 0.55 0.55 0.08 0.08
MS02 Bulk Pebble Lime Silo (S-BPL) to Bulk Pebble Lime Silo Screw Conveyor (CV-BPLS) ReagTr 3-03-024-04 NF 37,800 tons 0.008 0.004 0.0006 lb/ton Enclosed a 100% 0 0 0 0 0 0
MS03 Bulk Pebble Lime Silo Screw Conveyor (CV-BPLS) to SAGMill Feed Conveyor (CV-SMF)
ReagTr 3-03-024-04 NF 37,800 tons 0.008 0.004 0.0006 lb/ton None 0% 0.16 0.16 0.07 0.07 0.01 0.01
MS04 Transfer of Lime to the Lime Storage Bin (B-L) LimeLd 3-05-016-26 NF 18,900 tons 0.61 0.29 0.04 lb/ton LSV a 90% 0.58 0.58 0.27 0.27 0.04 0.04
MS05 Transfer of Sodium Metasilicate to the Sodium MetasilicateStorage Bin (B-SM)
ReagTr 3-03-024-04 NF 3,000 tons 0.008 0.004 0.0006 lb/ton SMSV a 90% 0.001 0.001 0.0006 0.0006 0.00009 0.00009
MS06 Transfer of Flocculant from Supersacks to Flocculant Storage Bins (B-F1/F2)
ReagTr 3-03-024-04 NF 1,100 tons 0.008 0.004 0.0006 lb/ton None 0% 0.005 0.005 0.002 0.002 0.0003 0.0003
MS07 Transfer of Guar from Bags to Guar Feeder (F-Gu) ReagTr 3-03-024-04 NF 150 tons 0.008 0.004 0.0006 lb/ton None 0% 0.0006 0.0006 0.0003 0.0003 0.00004 0.00004
MS08 Transfer of Granular Cobalt Sulfate from Bags to CobaltSulfate Feeder (F-CoS)
ReagTr 3-03-024-04 NF 6 tons 0.008 0.004 0.0006 lb/ton None 0% 0.00002 0.00002 0.00001 0.00001 0.000002 0.000002
Particulate Matter Pollution Control Equipment with Emission Limits
PCL01 Crushing Area Scrubber (PC-CAS) CAS none NF 8,760 hours 1.29 1.28 1.13 lb/hr -- -- -- 5.65 -- 5.61 -- 4.94
PCL02 Stockpile Area Scrubber (PC-SAS) SAS none NF 8,760 hours 2.61 2.59 2.10 lb/hr -- -- -- 11.45 -- 11.34 -- 9.18
PCL03 Reclaim Tunnel Scrubber (PC-RTS) RTS none NF 8,760 hours 1.08 1.07 0.87 lb/hr -- -- -- 4.73 -- 4.69 -- 3.79
PCL04 Pebble Crusher Area Scrubber (PC-PCAS) PCAS none NF 8,760 hours 1.58 1.56 1.31 lb/hr -- -- -- 6.94 -- 6.83 -- 5.75
PCL05 Copper Concentrate Scrubber 1 (PC-CCS1) CCS none NF 8,760 hours 3.59 3.55 3.04 lb/hr -- -- -- 15.71 -- 15.55 -- 13.33
PCL06 Copper Concentrate Scrubber 2 (PC-CCS2) CCS none NF 8,760 hours 3.59 3.55 3.04 lb/hr -- -- -- 15.71 -- 15.55 -- 13.33
PCL07 Molybdenum Scrubber (PC-MS) / Electrostatic Precipitator (PC-EP) MS/EP none NF 8,760 hours 0.015 0.014 0.013 lb/hr -- -- -- 0.07 -- 0.06 -- 0.06
PCL08 Molybdenum Dust Collector (PC-MDC) MDC none NF 653,597,276 dscf 0.02 0.010 0.002 gr/dscf -- -- -- 0.99 -- 0.47 -- 0.07
PCL09 Laboratory Dust Collector 1 (PC-L1) LDC none NF 4,357,315,176 dscf 0.008 0.005 0.002 gr/dscf -- -- -- 2.56 -- 1.56 -- 0.76
PCL10 Laboratory Dust Collector 2 (PC-L2) LDC none NF 4,357,315,176 dscf 0.008 0.005 0.002 gr/dscf -- -- -- 2.56 -- 1.56 -- 0.76
PCL11 Laboratory Dust Collector 3 (PC-L3) LDC none NF 4,357,315,176 dscf 0.008 0.005 0.002 gr/dscf -- -- -- 2.56 -- 1.56 -- 0.76
706.86 72.44 307.04 66.81 68.87 53.68
24,444.06 2,786.66 6,331.92 763.36 642.98 85.71
25,150.92 2,859.10 6,638.96 830.18 711.85 139.39
33.84 33.84 33.84 33.84 33.84 33.84
a The control efficiency for this emission unit is inherent to the process. Therefore, the control efficiency is applied to both uncontrolled and controlled emissions.
Tailpipe Emissions (see Tables H.48-H.50):
Total Emissions (excluding tailpipe emissions):
Total Non-Fugitive Emissions (excluding tailpipe emissions):
Total Fugitive Emissions (excluding tailpipe emissions):
Rosemont Copper ProjectEmission Inventory Information JBR ENVIRONMENTAL CONSULTANTS, INC.
November 2011Page H159
AZRP00341

PM/TSP PM10 PM2.5 Uncontrolled Controlled Uncontrolled Controlled Uncontrolled Controlled
Mining
MN01 Drilling Drilling 3-05-020-10 F 80 holes 1.30 0.43 0.08 lb/hole None 0% 0.05 0.05 0.02 0.02 0.003 0.003
MN02 Blasting Blast 3-05-020-09 F 1.0 blasts 328.26 170.69 9.85 lb/blast None 0% 0.16 0.16 0.09 0.09 0.005 0.005
MN03 Loading Concentrate Ore Loading 3-03-024-08 F 90,000 tons 0.0007 0.0003 0.00005 lb/ton None 0% 0.03 0.03 0.01 0.01 0.002 0.002
MN04 Loading Leach Ore Loading 3-03-024-08 F 0 tons 0.0007 0.0003 0.00005 lb/ton None 0% 0 0 0 0 0 0
MN05 Loading Waste Rock Loading 3-03-024-08 F 268,200 tons 0.0007 0.0003 0.00005 lb/ton None 0% 0.09 0.09 0.04 0.04 0.007 0.007
MN06a Hauling Concentrate Ore to Primary Crusher Dump Hopper / Run of Mine Stockpile (Inside the Pit)
HaulingHD 3-05-020-11 F 1,459 VMT 21.25 5.46 0.55 lb/VMT HaulRdUI 90% 15.50 1.55 3.98 0.40 0.40 0.04
MN06b Hauling Concentrate Ore to Primary Crusher Dump Hopper / Run of Mine Stockpile (Outside the Pit)
HaulingHD 3-05-020-11 F 462 VMT 21.25 5.46 0.55 lb/VMT HaulRdUO 90% 4.90 0.49 1.26 0.13 0.13 0.01
MN07a Hauling Leach Ore to Leach Pad (Inside the Pit) HaulingHD 3-05-020-11 F 0 VMT 21.25 5.46 0.55 lb/VMT HaulRdUI 90% 0 0 0 0 0 0
MN07b Hauling Leach Ore to Leach Pad (Outside the Pit) HaulingHD 3-05-020-11 F 0 VMT 21.25 5.46 0.55 lb/VMT HaulRdUO 90% 0 0 0 0 0 0
MN08a Hauling Waste Rock to Waste Rock Storage Area (Inside the Pit)
HaulingHD 3-05-020-11 F 2,113 VMT 21.25 5.46 0.55 lb/VMT HaulRdUI 90% 22.45 2.24 5.77 0.58 0.58 0.06
MN08b Hauling Waste Rock to Waste Rock Storage Area (Outside the Pit)
HaulingHD 3-05-020-11 F 3,253 VMT 21.25 5.46 0.55 lb/VMT HaulRdUO 90% 34.56 3.46 8.88 0.89 0.89 0.09
MN09 Unloading Concentrate Ore to Run of Mine Stockpile TrStnUnp 3-03-024-08 F 90,000 tons 0.001 0.0006 0.00009 lb/ton None 0% 0.05 0.05 0.03 0.03 0.004 0.004
MN10 Unloading Leach Ore to Leach Pad TrStnUnp 3-03-024-08 F 0 tons 0.001 0.0006 0.00009 lb/ton None 0% 0 0 0 0 0 0
MN11 Unloading Waste Rock to Waste Rock Storage Area TrStnUnp 3-03-024-08 F 268,200 tons 0.001 0.0006 0.00009 lb/ton None 0% 0.16 0.16 0.08 0.08 0.01 0.01
MN12 Bulldozer Use Bldzrs 3-05-010-99 F 152 hrs 2.82 0.43 0.30 lb/hr None 0% 0.21 0.21 0.03 0.03 0.02 0.02
MN13a Water Truck Use (Inside the Pit) WtrTrksHD 3-05-010-99 F 230 VMT 17.06 4.38 0.44 lb/VMT HaulRdWTI 90% 1.97 0.20 0.51 0.05 0.05 0.005
MN13b Water Truck Use (Outside the Pit) WtrTrksHD 3-05-010-99 F 240 VMT 17.06 4.38 0.44 lb/VMT HaulRdWTO 90% 2.04 0.20 0.53 0.05 0.05 0.005
MN14 Grader Use GradersY10 3-05-010-99 F 238 VMT 2.05 0.71 0.06 lb/VMT None 0% 0.24 0.24 0.09 0.09 0.008 0.008
MN15a Support Vehicle Use (Inside the Pit) SupVehY10D 3-05-010-99 F 1,857 VMT 7.19 1.85 0.18 lb/VMT HaulRdUI 90% 6.67 0.67 1.71 0.17 0.17 0.02
MN15b Support Vehicle Use (Outside the Pit) SupVehY10D 3-05-010-99 F 1,857 VMT 7.19 1.85 0.18 lb/VMT HaulRdUO 90% 6.67 0.67 1.71 0.17 0.17 0.02
Primary Crushing, Conveying, Coarse Ore Storage, and Reclaim Conveying
PC01 Wind Erosion of the Run of Mine Stockpile WindROM 3-03-888-01 F 26 acres 0.21 0.11 0.02 ton/acre-yr None 0% 0.01 0.01 0.007 0.007 0.001 0.001
PC02 Unloading to Primary Crusher Dump Hopper (H-CDp) fromHaul Trucks or Run of Mine Stockpile
TrStnUnp 3-03-024-08 F 166,800 tons 0.001 0.0006 0.00009 lb/ton WSpry 82.5% 0.10 0.02 0.05 0.008 0.007 0.001
PC03 Primary Crusher (PCr) CrushP 3-03-024-05 NF 166,800 tons 0.02 0.009 0.002 lb/ton CAS 100% 1.67 0 0.75 0 0.14 0
PC04 Primary Crusher (PCr) to Crusher Discharge Hopper (H-CDs) TrStnPrt 3-03-024-08 NF 166,800 tons 0.0002 0.00007 0.00001 lb/ton Enclosed a 100% 0 0 0 0 0 0
PC05 Crusher Discharge Hopper (H-CDs) to Crusher DischargeFeeder (F-CD)
TrStnPrt 3-03-024-08 NF 166,800 tons 0.0002 0.00007 0.00001 lb/ton CAS 100% 0.01 0 0.006 0 0.0009 0
PC06 Crusher Discharge Feeder (F-CD) to Stockpile FeedConveyor (CV-SF)
TrStnPrt 3-03-024-08 NF 166,800 tons 0.0002 0.00007 0.00001 lb/ton CAS 100% 0.01 0 0.006 0 0.0009 0
PC07 Stockpile Feed Conveyor (CV-SF) to Stockpile TripperConveyor (CV-ST)
TrStnPrt 3-03-024-08 NF 166,800 tons 0.0002 0.00007 0.00001 lb/ton SAS 100% 0.01 0 0.006 0 0.0009 0
Control CodeRate Units
Non-Fug. (NF) /
Fug. (F)
Emission FactorsUnit ID Unit Description Process Code SCC Daily Production
Rate - Year 10EF Units
Table H.43 Maximum Daily Particulate Emissions - Year 10
PM/TSP Emissions (tpd) - Year 10 PM10 Emissions (tpd) - Year 10 PM2.5 Emissions (tpd) - Year 10Pick-up or Control Eff. (%)
Rosemont Copper ProjectEmission Inventory Information JBR ENVIRONMENTAL CONSULTANTS, INC.
November 2011Page H160
AZRP00342
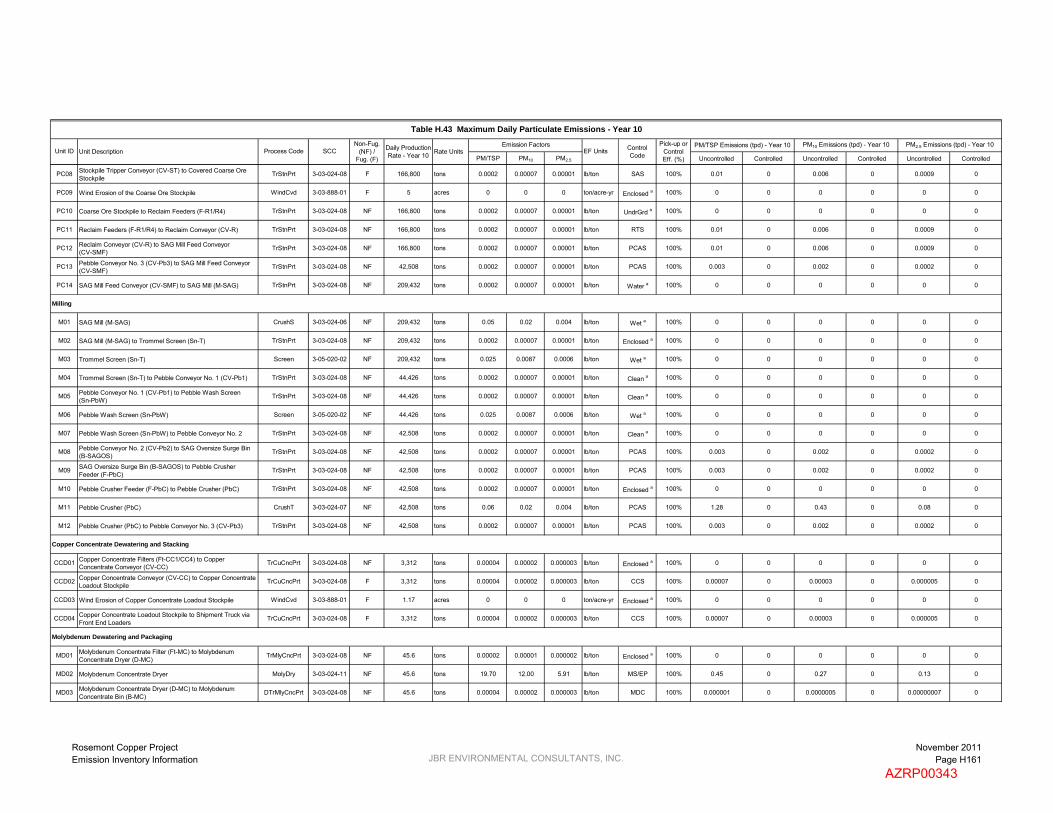
PM/TSP PM10 PM2.5 Uncontrolled Controlled Uncontrolled Controlled Uncontrolled Controlled
Control CodeRate Units
Non-Fug. (NF) /
Fug. (F)
Emission FactorsUnit ID Unit Description Process Code SCC Daily Production
Rate - Year 10EF Units
Table H.43 Maximum Daily Particulate Emissions - Year 10
PM/TSP Emissions (tpd) - Year 10 PM10 Emissions (tpd) - Year 10 PM2.5 Emissions (tpd) - Year 10Pick-up or Control Eff. (%)
PC08 Stockpile Tripper Conveyor (CV-ST) to Covered Coarse Ore Stockpile
TrStnPrt 3-03-024-08 F 166,800 tons 0.0002 0.00007 0.00001 lb/ton SAS 100% 0.01 0 0.006 0 0.0009 0
PC09 Wind Erosion of the Coarse Ore Stockpile WindCvd 3-03-888-01 F 5 acres 0 0 0 ton/acre-yr Enclosed a 100% 0 0 0 0 0 0
PC10 Coarse Ore Stockpile to Reclaim Feeders (F-R1/R4) TrStnPrt 3-03-024-08 NF 166,800 tons 0.0002 0.00007 0.00001 lb/ton UndrGrd a 100% 0 0 0 0 0 0
PC11 Reclaim Feeders (F-R1/R4) to Reclaim Conveyor (CV-R) TrStnPrt 3-03-024-08 NF 166,800 tons 0.0002 0.00007 0.00001 lb/ton RTS 100% 0.01 0 0.006 0 0.0009 0
PC12 Reclaim Conveyor (CV-R) to SAG Mill Feed Conveyor(CV-SMF) TrStnPrt 3-03-024-08 NF 166,800 tons 0.0002 0.00007 0.00001 lb/ton PCAS 100% 0.01 0 0.006 0 0.0009 0
PC13 Pebble Conveyor No. 3 (CV-Pb3) to SAG Mill Feed Conveyor (CV-SMF)
TrStnPrt 3-03-024-08 NF 42,508 tons 0.0002 0.00007 0.00001 lb/ton PCAS 100% 0.003 0 0.002 0 0.0002 0
PC14 SAG Mill Feed Conveyor (CV-SMF) to SAG Mill (M-SAG) TrStnPrt 3-03-024-08 NF 209,432 tons 0.0002 0.00007 0.00001 lb/ton Water a 100% 0 0 0 0 0 0
Milling
M01 SAG Mill (M-SAG) CrushS 3-03-024-06 NF 209,432 tons 0.05 0.02 0.004 lb/ton Wet a 100% 0 0 0 0 0 0
M02 SAG Mill (M-SAG) to Trommel Screen (Sn-T) TrStnPrt 3-03-024-08 NF 209,432 tons 0.0002 0.00007 0.00001 lb/ton Enclosed a 100% 0 0 0 0 0 0
M03 Trommel Screen (Sn-T) Screen 3-05-020-02 NF 209,432 tons 0.025 0.0087 0.0006 lb/ton Wet a 100% 0 0 0 0 0 0
M04 Trommel Screen (Sn-T) to Pebble Conveyor No. 1 (CV-Pb1) TrStnPrt 3-03-024-08 NF 44,426 tons 0.0002 0.00007 0.00001 lb/ton Clean a 100% 0 0 0 0 0 0
M05 Pebble Conveyor No. 1 (CV-Pb1) to Pebble Wash Screen(Sn-PbW)
TrStnPrt 3-03-024-08 NF 44,426 tons 0.0002 0.00007 0.00001 lb/ton Clean a 100% 0 0 0 0 0 0
M06 Pebble Wash Screen (Sn-PbW) Screen 3-05-020-02 NF 44,426 tons 0.025 0.0087 0.0006 lb/ton Wet a 100% 0 0 0 0 0 0
M07 Pebble Wash Screen (Sn-PbW) to Pebble Conveyor No. 2 TrStnPrt 3-03-024-08 NF 42,508 tons 0.0002 0.00007 0.00001 lb/ton Clean a 100% 0 0 0 0 0 0
M08 Pebble Conveyor No. 2 (CV-Pb2) to SAG Oversize Surge Bin(B-SAGOS) TrStnPrt 3-03-024-08 NF 42,508 tons 0.0002 0.00007 0.00001 lb/ton PCAS 100% 0.003 0 0.002 0 0.0002 0
M09 SAG Oversize Surge Bin (B-SAGOS) to Pebble CrusherFeeder (F-PbC)
TrStnPrt 3-03-024-08 NF 42,508 tons 0.0002 0.00007 0.00001 lb/ton PCAS 100% 0.003 0 0.002 0 0.0002 0
M10 Pebble Crusher Feeder (F-PbC) to Pebble Crusher (PbC) TrStnPrt 3-03-024-08 NF 42,508 tons 0.0002 0.00007 0.00001 lb/ton Enclosed a 100% 0 0 0 0 0 0
M11 Pebble Crusher (PbC) CrushT 3-03-024-07 NF 42,508 tons 0.06 0.02 0.004 lb/ton PCAS 100% 1.28 0 0.43 0 0.08 0
M12 Pebble Crusher (PbC) to Pebble Conveyor No. 3 (CV-Pb3) TrStnPrt 3-03-024-08 NF 42,508 tons 0.0002 0.00007 0.00001 lb/ton PCAS 100% 0.003 0 0.002 0 0.0002 0
Copper Concentrate Dewatering and Stacking
CCD01 Copper Concentrate Filters (Ft-CC1/CC4) to Copper Concentrate Conveyor (CV-CC) TrCuCncPrt 3-03-024-08 NF 3,312 tons 0.00004 0.00002 0.000003 lb/ton Enclosed a 100% 0 0 0 0 0 0
CCD02 Copper Concentrate Conveyor (CV-CC) to Copper Concentrate Loadout Stockpile
TrCuCncPrt 3-03-024-08 F 3,312 tons 0.00004 0.00002 0.000003 lb/ton CCS 100% 0.00007 0 0.00003 0 0.000005 0
CCD03 Wind Erosion of Copper Concentrate Loadout Stockpile WindCvd 3-03-888-01 F 1.17 acres 0 0 0 ton/acre-yr Enclosed a 100% 0 0 0 0 0 0
CCD04 Copper Concentrate Loadout Stockpile to Shipment Truck via Front End Loaders
TrCuCncPrt 3-03-024-08 F 3,312 tons 0.00004 0.00002 0.000003 lb/ton CCS 100% 0.00007 0 0.00003 0 0.000005 0
Molybdenum Dewatering and Packaging
MD01 Molybdenum Concentrate Filter (Ft-MC) to Molybdenum Concentrate Dryer (D-MC)
TrMlyCncPrt 3-03-024-08 NF 45.6 tons 0.00002 0.00001 0.000002 lb/ton Enclosed a 100% 0 0 0 0 0 0
MD02 Molybdenum Concentrate Dryer MolyDry 3-03-024-11 NF 45.6 tons 19.70 12.00 5.91 lb/ton MS/EP 100% 0.45 0 0.27 0 0.13 0
MD03 Molybdenum Concentrate Dryer (D-MC) to MolybdenumConcentrate Bin (B-MC)
DTrMlyCncPrt 3-03-024-08 NF 45.6 tons 0.00004 0.00002 0.000003 lb/ton MDC 100% 0.000001 0 0.0000005 0 0.00000007 0
Rosemont Copper ProjectEmission Inventory Information JBR ENVIRONMENTAL CONSULTANTS, INC.
November 2011Page H161
AZRP00343

PM/TSP PM10 PM2.5 Uncontrolled Controlled Uncontrolled Controlled Uncontrolled Controlled
Control CodeRate Units
Non-Fug. (NF) /
Fug. (F)
Emission FactorsUnit ID Unit Description Process Code SCC Daily Production
Rate - Year 10EF Units
Table H.43 Maximum Daily Particulate Emissions - Year 10
PM/TSP Emissions (tpd) - Year 10 PM10 Emissions (tpd) - Year 10 PM2.5 Emissions (tpd) - Year 10Pick-up or Control Eff. (%)
MD04 Molybdenum Concentrate Bin (B-MC) to MolybdenumConcentrate Hopper (H-MC)
DTrMlyCnc 3-03-024-08 NF 45.6 tons 0.0003 0.0002 0.00002 lb/ton None 0% 0.000008 0.000008 0.000004 0.000004 0.0000005 0.0000005
MD05 Molybdenum Concentrate Hopper (H-MC) to MolybdenumConcentrate Conveyor (CV-MC)
DTrMlyCncPrt 3-03-024-08 NF 45.6 tons 0.00004 0.00002 0.000003 lb/ton Enclosed a 100% 0 0 0 0 0 0
MD06 Molybdenum Concentrate Conveyor (CV-MC) to Molybdenum Packaging and Weigh System (MPS)
DTrMlyCnc 3-03-024-08 NF 45.6 tons 0.0003 0.0002 0.00002 lb/ton MDC 100% 0.000008 0 0.000004 0 0.0000005 0
Tailings Dewatering and Placement
TDS01 Tailings Filters (Ft-T1/T14) to Tailings Belt Feeders (F-T1/T14) FiltTailPrt 3-03-024-08 NF 257,328 tons 0.00002 0.00001 0.000002 lb/ton Enclosed a 100% 0 0 0 0 0 0
TDS02 Tailings Belt Feeders (F-T1/T14) to Fixed Tailings ConveyorNo. 1 (CV-F1)
FiltTailPrt 3-03-024-08 NF 257,328 tons 0.00002 0.00001 0.000002 lb/ton Enclosed a 100% 0 0 0 0 0 0
TDS03 Fixed Tailings Conveyor No. 1 (CV-F1) to Fixed TailingsConveyor No. 2 (CV-F2)
FiltTailPrt 3-03-024-08 NF 257,328 tons 0.00002 0.00001 0.000002 lb/ton Enclosed a 100% 0 0 0 0 0 0
TDS04 Fixed Tailings Conveyor No. 2 (CV-F2) to Fixed Tailings Conveyor No. 3 (CV-F3)
FiltTailPrt 3-03-024-08 NF 257,328 tons 0.00002 0.00001 0.000002 lb/ton None 0% 0.003 0.003 0.001 0.001 0.0002 0.0002
TDS05 Fixed Tailings Conveyor No. 3 (CV-F3) to RelocatableConveyor (CV-R1)
FiltTailPrt 3-03-024-08 F 257,328 tons 0.00002 0.00001 0.000002 lb/ton None 0% 0.003 0.003 0.001 0.001 0.0002 0.0002
TDS06 Relocatable Conveyor (CV-R1) to Shiftable Conveyor (CV-S1) FiltTailPrt 3-03-024-08 F 257,328 tons 0.00002 0.00001 0.000002 lb/ton None 0% 0.003 0.003 0.001 0.001 0.0002 0.0002
TDS07 Shiftable Conveyor (CV-S1) to Belt Wagon Conveyor(CV-BW1)
FiltTail 3-03-024-08 F 257,328 tons 0.0002 0.00009 0.00001 lb/ton None 0% 0.02 0.02 0.01 0.01 0.002 0.002
TDS08 Belt Wagon Conveyor (CV-BW1) to Spreader Crawler Mounted Conveyor (CV-SP1)
FiltTail 3-03-024-08 F 257,328 tons 0.0002 0.00009 0.00001 lb/ton None 0% 0.02 0.02 0.01 0.01 0.002 0.002
TDS09 Spreader Crawler Mounted Conveyor (CV-SP1) to Tailings Storage
FiltTail 3-03-024-08 F 257,328 tons 0.0002 0.00009 0.00001 lb/ton None 0% 0.02 0.02 0.01 0.01 0.002 0.002
TDS10 Wind Erosion of Tailings Storage TailStrg 3-03-888-01 F 1,500 acres 0.02 0.01 0.002 ton/acre-yr None 0% 0.08 0.08 0.04 0.04 0.006 0.006
Fuel Burning Equipment
FB01 Diesel Electrowinning Hot Water Generator (HWG) DFB 1-02-005-03 NF 24 hours 3.30 2.30 1.54 lb/1000 gal None 0% 0.002 0.002 0.001 0.001 0.0008 0.0008
6.0 MMBtu/hr
FB02 Thickener Area Emergency Generator (TEG) ICDE3 2-02-001-02 NF 24 hours 0.20 0.20 0.20 g/kW-hr None 0% 0.005 0.005 0.005 0.005 0.005 0.005
1,000 kW
FB03 PLS Pond Area Emergency Generator (PEG) ICDE3 2-02-001-02 NF 24 hours 0.20 0.20 0.20 g/kW-hr None 0% 0.005 0.005 0.005 0.005 0.005 0.005
1,000 kW
FB04 Main Substation Emergency Generator (MEG) ICDE3 2-02-001-02 NF 24 hours 0.20 0.20 0.20 g/kW-hr None 0% 0.004 0.004 0.004 0.004 0.004 0.004
750 kW
FB05 Administration Building Emergency Generator (AEG) ICDE3 2-02-001-02 NF 24 hours 0.20 0.20 0.20 g/kW-hr None 0% 0.004 0.004 0.004 0.004 0.004 0.004
750 kW
FB06 Electrowinning Building Emergency Generator (EWEG) ICDE1 2-02-001-02 NF 24 hours 0.40 0.40 0.40 g/kW-hr None 0% 0.0005 0.0005 0.0005 0.0005 0.0005 0.0005
50 kW
FB07 Primary Crusher Fire Water Pump (PCFWP) ICDE2 2-02-001-02 NF 24 hours 0.20 0.20 0.20 g/kW-hr None 0% 0.002 0.002 0.002 0.002 0.002 0.002
400 hp
Rosemont Copper ProjectEmission Inventory Information JBR ENVIRONMENTAL CONSULTANTS, INC.
November 2011Page H162
AZRP00344

PM/TSP PM10 PM2.5 Uncontrolled Controlled Uncontrolled Controlled Uncontrolled Controlled
Control CodeRate Units
Non-Fug. (NF) /
Fug. (F)
Emission FactorsUnit ID Unit Description Process Code SCC Daily Production
Rate - Year 10EF Units
Table H.43 Maximum Daily Particulate Emissions - Year 10
PM/TSP Emissions (tpd) - Year 10 PM10 Emissions (tpd) - Year 10 PM2.5 Emissions (tpd) - Year 10Pick-up or Control Eff. (%)
FB08 SX/EW Fire Water Pump (SXFWP) ICDE2 2-02-001-02 NF 24 hours 0.20 0.20 0.20 g/kW-hr None 0% 0.002 0.002 0.002 0.002 0.002 0.002
400 hp
Miscellaneous Sources
MS01 Transfer of Bulk Pebble Lime to the Bulk Pebble Lime Silo(S-BPL) LimeLd 3-05-016-26 NF 124.27 tons 0.61 0.29 0.04 lb/ton BPLSV a 90% 0.004 0.004 0.002 0.002 0.0003 0.0003
MS02 Bulk Pebble Lime Silo (S-BPL) to Bulk Pebble Lime Silo Screw Conveyor (CV-BPLS) ReagTr 3-03-024-04 NF 124.27 tons 0.008 0.004 0.0006 lb/ton Enclosed a 100% 0 0 0 0 0 0
MS03 Bulk Pebble Lime Silo Screw Conveyor (CV-BPLS) to SAGMill Feed Conveyor (CV-SMF)
ReagTr 3-03-024-04 NF 124.27 tons 0.008 0.004 0.0006 lb/ton None 0% 0.0005 0.0005 0.0002 0.0002 0.00004 0.00004
MS04 Transfer of Lime to the Lime Storage Bin (B-L) LimeLd 3-05-016-26 NF 62.14 tons 0.61 0.29 0.04 lb/ton LSV a 90% 0.002 0.002 0.0009 0.0009 0.0001 0.0001
MS05 Transfer of Sodium Metasilicate to the Sodium MetasilicateStorage Bin (B-SM)
ReagTr 3-03-024-04 NF 9.86 tons 0.008 0.004 0.0006 lb/ton SMSV a 90% 0.000004 0.000004 0.000002 0.000002 0.0000003 0.0000003
MS06 Transfer of Flocculant from Supersacks to Flocculant Storage Bins (B-F1/F2)
ReagTr 3-03-024-04 NF 3.62 tons 0.008 0.004 0.0006 lb/ton None 0% 0.00001 0.00001 0.000007 0.000007 0.000001 0.000001
MS07 Transfer of Guar from Bags to Guar Feeder (F-Gu) ReagTr 3-03-024-04 NF 0.49 tons 0.008 0.004 0.0006 lb/ton None 0% 0.000002 0.000002 0.000001 0.000001 0.0000001 0.0000001
MS08 Transfer of Granular Cobalt Sulfate from Bags to CobaltSulfate Feeder (F-CoS)
ReagTr 3-03-024-04 NF 0.02 tons 0.008 0.004 0.0006 lb/ton None 0% 0.00000008 0.00000008 0.00000004 0.00000004 0.000000006 0.000000006
Particulate Matter Pollution Control Equipment with Emission Limits
PCL01 Crushing Area Scrubber (PC-CAS) CAS none NF 24 hours 1.29 1.28 1.13 lb/hr -- -- -- 0.02 -- 0.02 -- 0.01
PCL02 Stockpile Area Scrubber (PC-SAS) SAS none NF 24 hours 2.61 2.59 2.10 lb/hr -- -- -- 0.03 -- 0.03 -- 0.03
PCL03 Reclaim Tunnel Scrubber (PC-RTS) RTS none NF 24 hours 1.08 1.07 0.87 lb/hr -- -- -- 0.01 -- 0.01 -- 0.01
PCL04 Pebble Crusher Area Scrubber (PC-PCAS) PCAS none NF 24 hours 1.58 1.56 1.31 lb/hr -- -- -- 0.02 -- 0.02 -- 0.02
PCL05 Copper Concentrate Scrubber 1 (PC-CCS1) CCS none NF 24 hours 3.59 3.55 3.04 lb/hr -- -- -- 0.04 -- 0.04 -- 0.04
PCL06 Copper Concentrate Scrubber 2 (PC-CCS2) CCS none NF 24 hours 3.59 3.55 3.04 lb/hr -- -- -- 0.04 -- 0.04 -- 0.04
PCL07 Molybdenum Scrubber (PC-MS) / Electrostatic Precipitator (PC-EP) MS/EP none NF 24 hours 0.015 0.014 0.013 lb/hr -- -- -- 0.0002 -- 0.0002 -- 0.0002
PCL08 Molybdenum Dust Collector (PC-MDC) MDC none NF 1,790,677 dscf 0.02 0.010 0.002 gr/dscf -- -- -- 0.003 -- 0.001 -- 0.0002
PCL09 Laboratory Dust Collector 1 (PC-L1) LDC none NF 11,937,850 dscf 0.008 0.005 0.002 gr/dscf -- -- -- 0.007 -- 0.004 -- 0.002
PCL10 Laboratory Dust Collector 2 (PC-L2) LDC none NF 11,937,850 dscf 0.008 0.005 0.002 gr/dscf -- -- -- 0.007 -- 0.004 -- 0.002
PCL11 Laboratory Dust Collector 3 (PC-L3) LDC none NF 11,937,850 dscf 0.008 0.005 0.002 gr/dscf -- -- -- 0.007 -- 0.004 -- 0.002
3.50 0.22 1.51 0.21 0.38 0.17
96.07 10.68 24.87 2.91 2.52 0.32
99.57 10.91 26.38 3.11 2.90 0.49
0.12 0.12 0.12 0.12 0.12 0.12
a The control efficiency for this emission unit is inherent to the process. Therefore, the control efficiency is applied to both uncontrolled and controlled emissions.
Tailpipe Emissions (see Tables H.48-H.50):
Total Emissions (excluding tailpipe emissions):
Total Non-Fugitive Emissions (excluding tailpipe emissions):
Total Fugitive Emissions (excluding tailpipe emissions):
Rosemont Copper ProjectEmission Inventory Information JBR ENVIRONMENTAL CONSULTANTS, INC.
November 2011Page H163
AZRP00345

PM/TSP PM10 PM2.5 Uncontrolled Controlled Uncontrolled Controlled Uncontrolled Controlled
Mining
MN01 Drilling Drilling 3-05-020-10 F 80 holes 1.30 0.43 0.08 lb/hole None 0% 104.00 104.00 34.67 34.67 6.42 6.42
MN02 Blasting Blast 3-05-020-09 F 1.00 blasts 328.26 170.69 9.85 lb/blast None 0% 328.26 328.26 170.69 170.69 9.85 9.85
MN03 Loading Concentrate Ore Loading 3-03-024-08 F 3,750 tons 0.0007 0.0003 0.00005 lb/ton None 0% 2.63 2.63 1.24 1.24 0.19 0.19
MN04 Loading Leach Ore Loading 3-03-024-08 F 0 tons 0.0007 0.0003 0.00005 lb/ton None 0% 0 0 0 0 0 0
MN05 Loading Waste Rock Loading 3-03-024-08 F 11,175 tons 0.0007 0.0003 0.00005 lb/ton None 0% 7.84 7.84 3.71 3.71 0.56 0.56
MN06a Hauling Concentrate Ore to Primary Crusher Dump Hopper / Run of Mine Stockpile (Inside the Pit)
HaulingHD 3-05-020-11 F 61 VMT 21.25 5.46 0.55 lb/VMT HaulRdUI 90% 1291.79 129.18 331.93 33.19 33.19 3.32
MN06b Hauling Concentrate Ore to Primary Crusher Dump Hopper / Run of Mine Stockpile (Outside the Pit)
HaulingHD 3-05-020-11 F 19 VMT 21.25 5.46 0.55 lb/VMT HaulRdUO 90% 408.62 40.86 105.00 10.50 10.50 1.05
MN07a Hauling Leach Ore to Leach Pad (Inside the Pit) HaulingHD 3-05-020-11 F 0 VMT 21.25 5.46 0.55 lb/VMT HaulRdUI 90% 0 0 0 0 0 0
MN07b Hauling Leach Ore to Leach Pad (Outside the Pit) HaulingHD 3-05-020-11 F 0 VMT 21.25 5.46 0.55 lb/VMT HaulRdUO 90% 0 0 0 0 0 0
MN08a Hauling Waste Rock to Waste Rock Storage Area (Inside the Pit)
HaulingHD 3-05-020-11 F 88 VMT 21.25 5.46 0.55 lb/VMT HaulRdUI 90% 1,870.62 187.06 480.66 48.07 48.07 4.81
MN08b Hauling Waste Rock to Waste Rock Storage Area (Outside the Pit)
HaulingHD 3-05-020-11 F 136 VMT 21.25 5.46 0.55 lb/VMT HaulRdUO 90% 2,880.03 288.00 740.03 74.00 74.00 7.40
MN09 Unloading Concentrate Ore to Run of Mine Stockpile TrStnUnp 3-03-024-08 F 3,750 tons 0.001 0.0006 0.00009 lb/ton None 0% 4.46 4.46 2.11 2.11 0.32 0.32
MN10 Unloading Leach Ore to Leach Pad TrStnUnp 3-03-024-08 F 0 tons 0.001 0.0006 0.00009 lb/ton None 0% 0 0 0 0 0 0
MN11 Unloading Waste Rock to Waste Rock Storage Area TrStnUnp 3-03-024-08 F 11,175 tons 0.001 0.0006 0.00009 lb/ton None 0% 13.28 13.28 6.28 6.28 0.95 0.95
MN12 Bulldozer Use Bldzrs 3-05-010-99 F 6 hrs 2.82 0.43 0.30 lb/hr None 0% 17.84 17.84 2.69 2.69 1.87 1.87
MN13a Water Truck Use (Inside the Pit) WtrTrksHD 3-05-010-99 F 10 VMT 17.06 4.38 0.44 lb/VMT HaulRdWTI 90% 163.87 16.39 42.11 4.21 4.21 0.42
MN13b Water Truck Use (Outside the Pit) WtrTrksHD 3-05-010-99 F 10 VMT 17.06 4.38 0.44 lb/VMT HaulRdWTO 90% 170.41 17.04 43.79 4.38 4.38 0.44
MN14 Grader Use GradersY10 3-05-010-99 F 10 VMT 2.05 0.71 0.06 lb/VMT None 0% 20.40 20.40 7.10 7.10 0.63 0.63
MN15a Support Vehicle Use (Inside the Pit) SupVehY10H 3-05-010-99 F 118 VMT 6.96 1.79 0.18 lb/VMT HaulRdUI 90% 823.98 82.40 211.72 21.17 21.17 2.12
MN15b Support Vehicle Use (Outside the Pit) SupVehY10H 3-05-010-99 F 118 VMT 6.96 1.79 0.18 lb/VMT HaulRdUO 90% 823.98 82.40 211.72 21.17 21.17 2.12
Primary Crushing, Conveying, Coarse Ore Storage, and Reclaim Conveying
PC01 Wind Erosion of the Run of Mine Stockpile WindROM 3-03-888-01 F 26 acres 0.21 0.11 0.02 ton/acre-yr None 0% 1.24 1.24 0.62 0.62 0.09 0.09
PC02 Unloading to Primary Crusher Dump Hopper (H-CDp) fromHaul Trucks or Run of Mine Stockpile
TrStnUnp 3-03-024-08 F 6,950 tons 0.001 0.0006 0.00009 lb/ton WSpry 82.5% 8.26 1.45 3.91 0.68 0.59 0.10
PC03 Primary Crusher (PCr) CrushP 3-03-024-05 NF 6,950 tons 0.02 0.009 0.002 lb/ton CAS 100% 139.00 0 62.55 0 11.58 0
PC04 Primary Crusher (PCr) to Crusher Discharge Hopper (H-CDs) TrStnPrt 3-03-024-08 NF 6,950 tons 0.0002 0.00007 0.00001 lb/ton Enclosed a 100% 0 0 0 0 0 0
PC05 Crusher Discharge Hopper (H-CDs) to Crusher DischargeFeeder (F-CD)
TrStnPrt 3-03-024-08 NF 6,950 tons 0.0002 0.00007 0.00001 lb/ton CAS 100% 1.08 0 0.51 0 0.08 0
PC06 Crusher Discharge Feeder (F-CD) to Stockpile FeedConveyor (CV-SF)
TrStnPrt 3-03-024-08 NF 6,950 tons 0.0002 0.00007 0.00001 lb/ton CAS 100% 1.08 0 0.51 0 0.08 0
PC07 Stockpile Feed Conveyor (CV-SF) to Stockpile TripperConveyor (CV-ST)
TrStnPrt 3-03-024-08 NF 6,950 tons 0.0002 0.00007 0.00001 lb/ton SAS 100% 1.08 0 0.51 0 0.08 0
PM2.5 Emissions (lb/hr) - Year 10PM/TSP Emissions (lb/hr) - Year 10Unit ID
Pick-up or Control Eff. (%)
Non-Fug. (NF) /
Fug. (F)Rate Units
Hourly Production Rate
- Year 10
Emission FactorsProcess Code
PM10 Emissions (lb/hr) - Year 10
Table H.44 Maximum Hourly Particulate Emissions - Year 10
SCC EF UnitsUnit Description Control Code
Rosemont Copper ProjectEmission Inventory Information JBR ENVIRONMENTAL CONSULTANTS, INC.
November 2011Page H164
AZRP00346
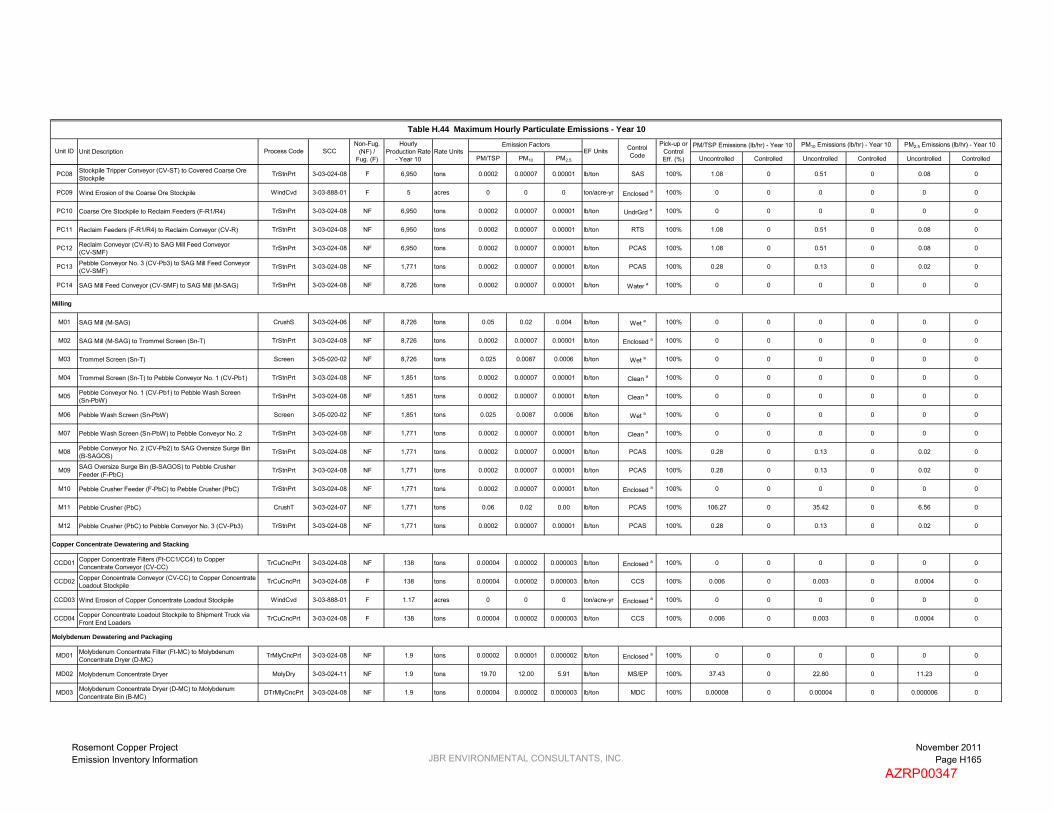
PM/TSP PM10 PM2.5 Uncontrolled Controlled Uncontrolled Controlled Uncontrolled Controlled
PM2.5 Emissions (lb/hr) - Year 10PM/TSP Emissions (lb/hr) - Year 10Unit ID
Pick-up or Control Eff. (%)
Non-Fug. (NF) /
Fug. (F)Rate Units
Hourly Production Rate
- Year 10
Emission FactorsProcess Code
PM10 Emissions (lb/hr) - Year 10
Table H.44 Maximum Hourly Particulate Emissions - Year 10
SCC EF UnitsUnit Description Control Code
PC08 Stockpile Tripper Conveyor (CV-ST) to Covered Coarse Ore Stockpile
TrStnPrt 3-03-024-08 F 6,950 tons 0.0002 0.00007 0.00001 lb/ton SAS 100% 1.08 0 0.51 0 0.08 0
PC09 Wind Erosion of the Coarse Ore Stockpile WindCvd 3-03-888-01 F 5 acres 0 0 0 ton/acre-yr Enclosed a 100% 0 0 0 0 0 0
PC10 Coarse Ore Stockpile to Reclaim Feeders (F-R1/R4) TrStnPrt 3-03-024-08 NF 6,950 tons 0.0002 0.00007 0.00001 lb/ton UndrGrd a 100% 0 0 0 0 0 0
PC11 Reclaim Feeders (F-R1/R4) to Reclaim Conveyor (CV-R) TrStnPrt 3-03-024-08 NF 6,950 tons 0.0002 0.00007 0.00001 lb/ton RTS 100% 1.08 0 0.51 0 0.08 0
PC12 Reclaim Conveyor (CV-R) to SAG Mill Feed Conveyor(CV-SMF) TrStnPrt 3-03-024-08 NF 6,950 tons 0.0002 0.00007 0.00001 lb/ton PCAS 100% 1.08 0 0.51 0 0.08 0
PC13 Pebble Conveyor No. 3 (CV-Pb3) to SAG Mill Feed Conveyor (CV-SMF)
TrStnPrt 3-03-024-08 NF 1,771 tons 0.0002 0.00007 0.00001 lb/ton PCAS 100% 0.28 0 0.13 0 0.02 0
PC14 SAG Mill Feed Conveyor (CV-SMF) to SAG Mill (M-SAG) TrStnPrt 3-03-024-08 NF 8,726 tons 0.0002 0.00007 0.00001 lb/ton Water a 100% 0 0 0 0 0 0
Milling
M01 SAG Mill (M-SAG) CrushS 3-03-024-06 NF 8,726 tons 0.05 0.02 0.004 lb/ton Wet a 100% 0 0 0 0 0 0
M02 SAG Mill (M-SAG) to Trommel Screen (Sn-T) TrStnPrt 3-03-024-08 NF 8,726 tons 0.0002 0.00007 0.00001 lb/ton Enclosed a 100% 0 0 0 0 0 0
M03 Trommel Screen (Sn-T) Screen 3-05-020-02 NF 8,726 tons 0.025 0.0087 0.0006 lb/ton Wet a 100% 0 0 0 0 0 0
M04 Trommel Screen (Sn-T) to Pebble Conveyor No. 1 (CV-Pb1) TrStnPrt 3-03-024-08 NF 1,851 tons 0.0002 0.00007 0.00001 lb/ton Clean a 100% 0 0 0 0 0 0
M05 Pebble Conveyor No. 1 (CV-Pb1) to Pebble Wash Screen(Sn-PbW)
TrStnPrt 3-03-024-08 NF 1,851 tons 0.0002 0.00007 0.00001 lb/ton Clean a 100% 0 0 0 0 0 0
M06 Pebble Wash Screen (Sn-PbW) Screen 3-05-020-02 NF 1,851 tons 0.025 0.0087 0.0006 lb/ton Wet a 100% 0 0 0 0 0 0
M07 Pebble Wash Screen (Sn-PbW) to Pebble Conveyor No. 2 TrStnPrt 3-03-024-08 NF 1,771 tons 0.0002 0.00007 0.00001 lb/ton Clean a 100% 0 0 0 0 0 0
M08 Pebble Conveyor No. 2 (CV-Pb2) to SAG Oversize Surge Bin(B-SAGOS) TrStnPrt 3-03-024-08 NF 1,771 tons 0.0002 0.00007 0.00001 lb/ton PCAS 100% 0.28 0 0.13 0 0.02 0
M09 SAG Oversize Surge Bin (B-SAGOS) to Pebble CrusherFeeder (F-PbC)
TrStnPrt 3-03-024-08 NF 1,771 tons 0.0002 0.00007 0.00001 lb/ton PCAS 100% 0.28 0 0.13 0 0.02 0
M10 Pebble Crusher Feeder (F-PbC) to Pebble Crusher (PbC) TrStnPrt 3-03-024-08 NF 1,771 tons 0.0002 0.00007 0.00001 lb/ton Enclosed a 100% 0 0 0 0 0 0
M11 Pebble Crusher (PbC) CrushT 3-03-024-07 NF 1,771 tons 0.06 0.02 0.00 lb/ton PCAS 100% 106.27 0 35.42 0 6.56 0
M12 Pebble Crusher (PbC) to Pebble Conveyor No. 3 (CV-Pb3) TrStnPrt 3-03-024-08 NF 1,771 tons 0.0002 0.00007 0.00001 lb/ton PCAS 100% 0.28 0 0.13 0 0.02 0
Copper Concentrate Dewatering and Stacking
CCD01 Copper Concentrate Filters (Ft-CC1/CC4) to Copper Concentrate Conveyor (CV-CC) TrCuCncPrt 3-03-024-08 NF 138 tons 0.00004 0.00002 0.000003 lb/ton Enclosed a 100% 0 0 0 0 0 0
CCD02 Copper Concentrate Conveyor (CV-CC) to Copper Concentrate Loadout Stockpile
TrCuCncPrt 3-03-024-08 F 138 tons 0.00004 0.00002 0.000003 lb/ton CCS 100% 0.006 0 0.003 0 0.0004 0
CCD03 Wind Erosion of Copper Concentrate Loadout Stockpile WindCvd 3-03-888-01 F 1.17 acres 0 0 0 ton/acre-yr Enclosed a 100% 0 0 0 0 0 0
CCD04 Copper Concentrate Loadout Stockpile to Shipment Truck via Front End Loaders
TrCuCncPrt 3-03-024-08 F 138 tons 0.00004 0.00002 0.000003 lb/ton CCS 100% 0.006 0 0.003 0 0.0004 0
Molybdenum Dewatering and Packaging
MD01 Molybdenum Concentrate Filter (Ft-MC) to Molybdenum Concentrate Dryer (D-MC)
TrMlyCncPrt 3-03-024-08 NF 1.9 tons 0.00002 0.00001 0.000002 lb/ton Enclosed a 100% 0 0 0 0 0 0
MD02 Molybdenum Concentrate Dryer MolyDry 3-03-024-11 NF 1.9 tons 19.70 12.00 5.91 lb/ton MS/EP 100% 37.43 0 22.80 0 11.23 0
MD03 Molybdenum Concentrate Dryer (D-MC) to MolybdenumConcentrate Bin (B-MC)
DTrMlyCncPrt 3-03-024-08 NF 1.9 tons 0.00004 0.00002 0.000003 lb/ton MDC 100% 0.00008 0 0.00004 0 0.000006 0
Rosemont Copper ProjectEmission Inventory Information JBR ENVIRONMENTAL CONSULTANTS, INC.
November 2011Page H165
AZRP00347

PM/TSP PM10 PM2.5 Uncontrolled Controlled Uncontrolled Controlled Uncontrolled Controlled
PM2.5 Emissions (lb/hr) - Year 10PM/TSP Emissions (lb/hr) - Year 10Unit ID
Pick-up or Control Eff. (%)
Non-Fug. (NF) /
Fug. (F)Rate Units
Hourly Production Rate
- Year 10
Emission FactorsProcess Code
PM10 Emissions (lb/hr) - Year 10
Table H.44 Maximum Hourly Particulate Emissions - Year 10
SCC EF UnitsUnit Description Control Code
MD04 Molybdenum Concentrate Bin (B-MC) to MolybdenumConcentrate Hopper (H-MC)
DTrMlyCnc 3-03-024-08 NF 1.9 tons 0.0003 0.0002 0.00002 lb/ton None 0% 0.0006 0.0006 0.0003 0.0003 0.00004 0.00004
MD05 Molybdenum Concentrate Hopper (H-MC) to MolybdenumConcentrate Conveyor (CV-MC)
DTrMlyCncPrt 3-03-024-08 NF 1.9 tons 0.00004 0.00002 0.000003 lb/ton Enclosed a 100% 0 0 0 0 0 0
MD06 Molybdenum Concentrate Conveyor (CV-MC) to Molybdenum Packaging and Weigh System (MPS)
DTrMlyCnc 3-03-024-08 NF 1.9 tons 0.0003 0.0002 0.00002 lb/ton MDC 100% 0.0006 0 0.0003 0 0.00004 0
Tailings Dewatering and Placement
TDS01 Tailings Filters (Ft-T1/T14) to Tailings Belt Feeders (F-T1/T14) FiltTailPrt 3-03-024-08 NF 10,722 tons 0.00002 0.00001 0.000002 lb/ton Enclosed a 100% 0 0 0 0 0 0
TDS02 Tailings Belt Feeders (F-T1/T14) to Fixed Tailings ConveyorNo. 1 (CV-F1)
FiltTailPrt 3-03-024-08 NF 10,722 tons 0.00002 0.00001 0.000002 lb/ton Enclosed a 100% 0 0 0 0 0 0
TDS03 Fixed Tailings Conveyor No. 1 (CV-F1) to Fixed TailingsConveyor No. 2 (CV-F2)
FiltTailPrt 3-03-024-08 NF 10,722 tons 0.00002 0.00001 0.000002 lb/ton Enclosed a 100% 0 0 0 0 0 0
TDS04 Fixed Tailings Conveyor No. 2 (CV-F2) to Fixed Tailings Conveyor No. 3 (CV-F3)
FiltTailPrt 3-03-024-08 NF 10,722 tons 0.00002 0.00001 0.000002 lb/ton None 0% 0.26 0.26 0.12 0.12 0.02 0.02
TDS05 Fixed Tailings Conveyor No. 3 (CV-F3) to RelocatableConveyor (CV-R1)
FiltTailPrt 3-03-024-08 F 10,722 tons 0.00002 0.00001 0.000002 lb/ton None 0% 0.26 0.26 0.12 0.12 0.02 0.02
TDS06 Relocatable Conveyor (CV-R1) to Shiftable Conveyor (CV-S1) FiltTailPrt 3-03-024-08 F 10,722 tons 0.00002 0.00001 0.000002 lb/ton None 0% 0.26 0.26 0.12 0.12 0.02 0.02
TDS07 Shiftable Conveyor (CV-S1) to Belt Wagon Conveyor(CV-BW1)
FiltTail 3-03-024-08 F 10,722 tons 0.0002 0.00009 0.00001 lb/ton None 0% 2.00 2.00 0.95 0.95 0.14 0.14
TDS08 Belt Wagon Conveyor (CV-BW1) to Spreader Crawler Mounted Conveyor (CV-SP1)
FiltTail 3-03-024-08 F 10,722 tons 0.0002 0.00009 0.00001 lb/ton None 0% 2.00 2.00 0.95 0.95 0.14 0.14
TDS09 Spreader Crawler Mounted Conveyor (CV-SP1) to Tailings Storage
FiltTail 3-03-024-08 F 10,722 tons 0.0002 0.00009 0.00001 lb/ton None 0% 2.00 2.00 0.95 0.95 0.14 0.14
TDS10 Wind Erosion of Tailings Storage TailStrg 3-03-888-01 F 1,500 acres 0.02 0.01 0.002 ton/acre-yr None 0% 6.90 6.90 3.45 3.45 0.52 0.52
Fuel Burning Equipment
FB01 Diesel Electrowinning Hot Water Generator (HWG) DFB 1-02-005-03 NF 1 hours 3.30 2.30 1.54 lb/1000 gal None 0% 0.14 0.14 0.10 0.10 0.07 0.07
6.0 MMBtu/hr
FB02 Thickener Area Emergency Generator (TEG) ICDE3 2-02-001-02 NF 1 hours 0.20 0.20 0.20 g/kW-hr None 0% 0.44 0.44 0.44 0.44 0.44 0.44
1,000 kW
FB03 PLS Pond Area Emergency Generator (PEG) ICDE3 2-02-001-02 NF 1 hours 0.20 0.20 0.20 g/kW-hr None 0% 0.44 0.44 0.44 0.44 0.44 0.44
1,000 kW
FB04 Main Substation Emergency Generator (MEG) ICDE3 2-02-001-02 NF 1 hours 0.20 0.20 0.20 g/kW-hr None 0% 0.33 0.33 0.33 0.33 0.33 0.33
750 kW
FB05 Administration Building Emergency Generator (AEG) ICDE3 2-02-001-02 NF 1 hours 0.20 0.20 0.20 g/kW-hr None 0% 0.33 0.33 0.33 0.33 0.33 0.33
750 kW
FB06 Electrowinning Building Emergency Generator (EWEG) ICDE1 2-02-001-02 NF 1 hours 0.40 0.40 0.40 g/kW-hr None 0% 0.04 0.04 0.04 0.04 0.04 0.04
50 kW
FB07 Primary Crusher Fire Water Pump (PCFWP) ICDE2 2-02-001-02 NF 1 hours 0.20 0.20 0.20 g/kW-hr None 0% 0.13 0.13 0.13 0.13 0.13 0.13
400 hp
Rosemont Copper ProjectEmission Inventory Information JBR ENVIRONMENTAL CONSULTANTS, INC.
November 2011Page H166
AZRP00348
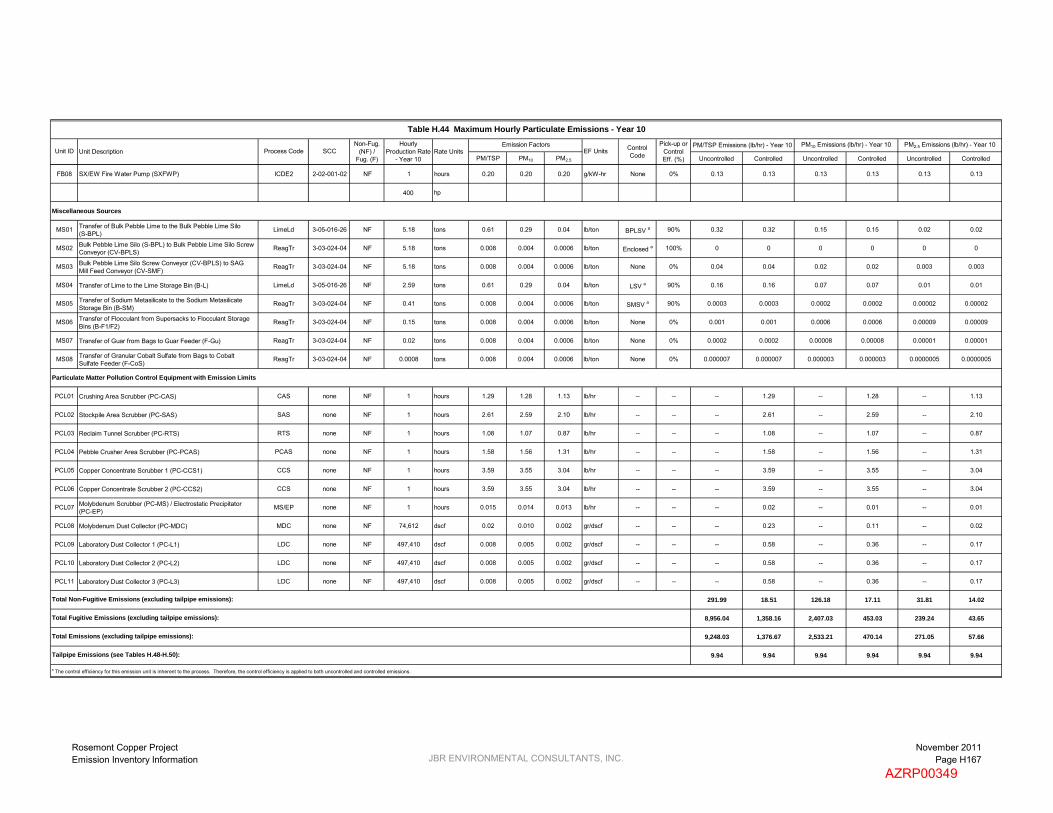
PM/TSP PM10 PM2.5 Uncontrolled Controlled Uncontrolled Controlled Uncontrolled Controlled
PM2.5 Emissions (lb/hr) - Year 10PM/TSP Emissions (lb/hr) - Year 10Unit ID
Pick-up or Control Eff. (%)
Non-Fug. (NF) /
Fug. (F)Rate Units
Hourly Production Rate
- Year 10
Emission FactorsProcess Code
PM10 Emissions (lb/hr) - Year 10
Table H.44 Maximum Hourly Particulate Emissions - Year 10
SCC EF UnitsUnit Description Control Code
FB08 SX/EW Fire Water Pump (SXFWP) ICDE2 2-02-001-02 NF 1 hours 0.20 0.20 0.20 g/kW-hr None 0% 0.13 0.13 0.13 0.13 0.13 0.13
400 hp
Miscellaneous Sources
MS01 Transfer of Bulk Pebble Lime to the Bulk Pebble Lime Silo(S-BPL) LimeLd 3-05-016-26 NF 5.18 tons 0.61 0.29 0.04 lb/ton BPLSV a 90% 0.32 0.32 0.15 0.15 0.02 0.02
MS02 Bulk Pebble Lime Silo (S-BPL) to Bulk Pebble Lime Silo Screw Conveyor (CV-BPLS) ReagTr 3-03-024-04 NF 5.18 tons 0.008 0.004 0.0006 lb/ton Enclosed a 100% 0 0 0 0 0 0
MS03 Bulk Pebble Lime Silo Screw Conveyor (CV-BPLS) to SAGMill Feed Conveyor (CV-SMF)
ReagTr 3-03-024-04 NF 5.18 tons 0.008 0.004 0.0006 lb/ton None 0% 0.04 0.04 0.02 0.02 0.003 0.003
MS04 Transfer of Lime to the Lime Storage Bin (B-L) LimeLd 3-05-016-26 NF 2.59 tons 0.61 0.29 0.04 lb/ton LSV a 90% 0.16 0.16 0.07 0.07 0.01 0.01
MS05 Transfer of Sodium Metasilicate to the Sodium MetasilicateStorage Bin (B-SM)
ReagTr 3-03-024-04 NF 0.41 tons 0.008 0.004 0.0006 lb/ton SMSV a 90% 0.0003 0.0003 0.0002 0.0002 0.00002 0.00002
MS06 Transfer of Flocculant from Supersacks to Flocculant Storage Bins (B-F1/F2)
ReagTr 3-03-024-04 NF 0.15 tons 0.008 0.004 0.0006 lb/ton None 0% 0.001 0.001 0.0006 0.0006 0.00009 0.00009
MS07 Transfer of Guar from Bags to Guar Feeder (F-Gu) ReagTr 3-03-024-04 NF 0.02 tons 0.008 0.004 0.0006 lb/ton None 0% 0.0002 0.0002 0.00008 0.00008 0.00001 0.00001
MS08 Transfer of Granular Cobalt Sulfate from Bags to CobaltSulfate Feeder (F-CoS)
ReagTr 3-03-024-04 NF 0.0008 tons 0.008 0.004 0.0006 lb/ton None 0% 0.000007 0.000007 0.000003 0.000003 0.0000005 0.0000005
Particulate Matter Pollution Control Equipment with Emission Limits
PCL01 Crushing Area Scrubber (PC-CAS) CAS none NF 1 hours 1.29 1.28 1.13 lb/hr -- -- -- 1.29 -- 1.28 -- 1.13
PCL02 Stockpile Area Scrubber (PC-SAS) SAS none NF 1 hours 2.61 2.59 2.10 lb/hr -- -- -- 2.61 -- 2.59 -- 2.10
PCL03 Reclaim Tunnel Scrubber (PC-RTS) RTS none NF 1 hours 1.08 1.07 0.87 lb/hr -- -- -- 1.08 -- 1.07 -- 0.87
PCL04 Pebble Crusher Area Scrubber (PC-PCAS) PCAS none NF 1 hours 1.58 1.56 1.31 lb/hr -- -- -- 1.58 -- 1.56 -- 1.31
PCL05 Copper Concentrate Scrubber 1 (PC-CCS1) CCS none NF 1 hours 3.59 3.55 3.04 lb/hr -- -- -- 3.59 -- 3.55 -- 3.04
PCL06 Copper Concentrate Scrubber 2 (PC-CCS2) CCS none NF 1 hours 3.59 3.55 3.04 lb/hr -- -- -- 3.59 -- 3.55 -- 3.04
PCL07 Molybdenum Scrubber (PC-MS) / Electrostatic Precipitator (PC-EP) MS/EP none NF 1 hours 0.015 0.014 0.013 lb/hr -- -- -- 0.02 -- 0.01 -- 0.01
PCL08 Molybdenum Dust Collector (PC-MDC) MDC none NF 74,612 dscf 0.02 0.010 0.002 gr/dscf -- -- -- 0.23 -- 0.11 -- 0.02
PCL09 Laboratory Dust Collector 1 (PC-L1) LDC none NF 497,410 dscf 0.008 0.005 0.002 gr/dscf -- -- -- 0.58 -- 0.36 -- 0.17
PCL10 Laboratory Dust Collector 2 (PC-L2) LDC none NF 497,410 dscf 0.008 0.005 0.002 gr/dscf -- -- -- 0.58 -- 0.36 -- 0.17
PCL11 Laboratory Dust Collector 3 (PC-L3) LDC none NF 497,410 dscf 0.008 0.005 0.002 gr/dscf -- -- -- 0.58 -- 0.36 -- 0.17
291.99 18.51 126.18 17.11 31.81 14.02
8,956.04 1,358.16 2,407.03 453.03 239.24 43.65
9,248.03 1,376.67 2,533.21 470.14 271.05 57.66
9.94 9.94 9.94 9.94 9.94 9.94
a The control efficiency for this emission unit is inherent to the process. Therefore, the control efficiency is applied to both uncontrolled and controlled emissions.
Tailpipe Emissions (see Tables H.48-H.50):
Total Emissions (excluding tailpipe emissions):
Total Fugitive Emissions (excluding tailpipe emissions):
Total Non-Fugitive Emissions (excluding tailpipe emissions):
Rosemont Copper ProjectEmission Inventory Information JBR ENVIRONMENTAL CONSULTANTS, INC.
November 2011Page H167
AZRP00349

CO NOX SO2 VOC H2SO4 CO2 CH4 N2O HAP Name HAP EF CO NOX SO2 VOC H2SO4 CO2a CH4
a N2O a HAP b
Mining
MN02 Blasting Blast 3-05-020-09 F 17,992 tons ANFO 67.00 17.00 2.00 0 0 566 0.02 0.005 -- -- lb/tons ANFO 602.73 152.93 17.99 0 0 5,095.78 0.21 0.04 --
Solvent Extraction and Electrowinning
SXE01 Solvent Extraction SX 4-90-001-99 F 8,760 hours 0 0 0 9.43E-05 0 0 0 0 Benzene 3.37E-07 lb/hr-ft2 0 0 0 3.77 0 0 0 0 1.35E-02
4 Primary Mix Tanks (7.75' D x 9.75' H each) 4 @ 47.2 = 188.7 ft2 9,132.9 ft2 Total Surface Area of Solvent Extraction Toluene 4.82E-06 lb/hr-ft2 1.93E-01
4 Secondary Mix Tanks (9.5' D x 9.75' H each) 4 @ 70.9 = 283.5 ft2 Ethylbenzene 2.05E-05 lb/hr-ft2 8.21E-01
3 Tertiary Mix Tanks (9.5' D x 9.75' H each) 3 @ 70.9 = 212.6 ft2 Xylenes 2.80E-05 lb/hr-ft2 1.12E+00
4 Extraction Settlers (64' L x 33' W x 3.33' H each) 4 @ 2,112 = 8,448 ft2 Others (including Hexane) 2.94E-05 lb/hr-ft2 1.18E+00
SXE02 Electrowinning Commercial Cells (EWCC) EW none NF 8,760 hours 0 0 0 0 1.57E-04 0 0 0 Cobalt Compounds 2.36E-08 lb/hr-ft2 0 0 0 0 0.02 0 0 0 2.72E-06
Controlled by Cell Ventilation Scrubbers(PC-EWCVS1/EWCVS6)
2,640 ft2
99 Control Efficiency (%)
Fuel Burning Equipment
FB01 Diesel Electrowinning Hot Water Generator (HWG) DFB 1-02-005-03 NF 8,760 hours 5.00 20.00 0.21 0.20 0 23,217 0.94 0.19 POM 3.30E-03 lb/1000 gal 0.96 3.84 0.04 0.04 0 4,453.51 0.18 0.04 6.33E-04
6.0 MMBtu/hr Formaldehyde 6.10E-02 lb/1000 gal 1.17E-02
Arsenic 4.00 lb/1012 Btu 1.05E-04
Beryllium 3.00 lb/1012 Btu 7.88E-05
Cadmium 3.00 lb/1012 Btu 7.88E-05
Chromium 3.00 lb/1012 Btu 7.88E-05
Lead 9.00 lb/1012 Btu 2.37E-04
Mercury 3.00 lb/1012 Btu 7.88E-05
Manganese 6.00 lb/1012 Btu 1.58E-04
Nickel 3.00 lb/1012 Btu 7.88E-05
Selenium 15.00 lb/1012 Btu 3.94E-04
FB02 Thickener Area Emergency Generator (TEG) ICDE3 2-02-001-02 NF 500 hours 3.50 6.00 0.0066 0.40 0 694 0.03 0.006 -- -- g/kW-hr 1.93 3.31 0.004 0.22 0 382.65 0.02 0.003 --
1,000 kW Benzene 7.76E-04 lb/MMBtu 1.82E-03
Toluene 2.81E-04 lb/MMBtu 6.59E-04
Xylenes 1.93E-04 lb/MMBtu 4.53E-04
Formaldehyde 7.89E-05 lb/MMBtu 1.85E-04
Acetaldehyde 2.52E-05 lb/MMBtu 5.91E-05
Acrolein 7.88E-06 lb/MMBtu 1.85E-05
Naphthalene 1.30E-04 lb/MMBtu 3.05E-04
Acenaphthylene 9.23E-06 lb/MMBtu 2.17E-05
Acenaphthene 4.68E-06 lb/MMBtu 1.10E-05
Fluorene 1.28E-05 lb/MMBtu 3.00E-05
Phenanthrene 4.08E-05 lb/MMBtu 9.57E-05
Anthracene 1.23E-06 lb/MMBtu 2.89E-06
Fluoranthene 4.03E-06 lb/MMBtu 9.46E-06
Pyrene 3.71E-06 lb/MMBtu 8.71E-06
Benz(a)anthracene 6.22E-07 lb/MMBtu 1.46E-06
Chrysene 1.53E-06 lb/MMBtu 3.59E-06
Emission FactorsSCCUnit ID EF UnitsUnit Description Process Code
Non-Fug. (NF) /
Fug. (F)Rate Units
Annual Production Rate -
Year 10
Table H.45 Annual Gaseous Emissions - Year 10
Emissions (tpy) - Year 10
Rosemont Copper ProjectEmission Inventory Information JBR ENVIRONMENTAL CONSULTANTS, INC.
November 2011Page H168
AZRP00350

CO NOX SO2 VOC H2SO4 CO2 CH4 N2O HAP Name HAP EF CO NOX SO2 VOC H2SO4 CO2a CH4
a N2O a HAP b
Emission FactorsSCCUnit ID EF UnitsUnit Description Process Code
Non-Fug. (NF) /
Fug. (F)Rate Units
Annual Production Rate -
Year 10
Table H.45 Annual Gaseous Emissions - Year 10
Emissions (tpy) - Year 10
Benzo(b)fluoranthene 1.11E-06 lb/MMBtu 2.60E-06
Benzo(k)fluoranthene 2.18E-07 lb/MMBtu 5.12E-07
Benzo(a)pyrene 2.57E-07 lb/MMBtu 6.03E-07
Indeno(1,2,3-cd)pyrene 4.14E-07 lb/MMBtu 9.72E-07
Dibenz(a,h)anthracene 3.46E-07 lb/MMBtu 8.12E-07
Benzo(g,h,i)perylene 5.56E-07 lb/MMBtu 1.30E-06
FB03 PLS Pond Area Emergency Generator (PEG) ICDE3 2-02-001-02 NF 500 hours 3.50 6.00 0.0066 0.40 0 694 0.03 0.006 -- -- g/kW-hr 1.93 3.31 0.004 0.22 0 382.65 0.02 0.003 --
1,000 kW Benzene 7.76E-04 lb/MMBtu 1.82E-03
Toluene 2.81E-04 lb/MMBtu 6.59E-04
Xylenes 1.93E-04 lb/MMBtu 4.53E-04
Formaldehyde 7.89E-05 lb/MMBtu 1.85E-04
Acetaldehyde 2.52E-05 lb/MMBtu 5.91E-05
Acrolein 7.88E-06 lb/MMBtu 1.85E-05
Naphthalene 1.30E-04 lb/MMBtu 3.05E-04
Acenaphthylene 9.23E-06 lb/MMBtu 2.17E-05
Acenaphthene 4.68E-06 lb/MMBtu 1.10E-05
Fluorene 1.28E-05 lb/MMBtu 3.00E-05
Phenanthrene 4.08E-05 lb/MMBtu 9.57E-05
Anthracene 1.23E-06 lb/MMBtu 2.89E-06
Fluoranthene 4.03E-06 lb/MMBtu 9.46E-06
Pyrene 3.71E-06 lb/MMBtu 8.71E-06
Benz(a)anthracene 6.22E-07 lb/MMBtu 1.46E-06
Chrysene 1.53E-06 lb/MMBtu 3.59E-06
Benzo(b)fluoranthene 1.11E-06 lb/MMBtu 2.60E-06
Benzo(k)fluoranthene 2.18E-07 lb/MMBtu 5.12E-07
Benzo(a)pyrene 2.57E-07 lb/MMBtu 6.03E-07
Indeno(1,2,3-cd)pyrene 4.14E-07 lb/MMBtu 9.72E-07
Dibenz(a,h)anthracene 3.46E-07 lb/MMBtu 8.12E-07
Benzo(g,h,i)perylene 5.56E-07 lb/MMBtu 1.30E-06
FB04 Main Substation Emergency Generator (MEG) ICDE3 2-02-001-02 NF 500 hours 3.50 6.00 0.0066 0.40 0 694 0.03 0.006 -- -- g/kW-hr 1.45 2.48 0.003 0.17 0 286.99 0.01 0.002 --
750 kW Benzene 7.76E-04 lb/MMBtu 1.37E-03
Toluene 2.81E-04 lb/MMBtu 4.95E-04
Xylenes 1.93E-04 lb/MMBtu 3.40E-04
Formaldehyde 7.89E-05 lb/MMBtu 1.39E-04
Acetaldehyde 2.52E-05 lb/MMBtu 4.44E-05
Acrolein 7.88E-06 lb/MMBtu 1.39E-05
Naphthalene 1.30E-04 lb/MMBtu 2.29E-04
Acenaphthylene 9.23E-06 lb/MMBtu 1.62E-05
Acenaphthene 4.68E-06 lb/MMBtu 8.24E-06
Fluorene 1.28E-05 lb/MMBtu 2.25E-05
Rosemont Copper ProjectEmission Inventory Information JBR ENVIRONMENTAL CONSULTANTS, INC.
November 2011Page H169
AZRP00351
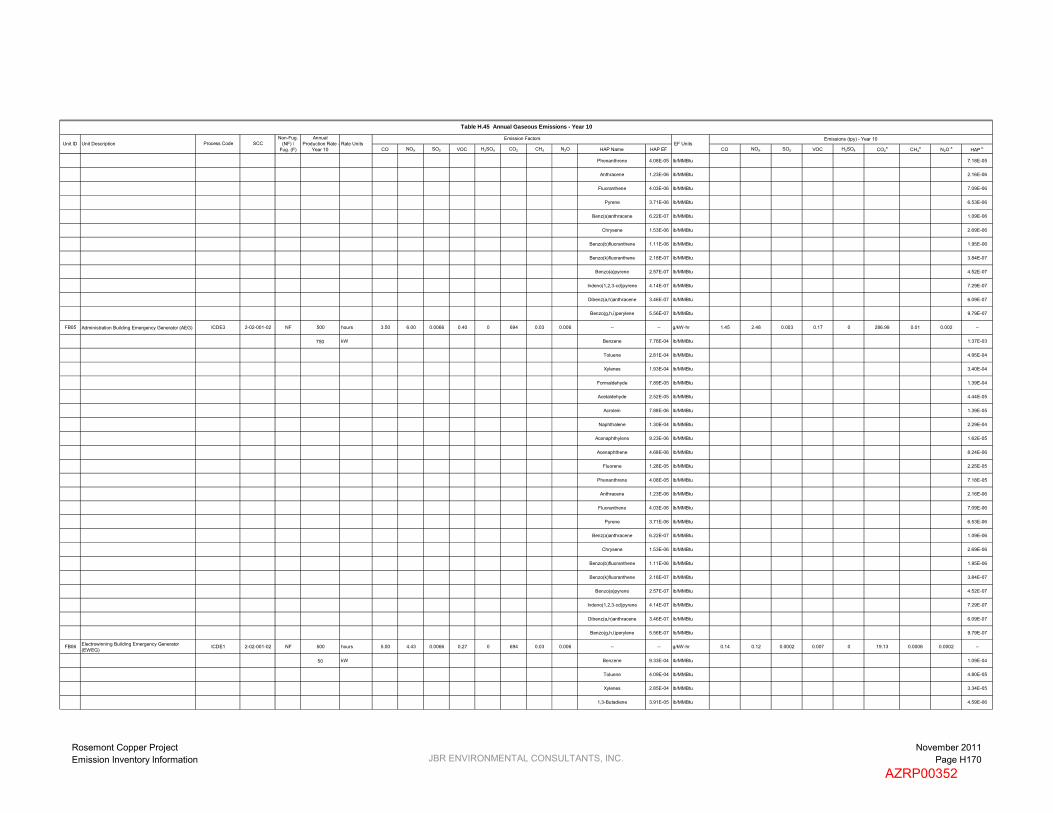
CO NOX SO2 VOC H2SO4 CO2 CH4 N2O HAP Name HAP EF CO NOX SO2 VOC H2SO4 CO2a CH4
a N2O a HAP b
Emission FactorsSCCUnit ID EF UnitsUnit Description Process Code
Non-Fug. (NF) /
Fug. (F)Rate Units
Annual Production Rate -
Year 10
Table H.45 Annual Gaseous Emissions - Year 10
Emissions (tpy) - Year 10
Phenanthrene 4.08E-05 lb/MMBtu 7.18E-05
Anthracene 1.23E-06 lb/MMBtu 2.16E-06
Fluoranthene 4.03E-06 lb/MMBtu 7.09E-06
Pyrene 3.71E-06 lb/MMBtu 6.53E-06
Benz(a)anthracene 6.22E-07 lb/MMBtu 1.09E-06
Chrysene 1.53E-06 lb/MMBtu 2.69E-06
Benzo(b)fluoranthene 1.11E-06 lb/MMBtu 1.95E-06
Benzo(k)fluoranthene 2.18E-07 lb/MMBtu 3.84E-07
Benzo(a)pyrene 2.57E-07 lb/MMBtu 4.52E-07
Indeno(1,2,3-cd)pyrene 4.14E-07 lb/MMBtu 7.29E-07
Dibenz(a,h)anthracene 3.46E-07 lb/MMBtu 6.09E-07
Benzo(g,h,i)perylene 5.56E-07 lb/MMBtu 9.79E-07
FB05 Administration Building Emergency Generator (AEG) ICDE3 2-02-001-02 NF 500 hours 3.50 6.00 0.0066 0.40 0 694 0.03 0.006 -- -- g/kW-hr 1.45 2.48 0.003 0.17 0 286.99 0.01 0.002 --
750 kW Benzene 7.76E-04 lb/MMBtu 1.37E-03
Toluene 2.81E-04 lb/MMBtu 4.95E-04
Xylenes 1.93E-04 lb/MMBtu 3.40E-04
Formaldehyde 7.89E-05 lb/MMBtu 1.39E-04
Acetaldehyde 2.52E-05 lb/MMBtu 4.44E-05
Acrolein 7.88E-06 lb/MMBtu 1.39E-05
Naphthalene 1.30E-04 lb/MMBtu 2.29E-04
Acenaphthylene 9.23E-06 lb/MMBtu 1.62E-05
Acenaphthene 4.68E-06 lb/MMBtu 8.24E-06
Fluorene 1.28E-05 lb/MMBtu 2.25E-05
Phenanthrene 4.08E-05 lb/MMBtu 7.18E-05
Anthracene 1.23E-06 lb/MMBtu 2.16E-06
Fluoranthene 4.03E-06 lb/MMBtu 7.09E-06
Pyrene 3.71E-06 lb/MMBtu 6.53E-06
Benz(a)anthracene 6.22E-07 lb/MMBtu 1.09E-06
Chrysene 1.53E-06 lb/MMBtu 2.69E-06
Benzo(b)fluoranthene 1.11E-06 lb/MMBtu 1.95E-06
Benzo(k)fluoranthene 2.18E-07 lb/MMBtu 3.84E-07
Benzo(a)pyrene 2.57E-07 lb/MMBtu 4.52E-07
Indeno(1,2,3-cd)pyrene 4.14E-07 lb/MMBtu 7.29E-07
Dibenz(a,h)anthracene 3.46E-07 lb/MMBtu 6.09E-07
Benzo(g,h,i)perylene 5.56E-07 lb/MMBtu 9.79E-07
FB06 Electrowinning Building Emergency Generator (EWEG)
ICDE1 2-02-001-02 NF 500 hours 5.00 4.43 0.0066 0.27 0 694 0.03 0.006 -- -- g/kW-hr 0.14 0.12 0.0002 0.007 0 19.13 0.0008 0.0002 --
50 kW Benzene 9.33E-04 lb/MMBtu 1.09E-04
Toluene 4.09E-04 lb/MMBtu 4.80E-05
Xylenes 2.85E-04 lb/MMBtu 3.34E-05
1,3-Butadiene 3.91E-05 lb/MMBtu 4.59E-06
Rosemont Copper ProjectEmission Inventory Information JBR ENVIRONMENTAL CONSULTANTS, INC.
November 2011Page H170
AZRP00352

CO NOX SO2 VOC H2SO4 CO2 CH4 N2O HAP Name HAP EF CO NOX SO2 VOC H2SO4 CO2a CH4
a N2O a HAP b
Emission FactorsSCCUnit ID EF UnitsUnit Description Process Code
Non-Fug. (NF) /
Fug. (F)Rate Units
Annual Production Rate -
Year 10
Table H.45 Annual Gaseous Emissions - Year 10
Emissions (tpy) - Year 10
Formaldehyde 1.18E-03 lb/MMBtu 1.38E-04
Acetaldehyde 7.67E-04 lb/MMBtu 9.00E-05
Acrolein 9.25E-05 lb/MMBtu 1.09E-05
Naphthalene 8.48E-05 lb/MMBtu 9.95E-06
Acenaphthylene 5.06E-06 lb/MMBtu 5.94E-07
Acenaphthene 1.42E-06 lb/MMBtu 1.67E-07
Fluorene 2.92E-05 lb/MMBtu 3.43E-06
Phenanthrene 2.94E-05 lb/MMBtu 3.45E-06
Anthracene 1.87E-06 lb/MMBtu 2.19E-07
Fluoranthene 7.61E-06 lb/MMBtu 8.93E-07
Pyrene 4.78E-06 lb/MMBtu 5.61E-07
Benzo(a)anthracene 1.68E-06 lb/MMBtu 1.97E-07
Chrysene 3.53E-07 lb/MMBtu 4.14E-08
Benzo(b)fluoranthene 9.91E-08 lb/MMBtu 1.16E-08
Benzo(k)fluoranthene 1.55E-07 lb/MMBtu 1.82E-08
Benzo(a)pyrene 1.88E-07 lb/MMBtu 2.21E-08
Indeno(1,2,3-cd)pyrene 3.75E-07 lb/MMBtu 4.40E-08
Dibenz(a,h)anthracene 5.83E-07 lb/MMBtu 6.84E-08
Benzo(g,h,i)perylene 4.89E-07 lb/MMBtu 5.74E-08
FB07 Primary Crusher Fire Water Pump (PCFWP) ICDE2 2-02-001-02 NF 500 hours 3.50 3.73 0.0066 0.27 0 694 0.03 0.006 -- -- g/kW-hr 0.58 0.61 0.001 0.04 0 114.14 0.005 0.0009 --
400 hp Benzene 9.33E-04 lb/MMBtu 6.53E-04
Toluene 4.09E-04 lb/MMBtu 2.86E-04
Xylenes 2.85E-04 lb/MMBtu 2.00E-04
1,3-Butadiene 3.91E-05 lb/MMBtu 2.74E-05
Formaldehyde 1.18E-03 lb/MMBtu 8.26E-04
Acetaldehyde 7.67E-04 lb/MMBtu 5.37E-04
Acrolein 9.25E-05 lb/MMBtu 6.48E-05
Naphthalene 8.48E-05 lb/MMBtu 5.94E-05
Acenaphthylene 5.06E-06 lb/MMBtu 3.54E-06
Acenaphthene 1.42E-06 lb/MMBtu 9.94E-07
Fluorene 2.92E-05 lb/MMBtu 2.04E-05
Phenanthrene 2.94E-05 lb/MMBtu 2.06E-05
Anthracene 1.87E-06 lb/MMBtu 1.31E-06
Fluoranthene 7.61E-06 lb/MMBtu 5.33E-06
Pyrene 4.78E-06 lb/MMBtu 3.35E-06
Benzo(a)anthracene 1.68E-06 lb/MMBtu 1.18E-06
Chrysene 3.53E-07 lb/MMBtu 2.47E-07
Benzo(b)fluoranthene 9.91E-08 lb/MMBtu 6.94E-08
Benzo(k)fluoranthene 1.55E-07 lb/MMBtu 1.09E-07
Benzo(a)pyrene 1.88E-07 lb/MMBtu 1.32E-07
Rosemont Copper ProjectEmission Inventory Information JBR ENVIRONMENTAL CONSULTANTS, INC.
November 2011Page H171
AZRP00353
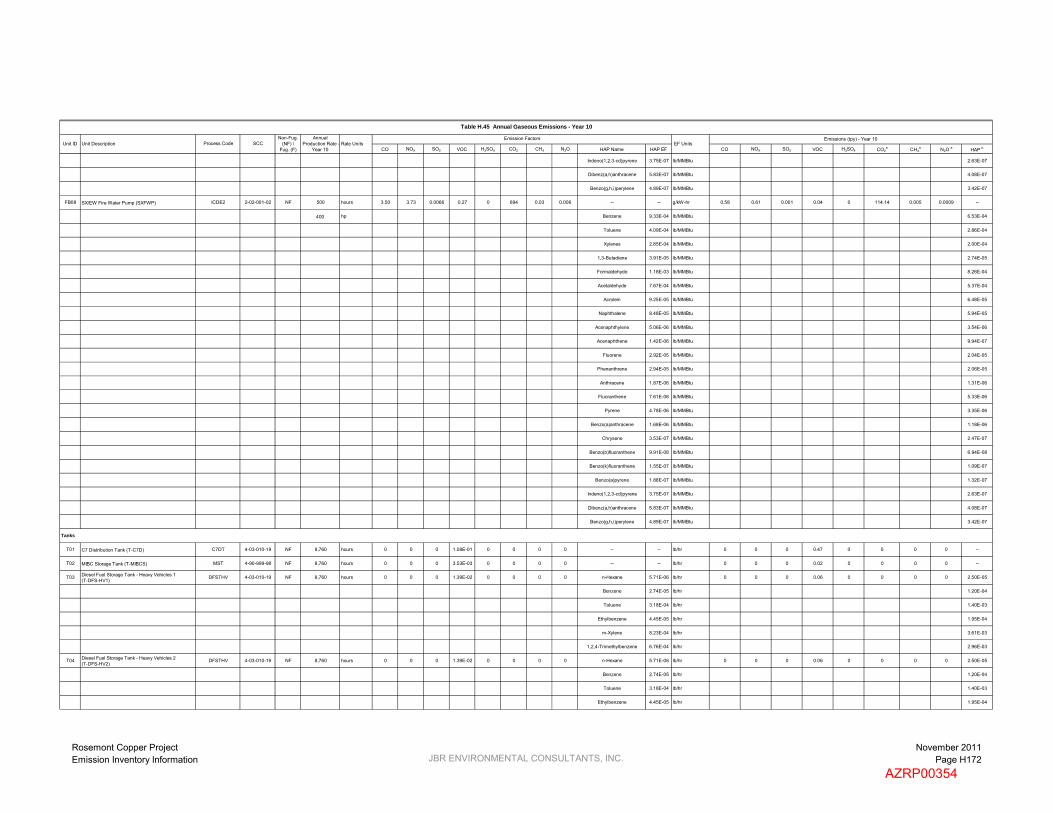
CO NOX SO2 VOC H2SO4 CO2 CH4 N2O HAP Name HAP EF CO NOX SO2 VOC H2SO4 CO2a CH4
a N2O a HAP b
Emission FactorsSCCUnit ID EF UnitsUnit Description Process Code
Non-Fug. (NF) /
Fug. (F)Rate Units
Annual Production Rate -
Year 10
Table H.45 Annual Gaseous Emissions - Year 10
Emissions (tpy) - Year 10
Indeno(1,2,3-cd)pyrene 3.75E-07 lb/MMBtu 2.63E-07
Dibenz(a,h)anthracene 5.83E-07 lb/MMBtu 4.08E-07
Benzo(g,h,i)perylene 4.89E-07 lb/MMBtu 3.42E-07
FB08 SX/EW Fire Water Pump (SXFWP) ICDE2 2-02-001-02 NF 500 hours 3.50 3.73 0.0066 0.27 0 694 0.03 0.006 -- -- g/kW-hr 0.58 0.61 0.001 0.04 0 114.14 0.005 0.0009 --
400 hp Benzene 9.33E-04 lb/MMBtu 6.53E-04
Toluene 4.09E-04 lb/MMBtu 2.86E-04
Xylenes 2.85E-04 lb/MMBtu 2.00E-04
1,3-Butadiene 3.91E-05 lb/MMBtu 2.74E-05
Formaldehyde 1.18E-03 lb/MMBtu 8.26E-04
Acetaldehyde 7.67E-04 lb/MMBtu 5.37E-04
Acrolein 9.25E-05 lb/MMBtu 6.48E-05
Naphthalene 8.48E-05 lb/MMBtu 5.94E-05
Acenaphthylene 5.06E-06 lb/MMBtu 3.54E-06
Acenaphthene 1.42E-06 lb/MMBtu 9.94E-07
Fluorene 2.92E-05 lb/MMBtu 2.04E-05
Phenanthrene 2.94E-05 lb/MMBtu 2.06E-05
Anthracene 1.87E-06 lb/MMBtu 1.31E-06
Fluoranthene 7.61E-06 lb/MMBtu 5.33E-06
Pyrene 4.78E-06 lb/MMBtu 3.35E-06
Benzo(a)anthracene 1.68E-06 lb/MMBtu 1.18E-06
Chrysene 3.53E-07 lb/MMBtu 2.47E-07
Benzo(b)fluoranthene 9.91E-08 lb/MMBtu 6.94E-08
Benzo(k)fluoranthene 1.55E-07 lb/MMBtu 1.09E-07
Benzo(a)pyrene 1.88E-07 lb/MMBtu 1.32E-07
Indeno(1,2,3-cd)pyrene 3.75E-07 lb/MMBtu 2.63E-07
Dibenz(a,h)anthracene 5.83E-07 lb/MMBtu 4.08E-07
Benzo(g,h,i)perylene 4.89E-07 lb/MMBtu 3.42E-07
Tanks
T01 C7 Distribution Tank (T-C7D) C7DT 4-03-010-19 NF 8,760 hours 0 0 0 1.08E-01 0 0 0 0 -- -- lb/hr 0 0 0 0.47 0 0 0 0 --
T02 MIBC Storage Tank (T-MIBCS) MST 4-90-999-98 NF 8,760 hours 0 0 0 3.53E-03 0 0 0 0 -- -- lb/hr 0 0 0 0.02 0 0 0 0 --
T03 Diesel Fuel Storage Tank - Heavy Vehicles 1(T-DFS-HV1)
DFSTHV 4-03-010-19 NF 8,760 hours 0 0 0 1.39E-02 0 0 0 0 n-Hexane 5.71E-06 lb/hr 0 0 0 0.06 0 0 0 0 2.50E-05
Benzene 2.74E-05 lb/hr 1.20E-04
Toluene 3.18E-04 lb/hr 1.40E-03
Ethylbenzene 4.45E-05 lb/hr 1.95E-04
m-Xylene 8.23E-04 lb/hr 3.61E-03
1,2,4-Trimethylbenzene 6.76E-04 lb/hr 2.96E-03
T04 Diesel Fuel Storage Tank - Heavy Vehicles 2(T-DFS-HV2)
DFSTHV 4-03-010-19 NF 8,760 hours 0 0 0 1.39E-02 0 0 0 0 n-Hexane 5.71E-06 lb/hr 0 0 0 0.06 0 0 0 0 2.50E-05
Benzene 2.74E-05 lb/hr 1.20E-04
Toluene 3.18E-04 lb/hr 1.40E-03
Ethylbenzene 4.45E-05 lb/hr 1.95E-04
Rosemont Copper ProjectEmission Inventory Information JBR ENVIRONMENTAL CONSULTANTS, INC.
November 2011Page H172
AZRP00354

CO NOX SO2 VOC H2SO4 CO2 CH4 N2O HAP Name HAP EF CO NOX SO2 VOC H2SO4 CO2a CH4
a N2O a HAP b
Emission FactorsSCCUnit ID EF UnitsUnit Description Process Code
Non-Fug. (NF) /
Fug. (F)Rate Units
Annual Production Rate -
Year 10
Table H.45 Annual Gaseous Emissions - Year 10
Emissions (tpy) - Year 10
m-Xylene 8.23E-04 lb/hr 3.61E-03
1,2,4-Trimethylbenzene 6.76E-04 lb/hr 2.96E-03
9.00 16.76 0.06 1.51 0.02 6,040.20 0.25 0.05 0.05
602.73 152.93 17.99 3.77 0 5,095.78 0.21 0.04 3.32
611.73 169.69 18.05 5.28 0.02 11,135.98 0.45 0.09 3.37
829.36 1,086.35 1.54 78.56 -- 163,285.50 -- -- --
a CO2e emissions are calculcated by summing the individual greenhouse gas emissions multiplied by their global warming potential (GWP). GWP of CO2 = 1, GWP of CH4 = 21, GWP of N2O = 310.
b All HAP emissions are included in the facility-wide potential to emit, regardless of if they are fugitive or non-fugitive emissions.
Tailpipe Emissions (see Tables H.51-H.55):
Total Emissions (excluding tailpipe emissions):
Total Non-Fugitive Emissions (excluding tailpipe emissions):
Total Fugitive Emissions (excluding tailpipe emissions):
Rosemont Copper ProjectEmission Inventory Information JBR ENVIRONMENTAL CONSULTANTS, INC.
November 2011Page H173
AZRP00355
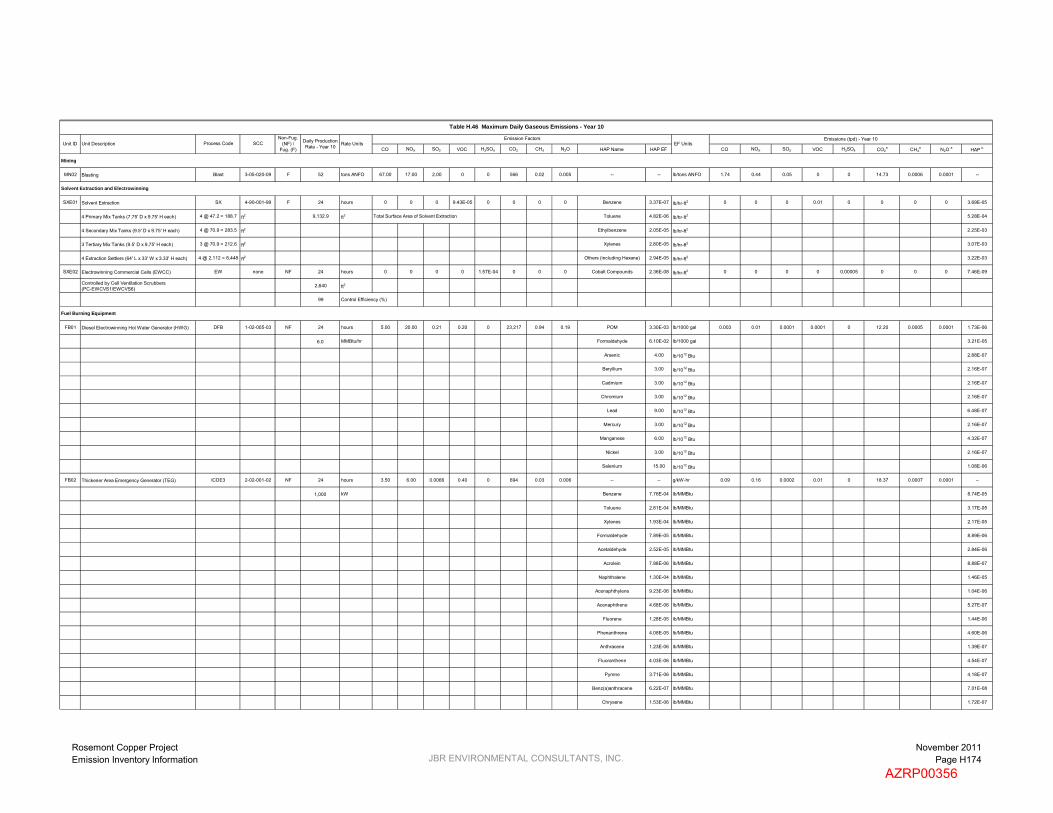
CO NOX SO2 VOC H2SO4 CO2 CH4 N2O HAP Name HAP EF CO NOX SO2 VOC H2SO4 CO2a CH4
a N2O a HAP b
Mining
MN02 Blasting Blast 3-05-020-09 F 52 tons ANFO 67.00 17.00 2.00 0 0 566 0.02 0.005 -- -- lb/tons ANFO 1.74 0.44 0.05 0 0 14.73 0.0006 0.0001 --
Solvent Extraction and Electrowinning
SXE01 Solvent Extraction SX 4-90-001-99 F 24 hours 0 0 0 9.43E-05 0 0 0 0 Benzene 3.37E-07 lb/hr-ft2 0 0 0 0.01 0 0 0 0 3.69E-05
4 Primary Mix Tanks (7.75' D x 9.75' H each) 4 @ 47.2 = 188.7 ft2 9,132.9 ft2 Total Surface Area of Solvent Extraction Toluene 4.82E-06 lb/hr-ft2 5.28E-04
4 Secondary Mix Tanks (9.5' D x 9.75' H each) 4 @ 70.9 = 283.5 ft2 Ethylbenzene 2.05E-05 lb/hr-ft2 2.25E-03
3 Tertiary Mix Tanks (9.5' D x 9.75' H each) 3 @ 70.9 = 212.6 ft2 Xylenes 2.80E-05 lb/hr-ft2 3.07E-03
4 Extraction Settlers (64' L x 33' W x 3.33' H each) 4 @ 2,112 = 8,448 ft2 Others (including Hexane) 2.94E-05 lb/hr-ft2 3.22E-03
SXE02 Electrowinning Commercial Cells (EWCC) EW none NF 24 hours 0 0 0 0 1.57E-04 0 0 0 Cobalt Compounds 2.36E-08 lb/hr-ft2 0 0 0 0 0.00005 0 0 0 7.46E-09
Controlled by Cell Ventilation Scrubbers(PC-EWCVS1/EWCVS6)
2,640 ft2
99 Control Efficiency (%)
Fuel Burning Equipment
FB01 Diesel Electrowinning Hot Water Generator (HWG) DFB 1-02-005-03 NF 24 hours 5.00 20.00 0.21 0.20 0 23,217 0.94 0.19 POM 3.30E-03 lb/1000 gal 0.003 0.01 0.0001 0.0001 0 12.20 0.0005 0.0001 1.73E-06
6.0 MMBtu/hr Formaldehyde 6.10E-02 lb/1000 gal 3.21E-05
Arsenic 4.00 lb/1012 Btu 2.88E-07
Beryllium 3.00 lb/1012 Btu 2.16E-07
Cadmium 3.00 lb/1012 Btu 2.16E-07
Chromium 3.00 lb/1012 Btu 2.16E-07
Lead 9.00 lb/1012 Btu 6.48E-07
Mercury 3.00 lb/1012 Btu 2.16E-07
Manganese 6.00 lb/1012 Btu 4.32E-07
Nickel 3.00 lb/1012 Btu 2.16E-07
Selenium 15.00 lb/1012 Btu 1.08E-06
FB02 Thickener Area Emergency Generator (TEG) ICDE3 2-02-001-02 NF 24 hours 3.50 6.00 0.0066 0.40 0 694 0.03 0.006 -- -- g/kW-hr 0.09 0.16 0.0002 0.01 0 18.37 0.0007 0.0001 --
1,000 kW Benzene 7.76E-04 lb/MMBtu 8.74E-05
Toluene 2.81E-04 lb/MMBtu 3.17E-05
Xylenes 1.93E-04 lb/MMBtu 2.17E-05
Formaldehyde 7.89E-05 lb/MMBtu 8.89E-06
Acetaldehyde 2.52E-05 lb/MMBtu 2.84E-06
Acrolein 7.88E-06 lb/MMBtu 8.88E-07
Naphthalene 1.30E-04 lb/MMBtu 1.46E-05
Acenaphthylene 9.23E-06 lb/MMBtu 1.04E-06
Acenaphthene 4.68E-06 lb/MMBtu 5.27E-07
Fluorene 1.28E-05 lb/MMBtu 1.44E-06
Phenanthrene 4.08E-05 lb/MMBtu 4.60E-06
Anthracene 1.23E-06 lb/MMBtu 1.39E-07
Fluoranthene 4.03E-06 lb/MMBtu 4.54E-07
Pyrene 3.71E-06 lb/MMBtu 4.18E-07
Benz(a)anthracene 6.22E-07 lb/MMBtu 7.01E-08
Chrysene 1.53E-06 lb/MMBtu 1.72E-07
Emissions (tpd) - Year 10
Table H.46 Maximum Daily Gaseous Emissions - Year 10
Rate UnitsSCC Daily Production Rate - Year 10
Emission FactorsUnit ID EF UnitsUnit Description Process Code
Non-Fug. (NF) /
Fug. (F)
Rosemont Copper ProjectEmission Inventory Information JBR ENVIRONMENTAL CONSULTANTS, INC.
November 2011Page H174
AZRP00356

CO NOX SO2 VOC H2SO4 CO2 CH4 N2O HAP Name HAP EF CO NOX SO2 VOC H2SO4 CO2a CH4
a N2O a HAP b
Emissions (tpd) - Year 10
Table H.46 Maximum Daily Gaseous Emissions - Year 10
Rate UnitsSCC Daily Production Rate - Year 10
Emission FactorsUnit ID EF UnitsUnit Description Process Code
Non-Fug. (NF) /
Fug. (F)
Benzo(b)fluoranthene 1.11E-06 lb/MMBtu 1.25E-07
Benzo(k)fluoranthene 2.18E-07 lb/MMBtu 2.46E-08
Benzo(a)pyrene 2.57E-07 lb/MMBtu 2.89E-08
Indeno(1,2,3-cd)pyrene 4.14E-07 lb/MMBtu 4.66E-08
Dibenz(a,h)anthracene 3.46E-07 lb/MMBtu 3.90E-08
Benzo(g,h,i)perylene 5.56E-07 lb/MMBtu 6.26E-08
FB03 PLS Pond Area Emergency Generator (PEG) ICDE3 2-02-001-02 NF 24 hours 3.50 6.00 0.0066 0.40 0 694 0.03 0.006 -- -- g/kW-hr 0.09 0.16 0.0002 0.01 0 18.37 0.0007 0.0001 --
1,000 kW Benzene 7.76E-04 lb/MMBtu 8.74E-05
Toluene 2.81E-04 lb/MMBtu 3.17E-05
Xylenes 1.93E-04 lb/MMBtu 2.17E-05
Formaldehyde 7.89E-05 lb/MMBtu 8.89E-06
Acetaldehyde 2.52E-05 lb/MMBtu 2.84E-06
Acrolein 7.88E-06 lb/MMBtu 8.88E-07
Naphthalene 1.30E-04 lb/MMBtu 1.46E-05
Acenaphthylene 9.23E-06 lb/MMBtu 1.04E-06
Acenaphthene 4.68E-06 lb/MMBtu 5.27E-07
Fluorene 1.28E-05 lb/MMBtu 1.44E-06
Phenanthrene 4.08E-05 lb/MMBtu 4.60E-06
Anthracene 1.23E-06 lb/MMBtu 1.39E-07
Fluoranthene 4.03E-06 lb/MMBtu 4.54E-07
Pyrene 3.71E-06 lb/MMBtu 4.18E-07
Benz(a)anthracene 6.22E-07 lb/MMBtu 7.01E-08
Chrysene 1.53E-06 lb/MMBtu 1.72E-07
Benzo(b)fluoranthene 1.11E-06 lb/MMBtu 1.25E-07
Benzo(k)fluoranthene 2.18E-07 lb/MMBtu 2.46E-08
Benzo(a)pyrene 2.57E-07 lb/MMBtu 2.89E-08
Indeno(1,2,3-cd)pyrene 4.14E-07 lb/MMBtu 4.66E-08
Dibenz(a,h)anthracene 3.46E-07 lb/MMBtu 3.90E-08
Benzo(g,h,i)perylene 5.56E-07 lb/MMBtu 6.26E-08
FB04 Main Substation Emergency Generator (MEG) ICDE3 2-02-001-02 NF 24 hours 3.50 6.00 0.0066 0.40 0 694 0.03 0.006 -- -- g/kW-hr 0.07 0.12 0.0001 0.008 0 13.78 0.0006 0.0001 --
750 kW Benzene 7.76E-04 lb/MMBtu 6.56E-05
Toluene 2.81E-04 lb/MMBtu 2.37E-05
Xylenes 1.93E-04 lb/MMBtu 1.63E-05
Formaldehyde 7.89E-05 lb/MMBtu 6.67E-06
Acetaldehyde 2.52E-05 lb/MMBtu 2.13E-06
Acrolein 7.88E-06 lb/MMBtu 6.66E-07
Naphthalene 1.30E-04 lb/MMBtu 1.10E-05
Acenaphthylene 9.23E-06 lb/MMBtu 7.80E-07
Acenaphthene 4.68E-06 lb/MMBtu 3.95E-07
Fluorene 1.28E-05 lb/MMBtu 1.08E-06
Rosemont Copper ProjectEmission Inventory Information JBR ENVIRONMENTAL CONSULTANTS, INC.
November 2011Page H175
AZRP00357

CO NOX SO2 VOC H2SO4 CO2 CH4 N2O HAP Name HAP EF CO NOX SO2 VOC H2SO4 CO2a CH4
a N2O a HAP b
Emissions (tpd) - Year 10
Table H.46 Maximum Daily Gaseous Emissions - Year 10
Rate UnitsSCC Daily Production Rate - Year 10
Emission FactorsUnit ID EF UnitsUnit Description Process Code
Non-Fug. (NF) /
Fug. (F)
Phenanthrene 4.08E-05 lb/MMBtu 3.45E-06
Anthracene 1.23E-06 lb/MMBtu 1.04E-07
Fluoranthene 4.03E-06 lb/MMBtu 3.40E-07
Pyrene 3.71E-06 lb/MMBtu 3.13E-07
Benz(a)anthracene 6.22E-07 lb/MMBtu 5.25E-08
Chrysene 1.53E-06 lb/MMBtu 1.29E-07
Benzo(b)fluoranthene 1.11E-06 lb/MMBtu 9.38E-08
Benzo(k)fluoranthene 2.18E-07 lb/MMBtu 1.84E-08
Benzo(a)pyrene 2.57E-07 lb/MMBtu 2.17E-08
Indeno(1,2,3-cd)pyrene 4.14E-07 lb/MMBtu 3.50E-08
Dibenz(a,h)anthracene 3.46E-07 lb/MMBtu 2.92E-08
Benzo(g,h,i)perylene 5.56E-07 lb/MMBtu 4.70E-08
FB05 Administration Building Emergency Generator (AEG) ICDE3 2-02-001-02 NF 24 hours 3.50 6.00 0.0066 0.40 0 694 0.03 0.006 -- -- g/kW-hr 0.07 0.12 0.0001 0.008 0 13.78 0.0006 0.0001 --
750 kW Benzene 7.76E-04 lb/MMBtu 6.56E-05
Toluene 2.81E-04 lb/MMBtu 2.37E-05
Xylenes 1.93E-04 lb/MMBtu 1.63E-05
Formaldehyde 7.89E-05 lb/MMBtu 6.67E-06
Acetaldehyde 2.52E-05 lb/MMBtu 2.13E-06
Acrolein 7.88E-06 lb/MMBtu 6.66E-07
Naphthalene 1.30E-04 lb/MMBtu 1.10E-05
Acenaphthylene 9.23E-06 lb/MMBtu 7.80E-07
Acenaphthene 4.68E-06 lb/MMBtu 3.95E-07
Fluorene 1.28E-05 lb/MMBtu 1.08E-06
Phenanthrene 4.08E-05 lb/MMBtu 3.45E-06
Anthracene 1.23E-06 lb/MMBtu 1.04E-07
Fluoranthene 4.03E-06 lb/MMBtu 3.40E-07
Pyrene 3.71E-06 lb/MMBtu 3.13E-07
Benz(a)anthracene 6.22E-07 lb/MMBtu 5.25E-08
Chrysene 1.53E-06 lb/MMBtu 1.29E-07
Benzo(b)fluoranthene 1.11E-06 lb/MMBtu 9.38E-08
Benzo(k)fluoranthene 2.18E-07 lb/MMBtu 1.84E-08
Benzo(a)pyrene 2.57E-07 lb/MMBtu 2.17E-08
Indeno(1,2,3-cd)pyrene 4.14E-07 lb/MMBtu 3.50E-08
Dibenz(a,h)anthracene 3.46E-07 lb/MMBtu 2.92E-08
Benzo(g,h,i)perylene 5.56E-07 lb/MMBtu 4.70E-08
FB06 Electrowinning Building Emergency Generator (EWEG)
ICDE1 2-02-001-02 NF 24 hours 5.00 4.43 0.0066 0.27 0 694 0.03 0.006 -- -- g/kW-hr 0.007 0.006 0.000009 0.0004 0 0.92 0.00004 0.000007 --
50 kW Benzene 9.33E-04 lb/MMBtu 5.25E-06
Toluene 4.09E-04 lb/MMBtu 2.30E-06
Xylenes 2.85E-04 lb/MMBtu 1.61E-06
1,3-Butadiene 3.91E-05 lb/MMBtu 2.20E-07
Rosemont Copper ProjectEmission Inventory Information JBR ENVIRONMENTAL CONSULTANTS, INC.
November 2011Page H176
AZRP00358

CO NOX SO2 VOC H2SO4 CO2 CH4 N2O HAP Name HAP EF CO NOX SO2 VOC H2SO4 CO2a CH4
a N2O a HAP b
Emissions (tpd) - Year 10
Table H.46 Maximum Daily Gaseous Emissions - Year 10
Rate UnitsSCC Daily Production Rate - Year 10
Emission FactorsUnit ID EF UnitsUnit Description Process Code
Non-Fug. (NF) /
Fug. (F)
Formaldehyde 1.18E-03 lb/MMBtu 6.65E-06
Acetaldehyde 7.67E-04 lb/MMBtu 4.32E-06
Acrolein 9.25E-05 lb/MMBtu 5.21E-07
Naphthalene 8.48E-05 lb/MMBtu 4.78E-07
Acenaphthylene 5.06E-06 lb/MMBtu 2.85E-08
Acenaphthene 1.42E-06 lb/MMBtu 8.00E-09
Fluorene 2.92E-05 lb/MMBtu 1.64E-07
Phenanthrene 2.94E-05 lb/MMBtu 1.66E-07
Anthracene 1.87E-06 lb/MMBtu 1.05E-08
Fluoranthene 7.61E-06 lb/MMBtu 4.29E-08
Pyrene 4.78E-06 lb/MMBtu 2.69E-08
Benzo(a)anthracene 1.68E-06 lb/MMBtu 9.46E-09
Chrysene 3.53E-07 lb/MMBtu 1.99E-09
Benzo(b)fluoranthene 9.91E-08 lb/MMBtu 5.58E-10
Benzo(k)fluoranthene 1.55E-07 lb/MMBtu 8.73E-10
Benzo(a)pyrene 1.88E-07 lb/MMBtu 1.06E-09
Indeno(1,2,3-cd)pyrene 3.75E-07 lb/MMBtu 2.11E-09
Dibenz(a,h)anthracene 5.83E-07 lb/MMBtu 3.28E-09
Benzo(g,h,i)perylene 4.89E-07 lb/MMBtu 2.75E-09
FB07 Primary Crusher Fire Water Pump (PCFWP) ICDE2 2-02-001-02 NF 24 hours 3.50 3.73 0.0066 0.27 0 694 0.03 0.006 -- -- g/kW-hr 0.03 0.03 0.00005 0.002 0 5.48 0.0002 0.00004 --
400 hp Benzene 9.33E-04 lb/MMBtu 3.13E-05
Toluene 4.09E-04 lb/MMBtu 1.37E-05
Xylenes 2.85E-04 lb/MMBtu 9.58E-06
1,3-Butadiene 3.91E-05 lb/MMBtu 1.31E-06
Formaldehyde 1.18E-03 lb/MMBtu 3.96E-05
Acetaldehyde 7.67E-04 lb/MMBtu 2.58E-05
Acrolein 9.25E-05 lb/MMBtu 3.11E-06
Naphthalene 8.48E-05 lb/MMBtu 2.85E-06
Acenaphthylene 5.06E-06 lb/MMBtu 1.70E-07
Acenaphthene 1.42E-06 lb/MMBtu 4.77E-08
Fluorene 2.92E-05 lb/MMBtu 9.81E-07
Phenanthrene 2.94E-05 lb/MMBtu 9.88E-07
Anthracene 1.87E-06 lb/MMBtu 6.28E-08
Fluoranthene 7.61E-06 lb/MMBtu 2.56E-07
Pyrene 4.78E-06 lb/MMBtu 1.61E-07
Benzo(a)anthracene 1.68E-06 lb/MMBtu 5.64E-08
Chrysene 3.53E-07 lb/MMBtu 1.19E-08
Benzo(b)fluoranthene 9.91E-08 lb/MMBtu 3.33E-09
Benzo(k)fluoranthene 1.55E-07 lb/MMBtu 5.21E-09
Benzo(a)pyrene 1.88E-07 lb/MMBtu 6.32E-09
Rosemont Copper ProjectEmission Inventory Information JBR ENVIRONMENTAL CONSULTANTS, INC.
November 2011Page H177
AZRP00359

CO NOX SO2 VOC H2SO4 CO2 CH4 N2O HAP Name HAP EF CO NOX SO2 VOC H2SO4 CO2a CH4
a N2O a HAP b
Emissions (tpd) - Year 10
Table H.46 Maximum Daily Gaseous Emissions - Year 10
Rate UnitsSCC Daily Production Rate - Year 10
Emission FactorsUnit ID EF UnitsUnit Description Process Code
Non-Fug. (NF) /
Fug. (F)
Indeno(1,2,3-cd)pyrene 3.75E-07 lb/MMBtu 1.26E-08
Dibenz(a,h)anthracene 5.83E-07 lb/MMBtu 1.96E-08
Benzo(g,h,i)perylene 4.89E-07 lb/MMBtu 1.64E-08
FB08 SX/EW Fire Water Pump (SXFWP) ICDE2 2-02-001-02 NF 24 hours 3.50 3.73 0.0066 0.27 0 694 0.03 0.006 -- -- g/kW-hr 0.03 0.03 0.00005 0.002 0 5.48 0.0002 0.00004 --
400 hp Benzene 9.33E-04 lb/MMBtu 3.13E-05
Toluene 4.09E-04 lb/MMBtu 1.37E-05
Xylenes 2.85E-04 lb/MMBtu 9.58E-06
1,3-Butadiene 3.91E-05 lb/MMBtu 1.31E-06
Formaldehyde 1.18E-03 lb/MMBtu 3.96E-05
Acetaldehyde 7.67E-04 lb/MMBtu 2.58E-05
Acrolein 9.25E-05 lb/MMBtu 3.11E-06
Naphthalene 8.48E-05 lb/MMBtu 2.85E-06
Acenaphthylene 5.06E-06 lb/MMBtu 1.70E-07
Acenaphthene 1.42E-06 lb/MMBtu 4.77E-08
Fluorene 2.92E-05 lb/MMBtu 9.81E-07
Phenanthrene 2.94E-05 lb/MMBtu 9.88E-07
Anthracene 1.87E-06 lb/MMBtu 6.28E-08
Fluoranthene 7.61E-06 lb/MMBtu 2.56E-07
Pyrene 4.78E-06 lb/MMBtu 1.61E-07
Benzo(a)anthracene 1.68E-06 lb/MMBtu 5.64E-08
Chrysene 3.53E-07 lb/MMBtu 1.19E-08
Benzo(b)fluoranthene 9.91E-08 lb/MMBtu 3.33E-09
Benzo(k)fluoranthene 1.55E-07 lb/MMBtu 5.21E-09
Benzo(a)pyrene 1.88E-07 lb/MMBtu 6.32E-09
Indeno(1,2,3-cd)pyrene 3.75E-07 lb/MMBtu 1.26E-08
Dibenz(a,h)anthracene 5.83E-07 lb/MMBtu 1.96E-08
Benzo(g,h,i)perylene 4.89E-07 lb/MMBtu 1.64E-08
Tanks
T01 C7 Distribution Tank (T-C7D) C7DT 4-03-010-19 NF 24 hours 0 0 0 1.08E-01 0 0 0 0 -- -- lb/hr 0 0 0 0.001 0 0 0 0 --
T02 MIBC Storage Tank (T-MIBCS) MST 4-90-999-98 NF 24 hours 0 0 0 3.53E-03 0 0 0 0 -- -- lb/hr 0 0 0 0.00004 0 0 0 0 --
T03 Diesel Fuel Storage Tank - Heavy Vehicles 1(T-DFS-HV1)
DFSTHV 4-03-010-19 NF 24 hours 0 0 0 1.39E-02 0 0 0 0 n-Hexane 5.71E-06 lb/hr 0 0 0 0.0002 0 0 0 0 6.85E-08
Benzene 2.74E-05 lb/hr 3.29E-07
Toluene 3.18E-04 lb/hr 3.82E-06
Ethylbenzene 4.45E-05 lb/hr 5.34E-07
m-Xylene 8.23E-04 lb/hr 9.88E-06
1,2,4-Trimethylbenzene 6.76E-04 lb/hr 8.11E-06
T04 Diesel Fuel Storage Tank - Heavy Vehicles 2(T-DFS-HV2)
DFSTHV 4-03-010-19 NF 24 hours 0 0 0 1.39E-02 0 0 0 0 n-Hexane 5.71E-06 lb/hr 0 0 0 0.0002 0 0 0 0 6.85E-08
Benzene 2.74E-05 lb/hr 3.29E-07
Toluene 3.18E-04 lb/hr 3.82E-06
Ethylbenzene 4.45E-05 lb/hr 5.34E-07
Rosemont Copper ProjectEmission Inventory Information JBR ENVIRONMENTAL CONSULTANTS, INC.
November 2011Page H178
AZRP00360

CO NOX SO2 VOC H2SO4 CO2 CH4 N2O HAP Name HAP EF CO NOX SO2 VOC H2SO4 CO2a CH4
a N2O a HAP b
Emissions (tpd) - Year 10
Table H.46 Maximum Daily Gaseous Emissions - Year 10
Rate UnitsSCC Daily Production Rate - Year 10
Emission FactorsUnit ID EF UnitsUnit Description Process Code
Non-Fug. (NF) /
Fug. (F)
m-Xylene 8.23E-04 lb/hr 9.88E-06
1,2,4-Trimethylbenzene 6.76E-04 lb/hr 8.11E-06
0.39 0.63 0.0008 0.04 0.00005 88.36 0.004 0.0007 0.001
1.74 0.44 0.05 0.01 0 14.73 0.0006 0.0001 0.009
2.13 1.07 0.05 0.05 0.00005 103.09 0.004 0.0008 0.01
2.78 3.77 0.006 0.27 -- 542.21 -- -- --
a CO2e emissions are calculcated by summing the individual greenhouse gas emissions multiplied by their global warming potential (GWP). GWP of CO2 = 1, GWP of CH4 = 21, GWP of N2O = 310.
b All HAP emissions are included in the facility-wide potential to emit, regardless of if they are fugitive or non-fugitive emissions.
Tailpipe Emissions (see Tables H.51-H.55):
Total Emissions (excluding tailpipe emissions):
Total Non-Fugitive Emissions (excluding tailpipe emissions):
Total Fugitive Emissions (excluding tailpipe emissions):
Rosemont Copper ProjectEmission Inventory Information JBR ENVIRONMENTAL CONSULTANTS, INC.
November 2011Page H179
AZRP00361

CO NOX SO2 VOC H2SO4 CO2 CH4 N2O HAP Name HAP EF CO NOX SO2 VOC H2SO4 CO2a CH4
a N2O a HAP b
Mining
MN02 Blasting Blast 3-05-020-09 F 52 tons ANFO 67.00 17.00 2.00 0 0 566 0.02 0.005 -- -- lb/tons ANFO 3,484.00 884.00 104.00 0 0 29,455.36 1.19 0.24 --
Solvent Extraction and Electrowinning
SXE01 Solvent Extraction SX 4-90-001-99 F 1 hours 0 0 0 9.43E-05 0 0 0 0 Benzene 3.37E-07 lb/hr-ft2 0 0 0 0.86 0 0 0 0 3.08E-03
4 Primary Mix Tanks (7.75' D x 9.75' H each) 4 @ 47.2 = 188.7 ft2 9,132.9 ft2 Total Surface Area of Solvent Extraction Toluene 4.82E-06 lb/hr-ft2 4.40E-02
4 Secondary Mix Tanks (9.5' D x 9.75' H each) 4 @ 70.9 = 283.5 ft2 Ethylbenzene 2.05E-05 lb/hr-ft2 1.87E-01
3 Tertiary Mix Tanks (9.5' D x 9.75' H each) 3 @ 70.9 = 212.6 ft2 Xylenes 2.80E-05 lb/hr-ft2 2.56E-01
4 Extraction Settlers (64' L x 33' W x 3.33' H each) 4 @ 2,112 = 8,448 ft2 Others (including Hexane) 2.94E-05 lb/hr-ft2 2.69E-01
SXE02 Electrowinning Commercial Cells (EWCC) EW none NF 1 hours 0 0 0 0 1.57E-04 0 0 0 Cobalt Compounds 2.36E-08 lb/hr-ft2 0 0 0 0 0.004 0 0 0 6.22E-07
Controlled by Cell Ventilation Scrubbers(PC-EWCVS1/EWCVS6)
2,640 ft2
99 Control Efficiency (%)
Fuel Burning Equipment
FB01 Diesel Electrowinning Hot Water Generator (HWG) DFB 1-02-005-03 NF 1 hours 5.00 20.00 0.21 0.20 0 23,217 0.94 0.19 POM 3.30E-03 lb/1000 gal 0.22 0.88 0.009 0.009 0 1,016.78 0.04 0.008 1.45E-04
6.0 MMBtu/hr Formaldehyde 6.10E-02 lb/1000 gal 2.67E-03
Arsenic 4.00 lb/1012 Btu 2.40E-05
Beryllium 3.00 lb/1012 Btu 1.80E-05
Cadmium 3.00 lb/1012 Btu 1.80E-05
Chromium 3.00 lb/1012 Btu 1.80E-05
Lead 9.00 lb/1012 Btu 5.40E-05
Mercury 3.00 lb/1012 Btu 1.80E-05
Manganese 6.00 lb/1012 Btu 3.60E-05
Nickel 3.00 lb/1012 Btu 1.80E-05
Selenium 15.00 lb/1012 Btu 9.00E-05
FB02 Thickener Area Emergency Generator (TEG) ICDE3 2-02-001-02 NF 1 hours 3.50 6.00 0.0066 0.40 0 694 0.03 0.006 -- -- g/kW-hr 7.72 13.23 0.01 0.88 0 1,530.61 0.06 0.01 --
1,000 kW Benzene 7.76E-04 lb/MMBtu 7.28E-03
Toluene 2.81E-04 lb/MMBtu 2.64E-03
Xylenes 1.93E-04 lb/MMBtu 1.81E-03
Formaldehyde 7.89E-05 lb/MMBtu 7.41E-04
Acetaldehyde 2.52E-05 lb/MMBtu 2.37E-04
Acrolein 7.88E-06 lb/MMBtu 7.40E-05
Naphthalene 1.30E-04 lb/MMBtu 1.22E-03
Acenaphthylene 9.23E-06 lb/MMBtu 8.66E-05
Acenaphthene 4.68E-06 lb/MMBtu 4.39E-05
Fluorene 1.28E-05 lb/MMBtu 1.20E-04
Phenanthrene 4.08E-05 lb/MMBtu 3.83E-04
Anthracene 1.23E-06 lb/MMBtu 1.15E-05
Fluoranthene 4.03E-06 lb/MMBtu 3.78E-05
Pyrene 3.71E-06 lb/MMBtu 3.48E-05
Benz(a)anthracene 6.22E-07 lb/MMBtu 5.84E-06
Chrysene 1.53E-06 lb/MMBtu 1.44E-05
Emissions (lb/hr) - Year 10
Table H.47 Hourly Gaseous Emissions - Year 10
Rate UnitsSCCHourly
Production Rate - Year 10
Emission FactorsUnit ID EF UnitsUnit Description Process Code
Non-Fug. (NF) /
Fug. (F)
Rosemont Copper ProjectEmission Inventory Information JBR ENVIRONMENTAL CONSULTANTS, INC.
November 2011Page H180
AZRP00362
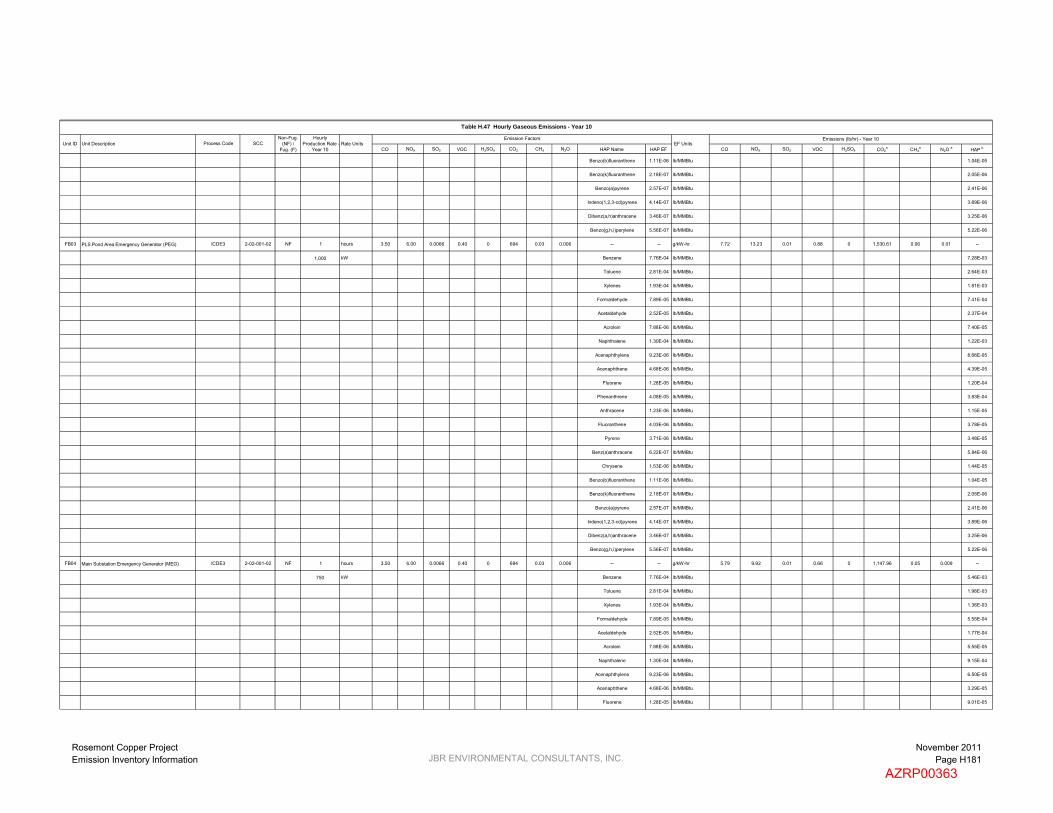
CO NOX SO2 VOC H2SO4 CO2 CH4 N2O HAP Name HAP EF CO NOX SO2 VOC H2SO4 CO2a CH4
a N2O a HAP b
Emissions (lb/hr) - Year 10
Table H.47 Hourly Gaseous Emissions - Year 10
Rate UnitsSCCHourly
Production Rate - Year 10
Emission FactorsUnit ID EF UnitsUnit Description Process Code
Non-Fug. (NF) /
Fug. (F)
Benzo(b)fluoranthene 1.11E-06 lb/MMBtu 1.04E-05
Benzo(k)fluoranthene 2.18E-07 lb/MMBtu 2.05E-06
Benzo(a)pyrene 2.57E-07 lb/MMBtu 2.41E-06
Indeno(1,2,3-cd)pyrene 4.14E-07 lb/MMBtu 3.89E-06
Dibenz(a,h)anthracene 3.46E-07 lb/MMBtu 3.25E-06
Benzo(g,h,i)perylene 5.56E-07 lb/MMBtu 5.22E-06
FB03 PLS Pond Area Emergency Generator (PEG) ICDE3 2-02-001-02 NF 1 hours 3.50 6.00 0.0066 0.40 0 694 0.03 0.006 -- -- g/kW-hr 7.72 13.23 0.01 0.88 0 1,530.61 0.06 0.01 --
1,000 kW Benzene 7.76E-04 lb/MMBtu 7.28E-03
Toluene 2.81E-04 lb/MMBtu 2.64E-03
Xylenes 1.93E-04 lb/MMBtu 1.81E-03
Formaldehyde 7.89E-05 lb/MMBtu 7.41E-04
Acetaldehyde 2.52E-05 lb/MMBtu 2.37E-04
Acrolein 7.88E-06 lb/MMBtu 7.40E-05
Naphthalene 1.30E-04 lb/MMBtu 1.22E-03
Acenaphthylene 9.23E-06 lb/MMBtu 8.66E-05
Acenaphthene 4.68E-06 lb/MMBtu 4.39E-05
Fluorene 1.28E-05 lb/MMBtu 1.20E-04
Phenanthrene 4.08E-05 lb/MMBtu 3.83E-04
Anthracene 1.23E-06 lb/MMBtu 1.15E-05
Fluoranthene 4.03E-06 lb/MMBtu 3.78E-05
Pyrene 3.71E-06 lb/MMBtu 3.48E-05
Benz(a)anthracene 6.22E-07 lb/MMBtu 5.84E-06
Chrysene 1.53E-06 lb/MMBtu 1.44E-05
Benzo(b)fluoranthene 1.11E-06 lb/MMBtu 1.04E-05
Benzo(k)fluoranthene 2.18E-07 lb/MMBtu 2.05E-06
Benzo(a)pyrene 2.57E-07 lb/MMBtu 2.41E-06
Indeno(1,2,3-cd)pyrene 4.14E-07 lb/MMBtu 3.89E-06
Dibenz(a,h)anthracene 3.46E-07 lb/MMBtu 3.25E-06
Benzo(g,h,i)perylene 5.56E-07 lb/MMBtu 5.22E-06
FB04 Main Substation Emergency Generator (MEG) ICDE3 2-02-001-02 NF 1 hours 3.50 6.00 0.0066 0.40 0 694 0.03 0.006 -- -- g/kW-hr 5.79 9.92 0.01 0.66 0 1,147.96 0.05 0.009 --
750 kW Benzene 7.76E-04 lb/MMBtu 5.46E-03
Toluene 2.81E-04 lb/MMBtu 1.98E-03
Xylenes 1.93E-04 lb/MMBtu 1.36E-03
Formaldehyde 7.89E-05 lb/MMBtu 5.55E-04
Acetaldehyde 2.52E-05 lb/MMBtu 1.77E-04
Acrolein 7.88E-06 lb/MMBtu 5.55E-05
Naphthalene 1.30E-04 lb/MMBtu 9.15E-04
Acenaphthylene 9.23E-06 lb/MMBtu 6.50E-05
Acenaphthene 4.68E-06 lb/MMBtu 3.29E-05
Fluorene 1.28E-05 lb/MMBtu 9.01E-05
Rosemont Copper ProjectEmission Inventory Information JBR ENVIRONMENTAL CONSULTANTS, INC.
November 2011Page H181
AZRP00363

CO NOX SO2 VOC H2SO4 CO2 CH4 N2O HAP Name HAP EF CO NOX SO2 VOC H2SO4 CO2a CH4
a N2O a HAP b
Emissions (lb/hr) - Year 10
Table H.47 Hourly Gaseous Emissions - Year 10
Rate UnitsSCCHourly
Production Rate - Year 10
Emission FactorsUnit ID EF UnitsUnit Description Process Code
Non-Fug. (NF) /
Fug. (F)
Phenanthrene 4.08E-05 lb/MMBtu 2.87E-04
Anthracene 1.23E-06 lb/MMBtu 8.66E-06
Fluoranthene 4.03E-06 lb/MMBtu 2.84E-05
Pyrene 3.71E-06 lb/MMBtu 2.61E-05
Benz(a)anthracene 6.22E-07 lb/MMBtu 4.38E-06
Chrysene 1.53E-06 lb/MMBtu 1.08E-05
Benzo(b)fluoranthene 1.11E-06 lb/MMBtu 7.81E-06
Benzo(k)fluoranthene 2.18E-07 lb/MMBtu 1.53E-06
Benzo(a)pyrene 2.57E-07 lb/MMBtu 1.81E-06
Indeno(1,2,3-cd)pyrene 4.14E-07 lb/MMBtu 2.91E-06
Dibenz(a,h)anthracene 3.46E-07 lb/MMBtu 2.44E-06
Benzo(g,h,i)perylene 5.56E-07 lb/MMBtu 3.91E-06
FB05 Administration Building Emergency Generator (AEG) ICDE3 2-02-001-02 NF 1 hours 3.50 6.00 0.0066 0.40 0 694 0.03 0.006 -- -- g/kW-hr 5.79 9.92 0.01 0.66 0 1,147.96 0.05 0.009 --
750 kW Benzene 7.76E-04 lb/MMBtu 5.46E-03
Toluene 2.81E-04 lb/MMBtu 1.98E-03
Xylenes 1.93E-04 lb/MMBtu 1.36E-03
Formaldehyde 7.89E-05 lb/MMBtu 5.55E-04
Acetaldehyde 2.52E-05 lb/MMBtu 1.77E-04
Acrolein 7.88E-06 lb/MMBtu 5.55E-05
Naphthalene 1.30E-04 lb/MMBtu 9.15E-04
Acenaphthylene 9.23E-06 lb/MMBtu 6.50E-05
Acenaphthene 4.68E-06 lb/MMBtu 3.29E-05
Fluorene 1.28E-05 lb/MMBtu 9.01E-05
Phenanthrene 4.08E-05 lb/MMBtu 2.87E-04
Anthracene 1.23E-06 lb/MMBtu 8.66E-06
Fluoranthene 4.03E-06 lb/MMBtu 2.84E-05
Pyrene 3.71E-06 lb/MMBtu 2.61E-05
Benz(a)anthracene 6.22E-07 lb/MMBtu 4.38E-06
Chrysene 1.53E-06 lb/MMBtu 1.08E-05
Benzo(b)fluoranthene 1.11E-06 lb/MMBtu 7.81E-06
Benzo(k)fluoranthene 2.18E-07 lb/MMBtu 1.53E-06
Benzo(a)pyrene 2.57E-07 lb/MMBtu 1.81E-06
Indeno(1,2,3-cd)pyrene 4.14E-07 lb/MMBtu 2.91E-06
Dibenz(a,h)anthracene 3.46E-07 lb/MMBtu 2.44E-06
Benzo(g,h,i)perylene 5.56E-07 lb/MMBtu 3.91E-06
FB06 Electrowinning Building Emergency Generator (EWEG)
ICDE1 2-02-001-02 NF 1 hours 5.00 4.43 0.0066 0.27 0 694 0.03 0.006 -- -- g/kW-hr 0.55 0.49 0.0007 0.03 0 76.53 0.003 0.0006 --
50 kW Benzene 9.33E-04 lb/MMBtu 4.38E-04
Toluene 4.09E-04 lb/MMBtu 1.92E-04
Xylenes 2.85E-04 lb/MMBtu 1.34E-04
1,3-Butadiene 3.91E-05 lb/MMBtu 1.84E-05
Rosemont Copper ProjectEmission Inventory Information JBR ENVIRONMENTAL CONSULTANTS, INC.
November 2011Page H182
AZRP00364

CO NOX SO2 VOC H2SO4 CO2 CH4 N2O HAP Name HAP EF CO NOX SO2 VOC H2SO4 CO2a CH4
a N2O a HAP b
Emissions (lb/hr) - Year 10
Table H.47 Hourly Gaseous Emissions - Year 10
Rate UnitsSCCHourly
Production Rate - Year 10
Emission FactorsUnit ID EF UnitsUnit Description Process Code
Non-Fug. (NF) /
Fug. (F)
Formaldehyde 1.18E-03 lb/MMBtu 5.54E-04
Acetaldehyde 7.67E-04 lb/MMBtu 3.60E-04
Acrolein 9.25E-05 lb/MMBtu 4.34E-05
Naphthalene 8.48E-05 lb/MMBtu 3.98E-05
Acenaphthylene 5.06E-06 lb/MMBtu 2.37E-06
Acenaphthene 1.42E-06 lb/MMBtu 6.66E-07
Fluorene 2.92E-05 lb/MMBtu 1.37E-05
Phenanthrene 2.94E-05 lb/MMBtu 1.38E-05
Anthracene 1.87E-06 lb/MMBtu 8.78E-07
Fluoranthene 7.61E-06 lb/MMBtu 3.57E-06
Pyrene 4.78E-06 lb/MMBtu 2.24E-06
Benzo(a)anthracene 1.68E-06 lb/MMBtu 7.89E-07
Chrysene 3.53E-07 lb/MMBtu 1.66E-07
Benzo(b)fluoranthene 9.91E-08 lb/MMBtu 4.65E-08
Benzo(k)fluoranthene 1.55E-07 lb/MMBtu 7.28E-08
Benzo(a)pyrene 1.88E-07 lb/MMBtu 8.82E-08
Indeno(1,2,3-cd)pyrene 3.75E-07 lb/MMBtu 1.76E-07
Dibenz(a,h)anthracene 5.83E-07 lb/MMBtu 2.74E-07
Benzo(g,h,i)perylene 4.89E-07 lb/MMBtu 2.30E-07
FB07 Primary Crusher Fire Water Pump (PCFWP) ICDE2 2-02-001-02 NF 1 hours 3.50 3.73 0.0066 0.27 0 694 0.03 0.006 -- -- g/kW-hr 2.30 2.46 0.004 0.18 0 456.55 0.02 0.004 --
400 hp Benzene 9.33E-04 lb/MMBtu 2.61E-03
Toluene 4.09E-04 lb/MMBtu 1.15E-03
Xylenes 2.85E-04 lb/MMBtu 7.98E-04
1,3-Butadiene 3.91E-05 lb/MMBtu 1.09E-04
Formaldehyde 1.18E-03 lb/MMBtu 3.30E-03
Acetaldehyde 7.67E-04 lb/MMBtu 2.15E-03
Acrolein 9.25E-05 lb/MMBtu 2.59E-04
Naphthalene 8.48E-05 lb/MMBtu 2.37E-04
Acenaphthylene 5.06E-06 lb/MMBtu 1.42E-05
Acenaphthene 1.42E-06 lb/MMBtu 3.98E-06
Fluorene 2.92E-05 lb/MMBtu 8.18E-05
Phenanthrene 2.94E-05 lb/MMBtu 8.23E-05
Anthracene 1.87E-06 lb/MMBtu 5.24E-06
Fluoranthene 7.61E-06 lb/MMBtu 2.13E-05
Pyrene 4.78E-06 lb/MMBtu 1.34E-05
Benzo(a)anthracene 1.68E-06 lb/MMBtu 4.70E-06
Chrysene 3.53E-07 lb/MMBtu 9.88E-07
Benzo(b)fluoranthene 9.91E-08 lb/MMBtu 2.77E-07
Benzo(k)fluoranthene 1.55E-07 lb/MMBtu 4.34E-07
Benzo(a)pyrene 1.88E-07 lb/MMBtu 5.26E-07
Rosemont Copper ProjectEmission Inventory Information JBR ENVIRONMENTAL CONSULTANTS, INC.
November 2011Page H183
AZRP00365

CO NOX SO2 VOC H2SO4 CO2 CH4 N2O HAP Name HAP EF CO NOX SO2 VOC H2SO4 CO2a CH4
a N2O a HAP b
Emissions (lb/hr) - Year 10
Table H.47 Hourly Gaseous Emissions - Year 10
Rate UnitsSCCHourly
Production Rate - Year 10
Emission FactorsUnit ID EF UnitsUnit Description Process Code
Non-Fug. (NF) /
Fug. (F)
Indeno(1,2,3-cd)pyrene 3.75E-07 lb/MMBtu 1.05E-06
Dibenz(a,h)anthracene 5.83E-07 lb/MMBtu 1.63E-06
Benzo(g,h,i)perylene 4.89E-07 lb/MMBtu 1.37E-06
FB08 SX/EW Fire Water Pump (SXFWP) ICDE2 2-02-001-02 NF 1 hours 3.50 3.73 0.0066 0.27 0 694 0.03 0.006 -- -- g/kW-hr 2.30 2.46 0.004 0.18 0 456.55 0.02 0.004 --
400 hp Benzene 9.33E-04 lb/MMBtu 2.61E-03
Toluene 4.09E-04 lb/MMBtu 1.15E-03
Xylenes 2.85E-04 lb/MMBtu 7.98E-04
1,3-Butadiene 3.91E-05 lb/MMBtu 1.09E-04
Formaldehyde 1.18E-03 lb/MMBtu 3.30E-03
Acetaldehyde 7.67E-04 lb/MMBtu 2.15E-03
Acrolein 9.25E-05 lb/MMBtu 2.59E-04
Naphthalene 8.48E-05 lb/MMBtu 2.37E-04
Acenaphthylene 5.06E-06 lb/MMBtu 1.42E-05
Acenaphthene 1.42E-06 lb/MMBtu 3.98E-06
Fluorene 2.92E-05 lb/MMBtu 8.18E-05
Phenanthrene 2.94E-05 lb/MMBtu 8.23E-05
Anthracene 1.87E-06 lb/MMBtu 5.24E-06
Fluoranthene 7.61E-06 lb/MMBtu 2.13E-05
Pyrene 4.78E-06 lb/MMBtu 1.34E-05
Benzo(a)anthracene 1.68E-06 lb/MMBtu 4.70E-06
Chrysene 3.53E-07 lb/MMBtu 9.88E-07
Benzo(b)fluoranthene 9.91E-08 lb/MMBtu 2.77E-07
Benzo(k)fluoranthene 1.55E-07 lb/MMBtu 4.34E-07
Benzo(a)pyrene 1.88E-07 lb/MMBtu 5.26E-07
Indeno(1,2,3-cd)pyrene 3.75E-07 lb/MMBtu 1.05E-06
Dibenz(a,h)anthracene 5.83E-07 lb/MMBtu 1.63E-06
Benzo(g,h,i)perylene 4.89E-07 lb/MMBtu 1.37E-06
Tanks
T01 C7 Distribution Tank (T-C7D) C7DT 4-03-010-19 NF 1 hours 0 0 0 1.08E-01 0 0 0 0 -- -- lb/hr 0 0 0 0.11 0 0 0 0 --
T02 MIBC Storage Tank (T-MIBCS) MST 4-90-999-98 NF 1 hours 0 0 0 3.53E-03 0 0 0 0 -- -- lb/hr 0 0 0 0.004 0 0 0 0 --
T03 Diesel Fuel Storage Tank - Heavy Vehicles 1(T-DFS-HV1)
DFSTHV 4-03-010-19 NF 1 hours 0 0 0 1.39E-02 0 0 0 0 n-Hexane 5.71E-06 lb/hr 0 0 0 0.01 0 0 0 0 5.71E-06
Benzene 2.74E-05 lb/hr 2.74E-05
Toluene 3.18E-04 lb/hr 3.18E-04
Ethylbenzene 4.45E-05 lb/hr 4.45E-05
m-Xylene 8.23E-04 lb/hr 8.23E-04
1,2,4-Trimethylbenzene 6.76E-04 lb/hr 6.76E-04
T04 Diesel Fuel Storage Tank - Heavy Vehicles 2(T-DFS-HV2)
DFSTHV 4-03-010-19 NF 1 hours 0 0 0 1.39E-02 0 0 0 0 n-Hexane 5.71E-06 lb/hr 0 0 0 0.01 0 0 0 0 5.71E-06
Benzene 2.74E-05 lb/hr 2.74E-05
Toluene 3.18E-04 lb/hr 3.18E-04
Ethylbenzene 4.45E-05 lb/hr 4.45E-05
Rosemont Copper ProjectEmission Inventory Information JBR ENVIRONMENTAL CONSULTANTS, INC.
November 2011Page H184
AZRP00366

CO NOX SO2 VOC H2SO4 CO2 CH4 N2O HAP Name HAP EF CO NOX SO2 VOC H2SO4 CO2a CH4
a N2O a HAP b
Emissions (lb/hr) - Year 10
Table H.47 Hourly Gaseous Emissions - Year 10
Rate UnitsSCCHourly
Production Rate - Year 10
Emission FactorsUnit ID EF UnitsUnit Description Process Code
Non-Fug. (NF) /
Fug. (F)
m-Xylene 8.23E-04 lb/hr 8.23E-04
1,2,4-Trimethylbenzene 6.76E-04 lb/hr 6.76E-04
32.38 52.57 0.07 3.61 0.004 7,363.56 0.30 0.06 0.08
3,484.00 884.00 104.00 0.86 0 29,455.36 1.19 0.24 0.76
3,516.38 936.57 104.07 4.48 0.004 36,818.92 1.49 0.30 0.84
231.91 315.26 1.00 22.54 -- 47,021.00 -- -- --
a CO2e emissions are calculcated by summing the individual greenhouse gas emissions multiplied by their global warming potential (GWP). GWP of CO2 = 1, GWP of CH4 = 21, GWP of N2O = 310.
b All HAP emissions are included in the facility-wide potential to emit, regardless of if they are fugitive or non-fugitive emissions.
Tailpipe Emissions (see Tables H.51-H.55):
Total Emissions (excluding tailpipe emissions):
Total Non-Fugitive Emissions (excluding tailpipe emissions):
Total Fugitive Emissions (excluding tailpipe emissions):
Rosemont Copper ProjectEmission Inventory Information JBR ENVIRONMENTAL CONSULTANTS, INC.
November 2011Page H185
AZRP00367

Hourly Daily AnnualTier 2/Tier 4 (Final) Emission Standards or Mobile 6 Output
Units lb/hr tpd tpy
Haulage Trucks, 250 tons 31 2,650 1.00 24 6,600 hours 0.32 0.15 g/hp-hr 8.69 0.10 28.69
Crawler Dozers, D11T Class 3 850 0.46 11 4,000 hours 0.575 0.03 g/hp-hr 0.04 0.0005 0.19
Crawler Dozers, D10T Class 3 580 0.70 17 6,090 hours 0.575 0.01 g/hp-hr 0.02 0.0002 0.07
Crawler Dozer, D8T Class 1 310 0.75 18 6,570 hours 0.575 0.01 g/hp-hr 0.003 0.00004 0.01
Rubber Tired Dozers, 834H Class 3 498 0.70 17 6,175 hours 0.575 0.01 g/hp-hr 0.01 0.0002 0.06
Motor Graders, 24M Class 1 533 0.68 16 6,000 hours 0.575 0.01 g/hp-hr 0.005 0.00006 0.02
Motor Graders, 16M Class 3 297 0.46 11 4,000 hours 0.575 0.01 g/hp-hr 0.005 0.00006 0.02
Water Trucks, 30,000 gallons 4 1,348 0.45 11 3,250 hours 0.35 0.03 g/hp-hr 0.06 0.0007 0.20
Diesel Blasthole Drill, 12.25 inches 2 1,500 0.75 18 6,570 hours 0.43 0.03 g/hp-hr 0.06 0.0008 0.28
Hydraulic DML 45 Drill 1 425 0.75 18 6,570 hours 0.43 0.01 g/hp-hr 0.003 0.00004 0.01
Front End Loaders 2 2,000 0.90 22 7,884 hours 0.59 0.15 g/hp-hr 0.70 0.008 3.08
Stemming Truck 2 450 0.75 18 6,570 hours 0.43 0.01 g/hp-hr 0.006 0.00008 0.03
ANFO/Slurry Truck, 20 tons 2 450 0.75 18 6,570 hours 0.43 0.01 g/hp-hr 0.006 0.00008 0.03
Powder Truck, 2 tons 2 350 0.75 18 6,570 hours 0.43 0.01 g/hp-hr 0.005 0.00006 0.02
Front End Loaders, 8 yd3 2 262 0.75 18 6,570 hours 0.575 0.01 g/hp-hr 0.005 0.00006 0.02
Hydraulic Excavator, 385 Cat CL 2 513 0.90 22 7,884 hours 0.35 0.01 g/hp-hr 0.007 0.00009 0.03
Backhoe/Loader, 2 yd3 1 124 0.75 18 6,570 hours 0.35 0.01 g/hp-hr 0.0007 0.000009 0.003
Table H.48 PM/TSP Emissions from Fuel Burning Mobile Engines - Year 10
Fuel Burning Mobile Engine Description a
Fleet Size
HP Rating
Load Factor
PM/TSP Emission Factors PM/TSP Emissions - Year 10Process Rates b - Year 10
Units
Rosemont Copper ProjectEmission Inventory Information JBR ENVIRONMENTAL CONSULTANTS, INC.
November 2011Page H186
AZRP00368

Hourly Daily AnnualTier 2/Tier 4 (Final) Emission Standards or Mobile 6 Output
Units lb/hr tpd tpy
Table H.48 PM/TSP Emissions from Fuel Burning Mobile Engines - Year 10
Fuel Burning Mobile Engine Description a
Fleet Size
HP Rating
Load Factor
PM/TSP Emission Factors PM/TSP Emissions - Year 10Process Rates b - Year 10
Units
All-Terrain Crane, 75 tons 1 230 0.75 18 6,570 hours 0.43 0.01 g/hp-hr 0.002 0.00002 0.007
Transporter with Tractor, 200 tons 1 1,350 0.75 18 6,570 hours 0.59 0.03 g/hp-hr 0.04 0.0005 0.17
Fuel/Lube Trucks, 6,000 gallons 2 703 0.75 18 6,570 hours 0.35 0.01 g/hp-hr 0.008 0.0001 0.04
Mechanic Field Service Trucks 5 370 1.71 41 15,000 VMT 0.43 0.2117 g/mile 0.004 0.00005 0.02
Tire Handler 1 90 0.11 3 1,000 VMT 0.43 0.2117 g/mile 0.00005 0.0000006 0.0002
Shop Forklift, 12,000 lbs 1 90 0.75 18 6,570 hours 0.59 0.01 g/hp-hr 0.0009 0.00001 0.004
Integrated Tool Carrier, 140 hp 1 138 0.75 18 6,570 hours 0.59 0.01 g/hp-hr 0.001 0.00002 0.006
Light Plant, 6 kW 15 35 0.40 10 3,504 hours 0.43 0.02 g/hp-hr 0.004 0.00005 0.02
Primary Crushing Mobile Crane - 400 tons 1 320 0.75 18 6,570 hours 0.43 0.01 g/hp-hr 0.002 0.00003 0.01
Copper Concentrate Area Front End Loader - Cat 930 1 160 0.75 18 6,570 hours 0.59 0.01 g/hp-hr 0.002 0.00002 0.007
Molybdenum Packaging Forklift, 7,000 lbs 1 93 0.75 18 6,570 hours 0.59 0.01 g/hp-hr 0.0009 0.00001 0.004
Copper Cathode Forklift 1 93 0.75 18 6,570 hours 0.59 0.01 g/hp-hr 0.0009 0.00001 0.004
Boom Trucks 10 tons, 45 foot boom 1 200 0.75 18 6,570 hours 0.21 0.01 g/hp-hr 0.0007 0.000008 0.003
Boom Trucks 15 tons, 60 foot boom 1 210 0.75 18 6,570 hours 0.21 0.01 g/hp-hr 0.0007 0.000009 0.003
Front End Loader, 6 yd3 1 349 0.75 18 6,570 hours 0.35 0.01 g/hp-hr 0.002 0.00002 0.009
Front End Loader, 5 yd3 1 149 0.75 18 6,570 hours 0.25 0.01 g/hp-hr 0.0006 0.000007 0.003
Bob Cats, 2,400 lbs 2 82 0.75 18 6,570 hours 0.59 0.01 g/hp-hr 0.002 0.00002 0.007
Rosemont Copper ProjectEmission Inventory Information JBR ENVIRONMENTAL CONSULTANTS, INC.
November 2011Page H187
AZRP00369
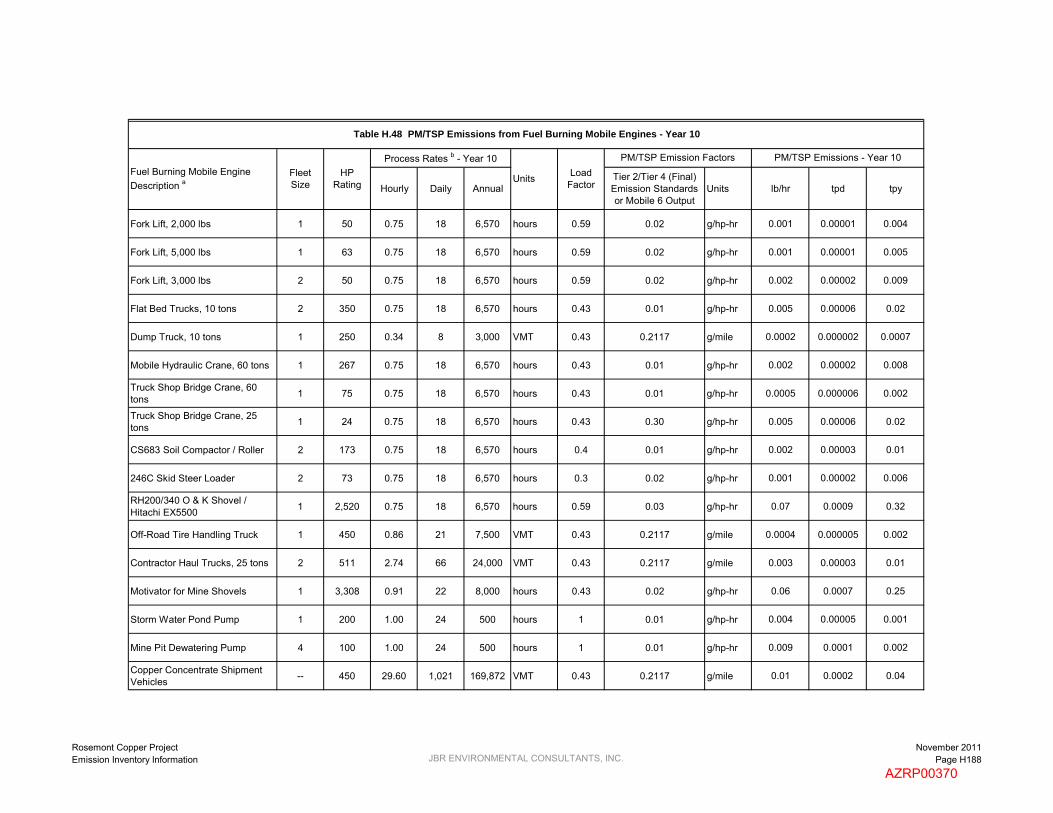
Hourly Daily AnnualTier 2/Tier 4 (Final) Emission Standards or Mobile 6 Output
Units lb/hr tpd tpy
Table H.48 PM/TSP Emissions from Fuel Burning Mobile Engines - Year 10
Fuel Burning Mobile Engine Description a
Fleet Size
HP Rating
Load Factor
PM/TSP Emission Factors PM/TSP Emissions - Year 10Process Rates b - Year 10
Units
Fork Lift, 2,000 lbs 1 50 0.75 18 6,570 hours 0.59 0.02 g/hp-hr 0.001 0.00001 0.004
Fork Lift, 5,000 lbs 1 63 0.75 18 6,570 hours 0.59 0.02 g/hp-hr 0.001 0.00001 0.005
Fork Lift, 3,000 lbs 2 50 0.75 18 6,570 hours 0.59 0.02 g/hp-hr 0.002 0.00002 0.009
Flat Bed Trucks, 10 tons 2 350 0.75 18 6,570 hours 0.43 0.01 g/hp-hr 0.005 0.00006 0.02
Dump Truck, 10 tons 1 250 0.34 8 3,000 VMT 0.43 0.2117 g/mile 0.0002 0.000002 0.0007
Mobile Hydraulic Crane, 60 tons 1 267 0.75 18 6,570 hours 0.43 0.01 g/hp-hr 0.002 0.00002 0.008
Truck Shop Bridge Crane, 60 tons 1 75 0.75 18 6,570 hours 0.43 0.01 g/hp-hr 0.0005 0.000006 0.002
Truck Shop Bridge Crane, 25 tons 1 24 0.75 18 6,570 hours 0.43 0.30 g/hp-hr 0.005 0.00006 0.02
CS683 Soil Compactor / Roller 2 173 0.75 18 6,570 hours 0.4 0.01 g/hp-hr 0.002 0.00003 0.01
246C Skid Steer Loader 2 73 0.75 18 6,570 hours 0.3 0.02 g/hp-hr 0.001 0.00002 0.006
RH200/340 O & K Shovel / Hitachi EX5500 1 2,520 0.75 18 6,570 hours 0.59 0.03 g/hp-hr 0.07 0.0009 0.32
Off-Road Tire Handling Truck 1 450 0.86 21 7,500 VMT 0.43 0.2117 g/mile 0.0004 0.000005 0.002
Contractor Haul Trucks, 25 tons 2 511 2.74 66 24,000 VMT 0.43 0.2117 g/mile 0.003 0.00003 0.01
Motivator for Mine Shovels 1 3,308 0.91 22 8,000 hours 0.43 0.02 g/hp-hr 0.06 0.0007 0.25
Storm Water Pond Pump 1 200 1.00 24 500 hours 1 0.01 g/hp-hr 0.004 0.00005 0.001
Mine Pit Dewatering Pump 4 100 1.00 24 500 hours 1 0.01 g/hp-hr 0.009 0.0001 0.002
Copper Concentrate Shipment Vehicles -- 450 29.60 1,021 169,872 VMT 0.43 0.2117 g/mile 0.01 0.0002 0.04
Rosemont Copper ProjectEmission Inventory Information JBR ENVIRONMENTAL CONSULTANTS, INC.
November 2011Page H188
AZRP00370
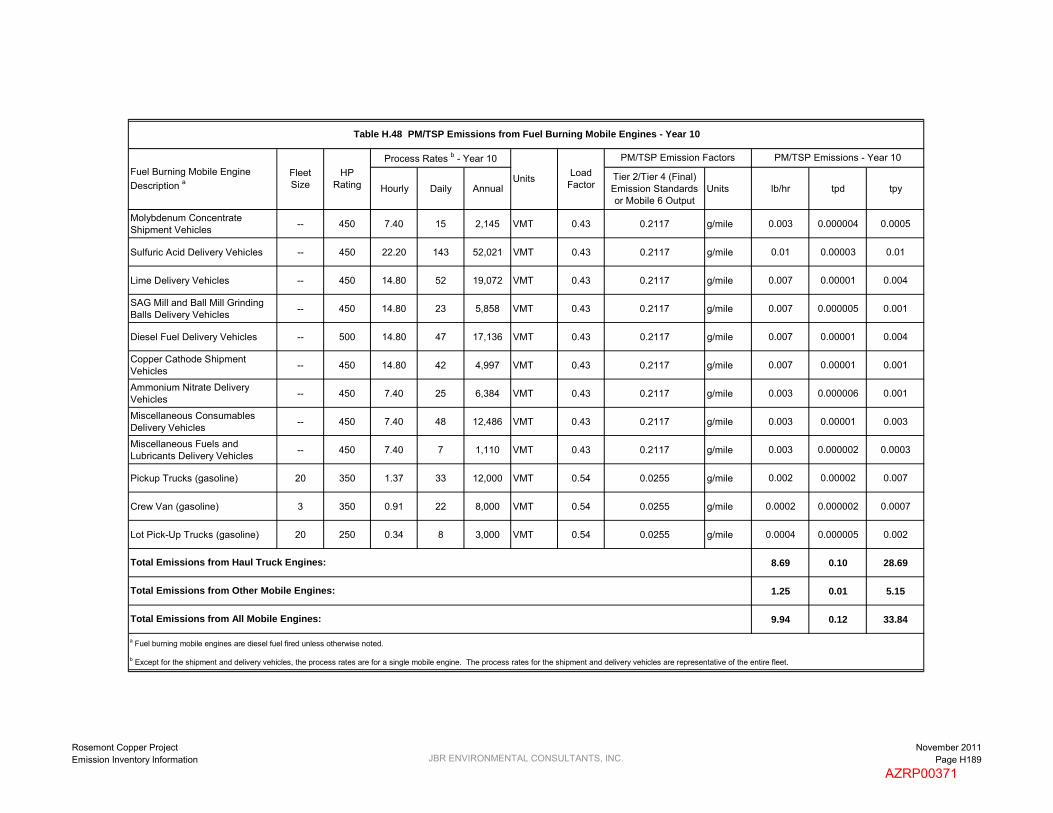
Hourly Daily AnnualTier 2/Tier 4 (Final) Emission Standards or Mobile 6 Output
Units lb/hr tpd tpy
Table H.48 PM/TSP Emissions from Fuel Burning Mobile Engines - Year 10
Fuel Burning Mobile Engine Description a
Fleet Size
HP Rating
Load Factor
PM/TSP Emission Factors PM/TSP Emissions - Year 10Process Rates b - Year 10
Units
Molybdenum Concentrate Shipment Vehicles -- 450 7.40 15 2,145 VMT 0.43 0.2117 g/mile 0.003 0.000004 0.0005
Sulfuric Acid Delivery Vehicles -- 450 22.20 143 52,021 VMT 0.43 0.2117 g/mile 0.01 0.00003 0.01
Lime Delivery Vehicles -- 450 14.80 52 19,072 VMT 0.43 0.2117 g/mile 0.007 0.00001 0.004
SAG Mill and Ball Mill Grinding Balls Delivery Vehicles -- 450 14.80 23 5,858 VMT 0.43 0.2117 g/mile 0.007 0.000005 0.001
Diesel Fuel Delivery Vehicles -- 500 14.80 47 17,136 VMT 0.43 0.2117 g/mile 0.007 0.00001 0.004
Copper Cathode Shipment Vehicles -- 450 14.80 42 4,997 VMT 0.43 0.2117 g/mile 0.007 0.00001 0.001
Ammonium Nitrate Delivery Vehicles -- 450 7.40 25 6,384 VMT 0.43 0.2117 g/mile 0.003 0.000006 0.001
Miscellaneous Consumables Delivery Vehicles -- 450 7.40 48 12,486 VMT 0.43 0.2117 g/mile 0.003 0.00001 0.003
Miscellaneous Fuels and Lubricants Delivery Vehicles -- 450 7.40 7 1,110 VMT 0.43 0.2117 g/mile 0.003 0.000002 0.0003
Pickup Trucks (gasoline) 20 350 1.37 33 12,000 VMT 0.54 0.0255 g/mile 0.002 0.00002 0.007
Crew Van (gasoline) 3 350 0.91 22 8,000 VMT 0.54 0.0255 g/mile 0.0002 0.000002 0.0007
Lot Pick-Up Trucks (gasoline) 20 250 0.34 8 3,000 VMT 0.54 0.0255 g/mile 0.0004 0.000005 0.002
8.69 0.10 28.69
1.25 0.01 5.15
9.94 0.12 33.84
a Fuel burning mobile engines are diesel fuel fired unless otherwise noted.
b Except for the shipment and delivery vehicles, the process rates are for a single mobile engine. The process rates for the shipment and delivery vehicles are representative of the entire fleet.
Total Emissions from All Mobile Engines:
Total Emissions from Haul Truck Engines:
Total Emissions from Other Mobile Engines:
Rosemont Copper ProjectEmission Inventory Information JBR ENVIRONMENTAL CONSULTANTS, INC.
November 2011Page H189
AZRP00371

Hourly Daily AnnualTier 2/Tier 4 (Final) Emission Standards or Mobile 6 Output
Units lb/hr tpd tpy
Haulage Trucks, 250 tons 31 2,650 1.00 24 6,600 hours 0.32 0.15 g/hp-hr 8.69 0.10 28.69
Crawler Dozers, D11T Class 3 850 0.46 11 4,000 hours 0.575 0.03 g/hp-hr 0.04 0.0005 0.19
Crawler Dozers, D10T Class 3 580 0.70 17 6,090 hours 0.575 0.01 g/hp-hr 0.02 0.0002 0.07
Crawler Dozer, D8T Class 1 310 0.75 18 6,570 hours 0.575 0.01 g/hp-hr 0.003 0.00004 0.01
Rubber Tired Dozers, 834H Class 3 498 0.70 17 6,175 hours 0.575 0.01 g/hp-hr 0.01 0.0002 0.06
Motor Graders, 24M Class 1 533 0.68 16 6,000 hours 0.575 0.01 g/hp-hr 0.005 0.00006 0.02
Motor Graders, 16M Class 3 297 0.46 11 4,000 hours 0.575 0.01 g/hp-hr 0.005 0.00006 0.02
Water Trucks, 30,000 gallons 4 1,348 0.45 11 3,250 hours 0.35 0.03 g/hp-hr 0.06 0.0007 0.20
Diesel Blasthole Drill, 12.25 inches 2 1,500 0.75 18 6,570 hours 0.43 0.03 g/hp-hr 0.06 0.0008 0.28
Hydraulic DML 45 Drill 1 425 0.75 18 6,570 hours 0.43 0.01 g/hp-hr 0.003 0.00004 0.01
Front End Loaders 2 2,000 0.90 22 7,884 hours 0.59 0.15 g/hp-hr 0.70 0.008 3.08
Stemming Truck 2 450 0.75 18 6,570 hours 0.43 0.01 g/hp-hr 0.006 0.00008 0.03
ANFO/Slurry Truck, 20 tons 2 450 0.75 18 6,570 hours 0.43 0.01 g/hp-hr 0.006 0.00008 0.03
Powder Truck, 2 tons 2 350 0.75 18 6,570 hours 0.43 0.01 g/hp-hr 0.005 0.00006 0.02
Front End Loaders, 8 yd3 2 262 0.75 18 6,570 hours 0.575 0.01 g/hp-hr 0.005 0.00006 0.02
Hydraulic Excavator, 385 Cat CL 2 513 0.90 22 7,884 hours 0.35 0.01 g/hp-hr 0.007 0.00009 0.03
Backhoe/Loader, 2 yd3 1 124 0.75 18 6,570 hours 0.35 0.01 g/hp-hr 0.0007 0.000009 0.003
PM10 Emissions - Year 10Fuel Burning Mobile Engine Description a
Fleet Size
HP Rating
Process Rates b - Year 10
Units
Table H.49 PM10 Emissions from Fuel Burning Mobile Engines - Year 10
Load Factor
PM10 Emission Factor
Rosemont Copper ProjectEmission Inventory Information JBR ENVIRONMENTAL CONSULTANTS, INC.
November 2011Page H190
AZRP00372

Hourly Daily AnnualTier 2/Tier 4 (Final) Emission Standards or Mobile 6 Output
Units lb/hr tpd tpy
PM10 Emissions - Year 10Fuel Burning Mobile Engine Description a
Fleet Size
HP Rating
Process Rates b - Year 10
Units
Table H.49 PM10 Emissions from Fuel Burning Mobile Engines - Year 10
Load Factor
PM10 Emission Factor
All-Terrain Crane, 75 tons 1 230 0.75 18 6,570 hours 0.43 0.01 g/hp-hr 0.002 0.00002 0.007
Transporter with Tractor, 200 tons 1 1,350 0.75 18 6,570 hours 0.59 0.03 g/hp-hr 0.04 0.0005 0.17
Fuel/Lube Trucks, 6,000 gallons 2 703 0.75 18 6,570 hours 0.35 0.01 g/hp-hr 0.008 0.0001 0.04
Mechanic Field Service Trucks 5 370 1.71 41 15,000 VMT 0.43 0.2117 g/mile 0.004 0.00005 0.02
Tire Handler 1 90 0.11 3 1,000 VMT 0.43 0.2117 g/mile 0.00005 0.0000006 0.0002
Shop Forklift, 12,000 lbs 1 90 0.75 18 6,570 hours 0.59 0.01 g/hp-hr 0.0009 0.00001 0.004
Integrated Tool Carrier, 140 hp 1 138 0.75 18 6,570 hours 0.59 0.01 g/hp-hr 0.001 0.00002 0.006
Light Plant, 6 kW 15 35 0.40 10 3,504 hours 0.43 0.02 g/hp-hr 0.004 0.00005 0.02
Primary Crushing Mobile Crane - 400 tons 1 320 0.75 18 6,570 hours 0.43 0.01 g/hp-hr 0.002 0.00003 0.01
Copper Concentrate Area Front End Loader - Cat 930 1 160 0.75 18 6,570 hours 0.59 0.01 g/hp-hr 0.002 0.00002 0.007
Molybdenum Packaging Forklift, 7,000 lbs 1 93 0.75 18 6,570 hours 0.59 0.01 g/hp-hr 0.0009 0.00001 0.004
Copper Cathode Forklift 1 92.5 0.75 18 6,570 hours 0.59 0.01 g/hp-hr 0.0009 0.00001 0.004
Boom Trucks 10 tons, 45 foot boom 1 200 0.75 18 6,570 hours 0.21 0.01 g/hp-hr 0.0007 0.000008 0.003
Boom Trucks 15 tons, 60 foot boom 1 210 0.75 18 6,570 hours 0.21 0.01 g/hp-hr 0.0007 0.000009 0.003
Front End Loader, 6 yd3 1 349 0.75 18 6,570 hours 0.35 0.01 g/hp-hr 0.002 0.00002 0.009
Front End Loader, 5 yd3 1 149 0.75 18 6,570 hours 0.25 0.01 g/hp-hr 0.0006 0.000007 0.003
Bob Cats, 2,400 lbs 2 82 0.75 18 6,570 hours 0.59 0.01 g/hp-hr 0.002 0.00002 0.007
Rosemont Copper ProjectEmission Inventory Information JBR ENVIRONMENTAL CONSULTANTS, INC.
November 2011Page H191
AZRP00373

Hourly Daily AnnualTier 2/Tier 4 (Final) Emission Standards or Mobile 6 Output
Units lb/hr tpd tpy
PM10 Emissions - Year 10Fuel Burning Mobile Engine Description a
Fleet Size
HP Rating
Process Rates b - Year 10
Units
Table H.49 PM10 Emissions from Fuel Burning Mobile Engines - Year 10
Load Factor
PM10 Emission Factor
Fork Lift, 2,000 lbs 1 50 0.75 18 6,570 hours 0.59 0.02 g/hp-hr 0.001 0.00001 0.004
Fork Lift, 5,000 lbs 1 63 0.75 18 6,570 hours 0.59 0.02 g/hp-hr 0.001 0.00001 0.005
Fork Lift, 3,000 lbs 2 50 0.75 18 6,570 hours 0.59 0.02 g/hp-hr 0.002 0.00002 0.009
Flat Bed Trucks, 10 tons 2 350 0.75 18 6,570 hours 0.43 0.01 g/hp-hr 0.005 0.00006 0.02
Dump Truck, 10 tons 1 250 0.34 8 3,000 VMT 0.43 0.2117 g/mile 0.0002 0.000002 0.0007
Mobile Hydraulic Crane, 60 tons 1 267 0.75 18 6,570 hours 0.43 0.01 g/hp-hr 0.002 0.00002 0.008
Truck Shop Bridge Crane, 60 tons 1 75 0.75 18 6,570 hours 0.43 0.01 g/hp-hr 0.0005 0.000006 0.002
Truck Shop Bridge Crane, 25 tons 1 24.1 0.75 18 6,570 hours 0.43 0.30 g/hp-hr 0.005 0.00006 0.02
CS683 Soil Compactor / Roller 2 173 0.75 18 6,570 hours 0.40 0.01 g/hp-hr 0.002 0.00003 0.01
246C Skid Steer Loader 2 73 0.75 18 6,570 hours 0.30 0.02 g/hp-hr 0.001 0.00002 0.006
RH200/340 O & K Shovel / Hitachi EX5500 1 2,520 0.75 18 6,570 hours 0.59 0.03 g/hp-hr 0.07 0.0009 0.32
Off-Road Tire Handling Truck 1 450 0.86 21 7,500 VMT 0.43 0.2117 g/mile 0.0004 0.000005 0.002
Contractor Haul Trucks, 25 tons 2 511 2.74 66 24,000 VMT 0.43 0.2117 g/mile 0.003 0.00003 0.01
Motivator for Mine Shovels 1 3,308 0.91 22 8,000 hours 0.43 0.02 g/hp-hr 0.06 0.0007 0.25
Storm Water Pond Pump 1 200 1.00 24 500 hours 1 0.01 g/hp-hr 0.004 0.00005 0.001
Mine Pit Dewatering Pump 4 100 1.00 24 500 hours 1 0.01 g/hp-hr 0.009 0.0001 0.002
Copper Concentrate Shipment Vehicles -- 450 29.60 1,021 169,872 VMT 0.43 0.2117 g/mile 0.01 0.0002 0.04
Rosemont Copper ProjectEmission Inventory Information JBR ENVIRONMENTAL CONSULTANTS, INC.
November 2011Page H192
AZRP00374
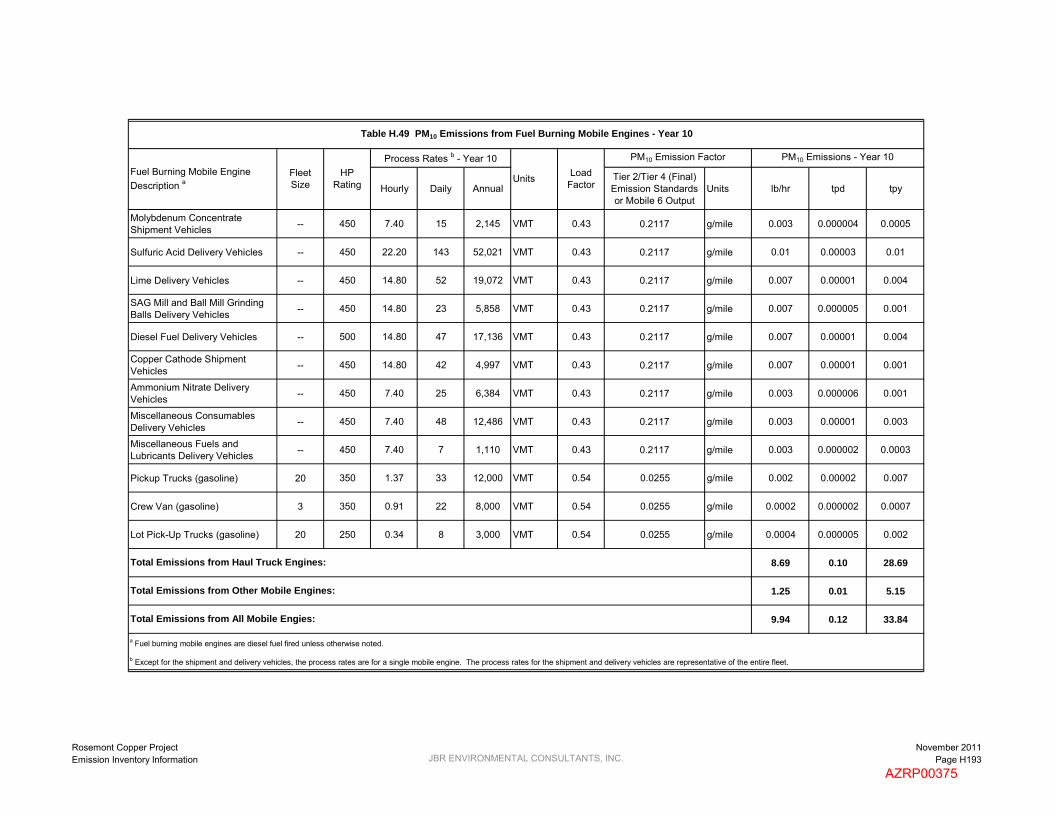
Hourly Daily AnnualTier 2/Tier 4 (Final) Emission Standards or Mobile 6 Output
Units lb/hr tpd tpy
PM10 Emissions - Year 10Fuel Burning Mobile Engine Description a
Fleet Size
HP Rating
Process Rates b - Year 10
Units
Table H.49 PM10 Emissions from Fuel Burning Mobile Engines - Year 10
Load Factor
PM10 Emission Factor
Molybdenum Concentrate Shipment Vehicles -- 450 7.40 15 2,145 VMT 0.43 0.2117 g/mile 0.003 0.000004 0.0005
Sulfuric Acid Delivery Vehicles -- 450 22.20 143 52,021 VMT 0.43 0.2117 g/mile 0.01 0.00003 0.01
Lime Delivery Vehicles -- 450 14.80 52 19,072 VMT 0.43 0.2117 g/mile 0.007 0.00001 0.004
SAG Mill and Ball Mill Grinding Balls Delivery Vehicles -- 450 14.80 23 5,858 VMT 0.43 0.2117 g/mile 0.007 0.000005 0.001
Diesel Fuel Delivery Vehicles -- 500 14.80 47 17,136 VMT 0.43 0.2117 g/mile 0.007 0.00001 0.004
Copper Cathode Shipment Vehicles -- 450 14.80 42 4,997 VMT 0.43 0.2117 g/mile 0.007 0.00001 0.001
Ammonium Nitrate Delivery Vehicles -- 450 7.40 25 6,384 VMT 0.43 0.2117 g/mile 0.003 0.000006 0.001
Miscellaneous Consumables Delivery Vehicles -- 450 7.40 48 12,486 VMT 0.43 0.2117 g/mile 0.003 0.00001 0.003
Miscellaneous Fuels and Lubricants Delivery Vehicles -- 450 7.40 7 1,110 VMT 0.43 0.2117 g/mile 0.003 0.000002 0.0003
Pickup Trucks (gasoline) 20 350 1.37 33 12,000 VMT 0.54 0.0255 g/mile 0.002 0.00002 0.007
Crew Van (gasoline) 3 350 0.91 22 8,000 VMT 0.54 0.0255 g/mile 0.0002 0.000002 0.0007
Lot Pick-Up Trucks (gasoline) 20 250 0.34 8 3,000 VMT 0.54 0.0255 g/mile 0.0004 0.000005 0.002
8.69 0.10 28.69
1.25 0.01 5.15
9.94 0.12 33.84
a Fuel burning mobile engines are diesel fuel fired unless otherwise noted.
b Except for the shipment and delivery vehicles, the process rates are for a single mobile engine. The process rates for the shipment and delivery vehicles are representative of the entire fleet.
Total Emissions from Haul Truck Engines:
Total Emissions from Other Mobile Engines:
Total Emissions from All Mobile Engies:
Rosemont Copper ProjectEmission Inventory Information JBR ENVIRONMENTAL CONSULTANTS, INC.
November 2011Page H193
AZRP00375

Hourly Daily AnnualTier 2/Tier 4 (Final) Emission Standards or Mobile 6 Output
Units lb/hr tpd tpy
Haulage Trucks, 250 tons 31 2,650 1.00 24 6,600 hours 0.32 0.15 g/hp-hr 8.69 0.10 28.69
Crawler Dozers, D11T Class 3 850 0.46 11 4,000 hours 0.575 0.03 g/hp-hr 0.04 0.0005 0.19
Crawler Dozers, D10T Class 3 580 0.70 17 6,090 hours 0.575 0.01 g/hp-hr 0.02 0.0002 0.07
Crawler Dozer, D8T Class 1 310 0.75 18 6,570 hours 0.575 0.01 g/hp-hr 0.003 0.00004 0.01
Rubber Tired Dozers, 834H Class 3 498 0.70 17 6,175 hours 0.575 0.01 g/hp-hr 0.01 0.0002 0.06
Motor Graders, 24M Class 1 533 0.68 16 6,000 hours 0.575 0.01 g/hp-hr 0.005 0.00006 0.02
Motor Graders, 16M Class 3 297 0.46 11 4,000 hours 0.575 0.01 g/hp-hr 0.005 0.00006 0.02
Water Trucks, 30,000 gallons 4 1,348 0.45 11 3,250 hours 0.35 0.03 g/hp-hr 0.06 0.0007 0.20
Diesel Blasthole Drill, 12.25 inches 2 1,500 0.75 18 6,570 hours 0.43 0.03 g/hp-hr 0.06 0.0008 0.28
Hydraulic DML 45 Drill 1 425 0.75 18 6,570 hours 0.43 0.01 g/hp-hr 0.003 0.00004 0.01
Front End Loaders 2 2,000 0.90 22 7,884 hours 0.59 0.15 g/hp-hr 0.70 0.008 3.08
Stemming Truck 2 450 0.75 18 6,570 hours 0.43 0.01 g/hp-hr 0.006 0.00008 0.03
ANFO/Slurry Truck, 20 tons 2 450 0.75 18 6,570 hours 0.43 0.01 g/hp-hr 0.006 0.00008 0.03
Powder Truck, 2 tons 2 350 0.75 18 6,570 hours 0.43 0.01 g/hp-hr 0.005 0.00006 0.02
Front End Loaders, 8 yd3 2 262 0.75 18 6,570 hours 0.575 0.01 g/hp-hr 0.005 0.00006 0.02
Hydraulic Excavator, 385 Cat CL 2 513 0.90 22 7,884 hours 0.35 0.01 g/hp-hr 0.007 0.00009 0.03
Backhoe/Loader, 2 yd3 1 124 0.75 18 6,570 hours 0.35 0.01 g/hp-hr 0.0007 0.000009 0.003
Table H.50 PM2.5 Emissions from Fuel Burning Mobile Engines - Year 10
Fuel Burning Mobile Engine Description a
Fleet Size
HP Rating
Load Factor
PM2.5 Emission Factor PM2.5 Emissions - Year 10Process Rates b - Year 10
Units
Rosemont Copper ProjectEmission Inventory Information JBR ENVIRONMENTAL CONSULTANTS, INC.
November 2011Page H194
AZRP00376

Hourly Daily AnnualTier 2/Tier 4 (Final) Emission Standards or Mobile 6 Output
Units lb/hr tpd tpy
Table H.50 PM2.5 Emissions from Fuel Burning Mobile Engines - Year 10
Fuel Burning Mobile Engine Description a
Fleet Size
HP Rating
Load Factor
PM2.5 Emission Factor PM2.5 Emissions - Year 10Process Rates b - Year 10
Units
All-Terrain Crane, 75 tons 1 230 0.75 18 6,570 hours 0.43 0.01 g/hp-hr 0.002 0.00002 0.007
Transporter with Tractor, 200 tons 1 1,350 0.75 18 6,570 hours 0.59 0.03 g/hp-hr 0.04 0.0005 0.17
Fuel/Lube Trucks, 6,000 gallons 2 703 0.75 18 6,570 hours 0.35 0.01 g/hp-hr 0.008 0.0001 0.04
Mechanic Field Service Trucks 5 370 1.71 41 15,000 VMT 0.43 0.2117 g/mile 0.004 0.00005 0.02
Tire Handler 1 90 0.11 3 1,000 VMT 0.43 0.2117 g/mile 0.00005 0.0000006 0.0002
Shop Forklift, 12,000 lbs 1 90 0.75 18 6,570 hours 0.59 0.01 g/hp-hr 0.0009 0.00001 0.004
Integrated Tool Carrier, 140 hp 1 138 0.75 18 6,570 hours 0.59 0.01 g/hp-hr 0.001 0.00002 0.006
Light Plant, 6 kW 15 35 0.40 10 3,504 hours 0.43 0.02 g/hp-hr 0.004 0.00005 0.02
Primary Crushing Mobile Crane - 400 tons 1 320 0.75 18 6,570 hours 0.43 0.01 g/hp-hr 0.002 0.00003 0.01
Copper Concentrate Area Front End Loader - Cat 930 1 160 0.75 18 6,570 hours 0.59 0.01 g/hp-hr 0.002 0.00002 0.007
Molybdenum Packaging Forklift, 7,000 lbs 1 93 0.75 18 6,570 hours 0.59 0.01 g/hp-hr 0.0009 0.00001 0.004
Copper Cathode Forklift 1 93 0.75 18 6,570 hours 0.59 0.01 g/hp-hr 0.0009 0.00001 0.004
Boom Trucks 10 tons, 45 foot boom 1 200 0.75 18 6,570 hours 0.21 0.01 g/hp-hr 0.0007 0.000008 0.003
Boom Trucks 15 tons, 60 foot boom 1 210 0.75 18 6,570 hours 0.21 0.01 g/hp-hr 0.0007 0.000009 0.003
Front End Loader, 6 yd3 1 349 0.75 18 6,570 hours 0.35 0.01 g/hp-hr 0.002 0.00002 0.009
Front End Loader, 5 yd3 1 149 0.75 18 6,570 hours 0.25 0.01 g/hp-hr 0.0006 0.000007 0.003
Bob Cats, 2,400 lbs 2 82 0.75 18 6,570 hours 0.59 0.01 g/hp-hr 0.002 0.00002 0.007
Rosemont Copper ProjectEmission Inventory Information JBR ENVIRONMENTAL CONSULTANTS, INC.
November 2011Page H195
AZRP00377

Hourly Daily AnnualTier 2/Tier 4 (Final) Emission Standards or Mobile 6 Output
Units lb/hr tpd tpy
Table H.50 PM2.5 Emissions from Fuel Burning Mobile Engines - Year 10
Fuel Burning Mobile Engine Description a
Fleet Size
HP Rating
Load Factor
PM2.5 Emission Factor PM2.5 Emissions - Year 10Process Rates b - Year 10
Units
Fork Lift, 2,000 lbs 1 50 0.75 18 6,570 hours 0.59 0.02 g/hp-hr 0.001 0.00001 0.004
Fork Lift, 5,000 lbs 1 63 0.75 18 6,570 hours 0.59 0.02 g/hp-hr 0.001 0.00001 0.005
Fork Lift, 3,000 lbs 2 50 0.75 18 6,570 hours 0.59 0.02 g/hp-hr 0.002 0.00002 0.009
Flat Bed Trucks, 10 tons 2 350 0.75 18 6,570 hours 0.43 0.01 g/hp-hr 0.005 0.00006 0.02
Dump Truck, 10 tons 1 250 0.34 8 3,000 VMT 0.43 0.2117 g/mile 0.0002 0.000002 0.0007
Mobile Hydraulic Crane, 60 tons 1 267 0.75 18 6,570 hours 0.43 0.01 g/hp-hr 0.002 0.00002 0.008
Truck Shop Bridge Crane, 60 tons 1 75 0.75 18 6,570 hours 0.43 0.01 g/hp-hr 0.0005 0.000006 0.002
Truck Shop Bridge Crane, 25 tons 1 24 0.75 18 6,570 hours 0.43 0.30 g/hp-hr 0.005 0.00006 0.02
CS683 Soil Compactor / Roller 2 173 0.75 18 6,570 hours 0.4 0.01 g/hp-hr 0.002 0.00003 0.01
246C Skid Steer Loader 2 73 0.75 18 6,570 hours 0.3 0.02 g/hp-hr 0.001 0.00002 0.006
RH200/340 O & K Shovel / Hitachi EX5500 1 2,520 0.75 18 6,570 hours 0.59 0.03 g/hp-hr 0.07 0.0009 0.32
Off-Road Tire Handling Truck 1 450 0.86 21 7,500 VMT 0.43 0.2117 g/mile 0.0004 0.000005 0.002
Contractor Haul Trucks, 25 tons 2 511 2.74 66 24,000 VMT 0.43 0.2117 g/mile 0.003 0.00003 0.01
Motivator for Mine Shovels 1 3,308 0.91 22 8,000 hours 0.43 0.02 g/hp-hr 0.06 0.0007 0.25
Storm Water Pond Pump 1 200 1.00 24 500 hours 1 0.01 g/hp-hr 0.004 0.00005 0.001
Mine Pit Dewatering Pump 4 100 1.00 24 500 hours 1 0.01 g/hp-hr 0.009 0.0001 0.002
Copper Concentrate Shipment Vehicles -- 450 29.60 1,021 169,872 VMT 0.43 0.2117 g/mile 0.01 0.0002 0.04
Rosemont Copper ProjectEmission Inventory Information JBR ENVIRONMENTAL CONSULTANTS, INC.
November 2011Page H196
AZRP00378

Hourly Daily AnnualTier 2/Tier 4 (Final) Emission Standards or Mobile 6 Output
Units lb/hr tpd tpy
Table H.50 PM2.5 Emissions from Fuel Burning Mobile Engines - Year 10
Fuel Burning Mobile Engine Description a
Fleet Size
HP Rating
Load Factor
PM2.5 Emission Factor PM2.5 Emissions - Year 10Process Rates b - Year 10
Units
Molybdenum Concentrate Shipment Vehicles -- 450 7.40 15 2,145 VMT 0.43 0.2117 g/mile 0.003 0.000004 0.0005
Sulfuric Acid Delivery Vehicles -- 450 22.20 143 52,021 VMT 0.43 0.2117 g/mile 0.01 0.00003 0.01
Lime Delivery Vehicles -- 450 14.80 52 19,072 VMT 0.43 0.2117 g/mile 0.007 0.00001 0.004
SAG Mill and Ball Mill Grinding Balls Delivery Vehicles -- 450 14.80 23 5,858 VMT 0.43 0.2117 g/mile 0.007 0.000005 0.001
Diesel Fuel Delivery Vehicles -- 500 14.80 47 17,136 VMT 0.43 0.2117 g/mile 0.007 0.00001 0.004
Copper Cathode Shipment Vehicles -- 450 14.80 42 4,997 VMT 0.43 0.2117 g/mile 0.007 0.00001 0.001
Ammonium Nitrate Delivery Vehicles -- 450 7.40 25 6,384 VMT 0.43 0.2117 g/mile 0.003 0.000006 0.001
Miscellaneous Consumables Delivery Vehicles -- 450 7.40 48 12,486 VMT 0.43 0.2117 g/mile 0.003 0.00001 0.003
Miscellaneous Fuels and Lubricants Delivery Vehicles -- 450 7.40 7 1,110 VMT 0.43 0.2117 g/mile 0.003 0.000002 0.0003
Pickup Trucks (gasoline) 20 350 1.37 33 12,000 VMT 0.54 0.0255 g/mile 0.002 0.00002 0.007
Crew Van (gasoline) 3 350 0.91 22 8,000 VMT 0.54 0.0255 g/mile 0.0002 0.000002 0.0007
Lot Pick-Up Trucks (gasoline) 20 250 0.34 8 3,000 VMT 0.54 0.0255 g/mile 0.0004 0.000005 0.002
8.69 0.10 28.69
1.25 0.01 5.15
9.94 0.12 33.84
a Fuel burning mobile engines are diesel fuel fired unless otherwise noted.
b Except for the shipment and delivery vehicles, the process rates are for a single mobile engine. The process rates for the shipment and delivery vehicles are representative of the entire fleet.
Total Emissions from All Mobile Engines:
Total Emissions from Haul Truck Engines:
Total Emissions from Other Mobile Engines:
Rosemont Copper ProjectEmission Inventory Information JBR ENVIRONMENTAL CONSULTANTS, INC.
November 2011Page H197
AZRP00379
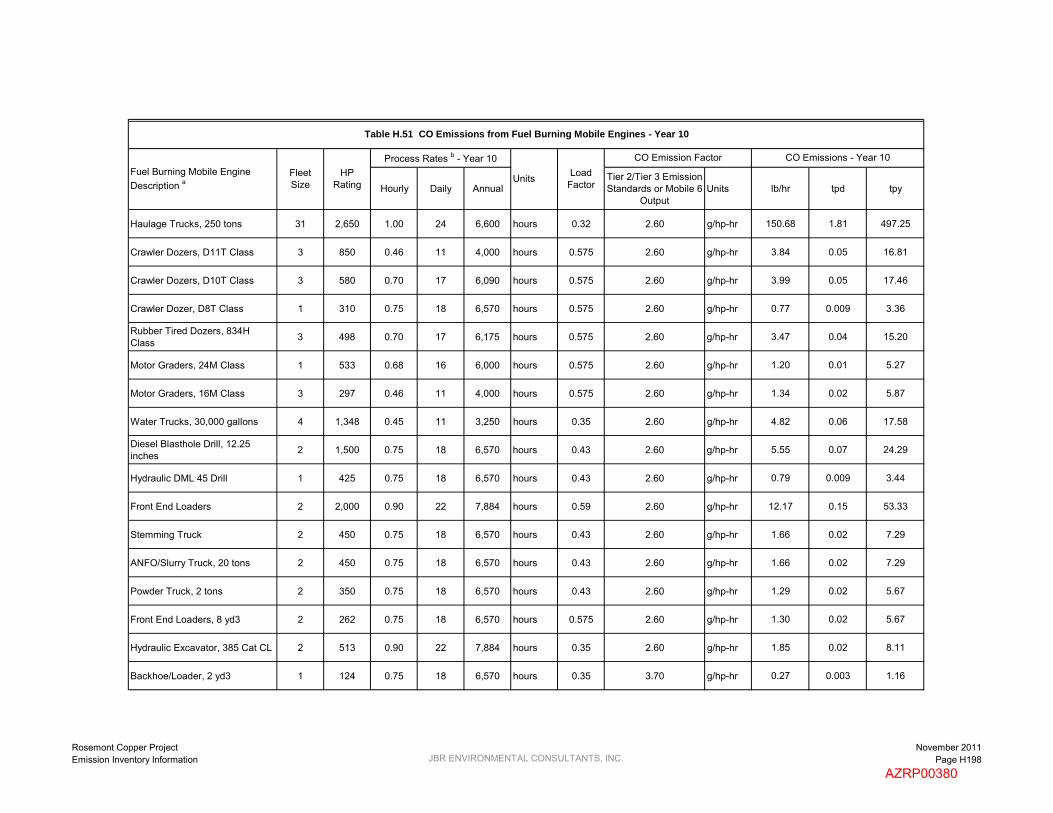
Hourly Daily AnnualTier 2/Tier 3 Emission Standards or Mobile 6
OutputUnits lb/hr tpd tpy
Haulage Trucks, 250 tons 31 2,650 1.00 24 6,600 hours 0.32 2.60 g/hp-hr 150.68 1.81 497.25
Crawler Dozers, D11T Class 3 850 0.46 11 4,000 hours 0.575 2.60 g/hp-hr 3.84 0.05 16.81
Crawler Dozers, D10T Class 3 580 0.70 17 6,090 hours 0.575 2.60 g/hp-hr 3.99 0.05 17.46
Crawler Dozer, D8T Class 1 310 0.75 18 6,570 hours 0.575 2.60 g/hp-hr 0.77 0.009 3.36
Rubber Tired Dozers, 834H Class 3 498 0.70 17 6,175 hours 0.575 2.60 g/hp-hr 3.47 0.04 15.20
Motor Graders, 24M Class 1 533 0.68 16 6,000 hours 0.575 2.60 g/hp-hr 1.20 0.01 5.27
Motor Graders, 16M Class 3 297 0.46 11 4,000 hours 0.575 2.60 g/hp-hr 1.34 0.02 5.87
Water Trucks, 30,000 gallons 4 1,348 0.45 11 3,250 hours 0.35 2.60 g/hp-hr 4.82 0.06 17.58
Diesel Blasthole Drill, 12.25 inches 2 1,500 0.75 18 6,570 hours 0.43 2.60 g/hp-hr 5.55 0.07 24.29
Hydraulic DML 45 Drill 1 425 0.75 18 6,570 hours 0.43 2.60 g/hp-hr 0.79 0.009 3.44
Front End Loaders 2 2,000 0.90 22 7,884 hours 0.59 2.60 g/hp-hr 12.17 0.15 53.33
Stemming Truck 2 450 0.75 18 6,570 hours 0.43 2.60 g/hp-hr 1.66 0.02 7.29
ANFO/Slurry Truck, 20 tons 2 450 0.75 18 6,570 hours 0.43 2.60 g/hp-hr 1.66 0.02 7.29
Powder Truck, 2 tons 2 350 0.75 18 6,570 hours 0.43 2.60 g/hp-hr 1.29 0.02 5.67
Front End Loaders, 8 yd3 2 262 0.75 18 6,570 hours 0.575 2.60 g/hp-hr 1.30 0.02 5.67
Hydraulic Excavator, 385 Cat CL 2 513 0.90 22 7,884 hours 0.35 2.60 g/hp-hr 1.85 0.02 8.11
Backhoe/Loader, 2 yd3 1 124 0.75 18 6,570 hours 0.35 3.70 g/hp-hr 0.27 0.003 1.16
Table H.51 CO Emissions from Fuel Burning Mobile Engines - Year 10
Fuel Burning Mobile Engine Description a
Fleet Size
HP Rating
Load Factor
CO Emission Factor CO Emissions - Year 10Process Rates b - Year 10
Units
Rosemont Copper ProjectEmission Inventory Information JBR ENVIRONMENTAL CONSULTANTS, INC.
November 2011Page H198
AZRP00380

Hourly Daily AnnualTier 2/Tier 3 Emission Standards or Mobile 6
OutputUnits lb/hr tpd tpy
Table H.51 CO Emissions from Fuel Burning Mobile Engines - Year 10
Fuel Burning Mobile Engine Description a
Fleet Size
HP Rating
Load Factor
CO Emission Factor CO Emissions - Year 10Process Rates b - Year 10
Units
All-Terrain Crane, 75 tons 1 230 0.75 18 6,570 hours 0.43 2.60 g/hp-hr 0.43 0.005 1.86
Transporter with Tractor, 200 tons 1 1,350 0.75 18 6,570 hours 0.59 2.60 g/hp-hr 3.42 0.04 15.00
Fuel/Lube Trucks, 6,000 gallons 2 703 0.75 18 6,570 hours 0.35 2.60 g/hp-hr 2.12 0.03 9.27
Mechanic Field Service Trucks 5 370 1.71 41 15,000 VMT 0.43 1.870 g/mile 0.04 0.0004 0.15
Tire Handler 1 90 0.11 3 1,000 VMT 0.43 1.870 g/mile 0.0005 0.000006 0.002
Shop Forklift, 12,000 lbs 1 90 0.75 18 6,570 hours 0.59 3.70 g/hp-hr 0.32 0.004 1.42
Integrated Tool Carrier, 140 hp 1 138 0.75 18 6,570 hours 0.59 3.70 g/hp-hr 0.50 0.006 2.18
Light Plant, 6 kW 15 35 0.40 10 3,504 hours 0.43 4.10 g/hp-hr 0.82 0.01 3.58
Primary Crushing Mobile Crane - 400 tons 1 320 0.75 18 6,570 hours 0.43 2.60 g/hp-hr 0.59 0.007 2.59
Copper Concentrate Area Front End Loader - Cat 930 1 160 0.75 18 6,570 hours 0.59 3.70 g/hp-hr 0.58 0.007 2.53
Molybdenum Packaging Forklift, 7,000 lbs 1 93 0.75 18 6,570 hours 0.59 3.70 g/hp-hr 0.33 0.004 1.46
Copper Cathode Forklift 1 93 0.75 18 6,570 hours 0.59 3.70 g/hp-hr 0.33 0.004 1.46
Boom Trucks 10 tons, 45 foot boom 1 200 0.75 18 6,570 hours 0.21 2.60 g/hp-hr 0.18 0.002 0.79
Boom Trucks 15 tons, 60 foot boom 1 210 0.75 18 6,570 hours 0.21 2.60 g/hp-hr 0.19 0.002 0.83
Front End Loader, 6 yd3 1 349 0.75 18 6,570 hours 0.35 2.60 g/hp-hr 0.53 0.006 2.30
Front End Loader, 5 yd3 1 149 0.75 18 6,570 hours 0.25 3.70 g/hp-hr 0.23 0.003 1.00
Bob Cats, 2,400 lbs 2 82 0.75 18 6,570 hours 0.59 3.70 g/hp-hr 0.59 0.007 2.59
Rosemont Copper ProjectEmission Inventory Information JBR ENVIRONMENTAL CONSULTANTS, INC.
November 2011Page H199
AZRP00381

Hourly Daily AnnualTier 2/Tier 3 Emission Standards or Mobile 6
OutputUnits lb/hr tpd tpy
Table H.51 CO Emissions from Fuel Burning Mobile Engines - Year 10
Fuel Burning Mobile Engine Description a
Fleet Size
HP Rating
Load Factor
CO Emission Factor CO Emissions - Year 10Process Rates b - Year 10
Units
Fork Lift, 2,000 lbs 1 50 0.75 18 6,570 hours 0.59 3.70 g/hp-hr 0.18 0.002 0.79
Fork Lift, 5,000 lbs 1 63 0.75 18 6,570 hours 0.59 3.70 g/hp-hr 0.23 0.003 1.00
Fork Lift, 3,000 lbs 2 50 0.75 18 6,570 hours 0.59 3.70 g/hp-hr 0.36 0.004 1.58
Flat Bed Trucks, 10 tons 2 350 0.75 18 6,570 hours 0.43 2.60 g/hp-hr 1.29 0.02 5.67
Dump Truck, 10 tons 1 250 0.34 8 3,000 VMT 0.43 1.870 g/mile 0.001 0.00002 0.006
Mobile Hydraulic Crane, 60 tons 1 267 0.75 18 6,570 hours 0.43 2.60 g/hp-hr 0.49 0.006 2.16
Truck Shop Bridge Crane, 60 tons 1 75 0.75 18 6,570 hours 0.43 3.70 g/hp-hr 0.20 0.002 0.86
Truck Shop Bridge Crane, 25 tons 1 24 0.75 18 6,570 hours 0.43 4.90 g/hp-hr 0.08 0.001 0.37
CS683 Soil Compactor / Roller 2 173 0.75 18 6,570 hours 0.4 3.70 g/hp-hr 0.85 0.01 3.71
246C Skid Steer Loader 2 73 0.75 18 6,570 hours 0.3 3.70 g/hp-hr 0.27 0.003 1.17
RH200/340 O & K Shovel / Hitachi EX5500 1 2,520 0.75 18 6,570 hours 0.59 2.60 g/hp-hr 6.39 0.08 28.00
Off-Road Tire Handling Truck 1 450 0.86 21 7,500 VMT 0.43 1.870 g/mile 0.004 0.00004 0.02
Contractor Haul Trucks, 25 tons 2 511 2.74 66 24,000 VMT 0.43 1.870 g/mile 0.02 0.0003 0.10
Motivator for Mine Shovels 1 3,308 0.91 22 8,000 hours 0.43 2.60 g/hp-hr 7.45 0.09 32.61
Storm Water Pond Pump 1 200 1.00 24 500 hours 1 2.60 g/hp-hr 1.15 0.01 0.29
Mine Pit Dewatering Pump 4 100 1.00 24 500 hours 1 3.70 g/hp-hr 3.26 0.04 0.82
Copper Concentrate Shipment Vehicles -- 450 29.60 1,021 169,872 VMT 0.43 1.870 g/mile 0.12 0.002 0.35
Rosemont Copper ProjectEmission Inventory Information JBR ENVIRONMENTAL CONSULTANTS, INC.
November 2011Page H200
AZRP00382
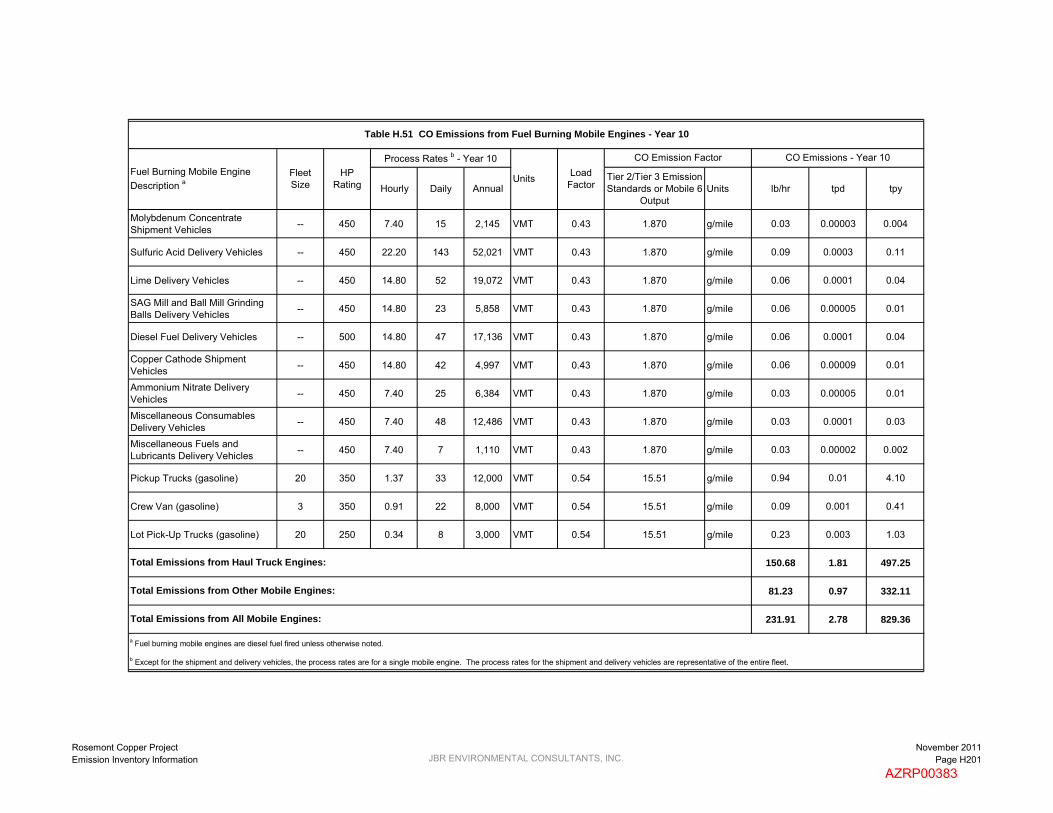
Hourly Daily AnnualTier 2/Tier 3 Emission Standards or Mobile 6
OutputUnits lb/hr tpd tpy
Table H.51 CO Emissions from Fuel Burning Mobile Engines - Year 10
Fuel Burning Mobile Engine Description a
Fleet Size
HP Rating
Load Factor
CO Emission Factor CO Emissions - Year 10Process Rates b - Year 10
Units
Molybdenum Concentrate Shipment Vehicles -- 450 7.40 15 2,145 VMT 0.43 1.870 g/mile 0.03 0.00003 0.004
Sulfuric Acid Delivery Vehicles -- 450 22.20 143 52,021 VMT 0.43 1.870 g/mile 0.09 0.0003 0.11
Lime Delivery Vehicles -- 450 14.80 52 19,072 VMT 0.43 1.870 g/mile 0.06 0.0001 0.04
SAG Mill and Ball Mill Grinding Balls Delivery Vehicles -- 450 14.80 23 5,858 VMT 0.43 1.870 g/mile 0.06 0.00005 0.01
Diesel Fuel Delivery Vehicles -- 500 14.80 47 17,136 VMT 0.43 1.870 g/mile 0.06 0.0001 0.04
Copper Cathode Shipment Vehicles -- 450 14.80 42 4,997 VMT 0.43 1.870 g/mile 0.06 0.00009 0.01
Ammonium Nitrate Delivery Vehicles -- 450 7.40 25 6,384 VMT 0.43 1.870 g/mile 0.03 0.00005 0.01
Miscellaneous Consumables Delivery Vehicles -- 450 7.40 48 12,486 VMT 0.43 1.870 g/mile 0.03 0.0001 0.03
Miscellaneous Fuels and Lubricants Delivery Vehicles -- 450 7.40 7 1,110 VMT 0.43 1.870 g/mile 0.03 0.00002 0.002
Pickup Trucks (gasoline) 20 350 1.37 33 12,000 VMT 0.54 15.51 g/mile 0.94 0.01 4.10
Crew Van (gasoline) 3 350 0.91 22 8,000 VMT 0.54 15.51 g/mile 0.09 0.001 0.41
Lot Pick-Up Trucks (gasoline) 20 250 0.34 8 3,000 VMT 0.54 15.51 g/mile 0.23 0.003 1.03
150.68 1.81 497.25
81.23 0.97 332.11
231.91 2.78 829.36
a Fuel burning mobile engines are diesel fuel fired unless otherwise noted.
b Except for the shipment and delivery vehicles, the process rates are for a single mobile engine. The process rates for the shipment and delivery vehicles are representative of the entire fleet.
Total Emissions from All Mobile Engines:
Total Emissions from Haul Truck Engines:
Total Emissions from Other Mobile Engines:
Rosemont Copper ProjectEmission Inventory Information JBR ENVIRONMENTAL CONSULTANTS, INC.
November 2011Page H201
AZRP00383
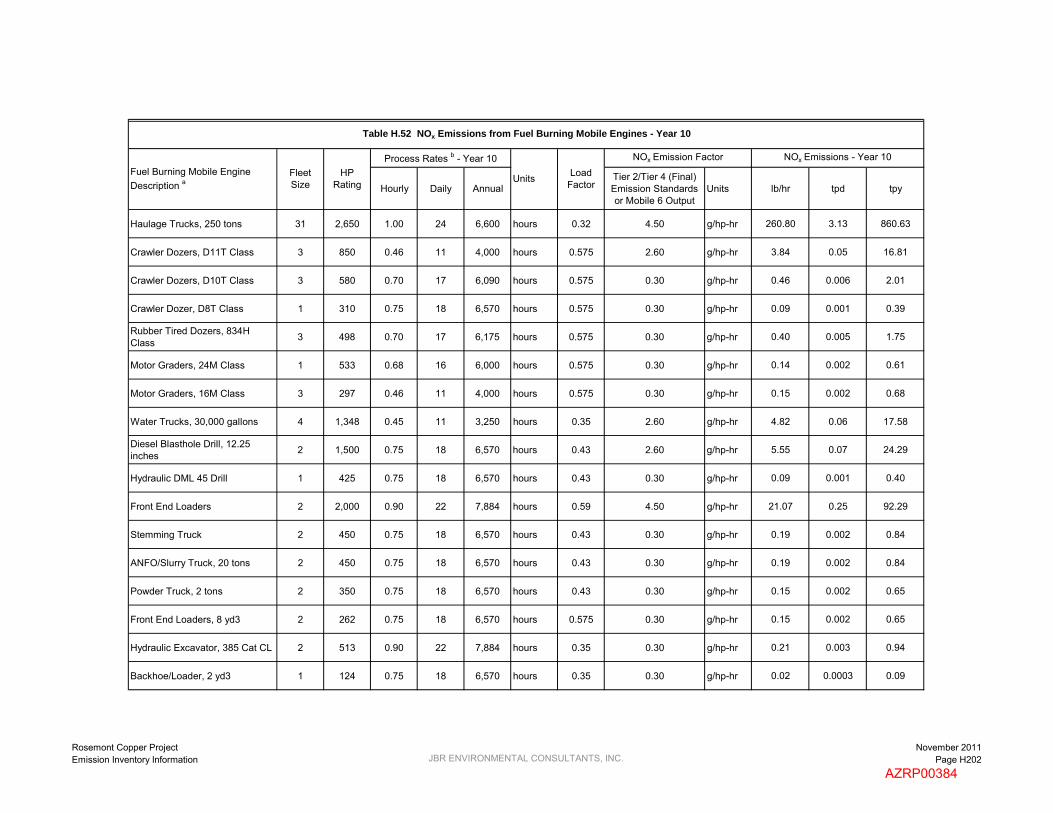
Hourly Daily AnnualTier 2/Tier 4 (Final) Emission Standards or Mobile 6 Output
Units lb/hr tpd tpy
Haulage Trucks, 250 tons 31 2,650 1.00 24 6,600 hours 0.32 4.50 g/hp-hr 260.80 3.13 860.63
Crawler Dozers, D11T Class 3 850 0.46 11 4,000 hours 0.575 2.60 g/hp-hr 3.84 0.05 16.81
Crawler Dozers, D10T Class 3 580 0.70 17 6,090 hours 0.575 0.30 g/hp-hr 0.46 0.006 2.01
Crawler Dozer, D8T Class 1 310 0.75 18 6,570 hours 0.575 0.30 g/hp-hr 0.09 0.001 0.39
Rubber Tired Dozers, 834H Class 3 498 0.70 17 6,175 hours 0.575 0.30 g/hp-hr 0.40 0.005 1.75
Motor Graders, 24M Class 1 533 0.68 16 6,000 hours 0.575 0.30 g/hp-hr 0.14 0.002 0.61
Motor Graders, 16M Class 3 297 0.46 11 4,000 hours 0.575 0.30 g/hp-hr 0.15 0.002 0.68
Water Trucks, 30,000 gallons 4 1,348 0.45 11 3,250 hours 0.35 2.60 g/hp-hr 4.82 0.06 17.58
Diesel Blasthole Drill, 12.25 inches 2 1,500 0.75 18 6,570 hours 0.43 2.60 g/hp-hr 5.55 0.07 24.29
Hydraulic DML 45 Drill 1 425 0.75 18 6,570 hours 0.43 0.30 g/hp-hr 0.09 0.001 0.40
Front End Loaders 2 2,000 0.90 22 7,884 hours 0.59 4.50 g/hp-hr 21.07 0.25 92.29
Stemming Truck 2 450 0.75 18 6,570 hours 0.43 0.30 g/hp-hr 0.19 0.002 0.84
ANFO/Slurry Truck, 20 tons 2 450 0.75 18 6,570 hours 0.43 0.30 g/hp-hr 0.19 0.002 0.84
Powder Truck, 2 tons 2 350 0.75 18 6,570 hours 0.43 0.30 g/hp-hr 0.15 0.002 0.65
Front End Loaders, 8 yd3 2 262 0.75 18 6,570 hours 0.575 0.30 g/hp-hr 0.15 0.002 0.65
Hydraulic Excavator, 385 Cat CL 2 513 0.90 22 7,884 hours 0.35 0.30 g/hp-hr 0.21 0.003 0.94
Backhoe/Loader, 2 yd3 1 124 0.75 18 6,570 hours 0.35 0.30 g/hp-hr 0.02 0.0003 0.09
Table H.52 NOx Emissions from Fuel Burning Mobile Engines - Year 10
Fuel Burning Mobile Engine Description a
Fleet Size
HP Rating
Load Factor
NOx Emission Factor NOx Emissions - Year 10Process Rates b - Year 10
Units
Rosemont Copper ProjectEmission Inventory Information JBR ENVIRONMENTAL CONSULTANTS, INC.
November 2011Page H202
AZRP00384
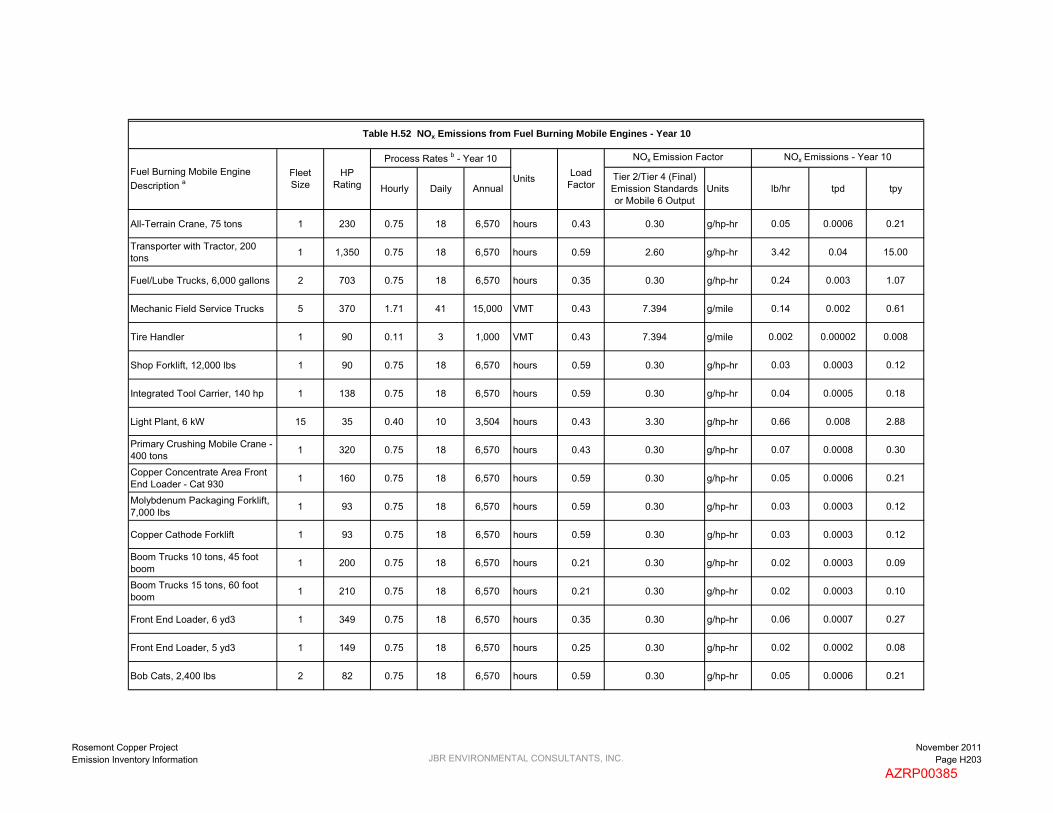
Hourly Daily AnnualTier 2/Tier 4 (Final) Emission Standards or Mobile 6 Output
Units lb/hr tpd tpy
Table H.52 NOx Emissions from Fuel Burning Mobile Engines - Year 10
Fuel Burning Mobile Engine Description a
Fleet Size
HP Rating
Load Factor
NOx Emission Factor NOx Emissions - Year 10Process Rates b - Year 10
Units
All-Terrain Crane, 75 tons 1 230 0.75 18 6,570 hours 0.43 0.30 g/hp-hr 0.05 0.0006 0.21
Transporter with Tractor, 200 tons 1 1,350 0.75 18 6,570 hours 0.59 2.60 g/hp-hr 3.42 0.04 15.00
Fuel/Lube Trucks, 6,000 gallons 2 703 0.75 18 6,570 hours 0.35 0.30 g/hp-hr 0.24 0.003 1.07
Mechanic Field Service Trucks 5 370 1.71 41 15,000 VMT 0.43 7.394 g/mile 0.14 0.002 0.61
Tire Handler 1 90 0.11 3 1,000 VMT 0.43 7.394 g/mile 0.002 0.00002 0.008
Shop Forklift, 12,000 lbs 1 90 0.75 18 6,570 hours 0.59 0.30 g/hp-hr 0.03 0.0003 0.12
Integrated Tool Carrier, 140 hp 1 138 0.75 18 6,570 hours 0.59 0.30 g/hp-hr 0.04 0.0005 0.18
Light Plant, 6 kW 15 35 0.40 10 3,504 hours 0.43 3.30 g/hp-hr 0.66 0.008 2.88
Primary Crushing Mobile Crane - 400 tons 1 320 0.75 18 6,570 hours 0.43 0.30 g/hp-hr 0.07 0.0008 0.30
Copper Concentrate Area Front End Loader - Cat 930 1 160 0.75 18 6,570 hours 0.59 0.30 g/hp-hr 0.05 0.0006 0.21
Molybdenum Packaging Forklift, 7,000 lbs 1 93 0.75 18 6,570 hours 0.59 0.30 g/hp-hr 0.03 0.0003 0.12
Copper Cathode Forklift 1 93 0.75 18 6,570 hours 0.59 0.30 g/hp-hr 0.03 0.0003 0.12
Boom Trucks 10 tons, 45 foot boom 1 200 0.75 18 6,570 hours 0.21 0.30 g/hp-hr 0.02 0.0003 0.09
Boom Trucks 15 tons, 60 foot boom 1 210 0.75 18 6,570 hours 0.21 0.30 g/hp-hr 0.02 0.0003 0.10
Front End Loader, 6 yd3 1 349 0.75 18 6,570 hours 0.35 0.30 g/hp-hr 0.06 0.0007 0.27
Front End Loader, 5 yd3 1 149 0.75 18 6,570 hours 0.25 0.30 g/hp-hr 0.02 0.0002 0.08
Bob Cats, 2,400 lbs 2 82 0.75 18 6,570 hours 0.59 0.30 g/hp-hr 0.05 0.0006 0.21
Rosemont Copper ProjectEmission Inventory Information JBR ENVIRONMENTAL CONSULTANTS, INC.
November 2011Page H203
AZRP00385
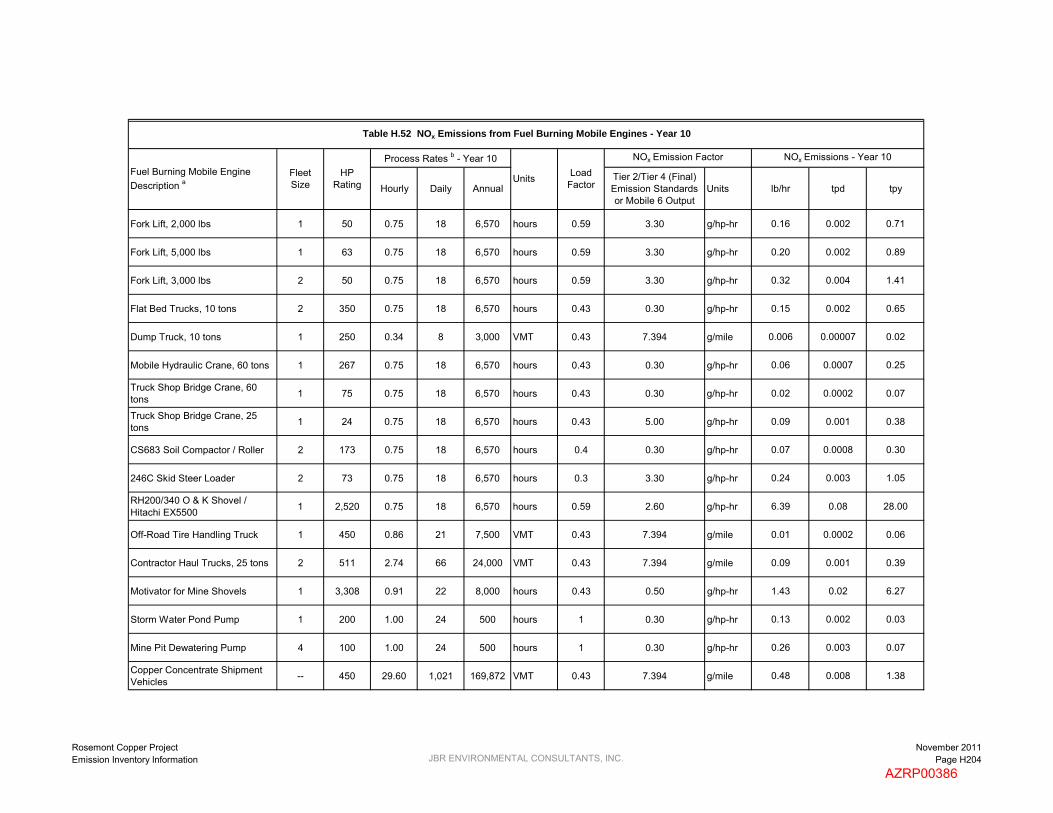
Hourly Daily AnnualTier 2/Tier 4 (Final) Emission Standards or Mobile 6 Output
Units lb/hr tpd tpy
Table H.52 NOx Emissions from Fuel Burning Mobile Engines - Year 10
Fuel Burning Mobile Engine Description a
Fleet Size
HP Rating
Load Factor
NOx Emission Factor NOx Emissions - Year 10Process Rates b - Year 10
Units
Fork Lift, 2,000 lbs 1 50 0.75 18 6,570 hours 0.59 3.30 g/hp-hr 0.16 0.002 0.71
Fork Lift, 5,000 lbs 1 63 0.75 18 6,570 hours 0.59 3.30 g/hp-hr 0.20 0.002 0.89
Fork Lift, 3,000 lbs 2 50 0.75 18 6,570 hours 0.59 3.30 g/hp-hr 0.32 0.004 1.41
Flat Bed Trucks, 10 tons 2 350 0.75 18 6,570 hours 0.43 0.30 g/hp-hr 0.15 0.002 0.65
Dump Truck, 10 tons 1 250 0.34 8 3,000 VMT 0.43 7.394 g/mile 0.006 0.00007 0.02
Mobile Hydraulic Crane, 60 tons 1 267 0.75 18 6,570 hours 0.43 0.30 g/hp-hr 0.06 0.0007 0.25
Truck Shop Bridge Crane, 60 tons 1 75 0.75 18 6,570 hours 0.43 0.30 g/hp-hr 0.02 0.0002 0.07
Truck Shop Bridge Crane, 25 tons 1 24 0.75 18 6,570 hours 0.43 5.00 g/hp-hr 0.09 0.001 0.38
CS683 Soil Compactor / Roller 2 173 0.75 18 6,570 hours 0.4 0.30 g/hp-hr 0.07 0.0008 0.30
246C Skid Steer Loader 2 73 0.75 18 6,570 hours 0.3 3.30 g/hp-hr 0.24 0.003 1.05
RH200/340 O & K Shovel / Hitachi EX5500 1 2,520 0.75 18 6,570 hours 0.59 2.60 g/hp-hr 6.39 0.08 28.00
Off-Road Tire Handling Truck 1 450 0.86 21 7,500 VMT 0.43 7.394 g/mile 0.01 0.0002 0.06
Contractor Haul Trucks, 25 tons 2 511 2.74 66 24,000 VMT 0.43 7.394 g/mile 0.09 0.001 0.39
Motivator for Mine Shovels 1 3,308 0.91 22 8,000 hours 0.43 0.50 g/hp-hr 1.43 0.02 6.27
Storm Water Pond Pump 1 200 1.00 24 500 hours 1 0.30 g/hp-hr 0.13 0.002 0.03
Mine Pit Dewatering Pump 4 100 1.00 24 500 hours 1 0.30 g/hp-hr 0.26 0.003 0.07
Copper Concentrate Shipment Vehicles -- 450 29.60 1,021 169,872 VMT 0.43 7.394 g/mile 0.48 0.008 1.38
Rosemont Copper ProjectEmission Inventory Information JBR ENVIRONMENTAL CONSULTANTS, INC.
November 2011Page H204
AZRP00386

Hourly Daily AnnualTier 2/Tier 4 (Final) Emission Standards or Mobile 6 Output
Units lb/hr tpd tpy
Table H.52 NOx Emissions from Fuel Burning Mobile Engines - Year 10
Fuel Burning Mobile Engine Description a
Fleet Size
HP Rating
Load Factor
NOx Emission Factor NOx Emissions - Year 10Process Rates b - Year 10
Units
Molybdenum Concentrate Shipment Vehicles -- 450 7.40 15 2,145 VMT 0.43 7.394 g/mile 0.12 0.0001 0.02
Sulfuric Acid Delivery Vehicles -- 450 22.20 143 52,021 VMT 0.43 7.394 g/mile 0.36 0.001 0.42
Lime Delivery Vehicles -- 450 14.80 52 19,072 VMT 0.43 7.394 g/mile 0.24 0.0004 0.16
SAG Mill and Ball Mill Grinding Balls Delivery Vehicles -- 450 14.80 23 5,858 VMT 0.43 7.394 g/mile 0.24 0.0002 0.05
Diesel Fuel Delivery Vehicles -- 500 14.80 47 17,136 VMT 0.43 7.394 g/mile 0.24 0.0004 0.14
Copper Cathode Shipment Vehicles -- 450 14.80 42 4,997 VMT 0.43 7.394 g/mile 0.24 0.0003 0.04
Ammonium Nitrate Delivery Vehicles -- 450 7.40 25 6,384 VMT 0.43 7.394 g/mile 0.12 0.0002 0.05
Miscellaneous Consumables Delivery Vehicles -- 450 7.40 48 12,486 VMT 0.43 7.394 g/mile 0.12 0.0004 0.10
Miscellaneous Fuels and Lubricants Delivery Vehicles -- 450 7.40 7 1,110 VMT 0.43 7.394 g/mile 0.12 0.00006 0.009
Pickup Trucks (gasoline) 20 350 1.37 33 12,000 VMT 0.54 1.145 g/mile 0.07 0.0008 0.30
Crew Van (gasoline) 3 350 0.91 22 8,000 VMT 0.54 1.145 g/mile 0.007 0.00008 0.03
Lot Pick-Up Trucks (gasoline) 20 250 0.34 8 3,000 VMT 0.54 1.145 g/mile 0.02 0.0002 0.08
260.80 3.13 860.63
54.46 0.64 225.71
315.26 3.77 1,086.35
a Fuel burning mobile engines are diesel fuel fired unless otherwise noted.
b Except for the shipment and delivery vehicles, the process rates are for a single mobile engine. The process rates for the shipment and delivery vehicles are representative of the entire fleet.
Total Emissions from All Mobile Engines:
Total Emissions from Haul Truck Engines:
Total Emissions from Other Mobile Engines:
Rosemont Copper ProjectEmission Inventory Information JBR ENVIRONMENTAL CONSULTANTS, INC.
November 2011Page H205
AZRP00387
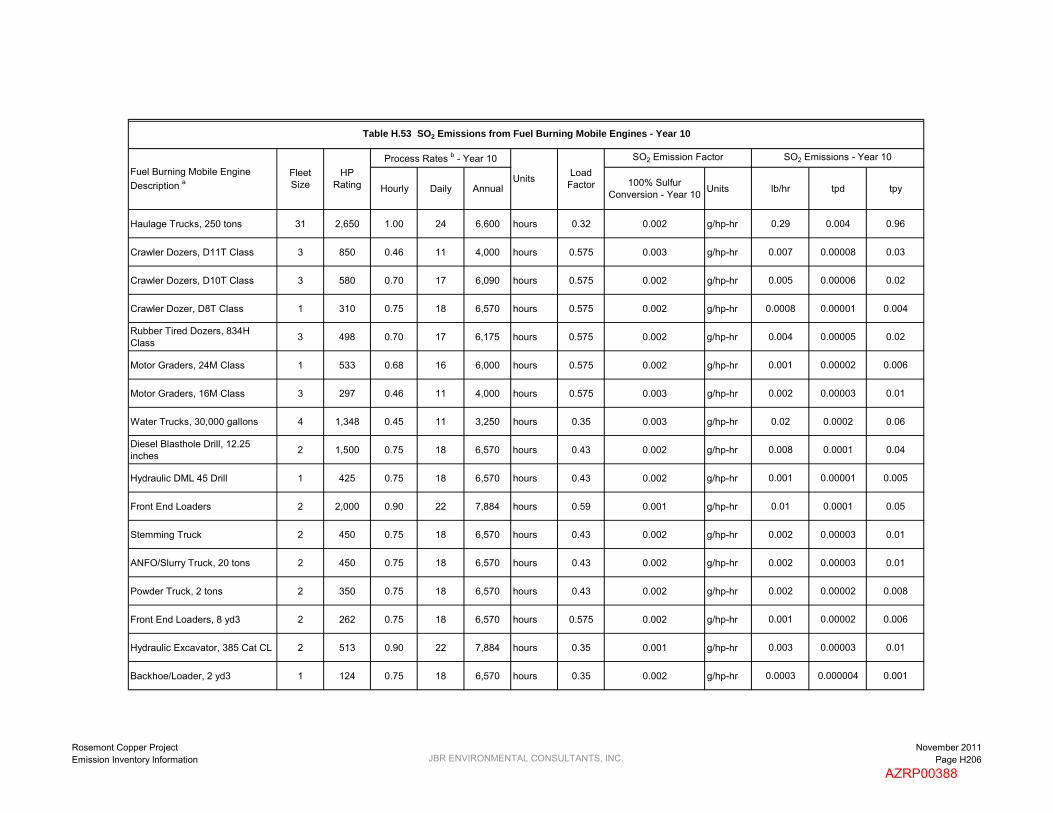
Hourly Daily Annual 100% Sulfur Conversion - Year 10 Units lb/hr tpd tpy
Haulage Trucks, 250 tons 31 2,650 1.00 24 6,600 hours 0.32 0.002 g/hp-hr 0.29 0.004 0.96
Crawler Dozers, D11T Class 3 850 0.46 11 4,000 hours 0.575 0.003 g/hp-hr 0.007 0.00008 0.03
Crawler Dozers, D10T Class 3 580 0.70 17 6,090 hours 0.575 0.002 g/hp-hr 0.005 0.00006 0.02
Crawler Dozer, D8T Class 1 310 0.75 18 6,570 hours 0.575 0.002 g/hp-hr 0.0008 0.00001 0.004
Rubber Tired Dozers, 834H Class 3 498 0.70 17 6,175 hours 0.575 0.002 g/hp-hr 0.004 0.00005 0.02
Motor Graders, 24M Class 1 533 0.68 16 6,000 hours 0.575 0.002 g/hp-hr 0.001 0.00002 0.006
Motor Graders, 16M Class 3 297 0.46 11 4,000 hours 0.575 0.003 g/hp-hr 0.002 0.00003 0.01
Water Trucks, 30,000 gallons 4 1,348 0.45 11 3,250 hours 0.35 0.003 g/hp-hr 0.02 0.0002 0.06
Diesel Blasthole Drill, 12.25 inches 2 1,500 0.75 18 6,570 hours 0.43 0.002 g/hp-hr 0.008 0.0001 0.04
Hydraulic DML 45 Drill 1 425 0.75 18 6,570 hours 0.43 0.002 g/hp-hr 0.001 0.00001 0.005
Front End Loaders 2 2,000 0.90 22 7,884 hours 0.59 0.001 g/hp-hr 0.01 0.0001 0.05
Stemming Truck 2 450 0.75 18 6,570 hours 0.43 0.002 g/hp-hr 0.002 0.00003 0.01
ANFO/Slurry Truck, 20 tons 2 450 0.75 18 6,570 hours 0.43 0.002 g/hp-hr 0.002 0.00003 0.01
Powder Truck, 2 tons 2 350 0.75 18 6,570 hours 0.43 0.002 g/hp-hr 0.002 0.00002 0.008
Front End Loaders, 8 yd3 2 262 0.75 18 6,570 hours 0.575 0.002 g/hp-hr 0.001 0.00002 0.006
Hydraulic Excavator, 385 Cat CL 2 513 0.90 22 7,884 hours 0.35 0.001 g/hp-hr 0.003 0.00003 0.01
Backhoe/Loader, 2 yd3 1 124 0.75 18 6,570 hours 0.35 0.002 g/hp-hr 0.0003 0.000004 0.001
Table H.53 SO2 Emissions from Fuel Burning Mobile Engines - Year 10
SO2 Emissions - Year 10Fuel Burning Mobile Engine Description a
Fleet Size
HP Rating
Process Rates b - Year 10
Units Load Factor
SO2 Emission Factor
Rosemont Copper ProjectEmission Inventory Information JBR ENVIRONMENTAL CONSULTANTS, INC.
November 2011Page H206
AZRP00388
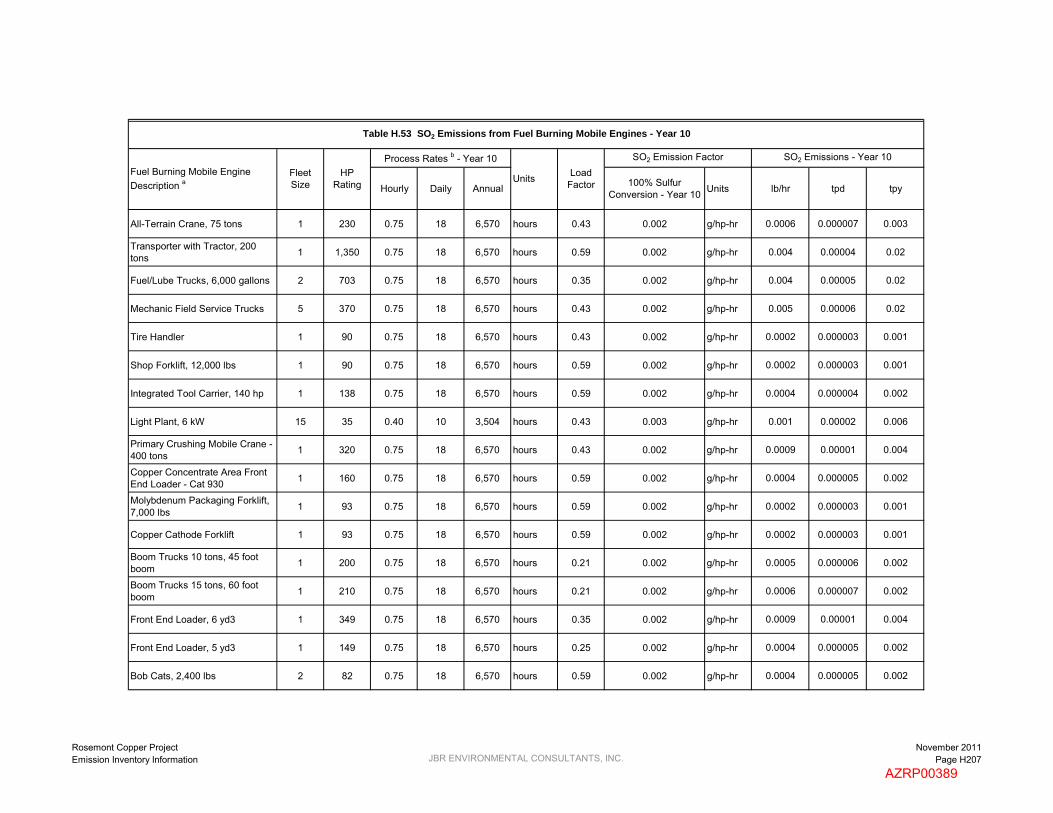
Hourly Daily Annual 100% Sulfur Conversion - Year 10 Units lb/hr tpd tpy
Table H.53 SO2 Emissions from Fuel Burning Mobile Engines - Year 10
SO2 Emissions - Year 10Fuel Burning Mobile Engine Description a
Fleet Size
HP Rating
Process Rates b - Year 10
Units Load Factor
SO2 Emission Factor
All-Terrain Crane, 75 tons 1 230 0.75 18 6,570 hours 0.43 0.002 g/hp-hr 0.0006 0.000007 0.003
Transporter with Tractor, 200 tons 1 1,350 0.75 18 6,570 hours 0.59 0.002 g/hp-hr 0.004 0.00004 0.02
Fuel/Lube Trucks, 6,000 gallons 2 703 0.75 18 6,570 hours 0.35 0.002 g/hp-hr 0.004 0.00005 0.02
Mechanic Field Service Trucks 5 370 0.75 18 6,570 hours 0.43 0.002 g/hp-hr 0.005 0.00006 0.02
Tire Handler 1 90 0.75 18 6,570 hours 0.43 0.002 g/hp-hr 0.0002 0.000003 0.001
Shop Forklift, 12,000 lbs 1 90 0.75 18 6,570 hours 0.59 0.002 g/hp-hr 0.0002 0.000003 0.001
Integrated Tool Carrier, 140 hp 1 138 0.75 18 6,570 hours 0.59 0.002 g/hp-hr 0.0004 0.000004 0.002
Light Plant, 6 kW 15 35 0.40 10 3,504 hours 0.43 0.003 g/hp-hr 0.001 0.00002 0.006
Primary Crushing Mobile Crane - 400 tons 1 320 0.75 18 6,570 hours 0.43 0.002 g/hp-hr 0.0009 0.00001 0.004
Copper Concentrate Area Front End Loader - Cat 930 1 160 0.75 18 6,570 hours 0.59 0.002 g/hp-hr 0.0004 0.000005 0.002
Molybdenum Packaging Forklift, 7,000 lbs 1 93 0.75 18 6,570 hours 0.59 0.002 g/hp-hr 0.0002 0.000003 0.001
Copper Cathode Forklift 1 93 0.75 18 6,570 hours 0.59 0.002 g/hp-hr 0.0002 0.000003 0.001
Boom Trucks 10 tons, 45 foot boom 1 200 0.75 18 6,570 hours 0.21 0.002 g/hp-hr 0.0005 0.000006 0.002
Boom Trucks 15 tons, 60 foot boom 1 210 0.75 18 6,570 hours 0.21 0.002 g/hp-hr 0.0006 0.000007 0.002
Front End Loader, 6 yd3 1 349 0.75 18 6,570 hours 0.35 0.002 g/hp-hr 0.0009 0.00001 0.004
Front End Loader, 5 yd3 1 149 0.75 18 6,570 hours 0.25 0.002 g/hp-hr 0.0004 0.000005 0.002
Bob Cats, 2,400 lbs 2 82 0.75 18 6,570 hours 0.59 0.002 g/hp-hr 0.0004 0.000005 0.002
Rosemont Copper ProjectEmission Inventory Information JBR ENVIRONMENTAL CONSULTANTS, INC.
November 2011Page H207
AZRP00389

Hourly Daily Annual 100% Sulfur Conversion - Year 10 Units lb/hr tpd tpy
Table H.53 SO2 Emissions from Fuel Burning Mobile Engines - Year 10
SO2 Emissions - Year 10Fuel Burning Mobile Engine Description a
Fleet Size
HP Rating
Process Rates b - Year 10
Units Load Factor
SO2 Emission Factor
Fork Lift, 2,000 lbs 1 50 0.75 18 6,570 hours 0.59 0.002 g/hp-hr 0.0001 0.000002 0.0006
Fork Lift, 5,000 lbs 1 63 0.75 18 6,570 hours 0.59 0.002 g/hp-hr 0.0002 0.000002 0.0007
Fork Lift, 3,000 lbs 2 50 0.75 18 6,570 hours 0.59 0.002 g/hp-hr 0.0003 0.000003 0.001
Flat Bed Trucks, 10 tons 2 350 0.75 18 6,570 hours 0.43 0.002 g/hp-hr 0.002 0.00002 0.008
Dump Truck, 10 tons 1 250 0.75 18 6,570 hours 0.43 0.002 g/hp-hr 0.0007 0.000008 0.003
Mobile Hydraulic Crane, 60 tons 1 267 0.75 18 6,570 hours 0.43 0.002 g/hp-hr 0.0007 0.000009 0.003
Truck Shop Bridge Crane, 60 tons 1 75 0.75 18 6,570 hours 0.43 0.002 g/hp-hr 0.0002 0.000002 0.0009
Truck Shop Bridge Crane, 25 tons 1 24 0.75 18 6,570 hours 0.43 0.002 g/hp-hr 0.00006 0.0000008 0.0003
CS683 Soil Compactor / Roller 2 173 0.75 18 6,570 hours 0.40 0.002 g/hp-hr 0.0009 0.00001 0.004
246C Skid Steer Loader 2 73 0.75 18 6,570 hours 0.3 0.002 g/hp-hr 0.0004 0.000005 0.002
RH200/340 O & K Shovel / Hitachi EX5500 1 2,520 0.75 18 6,570 hours 0.59 0.002 g/hp-hr 0.007 0.00008 0.03
Off-Road Tire Handling Truck 1 450 0.75 18 6,570 hours 0.43 0.002 g/hp-hr 0.001 0.00001 0.005
Contractor Haul Trucks, 25 tons 2 511 0.75 18 6,570 hours 0.43 0.002 g/hp-hr 0.003 0.00003 0.01
Motivator for Mine Shovels 1 3,308 0.91 22 8,000 hours 0.43 0.001 g/hp-hr 0.009 0.0001 0.04
Storm Water Pond Pump 1 200 1.00 24 500 hours 1 0.021 g/hp-hr 0.009 0.0001 0.002
Mine Pit Dewatering Pump 4 100 1.00 24 500 hours 1 0.021 g/hp-hr 0.02 0.0002 0.005
Copper Concentrate Shipment Vehicles -- 450 1.00 19 6,795 hours 0.43 0.002 g/hp-hr 0.002 0.00001 0.005
Rosemont Copper ProjectEmission Inventory Information JBR ENVIRONMENTAL CONSULTANTS, INC.
November 2011Page H208
AZRP00390

Hourly Daily Annual 100% Sulfur Conversion - Year 10 Units lb/hr tpd tpy
Table H.53 SO2 Emissions from Fuel Burning Mobile Engines - Year 10
SO2 Emissions - Year 10Fuel Burning Mobile Engine Description a
Fleet Size
HP Rating
Process Rates b - Year 10
Units Load Factor
SO2 Emission Factor
Molybdenum Concentrate Shipment Vehicles -- 450 1.00 1 86 hours 0.43 0.124 g/hp-hr 0.12 0.00006 0.005
Sulfuric Acid Delivery Vehicles -- 450 1.00 6 2,081 hours 0.43 0.005 g/hp-hr 0.005 0.00001 0.005
Lime Delivery Vehicles -- 450 1.00 2 763 hours 0.43 0.014 g/hp-hr 0.01 0.00001 0.005
SAG Mill and Ball Mill Grinding Balls Delivery Vehicles -- 450 1.00 1 234 hours 0.43 0.045 g/hp-hr 0.05 0.00002 0.005
Diesel Fuel Delivery Vehicles -- 500 1.00 2 685 hours 0.43 0.016 g/hp-hr 0.02 0.00002 0.006
Copper Cathode Shipment Vehicles -- 450 1.00 1 200 hours 0.43 0.053 g/hp-hr 0.05 0.00003 0.005
Ammonium Nitrate Delivery Vehicles -- 450 1.00 1 255 hours 0.43 0.042 g/hp-hr 0.04 0.00002 0.005
Miscellaneous Consumables Delivery Vehicles -- 450 1.00 1 499 hours 0.43 0.021 g/hp-hr 0.02 0.00001 0.005
Miscellaneous Fuels and Lubricants Delivery Vehicles -- 450 1.00 1 44 hours 0.43 0.240 g/hp-hr 0.24 0.0001 0.005
Pickup Trucks (gasoline) 20 350 0.25 6 2,190 hours 0.54 0.017 g/hp-hr 0.003 0.00004 0.01
Crew Van (gasoline) 3 350 0.25 6 2,190 hours 0.54 0.0025 g/hp-hr 0.0005 0.000006 0.002
Lot Pick-Up Trucks (gasoline) 20 250 0.25 6 2,190 hours 0.54 0.017 g/hp-hr 0.002 0.00003 0.01
0.29 0.004 0.96
0.71 0.002 0.57
1.00 0.006 1.54
a Fuel burning mobile engines are diesel fuel fired unless otherwise noted.
b Except for the shipment and delivery vehicles, the process rates are for a single mobile engine. The process rates for the shipment and delivery vehicles are representative of the entire fleet.
Total Emissions from All Mobile Engines:
Total Emissions from Haul Truck Engines:
Total Emissions from Other Mobile Engines:
Rosemont Copper ProjectEmission Inventory Information JBR ENVIRONMENTAL CONSULTANTS, INC.
November 2011Page H209
AZRP00391

Hourly Daily AnnualTier 2/Tier 4 (Final) Emission Standards or Mobile 6 Output
Units lb/hr tpd tpy
Haulage Trucks, 250 tons 31 2,650 1.00 24 6,600 hours 0.32 0.30 g/hp-hr 17.39 0.21 57.38
Crawler Dozers, D11T Class 3 850 0.46 11 4,000 hours 0.575 0.14 g/hp-hr 0.21 0.002 0.91
Crawler Dozers, D10T Class 3 580 0.70 17 6,090 hours 0.575 0.14 g/hp-hr 0.21 0.003 0.94
Crawler Dozer, D8T Class 1 310 0.75 18 6,570 hours 0.575 0.14 g/hp-hr 0.04 0.0005 0.18
Rubber Tired Dozers, 834H Class 3 498 0.70 17 6,175 hours 0.575 0.14 g/hp-hr 0.19 0.002 0.82
Motor Graders, 24M Class 1 533 0.68 16 6,000 hours 0.575 0.14 g/hp-hr 0.06 0.0008 0.28
Motor Graders, 16M Class 3 297 0.46 11 4,000 hours 0.575 0.14 g/hp-hr 0.07 0.0009 0.32
Water Trucks, 30,000 gallons 4 1,348 0.45 11 3,250 hours 0.35 0.14 g/hp-hr 0.26 0.003 0.95
Diesel Blasthole Drill, 12.25 inches 2 1,500 0.75 18 6,570 hours 0.43 0.14 g/hp-hr 0.30 0.004 1.31
Hydraulic DML 45 Drill 1 425 0.75 18 6,570 hours 0.43 0.14 g/hp-hr 0.04 0.0005 0.19
Front End Loaders 2 2,000 0.90 22 7,884 hours 0.59 0.30 g/hp-hr 1.40 0.02 6.15
Stemming Truck 2 450 0.75 18 6,570 hours 0.43 0.14 g/hp-hr 0.09 0.001 0.39
ANFO/Slurry Truck, 20 tons 2 450 0.75 18 6,570 hours 0.43 0.14 g/hp-hr 0.09 0.001 0.39
Powder Truck, 2 tons 2 350 0.75 18 6,570 hours 0.43 0.14 g/hp-hr 0.07 0.0008 0.31
Front End Loaders, 8 yd3 2 262 0.75 18 6,570 hours 0.575 0.14 g/hp-hr 0.07 0.0008 0.31
Hydraulic Excavator, 385 Cat CL 2 513 0.90 22 7,884 hours 0.35 0.14 g/hp-hr 0.10 0.001 0.44
Backhoe/Loader, 2 yd3 1 124 0.75 18 6,570 hours 0.35 0.14 g/hp-hr 0.01 0.0001 0.04
Table H.54 VOC Emissions from Fuel Burning Mobile Engines - Year 10
Fuel Burning Mobile Engine Description a
Fleet Size
HP Rating
Load Factor
VOC Emission Factor VOC Emissions - Year 10Process Rates b - Year 10
Units
Rosemont Copper ProjectEmission Inventory Information JBR ENVIRONMENTAL CONSULTANTS, INC.
November 2011Page H210
AZRP00392

Hourly Daily AnnualTier 2/Tier 4 (Final) Emission Standards or Mobile 6 Output
Units lb/hr tpd tpy
Table H.54 VOC Emissions from Fuel Burning Mobile Engines - Year 10
Fuel Burning Mobile Engine Description a
Fleet Size
HP Rating
Load Factor
VOC Emission Factor VOC Emissions - Year 10Process Rates b - Year 10
Units
All-Terrain Crane, 75 tons 1 230 0.75 18 6,570 hours 0.43 0.14 g/hp-hr 0.02 0.0003 0.10
Transporter with Tractor, 200 tons 1 1,350 0.75 18 6,570 hours 0.59 0.14 g/hp-hr 0.18 0.002 0.81
Fuel/Lube Trucks, 6,000 gallons 2 703 0.75 18 6,570 hours 0.35 0.14 g/hp-hr 0.11 0.001 0.50
Mechanic Field Service Trucks 5 370 1.71 41 15,000 VMT 0.43 0.403 g/mile 0.008 0.00009 0.03
Tire Handler 1 90 0.11 3 1,000 VMT 0.43 0.403 g/mile 0.0001 0.000001 0.0004
Shop Forklift, 12,000 lbs 1 90 0.75 18 6,570 hours 0.59 0.14 g/hp-hr 0.01 0.0001 0.05
Integrated Tool Carrier, 140 hp 1 138 0.75 18 6,570 hours 0.59 0.14 g/hp-hr 0.02 0.0002 0.08
Light Plant, 6 kW 15 35 0.40 10 3,504 hours 0.43 0.20 g/hp-hr 0.04 0.0005 0.17
Primary Crushing Mobile Crane - 400 tons 1 320 0.75 18 6,570 hours 0.43 0.14 g/hp-hr 0.03 0.0004 0.14
Copper Concentrate Area Front End Loader - Cat 930 1 160 0.75 18 6,570 hours 0.59 0.14 g/hp-hr 0.02 0.0003 0.10
Molybdenum Packaging Forklift, 7,000 lbs 1 93 0.75 18 6,570 hours 0.59 0.14 g/hp-hr 0.01 0.0002 0.06
Copper Cathode Forklift 1 93 0.75 18 6,570 hours 0.59 0.14 g/hp-hr 0.01 0.0002 0.06
Boom Trucks 10 tons, 45 foot boom 1 200 0.75 18 6,570 hours 0.21 0.14 g/hp-hr 0.01 0.0001 0.04
Boom Trucks 15 tons, 60 foot boom 1 210 0.75 18 6,570 hours 0.21 0.14 g/hp-hr 0.01 0.0001 0.04
Front End Loader, 6 yd3 1 349 0.75 18 6,570 hours 0.35 0.14 g/hp-hr 0.03 0.0003 0.12
Front End Loader, 5 yd3 1 149 0.75 18 6,570 hours 0.25 0.14 g/hp-hr 0.009 0.0001 0.04
Bob Cats, 2,400 lbs 2 82 0.75 18 6,570 hours 0.59 0.14 g/hp-hr 0.02 0.0003 0.10
Rosemont Copper ProjectEmission Inventory Information JBR ENVIRONMENTAL CONSULTANTS, INC.
November 2011Page H211
AZRP00393

Hourly Daily AnnualTier 2/Tier 4 (Final) Emission Standards or Mobile 6 Output
Units lb/hr tpd tpy
Table H.54 VOC Emissions from Fuel Burning Mobile Engines - Year 10
Fuel Burning Mobile Engine Description a
Fleet Size
HP Rating
Load Factor
VOC Emission Factor VOC Emissions - Year 10Process Rates b - Year 10
Units
Fork Lift, 2,000 lbs 1 50 0.75 18 6,570 hours 0.59 0.20 g/hp-hr 0.01 0.0001 0.04
Fork Lift, 5,000 lbs 1 63 0.75 18 6,570 hours 0.59 0.20 g/hp-hr 0.01 0.0001 0.05
Fork Lift, 3,000 lbs 2 50 0.75 18 6,570 hours 0.59 0.20 g/hp-hr 0.02 0.0002 0.09
Flat Bed Trucks, 10 tons 2 350 0.75 18 6,570 hours 0.43 0.14 g/hp-hr 0.07 0.0008 0.31
Dump Truck, 10 tons 1 250 0.34 8 3,000 VMT 0.43 0.403 g/mile 0.0003 0.000004 0.001
Mobile Hydraulic Crane, 60 tons 1 267 0.75 18 6,570 hours 0.43 0.14 g/hp-hr 0.03 0.0003 0.12
Truck Shop Bridge Crane, 60 tons 1 75 0.75 18 6,570 hours 0.43 0.14 g/hp-hr 0.007 0.00009 0.03
Truck Shop Bridge Crane, 25 tons 1 24 0.75 18 6,570 hours 0.43 0.60 g/hp-hr 0.01 0.0001 0.05
CS683 Soil Compactor / Roller 2 173 0.75 18 6,570 hours 0.4 0.14 g/hp-hr 0.03 0.0004 0.14
246C Skid Steer Loader 2 73 0.75 18 6,570 hours 0.3 0.20 g/hp-hr 0.01 0.0002 0.06
RH200/340 O & K Shovel / Hitachi EX5500 1 2,520 0.75 18 6,570 hours 0.59 0.14 g/hp-hr 0.34 0.004 1.51
Off-Road Tire Handling Truck 1 450 0.86 21 7,500 VMT 0.43 0.403 g/mile 0.0008 0.000009 0.003
Contractor Haul Trucks, 25 tons 2 511 2.74 66 24,000 VMT 0.43 0.403 g/mile 0.005 0.00006 0.02
Motivator for Mine Shovels 1 3,308 0.91 22 8,000 hours 0.43 0.14 g/hp-hr 0.40 0.005 1.76
Storm Water Pond Pump 1 200 1.00 24 500 hours 1 0.14 g/hp-hr 0.06 0.0007 0.02
Mine Pit Dewatering Pump 4 100 1.00 24 500 hours 1 0.14 g/hp-hr 0.12 0.001 0.03
Copper Concentrate Shipment Vehicles -- 450 29.60 1,021 169,872 VMT 0.43 0.403 g/mile 0.03 0.0005 0.08
Rosemont Copper ProjectEmission Inventory Information JBR ENVIRONMENTAL CONSULTANTS, INC.
November 2011Page H212
AZRP00394

Hourly Daily AnnualTier 2/Tier 4 (Final) Emission Standards or Mobile 6 Output
Units lb/hr tpd tpy
Table H.54 VOC Emissions from Fuel Burning Mobile Engines - Year 10
Fuel Burning Mobile Engine Description a
Fleet Size
HP Rating
Load Factor
VOC Emission Factor VOC Emissions - Year 10Process Rates b - Year 10
Units
Molybdenum Concentrate Shipment Vehicles -- 450 7.40 15 2,145 VMT 0.43 0.403 g/mile 0.007 0.000007 0.001
Sulfuric Acid Delivery Vehicles -- 450 22.20 143 52,021 VMT 0.43 0.403 g/mile 0.02 0.00006 0.02
Lime Delivery Vehicles -- 450 14.80 52 19,072 VMT 0.43 0.403 g/mile 0.01 0.00002 0.008
SAG Mill and Ball Mill Grinding Balls Delivery Vehicles -- 450 14.80 23 5,858 VMT 0.43 0.403 g/mile 0.01 0.00001 0.003
Diesel Fuel Delivery Vehicles -- 500 14.80 47 17,136 VMT 0.43 0.403 g/mile 0.01 0.00002 0.008
Copper Cathode Shipment Vehicles -- 450 14.80 42 4,997 VMT 0.43 0.403 g/mile 0.01 0.00002 0.002
Ammonium Nitrate Delivery Vehicles -- 450 7.40 25 6,384 VMT 0.43 0.403 g/mile 0.007 0.00001 0.003
Miscellaneous Consumables Delivery Vehicles -- 450 7.40 48 12,486 VMT 0.43 0.403 g/mile 0.007 0.00002 0.006
Miscellaneous Fuels and Lubricants Delivery Vehicles -- 450 7.40 7 1,110 VMT 0.43 0.403 g/mile 0.007 0.000003 0.0005
Pickup Trucks (gasoline) 20 350 1.37 33 12,000 VMT 0.54 1.329 g/mile 0.08 0.001 0.35
Crew Van (gasoline) 3 350 0.91 22 8,000 VMT 0.54 1.329 g/mile 0.008 0.0001 0.04
Lot Pick-Up Trucks (gasoline) 20 250 0.34 8 3,000 VMT 0.54 1.329 g/mile 0.02 0.0002 0.09
17.39 0.21 57.38
5.15 0.06 21.18
22.54 0.27 78.56
a Fuel burning mobile engines are diesel fuel fired unless otherwise noted.
b Except for the shipment and delivery vehicles, the process rates are for a single mobile engine. The process rates for the shipment and delivery vehicles are representative of the entire fleet.
Total Emissions from All Mobile Engines:
Total Emissions from Haul Truck Engines:
Total Emissions from Other Mobile Engines:
Rosemont Copper ProjectEmission Inventory Information JBR ENVIRONMENTAL CONSULTANTS, INC.
November 2011Page H213
AZRP00395

Hourly Daily Annual 99% Conversion(g/hp-hr) Units lb/hr tpd tpy
Haulage Trucks, 250 tons 31 2,650 1.00 24 6,600 hours 0.32 497 g/hp-hr 28,820.00 345.84 95,105.99
Crawler Dozers, D11T Class 3 850 0.46 11 4,000 hours 0.575 497 g/hp-hr 734.01 8.81 3,214.95
Crawler Dozers, D10T Class 3 580 0.70 17 6,090 hours 0.575 497 g/hp-hr 762.55 9.15 3,339.96
Crawler Dozer, D8T Class 1 310 0.75 18 6,570 hours 0.575 497 g/hp-hr 146.56 1.76 641.95
Rubber Tired Dozers, 834H Class 3 498 0.70 17 6,175 hours 0.575 497 g/hp-hr 663.88 7.97 2,907.78
Motor Graders, 24M Class 1 533 0.68 16 6,000 hours 0.575 497 g/hp-hr 230.13 2.76 1,007.98
Motor Graders, 16M Class 3 297 0.46 11 4,000 hours 0.575 497 g/hp-hr 256.47 3.08 1,123.34
Water Trucks, 30,000 gallons 4 1,348 0.45 11 3,250 hours 0.35 497 g/hp-hr 921.12 11.05 3,362.08
Diesel Blasthole Drill, 12.25 inches 2 1,500 0.75 18 6,570 hours 0.43 497 g/hp-hr 1,060.69 12.73 4,645.81
Hydraulic DML 45 Drill 1 425 0.75 18 6,570 hours 0.43 497 g/hp-hr 150.26 1.80 658.16
Front End Loaders 2 2,000 0.90 22 7,884 hours 0.59 497 g/hp-hr 2,328.58 27.94 10,199.17
Stemming Truck 2 450 0.75 18 6,570 hours 0.43 497 g/hp-hr 318.21 3.82 1,393.74
ANFO/Slurry Truck, 20 tons 2 450 0.75 18 6,570 hours 0.43 497 g/hp-hr 318.21 3.82 1,393.74
Powder Truck, 2 tons 2 350 0.75 18 6,570 hours 0.43 497 g/hp-hr 247.49 2.97 1,084.02
Front End Loaders, 8 yd3 2 262 0.75 18 6,570 hours 0.575 497 g/hp-hr 247.74 2.97 1,085.10
Hydraulic Excavator, 385 Cat CL 2 513 0.90 22 7,884 hours 0.35 497 g/hp-hr 354.32 4.25 1,551.92
Backhoe/Loader, 2 yd3 1 124 0.75 18 6,570 hours 0.35 497 g/hp-hr 35.69 0.43 156.30
Table H.55 CO2 Emissions from Fuel Burning Mobile Engines - Year 10
Fuel Burning Mobile Engine Description a
Fleet Size
HP Rating
Load Factor
CO2 Emission Factor CO2 Emissions - Year 10Process Rates b - Year 10
Units
Rosemont Copper ProjectEmission Inventory Information JBR ENVIRONMENTAL CONSULTANTS, INC.
November 2011Page H214
AZRP00396

Hourly Daily Annual 99% Conversion(g/hp-hr) Units lb/hr tpd tpy
Table H.55 CO2 Emissions from Fuel Burning Mobile Engines - Year 10
Fuel Burning Mobile Engine Description a
Fleet Size
HP Rating
Load Factor
CO2 Emission Factor CO2 Emissions - Year 10Process Rates b - Year 10
Units
All-Terrain Crane, 75 tons 1 230 0.75 18 6,570 hours 0.43 497 g/hp-hr 81.32 0.98 356.18
Transporter with Tractor, 200 tons 1 1,350 0.75 18 6,570 hours 0.59 497 g/hp-hr 654.91 7.86 2,868.52
Fuel/Lube Trucks, 6,000 gallons 2 703 0.75 18 6,570 hours 0.35 497 g/hp-hr 404.62 4.86 1,772.25
Mechanic Field Service Trucks 5 370 0.75 18 6,570 hours 0.43 497 g/hp-hr 654.09 7.85 2,864.92
Tire Handler 1 90 0.75 18 6,570 hours 0.43 497 g/hp-hr 31.82 0.38 139.37
Shop Forklift, 12,000 lbs 1 90 0.75 18 6,570 hours 0.59 497 g/hp-hr 43.66 0.52 191.23
Integrated Tool Carrier, 140 hp 1 138 0.75 18 6,570 hours 0.59 497 g/hp-hr 66.95 0.80 293.23
Light Plant, 6 kW 15 35 0.40 10 3,504 hours 0.43 497 g/hp-hr 99.00 1.19 433.61
Primary Crushing Mobile Crane - 400 tons 1 320 0.75 18 6,570 hours 0.43 497 g/hp-hr 113.14 1.36 495.55
Copper Concentrate Area Front End Loader - Cat 930 1 160 0.75 18 6,570 hours 0.59 497 g/hp-hr 77.62 0.93 339.97
Molybdenum Packaging Forklift, 7,000 lbs 1 93 0.75 18 6,570 hours 0.59 497 g/hp-hr 44.87 0.54 196.55
Copper Cathode Forklift 1 93 0.75 18 6,570 hours 0.59 497 g/hp-hr 44.87 0.54 196.55
Boom Trucks 10 tons, 45 foot boom 1 200 0.75 18 6,570 hours 0.21 497 g/hp-hr 34.53 0.41 151.26
Boom Trucks 15 tons, 60 foot boom 1 210 0.75 18 6,570 hours 0.21 497 g/hp-hr 36.26 0.44 158.82
Front End Loader, 6 yd3 1 349 0.75 18 6,570 hours 0.35 497 g/hp-hr 100.44 1.21 439.91
Front End Loader, 5 yd3 1 149 0.75 18 6,570 hours 0.25 497 g/hp-hr 30.63 0.37 134.15
Bob Cats, 2,400 lbs 2 82 0.75 18 6,570 hours 0.59 497 g/hp-hr 79.56 0.95 348.47
Rosemont Copper ProjectEmission Inventory Information JBR ENVIRONMENTAL CONSULTANTS, INC.
November 2011Page H215
AZRP00397

Hourly Daily Annual 99% Conversion(g/hp-hr) Units lb/hr tpd tpy
Table H.55 CO2 Emissions from Fuel Burning Mobile Engines - Year 10
Fuel Burning Mobile Engine Description a
Fleet Size
HP Rating
Load Factor
CO2 Emission Factor CO2 Emissions - Year 10Process Rates b - Year 10
Units
Fork Lift, 2,000 lbs 1 50 0.75 18 6,570 hours 0.59 497 g/hp-hr 24.26 0.29 106.24
Fork Lift, 5,000 lbs 1 63 0.75 18 6,570 hours 0.59 497 g/hp-hr 30.56 0.37 133.86
Fork Lift, 3,000 lbs 2 50 0.75 18 6,570 hours 0.59 497 g/hp-hr 48.51 0.58 212.48
Flat Bed Trucks, 10 tons 2 350 0.75 18 6,570 hours 0.43 497 g/hp-hr 247.49 2.97 1,084.02
Dump Truck, 10 tons 1 250 0.75 18 6,570 hours 0.43 497 g/hp-hr 88.39 1.06 387.15
Mobile Hydraulic Crane, 60 tons 1 267 0.75 18 6,570 hours 0.43 497 g/hp-hr 94.40 1.13 413.48
Truck Shop Bridge Crane, 60 tons 1 75 0.75 18 6,570 hours 0.43 497 g/hp-hr 26.52 0.32 116.15
Truck Shop Bridge Crane, 25 tons 1 24 0.75 18 6,570 hours 0.43 497 g/hp-hr 8.52 0.10 37.32
CS683 Soil Compactor / Roller 2 173 0.75 18 6,570 hours 0.4 497 g/hp-hr 113.80 1.37 498.43
246C Skid Steer Loader 2 73 0.75 18 6,570 hours 0.3 497 g/hp-hr 36.01 0.43 157.74
RH200/340 O & K Shovel / Hitachi EX5500 1 2,520 0.75 18 6,570 hours 0.59 497 g/hp-hr 1,222.50 14.67 5,354.57
Off-Road Tire Handling Truck 1 450 0.75 18 6,570 hours 0.43 497 g/hp-hr 159.10 1.91 696.87
Contractor Haul Trucks, 25 tons 2 511 0.75 18 6,570 hours 0.43 497 g/hp-hr 361.34 4.34 1,582.67
Motivator for Mine Shovels 1 3,308 0.91 22 8,000 hours 0.43 497 g/hp-hr 1,424.15 17.09 6,237.78
Storm Water Pond Pump 1 200 1.00 24 500 hours 1 497 g/hp-hr 219.26 2.63 54.82
Mine Pit Dewatering Pump 4 100 1.00 24 500 hours 1 497 g/hp-hr 438.53 5.26 109.63
Copper Concentrate Shipment Vehicles -- 450 1.00 19 6,795 hours 0.43 497 g/hp-hr 212.14 1.97 720.72
Rosemont Copper ProjectEmission Inventory Information JBR ENVIRONMENTAL CONSULTANTS, INC.
November 2011Page H216
AZRP00398

Hourly Daily Annual 99% Conversion(g/hp-hr) Units lb/hr tpd tpy
Table H.55 CO2 Emissions from Fuel Burning Mobile Engines - Year 10
Fuel Burning Mobile Engine Description a
Fleet Size
HP Rating
Load Factor
CO2 Emission Factor CO2 Emissions - Year 10Process Rates b - Year 10
Units
Molybdenum Concentrate Shipment Vehicles -- 450 1.00 1 86 hours 0.43 497 g/hp-hr 212.14 0.11 9.10
Sulfuric Acid Delivery Vehicles -- 450 1.00 6 2,081 hours 0.43 497 g/hp-hr 212.14 0.60 220.71
Lime Delivery Vehicles -- 450 1.00 2 763 hours 0.43 497 g/hp-hr 212.14 0.22 80.92
SAG Mill and Ball Mill Grinding Balls Delivery Vehicles -- 450 1.00 1 234 hours 0.43 497 g/hp-hr 212.14 0.11 24.86
Diesel Fuel Delivery Vehicles -- 500 1.00 2 685 hours 0.43 497 g/hp-hr 235.71 0.22 80.78
Copper Cathode Shipment Vehicles -- 450 1.00 1 200 hours 0.43 497 g/hp-hr 212.14 0.11 21.20
Ammonium Nitrate Delivery Vehicles -- 450 1.00 1 255 hours 0.43 497 g/hp-hr 212.14 0.11 27.09
Miscellaneous Consumables Delivery Vehicles -- 450 1.00 1 499 hours 0.43 497 g/hp-hr 212.14 0.15 52.98
Miscellaneous Fuels and Lubricants Delivery Vehicles -- 450 1.00 1 44 hours 0.43 497 g/hp-hr 212.14 0.11 4.71
Pickup Trucks (gasoline) 20 350 0.25 6 2,190 hours 0.54 1.08 lb/hp-hr 51.03 0.61 223.51
Crew Van (gasoline) 3 350 0.25 6 2,190 hours 0.54 1.08 lb/hp-hr 51.03 0.61 223.51
Lot Pick-Up Trucks (gasoline) 20 250 0.25 6 2,190 hours 0.54 1.08 lb/hp-hr 36.45 0.44 159.65
28,820.00 345.84 95,105.99
18,201.00 196.37 68,179.51
47,021.00 542.21 163,285.50
a Fuel burning mobile engines are diesel fuel fired unless otherwise noted.
b Except for the shipment and delivery vehicles, the process rates are for a single mobile engine. The process rates for the shipment and delivery vehicles are representative of the entire fleet.
Total Emissions from All Mobile Engines:
Total Emissions from Haul Truck Engines:
Total Emissions from Other Mobile Engines:
Rosemont Copper ProjectEmission Inventory Information JBR ENVIRONMENTAL CONSULTANTS, INC.
November 2011Page H217
AZRP00399

Hourly Daily Annual 2% Sulfur Conversion - Year 10 Units lb/hr tpd tpy
Haulage Trucks, 250 tons 31 2,650 1.00 24 6,600 hours 0.32 0.00003 g/hp-hr 0.006 0.00007 0.02
Crawler Dozers, D11T Class 3 850 0.46 11 4,000 hours 0.575 0.00005 g/hp-hr 0.0001 0.000002 0.0006
Crawler Dozers, D10T Class 3 580 0.70 17 6,090 hours 0.575 0.00003 g/hp-hr 0.00009 0.000001 0.0004
Crawler Dozer, D8T Class 1 310 0.75 18 6,570 hours 0.575 0.00003 g/hp-hr 0.00002 0.0000002 0.00007
Rubber Tired Dozers, 834H Class 3 498 0.70 17 6,175 hours 0.575 0.00003 g/hp-hr 0.00008 0.000001 0.0004
Motor Graders, 24M Class 1 533 0.68 16 6,000 hours 0.575 0.00004 g/hp-hr 0.00003 0.0000003 0.0001
Motor Graders, 16M Class 3 297 0.46 11 4,000 hours 0.575 0.00005 g/hp-hr 0.00005 0.0000006 0.0002
Water Trucks, 30,000 gallons 4 1,348 0.45 11 3,250 hours 0.35 0.00007 g/hp-hr 0.0003 0.000004 0.001
Diesel Blasthole Drill, 12.25 inches 2 1,500 0.75 18 6,570 hours 0.43 0.00003 g/hp-hr 0.0002 0.000002 0.0007
Hydraulic DML 45 Drill 1 425 0.75 18 6,570 hours 0.43 0.00003 g/hp-hr 0.00002 0.0000003 0.0001
Front End Loaders 2 2,000 0.90 22 7,884 hours 0.59 0.00003 g/hp-hr 0.0002 0.000003 0.0009
Stemming Truck 2 450 0.75 18 6,570 hours 0.43 0.00003 g/hp-hr 0.00005 0.0000006 0.0002
ANFO/Slurry Truck, 20 tons 2 450 0.75 18 6,570 hours 0.43 0.00003 g/hp-hr 0.00005 0.0000006 0.0002
Powder Truck, 2 tons 2 350 0.75 18 6,570 hours 0.43 0.00003 g/hp-hr 0.00004 0.0000005 0.0002
Front End Loaders, 8 yd3 2 262 0.75 18 6,570 hours 0.575 0.00003 g/hp-hr 0.00003 0.0000003 0.0001
Hydraulic Excavator, 385 Cat CL 2 513 0.90 22 7,884 hours 0.35 0.00003 g/hp-hr 0.00005 0.0000007 0.0002
Backhoe/Loader, 2 yd3 1 124 0.75 18 6,570 hours 0.35 0.00003 g/hp-hr 0.000007 0.00000008 0.00003
Table H.56 SO4 Emissions from Fuel Burning Mobile Engines (Diesel Engines Only) - Year 10
SO4 Emissions - Year 10Fuel Burning Mobile Engine Description a
Fleet Size
HP Rating
Process Rates b - Year 10
Units Load Factor
SO4 Emission Factor
Rosemont Copper ProjectEmission Inventory Information JBR ENVIRONMENTAL CONSULTANTS, INC.
November 2011Page H218
AZRP00400
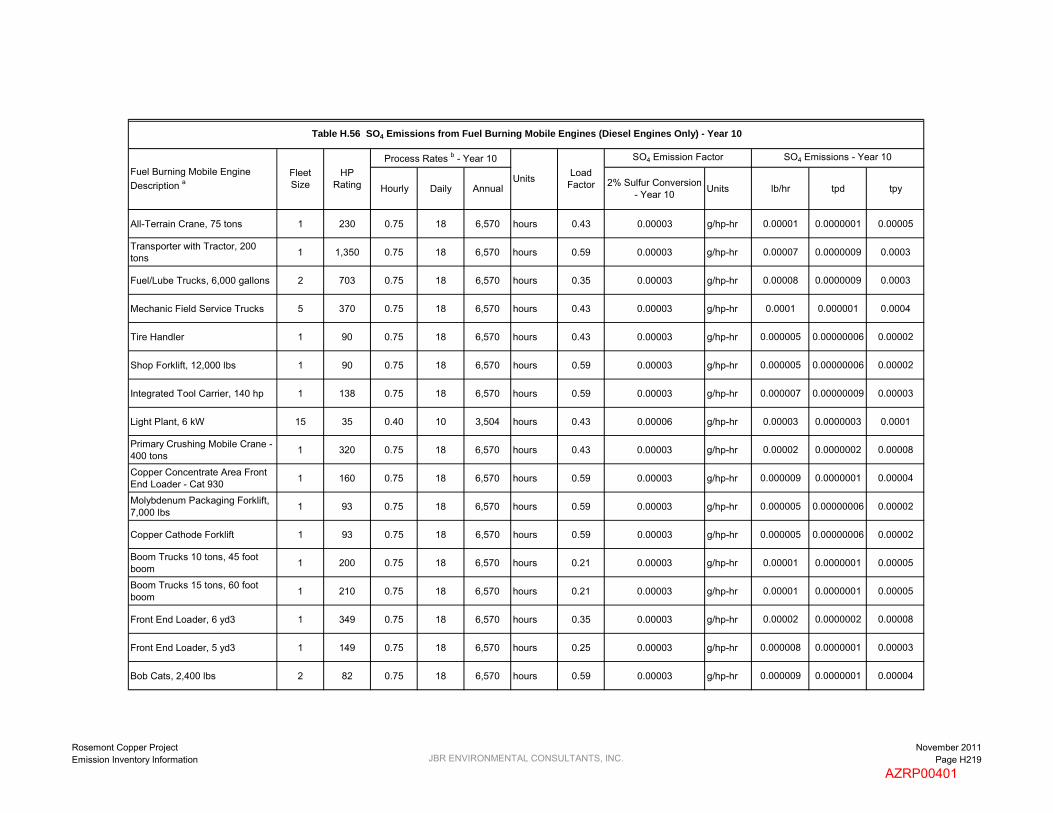
Hourly Daily Annual 2% Sulfur Conversion - Year 10 Units lb/hr tpd tpy
Table H.56 SO4 Emissions from Fuel Burning Mobile Engines (Diesel Engines Only) - Year 10
SO4 Emissions - Year 10Fuel Burning Mobile Engine Description a
Fleet Size
HP Rating
Process Rates b - Year 10
Units Load Factor
SO4 Emission Factor
All-Terrain Crane, 75 tons 1 230 0.75 18 6,570 hours 0.43 0.00003 g/hp-hr 0.00001 0.0000001 0.00005
Transporter with Tractor, 200 tons 1 1,350 0.75 18 6,570 hours 0.59 0.00003 g/hp-hr 0.00007 0.0000009 0.0003
Fuel/Lube Trucks, 6,000 gallons 2 703 0.75 18 6,570 hours 0.35 0.00003 g/hp-hr 0.00008 0.0000009 0.0003
Mechanic Field Service Trucks 5 370 0.75 18 6,570 hours 0.43 0.00003 g/hp-hr 0.0001 0.000001 0.0004
Tire Handler 1 90 0.75 18 6,570 hours 0.43 0.00003 g/hp-hr 0.000005 0.00000006 0.00002
Shop Forklift, 12,000 lbs 1 90 0.75 18 6,570 hours 0.59 0.00003 g/hp-hr 0.000005 0.00000006 0.00002
Integrated Tool Carrier, 140 hp 1 138 0.75 18 6,570 hours 0.59 0.00003 g/hp-hr 0.000007 0.00000009 0.00003
Light Plant, 6 kW 15 35 0.40 10 3,504 hours 0.43 0.00006 g/hp-hr 0.00003 0.0000003 0.0001
Primary Crushing Mobile Crane - 400 tons 1 320 0.75 18 6,570 hours 0.43 0.00003 g/hp-hr 0.00002 0.0000002 0.00008
Copper Concentrate Area Front End Loader - Cat 930 1 160 0.75 18 6,570 hours 0.59 0.00003 g/hp-hr 0.000009 0.0000001 0.00004
Molybdenum Packaging Forklift, 7,000 lbs 1 93 0.75 18 6,570 hours 0.59 0.00003 g/hp-hr 0.000005 0.00000006 0.00002
Copper Cathode Forklift 1 93 0.75 18 6,570 hours 0.59 0.00003 g/hp-hr 0.000005 0.00000006 0.00002
Boom Trucks 10 tons, 45 foot boom 1 200 0.75 18 6,570 hours 0.21 0.00003 g/hp-hr 0.00001 0.0000001 0.00005
Boom Trucks 15 tons, 60 foot boom 1 210 0.75 18 6,570 hours 0.21 0.00003 g/hp-hr 0.00001 0.0000001 0.00005
Front End Loader, 6 yd3 1 349 0.75 18 6,570 hours 0.35 0.00003 g/hp-hr 0.00002 0.0000002 0.00008
Front End Loader, 5 yd3 1 149 0.75 18 6,570 hours 0.25 0.00003 g/hp-hr 0.000008 0.0000001 0.00003
Bob Cats, 2,400 lbs 2 82 0.75 18 6,570 hours 0.59 0.00003 g/hp-hr 0.000009 0.0000001 0.00004
Rosemont Copper ProjectEmission Inventory Information JBR ENVIRONMENTAL CONSULTANTS, INC.
November 2011Page H219
AZRP00401
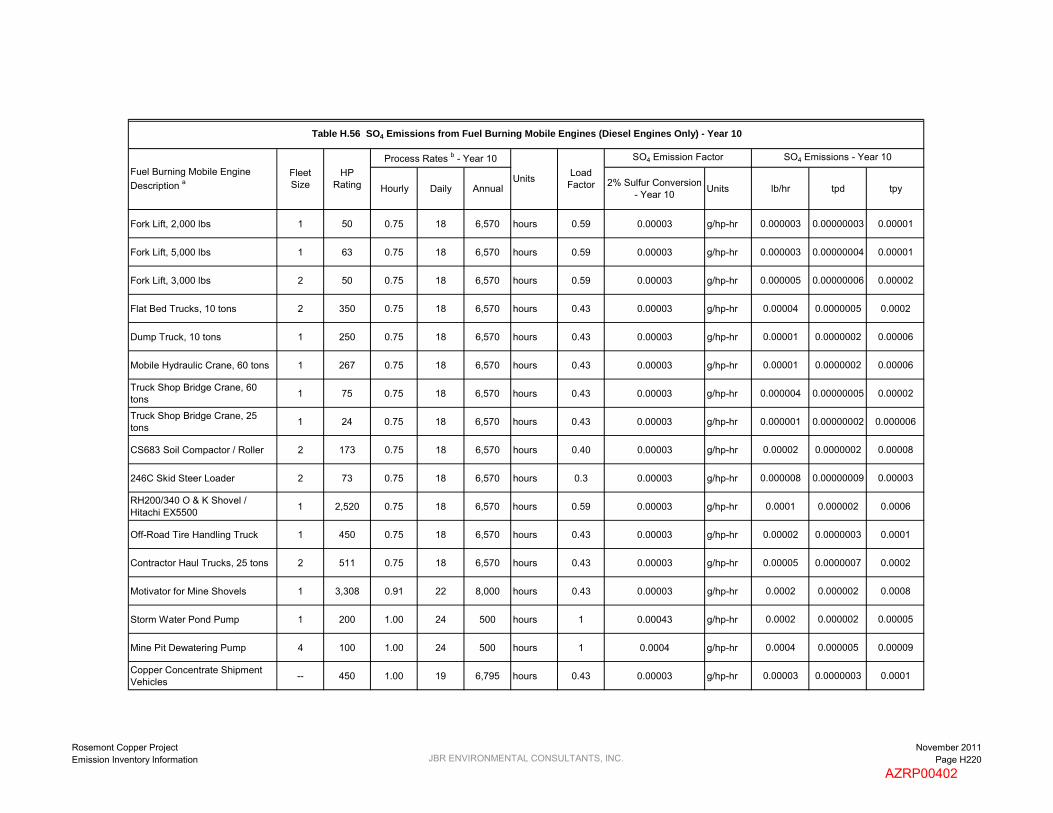
Hourly Daily Annual 2% Sulfur Conversion - Year 10 Units lb/hr tpd tpy
Table H.56 SO4 Emissions from Fuel Burning Mobile Engines (Diesel Engines Only) - Year 10
SO4 Emissions - Year 10Fuel Burning Mobile Engine Description a
Fleet Size
HP Rating
Process Rates b - Year 10
Units Load Factor
SO4 Emission Factor
Fork Lift, 2,000 lbs 1 50 0.75 18 6,570 hours 0.59 0.00003 g/hp-hr 0.000003 0.00000003 0.00001
Fork Lift, 5,000 lbs 1 63 0.75 18 6,570 hours 0.59 0.00003 g/hp-hr 0.000003 0.00000004 0.00001
Fork Lift, 3,000 lbs 2 50 0.75 18 6,570 hours 0.59 0.00003 g/hp-hr 0.000005 0.00000006 0.00002
Flat Bed Trucks, 10 tons 2 350 0.75 18 6,570 hours 0.43 0.00003 g/hp-hr 0.00004 0.0000005 0.0002
Dump Truck, 10 tons 1 250 0.75 18 6,570 hours 0.43 0.00003 g/hp-hr 0.00001 0.0000002 0.00006
Mobile Hydraulic Crane, 60 tons 1 267 0.75 18 6,570 hours 0.43 0.00003 g/hp-hr 0.00001 0.0000002 0.00006
Truck Shop Bridge Crane, 60 tons 1 75 0.75 18 6,570 hours 0.43 0.00003 g/hp-hr 0.000004 0.00000005 0.00002
Truck Shop Bridge Crane, 25 tons 1 24 0.75 18 6,570 hours 0.43 0.00003 g/hp-hr 0.000001 0.00000002 0.000006
CS683 Soil Compactor / Roller 2 173 0.75 18 6,570 hours 0.40 0.00003 g/hp-hr 0.00002 0.0000002 0.00008
246C Skid Steer Loader 2 73 0.75 18 6,570 hours 0.3 0.00003 g/hp-hr 0.000008 0.00000009 0.00003
RH200/340 O & K Shovel / Hitachi EX5500 1 2,520 0.75 18 6,570 hours 0.59 0.00003 g/hp-hr 0.0001 0.000002 0.0006
Off-Road Tire Handling Truck 1 450 0.75 18 6,570 hours 0.43 0.00003 g/hp-hr 0.00002 0.0000003 0.0001
Contractor Haul Trucks, 25 tons 2 511 0.75 18 6,570 hours 0.43 0.00003 g/hp-hr 0.00005 0.0000007 0.0002
Motivator for Mine Shovels 1 3,308 0.91 22 8,000 hours 0.43 0.00003 g/hp-hr 0.0002 0.000002 0.0008
Storm Water Pond Pump 1 200 1.00 24 500 hours 1 0.00043 g/hp-hr 0.0002 0.000002 0.00005
Mine Pit Dewatering Pump 4 100 1.00 24 500 hours 1 0.0004 g/hp-hr 0.0004 0.000005 0.00009
Copper Concentrate Shipment Vehicles -- 450 1.00 19 6,795 hours 0.43 0.00003 g/hp-hr 0.00003 0.0000003 0.0001
Rosemont Copper ProjectEmission Inventory Information JBR ENVIRONMENTAL CONSULTANTS, INC.
November 2011Page H220
AZRP00402

Hourly Daily Annual 2% Sulfur Conversion - Year 10 Units lb/hr tpd tpy
Table H.56 SO4 Emissions from Fuel Burning Mobile Engines (Diesel Engines Only) - Year 10
SO4 Emissions - Year 10Fuel Burning Mobile Engine Description a
Fleet Size
HP Rating
Process Rates b - Year 10
Units Load Factor
SO4 Emission Factor
Molybdenum Concentrate Shipment Vehicles -- 450 1.00 1 86 hours 0.43 0.002 g/hp-hr 0.002 0.000001 0.0001
Sulfuric Acid Delivery Vehicles -- 450 1.00 6 2,081 hours 0.43 0.0001 g/hp-hr 0.0001 0.0000003 0.0001
Lime Delivery Vehicles -- 450 1.00 2 763 hours 0.43 0.0003 g/hp-hr 0.0003 0.0000003 0.0001
SAG Mill and Ball Mill Grinding Balls Delivery Vehicles -- 450 1.00 1 234 hours 0.43 0.0009 g/hp-hr 0.0009 0.0000005 0.0001
Diesel Fuel Delivery Vehicles -- 500 1.00 2 685 hours 0.43 0.0003 g/hp-hr 0.0003 0.0000003 0.0001
Copper Cathode Shipment Vehicles -- 450 1.00 1 200 hours 0.43 0.001 g/hp-hr 0.001 0.0000005 0.0001
Ammonium Nitrate Delivery Vehicles -- 450 1.00 1 255 hours 0.43 0.0008 g/hp-hr 0.0008 0.0000004 0.0001
Miscellaneous Consumables Delivery Vehicles -- 450 1.00 1 499 hours 0.43 0.0004 g/hp-hr 0.0004 0.0000003 0.0001
Miscellaneous Fuels and Lubricants Delivery Vehicles -- 450 1.00 1 44 hours 0.43 0.005 g/hp-hr 0.005 0.000002 0.0001
Pickup Trucks (gasoline) 20 350 0.25 6 2,190 hours 0.54 -- -- -- -- --
Crew Van (gasoline) 3 350 0.25 6 2,190 hours 0.54 -- -- -- -- --
Lot Pick-Up Trucks (gasoline) 20 250 0.25 6 2,190 hours 0.54 -- -- -- -- --
0.006 0.00007 0.02
0.01 0.00004 0.01
0.02 0.0001 0.03
a Fuel burning mobile engines are diesel fuel fired unless otherwise noted.
b Except for the shipment and delivery vehicles, the process rates are for a single mobile engine. The process rates for the shipment and delivery vehicles are representative of the entire fleet.
Total Emissions from All Mobile Engines:
Total Emissions from Haul Truck Engines:
Total Emissions from Other Mobile Engines:
Rosemont Copper ProjectEmission Inventory Information JBR ENVIRONMENTAL CONSULTANTS, INC.
November 2011Page H221
AZRP00403

Hourly Daily Annual lb/hr tpd tpy lb/hr tpd tpy
Haulage Trucks, 250 tons 31 2,650 1.00 24 6,600 hours 0.24 2.08 0.03 6.88 6.60 0.08 21.79
Crawler Dozers, D11T Class 3 850 0.46 11 4,000 hours 0.24 0.01 0.0001 0.05 0.03 0.0004 0.15
Crawler Dozers, D10T Class 3 580 0.70 17 6,090 hours 0.24 0.004 0.00004 0.02 0.01 0.0001 0.05
Crawler Dozer, D8T Class 1 310 0.75 18 6,570 hours 0.24 0.0007 0.000008 0.003 0.002 0.00003 0.010
Rubber Tired Dozers, 834H Class 3 498 0.70 17 6,175 hours 0.24 0.003 0.00004 0.01 0.01 0.0001 0.04
Motor Graders, 24M Class 1 533 0.68 16 6,000 hours 0.24 0.001 0.00001 0.005 0.003 0.00004 0.02
Motor Graders, 16M Class 3 297 0.46 11 4,000 hours 0.24 0.001 0.00001 0.005 0.004 0.00005 0.02
Water Trucks, 30,000 gallons 4 1,348 0.45 11 3,250 hours 0.24 0.01 0.0002 0.05 0.04 0.0005 0.15
Diesel Blasthole Drill, 12.25 inches 2 1,500 0.75 18 6,570 hours 0.24 0.02 0.0002 0.067 0.05 0.0006 0.21
Hydraulic DML 45 Drill 1 425 0.75 18 6,570 hours 0.24 0.0007 0.000009 0.003 0.002 0.00003 0.01
Front End Loaders 2 2,000 0.90 22 7,884 hours 0.24 0.17 0.002 0.74 0.53 0.006 2.34
Stemming Truck 2 450 0.75 18 6,570 hours 0.24 0.002 0.00002 0.007 0.005 0.00006 0.02
ANFO/Slurry Truck, 20 tons 2 450 0.75 18 6,570 hours 0.24 0.002 0.00002 0.007 0.005 0.00006 0.02
Powder Truck, 2 tons 2 350 0.75 18 6,570 hours 0.44 0.002 0.00003 0.01 0.003 0.00003 0.01
Front End Loaders, 8 yd3 2 262 0.75 18 6,570 hours 0.24 0.001 0.00001 0.005 0.004 0.00005 0.02
Hydraulic Excavator, 385 Cat CL 2 513 0.90 22 7,884 hours 0.24 0.002 0.00002 0.007 0.005 0.00006 0.02
Backhoe/Loader, 2 yd3 1 124 0.75 18 6,570 hours 0.44 0.0003 0.000004 0.001 0.0004 0.000005 0.002
Table H.57 Soot (Elemental Carbon) Emissions from Fuel Burning Mobile Engines (Diesel Engines Only) - Year 10
Fuel Burning Mobile Engine Description a
Fleet Size
HP Rating
Process Rates b - Year 10
UnitsOrganic Carbon Fraction
Organic Carbon Emissions - Year 10 Soot Emissions - Year 10
Rosemont Copper ProjectEmission Inventory Information JBR ENVIRONMENTAL CONSULTANTS, INC.
November 2011Page H222
AZRP00404

Hourly Daily Annual lb/hr tpd tpy lb/hr tpd tpy
Table H.57 Soot (Elemental Carbon) Emissions from Fuel Burning Mobile Engines (Diesel Engines Only) - Year 10
Fuel Burning Mobile Engine Description a
Fleet Size
HP Rating
Process Rates b - Year 10
UnitsOrganic Carbon Fraction
Organic Carbon Emissions - Year 10 Soot Emissions - Year 10
All-Terrain Crane, 75 tons 1 230 0.75 18 6,570 hours 0.24 0.0004 0.000005 0.002 0.001 0.00001 0.005
Transporter with Tractor, 200 tons 1 1,350 0.75 18 6,570 hours 0.24 0.009 0.0001 0.041 0.03 0.0004 0.13
Fuel/Lube Trucks, 6,000 gallons 2 703 0.75 18 6,570 hours 0.24 0.002 0.00002 0.008 0.006 0.00007 0.03
Mechanic Field Service Trucks 5 370 0.75 18 6,570 hours 0.44 0.002 0.00002 0.008 0.002 0.00003 0.01
Tire Handler 1 90 0.75 18 6,570 hours 0.51 0.00002 0.0000003 0.0001 0.00002 0.0000003 0.0001
Shop Forklift, 12,000 lbs 1 90 0.75 18 6,570 hours 0.51 0.0004 0.000005 0.002 0.0004 0.000005 0.002
Integrated Tool Carrier, 140 hp 1 138 0.75 18 6,570 hours 0.44 0.0006 0.000007 0.003 0.0007 0.000009 0.003
Light Plant, 6 kW 15 35 0.40 10 3,504 hours 0.5 0.002 0.00002 0.009 0.002 0.00002 0.009
Primary Crushing Mobile Crane - 400 tons 1 320 0.75 18 6,570 hours 0.24 0.0005 0.000007 0.002 0.002 0.00002 0.008
Copper Concentrate Area Front End Loader - Cat 930 1 160 0.75 18 6,570 hours 0.44 0.0007 0.000008 0.003 0.0009 0.00001 0.004
Molybdenum Packaging Forklift, 7,000 lbs 1 93 0.75 18 6,570 hours 0.51 0.0005 0.000005 0.002 0.0004 0.000005 0.002
Copper Cathode Forklift 1 93 0.75 18 6,570 hours 0.44 0.0004 0.000005 0.002 0.0005 0.000006 0.002
Boom Trucks 10 tons, 45 foot boom 1 200 0.75 18 6,570 hours 0.44 0.0003 0.000004 0.001 0.0004 0.000005 0.002
Boom Trucks 15 tons, 60 foot boom 1 210 0.75 18 6,570 hours 0.44 0.0003 0.000004 0.001 0.0004 0.000005 0.002
Front End Loader, 6 yd3 1 349 0.75 18 6,570 hours 0.24 0.0005 0.000006 0.002 0.002 0.00002 0.007
Front End Loader, 5 yd3 1 149 0.75 18 6,570 hours 0.44 0.0003 0.000003 0.001 0.0003 0.000004 0.001
Bob Cats, 2,400 lbs 2 82 0.75 18 6,570 hours 0.5 0.0008 0.00001 0.003 0.0008 0.00001 0.003
Rosemont Copper ProjectEmission Inventory Information JBR ENVIRONMENTAL CONSULTANTS, INC.
November 2011Page H223
AZRP00405
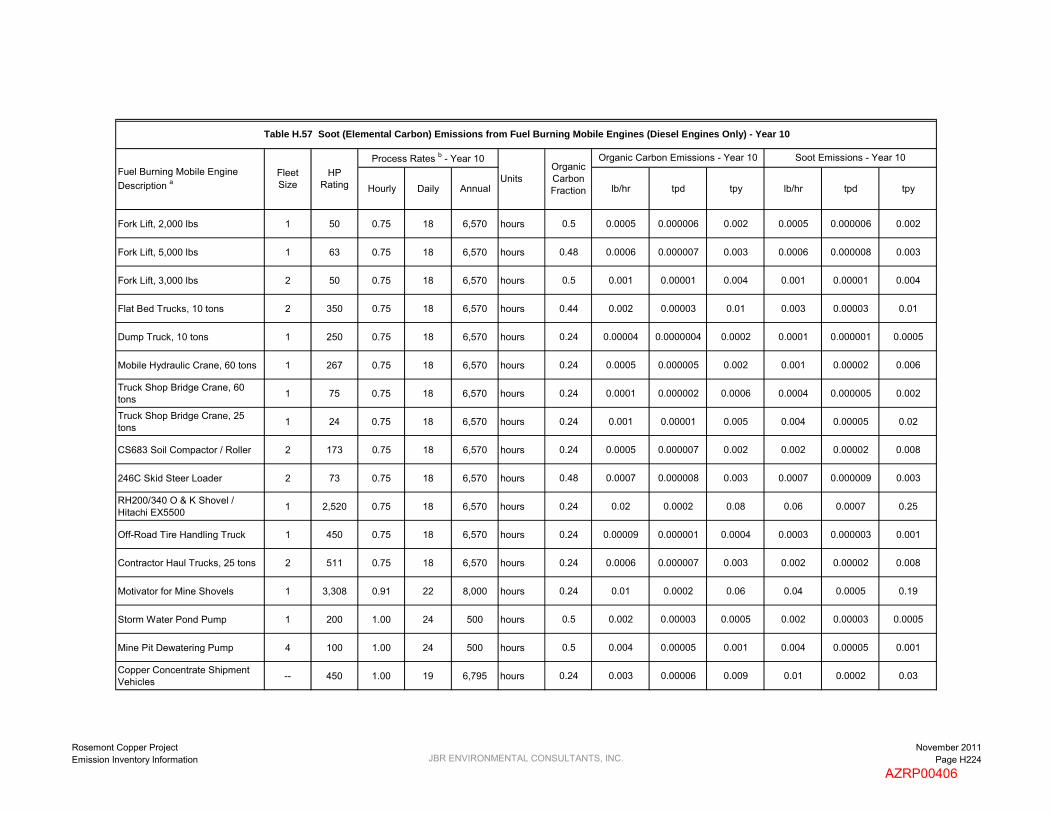
Hourly Daily Annual lb/hr tpd tpy lb/hr tpd tpy
Table H.57 Soot (Elemental Carbon) Emissions from Fuel Burning Mobile Engines (Diesel Engines Only) - Year 10
Fuel Burning Mobile Engine Description a
Fleet Size
HP Rating
Process Rates b - Year 10
UnitsOrganic Carbon Fraction
Organic Carbon Emissions - Year 10 Soot Emissions - Year 10
Fork Lift, 2,000 lbs 1 50 0.75 18 6,570 hours 0.5 0.0005 0.000006 0.002 0.0005 0.000006 0.002
Fork Lift, 5,000 lbs 1 63 0.75 18 6,570 hours 0.48 0.0006 0.000007 0.003 0.0006 0.000008 0.003
Fork Lift, 3,000 lbs 2 50 0.75 18 6,570 hours 0.5 0.001 0.00001 0.004 0.001 0.00001 0.004
Flat Bed Trucks, 10 tons 2 350 0.75 18 6,570 hours 0.44 0.002 0.00003 0.01 0.003 0.00003 0.01
Dump Truck, 10 tons 1 250 0.75 18 6,570 hours 0.24 0.00004 0.0000004 0.0002 0.0001 0.000001 0.0005
Mobile Hydraulic Crane, 60 tons 1 267 0.75 18 6,570 hours 0.24 0.0005 0.000005 0.002 0.001 0.00002 0.006
Truck Shop Bridge Crane, 60 tons 1 75 0.75 18 6,570 hours 0.24 0.0001 0.000002 0.0006 0.0004 0.000005 0.002
Truck Shop Bridge Crane, 25 tons 1 24 0.75 18 6,570 hours 0.24 0.001 0.00001 0.005 0.004 0.00005 0.02
CS683 Soil Compactor / Roller 2 173 0.75 18 6,570 hours 0.24 0.0005 0.000007 0.002 0.002 0.00002 0.008
246C Skid Steer Loader 2 73 0.75 18 6,570 hours 0.48 0.0007 0.000008 0.003 0.0007 0.000009 0.003
RH200/340 O & K Shovel / Hitachi EX5500 1 2,520 0.75 18 6,570 hours 0.24 0.02 0.0002 0.08 0.06 0.0007 0.25
Off-Road Tire Handling Truck 1 450 0.75 18 6,570 hours 0.24 0.00009 0.000001 0.0004 0.0003 0.000003 0.001
Contractor Haul Trucks, 25 tons 2 511 0.75 18 6,570 hours 0.24 0.0006 0.000007 0.003 0.002 0.00002 0.008
Motivator for Mine Shovels 1 3,308 0.91 22 8,000 hours 0.24 0.01 0.0002 0.06 0.04 0.0005 0.19
Storm Water Pond Pump 1 200 1.00 24 500 hours 0.5 0.002 0.00003 0.0005 0.002 0.00003 0.0005
Mine Pit Dewatering Pump 4 100 1.00 24 500 hours 0.5 0.004 0.00005 0.001 0.004 0.00005 0.001
Copper Concentrate Shipment Vehicles -- 450 1.00 19 6,795 hours 0.24 0.003 0.00006 0.009 0.01 0.0002 0.03
Rosemont Copper ProjectEmission Inventory Information JBR ENVIRONMENTAL CONSULTANTS, INC.
November 2011Page H224
AZRP00406

Hourly Daily Annual lb/hr tpd tpy lb/hr tpd tpy
Table H.57 Soot (Elemental Carbon) Emissions from Fuel Burning Mobile Engines (Diesel Engines Only) - Year 10
Fuel Burning Mobile Engine Description a
Fleet Size
HP Rating
Process Rates b - Year 10
UnitsOrganic Carbon Fraction
Organic Carbon Emissions - Year 10 Soot Emissions - Year 10
Molybdenum Concentrate Shipment Vehicles -- 450 1.00 1 86 hours 0.24 0.0002 0.0000006 0.00009 0.0008 0.000002 0.0003
Sulfuric Acid Delivery Vehicles -- 450 1.00 6 2,081 hours 0.24 0.002 0.000008 0.003 0.008 0.00003 0.009
Lime Delivery Vehicles -- 450 1.00 2 763 hours 0.24 0.002 0.000003 0.001 0.005 0.000009 0.003
SAG Mill and Ball Mill Grinding Balls Delivery Vehicles -- 450 1.00 1 234 hours 0.24 0.001 0.000001 0.0003 0.005 0.000004 0.001
Diesel Fuel Delivery Vehicles -- 500 1.00 2 685 hours 0.24 0.002 0.000003 0.0009 0.005 0.000008 0.003
Copper Cathode Shipment Vehicles -- 450 1.00 1 200 hours 0.24 0.001 0.000002 0.0003 0.004 0.000007 0.0008
Ammonium Nitrate Delivery Vehicles -- 450 1.00 1 255 hours 0.44 0.001 0.000002 0.0006 0.001 0.000003 0.0008
Miscellaneous Consumables Delivery Vehicles -- 450 1.00 1 499 hours 0.44 0.001 0.000005 0.001 0.002 0.000006 0.002
Miscellaneous Fuels and Lubricants Delivery Vehicles -- 450 1.00 1 44 hours 0.44 0.00 0.00 0.00 0.00 0.00 0.00
Pickup Trucks (gasoline) 20 350 0.25 6 2,190 hours -- -- -- -- -- -- --
Crew Van (gasoline) 3 350 0.25 6 2,190 hours -- -- -- -- -- -- --
Lot Pick-Up Trucks (gasoline) 20 250 0.25 6 2,190 hours -- -- -- -- -- -- --
6.60 0.08 21.79
0.92 0.01 3.86
7.53 0.09 25.65
a Fuel burning mobile engines are diesel fuel fired unless otherwise noted.
b Except for the shipment and delivery vehicles, the process rates are for a single mobile engine. The process rates for the shipment and delivery vehicles are representative of the entire fleet.
Total Emissions from Haul Truck Engines:
Total Emissions from Other Mobile Engines:
Total Emissions from All Mobile Engines:
Rosemont Copper ProjectEmission Inventory Information JBR ENVIRONMENTAL CONSULTANTS, INC.
November 2011Page H225
AZRP00407

Rosemont Copper Project November 2011 Emission Inventory Information Page H226
JBR ENVIRONMENTAL CONSULTANTS, INC.
YEAR 15
AZRP00408

PM/TSP PM10 PM2.5 Unitsk
(PM/TSP)
k (PM10) k (PM2.5) A (ft2) U (mph) M (%) W (tons) s (%) S (mph) P (days/yr)a
(PM/TSP)
a (PM10) a (PM2.5)b
(PM/TSP)
b (PM10) b (PM2.5) u* ut* e f (%) PE
Drilling Drilling 3-05-020-10 1.30 0.43 0.08 lb/hole holes 1 0.33 0.06 AP-42, Section 11.9, Table11.9-4 (10/98)
Blast Blasting 3-05-020-09 328.26 170.69 9.85 lb/blast blasts 1 0.52 0.03 81,920 AP-42, Section 11.9, Table11.9-1 (10/98)
Loading Loading 3-03-024-08 0.0007 0.0003 0.00005 lb/ton tons 0.74 0.35 0.053 4.14 4 AP-42, Section 13.2.4,Expression 1 (11/06)
HaulingHD Haul Trucks - Hourly/Daily 3-05-020-11 21.25 5.46 0.55 lb/VMT VMT 4.9 1.5 0.15 305 5.0 0.7 0.9 0.9 0.45 0.45 0.45 AP-42, Section 13.2.2,Expression 1a (11/06)
HaulingA Haul Trucks - Annual 3-05-020-11 17.70 4.55 0.45 lb/VMT VMT 4.9 1.5 0.15 305 5.0 61 0.7 0.9 0.9 0.45 0.45 0.45 AP-42, Section 13.2.2,Expressions 1a and 2 (11/06)
Bldzrs Bulldozers 3-05-010-99 2.82 0.43 0.30 lb/hr hrs 5.7 0.75 0.60 4 2.5 1.2 1.5 1.2 1.3 1.4 1.3 AP-42, Section 11.9, Table11.9-1 (10/98)
SupVehY15H Support Vehicular Traffic - Year 15 Hourly 3-05-010-99 6.96 1.79 0.18 lb/VMT VMT 4.9 1.5 0.15 25.5 5.0 0.7 0.9 0.9 0.45 0.45 0.45 AP-42, Section 13.2.2,
Expression 1a (11/06)
SupVehY15D Support Vehicular Traffic - Year 15 Daily 3-05-010-99 7.19 1.85 0.18 lb/VMT VMT 4.9 1.5 0.15 27.4 5.0 0.7 0.9 0.9 0.45 0.45 0.45 AP-42, Section 13.2.2,
Expression 1a (11/06)
SupVehY15A Support Vehicular Traffic - Year 15 Annual 3-05-010-99 6.06 1.56 0.16 lb/VMT VMT 4.9 1.5 0.15 28.2 5.0 61 0.7 0.9 0.9 0.45 0.45 0.45 AP-42, Section 13.2.2,
Expressions 1a and 2 (11/06)
WtrTrksHD Water Trucks - Hourly/Daily 3-05-010-99 17.06 4.38 0.44 lb/VMT VMT 4.9 1.5 0.15 187.4 5.0 0.7 0.9 0.9 0.45 0.45 0.45 AP-42, Section 13.2.2,Expression 1a (11/06)
WtrTrksA Water Trucks - Annual 3-05-010-99 14.21 3.65 0.37 lb/VMT VMT 4.9 1.5 0.15 187.4 5.0 61 0.7 0.9 0.9 0.45 0.45 0.45 AP-42, Section 13.2.2,Expressions 1a and 2 (11/06)
GradersY15 Graders - Year 15 3-05-010-99 2.05 0.71 0.06 lb/VMT VMT 1 0.60 0.031 4.83 0.040 0.051 0.040 2.5 2.0 2.5 AP-42, Section 11.9, Table11.9-1 (10/98)
TrMlyCncPrt Molybdnum Concentrate Transfer(Protected) 3-03-024-08 0.00002 0.00001 0.000002 lb/ton tons 0.74 0.35 0.053 1.3 15 AP-42, Section 13.2.4,
Expression 1 (11/06)
DTrMlyCncPrt Dried Molybdenum Concentrate Transfer (Protected) 3-03-024-08 0.00004 0.00002 0.000003 lb/ton tons 0.74 0.35 0.053 1.3 10 AP-42, Section 13.2.4,
Expression 1 (11/06)
DTrMlyCnc Dried Molybdenum Concentrate Transfer (Unprotected) 3-03-024-08 0.0003 0.0002 0.00002 lb/ton tons 0.74 0.35 0.053 6.21 10 AP-42, Section 13.2.4,
Expression 1 (11/06)
TrCuCncPrt Copper Concentrate Transfer (Protected) 3-03-024-08 0.00004 0.00002 0.000003 lb/ton tons 0.74 0.35 0.053 1.3 10 AP-42, Section 13.2.4,
Expression 1 (11/06)
TrCuCnc Copper Concentrate Loadout 3-03-024-08 0.0003 0.0002 0.00002 lb/ton tons 0.74 0.35 0.053 6.21 10 AP-42, Section 13.2.4,Expression 1 (11/06)
FiltTailPrt Filtered Tailings Transfer (Protected) 3-03-024-08 0.00002 0.00001 0.000002 lb/ton tons 0.74 0.35 0.053 1.3 15 AP-42, Section 13.2.4,
Expression 1 (11/06)
FiltTail Filtered Tailings Transfer (Unprotected) 3-03-024-08 0.0002 0.00009 0.00001 lb/ton tons 0.74 0.35 0.053 6.21 15 AP-42, Section 13.2.4,
Expression 1 (11/06)
CrushP Primary Crushing - High Moisture Ore 3-03-024-05 0.02 0.009 0.002 lb/ton tons 0.185
AP-42, Section 11.24, Table11.24-2 (08/82) and 11.19.2-2 (08/04)
CrushS Secondary Crushing - High Moisture Ore 3-03-024-06 0.05 0.02 0.004 lb/ton tons 0.185
AP-42, Section 11.24, Table11.24-2 (08/82) and 11.19.2-2 (08/04)
CrushT Tertiary Crushing - High Moisture Ore 3-03-024-07 0.06 0.02 0.004 lb/ton tons 0.185
AP-42, Section 11.24, Table11.24-2 (08/82) and 11.19.2-2(08/04)
Screen Screening 3-05-020-02 0.025 0.0087 0.0006 lb/ton tons 0.068 AP-42, Section 11.19, Table11.19.2-2 (08/04)
MolyDry Drying of High Moisture Ore 3-03-024-11 19.70 12.00 5.91 lb/ton tons 0.30AP-42, Section 11.24, Table11.24-2 (08/82) and Appendix B.2 (09/96)
TrStnPrt Material Transfer (Protected) 3-03-024-08 0.0002 0.00007 0.00001 lb/ton tons 0.74 0.35 0.053 1.3 4 AP-42, Section 13.2.4,Expression 1 (11/06)
TrStnUnp Material Transfer (Unprotected) 3-03-024-08 0.001 0.0006 0.00009 lb/ton tons 0.74 0.35 0.053 6.21 4 AP-42, Section 13.2.4,Expression 1 (11/06)
LimeLd Lime Product Loading, Enclosed Truck 3-05-016-26 0.61 0.29 0.04 lb/ton tons 1 0.47 0.07
AP-42, Section 11.17, Table11.17-4 (02/98) and AP-42, Section 13.2.4 (11/06)
ReagTr Miscellaneous Reagent Material Transfer 3-03-024-04 0.008 0.004 0.0006 lb/ton tons 0.74 0.35 0.053 6.21 1 AP-42, Section 13.2.4,
Expression 1 (11/06)
Process Code Process DescriptionParticulate Matter Emission Factor Inputs a
Table H.58 Particulate Matter Emission Factors - Year 15
SCC Code Prod. Rate Units Reference
Emission Factors
Rosemont Copper ProjectEmission Inventory Information JBR ENVIRONMENTAL CONSULTANTS, INC.
November 2011Page H227
AZRP00409

PM/TSP PM10 PM2.5 Unitsk
(PM/TSP)
k (PM10) k (PM2.5) A (ft2) U (mph) M (%) W (tons) s (%) S (mph) P (days/yr)a
(PM/TSP)
a (PM10) a (PM2.5)b
(PM/TSP)
b (PM10) b (PM2.5) u* ut* e f (%) PE
Process Code Process DescriptionParticulate Matter Emission Factor Inputs a
Table H.58 Particulate Matter Emission Factors - Year 15
SCC Code Prod. Rate Units Reference
Emission Factors
ICDE1 Internal Combustion Diesel Engine 37 ≤ kW > 75 2-02-001-02 0.40 0.40 0.40 g/kW-hr hours 1 1 1 NSPS Emission Standard
ICDE2 Internal Combustion Diesel Engine 225 ≤ kW > 450 2-02-001-02 0.20 0.20 0.20 g/kW-hr hours 1 1 1 NSPS Emission Standard
ICDE3 Internal Combustion Diesel Engine > 560 kW 2-02-001-02 0.20 0.20 0.20 g/kW-hr hours 1 1 1 NSPS Emission Standard
DFB Diesel (Distillate Oil) Fired Boiler <100 MMBtu/hr 1-02-005-03 3.30 2.30 1.54 lb/1000 gal hours 1 0.5 0.12 AP-42, Section 1.3, Tables
1.3-1, 1.3-2 and 1.3-6 (09/98)
CAS Crushing Area Scrubber none 1.29 1.28 1.13 lb/hr hours 1.01 1.00 0.88Voluntarily Accepted PM10
Emission Limit, PM and PM2.5
fractions of PM10 emissions
SAS Stockpile Area Scrubber none 2.61 2.59 2.10 lb/hr hours 1.01 1.00 0.81Voluntarily Accepted PM10
Emission Limit, PM and PM2.5
fractions of PM10 emissions
RTS Reclaim Tunnel Scrubber none 1.08 1.07 0.87 lb/hr hours 1.01 1.00 0.81Voluntarily Accepted PM10
Emission Limit, PM and PM2.5
fractions of PM10 emissions
PCAS Pebble Crusher Area Scrubber none 1.58 1.56 1.31 lb/hr hours 1.02 1.00 0.84Voluntarily Accepted PM10
Emission Limit, PM and PM2.5
fractions of PM10 emissions
CCS Copper Concentrate Scrubbers none 3.59 3.55 3.04 lb/hr hours 1.01 1.00 0.86Voluntarily Accepted PM10
Emission Limit, PM and PM2.5
fractions of PM10 emissions
MS/EP Molybdenum Scrubber / Electrostatic Precipitator none 0.015 0.014 0.013 lb/hr hours 1.10 1.00 0.94
Voluntarily Accepted PM10
Emission Limit, PM and PM2.5
fractions of PM10 emissions
MDC Molybdenum Dust Collector none 0.021 0.010 0.002 gr/dscf dscf 2.11 1.00 0.15Voluntarily Accepted PM10
Emission Limit, PM and PM2.5
fractions of PM10 emissions
LDC Laboratory Dust Collectors none 0.008 0.005 0.002 gr/dscf dscf 1.65 1.00 0.49Voluntarily Accepted PM10
Emission Limit, PM and PM2.5
fractions of PM10 emissions
WindROM Wind Erosion - Run of MineStockpile 3-03-888-01 0.21 0.11 0.02 ton/acre-yr acres 1 0.5 0.075 2.5 38 4.77 22
FDEMIb (07/83), p. 51-57, MRIEquation, AP-42, Section 13.2.5 (11/06) and Table 13.2.4-1 (11/06)
WindCvd Wind Erosion - Covered Stockpile 3-03-888-01 0 0 0 ton/acre-yr acres Assumed
TailStrg Wind Erosion - Tailings Storage 3-03-888-01 0.02 0.01 0.002 ton/acre-yr acres 1 0.5 0.075 0.57 0.43 AP-42, Section 13.2.5 (11/06)
b FDEMI = Fugitive Dust Emission Factors for the Mining Industry
a k = particle size multiplier, A = horizonal area of blasting surface, U = mean wind speed, M = material moisture content, W = mean vehicle weight, s = surface material silt content, S = mean vehicle speed, P = number of days per year with at least 0.01 inches of precipitation, a = constant based on particle size,b = constant based on particle size, u* = friction velocity, ut
* = threshold friction velocity, e = surface erodibility, f = percentage of time the wind speed exceeds 12 mph, PE = Thornthwaite's Precipitation-Evaporation Index
Rosemont Copper ProjectEmission Inventory Information JBR ENVIRONMENTAL CONSULTANTS, INC.
November 2011Page H228
AZRP00410

CO NOX SO2 VOC H2SO4 CO2 CH4 N2O Units
Blast Blasting 3-05-020-09 67.00 17.00 2.00 0 0 566 0.02 0.005 lb/tons ANFO tons ANFOAP-42 Section 13.3, Table 13.3-1 (02/80) and 40 CFR 98, Tables C-1 and C-2a
SX Solvent Extraction Mixers and Settlers 4-90-001-99 0 0 0 9.43E-05 0 0 0 0 lb/hr-ft2 hours Hydrometallurgy of Copper (Control Efficiency of 66%)
EW Electrowining Tankhouse none 0 0 0 0 1.57E-04 0 0 0 lb/hr-ft2 hours Applied Environmental Consultants - Reportb
ICDE1 Internal Combustion Diesel Engine 37 ≤ kW > 75 2-02-001-02 5.0 4.4 0.0066 0.3 0 694 0.03 0.006 g/kW-hr hours NSPS Emission Standard, Complete Sulfur Conversionc, and 40 CFR 98, Tables C-1 and C-2
ICDE2 Internal Combustion Diesel Engine 225 ≤ kW > 450 2-02-001-02 3.5 3.7 0.0066 0.3 0 694 0.03 0.006 g/kW-hr hours NSPS Emission Standard, Complete Sulfur Conversionc, and 40 CFR 98, Tables C-1 and C-2
ICDE3 Internal Combustion Diesel Engine > 560 kW 2-02-001-02 3.5 6.0 0.0066 0.40 0 694 0.03 0.006 g/kW-hr hours NSPS Emission Standard, Complete Sulfur Conversionc, and 40 CFR 98, Tables C-1 and C-2
DFB Diesel (Distillate Oil) Fired Boiler <100 MMBtu/hr 1-02-005-03 5.00 20.00 0.21 0.20 0 23,217 0.94 0.19 lb/1000 gal hours AP-42 Section 1.3, Tables 1.3-1 and 1.3-3 (05/10)c and 40 CFR 98, Tables C-1 and C-2
C7DT C7 Distribution Tank 4-03-010-19 0 0 0 1.08E-01 0 0 0 0 lb/hr hours EPA Tanks Program 4.0d
MST MIBC Storage Tank 4-90-999-98 0 0 0 3.53E-03 0 0 0 0 lb/hr hours EPA Tanks Program 4.0d
DFSTHV Diesel Fuel Storage Tank - Heavy Vehicles 4-03-010-19 0 0 0 1.39E-02 0 0 0 0 lb/hr hours EPA Tanks Program 4.0d
b "Measurement of Sulfuric Acid Mist Emissions from the Cyprus Twin Buttes Copper Company Electrowinning Tankhouse" (02/93).
d Assumes continuous operation.
a Assumes a fuel oil to ammonium nitrate ratio of 9.0%.
c SO2 emissions are calculated using a sulfur content of 0.0015% for diesel fuel.
Table H.59 Gaseous Emission Factors - Year 15
Process DescriptionProcess Code SCC Code Prod. Rate
Units ReferenceEmission Factor
Rosemont Copper ProjectEmission Inventory Information JBR ENVIRONMENTAL CONSULTANTS, INC.
November 2011Page H229
AZRP00411
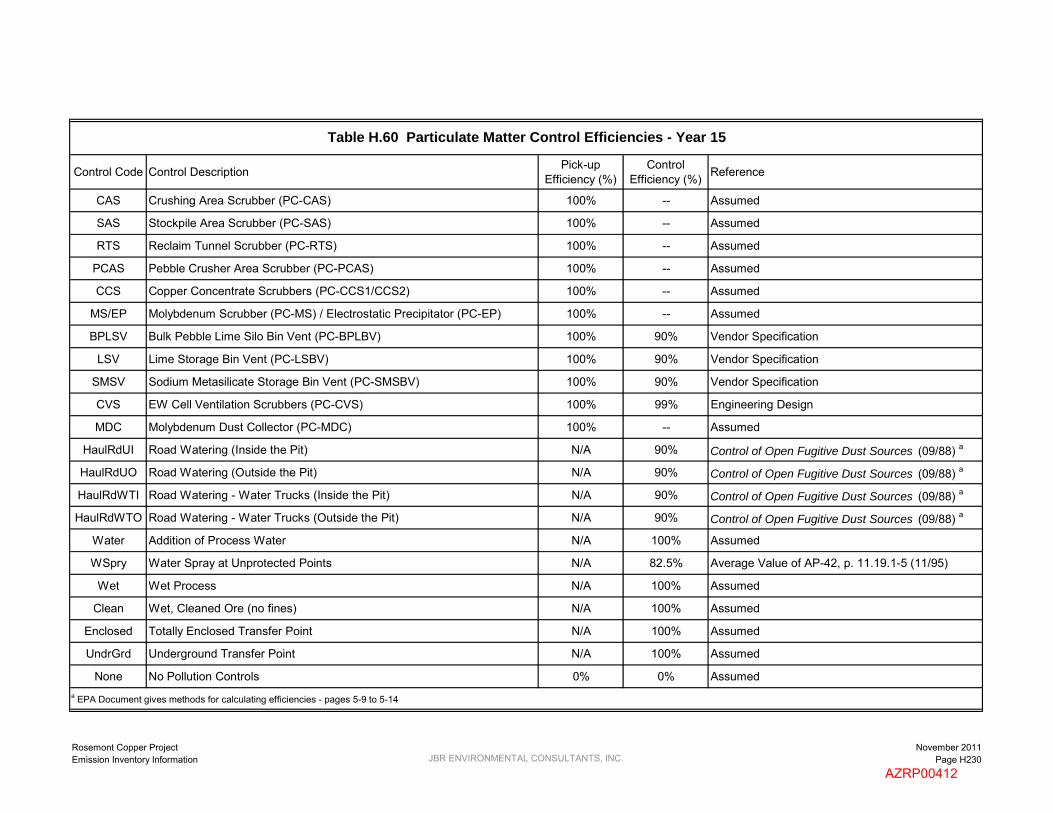
Control Code Control Description Pick-up Efficiency (%)
Control Efficiency (%) Reference
CAS Crushing Area Scrubber (PC-CAS) 100% -- Assumed
SAS Stockpile Area Scrubber (PC-SAS) 100% -- Assumed
RTS Reclaim Tunnel Scrubber (PC-RTS) 100% -- Assumed
PCAS Pebble Crusher Area Scrubber (PC-PCAS) 100% -- Assumed
CCS Copper Concentrate Scrubbers (PC-CCS1/CCS2) 100% -- Assumed
MS/EP Molybdenum Scrubber (PC-MS) / Electrostatic Precipitator (PC-EP) 100% -- Assumed
BPLSV Bulk Pebble Lime Silo Bin Vent (PC-BPLBV) 100% 90% Vendor Specification
LSV Lime Storage Bin Vent (PC-LSBV) 100% 90% Vendor Specification
SMSV Sodium Metasilicate Storage Bin Vent (PC-SMSBV) 100% 90% Vendor Specification
CVS EW Cell Ventilation Scrubbers (PC-CVS) 100% 99% Engineering Design
MDC Molybdenum Dust Collector (PC-MDC) 100% -- Assumed
HaulRdUI Road Watering (Inside the Pit) N/A 90% Control of Open Fugitive Dust Sources (09/88) a
HaulRdUO Road Watering (Outside the Pit) N/A 90% Control of Open Fugitive Dust Sources (09/88) a
HaulRdWTI Road Watering - Water Trucks (Inside the Pit) N/A 90% Control of Open Fugitive Dust Sources (09/88) a
HaulRdWTO Road Watering - Water Trucks (Outside the Pit) N/A 90% Control of Open Fugitive Dust Sources (09/88) a
Water Addition of Process Water N/A 100% Assumed
WSpry Water Spray at Unprotected Points N/A 82.5% Average Value of AP-42, p. 11.19.1-5 (11/95)
Wet Wet Process N/A 100% Assumed
Clean Wet, Cleaned Ore (no fines) N/A 100% Assumed
Enclosed Totally Enclosed Transfer Point N/A 100% Assumed
UndrGrd Underground Transfer Point N/A 100% Assumed
None No Pollution Controls 0% 0% Assumed
Table H.60 Particulate Matter Control Efficiencies - Year 15
a EPA Document gives methods for calculating efficiencies - pages 5-9 to 5-14
Rosemont Copper ProjectEmission Inventory Information JBR ENVIRONMENTAL CONSULTANTS, INC.
November 2011Page H230
AZRP00412
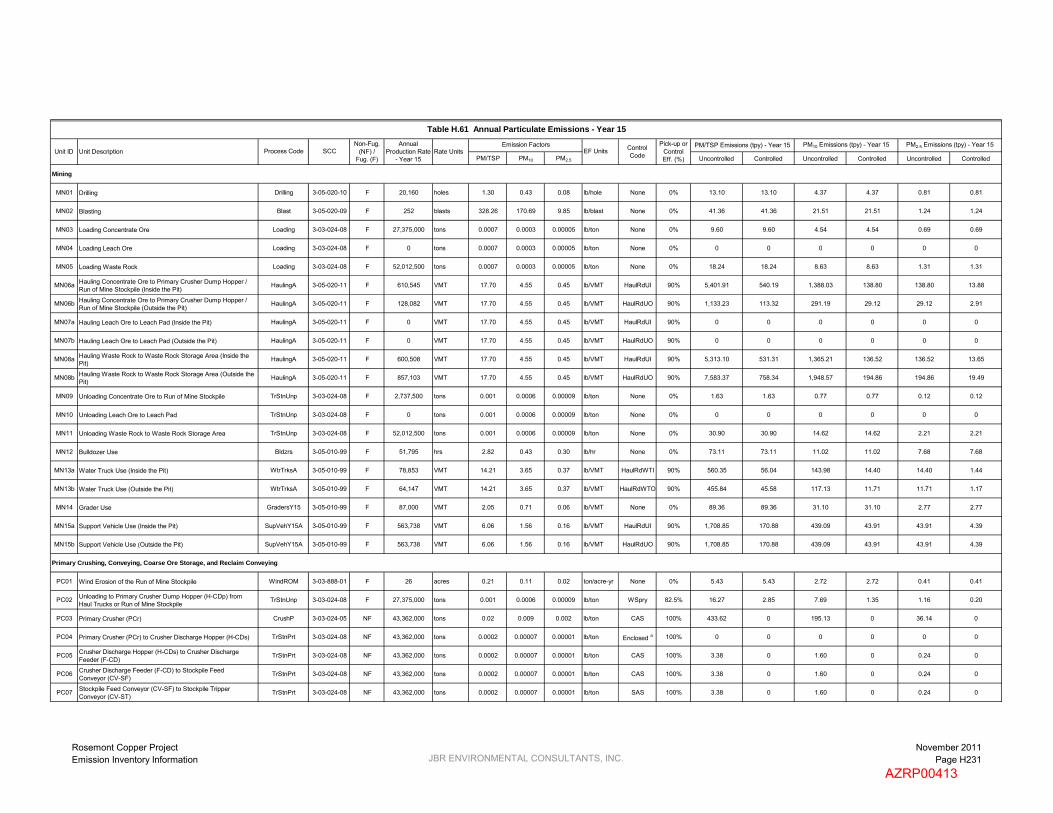
PM/TSP PM10 PM2.5 Uncontrolled Controlled Uncontrolled Controlled Uncontrolled Controlled
Mining
MN01 Drilling Drilling 3-05-020-10 F 20,160 holes 1.30 0.43 0.08 lb/hole None 0% 13.10 13.10 4.37 4.37 0.81 0.81
MN02 Blasting Blast 3-05-020-09 F 252 blasts 328.26 170.69 9.85 lb/blast None 0% 41.36 41.36 21.51 21.51 1.24 1.24
MN03 Loading Concentrate Ore Loading 3-03-024-08 F 27,375,000 tons 0.0007 0.0003 0.00005 lb/ton None 0% 9.60 9.60 4.54 4.54 0.69 0.69
MN04 Loading Leach Ore Loading 3-03-024-08 F 0 tons 0.0007 0.0003 0.00005 lb/ton None 0% 0 0 0 0 0 0
MN05 Loading Waste Rock Loading 3-03-024-08 F 52,012,500 tons 0.0007 0.0003 0.00005 lb/ton None 0% 18.24 18.24 8.63 8.63 1.31 1.31
MN06a Hauling Concentrate Ore to Primary Crusher Dump Hopper / Run of Mine Stockpile (Inside the Pit)
HaulingA 3-05-020-11 F 610,545 VMT 17.70 4.55 0.45 lb/VMT HaulRdUI 90% 5,401.91 540.19 1,388.03 138.80 138.80 13.88
MN06b Hauling Concentrate Ore to Primary Crusher Dump Hopper / Run of Mine Stockpile (Outside the Pit)
HaulingA 3-05-020-11 F 128,082 VMT 17.70 4.55 0.45 lb/VMT HaulRdUO 90% 1,133.23 113.32 291.19 29.12 29.12 2.91
MN07a Hauling Leach Ore to Leach Pad (Inside the Pit) HaulingA 3-05-020-11 F 0 VMT 17.70 4.55 0.45 lb/VMT HaulRdUI 90% 0 0 0 0 0 0
MN07b Hauling Leach Ore to Leach Pad (Outside the Pit) HaulingA 3-05-020-11 F 0 VMT 17.70 4.55 0.45 lb/VMT HaulRdUO 90% 0 0 0 0 0 0
MN08a Hauling Waste Rock to Waste Rock Storage Area (Inside the Pit)
HaulingA 3-05-020-11 F 600,508 VMT 17.70 4.55 0.45 lb/VMT HaulRdUI 90% 5,313.10 531.31 1,365.21 136.52 136.52 13.65
MN08b Hauling Waste Rock to Waste Rock Storage Area (Outside the Pit)
HaulingA 3-05-020-11 F 857,103 VMT 17.70 4.55 0.45 lb/VMT HaulRdUO 90% 7,583.37 758.34 1,948.57 194.86 194.86 19.49
MN09 Unloading Concentrate Ore to Run of Mine Stockpile TrStnUnp 3-03-024-08 F 2,737,500 tons 0.001 0.0006 0.00009 lb/ton None 0% 1.63 1.63 0.77 0.77 0.12 0.12
MN10 Unloading Leach Ore to Leach Pad TrStnUnp 3-03-024-08 F 0 tons 0.001 0.0006 0.00009 lb/ton None 0% 0 0 0 0 0 0
MN11 Unloading Waste Rock to Waste Rock Storage Area TrStnUnp 3-03-024-08 F 52,012,500 tons 0.001 0.0006 0.00009 lb/ton None 0% 30.90 30.90 14.62 14.62 2.21 2.21
MN12 Bulldozer Use Bldzrs 3-05-010-99 F 51,795 hrs 2.82 0.43 0.30 lb/hr None 0% 73.11 73.11 11.02 11.02 7.68 7.68
MN13a Water Truck Use (Inside the Pit) WtrTrksA 3-05-010-99 F 78,853 VMT 14.21 3.65 0.37 lb/VMT HaulRdWTI 90% 560.35 56.04 143.98 14.40 14.40 1.44
MN13b Water Truck Use (Outside the Pit) WtrTrksA 3-05-010-99 F 64,147 VMT 14.21 3.65 0.37 lb/VMT HaulRdWTO 90% 455.84 45.58 117.13 11.71 11.71 1.17
MN14 Grader Use GradersY15 3-05-010-99 F 87,000 VMT 2.05 0.71 0.06 lb/VMT None 0% 89.36 89.36 31.10 31.10 2.77 2.77
MN15a Support Vehicle Use (Inside the Pit) SupVehY15A 3-05-010-99 F 563,738 VMT 6.06 1.56 0.16 lb/VMT HaulRdUI 90% 1,708.85 170.88 439.09 43.91 43.91 4.39
MN15b Support Vehicle Use (Outside the Pit) SupVehY15A 3-05-010-99 F 563,738 VMT 6.06 1.56 0.16 lb/VMT HaulRdUO 90% 1,708.85 170.88 439.09 43.91 43.91 4.39
Primary Crushing, Conveying, Coarse Ore Storage, and Reclaim Conveying
PC01 Wind Erosion of the Run of Mine Stockpile WindROM 3-03-888-01 F 26 acres 0.21 0.11 0.02 ton/acre-yr None 0% 5.43 5.43 2.72 2.72 0.41 0.41
PC02 Unloading to Primary Crusher Dump Hopper (H-CDp) fromHaul Trucks or Run of Mine Stockpile
TrStnUnp 3-03-024-08 F 27,375,000 tons 0.001 0.0006 0.00009 lb/ton WSpry 82.5% 16.27 2.85 7.69 1.35 1.16 0.20
PC03 Primary Crusher (PCr) CrushP 3-03-024-05 NF 43,362,000 tons 0.02 0.009 0.002 lb/ton CAS 100% 433.62 0 195.13 0 36.14 0
PC04 Primary Crusher (PCr) to Crusher Discharge Hopper (H-CDs) TrStnPrt 3-03-024-08 NF 43,362,000 tons 0.0002 0.00007 0.00001 lb/ton Enclosed a 100% 0 0 0 0 0 0
PC05 Crusher Discharge Hopper (H-CDs) to Crusher DischargeFeeder (F-CD)
TrStnPrt 3-03-024-08 NF 43,362,000 tons 0.0002 0.00007 0.00001 lb/ton CAS 100% 3.38 0 1.60 0 0.24 0
PC06 Crusher Discharge Feeder (F-CD) to Stockpile FeedConveyor (CV-SF)
TrStnPrt 3-03-024-08 NF 43,362,000 tons 0.0002 0.00007 0.00001 lb/ton CAS 100% 3.38 0 1.60 0 0.24 0
PC07 Stockpile Feed Conveyor (CV-SF) to Stockpile TripperConveyor (CV-ST)
TrStnPrt 3-03-024-08 NF 43,362,000 tons 0.0002 0.00007 0.00001 lb/ton SAS 100% 3.38 0 1.60 0 0.24 0
PM2.5 Emissions (tpy) - Year 15PM/TSP Emissions (tpy) - Year 15Unit ID Unit Description Process Code EF Units
Pick-up or Control Eff. (%)
Emission Factors
Table H.61 Annual Particulate Emissions - Year 15Annual
Production Rate - Year 15
Control CodeRate Units
PM10 Emissions (tpy) - Year 15SCC
Non-Fug. (NF) /
Fug. (F)
Rosemont Copper ProjectEmission Inventory Information JBR ENVIRONMENTAL CONSULTANTS, INC.
November 2011Page H231
AZRP00413

PM/TSP PM10 PM2.5 Uncontrolled Controlled Uncontrolled Controlled Uncontrolled Controlled
PM2.5 Emissions (tpy) - Year 15PM/TSP Emissions (tpy) - Year 15Unit ID Unit Description Process Code EF Units
Pick-up or Control Eff. (%)
Emission Factors
Table H.61 Annual Particulate Emissions - Year 15Annual
Production Rate - Year 15
Control CodeRate Units
PM10 Emissions (tpy) - Year 15SCC
Non-Fug. (NF) /
Fug. (F)
PC08 Stockpile Tripper Conveyor (CV-ST) to Covered Coarse Ore Stockpile
TrStnPrt 3-03-024-08 F 43,362,000 tons 0.0002 0.00007 0.00001 lb/ton SAS 100% 3.38 0 1.60 0 0.24 0
PC09 Wind Erosion of the Coarse Ore Stockpile WindCvd 3-03-888-01 F 5 acres 0 0 0 ton/acre-yr Enclosed a 100% 0 0 0 0 0 0
PC10 Coarse Ore Stockpile to Reclaim Feeders (F-R1/R4) TrStnPrt 3-03-024-08 NF 43,362,000 tons 0.0002 0.00007 0.00001 lb/ton UndrGrd a 100% 0 0 0 0 0 0
PC11 Reclaim Feeders (F-R1/R4) to Reclaim Conveyor (CV-R) TrStnPrt 3-03-024-08 NF 43,362,000 tons 0.0002 0.00007 0.00001 lb/ton RTS 100% 3.38 0 1.60 0 0.24 0
PC12 Reclaim Conveyor (CV-R) to SAG Mill Feed Conveyor(CV-SMF) TrStnPrt 3-03-024-08 NF 43,362,000 tons 0.0002 0.00007 0.00001 lb/ton PCAS 100% 3.38 0 1.60 0 0.24 0
PC13 Pebble Conveyor No. 3 (CV-Pb3) to SAG Mill Feed Conveyor (CV-SMF)
TrStnPrt 3-03-024-08 NF 6,269,400 tons 0.0002 0.00007 0.00001 lb/ton PCAS 100% 0.49 0 0.23 0 0.03 0
PC14 SAG Mill Feed Conveyor (CV-SMF) to SAG Mill (M-SAG) TrStnPrt 3-03-024-08 NF 49,669,200 tons 0.0002 0.00007 0.00001 lb/ton Water a 100% 0 0 0 0 0 0
Milling
M01 SAG Mill (M-SAG) CrushS 3-03-024-06 NF 49,669,200 tons 0.05 0.02 0.004 lb/ton Wet a 100% 0 0 0 0 0 0
M02 SAG Mill (M-SAG) to Trommel Screen (Sn-T) TrStnPrt 3-03-024-08 NF 49,669,200 tons 0.0002 0.00007 0.00001 lb/ton Enclosed a 100% 0 0 0 0 0 0
M03 Trommel Screen (Sn-T) Screen 3-05-020-02 NF 49,669,200 tons 0.025 0.0087 0.0006 lb/ton Wet a 100% 0 0 0 0 0 0
M04 Trommel Screen (Sn-T) to Pebble Conveyor No. 1 (CV-Pb1) TrStnPrt 3-03-024-08 NF 10,505,042 tons 0.0002 0.00007 0.00001 lb/ton Clean a 100% 0 0 0 0 0 0
M05 Pebble Conveyor No. 1 (CV-Pb1) to Pebble Wash Screen(Sn-PbW)
TrStnPrt 3-03-024-08 NF 10,505,042 tons 0.0002 0.00007 0.00001 lb/ton Clean a 100% 0 0 0 0 0 0
M06 Pebble Wash Screen (Sn-PbW) Screen 3-05-020-02 NF 10,505,042 tons 0.025 0.0087 0.0006 lb/ton Wet a 100% 0 0 0 0 0 0
M07 Pebble Wash Screen (Sn-PbW) to Pebble Conveyor No. 2 TrStnPrt 3-03-024-08 NF 6,269,400 tons 0.0002 0.00007 0.00001 lb/ton Clean a 100% 0 0 0 0 0 0
M08 Pebble Conveyor No. 2 (CV-Pb2) to SAG Oversize Surge Bin(B-SAGOS) TrStnPrt 3-03-024-08 NF 6,269,400 tons 0.0002 0.00007 0.00001 lb/ton PCAS 100% 0.49 0 0.23 0 0.03 0
M09 SAG Oversize Surge Bin (B-SAGOS) to Pebble CrusherFeeder (F-PbC)
TrStnPrt 3-03-024-08 NF 6,269,400 tons 0.0002 0.00007 0.00001 lb/ton PCAS 100% 0.49 0 0.23 0 0.03 0
M10 Pebble Crusher Feeder (F-PbC) to Pebble Crusher (PbC) TrStnPrt 3-03-024-08 NF 6,269,400 tons 0.0002 0.00007 0.00001 lb/ton Enclosed a 100% 0 0 0 0 0 0
M11 Pebble Crusher (PbC) CrushT 3-03-024-07 NF 6,269,400 tons 0.06 0.02 0.004 lb/ton PCAS 100% 188.08 0 62.69 0 11.61 0
M12 Pebble Crusher (PbC) to Pebble Conveyor No. 3 (CV-Pb3) TrStnPrt 3-03-024-08 NF 6,269,400 tons 0.0002 0.00007 0.00001 lb/ton PCAS 100% 0.49 0 0.23 0 0.03 0
Copper Concentrate Dewatering and Stacking
CCD01 Copper Concentrate Filters (Ft-CC1/CC4) to Copper Concentrate Conveyor (CV-CC) TrCuCncPrt 3-03-024-08 NF 550,936 tons 0.00004 0.00002 0.000003 lb/ton Enclosed a 100% 0 0 0 0 0 0
CCD02 Copper Concentrate Conveyor (CV-CC) to Copper Concentrate Loadout Stockpile
TrCuCncPrt 3-03-024-08 F 550,936 tons 0.00004 0.00002 0.000003 lb/ton CCS 100% 0.01 0 0.006 0 0.0009 0
CCD03 Wind Erosion of Copper Concentrate Loadout Stockpile WindCvd 3-03-888-01 F 1.17 acres 0 0 0 ton/acre-yr Enclosed a 100% 0 0 0 0 0 0
CCD04 Copper Concentrate Loadout Stockpile to Shipment Truck via Front End Loaders
TrCuCncPrt 3-03-024-08 F 550,936 tons 0.00004 0.00002 0.000003 lb/ton CCS 100% 0.01 0 0.006 0 0.0009 0
Molybdenum Dewatering and Packaging
MD01 Molybdenum Concentrate Filter (Ft-MC) to Molybdenum Concentrate Dryer (D-MC)
TrMlyCncPrt 3-03-024-08 NF 6,377 tons 0.00002 0.00001 0.000002 lb/ton Enclosed a 100% 0 0 0 0 0 0
MD02 Molybdenum Concentrate Dryer MolyDry 3-03-024-11 NF 6,377 tons 19.70 12.00 5.91 lb/ton MS/EP 100% 62.81 0 38.26 0 18.84 0
MD03 Molybdenum Concentrate Dryer (D-MC) to MolybdenumConcentrate Bin (B-MC)
DTrMlyCncPrt 3-03-024-08 NF 6,377 tons 0.00004 0.00002 0.000003 lb/ton MDC 100% 0.0001 0 0.00007 0 0.00001 0
Rosemont Copper ProjectEmission Inventory Information JBR ENVIRONMENTAL CONSULTANTS, INC.
November 2011Page H232
AZRP00414

PM/TSP PM10 PM2.5 Uncontrolled Controlled Uncontrolled Controlled Uncontrolled Controlled
PM2.5 Emissions (tpy) - Year 15PM/TSP Emissions (tpy) - Year 15Unit ID Unit Description Process Code EF Units
Pick-up or Control Eff. (%)
Emission Factors
Table H.61 Annual Particulate Emissions - Year 15Annual
Production Rate - Year 15
Control CodeRate Units
PM10 Emissions (tpy) - Year 15SCC
Non-Fug. (NF) /
Fug. (F)
MD04 Molybdenum Concentrate Bin (B-MC) to MolybdenumConcentrate Hopper (H-MC)
DTrMlyCnc 3-03-024-08 NF 6,377 tons 0.0003 0.0002 0.00002 lb/ton None 0% 0.001 0.001 0.0005 0.0005 0.00008 0.00008
MD05 Molybdenum Concentrate Hopper (H-MC) to MolybdenumConcentrate Conveyor (CV-MC)
DTrMlyCncPrt 3-03-024-08 NF 6,377 tons 0.00004 0.00002 0.000003 lb/ton Enclosed a 100% 0 0 0 0 0 0
MD06 Molybdenum Concentrate Conveyor (CV-MC) to Molybdenum Packaging and Weigh System (MPS)
DTrMlyCnc 3-03-024-08 NF 6,377 tons 0.0003 0.0002 0.00002 lb/ton MDC 100% 0.001 0 0.0005 0 0.00008 0
Tailings Dewatering and Placement
TDS01 Tailings Filters (Ft-T1/T14) to Tailings Belt Feeders (F-T1/T14) FiltTailPrt 3-03-024-08 NF 42,804,687 tons 0.00002 0.00001 0.000002 lb/ton Enclosed a 100% 0 0 0 0 0 0
TDS02 Tailings Belt Feeders (F-T1/T14) to Fixed Tailings ConveyorNo. 1 (CV-F1)
FiltTailPrt 3-03-024-08 NF 42,804,687 tons 0.00002 0.00001 0.000002 lb/ton Enclosed a 100% 0 0 0 0 0 0
TDS03 Fixed Tailings Conveyor No. 1 (CV-F1) to Fixed TailingsConveyor No. 2 (CV-F2)
FiltTailPrt 3-03-024-08 NF 42,804,687 tons 0.00002 0.00001 0.000002 lb/ton Enclosed a 100% 0 0 0 0 0 0
TDS04 Fixed Tailings Conveyor No. 2 (CV-F2) to Fixed Tailings Conveyor No. 3 (CV-F3)
FiltTailPrt 3-03-024-08 NF 42,804,687 tons 0.00002 0.00001 0.000002 lb/ton None 0% 0.52 0.52 0.25 0.25 0.04 0.04
TDS05 Fixed Tailings Conveyor No. 3 (CV-F3) to RelocatableConveyor (CV-R1)
FiltTailPrt 3-03-024-08 F 42,804,687 tons 0.00002 0.00001 0.000002 lb/ton None 0% 0.52 0.52 0.25 0.25 0.04 0.04
TDS06 Relocatable Conveyor (CV-R1) to Shiftable Conveyor (CV-S1) FiltTailPrt 3-03-024-08 F 42,804,687 tons 0.00002 0.00001 0.000002 lb/ton None 0% 0.52 0.52 0.25 0.25 0.04 0.04
TDS07 Shiftable Conveyor (CV-S1) to Belt Wagon Conveyor(CV-BW1)
FiltTail 3-03-024-08 F 42,804,687 tons 0.0002 0.00009 0.00001 lb/ton None 0% 4.00 4.00 1.89 1.89 0.29 0.29
TDS08 Belt Wagon Conveyor (CV-BW1) to Spreader Crawler Mounted Conveyor (CV-SP1)
FiltTail 3-03-024-08 F 42,804,687 tons 0.0002 0.00009 0.00001 lb/ton None 0% 4.00 4.00 1.89 1.89 0.29 0.29
TDS09 Spreader Crawler Mounted Conveyor (CV-SP1) to Tailings Storage
FiltTail 3-03-024-08 F 42,804,687 tons 0.0002 0.00009 0.00001 lb/ton None 0% 4.00 4.00 1.89 1.89 0.29 0.29
TDS10 Wind Erosion of Tailings Storage TailStrg 3-03-888-01 F 1,500 acres 0.02 0.01 0.002 ton/acre-yr None 0% 30.23 30.23 15.11 15.11 2.27 2.27
Fuel Burning Equipment
FB01 Diesel Electrowinning Hot Water Generator (HWG) DFB 1-02-005-03 NF 8,760 hours 3.30 2.30 1.54 lb/1000 gal None 0% 0.63 0.63 0.44 0.44 0.30 0.30
6.0 MMBtu/hr
FB02 Thickener Area Emergency Generator (TEG) ICDE3 2-02-001-02 NF 500 hours 0.20 0.20 0.20 g/kW-hr None 0% 0.11 0.11 0.11 0.11 0.11 0.11
1,000 kW
FB03 PLS Pond Area Emergency Generator (PEG) ICDE3 2-02-001-02 NF 500 hours 0.20 0.20 0.20 g/kW-hr None 0% 0.11 0.11 0.11 0.11 0.11 0.11
1,000 kW
FB04 Main Substation Emergency Generator (MEG) ICDE3 2-02-001-02 NF 500 hours 0.20 0.20 0.20 g/kW-hr None 0% 0.08 0.08 0.08 0.08 0.08 0.08
750 kW
FB05 Administration Building Emergency Generator (AEG) ICDE3 2-02-001-02 NF 500 hours 0.20 0.20 0.20 g/kW-hr None 0% 0.08 0.08 0.08 0.08 0.08 0.08
750 kW
FB06 Electrowinning Building Emergency Generator (EWEG) ICDE1 2-02-001-02 NF 500 hours 0.40 0.40 0.40 g/kW-hr None 0% 0.01 0.01 0.01 0.01 0.01 0.01
50 kW
FB07 Primary Crusher Fire Water Pump (PCFWP) ICDE2 2-02-001-02 NF 500 hours 0.20 0.20 0.20 g/kW-hr None 0% 0.03 0.03 0.03 0.03 0.03 0.03
400 hp
Rosemont Copper ProjectEmission Inventory Information JBR ENVIRONMENTAL CONSULTANTS, INC.
November 2011Page H233
AZRP00415

PM/TSP PM10 PM2.5 Uncontrolled Controlled Uncontrolled Controlled Uncontrolled Controlled
PM2.5 Emissions (tpy) - Year 15PM/TSP Emissions (tpy) - Year 15Unit ID Unit Description Process Code EF Units
Pick-up or Control Eff. (%)
Emission Factors
Table H.61 Annual Particulate Emissions - Year 15Annual
Production Rate - Year 15
Control CodeRate Units
PM10 Emissions (tpy) - Year 15SCC
Non-Fug. (NF) /
Fug. (F)
FB08 SX/EW Fire Water Pump (SXFWP) ICDE2 2-02-001-02 NF 500 hours 0.20 0.20 0.20 g/kW-hr None 0% 0.03 0.03 0.03 0.03 0.03 0.03
400 hp
Miscellaneous Sources
MS01 Transfer of Bulk Pebble Lime to the Bulk Pebble Lime Silo(S-BPL) LimeLd 3-05-016-26 NF 37,800 tons 0.61 0.29 0.04 lb/ton BPLSV a 90% 1.15 1.15 0.55 0.55 0.08 0.08
MS02 Bulk Pebble Lime Silo (S-BPL) to Bulk Pebble Lime Silo Screw Conveyor (CV-BPLS) ReagTr 3-03-024-04 NF 37,800 tons 0.008 0.004 0.0006 lb/ton Enclosed a 100% 0 0 0 0 0 0
MS03 Bulk Pebble Lime Silo Screw Conveyor (CV-BPLS) to SAGMill Feed Conveyor (CV-SMF)
ReagTr 3-03-024-04 NF 37,800 tons 0.008 0.004 0.0006 lb/ton None 0% 0.16 0.16 0.07 0.07 0.01 0.01
MS04 Transfer of Lime to the Lime Storage Bin (B-L) LimeLd 3-05-016-26 NF 18,900 tons 0.61 0.29 0.04 lb/ton LSV a 90% 0.58 0.58 0.27 0.27 0.04 0.04
MS05 Transfer of Sodium Metasilicate to the Sodium MetasilicateStorage Bin (B-SM)
ReagTr 3-03-024-04 NF 3,000 tons 0.008 0.004 0.0006 lb/ton SMSV a 90% 0.001 0.001 0.0006 0.0006 0.00009 0.00009
MS06 Transfer of Flocculant from Supersacks to Flocculant Storage Bins (B-F1/F2)
ReagTr 3-03-024-04 NF 1,100 tons 0.008 0.004 0.0006 lb/ton None 0% 0.005 0.005 0.002 0.002 0.0003 0.0003
MS07 Transfer of Guar from Bags to Guar Feeder (F-Gu) ReagTr 3-03-024-04 NF 150 tons 0.008 0.004 0.0006 lb/ton None 0% 0.0006 0.0006 0.0003 0.0003 0.00004 0.00004
MS08 Transfer of Granular Cobalt Sulfate from Bags to CobaltSulfate Feeder (F-CoS)
ReagTr 3-03-024-04 NF 6 tons 0.008 0.004 0.0006 lb/ton None 0% 0.00002 0.00002 0.00001 0.00001 0.000002 0.000002
Particulate Matter Pollution Control Equipment with Emission Limits
PCL01 Crushing Area Scrubber (PC-CAS) CAS none NF 8,760 hours 1.29 1.28 1.13 lb/hr -- -- -- 5.65 -- 5.61 -- 4.94
PCL02 Stockpile Area Scrubber (PC-SAS) SAS none NF 8,760 hours 2.61 2.59 2.10 lb/hr -- -- -- 11.45 -- 11.34 -- 9.18
PCL03 Reclaim Tunnel Scrubber (PC-RTS) RTS none NF 8,760 hours 1.08 1.07 0.87 lb/hr -- -- -- 4.73 -- 4.69 -- 3.79
PCL04 Pebble Crusher Area Scrubber (PC-PCAS) PCAS none NF 8,760 hours 1.58 1.56 1.31 lb/hr -- -- -- 6.94 -- 6.83 -- 5.75
PCL05 Copper Concentrate Scrubber 1 (PC-CCS1) CCS none NF 8,760 hours 3.59 3.55 3.04 lb/hr -- -- -- 15.71 -- 15.55 -- 13.33
PCL06 Copper Concentrate Scrubber 2 (PC-CCS2) CCS none NF 8,760 hours 3.59 3.55 3.04 lb/hr -- -- -- 15.71 -- 15.55 -- 13.33
PCL07 Molybdenum Scrubber (PC-MS) / Electrostatic Precipitator (PC-EP) MS/EP none NF 8,760 hours 0.015 0.014 0.013 lb/hr -- -- -- 0.07 -- 0.06 -- 0.06
PCL08 Molybdenum Dust Collector (PC-MDC) MDC none NF 653,597,276 dscf 0.02 0.010 0.002 gr/dscf -- -- -- 0.99 -- 0.47 -- 0.07
PCL09 Laboratory Dust Collector 1 (PC-L1) LDC none NF 4,357,315,176 dscf 0.008 0.005 0.002 gr/dscf -- -- -- 2.56 -- 1.56 -- 0.76
PCL10 Laboratory Dust Collector 2 (PC-L2) LDC none NF 4,357,315,176 dscf 0.008 0.005 0.002 gr/dscf -- -- -- 2.56 -- 1.56 -- 0.76
PCL11 Laboratory Dust Collector 3 (PC-L3) LDC none NF 4,357,315,176 dscf 0.008 0.005 0.002 gr/dscf -- -- -- 2.56 -- 1.56 -- 0.76
706.86 72.44 307.04 66.81 68.87 53.68
24,211.18 2,715.41 6,262.15 735.13 635.07 81.96
24,918.04 2,787.85 6,569.19 801.94 703.94 135.64
33.83 33.83 33.83 33.83 33.83 33.83
a The control efficiency for this emission unit is inherent to the process. Therefore, the control efficiency is applied to both uncontrolled and controlled emissions.
Tailpipe Emissions (see Tables H.67-H.69):
Total Emissions (excluding tailpipe emissions):
Total Non-Fugitive Emissions (excluding tailpipe emissions):
Total Fugitive Emissions (excluding tailpipe emissions):
Rosemont Copper ProjectEmission Inventory Information JBR ENVIRONMENTAL CONSULTANTS, INC.
November 2011Page H234
AZRP00416
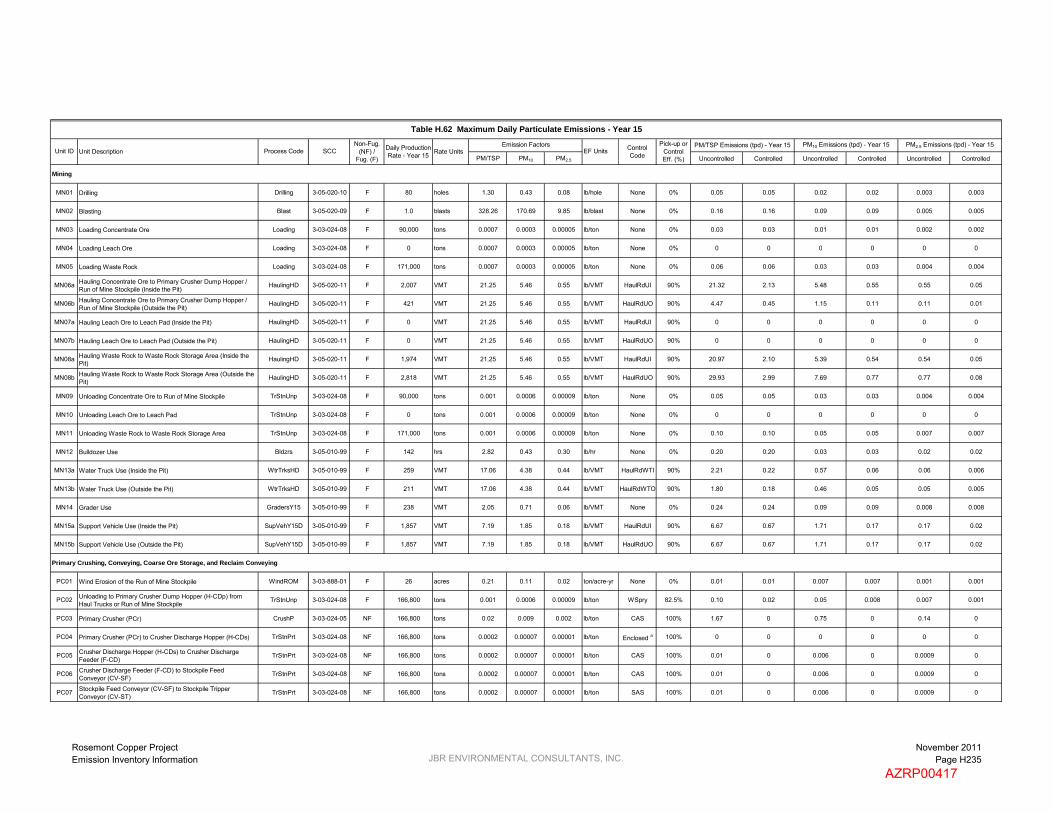
PM/TSP PM10 PM2.5 Uncontrolled Controlled Uncontrolled Controlled Uncontrolled Controlled
Mining
MN01 Drilling Drilling 3-05-020-10 F 80 holes 1.30 0.43 0.08 lb/hole None 0% 0.05 0.05 0.02 0.02 0.003 0.003
MN02 Blasting Blast 3-05-020-09 F 1.0 blasts 328.26 170.69 9.85 lb/blast None 0% 0.16 0.16 0.09 0.09 0.005 0.005
MN03 Loading Concentrate Ore Loading 3-03-024-08 F 90,000 tons 0.0007 0.0003 0.00005 lb/ton None 0% 0.03 0.03 0.01 0.01 0.002 0.002
MN04 Loading Leach Ore Loading 3-03-024-08 F 0 tons 0.0007 0.0003 0.00005 lb/ton None 0% 0 0 0 0 0 0
MN05 Loading Waste Rock Loading 3-03-024-08 F 171,000 tons 0.0007 0.0003 0.00005 lb/ton None 0% 0.06 0.06 0.03 0.03 0.004 0.004
MN06a Hauling Concentrate Ore to Primary Crusher Dump Hopper / Run of Mine Stockpile (Inside the Pit)
HaulingHD 3-05-020-11 F 2,007 VMT 21.25 5.46 0.55 lb/VMT HaulRdUI 90% 21.32 2.13 5.48 0.55 0.55 0.05
MN06b Hauling Concentrate Ore to Primary Crusher Dump Hopper / Run of Mine Stockpile (Outside the Pit)
HaulingHD 3-05-020-11 F 421 VMT 21.25 5.46 0.55 lb/VMT HaulRdUO 90% 4.47 0.45 1.15 0.11 0.11 0.01
MN07a Hauling Leach Ore to Leach Pad (Inside the Pit) HaulingHD 3-05-020-11 F 0 VMT 21.25 5.46 0.55 lb/VMT HaulRdUI 90% 0 0 0 0 0 0
MN07b Hauling Leach Ore to Leach Pad (Outside the Pit) HaulingHD 3-05-020-11 F 0 VMT 21.25 5.46 0.55 lb/VMT HaulRdUO 90% 0 0 0 0 0 0
MN08a Hauling Waste Rock to Waste Rock Storage Area (Inside the Pit)
HaulingHD 3-05-020-11 F 1,974 VMT 21.25 5.46 0.55 lb/VMT HaulRdUI 90% 20.97 2.10 5.39 0.54 0.54 0.05
MN08b Hauling Waste Rock to Waste Rock Storage Area (Outside the Pit)
HaulingHD 3-05-020-11 F 2,818 VMT 21.25 5.46 0.55 lb/VMT HaulRdUO 90% 29.93 2.99 7.69 0.77 0.77 0.08
MN09 Unloading Concentrate Ore to Run of Mine Stockpile TrStnUnp 3-03-024-08 F 90,000 tons 0.001 0.0006 0.00009 lb/ton None 0% 0.05 0.05 0.03 0.03 0.004 0.004
MN10 Unloading Leach Ore to Leach Pad TrStnUnp 3-03-024-08 F 0 tons 0.001 0.0006 0.00009 lb/ton None 0% 0 0 0 0 0 0
MN11 Unloading Waste Rock to Waste Rock Storage Area TrStnUnp 3-03-024-08 F 171,000 tons 0.001 0.0006 0.00009 lb/ton None 0% 0.10 0.10 0.05 0.05 0.007 0.007
MN12 Bulldozer Use Bldzrs 3-05-010-99 F 142 hrs 2.82 0.43 0.30 lb/hr None 0% 0.20 0.20 0.03 0.03 0.02 0.02
MN13a Water Truck Use (Inside the Pit) WtrTrksHD 3-05-010-99 F 259 VMT 17.06 4.38 0.44 lb/VMT HaulRdWTI 90% 2.21 0.22 0.57 0.06 0.06 0.006
MN13b Water Truck Use (Outside the Pit) WtrTrksHD 3-05-010-99 F 211 VMT 17.06 4.38 0.44 lb/VMT HaulRdWTO 90% 1.80 0.18 0.46 0.05 0.05 0.005
MN14 Grader Use GradersY15 3-05-010-99 F 238 VMT 2.05 0.71 0.06 lb/VMT None 0% 0.24 0.24 0.09 0.09 0.008 0.008
MN15a Support Vehicle Use (Inside the Pit) SupVehY15D 3-05-010-99 F 1,857 VMT 7.19 1.85 0.18 lb/VMT HaulRdUI 90% 6.67 0.67 1.71 0.17 0.17 0.02
MN15b Support Vehicle Use (Outside the Pit) SupVehY15D 3-05-010-99 F 1,857 VMT 7.19 1.85 0.18 lb/VMT HaulRdUO 90% 6.67 0.67 1.71 0.17 0.17 0.02
Primary Crushing, Conveying, Coarse Ore Storage, and Reclaim Conveying
PC01 Wind Erosion of the Run of Mine Stockpile WindROM 3-03-888-01 F 26 acres 0.21 0.11 0.02 ton/acre-yr None 0% 0.01 0.01 0.007 0.007 0.001 0.001
PC02 Unloading to Primary Crusher Dump Hopper (H-CDp) fromHaul Trucks or Run of Mine Stockpile
TrStnUnp 3-03-024-08 F 166,800 tons 0.001 0.0006 0.00009 lb/ton WSpry 82.5% 0.10 0.02 0.05 0.008 0.007 0.001
PC03 Primary Crusher (PCr) CrushP 3-03-024-05 NF 166,800 tons 0.02 0.009 0.002 lb/ton CAS 100% 1.67 0 0.75 0 0.14 0
PC04 Primary Crusher (PCr) to Crusher Discharge Hopper (H-CDs) TrStnPrt 3-03-024-08 NF 166,800 tons 0.0002 0.00007 0.00001 lb/ton Enclosed a 100% 0 0 0 0 0 0
PC05 Crusher Discharge Hopper (H-CDs) to Crusher DischargeFeeder (F-CD)
TrStnPrt 3-03-024-08 NF 166,800 tons 0.0002 0.00007 0.00001 lb/ton CAS 100% 0.01 0 0.006 0 0.0009 0
PC06 Crusher Discharge Feeder (F-CD) to Stockpile FeedConveyor (CV-SF)
TrStnPrt 3-03-024-08 NF 166,800 tons 0.0002 0.00007 0.00001 lb/ton CAS 100% 0.01 0 0.006 0 0.0009 0
PC07 Stockpile Feed Conveyor (CV-SF) to Stockpile TripperConveyor (CV-ST)
TrStnPrt 3-03-024-08 NF 166,800 tons 0.0002 0.00007 0.00001 lb/ton SAS 100% 0.01 0 0.006 0 0.0009 0
Table H.62 Maximum Daily Particulate Emissions - Year 15
PM/TSP Emissions (tpd) - Year 15 PM10 Emissions (tpd) - Year 15 PM2.5 Emissions (tpd) - Year 15Pick-up or Control Eff. (%)
Rate UnitsNon-Fug.
(NF) / Fug. (F)
Emission FactorsUnit ID Unit Description Process Code SCC Daily Production
Rate - Year 15EF Units Control
Code
Rosemont Copper ProjectEmission Inventory Information JBR ENVIRONMENTAL CONSULTANTS, INC.
November 2011Page H235
AZRP00417

PM/TSP PM10 PM2.5 Uncontrolled Controlled Uncontrolled Controlled Uncontrolled Controlled
Table H.62 Maximum Daily Particulate Emissions - Year 15
PM/TSP Emissions (tpd) - Year 15 PM10 Emissions (tpd) - Year 15 PM2.5 Emissions (tpd) - Year 15Pick-up or Control Eff. (%)
Rate UnitsNon-Fug.
(NF) / Fug. (F)
Emission FactorsUnit ID Unit Description Process Code SCC Daily Production
Rate - Year 15EF Units Control
Code
PC08 Stockpile Tripper Conveyor (CV-ST) to Covered Coarse Ore Stockpile
TrStnPrt 3-03-024-08 F 166,800 tons 0.0002 0.00007 0.00001 lb/ton SAS 100% 0.01 0 0.006 0 0.0009 0
PC09 Wind Erosion of the Coarse Ore Stockpile WindCvd 3-03-888-01 F 5 acres 0 0 0 ton/acre-yr Enclosed a 100% 0 0 0 0 0 0
PC10 Coarse Ore Stockpile to Reclaim Feeders (F-R1/R4) TrStnPrt 3-03-024-08 NF 166,800 tons 0.0002 0.00007 0.00001 lb/ton UndrGrd a 100% 0 0 0 0 0 0
PC11 Reclaim Feeders (F-R1/R4) to Reclaim Conveyor (CV-R) TrStnPrt 3-03-024-08 NF 166,800 tons 0.0002 0.00007 0.00001 lb/ton RTS 100% 0.01 0 0.006 0 0.0009 0
PC12 Reclaim Conveyor (CV-R) to SAG Mill Feed Conveyor(CV-SMF) TrStnPrt 3-03-024-08 NF 166,800 tons 0.0002 0.00007 0.00001 lb/ton PCAS 100% 0.01 0 0.006 0 0.0009 0
PC13 Pebble Conveyor No. 3 (CV-Pb3) to SAG Mill Feed Conveyor (CV-SMF)
TrStnPrt 3-03-024-08 NF 42,508 tons 0.0002 0.00007 0.00001 lb/ton PCAS 100% 0.003 0 0.002 0 0.0002 0
PC14 SAG Mill Feed Conveyor (CV-SMF) to SAG Mill (M-SAG) TrStnPrt 3-03-024-08 NF 209,432 tons 0.0002 0.00007 0.00001 lb/ton Water a 100% 0 0 0 0 0 0
Milling
M01 SAG Mill (M-SAG) CrushS 3-03-024-06 NF 209,432 tons 0.05 0.02 0.004 lb/ton Wet a 100% 0 0 0 0 0 0
M02 SAG Mill (M-SAG) to Trommel Screen (Sn-T) TrStnPrt 3-03-024-08 NF 209,432 tons 0.0002 0.00007 0.00001 lb/ton Enclosed a 100% 0 0 0 0 0 0
M03 Trommel Screen (Sn-T) Screen 3-05-020-02 NF 209,432 tons 0.025 0.0087 0.0006 lb/ton Wet a 100% 0 0 0 0 0 0
M04 Trommel Screen (Sn-T) to Pebble Conveyor No. 1 (CV-Pb1) TrStnPrt 3-03-024-08 NF 44,426 tons 0.0002 0.00007 0.00001 lb/ton Clean a 100% 0 0 0 0 0 0
M05 Pebble Conveyor No. 1 (CV-Pb1) to Pebble Wash Screen(Sn-PbW)
TrStnPrt 3-03-024-08 NF 44,426 tons 0.0002 0.00007 0.00001 lb/ton Clean a 100% 0 0 0 0 0 0
M06 Pebble Wash Screen (Sn-PbW) Screen 3-05-020-02 NF 44,426 tons 0.025 0.0087 0.0006 lb/ton Wet a 100% 0 0 0 0 0 0
M07 Pebble Wash Screen (Sn-PbW) to Pebble Conveyor No. 2 TrStnPrt 3-03-024-08 NF 42,508 tons 0.0002 0.00007 0.00001 lb/ton Clean a 100% 0 0 0 0 0 0
M08 Pebble Conveyor No. 2 (CV-Pb2) to SAG Oversize Surge Bin(B-SAGOS) TrStnPrt 3-03-024-08 NF 42,508 tons 0.0002 0.00007 0.00001 lb/ton PCAS 100% 0.003 0 0.002 0 0.0002 0
M09 SAG Oversize Surge Bin (B-SAGOS) to Pebble CrusherFeeder (F-PbC)
TrStnPrt 3-03-024-08 NF 42,508 tons 0.0002 0.00007 0.00001 lb/ton PCAS 100% 0.003 0 0.002 0 0.0002 0
M10 Pebble Crusher Feeder (F-PbC) to Pebble Crusher (PbC) TrStnPrt 3-03-024-08 NF 42,508 tons 0.0002 0.00007 0.00001 lb/ton Enclosed a 100% 0 0 0 0 0 0
M11 Pebble Crusher (PbC) CrushT 3-03-024-07 NF 42,508 tons 0.06 0.02 0.004 lb/ton PCAS 100% 1.28 0 0.43 0 0.08 0
M12 Pebble Crusher (PbC) to Pebble Conveyor No. 3 (CV-Pb3) TrStnPrt 3-03-024-08 NF 42,508 tons 0.0002 0.00007 0.00001 lb/ton PCAS 100% 0.003 0 0.002 0 0.0002 0
Copper Concentrate Dewatering and Stacking
CCD01 Copper Concentrate Filters (Ft-CC1/CC4) to Copper Concentrate Conveyor (CV-CC) TrCuCncPrt 3-03-024-08 NF 3,312 tons 0.00004 0.00002 0.000003 lb/ton Enclosed a 100% 0 0 0 0 0 0
CCD02 Copper Concentrate Conveyor (CV-CC) to Copper Concentrate Loadout Stockpile
TrCuCncPrt 3-03-024-08 F 3,312 tons 0.00004 0.00002 0.000003 lb/ton CCS 100% 0.00007 0 0.00003 0 0.000005 0
CCD03 Wind Erosion of Copper Concentrate Loadout Stockpile WindCvd 3-03-888-01 F 1.17 acres 0 0 0 ton/acre-yr Enclosed a 100% 0 0 0 0 0 0
CCD04 Copper Concentrate Loadout Stockpile to Shipment Truck via Front End Loaders
TrCuCncPrt 3-03-024-08 F 3,312 tons 0.00004 0.00002 0.000003 lb/ton CCS 100% 0.00007 0 0.00003 0 0.000005 0
Molybdenum Dewatering and Packaging
MD01 Molybdenum Concentrate Filter (Ft-MC) to Molybdenum Concentrate Dryer (D-MC)
TrMlyCncPrt 3-03-024-08 NF 45.6 tons 0.00002 0.00001 0.000002 lb/ton Enclosed a 100% 0 0 0 0 0 0
MD02 Molybdenum Concentrate Dryer MolyDry 3-03-024-11 NF 45.6 tons 19.70 12.00 5.91 lb/ton MS/EP 100% 0.45 0 0.27 0 0.13 0
MD03 Molybdenum Concentrate Dryer (D-MC) to MolybdenumConcentrate Bin (B-MC)
DTrMlyCncPrt 3-03-024-08 NF 45.6 tons 0.00004 0.00002 0.000003 lb/ton MDC 100% 0.000001 0 0.0000005 0 0.00000007 0
Rosemont Copper ProjectEmission Inventory Information JBR ENVIRONMENTAL CONSULTANTS, INC.
November 2011Page H236
AZRP00418

PM/TSP PM10 PM2.5 Uncontrolled Controlled Uncontrolled Controlled Uncontrolled Controlled
Table H.62 Maximum Daily Particulate Emissions - Year 15
PM/TSP Emissions (tpd) - Year 15 PM10 Emissions (tpd) - Year 15 PM2.5 Emissions (tpd) - Year 15Pick-up or Control Eff. (%)
Rate UnitsNon-Fug.
(NF) / Fug. (F)
Emission FactorsUnit ID Unit Description Process Code SCC Daily Production
Rate - Year 15EF Units Control
Code
MD04 Molybdenum Concentrate Bin (B-MC) to MolybdenumConcentrate Hopper (H-MC)
DTrMlyCnc 3-03-024-08 NF 45.6 tons 0.0003 0.0002 0.00002 lb/ton None 0% 0.000008 0.000008 0.000004 0.000004 0.0000005 0.0000005
MD05 Molybdenum Concentrate Hopper (H-MC) to MolybdenumConcentrate Conveyor (CV-MC)
DTrMlyCncPrt 3-03-024-08 NF 45.6 tons 0.00004 0.00002 0.000003 lb/ton Enclosed a 100% 0 0 0 0 0 0
MD06 Molybdenum Concentrate Conveyor (CV-MC) to Molybdenum Packaging and Weigh System (MPS)
DTrMlyCnc 3-03-024-08 NF 45.6 tons 0.0003 0.0002 0.00002 lb/ton MDC 100% 0.000008 0 0.000004 0 0.0000005 0
Tailings Dewatering and Placement
TDS01 Tailings Filters (Ft-T1/T14) to Tailings Belt Feeders (F-T1/T14) FiltTailPrt 3-03-024-08 NF 257,328 tons 0.00002 0.00001 0.000002 lb/ton Enclosed a 100% 0 0 0 0 0 0
TDS02 Tailings Belt Feeders (F-T1/T14) to Fixed Tailings ConveyorNo. 1 (CV-F1)
FiltTailPrt 3-03-024-08 NF 257,328 tons 0.00002 0.00001 0.000002 lb/ton Enclosed a 100% 0 0 0 0 0 0
TDS03 Fixed Tailings Conveyor No. 1 (CV-F1) to Fixed TailingsConveyor No. 2 (CV-F2)
FiltTailPrt 3-03-024-08 NF 257,328 tons 0.00002 0.00001 0.000002 lb/ton Enclosed a 100% 0 0 0 0 0 0
TDS04 Fixed Tailings Conveyor No. 2 (CV-F2) to Fixed Tailings Conveyor No. 3 (CV-F3)
FiltTailPrt 3-03-024-08 NF 257,328 tons 0.00002 0.00001 0.000002 lb/ton None 0% 0.003 0.003 0.001 0.001 0.0002 0.0002
TDS05 Fixed Tailings Conveyor No. 3 (CV-F3) to RelocatableConveyor (CV-R1)
FiltTailPrt 3-03-024-08 F 257,328 tons 0.00002 0.00001 0.000002 lb/ton None 0% 0.003 0.003 0.001 0.001 0.0002 0.0002
TDS06 Relocatable Conveyor (CV-R1) to Shiftable Conveyor (CV-S1) FiltTailPrt 3-03-024-08 F 257,328 tons 0.00002 0.00001 0.000002 lb/ton None 0% 0.003 0.003 0.001 0.001 0.0002 0.0002
TDS07 Shiftable Conveyor (CV-S1) to Belt Wagon Conveyor(CV-BW1)
FiltTail 3-03-024-08 F 257,328 tons 0.0002 0.00009 0.00001 lb/ton None 0% 0.02 0.02 0.01 0.01 0.002 0.002
TDS08 Belt Wagon Conveyor (CV-BW1) to Spreader Crawler Mounted Conveyor (CV-SP1)
FiltTail 3-03-024-08 F 257,328 tons 0.0002 0.00009 0.00001 lb/ton None 0% 0.02 0.02 0.01 0.01 0.002 0.002
TDS09 Spreader Crawler Mounted Conveyor (CV-SP1) to Tailings Storage
FiltTail 3-03-024-08 F 257,328 tons 0.0002 0.00009 0.00001 lb/ton None 0% 0.02 0.02 0.01 0.01 0.002 0.002
TDS10 Wind Erosion of Tailings Storage TailStrg 3-03-888-01 F 1,500 acres 0.02 0.01 0.002 ton/acre-yr None 0% 0.08 0.08 0.04 0.04 0.006 0.006
Fuel Burning Equipment
FB01 Diesel Electrowinning Hot Water Generator (HWG) DFB 1-02-005-03 NF 24 hours 3.30 2.30 1.54 lb/1000 gal None 0% 0.002 0.002 0.001 0.001 0.0008 0.0008
6.0 MMBtu/hr
FB02 Thickener Area Emergency Generator (TEG) ICDE3 2-02-001-02 NF 24 hours 0.20 0.20 0.20 g/kW-hr None 0% 0.005 0.005 0.005 0.005 0.005 0.005
1,000 kW
FB03 PLS Pond Area Emergency Generator (PEG) ICDE3 2-02-001-02 NF 24 hours 0.20 0.20 0.20 g/kW-hr None 0% 0.005 0.005 0.005 0.005 0.005 0.005
1,000 kW
FB04 Main Substation Emergency Generator (MEG) ICDE3 2-02-001-02 NF 24 hours 0.20 0.20 0.20 g/kW-hr None 0% 0.004 0.004 0.004 0.004 0.004 0.004
750 kW
FB05 Administration Building Emergency Generator (AEG) ICDE3 2-02-001-02 NF 24 hours 0.20 0.20 0.20 g/kW-hr None 0% 0.004 0.004 0.004 0.004 0.004 0.004
750 kW
FB06 Electrowinning Building Emergency Generator (EWEG) ICDE1 2-02-001-02 NF 24 hours 0.40 0.40 0.40 g/kW-hr None 0% 0.0005 0.0005 0.0005 0.0005 0.0005 0.0005
50 kW
FB07 Primary Crusher Fire Water Pump (PCFWP) ICDE2 2-02-001-02 NF 24 hours 0.20 0.20 0.20 g/kW-hr None 0% 0.002 0.002 0.002 0.002 0.002 0.002
400 hp
Rosemont Copper ProjectEmission Inventory Information JBR ENVIRONMENTAL CONSULTANTS, INC.
November 2011Page H237
AZRP00419
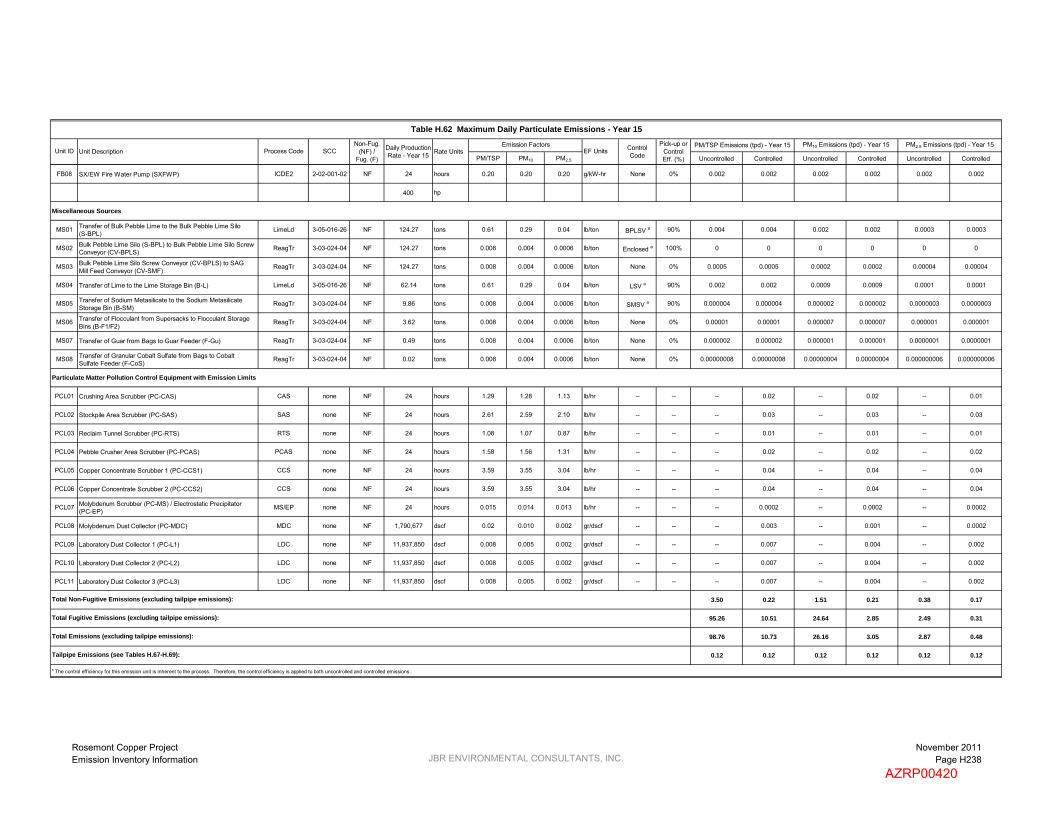
PM/TSP PM10 PM2.5 Uncontrolled Controlled Uncontrolled Controlled Uncontrolled Controlled
Table H.62 Maximum Daily Particulate Emissions - Year 15
PM/TSP Emissions (tpd) - Year 15 PM10 Emissions (tpd) - Year 15 PM2.5 Emissions (tpd) - Year 15Pick-up or Control Eff. (%)
Rate UnitsNon-Fug.
(NF) / Fug. (F)
Emission FactorsUnit ID Unit Description Process Code SCC Daily Production
Rate - Year 15EF Units Control
Code
FB08 SX/EW Fire Water Pump (SXFWP) ICDE2 2-02-001-02 NF 24 hours 0.20 0.20 0.20 g/kW-hr None 0% 0.002 0.002 0.002 0.002 0.002 0.002
400 hp
Miscellaneous Sources
MS01 Transfer of Bulk Pebble Lime to the Bulk Pebble Lime Silo(S-BPL) LimeLd 3-05-016-26 NF 124.27 tons 0.61 0.29 0.04 lb/ton BPLSV a 90% 0.004 0.004 0.002 0.002 0.0003 0.0003
MS02 Bulk Pebble Lime Silo (S-BPL) to Bulk Pebble Lime Silo Screw Conveyor (CV-BPLS) ReagTr 3-03-024-04 NF 124.27 tons 0.008 0.004 0.0006 lb/ton Enclosed a 100% 0 0 0 0 0 0
MS03 Bulk Pebble Lime Silo Screw Conveyor (CV-BPLS) to SAGMill Feed Conveyor (CV-SMF)
ReagTr 3-03-024-04 NF 124.27 tons 0.008 0.004 0.0006 lb/ton None 0% 0.0005 0.0005 0.0002 0.0002 0.00004 0.00004
MS04 Transfer of Lime to the Lime Storage Bin (B-L) LimeLd 3-05-016-26 NF 62.14 tons 0.61 0.29 0.04 lb/ton LSV a 90% 0.002 0.002 0.0009 0.0009 0.0001 0.0001
MS05 Transfer of Sodium Metasilicate to the Sodium MetasilicateStorage Bin (B-SM)
ReagTr 3-03-024-04 NF 9.86 tons 0.008 0.004 0.0006 lb/ton SMSV a 90% 0.000004 0.000004 0.000002 0.000002 0.0000003 0.0000003
MS06 Transfer of Flocculant from Supersacks to Flocculant Storage Bins (B-F1/F2)
ReagTr 3-03-024-04 NF 3.62 tons 0.008 0.004 0.0006 lb/ton None 0% 0.00001 0.00001 0.000007 0.000007 0.000001 0.000001
MS07 Transfer of Guar from Bags to Guar Feeder (F-Gu) ReagTr 3-03-024-04 NF 0.49 tons 0.008 0.004 0.0006 lb/ton None 0% 0.000002 0.000002 0.000001 0.000001 0.0000001 0.0000001
MS08 Transfer of Granular Cobalt Sulfate from Bags to CobaltSulfate Feeder (F-CoS)
ReagTr 3-03-024-04 NF 0.02 tons 0.008 0.004 0.0006 lb/ton None 0% 0.00000008 0.00000008 0.00000004 0.00000004 0.000000006 0.000000006
Particulate Matter Pollution Control Equipment with Emission Limits
PCL01 Crushing Area Scrubber (PC-CAS) CAS none NF 24 hours 1.29 1.28 1.13 lb/hr -- -- -- 0.02 -- 0.02 -- 0.01
PCL02 Stockpile Area Scrubber (PC-SAS) SAS none NF 24 hours 2.61 2.59 2.10 lb/hr -- -- -- 0.03 -- 0.03 -- 0.03
PCL03 Reclaim Tunnel Scrubber (PC-RTS) RTS none NF 24 hours 1.08 1.07 0.87 lb/hr -- -- -- 0.01 -- 0.01 -- 0.01
PCL04 Pebble Crusher Area Scrubber (PC-PCAS) PCAS none NF 24 hours 1.58 1.56 1.31 lb/hr -- -- -- 0.02 -- 0.02 -- 0.02
PCL05 Copper Concentrate Scrubber 1 (PC-CCS1) CCS none NF 24 hours 3.59 3.55 3.04 lb/hr -- -- -- 0.04 -- 0.04 -- 0.04
PCL06 Copper Concentrate Scrubber 2 (PC-CCS2) CCS none NF 24 hours 3.59 3.55 3.04 lb/hr -- -- -- 0.04 -- 0.04 -- 0.04
PCL07 Molybdenum Scrubber (PC-MS) / Electrostatic Precipitator (PC-EP) MS/EP none NF 24 hours 0.015 0.014 0.013 lb/hr -- -- -- 0.0002 -- 0.0002 -- 0.0002
PCL08 Molybdenum Dust Collector (PC-MDC) MDC none NF 1,790,677 dscf 0.02 0.010 0.002 gr/dscf -- -- -- 0.003 -- 0.001 -- 0.0002
PCL09 Laboratory Dust Collector 1 (PC-L1) LDC none NF 11,937,850 dscf 0.008 0.005 0.002 gr/dscf -- -- -- 0.007 -- 0.004 -- 0.002
PCL10 Laboratory Dust Collector 2 (PC-L2) LDC none NF 11,937,850 dscf 0.008 0.005 0.002 gr/dscf -- -- -- 0.007 -- 0.004 -- 0.002
PCL11 Laboratory Dust Collector 3 (PC-L3) LDC none NF 11,937,850 dscf 0.008 0.005 0.002 gr/dscf -- -- -- 0.007 -- 0.004 -- 0.002
3.50 0.22 1.51 0.21 0.38 0.17
95.26 10.51 24.64 2.85 2.49 0.31
98.76 10.73 26.16 3.05 2.87 0.48
0.12 0.12 0.12 0.12 0.12 0.12
a The control efficiency for this emission unit is inherent to the process. Therefore, the control efficiency is applied to both uncontrolled and controlled emissions.
Tailpipe Emissions (see Tables H.67-H.69):
Total Emissions (excluding tailpipe emissions):
Total Non-Fugitive Emissions (excluding tailpipe emissions):
Total Fugitive Emissions (excluding tailpipe emissions):
Rosemont Copper ProjectEmission Inventory Information JBR ENVIRONMENTAL CONSULTANTS, INC.
November 2011Page H238
AZRP00420

PM/TSP PM10 PM2.5 Uncontrolled Controlled Uncontrolled Controlled Uncontrolled Controlled
Mining
MN01 Drilling Drilling 3-05-020-10 F 80 holes 1.30 0.43 0.08 lb/hole None 0% 104.00 104.00 34.67 34.67 6.42 6.42
MN02 Blasting Blast 3-05-020-09 F 1.00 blasts 328.26 170.69 9.85 lb/blast None 0% 328.26 328.26 170.69 170.69 9.85 9.85
MN03 Loading Concentrate Ore Loading 3-03-024-08 F 3,750 tons 0.0007 0.0003 0.00005 lb/ton None 0% 2.63 2.63 1.24 1.24 0.19 0.19
MN04 Loading Leach Ore Loading 3-03-024-08 F 0 tons 0.0007 0.0003 0.00005 lb/ton None 0% 0 0 0 0 0 0
MN05 Loading Waste Rock Loading 3-03-024-08 F 7,125 tons 0.0007 0.0003 0.00005 lb/ton None 0% 5.00 5.00 2.36 2.36 0.36 0.36
MN06a Hauling Concentrate Ore to Primary Crusher Dump Hopper / Run of Mine Stockpile (Inside the Pit)
HaulingHD 3-05-020-11 F 84 VMT 21.25 5.46 0.55 lb/VMT HaulRdUI 90% 1776.94 177.69 456.59 45.66 45.66 4.57
MN06b Hauling Concentrate Ore to Primary Crusher Dump Hopper / Run of Mine Stockpile (Outside the Pit)
HaulingHD 3-05-020-11 F 18 VMT 21.25 5.46 0.55 lb/VMT HaulRdUO 90% 372.77 37.28 95.78 9.58 9.58 0.96
MN07a Hauling Leach Ore to Leach Pad (Inside the Pit) HaulingHD 3-05-020-11 F 0 VMT 21.25 5.46 0.55 lb/VMT HaulRdUI 90% 0 0 0 0 0 0
MN07b Hauling Leach Ore to Leach Pad (Outside the Pit) HaulingHD 3-05-020-11 F 0 VMT 21.25 5.46 0.55 lb/VMT HaulRdUO 90% 0 0 0 0 0 0
MN08a Hauling Waste Rock to Waste Rock Storage Area (Inside the Pit)
HaulingHD 3-05-020-11 F 82 VMT 21.25 5.46 0.55 lb/VMT HaulRdUI 90% 1,747.73 174.77 449.08 44.91 44.91 4.49
MN08b Hauling Waste Rock to Waste Rock Storage Area (Outside the Pit)
HaulingHD 3-05-020-11 F 117 VMT 21.25 5.46 0.55 lb/VMT HaulRdUO 90% 2,494.53 249.45 640.98 64.10 64.10 6.41
MN09 Unloading Concentrate Ore to Run of Mine Stockpile TrStnUnp 3-03-024-08 F 3,750 tons 0.001 0.0006 0.00009 lb/ton None 0% 4.46 4.46 2.11 2.11 0.32 0.32
MN10 Unloading Leach Ore to Leach Pad TrStnUnp 3-03-024-08 F 0 tons 0.001 0.0006 0.00009 lb/ton None 0% 0 0 0 0 0 0
MN11 Unloading Waste Rock to Waste Rock Storage Area TrStnUnp 3-03-024-08 F 7,125 tons 0.001 0.0006 0.00009 lb/ton None 0% 8.47 8.47 4.00 4.00 0.61 0.61
MN12 Bulldozer Use Bldzrs 3-05-010-99 F 6 hrs 2.82 0.43 0.30 lb/hr None 0% 16.69 16.69 2.52 2.52 1.75 1.75
MN13a Water Truck Use (Inside the Pit) WtrTrksHD 3-05-010-99 F 11 VMT 17.06 4.38 0.44 lb/VMT HaulRdWTI 90% 184.33 18.43 47.36 4.74 4.74 0.47
MN13b Water Truck Use (Outside the Pit) WtrTrksHD 3-05-010-99 F 9 VMT 17.06 4.38 0.44 lb/VMT HaulRdWTO 90% 149.95 14.99 38.53 3.85 3.85 0.39
MN14 Grader Use GradersY15 3-05-010-99 F 10 VMT 2.05 0.71 0.06 lb/VMT None 0% 20.40 20.40 7.10 7.10 0.63 0.63
MN15a Support Vehicle Use (Inside the Pit) SupVehY15H 3-05-010-99 F 118 VMT 6.96 1.79 0.18 lb/VMT HaulRdUI 90% 823.98 82.40 211.72 21.17 21.17 2.12
MN15b Support Vehicle Use (Outside the Pit) SupVehY15H 3-05-010-99 F 118 VMT 6.96 1.79 0.18 lb/VMT HaulRdUO 90% 823.98 82.40 211.72 21.17 21.17 2.12
Primary Crushing, Conveying, Coarse Ore Storage, and Reclaim Conveying
PC01 Wind Erosion of the Run of Mine Stockpile WindROM 3-03-888-01 F 26 acres 0.21 0.11 0.02 ton/acre-yr None 0% 1.24 1.24 0.62 0.62 0.09 0.09
PC02 Unloading to Primary Crusher Dump Hopper (H-CDp) fromHaul Trucks or Run of Mine Stockpile
TrStnUnp 3-03-024-08 F 6,950 tons 0.001 0.0006 0.00009 lb/ton WSpry 82.5% 8.26 1.45 3.91 0.68 0.59 0.10
PC03 Primary Crusher (PCr) CrushP 3-03-024-05 NF 6,950 tons 0.02 0.009 0.002 lb/ton CAS 100% 139.00 0 62.55 0 11.58 0
PC04 Primary Crusher (PCr) to Crusher Discharge Hopper (H-CDs) TrStnPrt 3-03-024-08 NF 6,950 tons 0.0002 0.00007 0.00001 lb/ton Enclosed a 100% 0 0 0 0 0 0
PC05 Crusher Discharge Hopper (H-CDs) to Crusher DischargeFeeder (F-CD)
TrStnPrt 3-03-024-08 NF 6,950 tons 0.0002 0.00007 0.00001 lb/ton CAS 100% 1.08 0 0.51 0 0.08 0
PC06 Crusher Discharge Feeder (F-CD) to Stockpile FeedConveyor (CV-SF)
TrStnPrt 3-03-024-08 NF 6,950 tons 0.0002 0.00007 0.00001 lb/ton CAS 100% 1.08 0 0.51 0 0.08 0
PC07 Stockpile Feed Conveyor (CV-SF) to Stockpile TripperConveyor (CV-ST)
TrStnPrt 3-03-024-08 NF 6,950 tons 0.0002 0.00007 0.00001 lb/ton SAS 100% 1.08 0 0.51 0 0.08 0
Table H.63 Maximum Hourly Particulate Emissions - Year 15Hourly
Production Rate - Year 15
SCC EF UnitsUnit Description Control Code
PM10 Emissions (lb/hr) - Year 15 PM2.5 Emissions (lb/hr) - Year 15Process Code
Emission Factors PM/TSP Emissions (lb/hr) - Year 15Unit ID
Pick-up or Control Eff. (%)
Non-Fug. (NF) /
Fug. (F)Rate Units
Rosemont Copper ProjectEmission Inventory Information JBR ENVIRONMENTAL CONSULTANTS, INC.
November 2011Page H239
AZRP00421
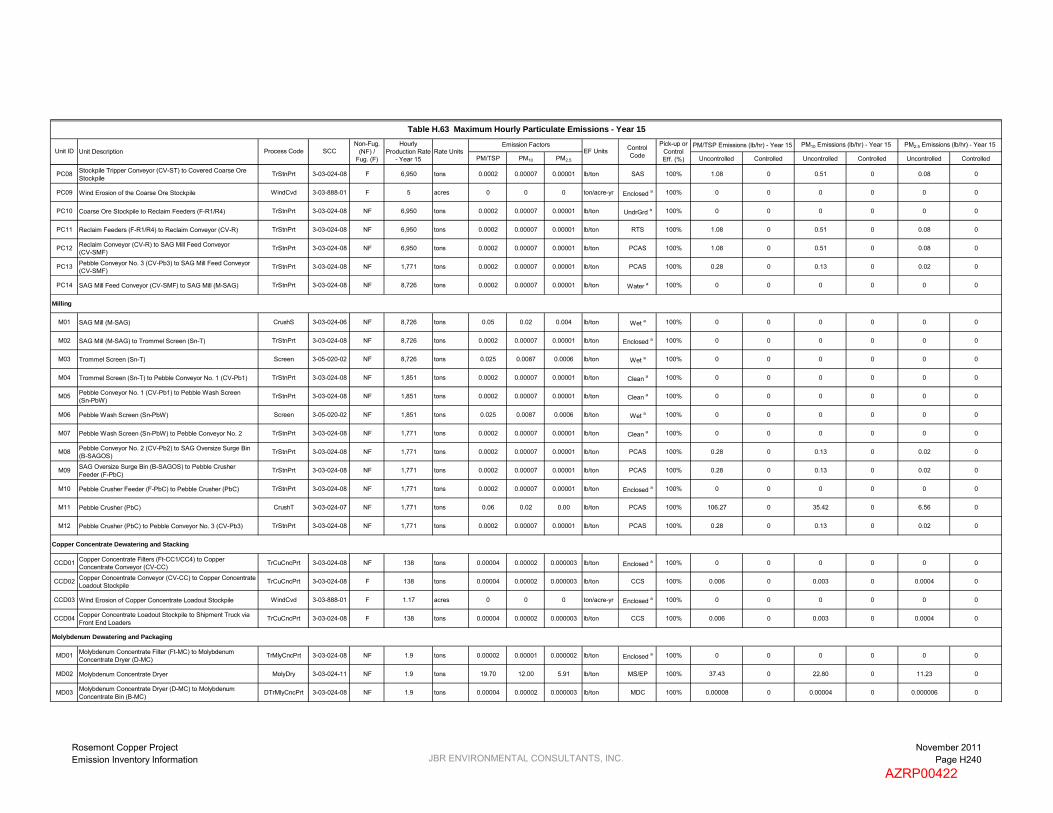
PM/TSP PM10 PM2.5 Uncontrolled Controlled Uncontrolled Controlled Uncontrolled Controlled
Table H.63 Maximum Hourly Particulate Emissions - Year 15Hourly
Production Rate - Year 15
SCC EF UnitsUnit Description Control Code
PM10 Emissions (lb/hr) - Year 15 PM2.5 Emissions (lb/hr) - Year 15Process Code
Emission Factors PM/TSP Emissions (lb/hr) - Year 15Unit ID
Pick-up or Control Eff. (%)
Non-Fug. (NF) /
Fug. (F)Rate Units
PC08 Stockpile Tripper Conveyor (CV-ST) to Covered Coarse Ore Stockpile
TrStnPrt 3-03-024-08 F 6,950 tons 0.0002 0.00007 0.00001 lb/ton SAS 100% 1.08 0 0.51 0 0.08 0
PC09 Wind Erosion of the Coarse Ore Stockpile WindCvd 3-03-888-01 F 5 acres 0 0 0 ton/acre-yr Enclosed a 100% 0 0 0 0 0 0
PC10 Coarse Ore Stockpile to Reclaim Feeders (F-R1/R4) TrStnPrt 3-03-024-08 NF 6,950 tons 0.0002 0.00007 0.00001 lb/ton UndrGrd a 100% 0 0 0 0 0 0
PC11 Reclaim Feeders (F-R1/R4) to Reclaim Conveyor (CV-R) TrStnPrt 3-03-024-08 NF 6,950 tons 0.0002 0.00007 0.00001 lb/ton RTS 100% 1.08 0 0.51 0 0.08 0
PC12 Reclaim Conveyor (CV-R) to SAG Mill Feed Conveyor(CV-SMF) TrStnPrt 3-03-024-08 NF 6,950 tons 0.0002 0.00007 0.00001 lb/ton PCAS 100% 1.08 0 0.51 0 0.08 0
PC13 Pebble Conveyor No. 3 (CV-Pb3) to SAG Mill Feed Conveyor (CV-SMF)
TrStnPrt 3-03-024-08 NF 1,771 tons 0.0002 0.00007 0.00001 lb/ton PCAS 100% 0.28 0 0.13 0 0.02 0
PC14 SAG Mill Feed Conveyor (CV-SMF) to SAG Mill (M-SAG) TrStnPrt 3-03-024-08 NF 8,726 tons 0.0002 0.00007 0.00001 lb/ton Water a 100% 0 0 0 0 0 0
Milling
M01 SAG Mill (M-SAG) CrushS 3-03-024-06 NF 8,726 tons 0.05 0.02 0.004 lb/ton Wet a 100% 0 0 0 0 0 0
M02 SAG Mill (M-SAG) to Trommel Screen (Sn-T) TrStnPrt 3-03-024-08 NF 8,726 tons 0.0002 0.00007 0.00001 lb/ton Enclosed a 100% 0 0 0 0 0 0
M03 Trommel Screen (Sn-T) Screen 3-05-020-02 NF 8,726 tons 0.025 0.0087 0.0006 lb/ton Wet a 100% 0 0 0 0 0 0
M04 Trommel Screen (Sn-T) to Pebble Conveyor No. 1 (CV-Pb1) TrStnPrt 3-03-024-08 NF 1,851 tons 0.0002 0.00007 0.00001 lb/ton Clean a 100% 0 0 0 0 0 0
M05 Pebble Conveyor No. 1 (CV-Pb1) to Pebble Wash Screen(Sn-PbW)
TrStnPrt 3-03-024-08 NF 1,851 tons 0.0002 0.00007 0.00001 lb/ton Clean a 100% 0 0 0 0 0 0
M06 Pebble Wash Screen (Sn-PbW) Screen 3-05-020-02 NF 1,851 tons 0.025 0.0087 0.0006 lb/ton Wet a 100% 0 0 0 0 0 0
M07 Pebble Wash Screen (Sn-PbW) to Pebble Conveyor No. 2 TrStnPrt 3-03-024-08 NF 1,771 tons 0.0002 0.00007 0.00001 lb/ton Clean a 100% 0 0 0 0 0 0
M08 Pebble Conveyor No. 2 (CV-Pb2) to SAG Oversize Surge Bin(B-SAGOS) TrStnPrt 3-03-024-08 NF 1,771 tons 0.0002 0.00007 0.00001 lb/ton PCAS 100% 0.28 0 0.13 0 0.02 0
M09 SAG Oversize Surge Bin (B-SAGOS) to Pebble CrusherFeeder (F-PbC)
TrStnPrt 3-03-024-08 NF 1,771 tons 0.0002 0.00007 0.00001 lb/ton PCAS 100% 0.28 0 0.13 0 0.02 0
M10 Pebble Crusher Feeder (F-PbC) to Pebble Crusher (PbC) TrStnPrt 3-03-024-08 NF 1,771 tons 0.0002 0.00007 0.00001 lb/ton Enclosed a 100% 0 0 0 0 0 0
M11 Pebble Crusher (PbC) CrushT 3-03-024-07 NF 1,771 tons 0.06 0.02 0.00 lb/ton PCAS 100% 106.27 0 35.42 0 6.56 0
M12 Pebble Crusher (PbC) to Pebble Conveyor No. 3 (CV-Pb3) TrStnPrt 3-03-024-08 NF 1,771 tons 0.0002 0.00007 0.00001 lb/ton PCAS 100% 0.28 0 0.13 0 0.02 0
Copper Concentrate Dewatering and Stacking
CCD01 Copper Concentrate Filters (Ft-CC1/CC4) to Copper Concentrate Conveyor (CV-CC) TrCuCncPrt 3-03-024-08 NF 138 tons 0.00004 0.00002 0.000003 lb/ton Enclosed a 100% 0 0 0 0 0 0
CCD02 Copper Concentrate Conveyor (CV-CC) to Copper Concentrate Loadout Stockpile
TrCuCncPrt 3-03-024-08 F 138 tons 0.00004 0.00002 0.000003 lb/ton CCS 100% 0.006 0 0.003 0 0.0004 0
CCD03 Wind Erosion of Copper Concentrate Loadout Stockpile WindCvd 3-03-888-01 F 1.17 acres 0 0 0 ton/acre-yr Enclosed a 100% 0 0 0 0 0 0
CCD04 Copper Concentrate Loadout Stockpile to Shipment Truck via Front End Loaders
TrCuCncPrt 3-03-024-08 F 138 tons 0.00004 0.00002 0.000003 lb/ton CCS 100% 0.006 0 0.003 0 0.0004 0
Molybdenum Dewatering and Packaging
MD01 Molybdenum Concentrate Filter (Ft-MC) to Molybdenum Concentrate Dryer (D-MC)
TrMlyCncPrt 3-03-024-08 NF 1.9 tons 0.00002 0.00001 0.000002 lb/ton Enclosed a 100% 0 0 0 0 0 0
MD02 Molybdenum Concentrate Dryer MolyDry 3-03-024-11 NF 1.9 tons 19.70 12.00 5.91 lb/ton MS/EP 100% 37.43 0 22.80 0 11.23 0
MD03 Molybdenum Concentrate Dryer (D-MC) to MolybdenumConcentrate Bin (B-MC)
DTrMlyCncPrt 3-03-024-08 NF 1.9 tons 0.00004 0.00002 0.000003 lb/ton MDC 100% 0.00008 0 0.00004 0 0.000006 0
Rosemont Copper ProjectEmission Inventory Information JBR ENVIRONMENTAL CONSULTANTS, INC.
November 2011Page H240
AZRP00422

PM/TSP PM10 PM2.5 Uncontrolled Controlled Uncontrolled Controlled Uncontrolled Controlled
Table H.63 Maximum Hourly Particulate Emissions - Year 15Hourly
Production Rate - Year 15
SCC EF UnitsUnit Description Control Code
PM10 Emissions (lb/hr) - Year 15 PM2.5 Emissions (lb/hr) - Year 15Process Code
Emission Factors PM/TSP Emissions (lb/hr) - Year 15Unit ID
Pick-up or Control Eff. (%)
Non-Fug. (NF) /
Fug. (F)Rate Units
MD04 Molybdenum Concentrate Bin (B-MC) to MolybdenumConcentrate Hopper (H-MC)
DTrMlyCnc 3-03-024-08 NF 1.9 tons 0.0003 0.0002 0.00002 lb/ton None 0% 0.0006 0.0006 0.0003 0.0003 0.00004 0.00004
MD05 Molybdenum Concentrate Hopper (H-MC) to MolybdenumConcentrate Conveyor (CV-MC)
DTrMlyCncPrt 3-03-024-08 NF 1.9 tons 0.00004 0.00002 0.000003 lb/ton Enclosed a 100% 0 0 0 0 0 0
MD06 Molybdenum Concentrate Conveyor (CV-MC) to Molybdenum Packaging and Weigh System (MPS)
DTrMlyCnc 3-03-024-08 NF 1.9 tons 0.0003 0.0002 0.00002 lb/ton MDC 100% 0.0006 0 0.0003 0 0.00004 0
Tailings Dewatering and Placement
TDS01 Tailings Filters (Ft-T1/T14) to Tailings Belt Feeders (F-T1/T14) FiltTailPrt 3-03-024-08 NF 10,722 tons 0.00002 0.00001 0.000002 lb/ton Enclosed a 100% 0 0 0 0 0 0
TDS02 Tailings Belt Feeders (F-T1/T14) to Fixed Tailings ConveyorNo. 1 (CV-F1)
FiltTailPrt 3-03-024-08 NF 10,722 tons 0.00002 0.00001 0.000002 lb/ton Enclosed a 100% 0 0 0 0 0 0
TDS03 Fixed Tailings Conveyor No. 1 (CV-F1) to Fixed TailingsConveyor No. 2 (CV-F2)
FiltTailPrt 3-03-024-08 NF 10,722 tons 0.00002 0.00001 0.000002 lb/ton Enclosed a 100% 0 0 0 0 0 0
TDS04 Fixed Tailings Conveyor No. 2 (CV-F2) to Fixed Tailings Conveyor No. 3 (CV-F3)
FiltTailPrt 3-03-024-08 NF 10,722 tons 0.00002 0.00001 0.000002 lb/ton None 0% 0.26 0.26 0.12 0.12 0.02 0.02
TDS05 Fixed Tailings Conveyor No. 3 (CV-F3) to RelocatableConveyor (CV-R1)
FiltTailPrt 3-03-024-08 F 10,722 tons 0.00002 0.00001 0.000002 lb/ton None 0% 0.26 0.26 0.12 0.12 0.02 0.02
TDS06 Relocatable Conveyor (CV-R1) to Shiftable Conveyor (CV-S1) FiltTailPrt 3-03-024-08 F 10,722 tons 0.00002 0.00001 0.000002 lb/ton None 0% 0.26 0.26 0.12 0.12 0.02 0.02
TDS07 Shiftable Conveyor (CV-S1) to Belt Wagon Conveyor(CV-BW1)
FiltTail 3-03-024-08 F 10,722 tons 0.0002 0.00009 0.00001 lb/ton None 0% 2.00 2.00 0.95 0.95 0.14 0.14
TDS08 Belt Wagon Conveyor (CV-BW1) to Spreader Crawler Mounted Conveyor (CV-SP1)
FiltTail 3-03-024-08 F 10,722 tons 0.0002 0.00009 0.00001 lb/ton None 0% 2.00 2.00 0.95 0.95 0.14 0.14
TDS09 Spreader Crawler Mounted Conveyor (CV-SP1) to Tailings Storage
FiltTail 3-03-024-08 F 10,722 tons 0.0002 0.00009 0.00001 lb/ton None 0% 2.00 2.00 0.95 0.95 0.14 0.14
TDS10 Wind Erosion of Tailings Storage TailStrg 3-03-888-01 F 1,500 acres 0.02 0.01 0.002 ton/acre-yr None 0% 6.90 6.90 3.45 3.45 0.52 0.52
Fuel Burning Equipment
FB01 Diesel Electrowinning Hot Water Generator (HWG) DFB 1-02-005-03 NF 1 hours 3.30 2.30 1.54 lb/1000 gal None 0% 0.14 0.14 0.10 0.10 0.07 0.07
6.0 MMBtu/hr
FB02 Thickener Area Emergency Generator (TEG) ICDE3 2-02-001-02 NF 1 hours 0.20 0.20 0.20 g/kW-hr None 0% 0.44 0.44 0.44 0.44 0.44 0.44
1,000 kW
FB03 PLS Pond Area Emergency Generator (PEG) ICDE3 2-02-001-02 NF 1 hours 0.20 0.20 0.20 g/kW-hr None 0% 0.44 0.44 0.44 0.44 0.44 0.44
1,000 kW
FB04 Main Substation Emergency Generator (MEG) ICDE3 2-02-001-02 NF 1 hours 0.20 0.20 0.20 g/kW-hr None 0% 0.33 0.33 0.33 0.33 0.33 0.33
750 kW
FB05 Administration Building Emergency Generator (AEG) ICDE3 2-02-001-02 NF 1 hours 0.20 0.20 0.20 g/kW-hr None 0% 0.33 0.33 0.33 0.33 0.33 0.33
750 kW
FB06 Electrowinning Building Emergency Generator (EWEG) ICDE1 2-02-001-02 NF 1 hours 0.40 0.40 0.40 g/kW-hr None 0% 0.04 0.04 0.04 0.04 0.04 0.04
50 kW
FB07 Primary Crusher Fire Water Pump (PCFWP) ICDE2 2-02-001-02 NF 1 hours 0.20 0.20 0.20 g/kW-hr None 0% 0.13 0.13 0.13 0.13 0.13 0.13
400 hp
Rosemont Copper ProjectEmission Inventory Information JBR ENVIRONMENTAL CONSULTANTS, INC.
November 2011Page H241
AZRP00423

PM/TSP PM10 PM2.5 Uncontrolled Controlled Uncontrolled Controlled Uncontrolled Controlled
Table H.63 Maximum Hourly Particulate Emissions - Year 15Hourly
Production Rate - Year 15
SCC EF UnitsUnit Description Control Code
PM10 Emissions (lb/hr) - Year 15 PM2.5 Emissions (lb/hr) - Year 15Process Code
Emission Factors PM/TSP Emissions (lb/hr) - Year 15Unit ID
Pick-up or Control Eff. (%)
Non-Fug. (NF) /
Fug. (F)Rate Units
FB08 SX/EW Fire Water Pump (SXFWP) ICDE2 2-02-001-02 NF 1 hours 0.20 0.20 0.20 g/kW-hr None 0% 0.13 0.13 0.13 0.13 0.13 0.13
400 hp
Miscellaneous Sources
MS01 Transfer of Bulk Pebble Lime to the Bulk Pebble Lime Silo(S-BPL) LimeLd 3-05-016-26 NF 5.18 tons 0.61 0.29 0.04 lb/ton BPLSV a 90% 0.32 0.32 0.15 0.15 0.02 0.02
MS02 Bulk Pebble Lime Silo (S-BPL) to Bulk Pebble Lime Silo Screw Conveyor (CV-BPLS) ReagTr 3-03-024-04 NF 5.18 tons 0.008 0.004 0.0006 lb/ton Enclosed a 100% 0 0 0 0 0 0
MS03 Bulk Pebble Lime Silo Screw Conveyor (CV-BPLS) to SAGMill Feed Conveyor (CV-SMF)
ReagTr 3-03-024-04 NF 5.18 tons 0.008 0.004 0.0006 lb/ton None 0% 0.04 0.04 0.02 0.02 0.003 0.003
MS04 Transfer of Lime to the Lime Storage Bin (B-L) LimeLd 3-05-016-26 NF 2.59 tons 0.61 0.29 0.04 lb/ton LSV a 90% 0.16 0.16 0.07 0.07 0.01 0.01
MS05 Transfer of Sodium Metasilicate to the Sodium MetasilicateStorage Bin (B-SM)
ReagTr 3-03-024-04 NF 0.41 tons 0.008 0.004 0.0006 lb/ton SMSV a 90% 0.0003 0.0003 0.0002 0.0002 0.00002 0.00002
MS06 Transfer of Flocculant from Supersacks to Flocculant Storage Bins (B-F1/F2)
ReagTr 3-03-024-04 NF 0.15 tons 0.008 0.004 0.0006 lb/ton None 0% 0.001 0.001 0.0006 0.0006 0.00009 0.00009
MS07 Transfer of Guar from Bags to Guar Feeder (F-Gu) ReagTr 3-03-024-04 NF 0.02 tons 0.008 0.004 0.0006 lb/ton None 0% 0.0002 0.0002 0.00008 0.00008 0.00001 0.00001
MS08 Transfer of Granular Cobalt Sulfate from Bags to CobaltSulfate Feeder (F-CoS)
ReagTr 3-03-024-04 NF 0.0008 tons 0.008 0.004 0.0006 lb/ton None 0% 0.000007 0.000007 0.000003 0.000003 0.0000005 0.0000005
Particulate Matter Pollution Control Equipment with Emission Limits
PCL01 Crushing Area Scrubber (PC-CAS) CAS none NF 1 hours 1.29 1.28 1.13 lb/hr -- -- -- 1.29 -- 1.28 -- 1.13
PCL02 Stockpile Area Scrubber (PC-SAS) SAS none NF 1 hours 2.61 2.59 2.10 lb/hr -- -- -- 2.61 -- 2.59 -- 2.10
PCL03 Reclaim Tunnel Scrubber (PC-RTS) RTS none NF 1 hours 1.08 1.07 0.87 lb/hr -- -- -- 1.08 -- 1.07 -- 0.87
PCL04 Pebble Crusher Area Scrubber (PC-PCAS) PCAS none NF 1 hours 1.58 1.56 1.31 lb/hr -- -- -- 1.58 -- 1.56 -- 1.31
PCL05 Copper Concentrate Scrubber 1 (PC-CCS1) CCS none NF 1 hours 3.59 3.55 3.04 lb/hr -- -- -- 3.59 -- 3.55 -- 3.04
PCL06 Copper Concentrate Scrubber 2 (PC-CCS2) CCS none NF 1 hours 3.59 3.55 3.04 lb/hr -- -- -- 3.59 -- 3.55 -- 3.04
PCL07 Molybdenum Scrubber (PC-MS) / Electrostatic Precipitator (PC-EP) MS/EP none NF 1 hours 0.015 0.014 0.013 lb/hr -- -- -- 0.02 -- 0.01 -- 0.01
PCL08 Molybdenum Dust Collector (PC-MDC) MDC none NF 74,612 dscf 0.02 0.010 0.002 gr/dscf -- -- -- 0.23 -- 0.11 -- 0.02
PCL09 Laboratory Dust Collector 1 (PC-L1) LDC none NF 497,410 dscf 0.008 0.005 0.002 gr/dscf -- -- -- 0.58 -- 0.36 -- 0.17
PCL10 Laboratory Dust Collector 2 (PC-L2) LDC none NF 497,410 dscf 0.008 0.005 0.002 gr/dscf -- -- -- 0.58 -- 0.36 -- 0.17
PCL11 Laboratory Dust Collector 3 (PC-L3) LDC none NF 497,410 dscf 0.008 0.005 0.002 gr/dscf -- -- -- 0.58 -- 0.36 -- 0.17
291.99 18.51 126.18 17.11 31.81 14.02
8,888.15 1,343.44 2,388.06 447.72 237.05 42.82
9,180.14 1,361.96 2,514.23 464.83 268.86 56.84
9.94 9.94 9.94 9.94 9.94 9.94
a The control efficiency for this emission unit is inherent to the process. Therefore, the control efficiency is applied to both uncontrolled and controlled emissions.
Tailpipe Emissions (see Tables H.67-H.69):
Total Emissions (excluding tailpipe emissions):
Total Fugitive Emissions (excluding tailpipe emissions):
Total Non-Fugitive Emissions (excluding tailpipe emissions):
Rosemont Copper ProjectEmission Inventory Information JBR ENVIRONMENTAL CONSULTANTS, INC.
November 2011Page H242
AZRP00424
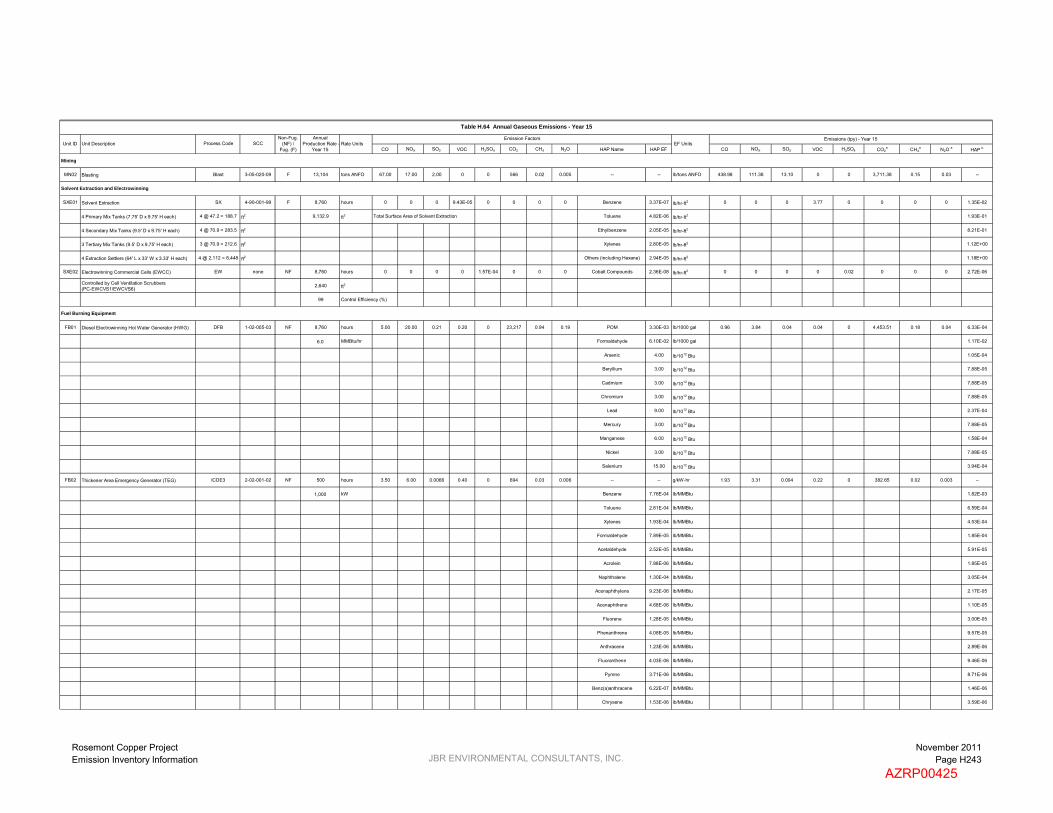
CO NOX SO2 VOC H2SO4 CO2 CH4 N2O HAP Name HAP EF CO NOX SO2 VOC H2SO4 CO2a CH4
a N2O a HAP b
Mining
MN02 Blasting Blast 3-05-020-09 F 13,104 tons ANFO 67.00 17.00 2.00 0 0 566 0.02 0.005 -- -- lb/tons ANFO 438.98 111.38 13.10 0 0 3,711.38 0.15 0.03 --
Solvent Extraction and Electrowinning
SXE01 Solvent Extraction SX 4-90-001-99 F 8,760 hours 0 0 0 9.43E-05 0 0 0 0 Benzene 3.37E-07 lb/hr-ft2 0 0 0 3.77 0 0 0 0 1.35E-02
4 Primary Mix Tanks (7.75' D x 9.75' H each) 4 @ 47.2 = 188.7 ft2 9,132.9 ft2 Total Surface Area of Solvent Extraction Toluene 4.82E-06 lb/hr-ft2 1.93E-01
4 Secondary Mix Tanks (9.5' D x 9.75' H each) 4 @ 70.9 = 283.5 ft2 Ethylbenzene 2.05E-05 lb/hr-ft2 8.21E-01
3 Tertiary Mix Tanks (9.5' D x 9.75' H each) 3 @ 70.9 = 212.6 ft2 Xylenes 2.80E-05 lb/hr-ft2 1.12E+00
4 Extraction Settlers (64' L x 33' W x 3.33' H each) 4 @ 2,112 = 8,448 ft2 Others (including Hexane) 2.94E-05 lb/hr-ft2 1.18E+00
SXE02 Electrowinning Commercial Cells (EWCC) EW none NF 8,760 hours 0 0 0 0 1.57E-04 0 0 0 Cobalt Compounds 2.36E-08 lb/hr-ft2 0 0 0 0 0.02 0 0 0 2.72E-06
Controlled by Cell Ventilation Scrubbers(PC-EWCVS1/EWCVS6)
2,640 ft2
99 Control Efficiency (%)
Fuel Burning Equipment
FB01 Diesel Electrowinning Hot Water Generator (HWG) DFB 1-02-005-03 NF 8,760 hours 5.00 20.00 0.21 0.20 0 23,217 0.94 0.19 POM 3.30E-03 lb/1000 gal 0.96 3.84 0.04 0.04 0 4,453.51 0.18 0.04 6.33E-04
6.0 MMBtu/hr Formaldehyde 6.10E-02 lb/1000 gal 1.17E-02
Arsenic 4.00 lb/1012 Btu 1.05E-04
Beryllium 3.00 lb/1012 Btu 7.88E-05
Cadmium 3.00 lb/1012 Btu 7.88E-05
Chromium 3.00 lb/1012 Btu 7.88E-05
Lead 9.00 lb/1012 Btu 2.37E-04
Mercury 3.00 lb/1012 Btu 7.88E-05
Manganese 6.00 lb/1012 Btu 1.58E-04
Nickel 3.00 lb/1012 Btu 7.88E-05
Selenium 15.00 lb/1012 Btu 3.94E-04
FB02 Thickener Area Emergency Generator (TEG) ICDE3 2-02-001-02 NF 500 hours 3.50 6.00 0.0066 0.40 0 694 0.03 0.006 -- -- g/kW-hr 1.93 3.31 0.004 0.22 0 382.65 0.02 0.003 --
1,000 kW Benzene 7.76E-04 lb/MMBtu 1.82E-03
Toluene 2.81E-04 lb/MMBtu 6.59E-04
Xylenes 1.93E-04 lb/MMBtu 4.53E-04
Formaldehyde 7.89E-05 lb/MMBtu 1.85E-04
Acetaldehyde 2.52E-05 lb/MMBtu 5.91E-05
Acrolein 7.88E-06 lb/MMBtu 1.85E-05
Naphthalene 1.30E-04 lb/MMBtu 3.05E-04
Acenaphthylene 9.23E-06 lb/MMBtu 2.17E-05
Acenaphthene 4.68E-06 lb/MMBtu 1.10E-05
Fluorene 1.28E-05 lb/MMBtu 3.00E-05
Phenanthrene 4.08E-05 lb/MMBtu 9.57E-05
Anthracene 1.23E-06 lb/MMBtu 2.89E-06
Fluoranthene 4.03E-06 lb/MMBtu 9.46E-06
Pyrene 3.71E-06 lb/MMBtu 8.71E-06
Benz(a)anthracene 6.22E-07 lb/MMBtu 1.46E-06
Chrysene 1.53E-06 lb/MMBtu 3.59E-06
Table H.64 Annual Gaseous Emissions - Year 15
Emissions (tpy) - Year 15Emission FactorsSCCUnit ID EF UnitsUnit Description Process Code
Non-Fug. (NF) /
Fug. (F)Rate Units
Annual Production Rate -
Year 15
Rosemont Copper ProjectEmission Inventory Information JBR ENVIRONMENTAL CONSULTANTS, INC.
November 2011Page H243
AZRP00425

CO NOX SO2 VOC H2SO4 CO2 CH4 N2O HAP Name HAP EF CO NOX SO2 VOC H2SO4 CO2a CH4
a N2O a HAP b
Table H.64 Annual Gaseous Emissions - Year 15
Emissions (tpy) - Year 15Emission FactorsSCCUnit ID EF UnitsUnit Description Process Code
Non-Fug. (NF) /
Fug. (F)Rate Units
Annual Production Rate -
Year 15
Benzo(b)fluoranthene 1.11E-06 lb/MMBtu 2.60E-06
Benzo(k)fluoranthene 2.18E-07 lb/MMBtu 5.12E-07
Benzo(a)pyrene 2.57E-07 lb/MMBtu 6.03E-07
Indeno(1,2,3-cd)pyrene 4.14E-07 lb/MMBtu 9.72E-07
Dibenz(a,h)anthracene 3.46E-07 lb/MMBtu 8.12E-07
Benzo(g,h,i)perylene 5.56E-07 lb/MMBtu 1.30E-06
FB03 PLS Pond Area Emergency Generator (PEG) ICDE3 2-02-001-02 NF 500 hours 3.50 6.00 0.0066 0.40 0 694 0.03 0.006 -- -- g/kW-hr 1.93 3.31 0.004 0.22 0 382.65 0.02 0.003 --
1,000 kW Benzene 7.76E-04 lb/MMBtu 1.82E-03
Toluene 2.81E-04 lb/MMBtu 6.59E-04
Xylenes 1.93E-04 lb/MMBtu 4.53E-04
Formaldehyde 7.89E-05 lb/MMBtu 1.85E-04
Acetaldehyde 2.52E-05 lb/MMBtu 5.91E-05
Acrolein 7.88E-06 lb/MMBtu 1.85E-05
Naphthalene 1.30E-04 lb/MMBtu 3.05E-04
Acenaphthylene 9.23E-06 lb/MMBtu 2.17E-05
Acenaphthene 4.68E-06 lb/MMBtu 1.10E-05
Fluorene 1.28E-05 lb/MMBtu 3.00E-05
Phenanthrene 4.08E-05 lb/MMBtu 9.57E-05
Anthracene 1.23E-06 lb/MMBtu 2.89E-06
Fluoranthene 4.03E-06 lb/MMBtu 9.46E-06
Pyrene 3.71E-06 lb/MMBtu 8.71E-06
Benz(a)anthracene 6.22E-07 lb/MMBtu 1.46E-06
Chrysene 1.53E-06 lb/MMBtu 3.59E-06
Benzo(b)fluoranthene 1.11E-06 lb/MMBtu 2.60E-06
Benzo(k)fluoranthene 2.18E-07 lb/MMBtu 5.12E-07
Benzo(a)pyrene 2.57E-07 lb/MMBtu 6.03E-07
Indeno(1,2,3-cd)pyrene 4.14E-07 lb/MMBtu 9.72E-07
Dibenz(a,h)anthracene 3.46E-07 lb/MMBtu 8.12E-07
Benzo(g,h,i)perylene 5.56E-07 lb/MMBtu 1.30E-06
FB04 Main Substation Emergency Generator (MEG) ICDE3 2-02-001-02 NF 500 hours 3.50 6.00 0.0066 0.40 0 694 0.03 0.006 -- -- g/kW-hr 1.45 2.48 0.003 0.17 0 286.99 0.01 0.002 --
750 kW Benzene 7.76E-04 lb/MMBtu 1.37E-03
Toluene 2.81E-04 lb/MMBtu 4.95E-04
Xylenes 1.93E-04 lb/MMBtu 3.40E-04
Formaldehyde 7.89E-05 lb/MMBtu 1.39E-04
Acetaldehyde 2.52E-05 lb/MMBtu 4.44E-05
Acrolein 7.88E-06 lb/MMBtu 1.39E-05
Naphthalene 1.30E-04 lb/MMBtu 2.29E-04
Acenaphthylene 9.23E-06 lb/MMBtu 1.62E-05
Acenaphthene 4.68E-06 lb/MMBtu 8.24E-06
Fluorene 1.28E-05 lb/MMBtu 2.25E-05
Rosemont Copper ProjectEmission Inventory Information JBR ENVIRONMENTAL CONSULTANTS, INC.
November 2011Page H244
AZRP00426

CO NOX SO2 VOC H2SO4 CO2 CH4 N2O HAP Name HAP EF CO NOX SO2 VOC H2SO4 CO2a CH4
a N2O a HAP b
Table H.64 Annual Gaseous Emissions - Year 15
Emissions (tpy) - Year 15Emission FactorsSCCUnit ID EF UnitsUnit Description Process Code
Non-Fug. (NF) /
Fug. (F)Rate Units
Annual Production Rate -
Year 15
Phenanthrene 4.08E-05 lb/MMBtu 7.18E-05
Anthracene 1.23E-06 lb/MMBtu 2.16E-06
Fluoranthene 4.03E-06 lb/MMBtu 7.09E-06
Pyrene 3.71E-06 lb/MMBtu 6.53E-06
Benz(a)anthracene 6.22E-07 lb/MMBtu 1.09E-06
Chrysene 1.53E-06 lb/MMBtu 2.69E-06
Benzo(b)fluoranthene 1.11E-06 lb/MMBtu 1.95E-06
Benzo(k)fluoranthene 2.18E-07 lb/MMBtu 3.84E-07
Benzo(a)pyrene 2.57E-07 lb/MMBtu 4.52E-07
Indeno(1,2,3-cd)pyrene 4.14E-07 lb/MMBtu 7.29E-07
Dibenz(a,h)anthracene 3.46E-07 lb/MMBtu 6.09E-07
Benzo(g,h,i)perylene 5.56E-07 lb/MMBtu 9.79E-07
FB05 Administration Building Emergency Generator (AEG) ICDE3 2-02-001-02 NF 500 hours 3.50 6.00 0.0066 0.40 0 694 0.03 0.006 -- -- g/kW-hr 1.45 2.48 0.003 0.17 0 286.99 0.01 0.002 --
750 kW Benzene 7.76E-04 lb/MMBtu 1.37E-03
Toluene 2.81E-04 lb/MMBtu 4.95E-04
Xylenes 1.93E-04 lb/MMBtu 3.40E-04
Formaldehyde 7.89E-05 lb/MMBtu 1.39E-04
Acetaldehyde 2.52E-05 lb/MMBtu 4.44E-05
Acrolein 7.88E-06 lb/MMBtu 1.39E-05
Naphthalene 1.30E-04 lb/MMBtu 2.29E-04
Acenaphthylene 9.23E-06 lb/MMBtu 1.62E-05
Acenaphthene 4.68E-06 lb/MMBtu 8.24E-06
Fluorene 1.28E-05 lb/MMBtu 2.25E-05
Phenanthrene 4.08E-05 lb/MMBtu 7.18E-05
Anthracene 1.23E-06 lb/MMBtu 2.16E-06
Fluoranthene 4.03E-06 lb/MMBtu 7.09E-06
Pyrene 3.71E-06 lb/MMBtu 6.53E-06
Benz(a)anthracene 6.22E-07 lb/MMBtu 1.09E-06
Chrysene 1.53E-06 lb/MMBtu 2.69E-06
Benzo(b)fluoranthene 1.11E-06 lb/MMBtu 1.95E-06
Benzo(k)fluoranthene 2.18E-07 lb/MMBtu 3.84E-07
Benzo(a)pyrene 2.57E-07 lb/MMBtu 4.52E-07
Indeno(1,2,3-cd)pyrene 4.14E-07 lb/MMBtu 7.29E-07
Dibenz(a,h)anthracene 3.46E-07 lb/MMBtu 6.09E-07
Benzo(g,h,i)perylene 5.56E-07 lb/MMBtu 9.79E-07
FB06 Electrowinning Building Emergency Generator (EWEG)
ICDE1 2-02-001-02 NF 500 hours 5.00 4.43 0.0066 0.27 0 694 0.03 0.006 -- -- g/kW-hr 0.14 0.12 0.0002 0.007 0 19.13 0.0008 0.0002 --
50 kW Benzene 9.33E-04 lb/MMBtu 1.09E-04
Toluene 4.09E-04 lb/MMBtu 4.80E-05
Xylenes 2.85E-04 lb/MMBtu 3.34E-05
1,3-Butadiene 3.91E-05 lb/MMBtu 4.59E-06
Rosemont Copper ProjectEmission Inventory Information JBR ENVIRONMENTAL CONSULTANTS, INC.
November 2011Page H245
AZRP00427

CO NOX SO2 VOC H2SO4 CO2 CH4 N2O HAP Name HAP EF CO NOX SO2 VOC H2SO4 CO2a CH4
a N2O a HAP b
Table H.64 Annual Gaseous Emissions - Year 15
Emissions (tpy) - Year 15Emission FactorsSCCUnit ID EF UnitsUnit Description Process Code
Non-Fug. (NF) /
Fug. (F)Rate Units
Annual Production Rate -
Year 15
Formaldehyde 1.18E-03 lb/MMBtu 1.38E-04
Acetaldehyde 7.67E-04 lb/MMBtu 9.00E-05
Acrolein 9.25E-05 lb/MMBtu 1.09E-05
Naphthalene 8.48E-05 lb/MMBtu 9.95E-06
Acenaphthylene 5.06E-06 lb/MMBtu 5.94E-07
Acenaphthene 1.42E-06 lb/MMBtu 1.67E-07
Fluorene 2.92E-05 lb/MMBtu 3.43E-06
Phenanthrene 2.94E-05 lb/MMBtu 3.45E-06
Anthracene 1.87E-06 lb/MMBtu 2.19E-07
Fluoranthene 7.61E-06 lb/MMBtu 8.93E-07
Pyrene 4.78E-06 lb/MMBtu 5.61E-07
Benzo(a)anthracene 1.68E-06 lb/MMBtu 1.97E-07
Chrysene 3.53E-07 lb/MMBtu 4.14E-08
Benzo(b)fluoranthene 9.91E-08 lb/MMBtu 1.16E-08
Benzo(k)fluoranthene 1.55E-07 lb/MMBtu 1.82E-08
Benzo(a)pyrene 1.88E-07 lb/MMBtu 2.21E-08
Indeno(1,2,3-cd)pyrene 3.75E-07 lb/MMBtu 4.40E-08
Dibenz(a,h)anthracene 5.83E-07 lb/MMBtu 6.84E-08
Benzo(g,h,i)perylene 4.89E-07 lb/MMBtu 5.74E-08
FB07 Primary Crusher Fire Water Pump (PCFWP) ICDE2 2-02-001-02 NF 500 hours 3.50 3.73 0.0066 0.27 0 694 0.03 0.006 -- -- g/kW-hr 0.58 0.61 0.001 0.04 0 114.14 0.005 0.0009 --
400 hp Benzene 9.33E-04 lb/MMBtu 6.53E-04
Toluene 4.09E-04 lb/MMBtu 2.86E-04
Xylenes 2.85E-04 lb/MMBtu 2.00E-04
1,3-Butadiene 3.91E-05 lb/MMBtu 2.74E-05
Formaldehyde 1.18E-03 lb/MMBtu 8.26E-04
Acetaldehyde 7.67E-04 lb/MMBtu 5.37E-04
Acrolein 9.25E-05 lb/MMBtu 6.48E-05
Naphthalene 8.48E-05 lb/MMBtu 5.94E-05
Acenaphthylene 5.06E-06 lb/MMBtu 3.54E-06
Acenaphthene 1.42E-06 lb/MMBtu 9.94E-07
Fluorene 2.92E-05 lb/MMBtu 2.04E-05
Phenanthrene 2.94E-05 lb/MMBtu 2.06E-05
Anthracene 1.87E-06 lb/MMBtu 1.31E-06
Fluoranthene 7.61E-06 lb/MMBtu 5.33E-06
Pyrene 4.78E-06 lb/MMBtu 3.35E-06
Benzo(a)anthracene 1.68E-06 lb/MMBtu 1.18E-06
Chrysene 3.53E-07 lb/MMBtu 2.47E-07
Benzo(b)fluoranthene 9.91E-08 lb/MMBtu 6.94E-08
Benzo(k)fluoranthene 1.55E-07 lb/MMBtu 1.09E-07
Benzo(a)pyrene 1.88E-07 lb/MMBtu 1.32E-07
Rosemont Copper ProjectEmission Inventory Information JBR ENVIRONMENTAL CONSULTANTS, INC.
November 2011Page H246
AZRP00428

CO NOX SO2 VOC H2SO4 CO2 CH4 N2O HAP Name HAP EF CO NOX SO2 VOC H2SO4 CO2a CH4
a N2O a HAP b
Table H.64 Annual Gaseous Emissions - Year 15
Emissions (tpy) - Year 15Emission FactorsSCCUnit ID EF UnitsUnit Description Process Code
Non-Fug. (NF) /
Fug. (F)Rate Units
Annual Production Rate -
Year 15
Indeno(1,2,3-cd)pyrene 3.75E-07 lb/MMBtu 2.63E-07
Dibenz(a,h)anthracene 5.83E-07 lb/MMBtu 4.08E-07
Benzo(g,h,i)perylene 4.89E-07 lb/MMBtu 3.42E-07
FB08 SX/EW Fire Water Pump (SXFWP) ICDE2 2-02-001-02 NF 500 hours 3.50 3.73 0.0066 0.27 0 694 0.03 0.006 -- -- g/kW-hr 0.58 0.61 0.001 0.04 0 114.14 0.005 0.0009 --
400 hp Benzene 9.33E-04 lb/MMBtu 6.53E-04
Toluene 4.09E-04 lb/MMBtu 2.86E-04
Xylenes 2.85E-04 lb/MMBtu 2.00E-04
1,3-Butadiene 3.91E-05 lb/MMBtu 2.74E-05
Formaldehyde 1.18E-03 lb/MMBtu 8.26E-04
Acetaldehyde 7.67E-04 lb/MMBtu 5.37E-04
Acrolein 9.25E-05 lb/MMBtu 6.48E-05
Naphthalene 8.48E-05 lb/MMBtu 5.94E-05
Acenaphthylene 5.06E-06 lb/MMBtu 3.54E-06
Acenaphthene 1.42E-06 lb/MMBtu 9.94E-07
Fluorene 2.92E-05 lb/MMBtu 2.04E-05
Phenanthrene 2.94E-05 lb/MMBtu 2.06E-05
Anthracene 1.87E-06 lb/MMBtu 1.31E-06
Fluoranthene 7.61E-06 lb/MMBtu 5.33E-06
Pyrene 4.78E-06 lb/MMBtu 3.35E-06
Benzo(a)anthracene 1.68E-06 lb/MMBtu 1.18E-06
Chrysene 3.53E-07 lb/MMBtu 2.47E-07
Benzo(b)fluoranthene 9.91E-08 lb/MMBtu 6.94E-08
Benzo(k)fluoranthene 1.55E-07 lb/MMBtu 1.09E-07
Benzo(a)pyrene 1.88E-07 lb/MMBtu 1.32E-07
Indeno(1,2,3-cd)pyrene 3.75E-07 lb/MMBtu 2.63E-07
Dibenz(a,h)anthracene 5.83E-07 lb/MMBtu 4.08E-07
Benzo(g,h,i)perylene 4.89E-07 lb/MMBtu 3.42E-07
Tanks
T01 C7 Distribution Tank (T-C7D) C7DT 4-03-010-19 NF 8,760 hours 0 0 0 1.08E-01 0 0 0 0 -- -- lb/hr 0 0 0 0.47 0 0 0 0 --
T02 MIBC Storage Tank (T-MIBCS) MST 4-90-999-98 NF 8,760 hours 0 0 0 3.53E-03 0 0 0 0 -- -- lb/hr 0 0 0 0.02 0 0 0 0 --
T03 Diesel Fuel Storage Tank - Heavy Vehicles 1(T-DFS-HV1)
DFSTHV 4-03-010-19 NF 8,760 hours 0 0 0 1.39E-02 0 0 0 0 n-Hexane 5.71E-06 lb/hr 0 0 0 0.06 0 0 0 0 2.50E-05
Benzene 2.74E-05 lb/hr 1.20E-04
Toluene 3.18E-04 lb/hr 1.40E-03
Ethylbenzene 4.45E-05 lb/hr 1.95E-04
m-Xylene 8.23E-04 lb/hr 3.61E-03
1,2,4-Trimethylbenzene 6.76E-04 lb/hr 2.96E-03
T04 Diesel Fuel Storage Tank - Heavy Vehicles 2(T-DFS-HV2)
DFSTHV 4-03-010-19 NF 8,760 hours 0 0 0 1.39E-02 0 0 0 0 n-Hexane 5.71E-06 lb/hr 0 0 0 0.06 0 0 0 0 2.50E-05
Benzene 2.74E-05 lb/hr 1.20E-04
Toluene 3.18E-04 lb/hr 1.40E-03
Ethylbenzene 4.45E-05 lb/hr 1.95E-04
Rosemont Copper ProjectEmission Inventory Information JBR ENVIRONMENTAL CONSULTANTS, INC.
November 2011Page H247
AZRP00429

CO NOX SO2 VOC H2SO4 CO2 CH4 N2O HAP Name HAP EF CO NOX SO2 VOC H2SO4 CO2a CH4
a N2O a HAP b
Table H.64 Annual Gaseous Emissions - Year 15
Emissions (tpy) - Year 15Emission FactorsSCCUnit ID EF UnitsUnit Description Process Code
Non-Fug. (NF) /
Fug. (F)Rate Units
Annual Production Rate -
Year 15
m-Xylene 8.23E-04 lb/hr 3.61E-03
1,2,4-Trimethylbenzene 6.76E-04 lb/hr 2.96E-03
9.00 16.76 0.06 1.51 0.02 6,040.20 0.25 0.05 0.05
438.98 111.38 13.10 3.77 0 3,711.38 0.15 0.03 3.32
447.98 128.14 13.16 5.28 0.02 9,751.58 0.40 0.08 3.37
826.39 1,086.00 1.54 78.40 -- 162,718.15 -- -- --
a CO2e emissions are calculcated by summing the individual greenhouse gas emissions multiplied by their global warming potential (GWP). GWP of CO2 = 1, GWP of CH4 = 21, GWP of N2O = 310.
b All HAP emissions are included in the facility-wide potential to emit, regardless of if they are fugitive or non-fugitive emissions.
Tailpipe Emissions (see Tables H.70-H.74):
Total Emissions (excluding tailpipe emissions):
Total Non-Fugitive Emissions (excluding tailpipe emissions):
Total Fugitive Emissions (excluding tailpipe emissions):
Rosemont Copper ProjectEmission Inventory Information JBR ENVIRONMENTAL CONSULTANTS, INC.
November 2011Page H248
AZRP00430

CO NOX SO2 VOC H2SO4 CO2 CH4 N2O HAP Name HAP EF CO NOX SO2 VOC H2SO4 CO2a CH4
a N2O a HAP b
Mining
MN02 Blasting Blast 3-05-020-09 F 52 tons ANFO 67.00 17.00 2.00 0 0 566 0.02 0.005 -- -- lb/tons ANFO 1.74 0.44 0.05 0 0 14.73 0.0006 0.0001 --
Solvent Extraction and Electrowinning
SXE01 Solvent Extraction SX 4-90-001-99 F 24 hours 0 0 0 9.43E-05 0 0 0 0 Benzene 3.37E-07 lb/hr-ft2 0 0 0 0.01 0 0 0 0 3.69E-05
4 Primary Mix Tanks (7.75' D x 9.75' H each) 4 @ 47.2 = 188.7 ft2 9,132.9 ft2 Total Surface Area of Solvent Extraction Toluene 4.82E-06 lb/hr-ft2 5.28E-04
4 Secondary Mix Tanks (9.5' D x 9.75' H each) 4 @ 70.9 = 283.5 ft2 Ethylbenzene 2.05E-05 lb/hr-ft2 2.25E-03
3 Tertiary Mix Tanks (9.5' D x 9.75' H each) 3 @ 70.9 = 212.6 ft2 Xylenes 2.80E-05 lb/hr-ft2 3.07E-03
4 Extraction Settlers (64' L x 33' W x 3.33' H each) 4 @ 2,112 = 8,448 ft2 Others (including Hexane) 2.94E-05 lb/hr-ft2 3.22E-03
SXE02 Electrowinning Commercial Cells (EWCC) EW none NF 24 hours 0 0 0 0 1.57E-04 0 0 0 Cobalt Compounds 2.36E-08 lb/hr-ft2 0 0 0 0 0.00005 0 0 0 7.46E-09
Controlled by Cell Ventilation Scrubbers(PC-EWCVS1/EWCVS6)
2,640 ft2
99 Control Efficiency (%)
Fuel Burning Equipment
FB01 Diesel Electrowinning Hot Water Generator (HWG) DFB 1-02-005-03 NF 24 hours 5.00 20.00 0.21 0.20 0 23,217 0.94 0.19 POM 3.30E-03 lb/1000 gal 0.003 0.01 0.0001 0.0001 0 12.20 0.0005 0.0001 1.73E-06
6.0 MMBtu/hr Formaldehyde 6.10E-02 lb/1000 gal 3.21E-05
Arsenic 4.00 lb/1012 Btu 2.88E-07
Beryllium 3.00 lb/1012 Btu 2.16E-07
Cadmium 3.00 lb/1012 Btu 2.16E-07
Chromium 3.00 lb/1012 Btu 2.16E-07
Lead 9.00 lb/1012 Btu 6.48E-07
Mercury 3.00 lb/1012 Btu 2.16E-07
Manganese 6.00 lb/1012 Btu 4.32E-07
Nickel 3.00 lb/1012 Btu 2.16E-07
Selenium 15.00 lb/1012 Btu 1.08E-06
FB02 Thickener Area Emergency Generator (TEG) ICDE3 2-02-001-02 NF 24 hours 3.50 6.00 0.0066 0.40 0 694 0.03 0.006 -- -- g/kW-hr 0.09 0.16 0.0002 0.01 0 18.37 0.0007 0.0001 --
1,000 kW Benzene 7.76E-04 lb/MMBtu 8.74E-05
Toluene 2.81E-04 lb/MMBtu 3.17E-05
Xylenes 1.93E-04 lb/MMBtu 2.17E-05
Formaldehyde 7.89E-05 lb/MMBtu 8.89E-06
Acetaldehyde 2.52E-05 lb/MMBtu 2.84E-06
Acrolein 7.88E-06 lb/MMBtu 8.88E-07
Naphthalene 1.30E-04 lb/MMBtu 1.46E-05
Acenaphthylene 9.23E-06 lb/MMBtu 1.04E-06
Acenaphthene 4.68E-06 lb/MMBtu 5.27E-07
Fluorene 1.28E-05 lb/MMBtu 1.44E-06
Phenanthrene 4.08E-05 lb/MMBtu 4.60E-06
Anthracene 1.23E-06 lb/MMBtu 1.39E-07
Fluoranthene 4.03E-06 lb/MMBtu 4.54E-07
Pyrene 3.71E-06 lb/MMBtu 4.18E-07
Benz(a)anthracene 6.22E-07 lb/MMBtu 7.01E-08
Chrysene 1.53E-06 lb/MMBtu 1.72E-07
SCCEmissions (tpd) - Year 15Emission Factors
Unit ID EF UnitsUnit Description Process CodeNon-Fug.
(NF) / Fug. (F)
Table H.65 Maximum Daily Gaseous Emissions - Year 15
Daily Production Rate - Year 15 Rate Units
Rosemont Copper ProjectEmission Inventory Information JBR ENVIRONMENTAL CONSULTANTS, INC.
November 2011Page H249
AZRP00431

CO NOX SO2 VOC H2SO4 CO2 CH4 N2O HAP Name HAP EF CO NOX SO2 VOC H2SO4 CO2a CH4
a N2O a HAP bSCC
Emissions (tpd) - Year 15Emission FactorsUnit ID EF UnitsUnit Description Process Code
Non-Fug. (NF) /
Fug. (F)
Table H.65 Maximum Daily Gaseous Emissions - Year 15
Daily Production Rate - Year 15 Rate Units
Benzo(b)fluoranthene 1.11E-06 lb/MMBtu 1.25E-07
Benzo(k)fluoranthene 2.18E-07 lb/MMBtu 2.46E-08
Benzo(a)pyrene 2.57E-07 lb/MMBtu 2.89E-08
Indeno(1,2,3-cd)pyrene 4.14E-07 lb/MMBtu 4.66E-08
Dibenz(a,h)anthracene 3.46E-07 lb/MMBtu 3.90E-08
Benzo(g,h,i)perylene 5.56E-07 lb/MMBtu 6.26E-08
FB03 PLS Pond Area Emergency Generator (PEG) ICDE3 2-02-001-02 NF 24 hours 3.50 6.00 0.0066 0.40 0 694 0.03 0.006 -- -- g/kW-hr 0.09 0.16 0.0002 0.01 0 18.37 0.0007 0.0001 --
1,000 kW Benzene 7.76E-04 lb/MMBtu 8.74E-05
Toluene 2.81E-04 lb/MMBtu 3.17E-05
Xylenes 1.93E-04 lb/MMBtu 2.17E-05
Formaldehyde 7.89E-05 lb/MMBtu 8.89E-06
Acetaldehyde 2.52E-05 lb/MMBtu 2.84E-06
Acrolein 7.88E-06 lb/MMBtu 8.88E-07
Naphthalene 1.30E-04 lb/MMBtu 1.46E-05
Acenaphthylene 9.23E-06 lb/MMBtu 1.04E-06
Acenaphthene 4.68E-06 lb/MMBtu 5.27E-07
Fluorene 1.28E-05 lb/MMBtu 1.44E-06
Phenanthrene 4.08E-05 lb/MMBtu 4.60E-06
Anthracene 1.23E-06 lb/MMBtu 1.39E-07
Fluoranthene 4.03E-06 lb/MMBtu 4.54E-07
Pyrene 3.71E-06 lb/MMBtu 4.18E-07
Benz(a)anthracene 6.22E-07 lb/MMBtu 7.01E-08
Chrysene 1.53E-06 lb/MMBtu 1.72E-07
Benzo(b)fluoranthene 1.11E-06 lb/MMBtu 1.25E-07
Benzo(k)fluoranthene 2.18E-07 lb/MMBtu 2.46E-08
Benzo(a)pyrene 2.57E-07 lb/MMBtu 2.89E-08
Indeno(1,2,3-cd)pyrene 4.14E-07 lb/MMBtu 4.66E-08
Dibenz(a,h)anthracene 3.46E-07 lb/MMBtu 3.90E-08
Benzo(g,h,i)perylene 5.56E-07 lb/MMBtu 6.26E-08
FB04 Main Substation Emergency Generator (MEG) ICDE3 2-02-001-02 NF 24 hours 3.50 6.00 0.0066 0.40 0 694 0.03 0.006 -- -- g/kW-hr 0.07 0.12 0.0001 0.008 0 13.78 0.0006 0.0001 --
750 kW Benzene 7.76E-04 lb/MMBtu 6.56E-05
Toluene 2.81E-04 lb/MMBtu 2.37E-05
Xylenes 1.93E-04 lb/MMBtu 1.63E-05
Formaldehyde 7.89E-05 lb/MMBtu 6.67E-06
Acetaldehyde 2.52E-05 lb/MMBtu 2.13E-06
Acrolein 7.88E-06 lb/MMBtu 6.66E-07
Naphthalene 1.30E-04 lb/MMBtu 1.10E-05
Acenaphthylene 9.23E-06 lb/MMBtu 7.80E-07
Acenaphthene 4.68E-06 lb/MMBtu 3.95E-07
Fluorene 1.28E-05 lb/MMBtu 1.08E-06
Rosemont Copper ProjectEmission Inventory Information JBR ENVIRONMENTAL CONSULTANTS, INC.
November 2011Page H250
AZRP00432

CO NOX SO2 VOC H2SO4 CO2 CH4 N2O HAP Name HAP EF CO NOX SO2 VOC H2SO4 CO2a CH4
a N2O a HAP bSCC
Emissions (tpd) - Year 15Emission FactorsUnit ID EF UnitsUnit Description Process Code
Non-Fug. (NF) /
Fug. (F)
Table H.65 Maximum Daily Gaseous Emissions - Year 15
Daily Production Rate - Year 15 Rate Units
Phenanthrene 4.08E-05 lb/MMBtu 3.45E-06
Anthracene 1.23E-06 lb/MMBtu 1.04E-07
Fluoranthene 4.03E-06 lb/MMBtu 3.40E-07
Pyrene 3.71E-06 lb/MMBtu 3.13E-07
Benz(a)anthracene 6.22E-07 lb/MMBtu 5.25E-08
Chrysene 1.53E-06 lb/MMBtu 1.29E-07
Benzo(b)fluoranthene 1.11E-06 lb/MMBtu 9.38E-08
Benzo(k)fluoranthene 2.18E-07 lb/MMBtu 1.84E-08
Benzo(a)pyrene 2.57E-07 lb/MMBtu 2.17E-08
Indeno(1,2,3-cd)pyrene 4.14E-07 lb/MMBtu 3.50E-08
Dibenz(a,h)anthracene 3.46E-07 lb/MMBtu 2.92E-08
Benzo(g,h,i)perylene 5.56E-07 lb/MMBtu 4.70E-08
FB05 Administration Building Emergency Generator (AEG) ICDE3 2-02-001-02 NF 24 hours 3.50 6.00 0.0066 0.40 0 694 0.03 0.006 -- -- g/kW-hr 0.07 0.12 0.0001 0.008 0 13.78 0.0006 0.0001 --
750 kW Benzene 7.76E-04 lb/MMBtu 6.56E-05
Toluene 2.81E-04 lb/MMBtu 2.37E-05
Xylenes 1.93E-04 lb/MMBtu 1.63E-05
Formaldehyde 7.89E-05 lb/MMBtu 6.67E-06
Acetaldehyde 2.52E-05 lb/MMBtu 2.13E-06
Acrolein 7.88E-06 lb/MMBtu 6.66E-07
Naphthalene 1.30E-04 lb/MMBtu 1.10E-05
Acenaphthylene 9.23E-06 lb/MMBtu 7.80E-07
Acenaphthene 4.68E-06 lb/MMBtu 3.95E-07
Fluorene 1.28E-05 lb/MMBtu 1.08E-06
Phenanthrene 4.08E-05 lb/MMBtu 3.45E-06
Anthracene 1.23E-06 lb/MMBtu 1.04E-07
Fluoranthene 4.03E-06 lb/MMBtu 3.40E-07
Pyrene 3.71E-06 lb/MMBtu 3.13E-07
Benz(a)anthracene 6.22E-07 lb/MMBtu 5.25E-08
Chrysene 1.53E-06 lb/MMBtu 1.29E-07
Benzo(b)fluoranthene 1.11E-06 lb/MMBtu 9.38E-08
Benzo(k)fluoranthene 2.18E-07 lb/MMBtu 1.84E-08
Benzo(a)pyrene 2.57E-07 lb/MMBtu 2.17E-08
Indeno(1,2,3-cd)pyrene 4.14E-07 lb/MMBtu 3.50E-08
Dibenz(a,h)anthracene 3.46E-07 lb/MMBtu 2.92E-08
Benzo(g,h,i)perylene 5.56E-07 lb/MMBtu 4.70E-08
FB06 Electrowinning Building Emergency Generator (EWEG)
ICDE1 2-02-001-02 NF 24 hours 5.00 4.43 0.0066 0.27 0 694 0.03 0.006 -- -- g/kW-hr 0.007 0.006 0.000009 0.0004 0 0.92 0.00004 0.000007 --
50 kW Benzene 9.33E-04 lb/MMBtu 5.25E-06
Toluene 4.09E-04 lb/MMBtu 2.30E-06
Xylenes 2.85E-04 lb/MMBtu 1.61E-06
1,3-Butadiene 3.91E-05 lb/MMBtu 2.20E-07
Rosemont Copper ProjectEmission Inventory Information JBR ENVIRONMENTAL CONSULTANTS, INC.
November 2011Page H251
AZRP00433

CO NOX SO2 VOC H2SO4 CO2 CH4 N2O HAP Name HAP EF CO NOX SO2 VOC H2SO4 CO2a CH4
a N2O a HAP bSCC
Emissions (tpd) - Year 15Emission FactorsUnit ID EF UnitsUnit Description Process Code
Non-Fug. (NF) /
Fug. (F)
Table H.65 Maximum Daily Gaseous Emissions - Year 15
Daily Production Rate - Year 15 Rate Units
Formaldehyde 1.18E-03 lb/MMBtu 6.65E-06
Acetaldehyde 7.67E-04 lb/MMBtu 4.32E-06
Acrolein 9.25E-05 lb/MMBtu 5.21E-07
Naphthalene 8.48E-05 lb/MMBtu 4.78E-07
Acenaphthylene 5.06E-06 lb/MMBtu 2.85E-08
Acenaphthene 1.42E-06 lb/MMBtu 8.00E-09
Fluorene 2.92E-05 lb/MMBtu 1.64E-07
Phenanthrene 2.94E-05 lb/MMBtu 1.66E-07
Anthracene 1.87E-06 lb/MMBtu 1.05E-08
Fluoranthene 7.61E-06 lb/MMBtu 4.29E-08
Pyrene 4.78E-06 lb/MMBtu 2.69E-08
Benzo(a)anthracene 1.68E-06 lb/MMBtu 9.46E-09
Chrysene 3.53E-07 lb/MMBtu 1.99E-09
Benzo(b)fluoranthene 9.91E-08 lb/MMBtu 5.58E-10
Benzo(k)fluoranthene 1.55E-07 lb/MMBtu 8.73E-10
Benzo(a)pyrene 1.88E-07 lb/MMBtu 1.06E-09
Indeno(1,2,3-cd)pyrene 3.75E-07 lb/MMBtu 2.11E-09
Dibenz(a,h)anthracene 5.83E-07 lb/MMBtu 3.28E-09
Benzo(g,h,i)perylene 4.89E-07 lb/MMBtu 2.75E-09
FB07 Primary Crusher Fire Water Pump (PCFWP) ICDE2 2-02-001-02 NF 24 hours 3.50 3.73 0.0066 0.27 0 694 0.03 0.006 -- -- g/kW-hr 0.03 0.03 0.00005 0.002 0 5.48 0.0002 0.00004 --
400 hp Benzene 9.33E-04 lb/MMBtu 3.13E-05
Toluene 4.09E-04 lb/MMBtu 1.37E-05
Xylenes 2.85E-04 lb/MMBtu 9.58E-06
1,3-Butadiene 3.91E-05 lb/MMBtu 1.31E-06
Formaldehyde 1.18E-03 lb/MMBtu 3.96E-05
Acetaldehyde 7.67E-04 lb/MMBtu 2.58E-05
Acrolein 9.25E-05 lb/MMBtu 3.11E-06
Naphthalene 8.48E-05 lb/MMBtu 2.85E-06
Acenaphthylene 5.06E-06 lb/MMBtu 1.70E-07
Acenaphthene 1.42E-06 lb/MMBtu 4.77E-08
Fluorene 2.92E-05 lb/MMBtu 9.81E-07
Phenanthrene 2.94E-05 lb/MMBtu 9.88E-07
Anthracene 1.87E-06 lb/MMBtu 6.28E-08
Fluoranthene 7.61E-06 lb/MMBtu 2.56E-07
Pyrene 4.78E-06 lb/MMBtu 1.61E-07
Benzo(a)anthracene 1.68E-06 lb/MMBtu 5.64E-08
Chrysene 3.53E-07 lb/MMBtu 1.19E-08
Benzo(b)fluoranthene 9.91E-08 lb/MMBtu 3.33E-09
Benzo(k)fluoranthene 1.55E-07 lb/MMBtu 5.21E-09
Benzo(a)pyrene 1.88E-07 lb/MMBtu 6.32E-09
Rosemont Copper ProjectEmission Inventory Information JBR ENVIRONMENTAL CONSULTANTS, INC.
November 2011Page H252
AZRP00434

CO NOX SO2 VOC H2SO4 CO2 CH4 N2O HAP Name HAP EF CO NOX SO2 VOC H2SO4 CO2a CH4
a N2O a HAP bSCC
Emissions (tpd) - Year 15Emission FactorsUnit ID EF UnitsUnit Description Process Code
Non-Fug. (NF) /
Fug. (F)
Table H.65 Maximum Daily Gaseous Emissions - Year 15
Daily Production Rate - Year 15 Rate Units
Indeno(1,2,3-cd)pyrene 3.75E-07 lb/MMBtu 1.26E-08
Dibenz(a,h)anthracene 5.83E-07 lb/MMBtu 1.96E-08
Benzo(g,h,i)perylene 4.89E-07 lb/MMBtu 1.64E-08
FB08 SX/EW Fire Water Pump (SXFWP) ICDE2 2-02-001-02 NF 24 hours 3.50 3.73 0.0066 0.27 0 694 0.03 0.006 -- -- g/kW-hr 0.03 0.03 0.00005 0.002 0 5.48 0.0002 0.00004 --
400 hp Benzene 9.33E-04 lb/MMBtu 3.13E-05
Toluene 4.09E-04 lb/MMBtu 1.37E-05
Xylenes 2.85E-04 lb/MMBtu 9.58E-06
1,3-Butadiene 3.91E-05 lb/MMBtu 1.31E-06
Formaldehyde 1.18E-03 lb/MMBtu 3.96E-05
Acetaldehyde 7.67E-04 lb/MMBtu 2.58E-05
Acrolein 9.25E-05 lb/MMBtu 3.11E-06
Naphthalene 8.48E-05 lb/MMBtu 2.85E-06
Acenaphthylene 5.06E-06 lb/MMBtu 1.70E-07
Acenaphthene 1.42E-06 lb/MMBtu 4.77E-08
Fluorene 2.92E-05 lb/MMBtu 9.81E-07
Phenanthrene 2.94E-05 lb/MMBtu 9.88E-07
Anthracene 1.87E-06 lb/MMBtu 6.28E-08
Fluoranthene 7.61E-06 lb/MMBtu 2.56E-07
Pyrene 4.78E-06 lb/MMBtu 1.61E-07
Benzo(a)anthracene 1.68E-06 lb/MMBtu 5.64E-08
Chrysene 3.53E-07 lb/MMBtu 1.19E-08
Benzo(b)fluoranthene 9.91E-08 lb/MMBtu 3.33E-09
Benzo(k)fluoranthene 1.55E-07 lb/MMBtu 5.21E-09
Benzo(a)pyrene 1.88E-07 lb/MMBtu 6.32E-09
Indeno(1,2,3-cd)pyrene 3.75E-07 lb/MMBtu 1.26E-08
Dibenz(a,h)anthracene 5.83E-07 lb/MMBtu 1.96E-08
Benzo(g,h,i)perylene 4.89E-07 lb/MMBtu 1.64E-08
Tanks
T01 C7 Distribution Tank (T-C7D) C7DT 4-03-010-19 NF 24 hours 0 0 0 1.08E-01 0 0 0 0 -- -- lb/hr 0 0 0 0.001 0 0 0 0 --
T02 MIBC Storage Tank (T-MIBCS) MST 4-90-999-98 NF 24 hours 0 0 0 3.53E-03 0 0 0 0 -- -- lb/hr 0 0 0 0.00004 0 0 0 0 --
T03 Diesel Fuel Storage Tank - Heavy Vehicles 1(T-DFS-HV1)
DFSTHV 4-03-010-19 NF 24 hours 0 0 0 1.39E-02 0 0 0 0 n-Hexane 5.71E-06 lb/hr 0 0 0 0.0002 0 0 0 0 6.85E-08
Benzene 2.74E-05 lb/hr 3.29E-07
Toluene 3.18E-04 lb/hr 3.82E-06
Ethylbenzene 4.45E-05 lb/hr 5.34E-07
m-Xylene 8.23E-04 lb/hr 9.88E-06
1,2,4-Trimethylbenzene 6.76E-04 lb/hr 8.11E-06
T04 Diesel Fuel Storage Tank - Heavy Vehicles 2(T-DFS-HV2)
DFSTHV 4-03-010-19 NF 24 hours 0 0 0 1.39E-02 0 0 0 0 n-Hexane 5.71E-06 lb/hr 0 0 0 0.0002 0 0 0 0 6.85E-08
Benzene 2.74E-05 lb/hr 3.29E-07
Toluene 3.18E-04 lb/hr 3.82E-06
Ethylbenzene 4.45E-05 lb/hr 5.34E-07
Rosemont Copper ProjectEmission Inventory Information JBR ENVIRONMENTAL CONSULTANTS, INC.
November 2011Page H253
AZRP00435

CO NOX SO2 VOC H2SO4 CO2 CH4 N2O HAP Name HAP EF CO NOX SO2 VOC H2SO4 CO2a CH4
a N2O a HAP bSCC
Emissions (tpd) - Year 15Emission FactorsUnit ID EF UnitsUnit Description Process Code
Non-Fug. (NF) /
Fug. (F)
Table H.65 Maximum Daily Gaseous Emissions - Year 15
Daily Production Rate - Year 15 Rate Units
m-Xylene 8.23E-04 lb/hr 9.88E-06
1,2,4-Trimethylbenzene 6.76E-04 lb/hr 8.11E-06
0.39 0.63 0.0008 0.04 0.00005 88.36 0.004 0.0007 0.001
1.74 0.44 0.05 0.01 0 14.73 0.0006 0.0001 0.009
2.13 1.07 0.05 0.05 0.00005 103.09 0.004 0.0008 0.01
2.77 3.77 0.006 0.27 -- 540.66 -- -- --
a CO2e emissions are calculcated by summing the individual greenhouse gas emissions multiplied by their global warming potential (GWP). GWP of CO2 = 1, GWP of CH4 = 21, GWP of N2O = 310.
b All HAP emissions are included in the facility-wide potential to emit, regardless of if they are fugitive or non-fugitive emissions.
Tailpipe Emissions (see Tables H.70-H.74):
Total Emissions (excluding tailpipe emissions):
Total Non-Fugitive Emissions (excluding tailpipe emissions):
Total Fugitive Emissions (excluding tailpipe emissions):
Rosemont Copper ProjectEmission Inventory Information JBR ENVIRONMENTAL CONSULTANTS, INC.
November 2011Page H254
AZRP00436

CO NOX SO2 VOC H2SO4 CO2 CH4 N2O HAP Name HAP EF CO NOX SO2 VOC H2SO4 CO2a CH4
a N2O a HAP b
Mining
MN02 Blasting Blast 3-05-020-09 F 52 tons ANFO 67.00 17.00 2.00 0 0 566 0.02 0.005 -- -- lb/tons ANFO 3,484.00 884.00 104.00 0 0 29,455.36 1.19 0.24 --
Solvent Extraction and Electrowinning
SXE01 Solvent Extraction SX 4-90-001-99 F 1 hours 0 0 0 9.43E-05 0 0 0 0 Benzene 3.37E-07 lb/hr-ft2 0 0 0 0.86 0 0 0 0 3.08E-03
4 Primary Mix Tanks (7.75' D x 9.75' H each) 4 @ 47.2 = 188.7 ft2 9,132.9 ft2 Total Surface Area of Solvent Extraction Toluene 4.82E-06 lb/hr-ft2 4.40E-02
4 Secondary Mix Tanks (9.5' D x 9.75' H each) 4 @ 70.9 = 283.5 ft2 Ethylbenzene 2.05E-05 lb/hr-ft2 1.87E-01
3 Tertiary Mix Tanks (9.5' D x 9.75' H each) 3 @ 70.9 = 212.6 ft2 Xylenes 2.80E-05 lb/hr-ft2 2.56E-01
4 Extraction Settlers (64' L x 33' W x 3.33' H each) 4 @ 2,112 = 8,448 ft2 Others (including Hexane) 2.94E-05 lb/hr-ft2 2.69E-01
SXE02 Electrowinning Commercial Cells (EWCC) EW none NF 1 hours 0 0 0 0 1.57E-04 0 0 0 Cobalt Compounds 2.36E-08 lb/hr-ft2 0 0 0 0 0.004 0 0 0 6.22E-07
Controlled by Cell Ventilation Scrubbers(PC-EWCVS1/EWCVS6)
2,640 ft2
99 Control Efficiency (%)
Fuel Burning Equipment
FB01 Diesel Electrowinning Hot Water Generator (HWG) DFB 1-02-005-03 NF 1 hours 5.00 20.00 0.21 0.20 0 23,217 0.94 0.19 POM 3.30E-03 lb/1000 gal 0.22 0.88 0.009 0.009 0 1,016.78 0.04 0.008 1.45E-04
6.0 MMBtu/hr Formaldehyde 6.10E-02 lb/1000 gal 2.67E-03
Arsenic 4.00 lb/1012 Btu 2.40E-05
Beryllium 3.00 lb/1012 Btu 1.80E-05
Cadmium 3.00 lb/1012 Btu 1.80E-05
Chromium 3.00 lb/1012 Btu 1.80E-05
Lead 9.00 lb/1012 Btu 5.40E-05
Mercury 3.00 lb/1012 Btu 1.80E-05
Manganese 6.00 lb/1012 Btu 3.60E-05
Nickel 3.00 lb/1012 Btu 1.80E-05
Selenium 15.00 lb/1012 Btu 9.00E-05
FB02 Thickener Area Emergency Generator (TEG) ICDE3 2-02-001-02 NF 1 hours 3.50 6.00 0.0066 0.40 0 694 0.03 0.006 -- -- g/kW-hr 7.72 13.23 0.01 0.88 0 1,530.61 0.06 0.01 --
1,000 kW Benzene 7.76E-04 lb/MMBtu 7.28E-03
Toluene 2.81E-04 lb/MMBtu 2.64E-03
Xylenes 1.93E-04 lb/MMBtu 1.81E-03
Formaldehyde 7.89E-05 lb/MMBtu 7.41E-04
Acetaldehyde 2.52E-05 lb/MMBtu 2.37E-04
Acrolein 7.88E-06 lb/MMBtu 7.40E-05
Naphthalene 1.30E-04 lb/MMBtu 1.22E-03
Acenaphthylene 9.23E-06 lb/MMBtu 8.66E-05
Acenaphthene 4.68E-06 lb/MMBtu 4.39E-05
Fluorene 1.28E-05 lb/MMBtu 1.20E-04
Phenanthrene 4.08E-05 lb/MMBtu 3.83E-04
Anthracene 1.23E-06 lb/MMBtu 1.15E-05
Fluoranthene 4.03E-06 lb/MMBtu 3.78E-05
Pyrene 3.71E-06 lb/MMBtu 3.48E-05
Benz(a)anthracene 6.22E-07 lb/MMBtu 5.84E-06
Chrysene 1.53E-06 lb/MMBtu 1.44E-05
SCCEmissions (lb/hr) - Year 15Emission Factors
Unit ID EF UnitsUnit Description Process CodeNon-Fug.
(NF) / Fug. (F)
Table H.66 Hourly Gaseous Emissions - Year 15
Hourly Production Rate -
Year 15Rate Units
Rosemont Copper ProjectEmission Inventory Information JBR ENVIRONMENTAL CONSULTANTS, INC.
November 2011Page H255
AZRP00437

CO NOX SO2 VOC H2SO4 CO2 CH4 N2O HAP Name HAP EF CO NOX SO2 VOC H2SO4 CO2a CH4
a N2O a HAP bSCC
Emissions (lb/hr) - Year 15Emission FactorsUnit ID EF UnitsUnit Description Process Code
Non-Fug. (NF) /
Fug. (F)
Table H.66 Hourly Gaseous Emissions - Year 15
Hourly Production Rate -
Year 15Rate Units
Benzo(b)fluoranthene 1.11E-06 lb/MMBtu 1.04E-05
Benzo(k)fluoranthene 2.18E-07 lb/MMBtu 2.05E-06
Benzo(a)pyrene 2.57E-07 lb/MMBtu 2.41E-06
Indeno(1,2,3-cd)pyrene 4.14E-07 lb/MMBtu 3.89E-06
Dibenz(a,h)anthracene 3.46E-07 lb/MMBtu 3.25E-06
Benzo(g,h,i)perylene 5.56E-07 lb/MMBtu 5.22E-06
FB03 PLS Pond Area Emergency Generator (PEG) ICDE3 2-02-001-02 NF 1 hours 3.50 6.00 0.0066 0.40 0 694 0.03 0.006 -- -- g/kW-hr 7.72 13.23 0.01 0.88 0 1,530.61 0.06 0.01 --
1,000 kW Benzene 7.76E-04 lb/MMBtu 7.28E-03
Toluene 2.81E-04 lb/MMBtu 2.64E-03
Xylenes 1.93E-04 lb/MMBtu 1.81E-03
Formaldehyde 7.89E-05 lb/MMBtu 7.41E-04
Acetaldehyde 2.52E-05 lb/MMBtu 2.37E-04
Acrolein 7.88E-06 lb/MMBtu 7.40E-05
Naphthalene 1.30E-04 lb/MMBtu 1.22E-03
Acenaphthylene 9.23E-06 lb/MMBtu 8.66E-05
Acenaphthene 4.68E-06 lb/MMBtu 4.39E-05
Fluorene 1.28E-05 lb/MMBtu 1.20E-04
Phenanthrene 4.08E-05 lb/MMBtu 3.83E-04
Anthracene 1.23E-06 lb/MMBtu 1.15E-05
Fluoranthene 4.03E-06 lb/MMBtu 3.78E-05
Pyrene 3.71E-06 lb/MMBtu 3.48E-05
Benz(a)anthracene 6.22E-07 lb/MMBtu 5.84E-06
Chrysene 1.53E-06 lb/MMBtu 1.44E-05
Benzo(b)fluoranthene 1.11E-06 lb/MMBtu 1.04E-05
Benzo(k)fluoranthene 2.18E-07 lb/MMBtu 2.05E-06
Benzo(a)pyrene 2.57E-07 lb/MMBtu 2.41E-06
Indeno(1,2,3-cd)pyrene 4.14E-07 lb/MMBtu 3.89E-06
Dibenz(a,h)anthracene 3.46E-07 lb/MMBtu 3.25E-06
Benzo(g,h,i)perylene 5.56E-07 lb/MMBtu 5.22E-06
FB04 Main Substation Emergency Generator (MEG) ICDE3 2-02-001-02 NF 1 hours 3.50 6.00 0.0066 0.40 0 694 0.03 0.006 -- -- g/kW-hr 5.79 9.92 0.01 0.66 0 1,147.96 0.05 0.009 --
750 kW Benzene 7.76E-04 lb/MMBtu 5.46E-03
Toluene 2.81E-04 lb/MMBtu 1.98E-03
Xylenes 1.93E-04 lb/MMBtu 1.36E-03
Formaldehyde 7.89E-05 lb/MMBtu 5.55E-04
Acetaldehyde 2.52E-05 lb/MMBtu 1.77E-04
Acrolein 7.88E-06 lb/MMBtu 5.55E-05
Naphthalene 1.30E-04 lb/MMBtu 9.15E-04
Acenaphthylene 9.23E-06 lb/MMBtu 6.50E-05
Acenaphthene 4.68E-06 lb/MMBtu 3.29E-05
Fluorene 1.28E-05 lb/MMBtu 9.01E-05
Rosemont Copper ProjectEmission Inventory Information JBR ENVIRONMENTAL CONSULTANTS, INC.
November 2011Page H256
AZRP00438

CO NOX SO2 VOC H2SO4 CO2 CH4 N2O HAP Name HAP EF CO NOX SO2 VOC H2SO4 CO2a CH4
a N2O a HAP bSCC
Emissions (lb/hr) - Year 15Emission FactorsUnit ID EF UnitsUnit Description Process Code
Non-Fug. (NF) /
Fug. (F)
Table H.66 Hourly Gaseous Emissions - Year 15
Hourly Production Rate -
Year 15Rate Units
Phenanthrene 4.08E-05 lb/MMBtu 2.87E-04
Anthracene 1.23E-06 lb/MMBtu 8.66E-06
Fluoranthene 4.03E-06 lb/MMBtu 2.84E-05
Pyrene 3.71E-06 lb/MMBtu 2.61E-05
Benz(a)anthracene 6.22E-07 lb/MMBtu 4.38E-06
Chrysene 1.53E-06 lb/MMBtu 1.08E-05
Benzo(b)fluoranthene 1.11E-06 lb/MMBtu 7.81E-06
Benzo(k)fluoranthene 2.18E-07 lb/MMBtu 1.53E-06
Benzo(a)pyrene 2.57E-07 lb/MMBtu 1.81E-06
Indeno(1,2,3-cd)pyrene 4.14E-07 lb/MMBtu 2.91E-06
Dibenz(a,h)anthracene 3.46E-07 lb/MMBtu 2.44E-06
Benzo(g,h,i)perylene 5.56E-07 lb/MMBtu 3.91E-06
FB05 Administration Building Emergency Generator (AEG) ICDE3 2-02-001-02 NF 1 hours 3.50 6.00 0.0066 0.40 0 694 0.03 0.006 -- -- g/kW-hr 5.79 9.92 0.01 0.66 0 1,147.96 0.05 0.009 --
750 kW Benzene 7.76E-04 lb/MMBtu 5.46E-03
Toluene 2.81E-04 lb/MMBtu 1.98E-03
Xylenes 1.93E-04 lb/MMBtu 1.36E-03
Formaldehyde 7.89E-05 lb/MMBtu 5.55E-04
Acetaldehyde 2.52E-05 lb/MMBtu 1.77E-04
Acrolein 7.88E-06 lb/MMBtu 5.55E-05
Naphthalene 1.30E-04 lb/MMBtu 9.15E-04
Acenaphthylene 9.23E-06 lb/MMBtu 6.50E-05
Acenaphthene 4.68E-06 lb/MMBtu 3.29E-05
Fluorene 1.28E-05 lb/MMBtu 9.01E-05
Phenanthrene 4.08E-05 lb/MMBtu 2.87E-04
Anthracene 1.23E-06 lb/MMBtu 8.66E-06
Fluoranthene 4.03E-06 lb/MMBtu 2.84E-05
Pyrene 3.71E-06 lb/MMBtu 2.61E-05
Benz(a)anthracene 6.22E-07 lb/MMBtu 4.38E-06
Chrysene 1.53E-06 lb/MMBtu 1.08E-05
Benzo(b)fluoranthene 1.11E-06 lb/MMBtu 7.81E-06
Benzo(k)fluoranthene 2.18E-07 lb/MMBtu 1.53E-06
Benzo(a)pyrene 2.57E-07 lb/MMBtu 1.81E-06
Indeno(1,2,3-cd)pyrene 4.14E-07 lb/MMBtu 2.91E-06
Dibenz(a,h)anthracene 3.46E-07 lb/MMBtu 2.44E-06
Benzo(g,h,i)perylene 5.56E-07 lb/MMBtu 3.91E-06
FB06 Electrowinning Building Emergency Generator (EWEG)
ICDE1 2-02-001-02 NF 1 hours 5.00 4.43 0.0066 0.27 0 694 0.03 0.006 -- -- g/kW-hr 0.55 0.49 0.0007 0.03 0 76.53 0.003 0.0006 --
50 kW Benzene 9.33E-04 lb/MMBtu 4.38E-04
Toluene 4.09E-04 lb/MMBtu 1.92E-04
Xylenes 2.85E-04 lb/MMBtu 1.34E-04
1,3-Butadiene 3.91E-05 lb/MMBtu 1.84E-05
Rosemont Copper ProjectEmission Inventory Information JBR ENVIRONMENTAL CONSULTANTS, INC.
November 2011Page H257
AZRP00439

CO NOX SO2 VOC H2SO4 CO2 CH4 N2O HAP Name HAP EF CO NOX SO2 VOC H2SO4 CO2a CH4
a N2O a HAP bSCC
Emissions (lb/hr) - Year 15Emission FactorsUnit ID EF UnitsUnit Description Process Code
Non-Fug. (NF) /
Fug. (F)
Table H.66 Hourly Gaseous Emissions - Year 15
Hourly Production Rate -
Year 15Rate Units
Formaldehyde 1.18E-03 lb/MMBtu 5.54E-04
Acetaldehyde 7.67E-04 lb/MMBtu 3.60E-04
Acrolein 9.25E-05 lb/MMBtu 4.34E-05
Naphthalene 8.48E-05 lb/MMBtu 3.98E-05
Acenaphthylene 5.06E-06 lb/MMBtu 2.37E-06
Acenaphthene 1.42E-06 lb/MMBtu 6.66E-07
Fluorene 2.92E-05 lb/MMBtu 1.37E-05
Phenanthrene 2.94E-05 lb/MMBtu 1.38E-05
Anthracene 1.87E-06 lb/MMBtu 8.78E-07
Fluoranthene 7.61E-06 lb/MMBtu 3.57E-06
Pyrene 4.78E-06 lb/MMBtu 2.24E-06
Benzo(a)anthracene 1.68E-06 lb/MMBtu 7.89E-07
Chrysene 3.53E-07 lb/MMBtu 1.66E-07
Benzo(b)fluoranthene 9.91E-08 lb/MMBtu 4.65E-08
Benzo(k)fluoranthene 1.55E-07 lb/MMBtu 7.28E-08
Benzo(a)pyrene 1.88E-07 lb/MMBtu 8.82E-08
Indeno(1,2,3-cd)pyrene 3.75E-07 lb/MMBtu 1.76E-07
Dibenz(a,h)anthracene 5.83E-07 lb/MMBtu 2.74E-07
Benzo(g,h,i)perylene 4.89E-07 lb/MMBtu 2.30E-07
FB07 Primary Crusher Fire Water Pump (PCFWP) ICDE2 2-02-001-02 NF 1 hours 3.50 3.73 0.0066 0.27 0 694 0.03 0.006 -- -- g/kW-hr 2.30 2.46 0.004 0.18 0 456.55 0.02 0.004 --
400 hp Benzene 9.33E-04 lb/MMBtu 2.61E-03
Toluene 4.09E-04 lb/MMBtu 1.15E-03
Xylenes 2.85E-04 lb/MMBtu 7.98E-04
1,3-Butadiene 3.91E-05 lb/MMBtu 1.09E-04
Formaldehyde 1.18E-03 lb/MMBtu 3.30E-03
Acetaldehyde 7.67E-04 lb/MMBtu 2.15E-03
Acrolein 9.25E-05 lb/MMBtu 2.59E-04
Naphthalene 8.48E-05 lb/MMBtu 2.37E-04
Acenaphthylene 5.06E-06 lb/MMBtu 1.42E-05
Acenaphthene 1.42E-06 lb/MMBtu 3.98E-06
Fluorene 2.92E-05 lb/MMBtu 8.18E-05
Phenanthrene 2.94E-05 lb/MMBtu 8.23E-05
Anthracene 1.87E-06 lb/MMBtu 5.24E-06
Fluoranthene 7.61E-06 lb/MMBtu 2.13E-05
Pyrene 4.78E-06 lb/MMBtu 1.34E-05
Benzo(a)anthracene 1.68E-06 lb/MMBtu 4.70E-06
Chrysene 3.53E-07 lb/MMBtu 9.88E-07
Benzo(b)fluoranthene 9.91E-08 lb/MMBtu 2.77E-07
Benzo(k)fluoranthene 1.55E-07 lb/MMBtu 4.34E-07
Benzo(a)pyrene 1.88E-07 lb/MMBtu 5.26E-07
Rosemont Copper ProjectEmission Inventory Information JBR ENVIRONMENTAL CONSULTANTS, INC.
November 2011Page H258
AZRP00440
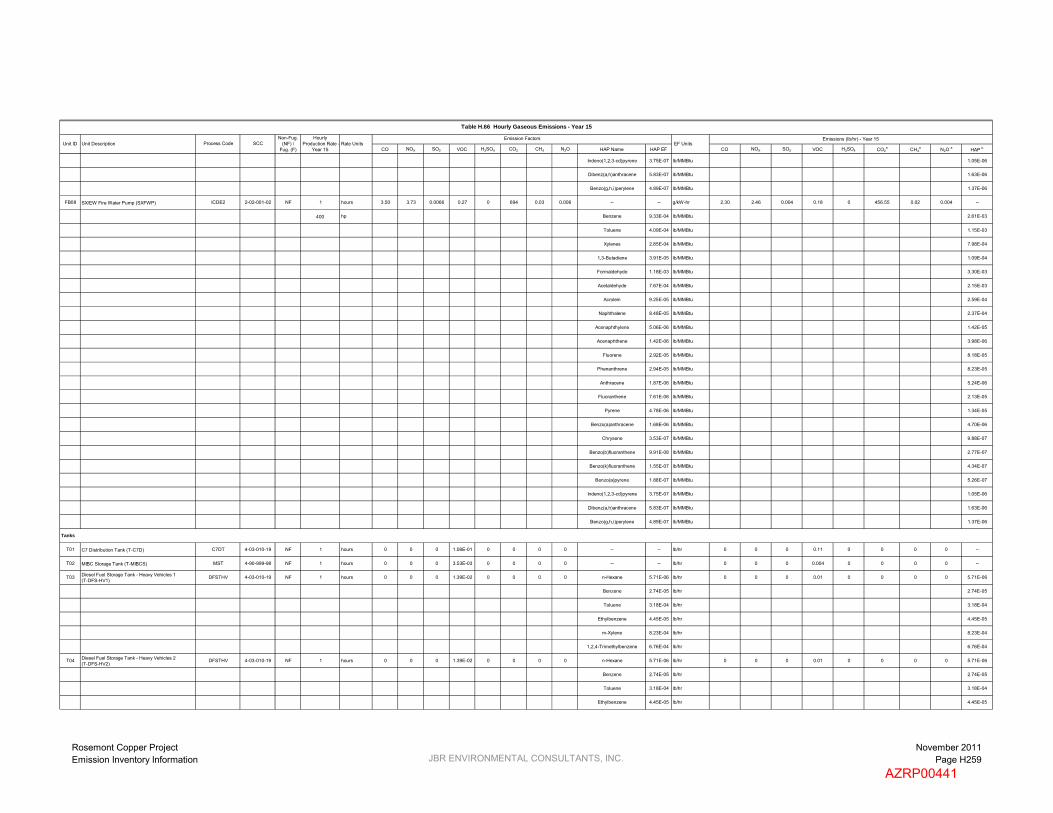
CO NOX SO2 VOC H2SO4 CO2 CH4 N2O HAP Name HAP EF CO NOX SO2 VOC H2SO4 CO2a CH4
a N2O a HAP bSCC
Emissions (lb/hr) - Year 15Emission FactorsUnit ID EF UnitsUnit Description Process Code
Non-Fug. (NF) /
Fug. (F)
Table H.66 Hourly Gaseous Emissions - Year 15
Hourly Production Rate -
Year 15Rate Units
Indeno(1,2,3-cd)pyrene 3.75E-07 lb/MMBtu 1.05E-06
Dibenz(a,h)anthracene 5.83E-07 lb/MMBtu 1.63E-06
Benzo(g,h,i)perylene 4.89E-07 lb/MMBtu 1.37E-06
FB08 SX/EW Fire Water Pump (SXFWP) ICDE2 2-02-001-02 NF 1 hours 3.50 3.73 0.0066 0.27 0 694 0.03 0.006 -- -- g/kW-hr 2.30 2.46 0.004 0.18 0 456.55 0.02 0.004 --
400 hp Benzene 9.33E-04 lb/MMBtu 2.61E-03
Toluene 4.09E-04 lb/MMBtu 1.15E-03
Xylenes 2.85E-04 lb/MMBtu 7.98E-04
1,3-Butadiene 3.91E-05 lb/MMBtu 1.09E-04
Formaldehyde 1.18E-03 lb/MMBtu 3.30E-03
Acetaldehyde 7.67E-04 lb/MMBtu 2.15E-03
Acrolein 9.25E-05 lb/MMBtu 2.59E-04
Naphthalene 8.48E-05 lb/MMBtu 2.37E-04
Acenaphthylene 5.06E-06 lb/MMBtu 1.42E-05
Acenaphthene 1.42E-06 lb/MMBtu 3.98E-06
Fluorene 2.92E-05 lb/MMBtu 8.18E-05
Phenanthrene 2.94E-05 lb/MMBtu 8.23E-05
Anthracene 1.87E-06 lb/MMBtu 5.24E-06
Fluoranthene 7.61E-06 lb/MMBtu 2.13E-05
Pyrene 4.78E-06 lb/MMBtu 1.34E-05
Benzo(a)anthracene 1.68E-06 lb/MMBtu 4.70E-06
Chrysene 3.53E-07 lb/MMBtu 9.88E-07
Benzo(b)fluoranthene 9.91E-08 lb/MMBtu 2.77E-07
Benzo(k)fluoranthene 1.55E-07 lb/MMBtu 4.34E-07
Benzo(a)pyrene 1.88E-07 lb/MMBtu 5.26E-07
Indeno(1,2,3-cd)pyrene 3.75E-07 lb/MMBtu 1.05E-06
Dibenz(a,h)anthracene 5.83E-07 lb/MMBtu 1.63E-06
Benzo(g,h,i)perylene 4.89E-07 lb/MMBtu 1.37E-06
Tanks
T01 C7 Distribution Tank (T-C7D) C7DT 4-03-010-19 NF 1 hours 0 0 0 1.08E-01 0 0 0 0 -- -- lb/hr 0 0 0 0.11 0 0 0 0 --
T02 MIBC Storage Tank (T-MIBCS) MST 4-90-999-98 NF 1 hours 0 0 0 3.53E-03 0 0 0 0 -- -- lb/hr 0 0 0 0.004 0 0 0 0 --
T03 Diesel Fuel Storage Tank - Heavy Vehicles 1(T-DFS-HV1)
DFSTHV 4-03-010-19 NF 1 hours 0 0 0 1.39E-02 0 0 0 0 n-Hexane 5.71E-06 lb/hr 0 0 0 0.01 0 0 0 0 5.71E-06
Benzene 2.74E-05 lb/hr 2.74E-05
Toluene 3.18E-04 lb/hr 3.18E-04
Ethylbenzene 4.45E-05 lb/hr 4.45E-05
m-Xylene 8.23E-04 lb/hr 8.23E-04
1,2,4-Trimethylbenzene 6.76E-04 lb/hr 6.76E-04
T04 Diesel Fuel Storage Tank - Heavy Vehicles 2(T-DFS-HV2)
DFSTHV 4-03-010-19 NF 1 hours 0 0 0 1.39E-02 0 0 0 0 n-Hexane 5.71E-06 lb/hr 0 0 0 0.01 0 0 0 0 5.71E-06
Benzene 2.74E-05 lb/hr 2.74E-05
Toluene 3.18E-04 lb/hr 3.18E-04
Ethylbenzene 4.45E-05 lb/hr 4.45E-05
Rosemont Copper ProjectEmission Inventory Information JBR ENVIRONMENTAL CONSULTANTS, INC.
November 2011Page H259
AZRP00441

CO NOX SO2 VOC H2SO4 CO2 CH4 N2O HAP Name HAP EF CO NOX SO2 VOC H2SO4 CO2a CH4
a N2O a HAP bSCC
Emissions (lb/hr) - Year 15Emission FactorsUnit ID EF UnitsUnit Description Process Code
Non-Fug. (NF) /
Fug. (F)
Table H.66 Hourly Gaseous Emissions - Year 15
Hourly Production Rate -
Year 15Rate Units
m-Xylene 8.23E-04 lb/hr 8.23E-04
1,2,4-Trimethylbenzene 6.76E-04 lb/hr 6.76E-04
32.38 52.57 0.07 3.61 0.004 7,363.56 0.30 0.06 0.08
3,484.00 884.00 104.00 0.86 0 29,455.36 1.19 0.24 0.76
3,516.38 936.57 104.07 4.48 0.004 36,818.92 1.49 0.30 0.84
231.23 315.18 1.00 22.50 -- 46,891.47 -- -- --
a CO2e emissions are calculcated by summing the individual greenhouse gas emissions multiplied by their global warming potential (GWP). GWP of CO2 = 1, GWP of CH4 = 21, GWP of N2O = 310.
b All HAP emissions are included in the facility-wide potential to emit, regardless of if they are fugitive or non-fugitive emissions.
Tailpipe Emissions (see Tables H.70-H.74):
Total Emissions (excluding tailpipe emissions):
Total Non-Fugitive Emissions (excluding tailpipe emissions):
Total Fugitive Emissions (excluding tailpipe emissions):
Rosemont Copper ProjectEmission Inventory Information JBR ENVIRONMENTAL CONSULTANTS, INC.
November 2011Page H260
AZRP00442

Hourly Daily AnnualTier 2/Tier 4 (Final) Emission Standards or Mobile 6 Output
Units lb/hr tpd tpy
Haulage Trucks, 250 tons 31 2,650 1.00 24 6,600 hours 0.32 0.15 g/hp-hr 8.69 0.10 28.69
Crawler Dozers, D11T Class 3 850 0.46 11 4,000 hours 0.575 0.03 g/hp-hr 0.04 0.0005 0.19
Crawler Dozers, D10T Class 3 580 0.68 16 6,000 hours 0.575 0.01 g/hp-hr 0.02 0.0002 0.07
Crawler Dozer, D8T Class 1 310 0.75 18 6,570 hours 0.575 0.01 g/hp-hr 0.003 0.00004 0.01
Rubber Tired Dozers, 834H Class 3 498 0.58 14 5,075 hours 0.575 0.01 g/hp-hr 0.01 0.0001 0.05
Motor Graders, 24M Class 1 533 0.68 16 6,000 hours 0.575 0.01 g/hp-hr 0.005 0.00006 0.02
Motor Graders, 16M Class 3 297 0.46 11 4,000 hours 0.575 0.01 g/hp-hr 0.005 0.00006 0.02
Water Trucks, 30,000 gallons 4 1,348 0.45 11 3,250 hours 0.35 0.03 g/hp-hr 0.06 0.0007 0.20
Diesel Blasthole Drill, 12.25 inches 2 1,500 0.75 18 6,570 hours 0.43 0.03 g/hp-hr 0.06 0.0008 0.28
Hydraulic DML 45 Drill 1 425 0.75 18 6,570 hours 0.43 0.01 g/hp-hr 0.003 0.00004 0.01
Front End Loaders 2 2,000 0.90 22 7,884 hours 0.59 0.15 g/hp-hr 0.70 0.008 3.08
Stemming Truck 2 450 0.75 18 6,570 hours 0.43 0.01 g/hp-hr 0.006 0.00008 0.03
ANFO/Slurry Truck, 20 tons 2 450 0.75 18 6,570 hours 0.43 0.01 g/hp-hr 0.006 0.00008 0.03
Powder Truck, 2 tons 2 350 0.75 18 6,570 hours 0.43 0.01 g/hp-hr 0.005 0.00006 0.02
Front End Loaders, 8 yd3 2 262 0.75 18 6,570 hours 0.575 0.01 g/hp-hr 0.005 0.00006 0.02
Hydraulic Excavator, 385 Cat CL 2 513 0.90 22 7,884 hours 0.35 0.01 g/hp-hr 0.007 0.00009 0.03
Backhoe/Loader, 2 yd3 1 124 0.75 18 6,570 hours 0.35 0.01 g/hp-hr 0.0007 0.000009 0.003
Load Factor
PM/TSP Emission Factors PM/TSP Emissions - Year 15Process Rates b - Year 15
Units
Table H.67 PM/TSP Emissions from Fuel Burning Mobile Engines - Year 15
Fuel Burning Mobile Engine Description a
Fleet Size
HP Rating
Rosemont Copper ProjectEmission Inventory Information JBR ENVIRONMENTAL CONSULTANTS, INC.
November 2011Page H261
AZRP00443
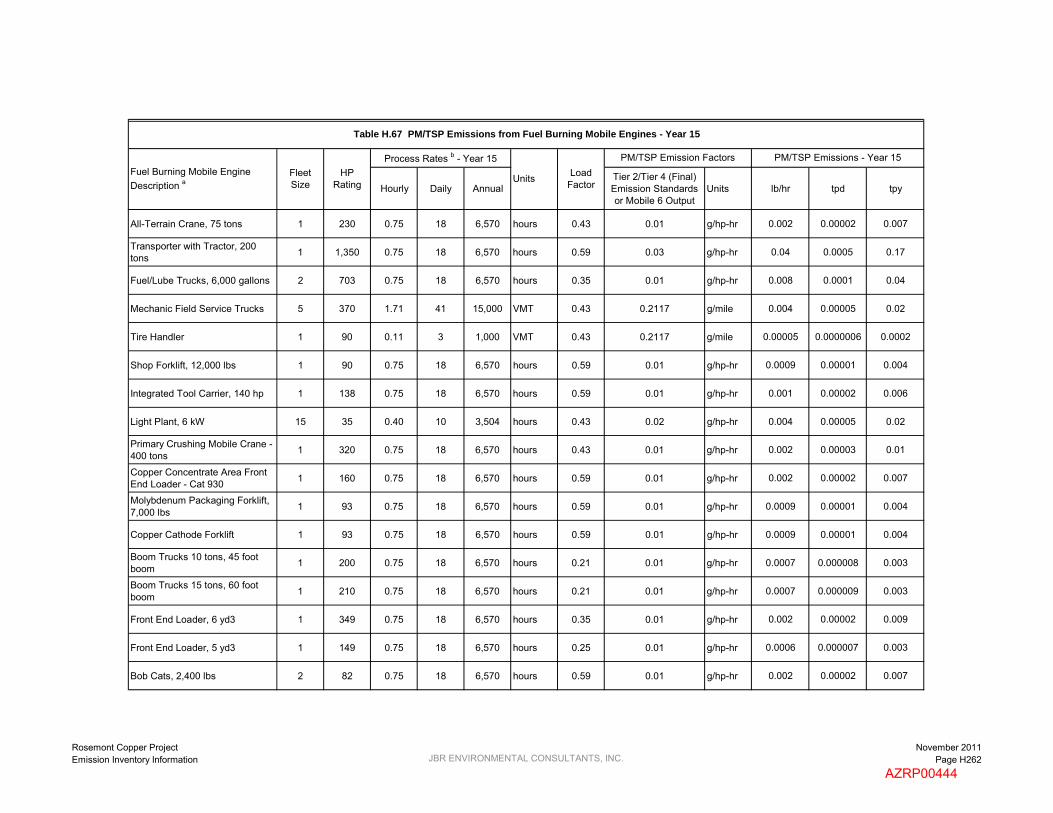
Hourly Daily AnnualTier 2/Tier 4 (Final) Emission Standards or Mobile 6 Output
Units lb/hr tpd tpyLoad
Factor
PM/TSP Emission Factors PM/TSP Emissions - Year 15Process Rates b - Year 15
Units
Table H.67 PM/TSP Emissions from Fuel Burning Mobile Engines - Year 15
Fuel Burning Mobile Engine Description a
Fleet Size
HP Rating
All-Terrain Crane, 75 tons 1 230 0.75 18 6,570 hours 0.43 0.01 g/hp-hr 0.002 0.00002 0.007
Transporter with Tractor, 200 tons 1 1,350 0.75 18 6,570 hours 0.59 0.03 g/hp-hr 0.04 0.0005 0.17
Fuel/Lube Trucks, 6,000 gallons 2 703 0.75 18 6,570 hours 0.35 0.01 g/hp-hr 0.008 0.0001 0.04
Mechanic Field Service Trucks 5 370 1.71 41 15,000 VMT 0.43 0.2117 g/mile 0.004 0.00005 0.02
Tire Handler 1 90 0.11 3 1,000 VMT 0.43 0.2117 g/mile 0.00005 0.0000006 0.0002
Shop Forklift, 12,000 lbs 1 90 0.75 18 6,570 hours 0.59 0.01 g/hp-hr 0.0009 0.00001 0.004
Integrated Tool Carrier, 140 hp 1 138 0.75 18 6,570 hours 0.59 0.01 g/hp-hr 0.001 0.00002 0.006
Light Plant, 6 kW 15 35 0.40 10 3,504 hours 0.43 0.02 g/hp-hr 0.004 0.00005 0.02
Primary Crushing Mobile Crane - 400 tons 1 320 0.75 18 6,570 hours 0.43 0.01 g/hp-hr 0.002 0.00003 0.01
Copper Concentrate Area Front End Loader - Cat 930 1 160 0.75 18 6,570 hours 0.59 0.01 g/hp-hr 0.002 0.00002 0.007
Molybdenum Packaging Forklift, 7,000 lbs 1 93 0.75 18 6,570 hours 0.59 0.01 g/hp-hr 0.0009 0.00001 0.004
Copper Cathode Forklift 1 93 0.75 18 6,570 hours 0.59 0.01 g/hp-hr 0.0009 0.00001 0.004
Boom Trucks 10 tons, 45 foot boom 1 200 0.75 18 6,570 hours 0.21 0.01 g/hp-hr 0.0007 0.000008 0.003
Boom Trucks 15 tons, 60 foot boom 1 210 0.75 18 6,570 hours 0.21 0.01 g/hp-hr 0.0007 0.000009 0.003
Front End Loader, 6 yd3 1 349 0.75 18 6,570 hours 0.35 0.01 g/hp-hr 0.002 0.00002 0.009
Front End Loader, 5 yd3 1 149 0.75 18 6,570 hours 0.25 0.01 g/hp-hr 0.0006 0.000007 0.003
Bob Cats, 2,400 lbs 2 82 0.75 18 6,570 hours 0.59 0.01 g/hp-hr 0.002 0.00002 0.007
Rosemont Copper ProjectEmission Inventory Information JBR ENVIRONMENTAL CONSULTANTS, INC.
November 2011Page H262
AZRP00444

Hourly Daily AnnualTier 2/Tier 4 (Final) Emission Standards or Mobile 6 Output
Units lb/hr tpd tpyLoad
Factor
PM/TSP Emission Factors PM/TSP Emissions - Year 15Process Rates b - Year 15
Units
Table H.67 PM/TSP Emissions from Fuel Burning Mobile Engines - Year 15
Fuel Burning Mobile Engine Description a
Fleet Size
HP Rating
Fork Lift, 2,000 lbs 1 50 0.75 18 6,570 hours 0.59 0.02 g/hp-hr 0.001 0.00001 0.004
Fork Lift, 5,000 lbs 1 63 0.75 18 6,570 hours 0.59 0.02 g/hp-hr 0.001 0.00001 0.005
Fork Lift, 3,000 lbs 2 50 0.75 18 6,570 hours 0.59 0.02 g/hp-hr 0.002 0.00002 0.009
Flat Bed Trucks, 10 tons 2 350 0.75 18 6,570 hours 0.43 0.01 g/hp-hr 0.005 0.00006 0.02
Dump Truck, 10 tons 1 250 0.34 8 3,000 VMT 0.43 0.2117 g/mile 0.0002 0.000002 0.0007
Mobile Hydraulic Crane, 60 tons 1 267 0.75 18 6,570 hours 0.43 0.01 g/hp-hr 0.002 0.00002 0.008
Truck Shop Bridge Crane, 60 tons 1 75 0.75 18 6,570 hours 0.43 0.01 g/hp-hr 0.0005 0.000006 0.002
Truck Shop Bridge Crane, 25 tons 1 24 0.75 18 6,570 hours 0.43 0.30 g/hp-hr 0.005 0.00006 0.02
CS683 Soil Compactor / Roller 2 173 0.75 18 6,570 hours 0.4 0.01 g/hp-hr 0.002 0.00003 0.01
246C Skid Steer Loader 2 73 0.75 18 6,570 hours 0.3 0.02 g/hp-hr 0.001 0.00002 0.006
RH200/340 O & K Shovel / Hitachi EX5500 1 2,520 0.75 18 6,570 hours 0.59 0.03 g/hp-hr 0.07 0.0009 0.32
Off-Road Tire Handling Truck 1 450 0.86 21 7,500 VMT 0.43 0.2117 g/mile 0.0004 0.000005 0.002
Contractor Haul Trucks, 25 tons 2 511 2.74 66 24,000 VMT 0.43 0.2117 g/mile 0.003 0.00003 0.01
Motivator for Mine Shovels 1 3,308 0.91 22 8,000 hours 0.43 0.02 g/hp-hr 0.06 0.0007 0.25
Storm Water Pond Pump 1 200 1.00 24 500 hours 1 0.01 g/hp-hr 0.004 0.00005 0.001
Mine Pit Dewatering Pump 4 100 1.00 24 500 hours 1 0.01 g/hp-hr 0.009 0.0001 0.002
Copper Concentrate Shipment Vehicles -- 450 29.60 1,021 169,872 VMT 0.43 0.2117 g/mile 0.01 0.0002 0.04
Rosemont Copper ProjectEmission Inventory Information JBR ENVIRONMENTAL CONSULTANTS, INC.
November 2011Page H263
AZRP00445

Hourly Daily AnnualTier 2/Tier 4 (Final) Emission Standards or Mobile 6 Output
Units lb/hr tpd tpyLoad
Factor
PM/TSP Emission Factors PM/TSP Emissions - Year 15Process Rates b - Year 15
Units
Table H.67 PM/TSP Emissions from Fuel Burning Mobile Engines - Year 15
Fuel Burning Mobile Engine Description a
Fleet Size
HP Rating
Molybdenum Concentrate Shipment Vehicles -- 450 7.40 15 2,145 VMT 0.43 0.2117 g/mile 0.003 0.000004 0.0005
Sulfuric Acid Delivery Vehicles -- 450 22.20 143 52,021 VMT 0.43 0.2117 g/mile 0.01 0.00003 0.01
Lime Delivery Vehicles -- 450 14.80 52 19,072 VMT 0.43 0.2117 g/mile 0.007 0.00001 0.004
SAG Mill and Ball Mill Grinding Balls Delivery Vehicles -- 450 14.80 23 5,858 VMT 0.43 0.2117 g/mile 0.007 0.000005 0.001
Diesel Fuel Delivery Vehicles -- 500 14.80 47 17,136 VMT 0.43 0.2117 g/mile 0.007 0.00001 0.004
Copper Cathode Shipment Vehicles -- 450 14.80 42 4,997 VMT 0.43 0.2117 g/mile 0.007 0.00001 0.001
Ammonium Nitrate Delivery Vehicles -- 450 7.40 25 6,384 VMT 0.43 0.2117 g/mile 0.003 0.000006 0.001
Miscellaneous Consumables Delivery Vehicles -- 450 7.40 48 12,486 VMT 0.43 0.2117 g/mile 0.003 0.00001 0.003
Miscellaneous Fuels and Lubricants Delivery Vehicles -- 450 7.40 7 1,110 VMT 0.43 0.2117 g/mile 0.003 0.000002 0.0003
Pickup Trucks (gasoline) 20 350 1.37 33 12,000 VMT 0.54 0.0255 g/mile 0.002 0.00002 0.007
Crew Van (gasoline) 3 350 0.91 22 8,000 VMT 0.54 0.0255 g/mile 0.0002 0.000002 0.0007
Lot Pick-Up Trucks (gasoline) 20 250 0.34 8 3,000 VMT 0.54 0.0255 g/mile 0.0004 0.000005 0.002
8.69 0.10 28.69
1.25 0.01 5.14
9.94 0.12 33.83
a Fuel burning mobile engines are diesel fuel fired unless otherwise noted.
b Except for the shipment and delivery vehicles, the process rates are for a single mobile engine. The process rates for the shipment and delivery vehicles are representative of the entire fleet.
Total Emissions from Haul Truck Engines:
Total Emissions from Other Mobile Engines:
Total Emissions from All Mobile Engines:
Rosemont Copper ProjectEmission Inventory Information JBR ENVIRONMENTAL CONSULTANTS, INC.
November 2011Page H264
AZRP00446

Hourly Daily AnnualTier 2/Tier 4 (Final) Emission Standards or Mobile 6 Output
Units lb/hr tpd tpy
Haulage Trucks, 250 tons 31 2,650 1.00 24 6,600 hours 0.32 0.15 g/hp-hr 8.69 0.10 28.69
Crawler Dozers, D11T Class 3 850 0.46 11 4,000 hours 0.575 0.03 g/hp-hr 0.04 0.0005 0.19
Crawler Dozers, D10T Class 3 580 0.68 16 6,000 hours 0.575 0.01 g/hp-hr 0.02 0.0002 0.07
Crawler Dozer, D8T Class 1 310 0.75 18 6,570 hours 0.575 0.01 g/hp-hr 0.003 0.00004 0.01
Rubber Tired Dozers, 834H Class 3 498 0.58 14 5,075 hours 0.575 0.01 g/hp-hr 0.01 0.0001 0.05
Motor Graders, 24M Class 1 533 0.68 16 6,000 hours 0.575 0.01 g/hp-hr 0.005 0.00006 0.02
Motor Graders, 16M Class 3 297 0.46 11 4,000 hours 0.575 0.01 g/hp-hr 0.005 0.00006 0.02
Water Trucks, 30,000 gallons 4 1,348 0.45 11 3,250 hours 0.35 0.03 g/hp-hr 0.06 0.0007 0.20
Diesel Blasthole Drill, 12.25 inches 2 1,500 0.75 18 6,570 hours 0.43 0.03 g/hp-hr 0.06 0.0008 0.28
Hydraulic DML 45 Drill 1 425 0.75 18 6,570 hours 0.43 0.01 g/hp-hr 0.003 0.00004 0.01
Front End Loaders 2 2,000 0.90 22 7,884 hours 0.59 0.15 g/hp-hr 0.70 0.008 3.08
Stemming Truck 2 450 0.75 18 6,570 hours 0.43 0.01 g/hp-hr 0.006 0.00008 0.03
ANFO/Slurry Truck, 20 tons 2 450 0.75 18 6,570 hours 0.43 0.01 g/hp-hr 0.006 0.00008 0.03
Powder Truck, 2 tons 2 350 0.75 18 6,570 hours 0.43 0.01 g/hp-hr 0.005 0.00006 0.02
Front End Loaders, 8 yd3 2 262 0.75 18 6,570 hours 0.575 0.01 g/hp-hr 0.005 0.00006 0.02
Hydraulic Excavator, 385 Cat CL 2 513 0.90 22 7,884 hours 0.35 0.01 g/hp-hr 0.007 0.00009 0.03
Backhoe/Loader, 2 yd3 1 124 0.75 18 6,570 hours 0.35 0.01 g/hp-hr 0.0007 0.000009 0.003
Table H.68 PM10 Emissions from Fuel Burning Mobile Engines - Year 15
Load Factor
PM10 Emission Factor PM10 Emissions - Year 15Fuel Burning Mobile Engine Description a
Fleet Size
HP Rating
Process Rates b - Year 15
Units
Rosemont Copper ProjectEmission Inventory Information JBR ENVIRONMENTAL CONSULTANTS, INC.
November 2011Page H265
AZRP00447
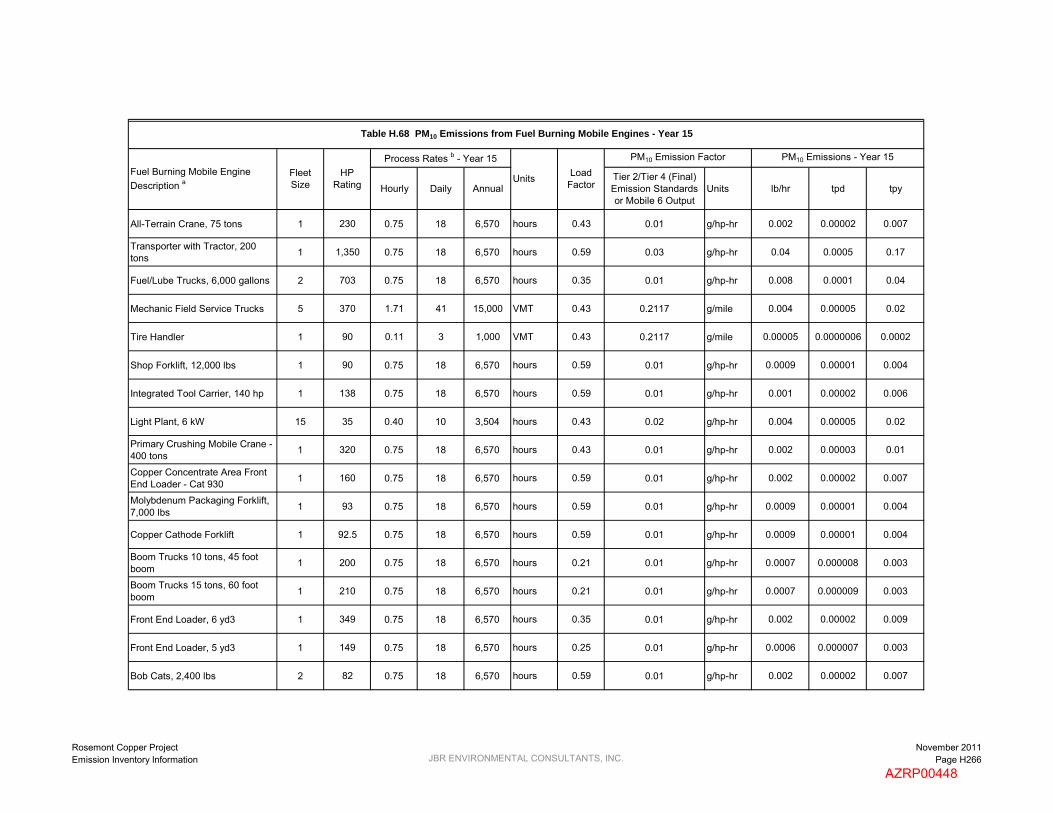
Hourly Daily AnnualTier 2/Tier 4 (Final) Emission Standards or Mobile 6 Output
Units lb/hr tpd tpy
Table H.68 PM10 Emissions from Fuel Burning Mobile Engines - Year 15
Load Factor
PM10 Emission Factor PM10 Emissions - Year 15Fuel Burning Mobile Engine Description a
Fleet Size
HP Rating
Process Rates b - Year 15
Units
All-Terrain Crane, 75 tons 1 230 0.75 18 6,570 hours 0.43 0.01 g/hp-hr 0.002 0.00002 0.007
Transporter with Tractor, 200 tons 1 1,350 0.75 18 6,570 hours 0.59 0.03 g/hp-hr 0.04 0.0005 0.17
Fuel/Lube Trucks, 6,000 gallons 2 703 0.75 18 6,570 hours 0.35 0.01 g/hp-hr 0.008 0.0001 0.04
Mechanic Field Service Trucks 5 370 1.71 41 15,000 VMT 0.43 0.2117 g/mile 0.004 0.00005 0.02
Tire Handler 1 90 0.11 3 1,000 VMT 0.43 0.2117 g/mile 0.00005 0.0000006 0.0002
Shop Forklift, 12,000 lbs 1 90 0.75 18 6,570 hours 0.59 0.01 g/hp-hr 0.0009 0.00001 0.004
Integrated Tool Carrier, 140 hp 1 138 0.75 18 6,570 hours 0.59 0.01 g/hp-hr 0.001 0.00002 0.006
Light Plant, 6 kW 15 35 0.40 10 3,504 hours 0.43 0.02 g/hp-hr 0.004 0.00005 0.02
Primary Crushing Mobile Crane - 400 tons 1 320 0.75 18 6,570 hours 0.43 0.01 g/hp-hr 0.002 0.00003 0.01
Copper Concentrate Area Front End Loader - Cat 930 1 160 0.75 18 6,570 hours 0.59 0.01 g/hp-hr 0.002 0.00002 0.007
Molybdenum Packaging Forklift, 7,000 lbs 1 93 0.75 18 6,570 hours 0.59 0.01 g/hp-hr 0.0009 0.00001 0.004
Copper Cathode Forklift 1 92.5 0.75 18 6,570 hours 0.59 0.01 g/hp-hr 0.0009 0.00001 0.004
Boom Trucks 10 tons, 45 foot boom 1 200 0.75 18 6,570 hours 0.21 0.01 g/hp-hr 0.0007 0.000008 0.003
Boom Trucks 15 tons, 60 foot boom 1 210 0.75 18 6,570 hours 0.21 0.01 g/hp-hr 0.0007 0.000009 0.003
Front End Loader, 6 yd3 1 349 0.75 18 6,570 hours 0.35 0.01 g/hp-hr 0.002 0.00002 0.009
Front End Loader, 5 yd3 1 149 0.75 18 6,570 hours 0.25 0.01 g/hp-hr 0.0006 0.000007 0.003
Bob Cats, 2,400 lbs 2 82 0.75 18 6,570 hours 0.59 0.01 g/hp-hr 0.002 0.00002 0.007
Rosemont Copper ProjectEmission Inventory Information JBR ENVIRONMENTAL CONSULTANTS, INC.
November 2011Page H266
AZRP00448

Hourly Daily AnnualTier 2/Tier 4 (Final) Emission Standards or Mobile 6 Output
Units lb/hr tpd tpy
Table H.68 PM10 Emissions from Fuel Burning Mobile Engines - Year 15
Load Factor
PM10 Emission Factor PM10 Emissions - Year 15Fuel Burning Mobile Engine Description a
Fleet Size
HP Rating
Process Rates b - Year 15
Units
Fork Lift, 2,000 lbs 1 50 0.75 18 6,570 hours 0.59 0.02 g/hp-hr 0.001 0.00001 0.004
Fork Lift, 5,000 lbs 1 63 0.75 18 6,570 hours 0.59 0.02 g/hp-hr 0.001 0.00001 0.005
Fork Lift, 3,000 lbs 2 50 0.75 18 6,570 hours 0.59 0.02 g/hp-hr 0.002 0.00002 0.009
Flat Bed Trucks, 10 tons 2 350 0.75 18 6,570 hours 0.43 0.01 g/hp-hr 0.005 0.00006 0.02
Dump Truck, 10 tons 1 250 0.34 8 3,000 VMT 0.43 0.2117 g/mile 0.0002 0.000002 0.0007
Mobile Hydraulic Crane, 60 tons 1 267 0.75 18 6,570 hours 0.43 0.01 g/hp-hr 0.002 0.00002 0.008
Truck Shop Bridge Crane, 60 tons 1 75 0.75 18 6,570 hours 0.43 0.01 g/hp-hr 0.0005 0.000006 0.002
Truck Shop Bridge Crane, 25 tons 1 24.1 0.75 18 6,570 hours 0.43 0.30 g/hp-hr 0.005 0.00006 0.02
CS683 Soil Compactor / Roller 2 173 0.75 18 6,570 hours 0.40 0.01 g/hp-hr 0.002 0.00003 0.01
246C Skid Steer Loader 2 73 0.75 18 6,570 hours 0.30 0.02 g/hp-hr 0.001 0.00002 0.006
RH200/340 O & K Shovel / Hitachi EX5500 1 2,520 0.75 18 6,570 hours 0.59 0.03 g/hp-hr 0.07 0.0009 0.32
Off-Road Tire Handling Truck 1 450 0.86 21 7,500 VMT 0.43 0.2117 g/mile 0.0004 0.000005 0.002
Contractor Haul Trucks, 25 tons 2 511 2.74 66 24,000 VMT 0.43 0.2117 g/mile 0.003 0.00003 0.01
Motivator for Mine Shovels 1 3,308 0.91 22 8,000 hours 0.43 0.02 g/hp-hr 0.06 0.0007 0.25
Storm Water Pond Pump 1 200 1.00 24 500 hours 1 0.01 g/hp-hr 0.004 0.00005 0.001
Mine Pit Dewatering Pump 4 100 1.00 24 500 hours 1 0.01 g/hp-hr 0.009 0.0001 0.002
Copper Concentrate Shipment Vehicles -- 450 29.60 1,021 169,872 VMT 0.43 0.2117 g/mile 0.01 0.0002 0.04
Rosemont Copper ProjectEmission Inventory Information JBR ENVIRONMENTAL CONSULTANTS, INC.
November 2011Page H267
AZRP00449

Hourly Daily AnnualTier 2/Tier 4 (Final) Emission Standards or Mobile 6 Output
Units lb/hr tpd tpy
Table H.68 PM10 Emissions from Fuel Burning Mobile Engines - Year 15
Load Factor
PM10 Emission Factor PM10 Emissions - Year 15Fuel Burning Mobile Engine Description a
Fleet Size
HP Rating
Process Rates b - Year 15
Units
Molybdenum Concentrate Shipment Vehicles -- 450 7.40 15 2,145 VMT 0.43 0.2117 g/mile 0.003 0.000004 0.0005
Sulfuric Acid Delivery Vehicles -- 450 22.20 143 52,021 VMT 0.43 0.2117 g/mile 0.01 0.00003 0.01
Lime Delivery Vehicles -- 450 14.80 52 19,072 VMT 0.43 0.2117 g/mile 0.007 0.00001 0.004
SAG Mill and Ball Mill Grinding Balls Delivery Vehicles -- 450 14.80 23 5,858 VMT 0.43 0.2117 g/mile 0.007 0.000005 0.001
Diesel Fuel Delivery Vehicles -- 500 14.80 47 17,136 VMT 0.43 0.2117 g/mile 0.007 0.00001 0.004
Copper Cathode Shipment Vehicles -- 450 14.80 42 4,997 VMT 0.43 0.2117 g/mile 0.007 0.00001 0.001
Ammonium Nitrate Delivery Vehicles -- 450 7.40 25 6,384 VMT 0.43 0.2117 g/mile 0.003 0.000006 0.001
Miscellaneous Consumables Delivery Vehicles -- 450 7.40 48 12,486 VMT 0.43 0.2117 g/mile 0.003 0.00001 0.003
Miscellaneous Fuels and Lubricants Delivery Vehicles -- 450 7.40 7 1,110 VMT 0.43 0.2117 g/mile 0.003 0.000002 0.0003
Pickup Trucks (gasoline) 20 350 1.37 33 12,000 VMT 0.54 0.0255 g/mile 0.002 0.00002 0.007
Crew Van (gasoline) 3 350 0.91 22 8,000 VMT 0.54 0.0255 g/mile 0.0002 0.000002 0.0007
Lot Pick-Up Trucks (gasoline) 20 250 0.34 8 3,000 VMT 0.54 0.0255 g/mile 0.0004 0.000005 0.002
8.69 0.10 28.69
1.25 0.01 5.14
9.94 0.12 33.83
a Fuel burning mobile engines are diesel fuel fired unless otherwise noted.
b Except for the shipment and delivery vehicles, the process rates are for a single mobile engine. The process rates for the shipment and delivery vehicles are representative of the entire fleet.
Total Emissions from Haul Truck Engines:
Total Emissions from Other Mobile Engines:
Total Emissions from All Mobile Engies:
Rosemont Copper ProjectEmission Inventory Information JBR ENVIRONMENTAL CONSULTANTS, INC.
November 2011Page H268
AZRP00450

Hourly Daily AnnualTier 2/Tier 4 (Final) Emission Standards or Mobile 6 Output
Units lb/hr tpd tpy
Haulage Trucks, 250 tons 31 2,650 1.00 24 6,600 hours 0.32 0.15 g/hp-hr 8.69 0.10 28.69
Crawler Dozers, D11T Class 3 850 0.46 11 4,000 hours 0.575 0.03 g/hp-hr 0.04 0.0005 0.19
Crawler Dozers, D10T Class 3 580 0.68 16 6,000 hours 0.575 0.01 g/hp-hr 0.02 0.0002 0.07
Crawler Dozer, D8T Class 1 310 0.75 18 6,570 hours 0.575 0.01 g/hp-hr 0.003 0.00004 0.01
Rubber Tired Dozers, 834H Class 3 498 0.58 14 5,075 hours 0.575 0.01 g/hp-hr 0.01 0.0001 0.05
Motor Graders, 24M Class 1 533 0.68 16 6,000 hours 0.575 0.01 g/hp-hr 0.005 0.00006 0.02
Motor Graders, 16M Class 3 297 0.46 11 4,000 hours 0.575 0.01 g/hp-hr 0.005 0.00006 0.02
Water Trucks, 30,000 gallons 4 1,348 0.45 11 3,250 hours 0.35 0.03 g/hp-hr 0.06 0.0007 0.20
Diesel Blasthole Drill, 12.25 inches 2 1,500 0.75 18 6,570 hours 0.43 0.03 g/hp-hr 0.06 0.0008 0.28
Hydraulic DML 45 Drill 1 425 0.75 18 6,570 hours 0.43 0.01 g/hp-hr 0.003 0.00004 0.01
Front End Loaders 2 2,000 0.90 22 7,884 hours 0.59 0.15 g/hp-hr 0.70 0.008 3.08
Stemming Truck 2 450 0.75 18 6,570 hours 0.43 0.01 g/hp-hr 0.006 0.00008 0.03
ANFO/Slurry Truck, 20 tons 2 450 0.75 18 6,570 hours 0.43 0.01 g/hp-hr 0.006 0.00008 0.03
Powder Truck, 2 tons 2 350 0.75 18 6,570 hours 0.43 0.01 g/hp-hr 0.005 0.00006 0.02
Front End Loaders, 8 yd3 2 262 0.75 18 6,570 hours 0.575 0.01 g/hp-hr 0.005 0.00006 0.02
Hydraulic Excavator, 385 Cat CL 2 513 0.90 22 7,884 hours 0.35 0.01 g/hp-hr 0.007 0.00009 0.03
Backhoe/Loader, 2 yd3 1 124 0.75 18 6,570 hours 0.35 0.01 g/hp-hr 0.0007 0.000009 0.003
Load Factor
PM2.5 Emission Factor PM2.5 Emissions - Year 15Process Rates b - Year 15
Units
Table H.69 PM2.5 Emissions from Fuel Burning Mobile Engines - Year 15
Fuel Burning Mobile Engine Description a
Fleet Size
HP Rating
Rosemont Copper ProjectEmission Inventory Information JBR ENVIRONMENTAL CONSULTANTS, INC.
November 2011Page H269
AZRP00451

Hourly Daily AnnualTier 2/Tier 4 (Final) Emission Standards or Mobile 6 Output
Units lb/hr tpd tpyLoad
Factor
PM2.5 Emission Factor PM2.5 Emissions - Year 15Process Rates b - Year 15
Units
Table H.69 PM2.5 Emissions from Fuel Burning Mobile Engines - Year 15
Fuel Burning Mobile Engine Description a
Fleet Size
HP Rating
All-Terrain Crane, 75 tons 1 230 0.75 18 6,570 hours 0.43 0.01 g/hp-hr 0.002 0.00002 0.007
Transporter with Tractor, 200 tons 1 1,350 0.75 18 6,570 hours 0.59 0.03 g/hp-hr 0.04 0.0005 0.17
Fuel/Lube Trucks, 6,000 gallons 2 703 0.75 18 6,570 hours 0.35 0.01 g/hp-hr 0.008 0.0001 0.04
Mechanic Field Service Trucks 5 370 1.71 41 15,000 VMT 0.43 0.2117 g/mile 0.004 0.00005 0.02
Tire Handler 1 90 0.11 3 1,000 VMT 0.43 0.2117 g/mile 0.00005 0.0000006 0.0002
Shop Forklift, 12,000 lbs 1 90 0.75 18 6,570 hours 0.59 0.01 g/hp-hr 0.0009 0.00001 0.004
Integrated Tool Carrier, 140 hp 1 138 0.75 18 6,570 hours 0.59 0.01 g/hp-hr 0.001 0.00002 0.006
Light Plant, 6 kW 15 35 0.40 10 3,504 hours 0.43 0.02 g/hp-hr 0.004 0.00005 0.02
Primary Crushing Mobile Crane - 400 tons 1 320 0.75 18 6,570 hours 0.43 0.01 g/hp-hr 0.002 0.00003 0.01
Copper Concentrate Area Front End Loader - Cat 930 1 160 0.75 18 6,570 hours 0.59 0.01 g/hp-hr 0.002 0.00002 0.007
Molybdenum Packaging Forklift, 7,000 lbs 1 93 0.75 18 6,570 hours 0.59 0.01 g/hp-hr 0.0009 0.00001 0.004
Copper Cathode Forklift 1 93 0.75 18 6,570 hours 0.59 0.01 g/hp-hr 0.0009 0.00001 0.004
Boom Trucks 10 tons, 45 foot boom 1 200 0.75 18 6,570 hours 0.21 0.01 g/hp-hr 0.0007 0.000008 0.003
Boom Trucks 15 tons, 60 foot boom 1 210 0.75 18 6,570 hours 0.21 0.01 g/hp-hr 0.0007 0.000009 0.003
Front End Loader, 6 yd3 1 349 0.75 18 6,570 hours 0.35 0.01 g/hp-hr 0.002 0.00002 0.009
Front End Loader, 5 yd3 1 149 0.75 18 6,570 hours 0.25 0.01 g/hp-hr 0.0006 0.000007 0.003
Bob Cats, 2,400 lbs 2 82 0.75 18 6,570 hours 0.59 0.01 g/hp-hr 0.002 0.00002 0.007
Rosemont Copper ProjectEmission Inventory Information JBR ENVIRONMENTAL CONSULTANTS, INC.
November 2011Page H270
AZRP00452

Hourly Daily AnnualTier 2/Tier 4 (Final) Emission Standards or Mobile 6 Output
Units lb/hr tpd tpyLoad
Factor
PM2.5 Emission Factor PM2.5 Emissions - Year 15Process Rates b - Year 15
Units
Table H.69 PM2.5 Emissions from Fuel Burning Mobile Engines - Year 15
Fuel Burning Mobile Engine Description a
Fleet Size
HP Rating
Fork Lift, 2,000 lbs 1 50 0.75 18 6,570 hours 0.59 0.02 g/hp-hr 0.001 0.00001 0.004
Fork Lift, 5,000 lbs 1 63 0.75 18 6,570 hours 0.59 0.02 g/hp-hr 0.001 0.00001 0.005
Fork Lift, 3,000 lbs 2 50 0.75 18 6,570 hours 0.59 0.02 g/hp-hr 0.002 0.00002 0.009
Flat Bed Trucks, 10 tons 2 350 0.75 18 6,570 hours 0.43 0.01 g/hp-hr 0.005 0.00006 0.02
Dump Truck, 10 tons 1 250 0.34 8 3,000 VMT 0.43 0.2117 g/mile 0.0002 0.000002 0.0007
Mobile Hydraulic Crane, 60 tons 1 267 0.75 18 6,570 hours 0.43 0.01 g/hp-hr 0.002 0.00002 0.008
Truck Shop Bridge Crane, 60 tons 1 75 0.75 18 6,570 hours 0.43 0.01 g/hp-hr 0.0005 0.000006 0.002
Truck Shop Bridge Crane, 25 tons 1 24 0.75 18 6,570 hours 0.43 0.30 g/hp-hr 0.005 0.00006 0.02
CS683 Soil Compactor / Roller 2 173 0.75 18 6,570 hours 0.4 0.01 g/hp-hr 0.002 0.00003 0.01
246C Skid Steer Loader 2 73 0.75 18 6,570 hours 0.3 0.02 g/hp-hr 0.001 0.00002 0.006
RH200/340 O & K Shovel / Hitachi EX5500 1 2,520 0.75 18 6,570 hours 0.59 0.03 g/hp-hr 0.07 0.0009 0.32
Off-Road Tire Handling Truck 1 450 0.86 21 7,500 VMT 0.43 0.2117 g/mile 0.0004 0.000005 0.002
Contractor Haul Trucks, 25 tons 2 511 2.74 66 24,000 VMT 0.43 0.2117 g/mile 0.003 0.00003 0.01
Motivator for Mine Shovels 1 3,308 0.91 22 8,000 hours 0.43 0.02 g/hp-hr 0.06 0.0007 0.25
Storm Water Pond Pump 1 200 1.00 24 500 hours 1 0.01 g/hp-hr 0.004 0.00005 0.001
Mine Pit Dewatering Pump 4 100 1.00 24 500 hours 1 0.01 g/hp-hr 0.009 0.0001 0.002
Copper Concentrate Shipment Vehicles -- 450 29.60 1,021 169,872 VMT 0.43 0.2117 g/mile 0.01 0.0002 0.04
Rosemont Copper ProjectEmission Inventory Information JBR ENVIRONMENTAL CONSULTANTS, INC.
November 2011Page H271
AZRP00453

Hourly Daily AnnualTier 2/Tier 4 (Final) Emission Standards or Mobile 6 Output
Units lb/hr tpd tpyLoad
Factor
PM2.5 Emission Factor PM2.5 Emissions - Year 15Process Rates b - Year 15
Units
Table H.69 PM2.5 Emissions from Fuel Burning Mobile Engines - Year 15
Fuel Burning Mobile Engine Description a
Fleet Size
HP Rating
Molybdenum Concentrate Shipment Vehicles -- 450 7.40 15 2,145 VMT 0.43 0.2117 g/mile 0.003 0.000004 0.0005
Sulfuric Acid Delivery Vehicles -- 450 22.20 143 52,021 VMT 0.43 0.2117 g/mile 0.01 0.00003 0.01
Lime Delivery Vehicles -- 450 14.80 52 19,072 VMT 0.43 0.2117 g/mile 0.007 0.00001 0.004
SAG Mill and Ball Mill Grinding Balls Delivery Vehicles -- 450 14.80 23 5,858 VMT 0.43 0.2117 g/mile 0.007 0.000005 0.001
Diesel Fuel Delivery Vehicles -- 500 14.80 47 17,136 VMT 0.43 0.2117 g/mile 0.007 0.00001 0.004
Copper Cathode Shipment Vehicles -- 450 14.80 42 4,997 VMT 0.43 0.2117 g/mile 0.007 0.00001 0.001
Ammonium Nitrate Delivery Vehicles -- 450 7.40 25 6,384 VMT 0.43 0.2117 g/mile 0.003 0.000006 0.001
Miscellaneous Consumables Delivery Vehicles -- 450 7.40 48 12,486 VMT 0.43 0.2117 g/mile 0.003 0.00001 0.003
Miscellaneous Fuels and Lubricants Delivery Vehicles -- 450 7.40 7 1,110 VMT 0.43 0.2117 g/mile 0.003 0.000002 0.0003
Pickup Trucks (gasoline) 20 350 1.37 33 12,000 VMT 0.54 0.0255 g/mile 0.002 0.00002 0.007
Crew Van (gasoline) 3 350 0.91 22 8,000 VMT 0.54 0.0255 g/mile 0.0002 0.000002 0.0007
Lot Pick-Up Trucks (gasoline) 20 250 0.34 8 3,000 VMT 0.54 0.0255 g/mile 0.0004 0.000005 0.002
8.69 0.10 28.69
1.25 0.01 5.14
9.94 0.12 33.83
a Fuel burning mobile engines are diesel fuel fired unless otherwise noted.
b Except for the shipment and delivery vehicles, the process rates are for a single mobile engine. The process rates for the shipment and delivery vehicles are representative of the entire fleet.
Total Emissions from Haul Truck Engines:
Total Emissions from Other Mobile Engines:
Total Emissions from All Mobile Engines:
Rosemont Copper ProjectEmission Inventory Information JBR ENVIRONMENTAL CONSULTANTS, INC.
November 2011Page H272
AZRP00454

Hourly Daily AnnualTier 2/Tier 3 Emission Standards or Mobile 6
OutputUnits lb/hr tpd tpy
Haulage Trucks, 250 tons 31 2,650 1.00 24 6,600 hours 0.32 2.60 g/hp-hr 150.68 1.81 497.25
Crawler Dozers, D11T Class 3 850 0.46 11 4,000 hours 0.575 2.60 g/hp-hr 3.84 0.05 16.81
Crawler Dozers, D10T Class 3 580 0.68 16 6,000 hours 0.575 2.60 g/hp-hr 3.93 0.05 17.20
Crawler Dozer, D8T Class 1 310 0.75 18 6,570 hours 0.575 2.60 g/hp-hr 0.77 0.009 3.36
Rubber Tired Dozers, 834H Class 3 498 0.58 14 5,075 hours 0.575 2.60 g/hp-hr 2.85 0.03 12.49
Motor Graders, 24M Class 1 533 0.68 16 6,000 hours 0.575 2.60 g/hp-hr 1.20 0.01 5.27
Motor Graders, 16M Class 3 297 0.46 11 4,000 hours 0.575 2.60 g/hp-hr 1.34 0.02 5.87
Water Trucks, 30,000 gallons 4 1,348 0.45 11 3,250 hours 0.35 2.60 g/hp-hr 4.82 0.06 17.58
Diesel Blasthole Drill, 12.25 inches 2 1,500 0.75 18 6,570 hours 0.43 2.60 g/hp-hr 5.55 0.07 24.29
Hydraulic DML 45 Drill 1 425 0.75 18 6,570 hours 0.43 2.60 g/hp-hr 0.79 0.009 3.44
Front End Loaders 2 2,000 0.90 22 7,884 hours 0.59 2.60 g/hp-hr 12.17 0.15 53.33
Stemming Truck 2 450 0.75 18 6,570 hours 0.43 2.60 g/hp-hr 1.66 0.02 7.29
ANFO/Slurry Truck, 20 tons 2 450 0.75 18 6,570 hours 0.43 2.60 g/hp-hr 1.66 0.02 7.29
Powder Truck, 2 tons 2 350 0.75 18 6,570 hours 0.43 2.60 g/hp-hr 1.29 0.02 5.67
Front End Loaders, 8 yd3 2 262 0.75 18 6,570 hours 0.575 2.60 g/hp-hr 1.30 0.02 5.67
Hydraulic Excavator, 385 Cat CL 2 513 0.90 22 7,884 hours 0.35 2.60 g/hp-hr 1.85 0.02 8.11
Backhoe/Loader, 2 yd3 1 124 0.75 18 6,570 hours 0.35 3.70 g/hp-hr 0.27 0.003 1.16
Load Factor
CO Emission Factor CO Emissions - Year 15Process Rates b - Year 15
Units
Table H.70 CO Emissions from Fuel Burning Mobile Engines - Year 15
Fuel Burning Mobile Engine Description a
Fleet Size
HP Rating
Rosemont Copper ProjectEmission Inventory Information JBR ENVIRONMENTAL CONSULTANTS, INC.
November 2011Page H273
AZRP00455
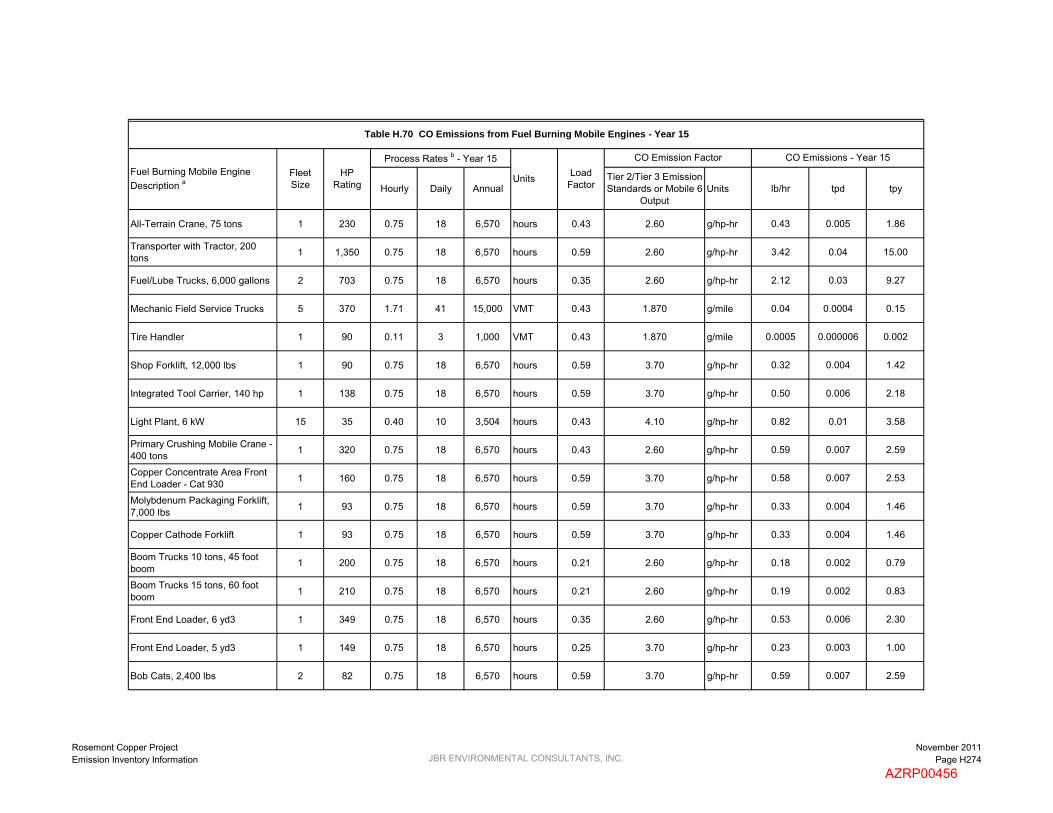
Hourly Daily AnnualTier 2/Tier 3 Emission Standards or Mobile 6
OutputUnits lb/hr tpd tpy
Load Factor
CO Emission Factor CO Emissions - Year 15Process Rates b - Year 15
Units
Table H.70 CO Emissions from Fuel Burning Mobile Engines - Year 15
Fuel Burning Mobile Engine Description a
Fleet Size
HP Rating
All-Terrain Crane, 75 tons 1 230 0.75 18 6,570 hours 0.43 2.60 g/hp-hr 0.43 0.005 1.86
Transporter with Tractor, 200 tons 1 1,350 0.75 18 6,570 hours 0.59 2.60 g/hp-hr 3.42 0.04 15.00
Fuel/Lube Trucks, 6,000 gallons 2 703 0.75 18 6,570 hours 0.35 2.60 g/hp-hr 2.12 0.03 9.27
Mechanic Field Service Trucks 5 370 1.71 41 15,000 VMT 0.43 1.870 g/mile 0.04 0.0004 0.15
Tire Handler 1 90 0.11 3 1,000 VMT 0.43 1.870 g/mile 0.0005 0.000006 0.002
Shop Forklift, 12,000 lbs 1 90 0.75 18 6,570 hours 0.59 3.70 g/hp-hr 0.32 0.004 1.42
Integrated Tool Carrier, 140 hp 1 138 0.75 18 6,570 hours 0.59 3.70 g/hp-hr 0.50 0.006 2.18
Light Plant, 6 kW 15 35 0.40 10 3,504 hours 0.43 4.10 g/hp-hr 0.82 0.01 3.58
Primary Crushing Mobile Crane - 400 tons 1 320 0.75 18 6,570 hours 0.43 2.60 g/hp-hr 0.59 0.007 2.59
Copper Concentrate Area Front End Loader - Cat 930 1 160 0.75 18 6,570 hours 0.59 3.70 g/hp-hr 0.58 0.007 2.53
Molybdenum Packaging Forklift, 7,000 lbs 1 93 0.75 18 6,570 hours 0.59 3.70 g/hp-hr 0.33 0.004 1.46
Copper Cathode Forklift 1 93 0.75 18 6,570 hours 0.59 3.70 g/hp-hr 0.33 0.004 1.46
Boom Trucks 10 tons, 45 foot boom 1 200 0.75 18 6,570 hours 0.21 2.60 g/hp-hr 0.18 0.002 0.79
Boom Trucks 15 tons, 60 foot boom 1 210 0.75 18 6,570 hours 0.21 2.60 g/hp-hr 0.19 0.002 0.83
Front End Loader, 6 yd3 1 349 0.75 18 6,570 hours 0.35 2.60 g/hp-hr 0.53 0.006 2.30
Front End Loader, 5 yd3 1 149 0.75 18 6,570 hours 0.25 3.70 g/hp-hr 0.23 0.003 1.00
Bob Cats, 2,400 lbs 2 82 0.75 18 6,570 hours 0.59 3.70 g/hp-hr 0.59 0.007 2.59
Rosemont Copper ProjectEmission Inventory Information JBR ENVIRONMENTAL CONSULTANTS, INC.
November 2011Page H274
AZRP00456
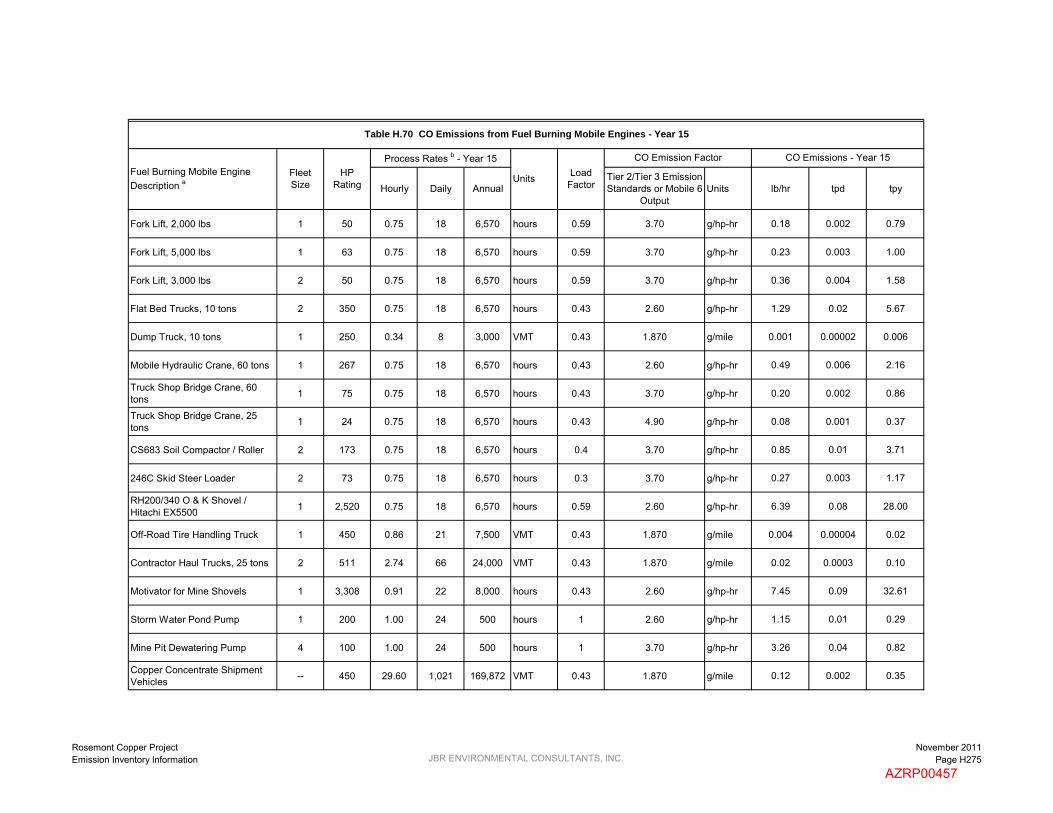
Hourly Daily AnnualTier 2/Tier 3 Emission Standards or Mobile 6
OutputUnits lb/hr tpd tpy
Load Factor
CO Emission Factor CO Emissions - Year 15Process Rates b - Year 15
Units
Table H.70 CO Emissions from Fuel Burning Mobile Engines - Year 15
Fuel Burning Mobile Engine Description a
Fleet Size
HP Rating
Fork Lift, 2,000 lbs 1 50 0.75 18 6,570 hours 0.59 3.70 g/hp-hr 0.18 0.002 0.79
Fork Lift, 5,000 lbs 1 63 0.75 18 6,570 hours 0.59 3.70 g/hp-hr 0.23 0.003 1.00
Fork Lift, 3,000 lbs 2 50 0.75 18 6,570 hours 0.59 3.70 g/hp-hr 0.36 0.004 1.58
Flat Bed Trucks, 10 tons 2 350 0.75 18 6,570 hours 0.43 2.60 g/hp-hr 1.29 0.02 5.67
Dump Truck, 10 tons 1 250 0.34 8 3,000 VMT 0.43 1.870 g/mile 0.001 0.00002 0.006
Mobile Hydraulic Crane, 60 tons 1 267 0.75 18 6,570 hours 0.43 2.60 g/hp-hr 0.49 0.006 2.16
Truck Shop Bridge Crane, 60 tons 1 75 0.75 18 6,570 hours 0.43 3.70 g/hp-hr 0.20 0.002 0.86
Truck Shop Bridge Crane, 25 tons 1 24 0.75 18 6,570 hours 0.43 4.90 g/hp-hr 0.08 0.001 0.37
CS683 Soil Compactor / Roller 2 173 0.75 18 6,570 hours 0.4 3.70 g/hp-hr 0.85 0.01 3.71
246C Skid Steer Loader 2 73 0.75 18 6,570 hours 0.3 3.70 g/hp-hr 0.27 0.003 1.17
RH200/340 O & K Shovel / Hitachi EX5500 1 2,520 0.75 18 6,570 hours 0.59 2.60 g/hp-hr 6.39 0.08 28.00
Off-Road Tire Handling Truck 1 450 0.86 21 7,500 VMT 0.43 1.870 g/mile 0.004 0.00004 0.02
Contractor Haul Trucks, 25 tons 2 511 2.74 66 24,000 VMT 0.43 1.870 g/mile 0.02 0.0003 0.10
Motivator for Mine Shovels 1 3,308 0.91 22 8,000 hours 0.43 2.60 g/hp-hr 7.45 0.09 32.61
Storm Water Pond Pump 1 200 1.00 24 500 hours 1 2.60 g/hp-hr 1.15 0.01 0.29
Mine Pit Dewatering Pump 4 100 1.00 24 500 hours 1 3.70 g/hp-hr 3.26 0.04 0.82
Copper Concentrate Shipment Vehicles -- 450 29.60 1,021 169,872 VMT 0.43 1.870 g/mile 0.12 0.002 0.35
Rosemont Copper ProjectEmission Inventory Information JBR ENVIRONMENTAL CONSULTANTS, INC.
November 2011Page H275
AZRP00457

Hourly Daily AnnualTier 2/Tier 3 Emission Standards or Mobile 6
OutputUnits lb/hr tpd tpy
Load Factor
CO Emission Factor CO Emissions - Year 15Process Rates b - Year 15
Units
Table H.70 CO Emissions from Fuel Burning Mobile Engines - Year 15
Fuel Burning Mobile Engine Description a
Fleet Size
HP Rating
Molybdenum Concentrate Shipment Vehicles -- 450 7.40 15 2,145 VMT 0.43 1.870 g/mile 0.03 0.00003 0.004
Sulfuric Acid Delivery Vehicles -- 450 22.20 143 52,021 VMT 0.43 1.870 g/mile 0.09 0.0003 0.11
Lime Delivery Vehicles -- 450 14.80 52 19,072 VMT 0.43 1.870 g/mile 0.06 0.0001 0.04
SAG Mill and Ball Mill Grinding Balls Delivery Vehicles -- 450 14.80 23 5,858 VMT 0.43 1.870 g/mile 0.06 0.00005 0.01
Diesel Fuel Delivery Vehicles -- 500 14.80 47 17,136 VMT 0.43 1.870 g/mile 0.06 0.0001 0.04
Copper Cathode Shipment Vehicles -- 450 14.80 42 4,997 VMT 0.43 1.870 g/mile 0.06 0.00009 0.01
Ammonium Nitrate Delivery Vehicles -- 450 7.40 25 6,384 VMT 0.43 1.870 g/mile 0.03 0.00005 0.01
Miscellaneous Consumables Delivery Vehicles -- 450 7.40 48 12,486 VMT 0.43 1.870 g/mile 0.03 0.0001 0.03
Miscellaneous Fuels and Lubricants Delivery Vehicles -- 450 7.40 7 1,110 VMT 0.43 1.870 g/mile 0.03 0.00002 0.002
Pickup Trucks (gasoline) 20 350 1.37 33 12,000 VMT 0.54 15.51 g/mile 0.94 0.01 4.10
Crew Van (gasoline) 3 350 0.91 22 8,000 VMT 0.54 15.51 g/mile 0.09 0.001 0.41
Lot Pick-Up Trucks (gasoline) 20 250 0.34 8 3,000 VMT 0.54 15.51 g/mile 0.23 0.003 1.03
150.68 1.81 497.25
80.55 0.96 329.14
231.23 2.77 826.39
a Fuel burning mobile engines are diesel fuel fired unless otherwise noted.
b Except for the shipment and delivery vehicles, the process rates are for a single mobile engine. The process rates for the shipment and delivery vehicles are representative of the entire fleet.
Total Emissions from Haul Truck Engines:
Total Emissions from Other Mobile Engines:
Total Emissions from All Mobile Engines:
Rosemont Copper ProjectEmission Inventory Information JBR ENVIRONMENTAL CONSULTANTS, INC.
November 2011Page H276
AZRP00458
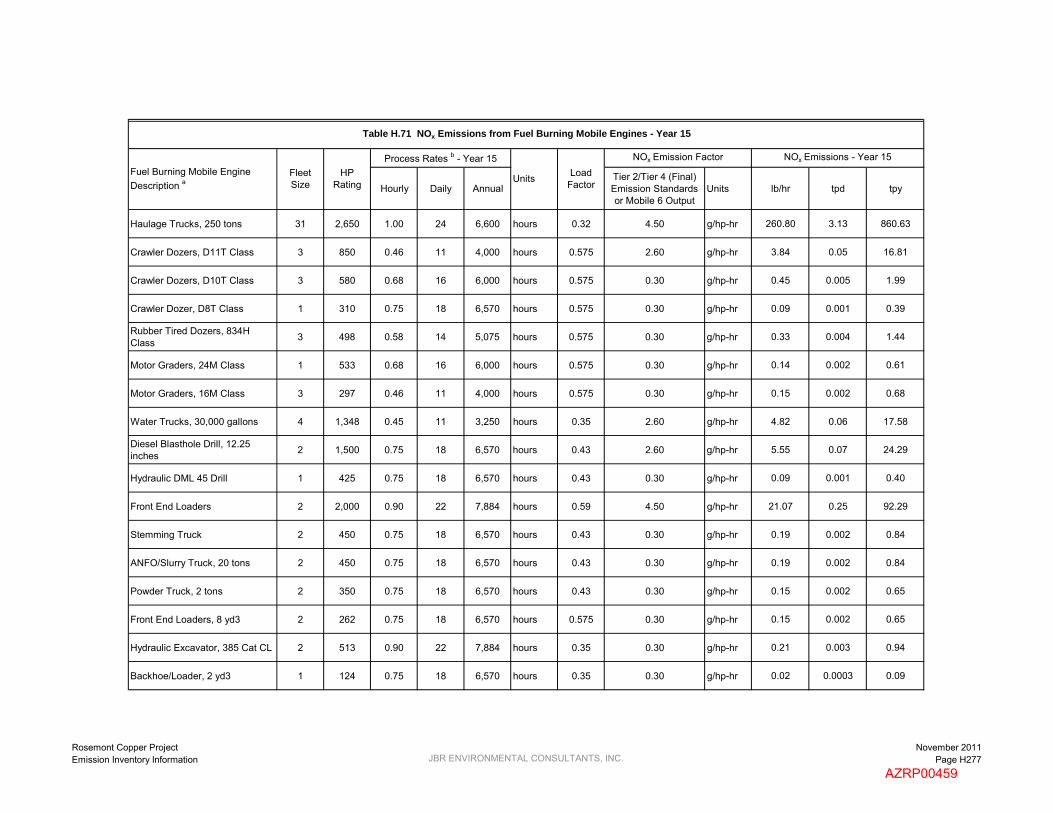
Hourly Daily AnnualTier 2/Tier 4 (Final) Emission Standards or Mobile 6 Output
Units lb/hr tpd tpy
Haulage Trucks, 250 tons 31 2,650 1.00 24 6,600 hours 0.32 4.50 g/hp-hr 260.80 3.13 860.63
Crawler Dozers, D11T Class 3 850 0.46 11 4,000 hours 0.575 2.60 g/hp-hr 3.84 0.05 16.81
Crawler Dozers, D10T Class 3 580 0.68 16 6,000 hours 0.575 0.30 g/hp-hr 0.45 0.005 1.99
Crawler Dozer, D8T Class 1 310 0.75 18 6,570 hours 0.575 0.30 g/hp-hr 0.09 0.001 0.39
Rubber Tired Dozers, 834H Class 3 498 0.58 14 5,075 hours 0.575 0.30 g/hp-hr 0.33 0.004 1.44
Motor Graders, 24M Class 1 533 0.68 16 6,000 hours 0.575 0.30 g/hp-hr 0.14 0.002 0.61
Motor Graders, 16M Class 3 297 0.46 11 4,000 hours 0.575 0.30 g/hp-hr 0.15 0.002 0.68
Water Trucks, 30,000 gallons 4 1,348 0.45 11 3,250 hours 0.35 2.60 g/hp-hr 4.82 0.06 17.58
Diesel Blasthole Drill, 12.25 inches 2 1,500 0.75 18 6,570 hours 0.43 2.60 g/hp-hr 5.55 0.07 24.29
Hydraulic DML 45 Drill 1 425 0.75 18 6,570 hours 0.43 0.30 g/hp-hr 0.09 0.001 0.40
Front End Loaders 2 2,000 0.90 22 7,884 hours 0.59 4.50 g/hp-hr 21.07 0.25 92.29
Stemming Truck 2 450 0.75 18 6,570 hours 0.43 0.30 g/hp-hr 0.19 0.002 0.84
ANFO/Slurry Truck, 20 tons 2 450 0.75 18 6,570 hours 0.43 0.30 g/hp-hr 0.19 0.002 0.84
Powder Truck, 2 tons 2 350 0.75 18 6,570 hours 0.43 0.30 g/hp-hr 0.15 0.002 0.65
Front End Loaders, 8 yd3 2 262 0.75 18 6,570 hours 0.575 0.30 g/hp-hr 0.15 0.002 0.65
Hydraulic Excavator, 385 Cat CL 2 513 0.90 22 7,884 hours 0.35 0.30 g/hp-hr 0.21 0.003 0.94
Backhoe/Loader, 2 yd3 1 124 0.75 18 6,570 hours 0.35 0.30 g/hp-hr 0.02 0.0003 0.09
Load Factor
NOx Emission Factor NOx Emissions - Year 15Process Rates b - Year 15
Units
Table H.71 NOx Emissions from Fuel Burning Mobile Engines - Year 15
Fuel Burning Mobile Engine Description a
Fleet Size
HP Rating
Rosemont Copper ProjectEmission Inventory Information JBR ENVIRONMENTAL CONSULTANTS, INC.
November 2011Page H277
AZRP00459

Hourly Daily AnnualTier 2/Tier 4 (Final) Emission Standards or Mobile 6 Output
Units lb/hr tpd tpyLoad
Factor
NOx Emission Factor NOx Emissions - Year 15Process Rates b - Year 15
Units
Table H.71 NOx Emissions from Fuel Burning Mobile Engines - Year 15
Fuel Burning Mobile Engine Description a
Fleet Size
HP Rating
All-Terrain Crane, 75 tons 1 230 0.75 18 6,570 hours 0.43 0.30 g/hp-hr 0.05 0.0006 0.21
Transporter with Tractor, 200 tons 1 1,350 0.75 18 6,570 hours 0.59 2.60 g/hp-hr 3.42 0.04 15.00
Fuel/Lube Trucks, 6,000 gallons 2 703 0.75 18 6,570 hours 0.35 0.30 g/hp-hr 0.24 0.003 1.07
Mechanic Field Service Trucks 5 370 1.71 41 15,000 VMT 0.43 7.394 g/mile 0.14 0.002 0.61
Tire Handler 1 90 0.11 3 1,000 VMT 0.43 7.394 g/mile 0.002 0.00002 0.008
Shop Forklift, 12,000 lbs 1 90 0.75 18 6,570 hours 0.59 0.30 g/hp-hr 0.03 0.0003 0.12
Integrated Tool Carrier, 140 hp 1 138 0.75 18 6,570 hours 0.59 0.30 g/hp-hr 0.04 0.0005 0.18
Light Plant, 6 kW 15 35 0.40 10 3,504 hours 0.43 3.30 g/hp-hr 0.66 0.008 2.88
Primary Crushing Mobile Crane - 400 tons 1 320 0.75 18 6,570 hours 0.43 0.30 g/hp-hr 0.07 0.0008 0.30
Copper Concentrate Area Front End Loader - Cat 930 1 160 0.75 18 6,570 hours 0.59 0.30 g/hp-hr 0.05 0.0006 0.21
Molybdenum Packaging Forklift, 7,000 lbs 1 93 0.75 18 6,570 hours 0.59 0.30 g/hp-hr 0.03 0.0003 0.12
Copper Cathode Forklift 1 93 0.75 18 6,570 hours 0.59 0.30 g/hp-hr 0.03 0.0003 0.12
Boom Trucks 10 tons, 45 foot boom 1 200 0.75 18 6,570 hours 0.21 0.30 g/hp-hr 0.02 0.0003 0.09
Boom Trucks 15 tons, 60 foot boom 1 210 0.75 18 6,570 hours 0.21 0.30 g/hp-hr 0.02 0.0003 0.10
Front End Loader, 6 yd3 1 349 0.75 18 6,570 hours 0.35 0.30 g/hp-hr 0.06 0.0007 0.27
Front End Loader, 5 yd3 1 149 0.75 18 6,570 hours 0.25 0.30 g/hp-hr 0.02 0.0002 0.08
Bob Cats, 2,400 lbs 2 82 0.75 18 6,570 hours 0.59 0.30 g/hp-hr 0.05 0.0006 0.21
Rosemont Copper ProjectEmission Inventory Information JBR ENVIRONMENTAL CONSULTANTS, INC.
November 2011Page H278
AZRP00460

Hourly Daily AnnualTier 2/Tier 4 (Final) Emission Standards or Mobile 6 Output
Units lb/hr tpd tpyLoad
Factor
NOx Emission Factor NOx Emissions - Year 15Process Rates b - Year 15
Units
Table H.71 NOx Emissions from Fuel Burning Mobile Engines - Year 15
Fuel Burning Mobile Engine Description a
Fleet Size
HP Rating
Fork Lift, 2,000 lbs 1 50 0.75 18 6,570 hours 0.59 3.30 g/hp-hr 0.16 0.002 0.71
Fork Lift, 5,000 lbs 1 63 0.75 18 6,570 hours 0.59 3.30 g/hp-hr 0.20 0.002 0.89
Fork Lift, 3,000 lbs 2 50 0.75 18 6,570 hours 0.59 3.30 g/hp-hr 0.32 0.004 1.41
Flat Bed Trucks, 10 tons 2 350 0.75 18 6,570 hours 0.43 0.30 g/hp-hr 0.15 0.002 0.65
Dump Truck, 10 tons 1 250 0.34 8 3,000 VMT 0.43 7.394 g/mile 0.006 0.00007 0.02
Mobile Hydraulic Crane, 60 tons 1 267 0.75 18 6,570 hours 0.43 0.30 g/hp-hr 0.06 0.0007 0.25
Truck Shop Bridge Crane, 60 tons 1 75 0.75 18 6,570 hours 0.43 0.30 g/hp-hr 0.02 0.0002 0.07
Truck Shop Bridge Crane, 25 tons 1 24 0.75 18 6,570 hours 0.43 5.00 g/hp-hr 0.09 0.001 0.38
CS683 Soil Compactor / Roller 2 173 0.75 18 6,570 hours 0.4 0.30 g/hp-hr 0.07 0.0008 0.30
246C Skid Steer Loader 2 73 0.75 18 6,570 hours 0.3 3.30 g/hp-hr 0.24 0.003 1.05
RH200/340 O & K Shovel / Hitachi EX5500 1 2,520 0.75 18 6,570 hours 0.59 2.60 g/hp-hr 6.39 0.08 28.00
Off-Road Tire Handling Truck 1 450 0.86 21 7,500 VMT 0.43 7.394 g/mile 0.01 0.0002 0.06
Contractor Haul Trucks, 25 tons 2 511 2.74 66 24,000 VMT 0.43 7.394 g/mile 0.09 0.001 0.39
Motivator for Mine Shovels 1 3,308 0.91 22 8,000 hours 0.43 0.50 g/hp-hr 1.43 0.02 6.27
Storm Water Pond Pump 1 200 1.00 24 500 hours 1 0.30 g/hp-hr 0.13 0.002 0.03
Mine Pit Dewatering Pump 4 100 1.00 24 500 hours 1 0.30 g/hp-hr 0.26 0.003 0.07
Copper Concentrate Shipment Vehicles -- 450 29.60 1,021 169,872 VMT 0.43 7.394 g/mile 0.48 0.008 1.38
Rosemont Copper ProjectEmission Inventory Information JBR ENVIRONMENTAL CONSULTANTS, INC.
November 2011Page H279
AZRP00461

Hourly Daily AnnualTier 2/Tier 4 (Final) Emission Standards or Mobile 6 Output
Units lb/hr tpd tpyLoad
Factor
NOx Emission Factor NOx Emissions - Year 15Process Rates b - Year 15
Units
Table H.71 NOx Emissions from Fuel Burning Mobile Engines - Year 15
Fuel Burning Mobile Engine Description a
Fleet Size
HP Rating
Molybdenum Concentrate Shipment Vehicles -- 450 7.40 15 2,145 VMT 0.43 7.394 g/mile 0.12 0.0001 0.02
Sulfuric Acid Delivery Vehicles -- 450 22.20 143 52,021 VMT 0.43 7.394 g/mile 0.36 0.001 0.42
Lime Delivery Vehicles -- 450 14.80 52 19,072 VMT 0.43 7.394 g/mile 0.24 0.0004 0.16
SAG Mill and Ball Mill Grinding Balls Delivery Vehicles -- 450 14.80 23 5,858 VMT 0.43 7.394 g/mile 0.24 0.0002 0.05
Diesel Fuel Delivery Vehicles -- 500 14.80 47 17,136 VMT 0.43 7.394 g/mile 0.24 0.0004 0.14
Copper Cathode Shipment Vehicles -- 450 14.80 42 4,997 VMT 0.43 7.394 g/mile 0.24 0.0003 0.04
Ammonium Nitrate Delivery Vehicles -- 450 7.40 25 6,384 VMT 0.43 7.394 g/mile 0.12 0.0002 0.05
Miscellaneous Consumables Delivery Vehicles -- 450 7.40 48 12,486 VMT 0.43 7.394 g/mile 0.12 0.0004 0.10
Miscellaneous Fuels and Lubricants Delivery Vehicles -- 450 7.40 7 1,110 VMT 0.43 7.394 g/mile 0.12 0.00006 0.009
Pickup Trucks (gasoline) 20 350 1.37 33 12,000 VMT 0.54 1.145 g/mile 0.07 0.0008 0.30
Crew Van (gasoline) 3 350 0.91 22 8,000 VMT 0.54 1.145 g/mile 0.007 0.00008 0.03
Lot Pick-Up Trucks (gasoline) 20 250 0.34 8 3,000 VMT 0.54 1.145 g/mile 0.02 0.0002 0.08
260.80 3.13 860.63
54.38 0.64 225.37
315.18 3.77 1,086.00
a Fuel burning mobile engines are diesel fuel fired unless otherwise noted.
b Except for the shipment and delivery vehicles, the process rates are for a single mobile engine. The process rates for the shipment and delivery vehicles are representative of the entire fleet.
Total Emissions from Haul Truck Engines:
Total Emissions from Other Mobile Engines:
Total Emissions from All Mobile Engines:
Rosemont Copper ProjectEmission Inventory Information JBR ENVIRONMENTAL CONSULTANTS, INC.
November 2011Page H280
AZRP00462

Hourly Daily Annual 100% Sulfur Conversion - Year 15 Units lb/hr tpd tpy
Haulage Trucks, 250 tons 31 2,650 1.00 24 6,600 hours 0.32 0.002 g/hp-hr 0.29 0.004 0.96
Crawler Dozers, D11T Class 3 850 0.46 11 4,000 hours 0.575 0.003 g/hp-hr 0.007 0.00008 0.03
Crawler Dozers, D10T Class 3 580 0.68 16 6,000 hours 0.575 0.002 g/hp-hr 0.005 0.00006 0.02
Crawler Dozer, D8T Class 1 310 0.75 18 6,570 hours 0.575 0.002 g/hp-hr 0.0008 0.00001 0.004
Rubber Tired Dozers, 834H Class 3 498 0.58 14 5,075 hours 0.575 0.002 g/hp-hr 0.004 0.00005 0.02
Motor Graders, 24M Class 1 533 0.68 16 6,000 hours 0.575 0.002 g/hp-hr 0.001 0.00002 0.006
Motor Graders, 16M Class 3 297 0.46 11 4,000 hours 0.575 0.003 g/hp-hr 0.002 0.00003 0.01
Water Trucks, 30,000 gallons 4 1,348 0.45 11 3,250 hours 0.35 0.003 g/hp-hr 0.02 0.0002 0.06
Diesel Blasthole Drill, 12.25 inches 2 1,500 0.75 18 6,570 hours 0.43 0.002 g/hp-hr 0.008 0.0001 0.04
Hydraulic DML 45 Drill 1 425 0.75 18 6,570 hours 0.43 0.002 g/hp-hr 0.001 0.00001 0.005
Front End Loaders 2 2,000 0.90 22 7,884 hours 0.59 0.001 g/hp-hr 0.01 0.0001 0.05
Stemming Truck 2 450 0.75 18 6,570 hours 0.43 0.002 g/hp-hr 0.002 0.00003 0.01
ANFO/Slurry Truck, 20 tons 2 450 0.75 18 6,570 hours 0.43 0.002 g/hp-hr 0.002 0.00003 0.01
Powder Truck, 2 tons 2 350 0.75 18 6,570 hours 0.43 0.002 g/hp-hr 0.002 0.00002 0.008
Front End Loaders, 8 yd3 2 262 0.75 18 6,570 hours 0.575 0.002 g/hp-hr 0.001 0.00002 0.006
Hydraulic Excavator, 385 Cat CL 2 513 0.90 22 7,884 hours 0.35 0.001 g/hp-hr 0.003 0.00003 0.01
Backhoe/Loader, 2 yd3 1 124 0.75 18 6,570 hours 0.35 0.002 g/hp-hr 0.0003 0.000004 0.001
SO2 Emissions - Year 15
Units Load Factor
SO2 Emission Factor
Table H.72 SO2 Emissions from Fuel Burning Mobile Engines - Year 15
Fuel Burning Mobile Engine Description a
Fleet Size
HP Rating
Process Rates b - Year 15
Rosemont Copper ProjectEmission Inventory Information JBR ENVIRONMENTAL CONSULTANTS, INC.
November 2011Page H281
AZRP00463

Hourly Daily Annual 100% Sulfur Conversion - Year 15 Units lb/hr tpd tpy
SO2 Emissions - Year 15
Units Load Factor
SO2 Emission Factor
Table H.72 SO2 Emissions from Fuel Burning Mobile Engines - Year 15
Fuel Burning Mobile Engine Description a
Fleet Size
HP Rating
Process Rates b - Year 15
All-Terrain Crane, 75 tons 1 230 0.75 18 6,570 hours 0.43 0.002 g/hp-hr 0.0006 0.000007 0.003
Transporter with Tractor, 200 tons 1 1,350 0.75 18 6,570 hours 0.59 0.002 g/hp-hr 0.004 0.00004 0.02
Fuel/Lube Trucks, 6,000 gallons 2 703 0.75 18 6,570 hours 0.35 0.002 g/hp-hr 0.004 0.00005 0.02
Mechanic Field Service Trucks 5 370 0.75 18 6,570 hours 0.43 0.002 g/hp-hr 0.005 0.00006 0.02
Tire Handler 1 90 0.75 18 6,570 hours 0.43 0.002 g/hp-hr 0.0002 0.000003 0.001
Shop Forklift, 12,000 lbs 1 90 0.75 18 6,570 hours 0.59 0.002 g/hp-hr 0.0002 0.000003 0.001
Integrated Tool Carrier, 140 hp 1 138 0.75 18 6,570 hours 0.59 0.002 g/hp-hr 0.0004 0.000004 0.002
Light Plant, 6 kW 15 35 0.40 10 3,504 hours 0.43 0.003 g/hp-hr 0.001 0.00002 0.006
Primary Crushing Mobile Crane - 400 tons 1 320 0.75 18 6,570 hours 0.43 0.002 g/hp-hr 0.0009 0.00001 0.004
Copper Concentrate Area Front End Loader - Cat 930 1 160 0.75 18 6,570 hours 0.59 0.002 g/hp-hr 0.0004 0.000005 0.002
Molybdenum Packaging Forklift, 7,000 lbs 1 93 0.75 18 6,570 hours 0.59 0.002 g/hp-hr 0.0002 0.000003 0.001
Copper Cathode Forklift 1 93 0.75 18 6,570 hours 0.59 0.002 g/hp-hr 0.0002 0.000003 0.001
Boom Trucks 10 tons, 45 foot boom 1 200 0.75 18 6,570 hours 0.21 0.002 g/hp-hr 0.0005 0.000006 0.002
Boom Trucks 15 tons, 60 foot boom 1 210 0.75 18 6,570 hours 0.21 0.002 g/hp-hr 0.0006 0.000007 0.002
Front End Loader, 6 yd3 1 349 0.75 18 6,570 hours 0.35 0.002 g/hp-hr 0.0009 0.00001 0.004
Front End Loader, 5 yd3 1 149 0.75 18 6,570 hours 0.25 0.002 g/hp-hr 0.0004 0.000005 0.002
Bob Cats, 2,400 lbs 2 82 0.75 18 6,570 hours 0.59 0.002 g/hp-hr 0.0004 0.000005 0.002
Rosemont Copper ProjectEmission Inventory Information JBR ENVIRONMENTAL CONSULTANTS, INC.
November 2011Page H282
AZRP00464
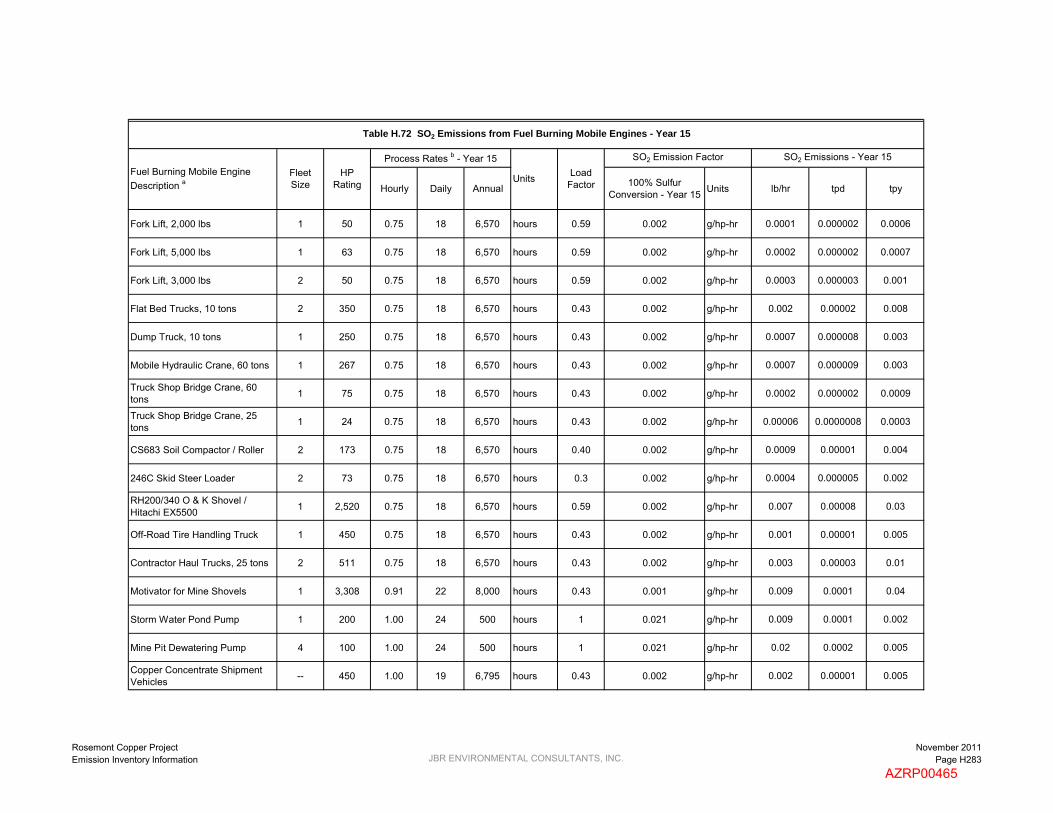
Hourly Daily Annual 100% Sulfur Conversion - Year 15 Units lb/hr tpd tpy
SO2 Emissions - Year 15
Units Load Factor
SO2 Emission Factor
Table H.72 SO2 Emissions from Fuel Burning Mobile Engines - Year 15
Fuel Burning Mobile Engine Description a
Fleet Size
HP Rating
Process Rates b - Year 15
Fork Lift, 2,000 lbs 1 50 0.75 18 6,570 hours 0.59 0.002 g/hp-hr 0.0001 0.000002 0.0006
Fork Lift, 5,000 lbs 1 63 0.75 18 6,570 hours 0.59 0.002 g/hp-hr 0.0002 0.000002 0.0007
Fork Lift, 3,000 lbs 2 50 0.75 18 6,570 hours 0.59 0.002 g/hp-hr 0.0003 0.000003 0.001
Flat Bed Trucks, 10 tons 2 350 0.75 18 6,570 hours 0.43 0.002 g/hp-hr 0.002 0.00002 0.008
Dump Truck, 10 tons 1 250 0.75 18 6,570 hours 0.43 0.002 g/hp-hr 0.0007 0.000008 0.003
Mobile Hydraulic Crane, 60 tons 1 267 0.75 18 6,570 hours 0.43 0.002 g/hp-hr 0.0007 0.000009 0.003
Truck Shop Bridge Crane, 60 tons 1 75 0.75 18 6,570 hours 0.43 0.002 g/hp-hr 0.0002 0.000002 0.0009
Truck Shop Bridge Crane, 25 tons 1 24 0.75 18 6,570 hours 0.43 0.002 g/hp-hr 0.00006 0.0000008 0.0003
CS683 Soil Compactor / Roller 2 173 0.75 18 6,570 hours 0.40 0.002 g/hp-hr 0.0009 0.00001 0.004
246C Skid Steer Loader 2 73 0.75 18 6,570 hours 0.3 0.002 g/hp-hr 0.0004 0.000005 0.002
RH200/340 O & K Shovel / Hitachi EX5500 1 2,520 0.75 18 6,570 hours 0.59 0.002 g/hp-hr 0.007 0.00008 0.03
Off-Road Tire Handling Truck 1 450 0.75 18 6,570 hours 0.43 0.002 g/hp-hr 0.001 0.00001 0.005
Contractor Haul Trucks, 25 tons 2 511 0.75 18 6,570 hours 0.43 0.002 g/hp-hr 0.003 0.00003 0.01
Motivator for Mine Shovels 1 3,308 0.91 22 8,000 hours 0.43 0.001 g/hp-hr 0.009 0.0001 0.04
Storm Water Pond Pump 1 200 1.00 24 500 hours 1 0.021 g/hp-hr 0.009 0.0001 0.002
Mine Pit Dewatering Pump 4 100 1.00 24 500 hours 1 0.021 g/hp-hr 0.02 0.0002 0.005
Copper Concentrate Shipment Vehicles -- 450 1.00 19 6,795 hours 0.43 0.002 g/hp-hr 0.002 0.00001 0.005
Rosemont Copper ProjectEmission Inventory Information JBR ENVIRONMENTAL CONSULTANTS, INC.
November 2011Page H283
AZRP00465

Hourly Daily Annual 100% Sulfur Conversion - Year 15 Units lb/hr tpd tpy
SO2 Emissions - Year 15
Units Load Factor
SO2 Emission Factor
Table H.72 SO2 Emissions from Fuel Burning Mobile Engines - Year 15
Fuel Burning Mobile Engine Description a
Fleet Size
HP Rating
Process Rates b - Year 15
Molybdenum Concentrate Shipment Vehicles -- 450 1.00 1 86 hours 0.43 0.124 g/hp-hr 0.12 0.00006 0.005
Sulfuric Acid Delivery Vehicles -- 450 1.00 6 2,081 hours 0.43 0.005 g/hp-hr 0.005 0.00001 0.005
Lime Delivery Vehicles -- 450 1.00 2 763 hours 0.43 0.014 g/hp-hr 0.01 0.00001 0.005
SAG Mill and Ball Mill Grinding Balls Delivery Vehicles -- 450 1.00 1 234 hours 0.43 0.045 g/hp-hr 0.05 0.00002 0.005
Diesel Fuel Delivery Vehicles -- 500 1.00 2 685 hours 0.43 0.016 g/hp-hr 0.02 0.00002 0.006
Copper Cathode Shipment Vehicles -- 450 1.00 1 200 hours 0.43 0.053 g/hp-hr 0.05 0.00003 0.005
Ammonium Nitrate Delivery Vehicles -- 450 1.00 1 255 hours 0.43 0.042 g/hp-hr 0.04 0.00002 0.005
Miscellaneous Consumables Delivery Vehicles -- 450 1.00 1 499 hours 0.43 0.021 g/hp-hr 0.02 0.00001 0.005
Miscellaneous Fuels and Lubricants Delivery Vehicles -- 450 1.00 1 44 hours 0.43 0.240 g/hp-hr 0.24 0.0001 0.005
Pickup Trucks (gasoline) 20 350 0.25 6 2,190 hours 0.54 0.017 g/hp-hr 0.003 0.00004 0.01
Crew Van (gasoline) 3 350 0.25 6 2,190 hours 0.54 0.0025 g/hp-hr 0.0005 0.000006 0.002
Lot Pick-Up Trucks (gasoline) 20 250 0.25 6 2,190 hours 0.54 0.017 g/hp-hr 0.002 0.00003 0.01
0.29 0.004 0.96
0.71 0.002 0.57
1.00 0.006 1.54
a Fuel burning mobile engines are diesel fuel fired unless otherwise noted.
b Except for the shipment and delivery vehicles, the process rates are for a single mobile engine. The process rates for the shipment and delivery vehicles are representative of the entire fleet.
Total Emissions from Haul Truck Engines:
Total Emissions from Other Mobile Engines:
Total Emissions from All Mobile Engines:
Rosemont Copper ProjectEmission Inventory Information JBR ENVIRONMENTAL CONSULTANTS, INC.
November 2011Page H284
AZRP00466
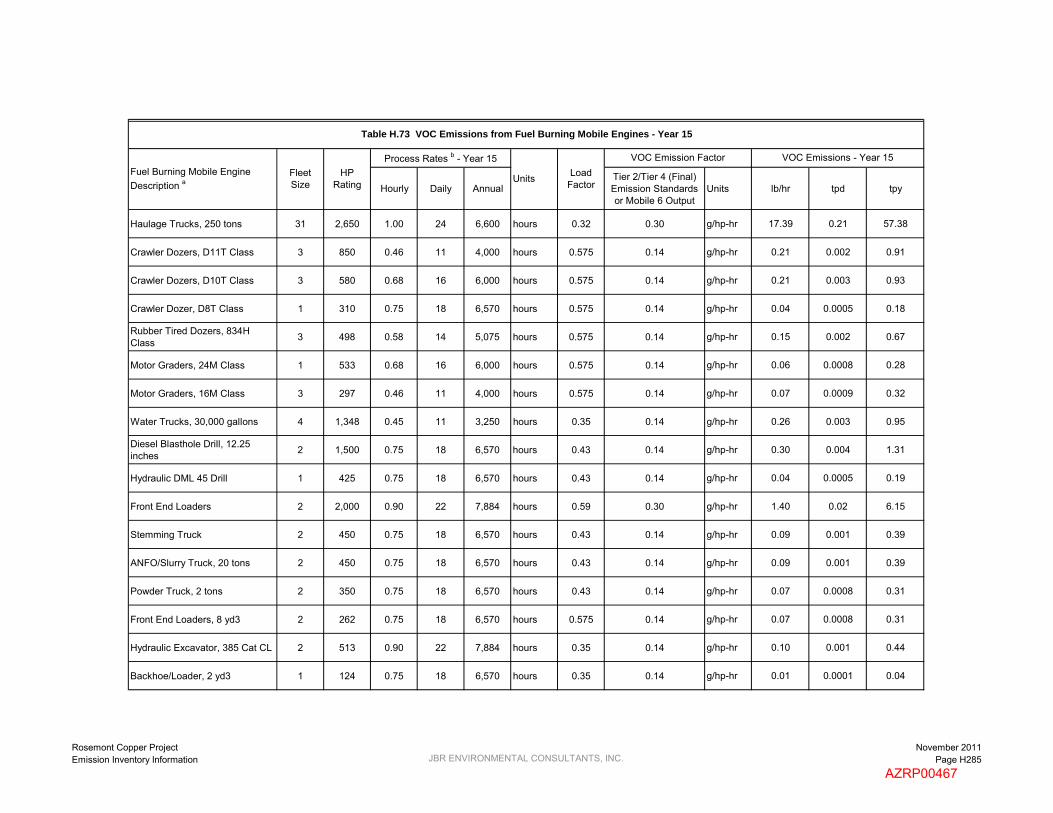
Hourly Daily AnnualTier 2/Tier 4 (Final) Emission Standards or Mobile 6 Output
Units lb/hr tpd tpy
Haulage Trucks, 250 tons 31 2,650 1.00 24 6,600 hours 0.32 0.30 g/hp-hr 17.39 0.21 57.38
Crawler Dozers, D11T Class 3 850 0.46 11 4,000 hours 0.575 0.14 g/hp-hr 0.21 0.002 0.91
Crawler Dozers, D10T Class 3 580 0.68 16 6,000 hours 0.575 0.14 g/hp-hr 0.21 0.003 0.93
Crawler Dozer, D8T Class 1 310 0.75 18 6,570 hours 0.575 0.14 g/hp-hr 0.04 0.0005 0.18
Rubber Tired Dozers, 834H Class 3 498 0.58 14 5,075 hours 0.575 0.14 g/hp-hr 0.15 0.002 0.67
Motor Graders, 24M Class 1 533 0.68 16 6,000 hours 0.575 0.14 g/hp-hr 0.06 0.0008 0.28
Motor Graders, 16M Class 3 297 0.46 11 4,000 hours 0.575 0.14 g/hp-hr 0.07 0.0009 0.32
Water Trucks, 30,000 gallons 4 1,348 0.45 11 3,250 hours 0.35 0.14 g/hp-hr 0.26 0.003 0.95
Diesel Blasthole Drill, 12.25 inches 2 1,500 0.75 18 6,570 hours 0.43 0.14 g/hp-hr 0.30 0.004 1.31
Hydraulic DML 45 Drill 1 425 0.75 18 6,570 hours 0.43 0.14 g/hp-hr 0.04 0.0005 0.19
Front End Loaders 2 2,000 0.90 22 7,884 hours 0.59 0.30 g/hp-hr 1.40 0.02 6.15
Stemming Truck 2 450 0.75 18 6,570 hours 0.43 0.14 g/hp-hr 0.09 0.001 0.39
ANFO/Slurry Truck, 20 tons 2 450 0.75 18 6,570 hours 0.43 0.14 g/hp-hr 0.09 0.001 0.39
Powder Truck, 2 tons 2 350 0.75 18 6,570 hours 0.43 0.14 g/hp-hr 0.07 0.0008 0.31
Front End Loaders, 8 yd3 2 262 0.75 18 6,570 hours 0.575 0.14 g/hp-hr 0.07 0.0008 0.31
Hydraulic Excavator, 385 Cat CL 2 513 0.90 22 7,884 hours 0.35 0.14 g/hp-hr 0.10 0.001 0.44
Backhoe/Loader, 2 yd3 1 124 0.75 18 6,570 hours 0.35 0.14 g/hp-hr 0.01 0.0001 0.04
Load Factor
VOC Emission Factor VOC Emissions - Year 15Process Rates b - Year 15
Units
Table H.73 VOC Emissions from Fuel Burning Mobile Engines - Year 15
Fuel Burning Mobile Engine Description a
Fleet Size
HP Rating
Rosemont Copper ProjectEmission Inventory Information JBR ENVIRONMENTAL CONSULTANTS, INC.
November 2011Page H285
AZRP00467
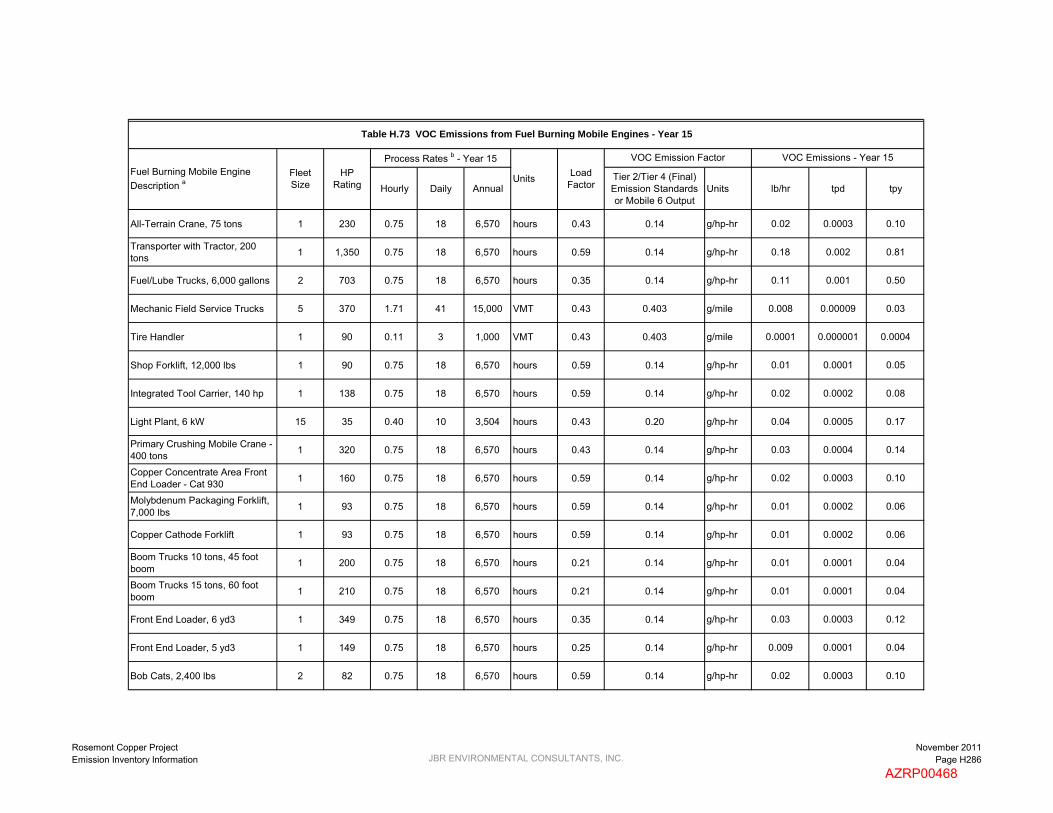
Hourly Daily AnnualTier 2/Tier 4 (Final) Emission Standards or Mobile 6 Output
Units lb/hr tpd tpyLoad
Factor
VOC Emission Factor VOC Emissions - Year 15Process Rates b - Year 15
Units
Table H.73 VOC Emissions from Fuel Burning Mobile Engines - Year 15
Fuel Burning Mobile Engine Description a
Fleet Size
HP Rating
All-Terrain Crane, 75 tons 1 230 0.75 18 6,570 hours 0.43 0.14 g/hp-hr 0.02 0.0003 0.10
Transporter with Tractor, 200 tons 1 1,350 0.75 18 6,570 hours 0.59 0.14 g/hp-hr 0.18 0.002 0.81
Fuel/Lube Trucks, 6,000 gallons 2 703 0.75 18 6,570 hours 0.35 0.14 g/hp-hr 0.11 0.001 0.50
Mechanic Field Service Trucks 5 370 1.71 41 15,000 VMT 0.43 0.403 g/mile 0.008 0.00009 0.03
Tire Handler 1 90 0.11 3 1,000 VMT 0.43 0.403 g/mile 0.0001 0.000001 0.0004
Shop Forklift, 12,000 lbs 1 90 0.75 18 6,570 hours 0.59 0.14 g/hp-hr 0.01 0.0001 0.05
Integrated Tool Carrier, 140 hp 1 138 0.75 18 6,570 hours 0.59 0.14 g/hp-hr 0.02 0.0002 0.08
Light Plant, 6 kW 15 35 0.40 10 3,504 hours 0.43 0.20 g/hp-hr 0.04 0.0005 0.17
Primary Crushing Mobile Crane - 400 tons 1 320 0.75 18 6,570 hours 0.43 0.14 g/hp-hr 0.03 0.0004 0.14
Copper Concentrate Area Front End Loader - Cat 930 1 160 0.75 18 6,570 hours 0.59 0.14 g/hp-hr 0.02 0.0003 0.10
Molybdenum Packaging Forklift, 7,000 lbs 1 93 0.75 18 6,570 hours 0.59 0.14 g/hp-hr 0.01 0.0002 0.06
Copper Cathode Forklift 1 93 0.75 18 6,570 hours 0.59 0.14 g/hp-hr 0.01 0.0002 0.06
Boom Trucks 10 tons, 45 foot boom 1 200 0.75 18 6,570 hours 0.21 0.14 g/hp-hr 0.01 0.0001 0.04
Boom Trucks 15 tons, 60 foot boom 1 210 0.75 18 6,570 hours 0.21 0.14 g/hp-hr 0.01 0.0001 0.04
Front End Loader, 6 yd3 1 349 0.75 18 6,570 hours 0.35 0.14 g/hp-hr 0.03 0.0003 0.12
Front End Loader, 5 yd3 1 149 0.75 18 6,570 hours 0.25 0.14 g/hp-hr 0.009 0.0001 0.04
Bob Cats, 2,400 lbs 2 82 0.75 18 6,570 hours 0.59 0.14 g/hp-hr 0.02 0.0003 0.10
Rosemont Copper ProjectEmission Inventory Information JBR ENVIRONMENTAL CONSULTANTS, INC.
November 2011Page H286
AZRP00468

Hourly Daily AnnualTier 2/Tier 4 (Final) Emission Standards or Mobile 6 Output
Units lb/hr tpd tpyLoad
Factor
VOC Emission Factor VOC Emissions - Year 15Process Rates b - Year 15
Units
Table H.73 VOC Emissions from Fuel Burning Mobile Engines - Year 15
Fuel Burning Mobile Engine Description a
Fleet Size
HP Rating
Fork Lift, 2,000 lbs 1 50 0.75 18 6,570 hours 0.59 0.20 g/hp-hr 0.01 0.0001 0.04
Fork Lift, 5,000 lbs 1 63 0.75 18 6,570 hours 0.59 0.20 g/hp-hr 0.01 0.0001 0.05
Fork Lift, 3,000 lbs 2 50 0.75 18 6,570 hours 0.59 0.20 g/hp-hr 0.02 0.0002 0.09
Flat Bed Trucks, 10 tons 2 350 0.75 18 6,570 hours 0.43 0.14 g/hp-hr 0.07 0.0008 0.31
Dump Truck, 10 tons 1 250 0.34 8 3,000 VMT 0.43 0.403 g/mile 0.0003 0.000004 0.001
Mobile Hydraulic Crane, 60 tons 1 267 0.75 18 6,570 hours 0.43 0.14 g/hp-hr 0.03 0.0003 0.12
Truck Shop Bridge Crane, 60 tons 1 75 0.75 18 6,570 hours 0.43 0.14 g/hp-hr 0.007 0.00009 0.03
Truck Shop Bridge Crane, 25 tons 1 24 0.75 18 6,570 hours 0.43 0.60 g/hp-hr 0.01 0.0001 0.05
CS683 Soil Compactor / Roller 2 173 0.75 18 6,570 hours 0.4 0.14 g/hp-hr 0.03 0.0004 0.14
246C Skid Steer Loader 2 73 0.75 18 6,570 hours 0.3 0.20 g/hp-hr 0.01 0.0002 0.06
RH200/340 O & K Shovel / Hitachi EX5500 1 2,520 0.75 18 6,570 hours 0.59 0.14 g/hp-hr 0.34 0.004 1.51
Off-Road Tire Handling Truck 1 450 0.86 21 7,500 VMT 0.43 0.403 g/mile 0.0008 0.000009 0.003
Contractor Haul Trucks, 25 tons 2 511 2.74 66 24,000 VMT 0.43 0.403 g/mile 0.005 0.00006 0.02
Motivator for Mine Shovels 1 3,308 0.91 22 8,000 hours 0.43 0.14 g/hp-hr 0.40 0.005 1.76
Storm Water Pond Pump 1 200 1.00 24 500 hours 1 0.14 g/hp-hr 0.06 0.0007 0.02
Mine Pit Dewatering Pump 4 100 1.00 24 500 hours 1 0.14 g/hp-hr 0.12 0.001 0.03
Copper Concentrate Shipment Vehicles -- 450 29.60 1,021 169,872 VMT 0.43 0.403 g/mile 0.03 0.0005 0.08
Rosemont Copper ProjectEmission Inventory Information JBR ENVIRONMENTAL CONSULTANTS, INC.
November 2011Page H287
AZRP00469

Hourly Daily AnnualTier 2/Tier 4 (Final) Emission Standards or Mobile 6 Output
Units lb/hr tpd tpyLoad
Factor
VOC Emission Factor VOC Emissions - Year 15Process Rates b - Year 15
Units
Table H.73 VOC Emissions from Fuel Burning Mobile Engines - Year 15
Fuel Burning Mobile Engine Description a
Fleet Size
HP Rating
Molybdenum Concentrate Shipment Vehicles -- 450 7.40 15 2,145 VMT 0.43 0.403 g/mile 0.007 0.000007 0.001
Sulfuric Acid Delivery Vehicles -- 450 22.20 143 52,021 VMT 0.43 0.403 g/mile 0.02 0.00006 0.02
Lime Delivery Vehicles -- 450 14.80 52 19,072 VMT 0.43 0.403 g/mile 0.01 0.00002 0.008
SAG Mill and Ball Mill Grinding Balls Delivery Vehicles -- 450 14.80 23 5,858 VMT 0.43 0.403 g/mile 0.01 0.00001 0.003
Diesel Fuel Delivery Vehicles -- 500 14.80 47 17,136 VMT 0.43 0.403 g/mile 0.01 0.00002 0.008
Copper Cathode Shipment Vehicles -- 450 14.80 42 4,997 VMT 0.43 0.403 g/mile 0.01 0.00002 0.002
Ammonium Nitrate Delivery Vehicles -- 450 7.40 25 6,384 VMT 0.43 0.403 g/mile 0.007 0.00001 0.003
Miscellaneous Consumables Delivery Vehicles -- 450 7.40 48 12,486 VMT 0.43 0.403 g/mile 0.007 0.00002 0.006
Miscellaneous Fuels and Lubricants Delivery Vehicles -- 450 7.40 7 1,110 VMT 0.43 0.403 g/mile 0.007 0.000003 0.0005
Pickup Trucks (gasoline) 20 350 1.37 33 12,000 VMT 0.54 1.329 g/mile 0.08 0.001 0.35
Crew Van (gasoline) 3 350 0.91 22 8,000 VMT 0.54 1.329 g/mile 0.008 0.0001 0.04
Lot Pick-Up Trucks (gasoline) 20 250 0.34 8 3,000 VMT 0.54 1.329 g/mile 0.02 0.0002 0.09
17.39 0.21 57.38
5.11 0.06 21.02
22.50 0.27 78.40
a Fuel burning mobile engines are diesel fuel fired unless otherwise noted.
b Except for the shipment and delivery vehicles, the process rates are for a single mobile engine. The process rates for the shipment and delivery vehicles are representative of the entire fleet.
Total Emissions from Haul Truck Engines:
Total Emissions from Other Mobile Engines:
Total Emissions from All Mobile Engines:
Rosemont Copper ProjectEmission Inventory Information JBR ENVIRONMENTAL CONSULTANTS, INC.
November 2011Page H288
AZRP00470

Hourly Daily Annual 99% Conversion(g/hp-hr) Units lb/hr tpd tpy
Haulage Trucks, 250 tons 31 2,650 1.00 24 6,600 hours 0.32 497 g/hp-hr 28,820.00 345.84 95,105.99
Crawler Dozers, D11T Class 3 850 0.46 11 4,000 hours 0.575 497 g/hp-hr 734.01 8.81 3,214.95
Crawler Dozers, D10T Class 3 580 0.68 16 6,000 hours 0.575 497 g/hp-hr 751.28 9.02 3,290.60
Crawler Dozer, D8T Class 1 310 0.75 18 6,570 hours 0.575 497 g/hp-hr 146.56 1.76 641.95
Rubber Tired Dozers, 834H Class 3 498 0.58 14 5,075 hours 0.575 497 g/hp-hr 545.62 6.55 2,389.80
Motor Graders, 24M Class 1 533 0.68 16 6,000 hours 0.575 497 g/hp-hr 230.13 2.76 1,007.98
Motor Graders, 16M Class 3 297 0.46 11 4,000 hours 0.575 497 g/hp-hr 256.47 3.08 1,123.34
Water Trucks, 30,000 gallons 4 1,348 0.45 11 3,250 hours 0.35 497 g/hp-hr 921.12 11.05 3,362.08
Diesel Blasthole Drill, 12.25 inches 2 1,500 0.75 18 6,570 hours 0.43 497 g/hp-hr 1,060.69 12.73 4,645.81
Hydraulic DML 45 Drill 1 425 0.75 18 6,570 hours 0.43 497 g/hp-hr 150.26 1.80 658.16
Front End Loaders 2 2,000 0.90 22 7,884 hours 0.59 497 g/hp-hr 2,328.58 27.94 10,199.17
Stemming Truck 2 450 0.75 18 6,570 hours 0.43 497 g/hp-hr 318.21 3.82 1,393.74
ANFO/Slurry Truck, 20 tons 2 450 0.75 18 6,570 hours 0.43 497 g/hp-hr 318.21 3.82 1,393.74
Powder Truck, 2 tons 2 350 0.75 18 6,570 hours 0.43 497 g/hp-hr 247.49 2.97 1,084.02
Front End Loaders, 8 yd3 2 262 0.75 18 6,570 hours 0.575 497 g/hp-hr 247.74 2.97 1,085.10
Hydraulic Excavator, 385 Cat CL 2 513 0.90 22 7,884 hours 0.35 497 g/hp-hr 354.32 4.25 1,551.92
Backhoe/Loader, 2 yd3 1 124 0.75 18 6,570 hours 0.35 497 g/hp-hr 35.69 0.43 156.30
Load Factor
CO2 Emission Factor CO2 Emissions - Year 15Process Rates b - Year 15
Units
Table H.74 CO2 Emissions from Fuel Burning Mobile Engines - Year 15
Fuel Burning Mobile Engine Description a
Fleet Size
HP Rating
Rosemont Copper ProjectEmission Inventory Information JBR ENVIRONMENTAL CONSULTANTS, INC.
November 2011Page H289
AZRP00471

Hourly Daily Annual 99% Conversion(g/hp-hr) Units lb/hr tpd tpy
Load Factor
CO2 Emission Factor CO2 Emissions - Year 15Process Rates b - Year 15
Units
Table H.74 CO2 Emissions from Fuel Burning Mobile Engines - Year 15
Fuel Burning Mobile Engine Description a
Fleet Size
HP Rating
All-Terrain Crane, 75 tons 1 230 0.75 18 6,570 hours 0.43 497 g/hp-hr 81.32 0.98 356.18
Transporter with Tractor, 200 tons 1 1,350 0.75 18 6,570 hours 0.59 497 g/hp-hr 654.91 7.86 2,868.52
Fuel/Lube Trucks, 6,000 gallons 2 703 0.75 18 6,570 hours 0.35 497 g/hp-hr 404.62 4.86 1,772.25
Mechanic Field Service Trucks 5 370 0.75 18 6,570 hours 0.43 497 g/hp-hr 654.09 7.85 2,864.92
Tire Handler 1 90 0.75 18 6,570 hours 0.43 497 g/hp-hr 31.82 0.38 139.37
Shop Forklift, 12,000 lbs 1 90 0.75 18 6,570 hours 0.59 497 g/hp-hr 43.66 0.52 191.23
Integrated Tool Carrier, 140 hp 1 138 0.75 18 6,570 hours 0.59 497 g/hp-hr 66.95 0.80 293.23
Light Plant, 6 kW 15 35 0.40 10 3,504 hours 0.43 497 g/hp-hr 99.00 1.19 433.61
Primary Crushing Mobile Crane - 400 tons 1 320 0.75 18 6,570 hours 0.43 497 g/hp-hr 113.14 1.36 495.55
Copper Concentrate Area Front End Loader - Cat 930 1 160 0.75 18 6,570 hours 0.59 497 g/hp-hr 77.62 0.93 339.97
Molybdenum Packaging Forklift, 7,000 lbs 1 93 0.75 18 6,570 hours 0.59 497 g/hp-hr 44.87 0.54 196.55
Copper Cathode Forklift 1 93 0.75 18 6,570 hours 0.59 497 g/hp-hr 44.87 0.54 196.55
Boom Trucks 10 tons, 45 foot boom 1 200 0.75 18 6,570 hours 0.21 497 g/hp-hr 34.53 0.41 151.26
Boom Trucks 15 tons, 60 foot boom 1 210 0.75 18 6,570 hours 0.21 497 g/hp-hr 36.26 0.44 158.82
Front End Loader, 6 yd3 1 349 0.75 18 6,570 hours 0.35 497 g/hp-hr 100.44 1.21 439.91
Front End Loader, 5 yd3 1 149 0.75 18 6,570 hours 0.25 497 g/hp-hr 30.63 0.37 134.15
Bob Cats, 2,400 lbs 2 82 0.75 18 6,570 hours 0.59 497 g/hp-hr 79.56 0.95 348.47
Rosemont Copper ProjectEmission Inventory Information JBR ENVIRONMENTAL CONSULTANTS, INC.
November 2011Page H290
AZRP00472

Hourly Daily Annual 99% Conversion(g/hp-hr) Units lb/hr tpd tpy
Load Factor
CO2 Emission Factor CO2 Emissions - Year 15Process Rates b - Year 15
Units
Table H.74 CO2 Emissions from Fuel Burning Mobile Engines - Year 15
Fuel Burning Mobile Engine Description a
Fleet Size
HP Rating
Fork Lift, 2,000 lbs 1 50 0.75 18 6,570 hours 0.59 497 g/hp-hr 24.26 0.29 106.24
Fork Lift, 5,000 lbs 1 63 0.75 18 6,570 hours 0.59 497 g/hp-hr 30.56 0.37 133.86
Fork Lift, 3,000 lbs 2 50 0.75 18 6,570 hours 0.59 497 g/hp-hr 48.51 0.58 212.48
Flat Bed Trucks, 10 tons 2 350 0.75 18 6,570 hours 0.43 497 g/hp-hr 247.49 2.97 1,084.02
Dump Truck, 10 tons 1 250 0.75 18 6,570 hours 0.43 497 g/hp-hr 88.39 1.06 387.15
Mobile Hydraulic Crane, 60 tons 1 267 0.75 18 6,570 hours 0.43 497 g/hp-hr 94.40 1.13 413.48
Truck Shop Bridge Crane, 60 tons 1 75 0.75 18 6,570 hours 0.43 497 g/hp-hr 26.52 0.32 116.15
Truck Shop Bridge Crane, 25 tons 1 24 0.75 18 6,570 hours 0.43 497 g/hp-hr 8.52 0.10 37.32
CS683 Soil Compactor / Roller 2 173 0.75 18 6,570 hours 0.4 497 g/hp-hr 113.80 1.37 498.43
246C Skid Steer Loader 2 73 0.75 18 6,570 hours 0.3 497 g/hp-hr 36.01 0.43 157.74
RH200/340 O & K Shovel / Hitachi EX5500 1 2,520 0.75 18 6,570 hours 0.59 497 g/hp-hr 1,222.50 14.67 5,354.57
Off-Road Tire Handling Truck 1 450 0.75 18 6,570 hours 0.43 497 g/hp-hr 159.10 1.91 696.87
Contractor Haul Trucks, 25 tons 2 511 0.75 18 6,570 hours 0.43 497 g/hp-hr 361.34 4.34 1,582.67
Motivator for Mine Shovels 1 3,308 0.91 22 8,000 hours 0.43 497 g/hp-hr 1,424.15 17.09 6,237.78
Storm Water Pond Pump 1 200 1.00 24 500 hours 1 497 g/hp-hr 219.26 2.63 54.82
Mine Pit Dewatering Pump 4 100 1.00 24 500 hours 1 497 g/hp-hr 438.53 5.26 109.63
Copper Concentrate Shipment Vehicles -- 450 1.00 19 6,795 hours 0.43 497 g/hp-hr 212.14 1.97 720.72
Rosemont Copper ProjectEmission Inventory Information JBR ENVIRONMENTAL CONSULTANTS, INC.
November 2011Page H291
AZRP00473

Hourly Daily Annual 99% Conversion(g/hp-hr) Units lb/hr tpd tpy
Load Factor
CO2 Emission Factor CO2 Emissions - Year 15Process Rates b - Year 15
Units
Table H.74 CO2 Emissions from Fuel Burning Mobile Engines - Year 15
Fuel Burning Mobile Engine Description a
Fleet Size
HP Rating
Molybdenum Concentrate Shipment Vehicles -- 450 1.00 1 86 hours 0.43 497 g/hp-hr 212.14 0.11 9.10
Sulfuric Acid Delivery Vehicles -- 450 1.00 6 2,081 hours 0.43 497 g/hp-hr 212.14 0.60 220.71
Lime Delivery Vehicles -- 450 1.00 2 763 hours 0.43 497 g/hp-hr 212.14 0.22 80.92
SAG Mill and Ball Mill Grinding Balls Delivery Vehicles -- 450 1.00 1 234 hours 0.43 497 g/hp-hr 212.14 0.11 24.86
Diesel Fuel Delivery Vehicles -- 500 1.00 2 685 hours 0.43 497 g/hp-hr 235.71 0.22 80.78
Copper Cathode Shipment Vehicles -- 450 1.00 1 200 hours 0.43 497 g/hp-hr 212.14 0.11 21.20
Ammonium Nitrate Delivery Vehicles -- 450 1.00 1 255 hours 0.43 497 g/hp-hr 212.14 0.11 27.09
Miscellaneous Consumables Delivery Vehicles -- 450 1.00 1 499 hours 0.43 497 g/hp-hr 212.14 0.15 52.98
Miscellaneous Fuels and Lubricants Delivery Vehicles -- 450 1.00 1 44 hours 0.43 497 g/hp-hr 212.14 0.11 4.71
Pickup Trucks (gasoline) 20 350 0.25 6 2,190 hours 0.54 1.08 lb/hp-hr 51.03 0.61 223.51
Crew Van (gasoline) 3 350 0.25 6 2,190 hours 0.54 1.08 lb/hp-hr 51.03 0.61 223.51
Lot Pick-Up Trucks (gasoline) 20 250 0.25 6 2,190 hours 0.54 1.08 lb/hp-hr 36.45 0.44 159.65
28,820.00 345.84 95,105.99
18,071.47 194.82 67,612.16
46,891.47 540.66 162,718.15
a Fuel burning mobile engines are diesel fuel fired unless otherwise noted.
b Except for the shipment and delivery vehicles, the process rates are for a single mobile engine. The process rates for the shipment and delivery vehicles are representative of the entire fleet.
Total Emissions from Haul Truck Engines:
Total Emissions from Other Mobile Engines:
Total Emissions from All Mobile Engines:
Rosemont Copper ProjectEmission Inventory Information JBR ENVIRONMENTAL CONSULTANTS, INC.
November 2011Page H292
AZRP00474

Hourly Daily Annual 2% Sulfur Conversion - Year 15 Units lb/hr tpd tpy
Haulage Trucks, 250 tons 31 2,650 1.00 24 6,600 hours 0.32 0.00003 g/hp-hr 0.006 0.00007 0.02
Crawler Dozers, D11T Class 3 850 0.46 11 4,000 hours 0.575 0.00005 g/hp-hr 0.0001 0.000002 0.0006
Crawler Dozers, D10T Class 3 580 0.68 16 6,000 hours 0.575 0.00004 g/hp-hr 0.00009 0.000001 0.0004
Crawler Dozer, D8T Class 1 310 0.75 18 6,570 hours 0.575 0.00003 g/hp-hr 0.00002 0.0000002 0.00007
Rubber Tired Dozers, 834H Class 3 498 0.58 14 5,075 hours 0.575 0.00004 g/hp-hr 0.00008 0.000001 0.0004
Motor Graders, 24M Class 1 533 0.68 16 6,000 hours 0.575 0.00004 g/hp-hr 0.00003 0.0000003 0.0001
Motor Graders, 16M Class 3 297 0.46 11 4,000 hours 0.575 0.00005 g/hp-hr 0.00005 0.0000006 0.0002
Water Trucks, 30,000 gallons 4 1,348 0.45 11 3,250 hours 0.35 0.00007 g/hp-hr 0.0003 0.000004 0.001
Diesel Blasthole Drill, 12.25 inches 2 1,500 0.75 18 6,570 hours 0.43 0.00003 g/hp-hr 0.0002 0.000002 0.0007
Hydraulic DML 45 Drill 1 425 0.75 18 6,570 hours 0.43 0.00003 g/hp-hr 0.00002 0.0000003 0.0001
Front End Loaders 2 2,000 0.90 22 7,884 hours 0.59 0.00003 g/hp-hr 0.0002 0.000003 0.0009
Stemming Truck 2 450 0.75 18 6,570 hours 0.43 0.00003 g/hp-hr 0.00005 0.0000006 0.0002
ANFO/Slurry Truck, 20 tons 2 450 0.75 18 6,570 hours 0.43 0.00003 g/hp-hr 0.00005 0.0000006 0.0002
Powder Truck, 2 tons 2 350 0.75 18 6,570 hours 0.43 0.00003 g/hp-hr 0.00004 0.0000005 0.0002
Front End Loaders, 8 yd3 2 262 0.75 18 6,570 hours 0.575 0.00003 g/hp-hr 0.00003 0.0000003 0.0001
Hydraulic Excavator, 385 Cat CL 2 513 0.90 22 7,884 hours 0.35 0.00003 g/hp-hr 0.00005 0.0000007 0.0002
Backhoe/Loader, 2 yd3 1 124 0.75 18 6,570 hours 0.35 0.00003 g/hp-hr 0.000007 0.00000008 0.00003
SO4 Emissions - Year 15
Units Load Factor
SO4 Emission Factor
Table H.75 SO4 Emissions from Fuel Burning Mobile Engines (Diesel Engines Only) - Year 15
Fuel Burning Mobile Engine Description a
Fleet Size
HP Rating
Process Rates b - Year 15
Rosemont Copper ProjectEmission Inventory Information JBR ENVIRONMENTAL CONSULTANTS, INC.
November 2011Page H293
AZRP00475
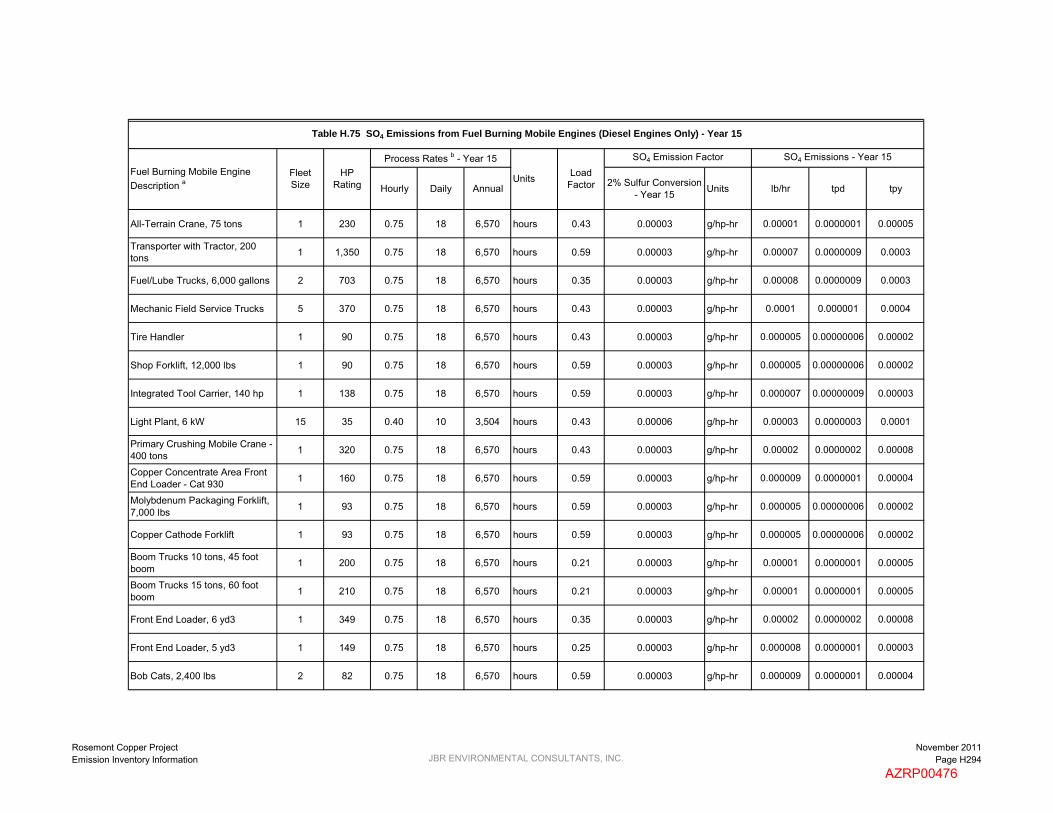
Hourly Daily Annual 2% Sulfur Conversion - Year 15 Units lb/hr tpd tpy
SO4 Emissions - Year 15
Units Load Factor
SO4 Emission Factor
Table H.75 SO4 Emissions from Fuel Burning Mobile Engines (Diesel Engines Only) - Year 15
Fuel Burning Mobile Engine Description a
Fleet Size
HP Rating
Process Rates b - Year 15
All-Terrain Crane, 75 tons 1 230 0.75 18 6,570 hours 0.43 0.00003 g/hp-hr 0.00001 0.0000001 0.00005
Transporter with Tractor, 200 tons 1 1,350 0.75 18 6,570 hours 0.59 0.00003 g/hp-hr 0.00007 0.0000009 0.0003
Fuel/Lube Trucks, 6,000 gallons 2 703 0.75 18 6,570 hours 0.35 0.00003 g/hp-hr 0.00008 0.0000009 0.0003
Mechanic Field Service Trucks 5 370 0.75 18 6,570 hours 0.43 0.00003 g/hp-hr 0.0001 0.000001 0.0004
Tire Handler 1 90 0.75 18 6,570 hours 0.43 0.00003 g/hp-hr 0.000005 0.00000006 0.00002
Shop Forklift, 12,000 lbs 1 90 0.75 18 6,570 hours 0.59 0.00003 g/hp-hr 0.000005 0.00000006 0.00002
Integrated Tool Carrier, 140 hp 1 138 0.75 18 6,570 hours 0.59 0.00003 g/hp-hr 0.000007 0.00000009 0.00003
Light Plant, 6 kW 15 35 0.40 10 3,504 hours 0.43 0.00006 g/hp-hr 0.00003 0.0000003 0.0001
Primary Crushing Mobile Crane - 400 tons 1 320 0.75 18 6,570 hours 0.43 0.00003 g/hp-hr 0.00002 0.0000002 0.00008
Copper Concentrate Area Front End Loader - Cat 930 1 160 0.75 18 6,570 hours 0.59 0.00003 g/hp-hr 0.000009 0.0000001 0.00004
Molybdenum Packaging Forklift, 7,000 lbs 1 93 0.75 18 6,570 hours 0.59 0.00003 g/hp-hr 0.000005 0.00000006 0.00002
Copper Cathode Forklift 1 93 0.75 18 6,570 hours 0.59 0.00003 g/hp-hr 0.000005 0.00000006 0.00002
Boom Trucks 10 tons, 45 foot boom 1 200 0.75 18 6,570 hours 0.21 0.00003 g/hp-hr 0.00001 0.0000001 0.00005
Boom Trucks 15 tons, 60 foot boom 1 210 0.75 18 6,570 hours 0.21 0.00003 g/hp-hr 0.00001 0.0000001 0.00005
Front End Loader, 6 yd3 1 349 0.75 18 6,570 hours 0.35 0.00003 g/hp-hr 0.00002 0.0000002 0.00008
Front End Loader, 5 yd3 1 149 0.75 18 6,570 hours 0.25 0.00003 g/hp-hr 0.000008 0.0000001 0.00003
Bob Cats, 2,400 lbs 2 82 0.75 18 6,570 hours 0.59 0.00003 g/hp-hr 0.000009 0.0000001 0.00004
Rosemont Copper ProjectEmission Inventory Information JBR ENVIRONMENTAL CONSULTANTS, INC.
November 2011Page H294
AZRP00476

Hourly Daily Annual 2% Sulfur Conversion - Year 15 Units lb/hr tpd tpy
SO4 Emissions - Year 15
Units Load Factor
SO4 Emission Factor
Table H.75 SO4 Emissions from Fuel Burning Mobile Engines (Diesel Engines Only) - Year 15
Fuel Burning Mobile Engine Description a
Fleet Size
HP Rating
Process Rates b - Year 15
Fork Lift, 2,000 lbs 1 50 0.75 18 6,570 hours 0.59 0.00003 g/hp-hr 0.000003 0.00000003 0.00001
Fork Lift, 5,000 lbs 1 63 0.75 18 6,570 hours 0.59 0.00003 g/hp-hr 0.000003 0.00000004 0.00001
Fork Lift, 3,000 lbs 2 50 0.75 18 6,570 hours 0.59 0.00003 g/hp-hr 0.000005 0.00000006 0.00002
Flat Bed Trucks, 10 tons 2 350 0.75 18 6,570 hours 0.43 0.00003 g/hp-hr 0.00004 0.0000005 0.0002
Dump Truck, 10 tons 1 250 0.75 18 6,570 hours 0.43 0.00003 g/hp-hr 0.00001 0.0000002 0.00006
Mobile Hydraulic Crane, 60 tons 1 267 0.75 18 6,570 hours 0.43 0.00003 g/hp-hr 0.00001 0.0000002 0.00006
Truck Shop Bridge Crane, 60 tons 1 75 0.75 18 6,570 hours 0.43 0.00003 g/hp-hr 0.000004 0.00000005 0.00002
Truck Shop Bridge Crane, 25 tons 1 24 0.75 18 6,570 hours 0.43 0.00003 g/hp-hr 0.000001 0.00000002 0.000006
CS683 Soil Compactor / Roller 2 173 0.75 18 6,570 hours 0.40 0.00003 g/hp-hr 0.00002 0.0000002 0.00008
246C Skid Steer Loader 2 73 0.75 18 6,570 hours 0.3 0.00003 g/hp-hr 0.000008 0.00000009 0.00003
RH200/340 O & K Shovel / Hitachi EX5500 1 2,520 0.75 18 6,570 hours 0.59 0.00003 g/hp-hr 0.0001 0.000002 0.0006
Off-Road Tire Handling Truck 1 450 0.75 18 6,570 hours 0.43 0.00003 g/hp-hr 0.00002 0.0000003 0.0001
Contractor Haul Trucks, 25 tons 2 511 0.75 18 6,570 hours 0.43 0.00003 g/hp-hr 0.00005 0.0000007 0.0002
Motivator for Mine Shovels 1 3,308 0.91 22 8,000 hours 0.43 0.00003 g/hp-hr 0.0002 0.000002 0.0008
Storm Water Pond Pump 1 200 1.00 24 500 hours 1 0.0004 g/hp-hr 0.0002 0.000002 0.00005
Mine Pit Dewatering Pump 4 100 1.00 24 500 hours 1 0.0004 g/hp-hr 0.0004 0.000005 0.00009
Copper Concentrate Shipment Vehicles -- 450 1.00 19 6,795 hours 0.43 0.00003 g/hp-hr 0.00003 0.0000003 0.0001
Rosemont Copper ProjectEmission Inventory Information JBR ENVIRONMENTAL CONSULTANTS, INC.
November 2011Page H295
AZRP00477

Hourly Daily Annual 2% Sulfur Conversion - Year 15 Units lb/hr tpd tpy
SO4 Emissions - Year 15
Units Load Factor
SO4 Emission Factor
Table H.75 SO4 Emissions from Fuel Burning Mobile Engines (Diesel Engines Only) - Year 15
Fuel Burning Mobile Engine Description a
Fleet Size
HP Rating
Process Rates b - Year 15
Molybdenum Concentrate Shipment Vehicles -- 450 1.00 1 86 hours 0.43 0.002 g/hp-hr 0.002 0.000001 0.0001
Sulfuric Acid Delivery Vehicles -- 450 1.00 6 2,081 hours 0.43 0.0001 g/hp-hr 0.0001 0.0000003 0.0001
Lime Delivery Vehicles -- 450 1.00 2 763 hours 0.43 0.0003 g/hp-hr 0.0003 0.0000003 0.0001
SAG Mill and Ball Mill Grinding Balls Delivery Vehicles -- 450 1.00 1 234 hours 0.43 0.0009 g/hp-hr 0.0009 0.0000005 0.0001
Diesel Fuel Delivery Vehicles -- 500 1.00 2 685 hours 0.43 0.0003 g/hp-hr 0.0003 0.0000003 0.0001
Copper Cathode Shipment Vehicles -- 450 1.00 1 200 hours 0.43 0.001 g/hp-hr 0.001 0.0000005 0.0001
Ammonium Nitrate Delivery Vehicles -- 450 1.00 1 255 hours 0.43 0.0008 g/hp-hr 0.0008 0.0000004 0.0001
Miscellaneous Consumables Delivery Vehicles -- 450 1.00 1 499 hours 0.43 0.0004 g/hp-hr 0.0004 0.0000003 0.0001
Miscellaneous Fuels and Lubricants Delivery Vehicles -- 450 1.00 1 44 hours 0.43 0.005 g/hp-hr 0.005 0.000002 0.0001
Pickup Trucks (gasoline) 20 350 0.25 6 2,190 hours 0.54 -- -- -- -- --
Crew Van (gasoline) 3 350 0.25 6 2,190 hours 0.54 -- -- -- -- --
Lot Pick-Up Trucks (gasoline) 20 250 0.25 6 2,190 hours 0.54 -- -- -- -- --
0.006 0.00007 0.02
0.01 0.00004 0.01
0.02 0.0001 0.03
a Fuel burning mobile engines are diesel fuel fired unless otherwise noted.
b Except for the shipment and delivery vehicles, the process rates are for a single mobile engine. The process rates for the shipment and delivery vehicles are representative of the entire fleet.
Total Emissions from Haul Truck Engines:
Total Emissions from Other Mobile Engines:
Total Emissions from All Mobile Engines:
Rosemont Copper ProjectEmission Inventory Information JBR ENVIRONMENTAL CONSULTANTS, INC.
November 2011Page H296
AZRP00478

Hourly Daily Annual lb/hr tpd tpy lb/hr tpd tpy
Haulage Trucks, 250 tons 31 2,650 1.00 24 6,600 hours 0.24 2.08 0.03 6.88 6.60 0.08 21.79
Crawler Dozers, D11T Class 3 850 0.46 11 4,000 hours 0.24 0.01 0.0001 0.05 0.03 0.0004 0.15
Crawler Dozers, D10T Class 3 580 0.68 16 6,000 hours 0.24 0.004 0.00004 0.02 0.01 0.0001 0.05
Crawler Dozer, D8T Class 1 310 0.75 18 6,570 hours 0.24 0.0007 0.000008 0.003 0.002 0.00003 0.01
Rubber Tired Dozers, 834H Class 3 498 0.58 14 5,075 hours 0.24 0.003 0.00003 0.01 0.008 0.0001 0.04
Motor Graders, 24M Class 1 533 0.68 16 6,000 hours 0.24 0.001 0.00001 0.005 0.003 0.00004 0.02
Motor Graders, 16M Class 3 297 0.46 11 4,000 hours 0.24 0.001 0.00001 0.005 0.004 0.00005 0.02
Water Trucks, 30,000 gallons 4 1,348 0.45 11 3,250 hours 0.24 0.01 0.0002 0.05 0.04 0.0005 0.15
Diesel Blasthole Drill, 12.25 inches 2 1,500 0.75 18 6,570 hours 0.24 0.02 0.0002 0.07 0.05 0.0006 0.21
Hydraulic DML 45 Drill 1 425 0.75 18 6,570 hours 0.24 0.0007 0.000009 0.003 0.002 0.00003 0.01
Front End Loaders 2 2,000 0.90 22 7,884 hours 0.24 0.17 0.002 0.74 0.53 0.006 2.34
Stemming Truck 2 450 0.75 18 6,570 hours 0.24 0.002 0.00002 0.007 0.005 0.00006 0.02
ANFO/Slurry Truck, 20 tons 2 450 0.75 18 6,570 hours 0.24 0.002 0.00002 0.007 0.005 0.00006 0.02
Powder Truck, 2 tons 2 350 0.75 18 6,570 hours 0.44 0.002 0.00003 0.01 0.003 0.00003 0.01
Front End Loaders, 8 yd3 2 262 0.75 18 6,570 hours 0.24 0.001 0.00001 0.005 0.004 0.00005 0.02
Hydraulic Excavator, 385 Cat CL 2 513 0.90 22 7,884 hours 0.24 0.002 0.00002 0.007 0.005 0.00006 0.02
Backhoe/Loader, 2 yd3 1 124 0.75 18 6,570 hours 0.44 0.0003 0.000004 0.001 0.0004 0.000005 0.002
Soot Emissions - Year 15
Table H.76 Soot (Elemental Carbon) Emissions from Fuel Burning Mobile Engines (Diesel Engines Only) - Year 15
Fuel Burning Mobile Engine Description a
Fleet Size
HP Rating
Process Rates b - Year 15
UnitsOrganic Carbon Fraction
Organic Carbon Emissions - Year 15
Rosemont Copper ProjectEmission Inventory Information JBR ENVIRONMENTAL CONSULTANTS, INC.
November 2011Page H297
AZRP00479

Hourly Daily Annual lb/hr tpd tpy lb/hr tpd tpy
Soot Emissions - Year 15
Table H.76 Soot (Elemental Carbon) Emissions from Fuel Burning Mobile Engines (Diesel Engines Only) - Year 15
Fuel Burning Mobile Engine Description a
Fleet Size
HP Rating
Process Rates b - Year 15
UnitsOrganic Carbon Fraction
Organic Carbon Emissions - Year 15
All-Terrain Crane, 75 tons 1 230 0.75 18 6,570 hours 0.24 0.0004 0.000005 0.002 0.001 0.00001 0.005
Transporter with Tractor, 200 tons 1 1,350 0.75 18 6,570 hours 0.24 0.009 0.0001 0.04 0.03 0.0004 0.13
Fuel/Lube Trucks, 6,000 gallons 2 703 0.75 18 6,570 hours 0.24 0.002 0.00002 0.008 0.006 0.00007 0.03
Mechanic Field Service Trucks 5 370 0.75 18 6,570 hours 0.44 0.002 0.00002 0.008 0.002 0.00003 0.01
Tire Handler 1 90 0.75 18 6,570 hours 0.51 0.00002 0.0000003 0.0001 0.00002 0.0000003 0.0001
Shop Forklift, 12,000 lbs 1 90 0.75 18 6,570 hours 0.51 0.0004 0.000005 0.002 0.0004 0.000005 0.002
Integrated Tool Carrier, 140 hp 1 138 0.75 18 6,570 hours 0.44 0.0006 0.000007 0.003 0.0007 0.000009 0.003
Light Plant, 6 kW 15 35 0.40 10 3,504 hours 0.5 0.002 0.00002 0.009 0.002 0.00002 0.009
Primary Crushing Mobile Crane - 400 tons 1 320 0.75 18 6,570 hours 0.24 0.0005 0.000007 0.002 0.002 0.00002 0.008
Copper Concentrate Area Front End Loader - Cat 930 1 160 0.75 18 6,570 hours 0.44 0.0007 0.000008 0.003 0.0009 0.00001 0.004
Molybdenum Packaging Forklift, 7,000 lbs 1 93 0.75 18 6,570 hours 0.51 0.0005 0.000005 0.002 0.0004 0.000005 0.002
Copper Cathode Forklift 1 93 0.75 18 6,570 hours 0.44 0.0004 0.000005 0.002 0.0005 0.000006 0.002
Boom Trucks 10 tons, 45 foot boom 1 200 0.75 18 6,570 hours 0.44 0.0003 0.000004 0.001 0.0004 0.000005 0.002
Boom Trucks 15 tons, 60 foot boom 1 210 0.75 18 6,570 hours 0.44 0.0003 0.000004 0.001 0.0004 0.000005 0.002
Front End Loader, 6 yd3 1 349 0.75 18 6,570 hours 0.24 0.0005 0.000006 0.002 0.002 0.00002 0.007
Front End Loader, 5 yd3 1 149 0.75 18 6,570 hours 0.44 0.0003 0.000003 0.001 0.0003 0.000004 0.001
Bob Cats, 2,400 lbs 2 82 0.75 18 6,570 hours 0.5 0.0008 0.00001 0.003 0.0008 0.00001 0.003
Rosemont Copper ProjectEmission Inventory Information JBR ENVIRONMENTAL CONSULTANTS, INC.
November 2011Page H298
AZRP00480

Hourly Daily Annual lb/hr tpd tpy lb/hr tpd tpy
Soot Emissions - Year 15
Table H.76 Soot (Elemental Carbon) Emissions from Fuel Burning Mobile Engines (Diesel Engines Only) - Year 15
Fuel Burning Mobile Engine Description a
Fleet Size
HP Rating
Process Rates b - Year 15
UnitsOrganic Carbon Fraction
Organic Carbon Emissions - Year 15
Fork Lift, 2,000 lbs 1 50 0.75 18 6,570 hours 0.5 0.0005 0.000006 0.002 0.0005 0.000006 0.002
Fork Lift, 5,000 lbs 1 63 0.75 18 6,570 hours 0.48 0.0006 0.000007 0.003 0.0006 0.000008 0.003
Fork Lift, 3,000 lbs 2 50 0.75 18 6,570 hours 0.5 0.001 0.00001 0.004 0.001 0.00001 0.004
Flat Bed Trucks, 10 tons 2 350 0.75 18 6,570 hours 0.44 0.002 0.00003 0.01 0.003 0.00003 0.01
Dump Truck, 10 tons 1 250 0.75 18 6,570 hours 0.24 0.00004 0.0000004 0.0002 0.0001 0.000001 0.0005
Mobile Hydraulic Crane, 60 tons 1 267 0.75 18 6,570 hours 0.24 0.0005 0.000005 0.002 0.001 0.00002 0.006
Truck Shop Bridge Crane, 60 tons 1 75 0.75 18 6,570 hours 0.24 0.0001 0.000002 0.0006 0.0004 0.000005 0.002
Truck Shop Bridge Crane, 25 tons 1 24 0.75 18 6,570 hours 0.24 0.001 0.00001 0.005 0.004 0.00005 0.02
CS683 Soil Compactor / Roller 2 173 0.75 18 6,570 hours 0.24 0.0005 0.000007 0.002 0.002 0.00002 0.008
246C Skid Steer Loader 2 73 0.75 18 6,570 hours 0.48 0.0007 0.000008 0.003 0.0007 0.000009 0.003
RH200/340 O & K Shovel / Hitachi EX5500 1 2,520 0.75 18 6,570 hours 0.24 0.02 0.0002 0.08 0.06 0.0007 0.25
Off-Road Tire Handling Truck 1 450 0.75 18 6,570 hours 0.24 0.00009 0.000001 0.0004 0.0003 0.000003 0.001
Contractor Haul Trucks, 25 tons 2 511 0.75 18 6,570 hours 0.24 0.0006 0.000007 0.003 0.002 0.00002 0.008
Motivator for Mine Shovels 1 3,308 0.91 22 8,000 hours 0.24 0.01 0.0002 0.06 0.04 0.0005 0.19
Storm Water Pond Pump 1 200 1.00 24 500 hours 0.5 0.002 0.00003 0.0005 0.002 0.00003 0.0005
Mine Pit Dewatering Pump 4 100 1.00 24 500 hours 0.5 0.004 0.00005 0.001 0.004 0.00005 0.001
Copper Concentrate Shipment Vehicles -- 450 1.00 19 6,795 hours 0.24 0.003 0.00006 0.009 0.01 0.0002 0.03
Rosemont Copper ProjectEmission Inventory Information JBR ENVIRONMENTAL CONSULTANTS, INC.
November 2011Page H299
AZRP00481
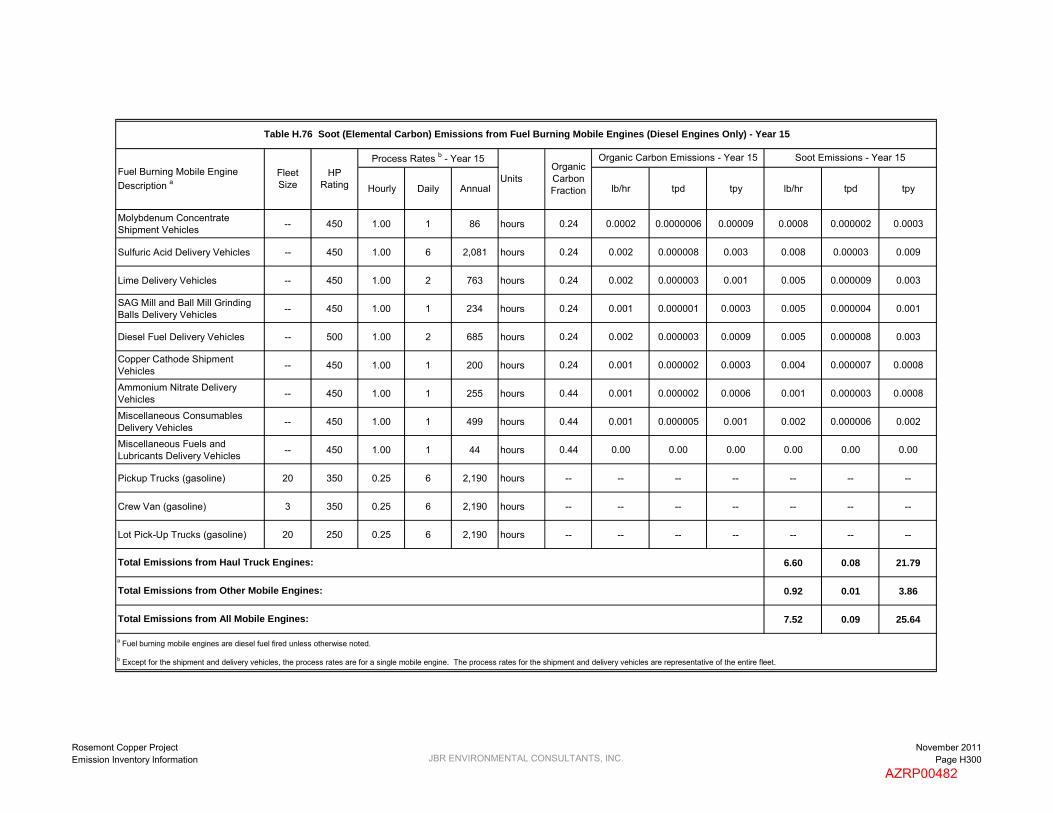
Hourly Daily Annual lb/hr tpd tpy lb/hr tpd tpy
Soot Emissions - Year 15
Table H.76 Soot (Elemental Carbon) Emissions from Fuel Burning Mobile Engines (Diesel Engines Only) - Year 15
Fuel Burning Mobile Engine Description a
Fleet Size
HP Rating
Process Rates b - Year 15
UnitsOrganic Carbon Fraction
Organic Carbon Emissions - Year 15
Molybdenum Concentrate Shipment Vehicles -- 450 1.00 1 86 hours 0.24 0.0002 0.0000006 0.00009 0.0008 0.000002 0.0003
Sulfuric Acid Delivery Vehicles -- 450 1.00 6 2,081 hours 0.24 0.002 0.000008 0.003 0.008 0.00003 0.009
Lime Delivery Vehicles -- 450 1.00 2 763 hours 0.24 0.002 0.000003 0.001 0.005 0.000009 0.003
SAG Mill and Ball Mill Grinding Balls Delivery Vehicles -- 450 1.00 1 234 hours 0.24 0.001 0.000001 0.0003 0.005 0.000004 0.001
Diesel Fuel Delivery Vehicles -- 500 1.00 2 685 hours 0.24 0.002 0.000003 0.0009 0.005 0.000008 0.003
Copper Cathode Shipment Vehicles -- 450 1.00 1 200 hours 0.24 0.001 0.000002 0.0003 0.004 0.000007 0.0008
Ammonium Nitrate Delivery Vehicles -- 450 1.00 1 255 hours 0.44 0.001 0.000002 0.0006 0.001 0.000003 0.0008
Miscellaneous Consumables Delivery Vehicles -- 450 1.00 1 499 hours 0.44 0.001 0.000005 0.001 0.002 0.000006 0.002
Miscellaneous Fuels and Lubricants Delivery Vehicles -- 450 1.00 1 44 hours 0.44 0.00 0.00 0.00 0.00 0.00 0.00
Pickup Trucks (gasoline) 20 350 0.25 6 2,190 hours -- -- -- -- -- -- --
Crew Van (gasoline) 3 350 0.25 6 2,190 hours -- -- -- -- -- -- --
Lot Pick-Up Trucks (gasoline) 20 250 0.25 6 2,190 hours -- -- -- -- -- -- --
6.60 0.08 21.79
0.92 0.01 3.86
7.52 0.09 25.64
a Fuel burning mobile engines are diesel fuel fired unless otherwise noted.
b Except for the shipment and delivery vehicles, the process rates are for a single mobile engine. The process rates for the shipment and delivery vehicles are representative of the entire fleet.
Total Emissions from Haul Truck Engines:
Total Emissions from Other Mobile Engines:
Total Emissions from All Mobile Engines:
Rosemont Copper ProjectEmission Inventory Information JBR ENVIRONMENTAL CONSULTANTS, INC.
November 2011Page H300
AZRP00482

Rosemont Copper Project November 2011 Emission Inventory Information Page H301
JBR ENVIRONMENTAL CONSULTANTS, INC.
YEAR 20
AZRP00483

PM/TSP PM10 PM2.5 Unitsk
(PM/TSP)
k (PM10) k (PM2.5) A (ft2) U (mph) M (%) W (tons) s (%) S (mph) P (days/yr)a
(PM/TSP)
a (PM10) a (PM2.5)b
(PM/TSP)
b (PM10) b (PM2.5) u* ut* e f (%) PE
Drilling Drilling 3-05-020-10 1.30 0.43 0.08 lb/hole holes 1 0.33 0.06 AP-42, Section 11.9, Table11.9-4 (10/98)
Blast Blasting 3-05-020-09 328.26 170.69 9.85 lb/blast blasts 1 0.52 0.03 81,920 AP-42, Section 11.9, Table11.9-1 (10/98)
Loading Loading 3-03-024-08 0.0007 0.0003 0.00005 lb/ton tons 0.74 0.35 0.053 4.14 4 AP-42, Section 13.2.4,Expression 1 (11/06)
HaulingHD Haul Trucks - Hourly/Daily 3-05-020-11 21.25 5.46 0.55 lb/VMT VMT 4.9 1.5 0.15 305 5.0 0.7 0.9 0.9 0.45 0.45 0.45 AP-42, Section 13.2.2,Expression 1a (11/06)
HaulingA Haul Trucks - Annual 3-05-020-11 17.70 4.55 0.45 lb/VMT VMT 4.9 1.5 0.15 305 5.0 61 0.7 0.9 0.9 0.45 0.45 0.45 AP-42, Section 13.2.2,Expressions 1a and 2 (11/06)
Bldzrs Bulldozers 3-05-010-99 2.82 0.43 0.30 lb/hr hrs 5.7 0.75 0.60 4 2.5 1.2 1.5 1.2 1.3 1.4 1.3 AP-42, Section 11.9, Table11.9-1 (10/98)
SupVehY20H Support Vehicular Traffic - Year 20 Hourly 3-05-010-99 6.96 1.79 0.18 lb/VMT VMT 4.9 1.5 0.15 25.5 5.0 0.7 0.9 0.9 0.45 0.45 0.45 AP-42, Section 13.2.2,
Expression 1a (11/06)
SupVehY20D Support Vehicular Traffic - Year 20 Daily 3-05-010-99 7.19 1.85 0.18 lb/VMT VMT 4.9 1.5 0.15 27.4 5.0 0.7 0.9 0.9 0.45 0.45 0.45 AP-42, Section 13.2.2,
Expression 1a (11/06)
SupVehY20A Support Vehicular Traffic - Year 20 Annual 3-05-010-99 6.06 1.56 0.16 lb/VMT VMT 4.9 1.5 0.15 28.2 5.0 61 0.7 0.9 0.9 0.45 0.45 0.45 AP-42, Section 13.2.2,
Expressions 1a and 2 (11/06)
WtrTrksHD Water Trucks - Hourly/Daily 3-05-010-99 17.06 4.38 0.44 lb/VMT VMT 4.9 1.5 0.15 187.4 5.0 0.7 0.9 0.9 0.45 0.45 0.45 AP-42, Section 13.2.2,Expression 1a (11/06)
WtrTrksA Water Trucks - Annual 3-05-010-99 14.21 3.65 0.37 lb/VMT VMT 4.9 1.5 0.15 187.4 5.0 61 0.7 0.9 0.9 0.45 0.45 0.45 AP-42, Section 13.2.2,Expressions 1a and 2 (11/06)
GradersY20 Graders - Year 20 3-05-010-99 2.18 0.75 0.07 lb/VMT VMT 1 0.60 0.031 4.95 0.040 0.051 0.040 2.5 2.0 2.5 AP-42, Section 11.9, Table11.9-1 (10/98)
TrMlyCncPrt Molybdnum Concentrate Transfer(Protected) 3-03-024-08 0.00002 0.00001 0.000002 lb/ton tons 0.74 0.35 0.053 1.3 15 AP-42, Section 13.2.4,
Expression 1 (11/06)
DTrMlyCncPrt Dried Molybdenum Concentrate Transfer (Protected) 3-03-024-08 0.00004 0.00002 0.000003 lb/ton tons 0.74 0.35 0.053 1.3 10 AP-42, Section 13.2.4,
Expression 1 (11/06)
DTrMlyCnc Dried Molybdenum Concentrate Transfer (Unprotected) 3-03-024-08 0.0003 0.0002 0.00002 lb/ton tons 0.74 0.35 0.053 6.21 10 AP-42, Section 13.2.4,
Expression 1 (11/06)
TrCuCncPrt Copper Concentrate Transfer (Protected) 3-03-024-08 0.00004 0.00002 0.000003 lb/ton tons 0.74 0.35 0.053 1.3 10 AP-42, Section 13.2.4,
Expression 1 (11/06)
TrCuCnc Copper Concentrate Loadout 3-03-024-08 0.0003 0.0002 0.00002 lb/ton tons 0.74 0.35 0.053 6.21 10 AP-42, Section 13.2.4,Expression 1 (11/06)
FiltTailPrt Filtered Tailings Transfer (Protected) 3-03-024-08 0.00002 0.00001 0.000002 lb/ton tons 0.74 0.35 0.053 1.3 15 AP-42, Section 13.2.4,
Expression 1 (11/06)
FiltTail Filtered Tailings Transfer (Unprotected) 3-03-024-08 0.0002 0.00009 0.00001 lb/ton tons 0.74 0.35 0.053 6.21 15 AP-42, Section 13.2.4,
Expression 1 (11/06)
CrushP Primary Crushing - High Moisture Ore 3-03-024-05 0.02 0.009 0.002 lb/ton tons 0.185
AP-42, Section 11.24, Table11.24-2 (08/82) and 11.19.2-2 (08/04)
CrushS Secondary Crushing - High Moisture Ore 3-03-024-06 0.05 0.02 0.004 lb/ton tons 0.185
AP-42, Section 11.24, Table11.24-2 (08/82) and 11.19.2-2 (08/04)
CrushT Tertiary Crushing - High Moisture Ore 3-03-024-07 0.06 0.02 0.004 lb/ton tons 0.185
AP-42, Section 11.24, Table11.24-2 (08/82) and 11.19.2-2(08/04)
Screen Screening 3-05-020-02 0.025 0.0087 0.0006 lb/ton tons 0.068 AP-42, Section 11.19, Table11.19.2-2 (08/04)
MolyDry Drying of High Moisture Ore 3-03-024-11 19.70 12.00 5.91 lb/ton tons 0.30AP-42, Section 11.24, Table11.24-2 (08/82) and Appendix B.2 (09/96)
TrStnPrt Material Transfer (Protected) 3-03-024-08 0.0002 0.00007 0.00001 lb/ton tons 0.74 0.35 0.053 1.3 4 AP-42, Section 13.2.4,Expression 1 (11/06)
TrStnUnp Material Transfer (Unprotected) 3-03-024-08 0.001 0.0006 0.00009 lb/ton tons 0.74 0.35 0.053 6.21 4 AP-42, Section 13.2.4,Expression 1 (11/06)
LimeLd Lime Product Loading, Enclosed Truck 3-05-016-26 0.61 0.29 0.04 lb/ton tons 1 0.47 0.07
AP-42, Section 11.17, Table11.17-4 (02/98) and AP-42, Section 13.2.4 (11/06)
ReagTr Miscellaneous Reagent Material Transfer 3-03-024-04 0.008 0.004 0.0006 lb/ton tons 0.74 0.35 0.053 6.21 1 AP-42, Section 13.2.4,
Expression 1 (11/06)
Process Code Process DescriptionParticulate Matter Emission Factor Inputs a
Table H.77 Particulate Matter Emission Factors - Year 20
SCC Code Prod. Rate Units Reference
Emission Factors
Rosemont Copper ProjectEmission Inventory Information JBR ENVIRONMENTAL CONSULTANTS, INC.
November 2011Page H302
AZRP00484
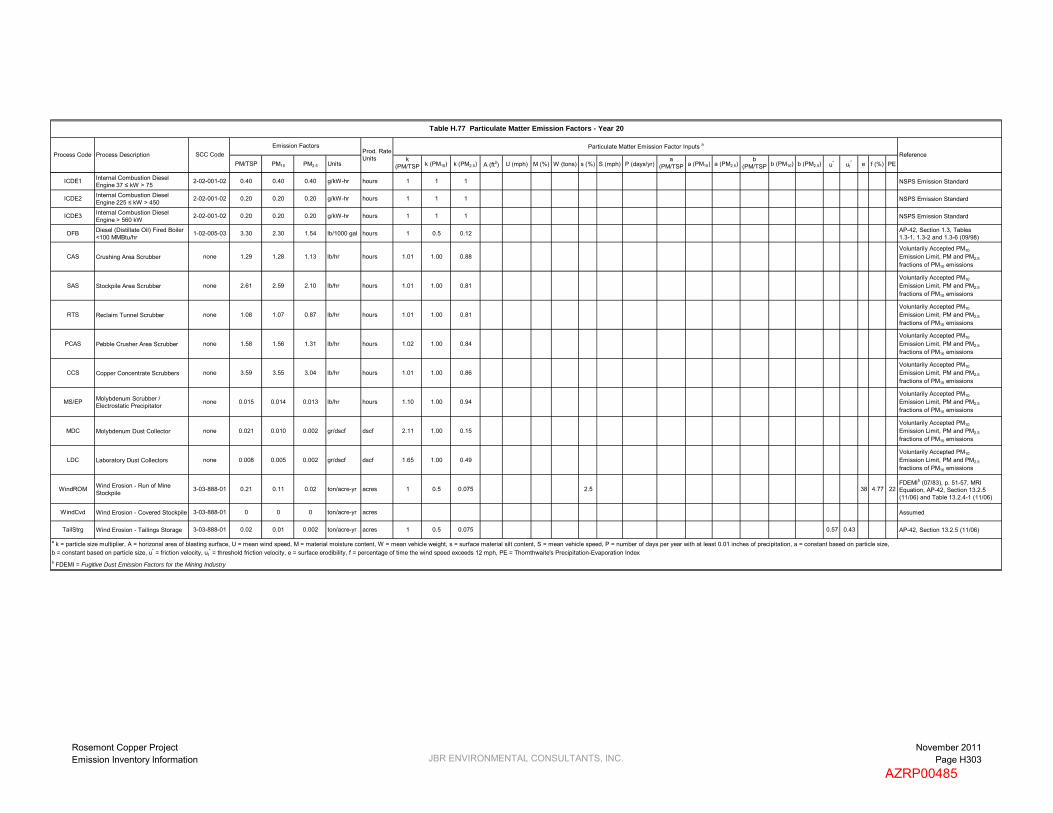
PM/TSP PM10 PM2.5 Unitsk
(PM/TSP)
k (PM10) k (PM2.5) A (ft2) U (mph) M (%) W (tons) s (%) S (mph) P (days/yr)a
(PM/TSP)
a (PM10) a (PM2.5)b
(PM/TSP)
b (PM10) b (PM2.5) u* ut* e f (%) PE
Process Code Process DescriptionParticulate Matter Emission Factor Inputs a
Table H.77 Particulate Matter Emission Factors - Year 20
SCC Code Prod. Rate Units Reference
Emission Factors
ICDE1 Internal Combustion Diesel Engine 37 ≤ kW > 75 2-02-001-02 0.40 0.40 0.40 g/kW-hr hours 1 1 1 NSPS Emission Standard
ICDE2 Internal Combustion Diesel Engine 225 ≤ kW > 450 2-02-001-02 0.20 0.20 0.20 g/kW-hr hours 1 1 1 NSPS Emission Standard
ICDE3 Internal Combustion Diesel Engine > 560 kW 2-02-001-02 0.20 0.20 0.20 g/kW-hr hours 1 1 1 NSPS Emission Standard
DFB Diesel (Distillate Oil) Fired Boiler <100 MMBtu/hr 1-02-005-03 3.30 2.30 1.54 lb/1000 gal hours 1 0.5 0.12 AP-42, Section 1.3, Tables
1.3-1, 1.3-2 and 1.3-6 (09/98)
CAS Crushing Area Scrubber none 1.29 1.28 1.13 lb/hr hours 1.01 1.00 0.88Voluntarily Accepted PM10
Emission Limit, PM and PM2.5
fractions of PM10 emissions
SAS Stockpile Area Scrubber none 2.61 2.59 2.10 lb/hr hours 1.01 1.00 0.81Voluntarily Accepted PM10
Emission Limit, PM and PM2.5
fractions of PM10 emissions
RTS Reclaim Tunnel Scrubber none 1.08 1.07 0.87 lb/hr hours 1.01 1.00 0.81Voluntarily Accepted PM10
Emission Limit, PM and PM2.5
fractions of PM10 emissions
PCAS Pebble Crusher Area Scrubber none 1.58 1.56 1.31 lb/hr hours 1.02 1.00 0.84Voluntarily Accepted PM10
Emission Limit, PM and PM2.5
fractions of PM10 emissions
CCS Copper Concentrate Scrubbers none 3.59 3.55 3.04 lb/hr hours 1.01 1.00 0.86Voluntarily Accepted PM10
Emission Limit, PM and PM2.5
fractions of PM10 emissions
MS/EP Molybdenum Scrubber / Electrostatic Precipitator none 0.015 0.014 0.013 lb/hr hours 1.10 1.00 0.94
Voluntarily Accepted PM10
Emission Limit, PM and PM2.5
fractions of PM10 emissions
MDC Molybdenum Dust Collector none 0.021 0.010 0.002 gr/dscf dscf 2.11 1.00 0.15Voluntarily Accepted PM10
Emission Limit, PM and PM2.5
fractions of PM10 emissions
LDC Laboratory Dust Collectors none 0.008 0.005 0.002 gr/dscf dscf 1.65 1.00 0.49Voluntarily Accepted PM10
Emission Limit, PM and PM2.5
fractions of PM10 emissions
WindROM Wind Erosion - Run of MineStockpile 3-03-888-01 0.21 0.11 0.02 ton/acre-yr acres 1 0.5 0.075 2.5 38 4.77 22
FDEMIb (07/83), p. 51-57, MRIEquation, AP-42, Section 13.2.5 (11/06) and Table 13.2.4-1 (11/06)
WindCvd Wind Erosion - Covered Stockpile 3-03-888-01 0 0 0 ton/acre-yr acres Assumed
TailStrg Wind Erosion - Tailings Storage 3-03-888-01 0.02 0.01 0.002 ton/acre-yr acres 1 0.5 0.075 0.57 0.43 AP-42, Section 13.2.5 (11/06)
b FDEMI = Fugitive Dust Emission Factors for the Mining Industry
a k = particle size multiplier, A = horizonal area of blasting surface, U = mean wind speed, M = material moisture content, W = mean vehicle weight, s = surface material silt content, S = mean vehicle speed, P = number of days per year with at least 0.01 inches of precipitation, a = constant based on particle size,b = constant based on particle size, u* = friction velocity, ut
* = threshold friction velocity, e = surface erodibility, f = percentage of time the wind speed exceeds 12 mph, PE = Thornthwaite's Precipitation-Evaporation Index
Rosemont Copper ProjectEmission Inventory Information JBR ENVIRONMENTAL CONSULTANTS, INC.
November 2011Page H303
AZRP00485

CO NOX SO2 VOC H2SO4 CO2 CH4 N2O Units
Blast Blasting 3-05-020-09 67.00 17.00 2.00 0 0 566 0.02 0.005 lb/tons ANFO tons ANFOAP-42 Section 13.3, Table 13.3-1 (02/80) and 40 CFR 98, Tables C-1 and C-2a
SX Solvent Extraction Mixers and Settlers 4-90-001-99 0 0 0 9.43E-05 0 0 0 0 lb/hr-ft2 hours Hydrometallurgy of Copper (Control Efficiency of 66%)
EW Electrowining Tankhouse none 0 0 0 0 1.57E-04 0 0 0 lb/hr-ft2 hours Applied Environmental Consultants - Reportb
ICDE1 Internal Combustion Diesel Engine 37 ≤ kW > 75 2-02-001-02 5.0 4.4 0.0066 0.3 0 694 0.03 0.006 g/kW-hr hours NSPS Emission Standard, Complete Sulfur Conversionc, and 40 CFR 98, Tables C-1 and C-2
ICDE2 Internal Combustion Diesel Engine 225 ≤ kW > 450 2-02-001-02 3.5 3.7 0.0066 0.3 0 694 0.03 0.006 g/kW-hr hours NSPS Emission Standard, Complete Sulfur Conversionc, and 40 CFR 98, Tables C-1 and C-2
ICDE3 Internal Combustion Diesel Engine > 560 kW 2-02-001-02 3.5 6.0 0.0066 0.40 0 694 0.03 0.006 g/kW-hr hours NSPS Emission Standard, Complete Sulfur Conversionc, and 40 CFR 98, Tables C-1 and C-2
DFB Diesel (Distillate Oil) Fired Boiler <100 MMBtu/hr 1-02-005-03 5.00 20.00 0.21 0.20 0 23,217 0.94 0.19 lb/1000 gal hours AP-42 Section 1.3, Tables 1.3-1 and 1.3-3 (05/10)c and 40 CFR 98, Tables C-1 and C-2
C7DT C7 Distribution Tank 4-03-010-19 0 0 0 1.08E-01 0 0 0 0 lb/hr hours EPA Tanks Program 4.0d
MST MIBC Storage Tank 4-90-999-98 0 0 0 3.53E-03 0 0 0 0 lb/hr hours EPA Tanks Program 4.0d
DFSTHV Diesel Fuel Storage Tank - Heavy Vehicles 4-03-010-19 0 0 0 1.39E-02 0 0 0 0 lb/hr hours EPA Tanks Program 4.0d
b "Measurement of Sulfuric Acid Mist Emissions from the Cyprus Twin Buttes Copper Company Electrowinning Tankhouse" (02/93).
d Assumes continuous operation.
a Assumes a fuel oil to ammonium nitrate ratio of 9.0%.
c SO2 emissions are calculated using a sulfur content of 0.0015% for diesel fuel.
Table H.78 Gaseous Emission Factors - Year 20
Process DescriptionProcess Code SCC Code Prod. Rate
Units ReferenceEmission Factor
Rosemont Copper ProjectEmission Inventory Information JBR ENVIRONMENTAL CONSULTANTS, INC.
November 2011Page H304
AZRP00486

Control Code Control Description Pick-up Efficiency (%)
Control Efficiency (%) Reference
CAS Crushing Area Scrubber (PC-CAS) 100% -- Assumed
SAS Stockpile Area Scrubber (PC-SAS) 100% -- Assumed
RTS Reclaim Tunnel Scrubber (PC-RTS) 100% -- Assumed
PCAS Pebble Crusher Area Scrubber (PC-PCAS) 100% -- Assumed
CCS Copper Concentrate Scrubbers (PC-CCS1/CCS2) 100% -- Assumed
MS/EP Molybdenum Scrubber (PC-MS) / Electrostatic Precipitator (PC-EP) 100% -- Assumed
BPLSV Bulk Pebble Lime Silo Bin Vent (PC-BPLBV) 100% 90% Vendor Specification
LSV Lime Storage Bin Vent (PC-LSBV) 100% 90% Vendor Specification
SMSV Sodium Metasilicate Storage Bin Vent (PC-SMSBV) 100% 90% Vendor Specification
CVS EW Cell Ventilation Scrubbers (PC-CVS) 100% 99% Engineering Design
MDC Molybdenum Dust Collector (PC-MDC) 100% -- Assumed
HaulRdUI Road Watering (Inside the Pit) N/A 90% Control of Open Fugitive Dust Sources (09/88) a
HaulRdUO Road Watering (Outside the Pit) N/A 90% Control of Open Fugitive Dust Sources (09/88) a
HaulRdWTI Road Watering - Water Trucks (Inside the Pit) N/A 90% Control of Open Fugitive Dust Sources (09/88) a
HaulRdWTO Road Watering - Water Trucks (Outside the Pit) N/A 90% Control of Open Fugitive Dust Sources (09/88) a
Water Addition of Process Water N/A 100% Assumed
WSpry Water Spray at Unprotected Points N/A 82.5% Average Value of AP-42, p. 11.19.1-5 (11/95)
Wet Wet Process N/A 100% Assumed
Clean Wet, Cleaned Ore (no fines) N/A 100% Assumed
Enclosed Totally Enclosed Transfer Point N/A 100% Assumed
UndrGrd Underground Transfer Point N/A 100% Assumed
None No Pollution Controls 0% 0% Assumed
Table H.79 Particulate Matter Control Efficiencies - Year 20
a EPA Document gives methods for calculating efficiencies - pages 5-9 to 5-14
Rosemont Copper ProjectEmission Inventory Information JBR ENVIRONMENTAL CONSULTANTS, INC.
November 2011Page H305
AZRP00487

PM/TSP PM10 PM2.5 Uncontrolled Controlled Uncontrolled Controlled Uncontrolled Controlled
Mining
MN01 Drilling Drilling 3-05-020-10 F 8,080 holes 1.30 0.43 0.08 lb/hole None 0% 5.25 5.25 1.75 1.75 0.32 0.32
MN02 Blasting Blast 3-05-020-09 F 101 blasts 328.26 170.69 9.85 lb/blast None 0% 16.58 16.58 8.62 8.62 0.50 0.50
MN03 Loading Concentrate Ore Loading 3-03-024-08 F 27,375,000 tons 0.0007 0.0003 0.00005 lb/ton None 0% 9.60 9.60 4.54 4.54 0.69 0.69
MN04 Loading Leach Ore Loading 3-03-024-08 F 0 tons 0.0007 0.0003 0.00005 lb/ton None 0% 0 0 0 0 0 0
MN05 Loading Waste Rock Loading 3-03-024-08 F 4,380,000 tons 0.0007 0.0003 0.00005 lb/ton None 0% 1.54 1.54 0.73 0.73 0.11 0.11
MN06a Hauling Concentrate Ore to Primary Crusher Dump Hopper / Run of Mine Stockpile (Inside the Pit)
HaulingA 3-05-020-11 F 695,574 VMT 17.70 4.55 0.45 lb/VMT HaulRdUI 90% 6,154.21 615.42 1,581.34 158.13 158.13 15.81
MN06b Hauling Concentrate Ore to Primary Crusher Dump Hopper / Run of Mine Stockpile (Outside the Pit)
HaulingA 3-05-020-11 F 190,588 VMT 17.70 4.55 0.45 lb/VMT HaulRdUO 90% 1,686.26 168.63 433.29 43.33 43.33 4.33
MN07a Hauling Leach Ore to Leach Pad (Inside the Pit) HaulingA 3-05-020-11 F 0 VMT 17.70 4.55 0.45 lb/VMT HaulRdUI 90% 0 0 0 0 0 0
MN07b Hauling Leach Ore to Leach Pad (Outside the Pit) HaulingA 3-05-020-11 F 0 VMT 17.70 4.55 0.45 lb/VMT HaulRdUO 90% 0 0 0 0 0 0
MN08a Hauling Waste Rock to Waste Rock Storage Area (Inside the Pit)
HaulingA 3-05-020-11 F 120,118 VMT 17.70 4.55 0.45 lb/VMT HaulRdUI 90% 1,062.77 106.28 273.08 27.31 27.31 2.73
MN08b Hauling Waste Rock to Waste Rock Storage Area (Outside the Pit)
HaulingA 3-05-020-11 F 107,682 VMT 17.70 4.55 0.45 lb/VMT HaulRdUO 90% 952.73 95.27 244.81 24.48 24.48 2.45
MN09 Unloading Concentrate Ore to Run of Mine Stockpile TrStnUnp 3-03-024-08 F 2,737,500 tons 0.001 0.0006 0.00009 lb/ton None 0% 1.63 1.63 0.77 0.77 0.12 0.12
MN10 Unloading Leach Ore to Leach Pad TrStnUnp 3-03-024-08 F 0 tons 0.001 0.0006 0.00009 lb/ton None 0% 0 0 0 0 0 0
MN11 Unloading Waste Rock to Waste Rock Storage Area TrStnUnp 3-03-024-08 F 4,380,000 tons 0.001 0.0006 0.00009 lb/ton None 0% 2.60 2.60 1.23 1.23 0.19 0.19
MN12 Bulldozer Use Bldzrs 3-05-010-99 F 30,660 hrs 2.82 0.43 0.30 lb/hr None 0% 43.28 43.28 6.53 6.53 4.54 4.54
MN13a Water Truck Use (Inside the Pit) WtrTrksA 3-05-010-99 F 64,437 VMT 14.21 3.65 0.37 lb/VMT HaulRdWTI 90% 457.91 45.79 117.66 11.77 11.77 1.18
MN13b Water Truck Use (Outside the Pit) WtrTrksA 3-05-010-99 F 23,563 VMT 14.21 3.65 0.37 lb/VMT HaulRdWTO 90% 167.44 16.74 43.02 4.30 4.30 0.43
MN14 Grader Use GradersY20 3-05-010-99 F 59,400 VMT 2.18 0.75 0.07 lb/VMT None 0% 64.76 64.76 22.27 22.27 2.01 2.01
MN15a Support Vehicle Use (Inside the Pit) SupVehY20A 3-05-010-99 F 563,646 VMT 6.06 1.56 0.16 lb/VMT HaulRdUI 90% 1,708.00 170.80 438.87 43.89 43.89 4.39
MN15b Support Vehicle Use (Outside the Pit) SupVehY20A 3-05-010-99 F 563,646 VMT 6.06 1.56 0.16 lb/VMT HaulRdUO 90% 1,708.00 170.80 438.87 43.89 43.89 4.39
Primary Crushing, Conveying, Coarse Ore Storage, and Reclaim Conveying
PC01 Wind Erosion of the Run of Mine Stockpile WindROM 3-03-888-01 F 26 acres 0.21 0.11 0.02 ton/acre-yr None 0% 5.43 5.43 2.72 2.72 0.41 0.41
PC02 Unloading to Primary Crusher Dump Hopper (H-CDp) fromHaul Trucks or Run of Mine Stockpile
TrStnUnp 3-03-024-08 F 27,375,000 tons 0.001 0.0006 0.00009 lb/ton WSpry 82.5% 16.27 2.85 7.69 1.35 1.16 0.20
PC03 Primary Crusher (PCr) CrushP 3-03-024-05 NF 43,362,000 tons 0.02 0.009 0.002 lb/ton CAS 100% 433.62 0 195.13 0 36.14 0
PC04 Primary Crusher (PCr) to Crusher Discharge Hopper (H-CDs) TrStnPrt 3-03-024-08 NF 43,362,000 tons 0.0002 0.00007 0.00001 lb/ton Enclosed a 100% 0 0 0 0 0 0
PC05 Crusher Discharge Hopper (H-CDs) to Crusher DischargeFeeder (F-CD)
TrStnPrt 3-03-024-08 NF 43,362,000 tons 0.0002 0.00007 0.00001 lb/ton CAS 100% 3.38 0 1.60 0 0.24 0
PC06 Crusher Discharge Feeder (F-CD) to Stockpile FeedConveyor (CV-SF)
TrStnPrt 3-03-024-08 NF 43,362,000 tons 0.0002 0.00007 0.00001 lb/ton CAS 100% 3.38 0 1.60 0 0.24 0
PC07 Stockpile Feed Conveyor (CV-SF) to Stockpile TripperConveyor (CV-ST)
TrStnPrt 3-03-024-08 NF 43,362,000 tons 0.0002 0.00007 0.00001 lb/ton SAS 100% 3.38 0 1.60 0 0.24 0
PM/TSP Emissions (tpy) - Year 20 PM10 Emissions (tpy) - Year 20 PM2.5 Emissions (tpy) - Year 20Unit ID Unit Description Process Code EF Units
Pick-up or Control Eff. (%)
Emission Factors
Table H.80 Annual Particulate Emissions - Year 20Annual
Production Rate - Year 20
Control CodeRate UnitsSCC
Non-Fug. (NF) /
Fug. (F)
Rosemont Copper ProjectEmission Inventory Information JBR ENVIRONMENTAL CONSULTANTS, INC.
November 2011Page H306
AZRP00488

PM/TSP PM10 PM2.5 Uncontrolled Controlled Uncontrolled Controlled Uncontrolled Controlled
PM/TSP Emissions (tpy) - Year 20 PM10 Emissions (tpy) - Year 20 PM2.5 Emissions (tpy) - Year 20Unit ID Unit Description Process Code EF Units
Pick-up or Control Eff. (%)
Emission Factors
Table H.80 Annual Particulate Emissions - Year 20Annual
Production Rate - Year 20
Control CodeRate UnitsSCC
Non-Fug. (NF) /
Fug. (F)
PC08 Stockpile Tripper Conveyor (CV-ST) to Covered Coarse Ore Stockpile
TrStnPrt 3-03-024-08 F 43,362,000 tons 0.0002 0.00007 0.00001 lb/ton SAS 100% 3.38 0 1.60 0 0.24 0
PC09 Wind Erosion of the Coarse Ore Stockpile WindCvd 3-03-888-01 F 5 acres 0 0 0 ton/acre-yr Enclosed a 100% 0 0 0 0 0 0
PC10 Coarse Ore Stockpile to Reclaim Feeders (F-R1/R4) TrStnPrt 3-03-024-08 NF 43,362,000 tons 0.0002 0.00007 0.00001 lb/ton UndrGrd a 100% 0 0 0 0 0 0
PC11 Reclaim Feeders (F-R1/R4) to Reclaim Conveyor (CV-R) TrStnPrt 3-03-024-08 NF 43,362,000 tons 0.0002 0.00007 0.00001 lb/ton RTS 100% 3.38 0 1.60 0 0.24 0
PC12 Reclaim Conveyor (CV-R) to SAG Mill Feed Conveyor(CV-SMF) TrStnPrt 3-03-024-08 NF 43,362,000 tons 0.0002 0.00007 0.00001 lb/ton PCAS 100% 3.38 0 1.60 0 0.24 0
PC13 Pebble Conveyor No. 3 (CV-Pb3) to SAG Mill Feed Conveyor (CV-SMF)
TrStnPrt 3-03-024-08 NF 6,269,400 tons 0.0002 0.00007 0.00001 lb/ton PCAS 100% 0.49 0 0.23 0 0.03 0
PC14 SAG Mill Feed Conveyor (CV-SMF) to SAG Mill (M-SAG) TrStnPrt 3-03-024-08 NF 49,669,200 tons 0.0002 0.00007 0.00001 lb/ton Water a 100% 0 0 0 0 0 0
Milling
M01 SAG Mill (M-SAG) CrushS 3-03-024-06 NF 49,669,200 tons 0.05 0.02 0.004 lb/ton Wet a 100% 0 0 0 0 0 0
M02 SAG Mill (M-SAG) to Trommel Screen (Sn-T) TrStnPrt 3-03-024-08 NF 49,669,200 tons 0.0002 0.00007 0.00001 lb/ton Enclosed a 100% 0 0 0 0 0 0
M03 Trommel Screen (Sn-T) Screen 3-05-020-02 NF 49,669,200 tons 0.025 0.0087 0.0006 lb/ton Wet a 100% 0 0 0 0 0 0
M04 Trommel Screen (Sn-T) to Pebble Conveyor No. 1 (CV-Pb1) TrStnPrt 3-03-024-08 NF 10,505,042 tons 0.0002 0.00007 0.00001 lb/ton Clean a 100% 0 0 0 0 0 0
M05 Pebble Conveyor No. 1 (CV-Pb1) to Pebble Wash Screen(Sn-PbW)
TrStnPrt 3-03-024-08 NF 10,505,042 tons 0.0002 0.00007 0.00001 lb/ton Clean a 100% 0 0 0 0 0 0
M06 Pebble Wash Screen (Sn-PbW) Screen 3-05-020-02 NF 10,505,042 tons 0.025 0.0087 0.0006 lb/ton Wet a 100% 0 0 0 0 0 0
M07 Pebble Wash Screen (Sn-PbW) to Pebble Conveyor No. 2 TrStnPrt 3-03-024-08 NF 6,269,400 tons 0.0002 0.00007 0.00001 lb/ton Clean a 100% 0 0 0 0 0 0
M08 Pebble Conveyor No. 2 (CV-Pb2) to SAG Oversize Surge Bin(B-SAGOS) TrStnPrt 3-03-024-08 NF 6,269,400 tons 0.0002 0.00007 0.00001 lb/ton PCAS 100% 0.49 0 0.23 0 0.03 0
M09 SAG Oversize Surge Bin (B-SAGOS) to Pebble CrusherFeeder (F-PbC)
TrStnPrt 3-03-024-08 NF 6,269,400 tons 0.0002 0.00007 0.00001 lb/ton PCAS 100% 0.49 0 0.23 0 0.03 0
M10 Pebble Crusher Feeder (F-PbC) to Pebble Crusher (PbC) TrStnPrt 3-03-024-08 NF 6,269,400 tons 0.0002 0.00007 0.00001 lb/ton Enclosed a 100% 0 0 0 0 0 0
M11 Pebble Crusher (PbC) CrushT 3-03-024-07 NF 6,269,400 tons 0.06 0.02 0.004 lb/ton PCAS 100% 188.08 0 62.69 0 11.61 0
M12 Pebble Crusher (PbC) to Pebble Conveyor No. 3 (CV-Pb3) TrStnPrt 3-03-024-08 NF 6,269,400 tons 0.0002 0.00007 0.00001 lb/ton PCAS 100% 0.49 0 0.23 0 0.03 0
Copper Concentrate Dewatering and Stacking
CCD01 Copper Concentrate Filters (Ft-CC1/CC4) to Copper Concentrate Conveyor (CV-CC) TrCuCncPrt 3-03-024-08 NF 550,936 tons 0.00004 0.00002 0.000003 lb/ton Enclosed a 100% 0 0 0 0 0 0
CCD02 Copper Concentrate Conveyor (CV-CC) to Copper Concentrate Loadout Stockpile
TrCuCncPrt 3-03-024-08 F 550,936 tons 0.00004 0.00002 0.000003 lb/ton CCS 100% 0.01 0 0.006 0 0.0009 0
CCD03 Wind Erosion of Copper Concentrate Loadout Stockpile WindCvd 3-03-888-01 F 1.17 acres 0 0 0 ton/acre-yr Enclosed a 100% 0 0 0 0 0 0
CCD04 Copper Concentrate Loadout Stockpile to Shipment Truck via Front End Loaders
TrCuCncPrt 3-03-024-08 F 550,936 tons 0.00004 0.00002 0.000003 lb/ton CCS 100% 0.01 0 0.006 0 0.0009 0
Molybdenum Dewatering and Packaging
MD01 Molybdenum Concentrate Filter (Ft-MC) to Molybdenum Concentrate Dryer (D-MC)
TrMlyCncPrt 3-03-024-08 NF 6,377 tons 0.00002 0.00001 0.000002 lb/ton Enclosed a 100% 0 0 0 0 0 0
MD02 Molybdenum Concentrate Dryer MolyDry 3-03-024-11 NF 6,377 tons 19.70 12.00 5.91 lb/ton MS/EP 100% 62.81 0 38.26 0 18.84 0
MD03 Molybdenum Concentrate Dryer (D-MC) to MolybdenumConcentrate Bin (B-MC)
DTrMlyCncPrt 3-03-024-08 NF 6,377 tons 0.00004 0.00002 0.000003 lb/ton MDC 100% 0.0001 0 0.00007 0 0.00001 0
Rosemont Copper ProjectEmission Inventory Information JBR ENVIRONMENTAL CONSULTANTS, INC.
November 2011Page H307
AZRP00489

PM/TSP PM10 PM2.5 Uncontrolled Controlled Uncontrolled Controlled Uncontrolled Controlled
PM/TSP Emissions (tpy) - Year 20 PM10 Emissions (tpy) - Year 20 PM2.5 Emissions (tpy) - Year 20Unit ID Unit Description Process Code EF Units
Pick-up or Control Eff. (%)
Emission Factors
Table H.80 Annual Particulate Emissions - Year 20Annual
Production Rate - Year 20
Control CodeRate UnitsSCC
Non-Fug. (NF) /
Fug. (F)
MD04 Molybdenum Concentrate Bin (B-MC) to MolybdenumConcentrate Hopper (H-MC)
DTrMlyCnc 3-03-024-08 NF 6,377 tons 0.0003 0.0002 0.00002 lb/ton None 0% 0.001 0.001 0.0005 0.0005 0.00008 0.00008
MD05 Molybdenum Concentrate Hopper (H-MC) to MolybdenumConcentrate Conveyor (CV-MC)
DTrMlyCncPrt 3-03-024-08 NF 6,377 tons 0.00004 0.00002 0.000003 lb/ton Enclosed a 100% 0 0 0 0 0 0
MD06 Molybdenum Concentrate Conveyor (CV-MC) to Molybdenum Packaging and Weigh System (MPS)
DTrMlyCnc 3-03-024-08 NF 6,377 tons 0.0003 0.0002 0.00002 lb/ton MDC 100% 0.001 0 0.0005 0 0.00008 0
Tailings Dewatering and Placement
TDS01 Tailings Filters (Ft-T1/T14) to Tailings Belt Feeders (F-T1/T14) FiltTailPrt 3-03-024-08 NF 42,804,687 tons 0.00002 0.00001 0.000002 lb/ton Enclosed a 100% 0 0 0 0 0 0
TDS02 Tailings Belt Feeders (F-T1/T14) to Fixed Tailings ConveyorNo. 1 (CV-F1)
FiltTailPrt 3-03-024-08 NF 42,804,687 tons 0.00002 0.00001 0.000002 lb/ton Enclosed a 100% 0 0 0 0 0 0
TDS03 Fixed Tailings Conveyor No. 1 (CV-F1) to Fixed TailingsConveyor No. 2 (CV-F2)
FiltTailPrt 3-03-024-08 NF 42,804,687 tons 0.00002 0.00001 0.000002 lb/ton Enclosed a 100% 0 0 0 0 0 0
TDS04 Fixed Tailings Conveyor No. 2 (CV-F2) to Fixed Tailings Conveyor No. 3 (CV-F3)
FiltTailPrt 3-03-024-08 NF 42,804,687 tons 0.00002 0.00001 0.000002 lb/ton None 0% 0.52 0.52 0.25 0.25 0.04 0.04
TDS05 Fixed Tailings Conveyor No. 3 (CV-F3) to RelocatableConveyor (CV-R1)
FiltTailPrt 3-03-024-08 F 42,804,687 tons 0.00002 0.00001 0.000002 lb/ton None 0% 0.52 0.52 0.25 0.25 0.04 0.04
TDS06 Relocatable Conveyor (CV-R1) to Shiftable Conveyor (CV-S1) FiltTailPrt 3-03-024-08 F 42,804,687 tons 0.00002 0.00001 0.000002 lb/ton None 0% 0.52 0.52 0.25 0.25 0.04 0.04
TDS07 Shiftable Conveyor (CV-S1) to Belt Wagon Conveyor(CV-BW1)
FiltTail 3-03-024-08 F 42,804,687 tons 0.0002 0.00009 0.00001 lb/ton None 0% 4.00 4.00 1.89 1.89 0.29 0.29
TDS08 Belt Wagon Conveyor (CV-BW1) to Spreader Crawler Mounted Conveyor (CV-SP1)
FiltTail 3-03-024-08 F 42,804,687 tons 0.0002 0.00009 0.00001 lb/ton None 0% 4.00 4.00 1.89 1.89 0.29 0.29
TDS09 Spreader Crawler Mounted Conveyor (CV-SP1) to Tailings Storage
FiltTail 3-03-024-08 F 42,804,687 tons 0.0002 0.00009 0.00001 lb/ton None 0% 4.00 4.00 1.89 1.89 0.29 0.29
TDS10 Wind Erosion of Tailings Storage TailStrg 3-03-888-01 F 1,500 acres 0.02 0.01 0.002 ton/acre-yr None 0% 30.23 30.23 15.11 15.11 2.27 2.27
Fuel Burning Equipment
FB01 Diesel Electrowinning Hot Water Generator (HWG) DFB 1-02-005-03 NF 8,760 hours 3.30 2.30 1.54 lb/1000 gal None 0% 0.63 0.63 0.44 0.44 0.30 0.30
6.0 MMBtu/hr
FB02 Thickener Area Emergency Generator (TEG) ICDE3 2-02-001-02 NF 500 hours 0.20 0.20 0.20 g/kW-hr None 0% 0.11 0.11 0.11 0.11 0.11 0.11
1,000 kW
FB03 PLS Pond Area Emergency Generator (PEG) ICDE3 2-02-001-02 NF 500 hours 0.20 0.20 0.20 g/kW-hr None 0% 0.11 0.11 0.11 0.11 0.11 0.11
1,000 kW
FB04 Main Substation Emergency Generator (MEG) ICDE3 2-02-001-02 NF 500 hours 0.20 0.20 0.20 g/kW-hr None 0% 0.08 0.08 0.08 0.08 0.08 0.08
750 kW
FB05 Administration Building Emergency Generator (AEG) ICDE3 2-02-001-02 NF 500 hours 0.20 0.20 0.20 g/kW-hr None 0% 0.08 0.08 0.08 0.08 0.08 0.08
750 kW
FB06 Electrowinning Building Emergency Generator (EWEG) ICDE1 2-02-001-02 NF 500 hours 0.40 0.40 0.40 g/kW-hr None 0% 0.01 0.01 0.01 0.01 0.01 0.01
50 kW
FB07 Primary Crusher Fire Water Pump (PCFWP) ICDE2 2-02-001-02 NF 500 hours 0.20 0.20 0.20 g/kW-hr None 0% 0.03 0.03 0.03 0.03 0.03 0.03
400 hp
Rosemont Copper ProjectEmission Inventory Information JBR ENVIRONMENTAL CONSULTANTS, INC.
November 2011Page H308
AZRP00490

PM/TSP PM10 PM2.5 Uncontrolled Controlled Uncontrolled Controlled Uncontrolled Controlled
PM/TSP Emissions (tpy) - Year 20 PM10 Emissions (tpy) - Year 20 PM2.5 Emissions (tpy) - Year 20Unit ID Unit Description Process Code EF Units
Pick-up or Control Eff. (%)
Emission Factors
Table H.80 Annual Particulate Emissions - Year 20Annual
Production Rate - Year 20
Control CodeRate UnitsSCC
Non-Fug. (NF) /
Fug. (F)
FB08 SX/EW Fire Water Pump (SXFWP) ICDE2 2-02-001-02 NF 500 hours 0.20 0.20 0.20 g/kW-hr None 0% 0.03 0.03 0.03 0.03 0.03 0.03
400 hp
Miscellaneous Sources
MS01 Transfer of Bulk Pebble Lime to the Bulk Pebble Lime Silo(S-BPL) LimeLd 3-05-016-26 NF 37,800 tons 0.61 0.29 0.04 lb/ton BPLSV a 90% 1.15 1.15 0.55 0.55 0.08 0.08
MS02 Bulk Pebble Lime Silo (S-BPL) to Bulk Pebble Lime Silo Screw Conveyor (CV-BPLS) ReagTr 3-03-024-04 NF 37,800 tons 0.008 0.004 0.0006 lb/ton Enclosed a 100% 0 0 0 0 0 0
MS03 Bulk Pebble Lime Silo Screw Conveyor (CV-BPLS) to SAGMill Feed Conveyor (CV-SMF)
ReagTr 3-03-024-04 NF 37,800 tons 0.008 0.004 0.0006 lb/ton None 0% 0.16 0.16 0.07 0.07 0.01 0.01
MS04 Transfer of Lime to the Lime Storage Bin (B-L) LimeLd 3-05-016-26 NF 18,900 tons 0.61 0.29 0.04 lb/ton LSV a 90% 0.58 0.58 0.27 0.27 0.04 0.04
MS05 Transfer of Sodium Metasilicate to the Sodium MetasilicateStorage Bin (B-SM)
ReagTr 3-03-024-04 NF 3,000 tons 0.008 0.004 0.0006 lb/ton SMSV a 90% 0.001 0.001 0.0006 0.0006 0.00009 0.00009
MS06 Transfer of Flocculant from Supersacks to Flocculant Storage Bins (B-F1/F2)
ReagTr 3-03-024-04 NF 1,100 tons 0.008 0.004 0.0006 lb/ton None 0% 0.005 0.005 0.002 0.002 0.0003 0.0003
MS07 Transfer of Guar from Bags to Guar Feeder (F-Gu) ReagTr 3-03-024-04 NF 150 tons 0.008 0.004 0.0006 lb/ton None 0% 0.0006 0.0006 0.0003 0.0003 0.00004 0.00004
MS08 Transfer of Granular Cobalt Sulfate from Bags to CobaltSulfate Feeder (F-CoS)
ReagTr 3-03-024-04 NF 6 tons 0.008 0.004 0.0006 lb/ton None 0% 0.00002 0.00002 0.00001 0.00001 0.000002 0.000002
Particulate Matter Pollution Control Equipment with Emission Limits
PCL01 Crushing Area Scrubber (PC-CAS) CAS none NF 8,760 hours 1.29 1.28 1.13 lb/hr -- -- -- 5.65 -- 5.61 -- 4.94
PCL02 Stockpile Area Scrubber (PC-SAS) SAS none NF 8,760 hours 2.61 2.59 2.10 lb/hr -- -- -- 11.45 -- 11.34 -- 9.18
PCL03 Reclaim Tunnel Scrubber (PC-RTS) RTS none NF 8,760 hours 1.08 1.07 0.87 lb/hr -- -- -- 4.73 -- 4.69 -- 3.79
PCL04 Pebble Crusher Area Scrubber (PC-PCAS) PCAS none NF 8,760 hours 1.58 1.56 1.31 lb/hr -- -- -- 6.94 -- 6.83 -- 5.75
PCL05 Copper Concentrate Scrubber 1 (PC-CCS1) CCS none NF 8,760 hours 3.59 3.55 3.04 lb/hr -- -- -- 15.71 -- 15.55 -- 13.33
PCL06 Copper Concentrate Scrubber 2 (PC-CCS2) CCS none NF 8,760 hours 3.59 3.55 3.04 lb/hr -- -- -- 15.71 -- 15.55 -- 13.33
PCL07 Molybdenum Scrubber (PC-MS) / Electrostatic Precipitator (PC-EP) MS/EP none NF 8,760 hours 0.015 0.014 0.013 lb/hr -- -- -- 0.07 -- 0.06 -- 0.06
PCL08 Molybdenum Dust Collector (PC-MDC) MDC none NF 653,597,276 dscf 0.02 0.010 0.002 gr/dscf -- -- -- 0.99 -- 0.47 -- 0.07
PCL09 Laboratory Dust Collector 1 (PC-L1) LDC none NF 4,357,315,176 dscf 0.008 0.005 0.002 gr/dscf -- -- -- 2.56 -- 1.56 -- 0.76
PCL10 Laboratory Dust Collector 2 (PC-L2) LDC none NF 4,357,315,176 dscf 0.008 0.005 0.002 gr/dscf -- -- -- 2.56 -- 1.56 -- 0.76
PCL11 Laboratory Dust Collector 3 (PC-L3) LDC none NF 4,357,315,176 dscf 0.008 0.005 0.002 gr/dscf -- -- -- 2.56 -- 1.56 -- 0.76
706.86 72.44 307.04 66.81 68.87 53.68
14,110.92 1,586.52 3,650.68 428.87 370.59 48.00
14,817.78 1,658.96 3,957.72 495.68 439.45 101.67
33.59 33.59 33.59 33.59 33.59 33.59
a The control efficiency for this emission unit is inherent to the process. Therefore, the control efficiency is applied to both uncontrolled and controlled emissions.
Tailpipe Emissions (see Tables H.86-H.88):
Total Emissions (excluding tailpipe emissions):
Total Non-Fugitive Emissions (excluding tailpipe emissions):
Total Fugitive Emissions (excluding tailpipe emissions):
Rosemont Copper ProjectEmission Inventory Information JBR ENVIRONMENTAL CONSULTANTS, INC.
November 2011Page H309
AZRP00491

PM/TSP PM10 PM2.5 Uncontrolled Controlled Uncontrolled Controlled Uncontrolled Controlled
Mining
MN01 Drilling Drilling 3-05-020-10 F 80 holes 1.30 0.43 0.08 lb/hole None 0% 0.05 0.05 0.02 0.02 0.003 0.003
MN02 Blasting Blast 3-05-020-09 F 1.0 blasts 328.26 170.69 9.85 lb/blast None 0% 0.16 0.16 0.09 0.09 0.005 0.005
MN03 Loading Concentrate Ore Loading 3-03-024-08 F 90,000 tons 0.0007 0.0003 0.00005 lb/ton None 0% 0.03 0.03 0.01 0.01 0.002 0.002
MN04 Loading Leach Ore Loading 3-03-024-08 F 0 tons 0.0007 0.0003 0.00005 lb/ton None 0% 0 0 0 0 0 0
MN05 Loading Waste Rock Loading 3-03-024-08 F 14,400 tons 0.0007 0.0003 0.00005 lb/ton None 0% 0.005 0.005 0.002 0.002 0.0004 0.0004
MN06a Hauling Concentrate Ore to Primary Crusher Dump Hopper / Run of Mine Stockpile (Inside the Pit)
HaulingHD 3-05-020-11 F 2,287 VMT 21.25 5.46 0.55 lb/VMT HaulRdUI 90% 24.29 2.43 6.24 0.62 0.62 0.06
MN06b Hauling Concentrate Ore to Primary Crusher Dump Hopper / Run of Mine Stockpile (Outside the Pit)
HaulingHD 3-05-020-11 F 627 VMT 21.25 5.46 0.55 lb/VMT HaulRdUO 90% 6.66 0.67 1.71 0.17 0.17 0.02
MN07a Hauling Leach Ore to Leach Pad (Inside the Pit) HaulingHD 3-05-020-11 F 0 VMT 21.25 5.46 0.55 lb/VMT HaulRdUI 90% 0 0 0 0 0 0
MN07b Hauling Leach Ore to Leach Pad (Outside the Pit) HaulingHD 3-05-020-11 F 0 VMT 21.25 5.46 0.55 lb/VMT HaulRdUO 90% 0 0 0 0 0 0
MN08a Hauling Waste Rock to Waste Rock Storage Area (Inside the Pit)
HaulingHD 3-05-020-11 F 395 VMT 21.25 5.46 0.55 lb/VMT HaulRdUI 90% 4.20 0.42 1.08 0.11 0.11 0.01
MN08b Hauling Waste Rock to Waste Rock Storage Area (Outside the Pit)
HaulingHD 3-05-020-11 F 354 VMT 21.25 5.46 0.55 lb/VMT HaulRdUO 90% 3.76 0.38 0.97 0.10 0.10 0.01
MN09 Unloading Concentrate Ore to Run of Mine Stockpile TrStnUnp 3-03-024-08 F 90,000 tons 0.001 0.0006 0.00009 lb/ton None 0% 0.05 0.05 0.03 0.03 0.004 0.004
MN10 Unloading Leach Ore to Leach Pad TrStnUnp 3-03-024-08 F 0 tons 0.001 0.0006 0.00009 lb/ton None 0% 0 0 0 0 0 0
MN11 Unloading Waste Rock to Waste Rock Storage Area TrStnUnp 3-03-024-08 F 14,400 tons 0.001 0.0006 0.00009 lb/ton None 0% 0.009 0.009 0.004 0.004 0.0006 0.0006
MN12 Bulldozer Use Bldzrs 3-05-010-99 F 84 hrs 2.82 0.43 0.30 lb/hr None 0% 0.12 0.12 0.02 0.02 0.01 0.01
MN13a Water Truck Use (Inside the Pit) WtrTrksHD 3-05-010-99 F 212 VMT 17.06 4.38 0.44 lb/VMT HaulRdWTI 90% 1.81 0.18 0.46 0.05 0.05 0.005
MN13b Water Truck Use (Outside the Pit) WtrTrksHD 3-05-010-99 F 77 VMT 17.06 4.38 0.44 lb/VMT HaulRdWTO 90% 0.66 0.07 0.17 0.02 0.02 0.002
MN14 Grader Use GradersY20 3-05-010-99 F 163 VMT 2.18 0.75 0.07 lb/VMT None 0% 0.18 0.18 0.06 0.06 0.006 0.006
MN15a Support Vehicle Use (Inside the Pit) SupVehY20D 3-05-010-99 F 1,857 VMT 7.19 1.85 0.18 lb/VMT HaulRdUI 90% 6.67 0.67 1.71 0.17 0.17 0.02
MN15b Support Vehicle Use (Outside the Pit) SupVehY20D 3-05-010-99 F 1,857 VMT 7.19 1.85 0.18 lb/VMT HaulRdUO 90% 6.67 0.67 1.71 0.17 0.17 0.02
Primary Crushing, Conveying, Coarse Ore Storage, and Reclaim Conveying
PC01 Wind Erosion of the Run of Mine Stockpile WindROM 3-03-888-01 F 26 acres 0.21 0.11 0.02 ton/acre-yr None 0% 0.01 0.01 0.007 0.007 0.001 0.001
PC02 Unloading to Primary Crusher Dump Hopper (H-CDp) fromHaul Trucks or Run of Mine Stockpile
TrStnUnp 3-03-024-08 F 166,800 tons 0.001 0.0006 0.00009 lb/ton WSpry 82.5% 0.10 0.02 0.05 0.008 0.01 0.001
PC03 Primary Crusher (PCr) CrushP 3-03-024-05 NF 166,800 tons 0.02 0.009 0.002 lb/ton CAS 100% 1.67 0 0.75 0 0.14 0
PC04 Primary Crusher (PCr) to Crusher Discharge Hopper (H-CDs) TrStnPrt 3-03-024-08 NF 166,800 tons 0.0002 0.00007 0.00001 lb/ton Enclosed a 100% 0 0 0 0 0 0
PC05 Crusher Discharge Hopper (H-CDs) to Crusher DischargeFeeder (F-CD)
TrStnPrt 3-03-024-08 NF 166,800 tons 0.0002 0.00007 0.00001 lb/ton CAS 100% 0.01 0 0.006 0 0.0009 0
PC06 Crusher Discharge Feeder (F-CD) to Stockpile FeedConveyor (CV-SF)
TrStnPrt 3-03-024-08 NF 166,800 tons 0.0002 0.00007 0.00001 lb/ton CAS 100% 0.01 0 0.006 0 0.0009 0
PC07 Stockpile Feed Conveyor (CV-SF) to Stockpile TripperConveyor (CV-ST)
TrStnPrt 3-03-024-08 NF 166,800 tons 0.0002 0.00007 0.00001 lb/ton SAS 100% 0.01 0 0.006 0 0.0009 0
Table H.81 Maximum Daily Particulate Emissions - Year 20
PM/TSP Emissions (tpd) - Year 20 PM10 Emissions (tpd) - Year 20 PM2.5 Emissions (tpd) - Year 20Pick-up or Control Eff. (%)
Rate UnitsNon-Fug.
(NF) / Fug. (F)
Emission FactorsUnit ID Unit Description Process Code SCC EF Units Control
CodeDaily Production Rate - Year 20
Rosemont Copper ProjectEmission Inventory Information JBR ENVIRONMENTAL CONSULTANTS, INC.
November 2011Page H310
AZRP00492

PM/TSP PM10 PM2.5 Uncontrolled Controlled Uncontrolled Controlled Uncontrolled Controlled
Table H.81 Maximum Daily Particulate Emissions - Year 20
PM/TSP Emissions (tpd) - Year 20 PM10 Emissions (tpd) - Year 20 PM2.5 Emissions (tpd) - Year 20Pick-up or Control Eff. (%)
Rate UnitsNon-Fug.
(NF) / Fug. (F)
Emission FactorsUnit ID Unit Description Process Code SCC EF Units Control
CodeDaily Production Rate - Year 20
PC08 Stockpile Tripper Conveyor (CV-ST) to Covered Coarse Ore Stockpile
TrStnPrt 3-03-024-08 F 166,800 tons 0.0002 0.00007 0.00001 lb/ton SAS 100% 0.01 0 0.006 0 0.0009 0
PC09 Wind Erosion of the Coarse Ore Stockpile WindCvd 3-03-888-01 F 5 acres 0 0 0 ton/acre-yr Enclosed a 100% 0 0 0 0 0 0
PC10 Coarse Ore Stockpile to Reclaim Feeders (F-R1/R4) TrStnPrt 3-03-024-08 NF 166,800 tons 0.0002 0.00007 0.00001 lb/ton UndrGrd a 100% 0 0 0 0 0 0
PC11 Reclaim Feeders (F-R1/R4) to Reclaim Conveyor (CV-R) TrStnPrt 3-03-024-08 NF 166,800 tons 0.0002 0.00007 0.00001 lb/ton RTS 100% 0.01 0 0.006 0 0.0009 0
PC12 Reclaim Conveyor (CV-R) to SAG Mill Feed Conveyor(CV-SMF) TrStnPrt 3-03-024-08 NF 166,800 tons 0.0002 0.00007 0.00001 lb/ton PCAS 100% 0.01 0 0.006 0 0.0009 0
PC13 Pebble Conveyor No. 3 (CV-Pb3) to SAG Mill Feed Conveyor (CV-SMF)
TrStnPrt 3-03-024-08 NF 42,508 tons 0.0002 0.00007 0.00001 lb/ton PCAS 100% 0.003 0 0.002 0 0.0002 0
PC14 SAG Mill Feed Conveyor (CV-SMF) to SAG Mill (M-SAG) TrStnPrt 3-03-024-08 NF 209,432 tons 0.0002 0.00007 0.00001 lb/ton Water a 100% 0 0 0 0 0 0
Milling
M01 SAG Mill (M-SAG) CrushS 3-03-024-06 NF 209,432 tons 0.05 0.02 0.004 lb/ton Wet a 100% 0 0 0 0 0 0
M02 SAG Mill (M-SAG) to Trommel Screen (Sn-T) TrStnPrt 3-03-024-08 NF 209,432 tons 0.0002 0.00007 0.00001 lb/ton Enclosed a 100% 0 0 0 0 0 0
M03 Trommel Screen (Sn-T) Screen 3-05-020-02 NF 209,432 tons 0.025 0.0087 0.0006 lb/ton Wet a 100% 0 0 0 0 0 0
M04 Trommel Screen (Sn-T) to Pebble Conveyor No. 1 (CV-Pb1) TrStnPrt 3-03-024-08 NF 44,426 tons 0.0002 0.00007 0.00001 lb/ton Clean a 100% 0 0 0 0 0 0
M05 Pebble Conveyor No. 1 (CV-Pb1) to Pebble Wash Screen(Sn-PbW)
TrStnPrt 3-03-024-08 NF 44,426 tons 0.0002 0.00007 0.00001 lb/ton Clean a 100% 0 0 0 0 0 0
M06 Pebble Wash Screen (Sn-PbW) Screen 3-05-020-02 NF 44,426 tons 0.025 0.0087 0.0006 lb/ton Wet a 100% 0 0 0 0 0 0
M07 Pebble Wash Screen (Sn-PbW) to Pebble Conveyor No. 2 TrStnPrt 3-03-024-08 NF 42,508 tons 0.0002 0.00007 0.00001 lb/ton Clean a 100% 0 0 0 0 0 0
M08 Pebble Conveyor No. 2 (CV-Pb2) to SAG Oversize Surge Bin(B-SAGOS) TrStnPrt 3-03-024-08 NF 42,508 tons 0.0002 0.00007 0.00001 lb/ton PCAS 100% 0.003 0 0.002 0 0.0002 0
M09 SAG Oversize Surge Bin (B-SAGOS) to Pebble CrusherFeeder (F-PbC)
TrStnPrt 3-03-024-08 NF 42,508 tons 0.0002 0.00007 0.00001 lb/ton PCAS 100% 0.003 0 0.002 0 0.0002 0
M10 Pebble Crusher Feeder (F-PbC) to Pebble Crusher (PbC) TrStnPrt 3-03-024-08 NF 42,508 tons 0.0002 0.00007 0.00001 lb/ton Enclosed a 100% 0 0 0 0 0 0
M11 Pebble Crusher (PbC) CrushT 3-03-024-07 NF 42,508 tons 0.06 0.02 0.004 lb/ton PCAS 100% 1.28 0 0.43 0 0.08 0
M12 Pebble Crusher (PbC) to Pebble Conveyor No. 3 (CV-Pb3) TrStnPrt 3-03-024-08 NF 42,508 tons 0.0002 0.00007 0.00001 lb/ton PCAS 100% 0.003 0 0.002 0 0.0002 0
Copper Concentrate Dewatering and Stacking
CCD01 Copper Concentrate Filters (Ft-CC1/CC4) to Copper Concentrate Conveyor (CV-CC) TrCuCncPrt 3-03-024-08 NF 3,312 tons 0.00004 0.00002 0.000003 lb/ton Enclosed a 100% 0 0 0 0 0 0
CCD02 Copper Concentrate Conveyor (CV-CC) to Copper Concentrate Loadout Stockpile
TrCuCncPrt 3-03-024-08 F 3,312 tons 0.00004 0.00002 0.000003 lb/ton CCS 100% 0.00007 0 0.00003 0 0.000005 0
CCD03 Wind Erosion of Copper Concentrate Loadout Stockpile WindCvd 3-03-888-01 F 1.17 acres 0 0 0 ton/acre-yr Enclosed a 100% 0 0 0 0 0 0
CCD04 Copper Concentrate Loadout Stockpile to Shipment Truck via Front End Loaders
TrCuCncPrt 3-03-024-08 F 3,312 tons 0.00004 0.00002 0.000003 lb/ton CCS 100% 0.00007 0 0.00003 0 0.000005 0
Molybdenum Dewatering and Packaging
MD01 Molybdenum Concentrate Filter (Ft-MC) to Molybdenum Concentrate Dryer (D-MC)
TrMlyCncPrt 3-03-024-08 NF 45.6 tons 0.00002 0.00001 0.000002 lb/ton Enclosed a 100% 0 0 0 0 0 0
MD02 Molybdenum Concentrate Dryer MolyDry 3-03-024-11 NF 45.6 tons 19.70 12.00 5.91 lb/ton MS/EP 100% 0.45 0 0.27 0 0.13 0
MD03 Molybdenum Concentrate Dryer (D-MC) to MolybdenumConcentrate Bin (B-MC)
DTrMlyCncPrt 3-03-024-08 NF 45.6 tons 0.00004 0.00002 0.000003 lb/ton MDC 100% 0.000001 0 0.0000005 0 0.00000007 0
Rosemont Copper ProjectEmission Inventory Information JBR ENVIRONMENTAL CONSULTANTS, INC.
November 2011Page H311
AZRP00493
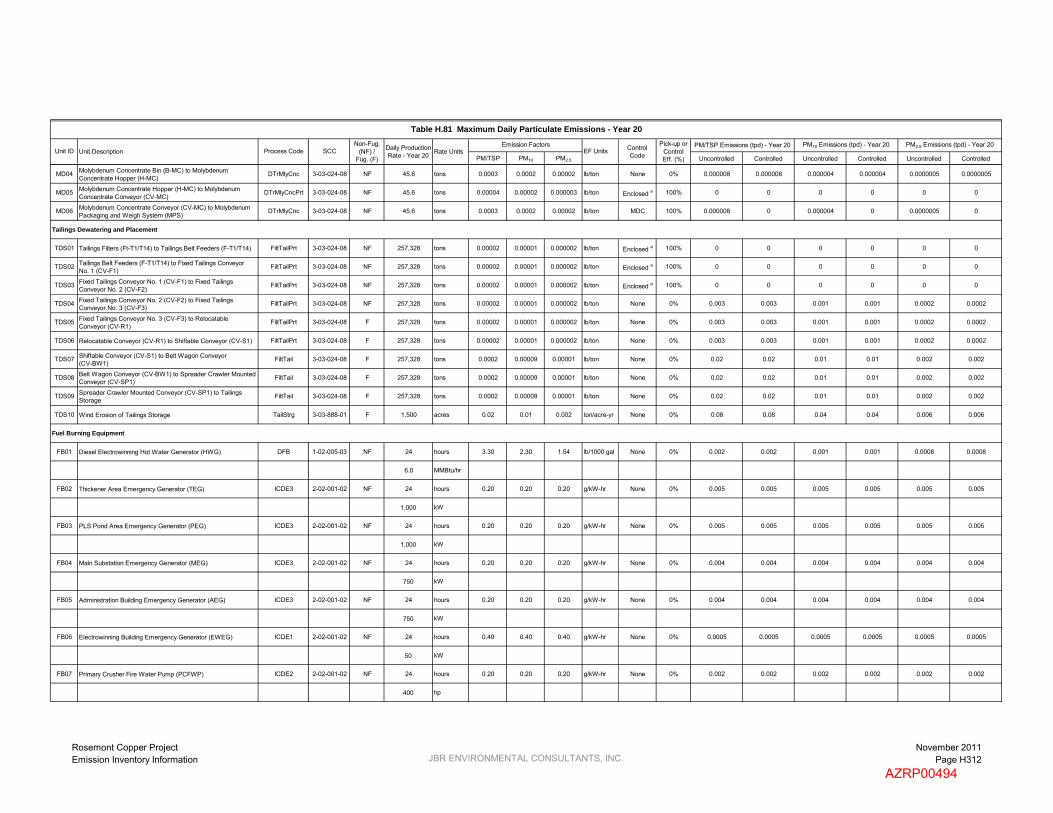
PM/TSP PM10 PM2.5 Uncontrolled Controlled Uncontrolled Controlled Uncontrolled Controlled
Table H.81 Maximum Daily Particulate Emissions - Year 20
PM/TSP Emissions (tpd) - Year 20 PM10 Emissions (tpd) - Year 20 PM2.5 Emissions (tpd) - Year 20Pick-up or Control Eff. (%)
Rate UnitsNon-Fug.
(NF) / Fug. (F)
Emission FactorsUnit ID Unit Description Process Code SCC EF Units Control
CodeDaily Production Rate - Year 20
MD04 Molybdenum Concentrate Bin (B-MC) to MolybdenumConcentrate Hopper (H-MC)
DTrMlyCnc 3-03-024-08 NF 45.6 tons 0.0003 0.0002 0.00002 lb/ton None 0% 0.000008 0.000008 0.000004 0.000004 0.0000005 0.0000005
MD05 Molybdenum Concentrate Hopper (H-MC) to MolybdenumConcentrate Conveyor (CV-MC)
DTrMlyCncPrt 3-03-024-08 NF 45.6 tons 0.00004 0.00002 0.000003 lb/ton Enclosed a 100% 0 0 0 0 0 0
MD06 Molybdenum Concentrate Conveyor (CV-MC) to Molybdenum Packaging and Weigh System (MPS)
DTrMlyCnc 3-03-024-08 NF 45.6 tons 0.0003 0.0002 0.00002 lb/ton MDC 100% 0.000008 0 0.000004 0 0.0000005 0
Tailings Dewatering and Placement
TDS01 Tailings Filters (Ft-T1/T14) to Tailings Belt Feeders (F-T1/T14) FiltTailPrt 3-03-024-08 NF 257,328 tons 0.00002 0.00001 0.000002 lb/ton Enclosed a 100% 0 0 0 0 0 0
TDS02 Tailings Belt Feeders (F-T1/T14) to Fixed Tailings ConveyorNo. 1 (CV-F1)
FiltTailPrt 3-03-024-08 NF 257,328 tons 0.00002 0.00001 0.000002 lb/ton Enclosed a 100% 0 0 0 0 0 0
TDS03 Fixed Tailings Conveyor No. 1 (CV-F1) to Fixed TailingsConveyor No. 2 (CV-F2)
FiltTailPrt 3-03-024-08 NF 257,328 tons 0.00002 0.00001 0.000002 lb/ton Enclosed a 100% 0 0 0 0 0 0
TDS04 Fixed Tailings Conveyor No. 2 (CV-F2) to Fixed Tailings Conveyor No. 3 (CV-F3)
FiltTailPrt 3-03-024-08 NF 257,328 tons 0.00002 0.00001 0.000002 lb/ton None 0% 0.003 0.003 0.001 0.001 0.0002 0.0002
TDS05 Fixed Tailings Conveyor No. 3 (CV-F3) to RelocatableConveyor (CV-R1)
FiltTailPrt 3-03-024-08 F 257,328 tons 0.00002 0.00001 0.000002 lb/ton None 0% 0.003 0.003 0.001 0.001 0.0002 0.0002
TDS06 Relocatable Conveyor (CV-R1) to Shiftable Conveyor (CV-S1) FiltTailPrt 3-03-024-08 F 257,328 tons 0.00002 0.00001 0.000002 lb/ton None 0% 0.003 0.003 0.001 0.001 0.0002 0.0002
TDS07 Shiftable Conveyor (CV-S1) to Belt Wagon Conveyor(CV-BW1)
FiltTail 3-03-024-08 F 257,328 tons 0.0002 0.00009 0.00001 lb/ton None 0% 0.02 0.02 0.01 0.01 0.002 0.002
TDS08 Belt Wagon Conveyor (CV-BW1) to Spreader Crawler Mounted Conveyor (CV-SP1)
FiltTail 3-03-024-08 F 257,328 tons 0.0002 0.00009 0.00001 lb/ton None 0% 0.02 0.02 0.01 0.01 0.002 0.002
TDS09 Spreader Crawler Mounted Conveyor (CV-SP1) to Tailings Storage
FiltTail 3-03-024-08 F 257,328 tons 0.0002 0.00009 0.00001 lb/ton None 0% 0.02 0.02 0.01 0.01 0.002 0.002
TDS10 Wind Erosion of Tailings Storage TailStrg 3-03-888-01 F 1,500 acres 0.02 0.01 0.002 ton/acre-yr None 0% 0.08 0.08 0.04 0.04 0.006 0.006
Fuel Burning Equipment
FB01 Diesel Electrowinning Hot Water Generator (HWG) DFB 1-02-005-03 NF 24 hours 3.30 2.30 1.54 lb/1000 gal None 0% 0.002 0.002 0.001 0.001 0.0008 0.0008
6.0 MMBtu/hr
FB02 Thickener Area Emergency Generator (TEG) ICDE3 2-02-001-02 NF 24 hours 0.20 0.20 0.20 g/kW-hr None 0% 0.005 0.005 0.005 0.005 0.005 0.005
1,000 kW
FB03 PLS Pond Area Emergency Generator (PEG) ICDE3 2-02-001-02 NF 24 hours 0.20 0.20 0.20 g/kW-hr None 0% 0.005 0.005 0.005 0.005 0.005 0.005
1,000 kW
FB04 Main Substation Emergency Generator (MEG) ICDE3 2-02-001-02 NF 24 hours 0.20 0.20 0.20 g/kW-hr None 0% 0.004 0.004 0.004 0.004 0.004 0.004
750 kW
FB05 Administration Building Emergency Generator (AEG) ICDE3 2-02-001-02 NF 24 hours 0.20 0.20 0.20 g/kW-hr None 0% 0.004 0.004 0.004 0.004 0.004 0.004
750 kW
FB06 Electrowinning Building Emergency Generator (EWEG) ICDE1 2-02-001-02 NF 24 hours 0.40 0.40 0.40 g/kW-hr None 0% 0.0005 0.0005 0.0005 0.0005 0.0005 0.0005
50 kW
FB07 Primary Crusher Fire Water Pump (PCFWP) ICDE2 2-02-001-02 NF 24 hours 0.20 0.20 0.20 g/kW-hr None 0% 0.002 0.002 0.002 0.002 0.002 0.002
400 hp
Rosemont Copper ProjectEmission Inventory Information JBR ENVIRONMENTAL CONSULTANTS, INC.
November 2011Page H312
AZRP00494

PM/TSP PM10 PM2.5 Uncontrolled Controlled Uncontrolled Controlled Uncontrolled Controlled
Table H.81 Maximum Daily Particulate Emissions - Year 20
PM/TSP Emissions (tpd) - Year 20 PM10 Emissions (tpd) - Year 20 PM2.5 Emissions (tpd) - Year 20Pick-up or Control Eff. (%)
Rate UnitsNon-Fug.
(NF) / Fug. (F)
Emission FactorsUnit ID Unit Description Process Code SCC EF Units Control
CodeDaily Production Rate - Year 20
FB08 SX/EW Fire Water Pump (SXFWP) ICDE2 2-02-001-02 NF 24 hours 0.20 0.20 0.20 g/kW-hr None 0% 0.002 0.002 0.002 0.002 0.002 0.002
400 hp
Miscellaneous Sources
MS01 Transfer of Bulk Pebble Lime to the Bulk Pebble Lime Silo(S-BPL) LimeLd 3-05-016-26 NF 124.27 tons 0.61 0.29 0.04 lb/ton BPLSV a 90% 0.004 0.004 0.002 0.002 0.0003 0.0003
MS02 Bulk Pebble Lime Silo (S-BPL) to Bulk Pebble Lime Silo Screw Conveyor (CV-BPLS) ReagTr 3-03-024-04 NF 124.27 tons 0.008 0.004 0.0006 lb/ton Enclosed a 100% 0 0 0 0 0 0
MS03 Bulk Pebble Lime Silo Screw Conveyor (CV-BPLS) to SAGMill Feed Conveyor (CV-SMF)
ReagTr 3-03-024-04 NF 124.27 tons 0.008 0.004 0.0006 lb/ton None 0% 0.0005 0.0005 0.0002 0.0002 0.00004 0.00004
MS04 Transfer of Lime to the Lime Storage Bin (B-L) LimeLd 3-05-016-26 NF 62.14 tons 0.61 0.29 0.04 lb/ton LSV a 90% 0.002 0.002 0.0009 0.0009 0.0001 0.0001
MS05 Transfer of Sodium Metasilicate to the Sodium MetasilicateStorage Bin (B-SM)
ReagTr 3-03-024-04 NF 9.86 tons 0.008 0.004 0.0006 lb/ton SMSV a 90% 0.000004 0.000004 0.000002 0.000002 0.0000003 0.0000003
MS06 Transfer of Flocculant from Supersacks to Flocculant Storage Bins (B-F1/F2)
ReagTr 3-03-024-04 NF 3.62 tons 0.008 0.004 0.0006 lb/ton None 0% 0.00001 0.00001 0.000007 0.000007 0.000001 0.000001
MS07 Transfer of Guar from Bags to Guar Feeder (F-Gu) ReagTr 3-03-024-04 NF 0.49 tons 0.008 0.004 0.0006 lb/ton None 0% 0.000002 0.000002 0.000001 0.000001 0.0000001 0.0000001
MS08 Transfer of Granular Cobalt Sulfate from Bags to CobaltSulfate Feeder (F-CoS)
ReagTr 3-03-024-04 NF 0.02 tons 0.008 0.004 0.0006 lb/ton None 0% 0.00000008 0.00000008 0.00000004 0.00000004 0.000000006 0.000000006
Particulate Matter Pollution Control Equipment with Emission Limits
PCL01 Crushing Area Scrubber (PC-CAS) CAS none NF 24 hours 1.29 1.28 1.13 lb/hr -- -- -- 0.02 -- 0.02 -- 0.01
PCL02 Stockpile Area Scrubber (PC-SAS) SAS none NF 24 hours 2.61 2.59 2.10 lb/hr -- -- -- 0.03 -- 0.03 -- 0.03
PCL03 Reclaim Tunnel Scrubber (PC-RTS) RTS none NF 24 hours 1.08 1.07 0.87 lb/hr -- -- -- 0.01 -- 0.01 -- 0.01
PCL04 Pebble Crusher Area Scrubber (PC-PCAS) PCAS none NF 24 hours 1.58 1.56 1.31 lb/hr -- -- -- 0.02 -- 0.02 -- 0.02
PCL05 Copper Concentrate Scrubber 1 (PC-CCS1) CCS none NF 24 hours 3.59 3.55 3.04 lb/hr -- -- -- 0.04 -- 0.04 -- 0.04
PCL06 Copper Concentrate Scrubber 2 (PC-CCS2) CCS none NF 24 hours 3.59 3.55 3.04 lb/hr -- -- -- 0.04 -- 0.04 -- 0.04
PCL07 Molybdenum Scrubber (PC-MS) / Electrostatic Precipitator (PC-EP) MS/EP none NF 24 hours 0.015 0.014 0.013 lb/hr -- -- -- 0.0002 -- 0.0002 -- 0.0002
PCL08 Molybdenum Dust Collector (PC-MDC) MDC none NF 1,790,677 dscf 0.02 0.010 0.002 gr/dscf -- -- -- 0.003 -- 0.001 -- 0.0002
PCL09 Laboratory Dust Collector 1 (PC-L1) LDC none NF 11,937,850 dscf 0.008 0.005 0.002 gr/dscf -- -- -- 0.007 -- 0.004 -- 0.002
PCL10 Laboratory Dust Collector 2 (PC-L2) LDC none NF 11,937,850 dscf 0.008 0.005 0.002 gr/dscf -- -- -- 0.007 -- 0.004 -- 0.002
PCL11 Laboratory Dust Collector 3 (PC-L3) LDC none NF 11,937,850 dscf 0.008 0.005 0.002 gr/dscf -- -- -- 0.007 -- 0.004 -- 0.002
3.50 0.22 1.51 0.21 0.38 0.17
55.62 6.28 14.43 1.73 1.46 0.19
59.12 6.50 15.94 1.93 1.84 0.36
0.12 0.12 0.12 0.12 0.12 0.12
a The control efficiency for this emission unit is inherent to the process. Therefore, the control efficiency is applied to both uncontrolled and controlled emissions.
Tailpipe Emissions (see Tables H.86-H.88):
Total Emissions (excluding tailpipe emissions):
Total Non-Fugitive Emissions (excluding tailpipe emissions):
Total Fugitive Emissions (excluding tailpipe emissions):
Rosemont Copper ProjectEmission Inventory Information JBR ENVIRONMENTAL CONSULTANTS, INC.
November 2011Page H313
AZRP00495
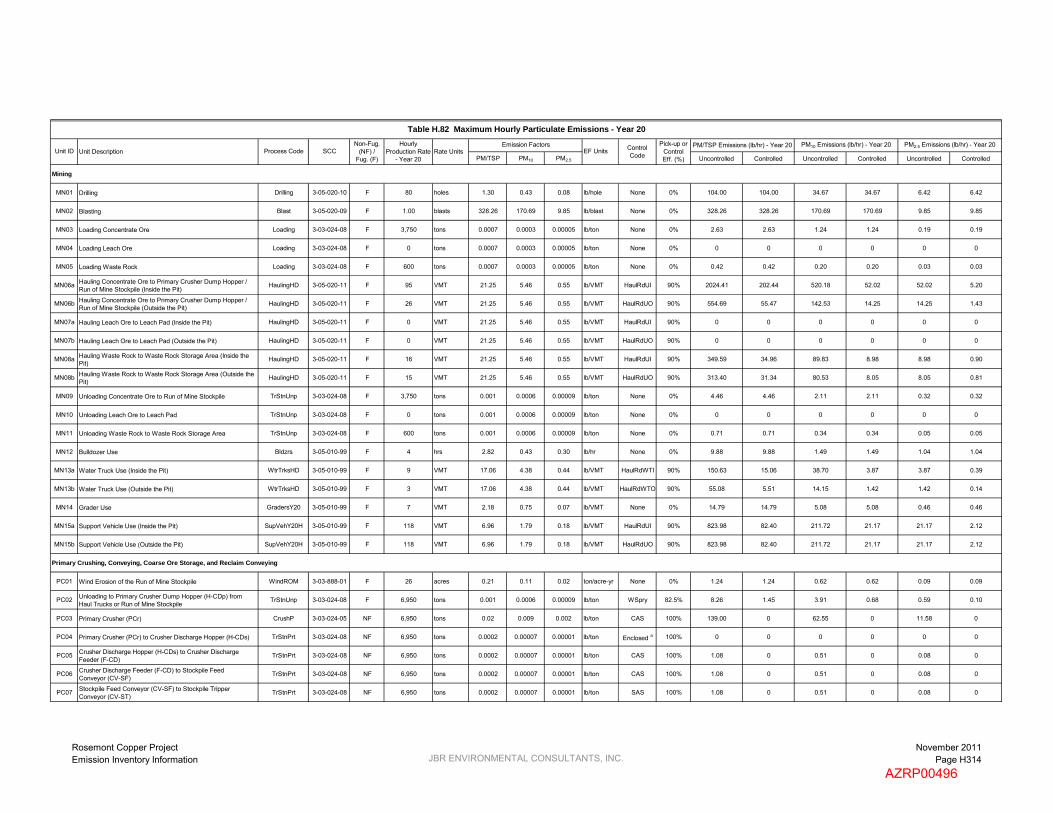
PM/TSP PM10 PM2.5 Uncontrolled Controlled Uncontrolled Controlled Uncontrolled Controlled
Mining
MN01 Drilling Drilling 3-05-020-10 F 80 holes 1.30 0.43 0.08 lb/hole None 0% 104.00 104.00 34.67 34.67 6.42 6.42
MN02 Blasting Blast 3-05-020-09 F 1.00 blasts 328.26 170.69 9.85 lb/blast None 0% 328.26 328.26 170.69 170.69 9.85 9.85
MN03 Loading Concentrate Ore Loading 3-03-024-08 F 3,750 tons 0.0007 0.0003 0.00005 lb/ton None 0% 2.63 2.63 1.24 1.24 0.19 0.19
MN04 Loading Leach Ore Loading 3-03-024-08 F 0 tons 0.0007 0.0003 0.00005 lb/ton None 0% 0 0 0 0 0 0
MN05 Loading Waste Rock Loading 3-03-024-08 F 600 tons 0.0007 0.0003 0.00005 lb/ton None 0% 0.42 0.42 0.20 0.20 0.03 0.03
MN06a Hauling Concentrate Ore to Primary Crusher Dump Hopper / Run of Mine Stockpile (Inside the Pit)
HaulingHD 3-05-020-11 F 95 VMT 21.25 5.46 0.55 lb/VMT HaulRdUI 90% 2024.41 202.44 520.18 52.02 52.02 5.20
MN06b Hauling Concentrate Ore to Primary Crusher Dump Hopper / Run of Mine Stockpile (Outside the Pit)
HaulingHD 3-05-020-11 F 26 VMT 21.25 5.46 0.55 lb/VMT HaulRdUO 90% 554.69 55.47 142.53 14.25 14.25 1.43
MN07a Hauling Leach Ore to Leach Pad (Inside the Pit) HaulingHD 3-05-020-11 F 0 VMT 21.25 5.46 0.55 lb/VMT HaulRdUI 90% 0 0 0 0 0 0
MN07b Hauling Leach Ore to Leach Pad (Outside the Pit) HaulingHD 3-05-020-11 F 0 VMT 21.25 5.46 0.55 lb/VMT HaulRdUO 90% 0 0 0 0 0 0
MN08a Hauling Waste Rock to Waste Rock Storage Area (Inside the Pit)
HaulingHD 3-05-020-11 F 16 VMT 21.25 5.46 0.55 lb/VMT HaulRdUI 90% 349.59 34.96 89.83 8.98 8.98 0.90
MN08b Hauling Waste Rock to Waste Rock Storage Area (Outside the Pit)
HaulingHD 3-05-020-11 F 15 VMT 21.25 5.46 0.55 lb/VMT HaulRdUO 90% 313.40 31.34 80.53 8.05 8.05 0.81
MN09 Unloading Concentrate Ore to Run of Mine Stockpile TrStnUnp 3-03-024-08 F 3,750 tons 0.001 0.0006 0.00009 lb/ton None 0% 4.46 4.46 2.11 2.11 0.32 0.32
MN10 Unloading Leach Ore to Leach Pad TrStnUnp 3-03-024-08 F 0 tons 0.001 0.0006 0.00009 lb/ton None 0% 0 0 0 0 0 0
MN11 Unloading Waste Rock to Waste Rock Storage Area TrStnUnp 3-03-024-08 F 600 tons 0.001 0.0006 0.00009 lb/ton None 0% 0.71 0.71 0.34 0.34 0.05 0.05
MN12 Bulldozer Use Bldzrs 3-05-010-99 F 4 hrs 2.82 0.43 0.30 lb/hr None 0% 9.88 9.88 1.49 1.49 1.04 1.04
MN13a Water Truck Use (Inside the Pit) WtrTrksHD 3-05-010-99 F 9 VMT 17.06 4.38 0.44 lb/VMT HaulRdWTI 90% 150.63 15.06 38.70 3.87 3.87 0.39
MN13b Water Truck Use (Outside the Pit) WtrTrksHD 3-05-010-99 F 3 VMT 17.06 4.38 0.44 lb/VMT HaulRdWTO 90% 55.08 5.51 14.15 1.42 1.42 0.14
MN14 Grader Use GradersY20 3-05-010-99 F 7 VMT 2.18 0.75 0.07 lb/VMT None 0% 14.79 14.79 5.08 5.08 0.46 0.46
MN15a Support Vehicle Use (Inside the Pit) SupVehY20H 3-05-010-99 F 118 VMT 6.96 1.79 0.18 lb/VMT HaulRdUI 90% 823.98 82.40 211.72 21.17 21.17 2.12
MN15b Support Vehicle Use (Outside the Pit) SupVehY20H 3-05-010-99 F 118 VMT 6.96 1.79 0.18 lb/VMT HaulRdUO 90% 823.98 82.40 211.72 21.17 21.17 2.12
Primary Crushing, Conveying, Coarse Ore Storage, and Reclaim Conveying
PC01 Wind Erosion of the Run of Mine Stockpile WindROM 3-03-888-01 F 26 acres 0.21 0.11 0.02 ton/acre-yr None 0% 1.24 1.24 0.62 0.62 0.09 0.09
PC02 Unloading to Primary Crusher Dump Hopper (H-CDp) fromHaul Trucks or Run of Mine Stockpile
TrStnUnp 3-03-024-08 F 6,950 tons 0.001 0.0006 0.00009 lb/ton WSpry 82.5% 8.26 1.45 3.91 0.68 0.59 0.10
PC03 Primary Crusher (PCr) CrushP 3-03-024-05 NF 6,950 tons 0.02 0.009 0.002 lb/ton CAS 100% 139.00 0 62.55 0 11.58 0
PC04 Primary Crusher (PCr) to Crusher Discharge Hopper (H-CDs) TrStnPrt 3-03-024-08 NF 6,950 tons 0.0002 0.00007 0.00001 lb/ton Enclosed a 100% 0 0 0 0 0 0
PC05 Crusher Discharge Hopper (H-CDs) to Crusher DischargeFeeder (F-CD)
TrStnPrt 3-03-024-08 NF 6,950 tons 0.0002 0.00007 0.00001 lb/ton CAS 100% 1.08 0 0.51 0 0.08 0
PC06 Crusher Discharge Feeder (F-CD) to Stockpile FeedConveyor (CV-SF)
TrStnPrt 3-03-024-08 NF 6,950 tons 0.0002 0.00007 0.00001 lb/ton CAS 100% 1.08 0 0.51 0 0.08 0
PC07 Stockpile Feed Conveyor (CV-SF) to Stockpile TripperConveyor (CV-ST)
TrStnPrt 3-03-024-08 NF 6,950 tons 0.0002 0.00007 0.00001 lb/ton SAS 100% 1.08 0 0.51 0 0.08 0
PM2.5 Emissions (lb/hr) - Year 20Emission Factors
Table H.82 Maximum Hourly Particulate Emissions - Year 20Hourly
Production Rate - Year 20
SCC EF UnitsPM10 Emissions (lb/hr) - Year 20
Unit Description Control Code
PM/TSP Emissions (lb/hr) - Year 20Process CodeUnit ID
Pick-up or Control Eff. (%)
Non-Fug. (NF) /
Fug. (F)Rate Units
Rosemont Copper ProjectEmission Inventory Information JBR ENVIRONMENTAL CONSULTANTS, INC.
November 2011Page H314
AZRP00496

PM/TSP PM10 PM2.5 Uncontrolled Controlled Uncontrolled Controlled Uncontrolled Controlled
PM2.5 Emissions (lb/hr) - Year 20Emission Factors
Table H.82 Maximum Hourly Particulate Emissions - Year 20Hourly
Production Rate - Year 20
SCC EF UnitsPM10 Emissions (lb/hr) - Year 20
Unit Description Control Code
PM/TSP Emissions (lb/hr) - Year 20Process CodeUnit ID
Pick-up or Control Eff. (%)
Non-Fug. (NF) /
Fug. (F)Rate Units
PC08 Stockpile Tripper Conveyor (CV-ST) to Covered Coarse Ore Stockpile
TrStnPrt 3-03-024-08 F 6,950 tons 0.0002 0.00007 0.00001 lb/ton SAS 100% 1.08 0 0.51 0 0.08 0
PC09 Wind Erosion of the Coarse Ore Stockpile WindCvd 3-03-888-01 F 5 acres 0 0 0 ton/acre-yr Enclosed a 100% 0 0 0 0 0 0
PC10 Coarse Ore Stockpile to Reclaim Feeders (F-R1/R4) TrStnPrt 3-03-024-08 NF 6,950 tons 0.0002 0.00007 0.00001 lb/ton UndrGrd a 100% 0 0 0 0 0 0
PC11 Reclaim Feeders (F-R1/R4) to Reclaim Conveyor (CV-R) TrStnPrt 3-03-024-08 NF 6,950 tons 0.0002 0.00007 0.00001 lb/ton RTS 100% 1.08 0 0.51 0 0.08 0
PC12 Reclaim Conveyor (CV-R) to SAG Mill Feed Conveyor(CV-SMF) TrStnPrt 3-03-024-08 NF 6,950 tons 0.0002 0.00007 0.00001 lb/ton PCAS 100% 1.08 0 0.51 0 0.08 0
PC13 Pebble Conveyor No. 3 (CV-Pb3) to SAG Mill Feed Conveyor (CV-SMF)
TrStnPrt 3-03-024-08 NF 1,771 tons 0.0002 0.00007 0.00001 lb/ton PCAS 100% 0.28 0 0.13 0 0.02 0
PC14 SAG Mill Feed Conveyor (CV-SMF) to SAG Mill (M-SAG) TrStnPrt 3-03-024-08 NF 8,726 tons 0.0002 0.00007 0.00001 lb/ton Water a 100% 0 0 0 0 0 0
Milling
M01 SAG Mill (M-SAG) CrushS 3-03-024-06 NF 8,726 tons 0.05 0.02 0.004 lb/ton Wet a 100% 0 0 0 0 0 0
M02 SAG Mill (M-SAG) to Trommel Screen (Sn-T) TrStnPrt 3-03-024-08 NF 8,726 tons 0.0002 0.00007 0.00001 lb/ton Enclosed a 100% 0 0 0 0 0 0
M03 Trommel Screen (Sn-T) Screen 3-05-020-02 NF 8,726 tons 0.025 0.0087 0.0006 lb/ton Wet a 100% 0 0 0 0 0 0
M04 Trommel Screen (Sn-T) to Pebble Conveyor No. 1 (CV-Pb1) TrStnPrt 3-03-024-08 NF 1,851 tons 0.0002 0.00007 0.00001 lb/ton Clean a 100% 0 0 0 0 0 0
M05 Pebble Conveyor No. 1 (CV-Pb1) to Pebble Wash Screen(Sn-PbW)
TrStnPrt 3-03-024-08 NF 1,851 tons 0.0002 0.00007 0.00001 lb/ton Clean a 100% 0 0 0 0 0 0
M06 Pebble Wash Screen (Sn-PbW) Screen 3-05-020-02 NF 1,851 tons 0.025 0.0087 0.0006 lb/ton Wet a 100% 0 0 0 0 0 0
M07 Pebble Wash Screen (Sn-PbW) to Pebble Conveyor No. 2 TrStnPrt 3-03-024-08 NF 1,771 tons 0.0002 0.00007 0.00001 lb/ton Clean a 100% 0 0 0 0 0 0
M08 Pebble Conveyor No. 2 (CV-Pb2) to SAG Oversize Surge Bin(B-SAGOS) TrStnPrt 3-03-024-08 NF 1,771 tons 0.0002 0.00007 0.00001 lb/ton PCAS 100% 0.28 0 0.13 0 0.02 0
M09 SAG Oversize Surge Bin (B-SAGOS) to Pebble CrusherFeeder (F-PbC)
TrStnPrt 3-03-024-08 NF 1,771 tons 0.0002 0.00007 0.00001 lb/ton PCAS 100% 0.28 0 0.13 0 0.02 0
M10 Pebble Crusher Feeder (F-PbC) to Pebble Crusher (PbC) TrStnPrt 3-03-024-08 NF 1,771 tons 0.0002 0.00007 0.00001 lb/ton Enclosed a 100% 0 0 0 0 0 0
M11 Pebble Crusher (PbC) CrushT 3-03-024-07 NF 1,771 tons 0.06 0.02 0.00 lb/ton PCAS 100% 106.27 0 35.42 0 6.56 0
M12 Pebble Crusher (PbC) to Pebble Conveyor No. 3 (CV-Pb3) TrStnPrt 3-03-024-08 NF 1,771 tons 0.0002 0.00007 0.00001 lb/ton PCAS 100% 0.28 0 0.13 0 0.02 0
Copper Concentrate Dewatering and Stacking
CCD01 Copper Concentrate Filters (Ft-CC1/CC4) to Copper Concentrate Conveyor (CV-CC) TrCuCncPrt 3-03-024-08 NF 138 tons 0.00004 0.00002 0.000003 lb/ton Enclosed a 100% 0 0 0 0 0 0
CCD02 Copper Concentrate Conveyor (CV-CC) to Copper Concentrate Loadout Stockpile
TrCuCncPrt 3-03-024-08 F 138 tons 0.00004 0.00002 0.000003 lb/ton CCS 100% 0.006 0 0.003 0 0.0004 0
CCD03 Wind Erosion of Copper Concentrate Loadout Stockpile WindCvd 3-03-888-01 F 1.17 acres 0 0 0 ton/acre-yr Enclosed a 100% 0 0 0 0 0 0
CCD04 Copper Concentrate Loadout Stockpile to Shipment Truck via Front End Loaders
TrCuCncPrt 3-03-024-08 F 138 tons 0.00004 0.00002 0.000003 lb/ton CCS 100% 0.006 0 0.003 0 0.0004 0
Molybdenum Dewatering and Packaging
MD01 Molybdenum Concentrate Filter (Ft-MC) to Molybdenum Concentrate Dryer (D-MC)
TrMlyCncPrt 3-03-024-08 NF 1.9 tons 0.00002 0.00001 0.000002 lb/ton Enclosed a 100% 0 0 0 0 0 0
MD02 Molybdenum Concentrate Dryer MolyDry 3-03-024-11 NF 1.9 tons 19.70 12.00 5.91 lb/ton MS/EP 100% 37.43 0 22.80 0 11.23 0
MD03 Molybdenum Concentrate Dryer (D-MC) to MolybdenumConcentrate Bin (B-MC)
DTrMlyCncPrt 3-03-024-08 NF 1.9 tons 0.00004 0.00002 0.000003 lb/ton MDC 100% 0.00008 0 0.00004 0 0.000006 0
Rosemont Copper ProjectEmission Inventory Information JBR ENVIRONMENTAL CONSULTANTS, INC.
November 2011Page H315
AZRP00497

PM/TSP PM10 PM2.5 Uncontrolled Controlled Uncontrolled Controlled Uncontrolled Controlled
PM2.5 Emissions (lb/hr) - Year 20Emission Factors
Table H.82 Maximum Hourly Particulate Emissions - Year 20Hourly
Production Rate - Year 20
SCC EF UnitsPM10 Emissions (lb/hr) - Year 20
Unit Description Control Code
PM/TSP Emissions (lb/hr) - Year 20Process CodeUnit ID
Pick-up or Control Eff. (%)
Non-Fug. (NF) /
Fug. (F)Rate Units
MD04 Molybdenum Concentrate Bin (B-MC) to MolybdenumConcentrate Hopper (H-MC)
DTrMlyCnc 3-03-024-08 NF 1.9 tons 0.0003 0.0002 0.00002 lb/ton None 0% 0.0006 0.0006 0.0003 0.0003 0.00004 0.00004
MD05 Molybdenum Concentrate Hopper (H-MC) to MolybdenumConcentrate Conveyor (CV-MC)
DTrMlyCncPrt 3-03-024-08 NF 1.9 tons 0.00004 0.00002 0.000003 lb/ton Enclosed a 100% 0 0 0 0 0 0
MD06 Molybdenum Concentrate Conveyor (CV-MC) to Molybdenum Packaging and Weigh System (MPS)
DTrMlyCnc 3-03-024-08 NF 1.9 tons 0.0003 0.0002 0.00002 lb/ton MDC 100% 0.0006 0 0.0003 0 0.00004 0
Tailings Dewatering and Placement
TDS01 Tailings Filters (Ft-T1/T14) to Tailings Belt Feeders (F-T1/T14) FiltTailPrt 3-03-024-08 NF 10,722 tons 0.00002 0.00001 0.000002 lb/ton Enclosed a 100% 0 0 0 0 0 0
TDS02 Tailings Belt Feeders (F-T1/T14) to Fixed Tailings ConveyorNo. 1 (CV-F1)
FiltTailPrt 3-03-024-08 NF 10,722 tons 0.00002 0.00001 0.000002 lb/ton Enclosed a 100% 0 0 0 0 0 0
TDS03 Fixed Tailings Conveyor No. 1 (CV-F1) to Fixed TailingsConveyor No. 2 (CV-F2)
FiltTailPrt 3-03-024-08 NF 10,722 tons 0.00002 0.00001 0.000002 lb/ton Enclosed a 100% 0 0 0 0 0 0
TDS04 Fixed Tailings Conveyor No. 2 (CV-F2) to Fixed Tailings Conveyor No. 3 (CV-F3)
FiltTailPrt 3-03-024-08 NF 10,722 tons 0.00002 0.00001 0.000002 lb/ton None 0% 0.26 0.26 0.12 0.12 0.02 0.02
TDS05 Fixed Tailings Conveyor No. 3 (CV-F3) to RelocatableConveyor (CV-R1)
FiltTailPrt 3-03-024-08 F 10,722 tons 0.00002 0.00001 0.000002 lb/ton None 0% 0.26 0.26 0.12 0.12 0.02 0.02
TDS06 Relocatable Conveyor (CV-R1) to Shiftable Conveyor (CV-S1) FiltTailPrt 3-03-024-08 F 10,722 tons 0.00002 0.00001 0.000002 lb/ton None 0% 0.26 0.26 0.12 0.12 0.02 0.02
TDS07 Shiftable Conveyor (CV-S1) to Belt Wagon Conveyor(CV-BW1)
FiltTail 3-03-024-08 F 10,722 tons 0.0002 0.00009 0.00001 lb/ton None 0% 2.00 2.00 0.95 0.95 0.14 0.14
TDS08 Belt Wagon Conveyor (CV-BW1) to Spreader Crawler Mounted Conveyor (CV-SP1)
FiltTail 3-03-024-08 F 10,722 tons 0.0002 0.00009 0.00001 lb/ton None 0% 2.00 2.00 0.95 0.95 0.14 0.14
TDS09 Spreader Crawler Mounted Conveyor (CV-SP1) to Tailings Storage
FiltTail 3-03-024-08 F 10,722 tons 0.0002 0.00009 0.00001 lb/ton None 0% 2.00 2.00 0.95 0.95 0.14 0.14
TDS10 Wind Erosion of Tailings Storage TailStrg 3-03-888-01 F 1,500 acres 0.02 0.01 0.002 ton/acre-yr None 0% 6.90 6.90 3.45 3.45 0.52 0.52
Fuel Burning Equipment
FB01 Diesel Electrowinning Hot Water Generator (HWG) DFB 1-02-005-03 NF 1 hours 3.30 2.30 1.54 lb/1000 gal None 0% 0.14 0.14 0.10 0.10 0.07 0.07
6.0 MMBtu/hr
FB02 Thickener Area Emergency Generator (TEG) ICDE3 2-02-001-02 NF 1 hours 0.20 0.20 0.20 g/kW-hr None 0% 0.44 0.44 0.44 0.44 0.44 0.44
1,000 kW
FB03 PLS Pond Area Emergency Generator (PEG) ICDE3 2-02-001-02 NF 1 hours 0.20 0.20 0.20 g/kW-hr None 0% 0.44 0.44 0.44 0.44 0.44 0.44
1,000 kW
FB04 Main Substation Emergency Generator (MEG) ICDE3 2-02-001-02 NF 1 hours 0.20 0.20 0.20 g/kW-hr None 0% 0.33 0.33 0.33 0.33 0.33 0.33
750 kW
FB05 Administration Building Emergency Generator (AEG) ICDE3 2-02-001-02 NF 1 hours 0.20 0.20 0.20 g/kW-hr None 0% 0.33 0.33 0.33 0.33 0.33 0.33
750 kW
FB06 Electrowinning Building Emergency Generator (EWEG) ICDE1 2-02-001-02 NF 1 hours 0.40 0.40 0.40 g/kW-hr None 0% 0.04 0.04 0.04 0.04 0.04 0.04
50 kW
FB07 Primary Crusher Fire Water Pump (PCFWP) ICDE2 2-02-001-02 NF 1 hours 0.20 0.20 0.20 g/kW-hr None 0% 0.13 0.13 0.13 0.13 0.13 0.13
400 hp
Rosemont Copper ProjectEmission Inventory Information JBR ENVIRONMENTAL CONSULTANTS, INC.
November 2011Page H316
AZRP00498

PM/TSP PM10 PM2.5 Uncontrolled Controlled Uncontrolled Controlled Uncontrolled Controlled
PM2.5 Emissions (lb/hr) - Year 20Emission Factors
Table H.82 Maximum Hourly Particulate Emissions - Year 20Hourly
Production Rate - Year 20
SCC EF UnitsPM10 Emissions (lb/hr) - Year 20
Unit Description Control Code
PM/TSP Emissions (lb/hr) - Year 20Process CodeUnit ID
Pick-up or Control Eff. (%)
Non-Fug. (NF) /
Fug. (F)Rate Units
FB08 SX/EW Fire Water Pump (SXFWP) ICDE2 2-02-001-02 NF 1 hours 0.20 0.20 0.20 g/kW-hr None 0% 0.13 0.13 0.13 0.13 0.13 0.13
400 hp
Miscellaneous Sources
MS01 Transfer of Bulk Pebble Lime to the Bulk Pebble Lime Silo(S-BPL) LimeLd 3-05-016-26 NF 5.18 tons 0.61 0.29 0.04 lb/ton BPLSV a 90% 0.32 0.32 0.15 0.15 0.02 0.02
MS02 Bulk Pebble Lime Silo (S-BPL) to Bulk Pebble Lime Silo Screw Conveyor (CV-BPLS) ReagTr 3-03-024-04 NF 5.18 tons 0.008 0.004 0.0006 lb/ton Enclosed a 100% 0 0 0 0 0 0
MS03 Bulk Pebble Lime Silo Screw Conveyor (CV-BPLS) to SAGMill Feed Conveyor (CV-SMF)
ReagTr 3-03-024-04 NF 5.18 tons 0.008 0.004 0.0006 lb/ton None 0% 0.04 0.04 0.02 0.02 0.003 0.003
MS04 Transfer of Lime to the Lime Storage Bin (B-L) LimeLd 3-05-016-26 NF 2.59 tons 0.61 0.29 0.04 lb/ton LSV a 90% 0.16 0.16 0.07 0.07 0.01 0.01
MS05 Transfer of Sodium Metasilicate to the Sodium MetasilicateStorage Bin (B-SM)
ReagTr 3-03-024-04 NF 0.41 tons 0.008 0.004 0.0006 lb/ton SMSV a 90% 0.0003 0.0003 0.0002 0.0002 0.00002 0.00002
MS06 Transfer of Flocculant from Supersacks to Flocculant Storage Bins (B-F1/F2)
ReagTr 3-03-024-04 NF 0.15 tons 0.008 0.004 0.0006 lb/ton None 0% 0.001 0.001 0.0006 0.0006 0.00009 0.00009
MS07 Transfer of Guar from Bags to Guar Feeder (F-Gu) ReagTr 3-03-024-04 NF 0.02 tons 0.008 0.004 0.0006 lb/ton None 0% 0.0002 0.0002 0.00008 0.00008 0.00001 0.00001
MS08 Transfer of Granular Cobalt Sulfate from Bags to CobaltSulfate Feeder (F-CoS)
ReagTr 3-03-024-04 NF 0.0008 tons 0.008 0.004 0.0006 lb/ton None 0% 0.000007 0.000007 0.000003 0.000003 0.0000005 0.0000005
Particulate Matter Pollution Control Equipment with Emission Limits
PCL01 Crushing Area Scrubber (PC-CAS) CAS none NF 1 hours 1.29 1.28 1.13 lb/hr -- -- -- 1.29 -- 1.28 -- 1.13
PCL02 Stockpile Area Scrubber (PC-SAS) SAS none NF 1 hours 2.61 2.59 2.10 lb/hr -- -- -- 2.61 -- 2.59 -- 2.10
PCL03 Reclaim Tunnel Scrubber (PC-RTS) RTS none NF 1 hours 1.08 1.07 0.87 lb/hr -- -- -- 1.08 -- 1.07 -- 0.87
PCL04 Pebble Crusher Area Scrubber (PC-PCAS) PCAS none NF 1 hours 1.58 1.56 1.31 lb/hr -- -- -- 1.58 -- 1.56 -- 1.31
PCL05 Copper Concentrate Scrubber 1 (PC-CCS1) CCS none NF 1 hours 3.59 3.55 3.04 lb/hr -- -- -- 3.59 -- 3.55 -- 3.04
PCL06 Copper Concentrate Scrubber 2 (PC-CCS2) CCS none NF 1 hours 3.59 3.55 3.04 lb/hr -- -- -- 3.59 -- 3.55 -- 3.04
PCL07 Molybdenum Scrubber (PC-MS) / Electrostatic Precipitator (PC-EP) MS/EP none NF 1 hours 0.015 0.014 0.013 lb/hr -- -- -- 0.02 -- 0.01 -- 0.01
PCL08 Molybdenum Dust Collector (PC-MDC) MDC none NF 74,612 dscf 0.02 0.010 0.002 gr/dscf -- -- -- 0.23 -- 0.11 -- 0.02
PCL09 Laboratory Dust Collector 1 (PC-L1) LDC none NF 497,410 dscf 0.008 0.005 0.002 gr/dscf -- -- -- 0.58 -- 0.36 -- 0.17
PCL10 Laboratory Dust Collector 2 (PC-L2) LDC none NF 497,410 dscf 0.008 0.005 0.002 gr/dscf -- -- -- 0.58 -- 0.36 -- 0.17
PCL11 Laboratory Dust Collector 3 (PC-L3) LDC none NF 497,410 dscf 0.008 0.005 0.002 gr/dscf -- -- -- 0.58 -- 0.36 -- 0.17
291.99 18.51 126.18 17.11 31.81 14.02
5,584.94 990.84 1,536.78 354.60 151.04 32.63
5,876.93 1,009.35 1,662.95 371.71 182.85 46.64
9.88 9.88 9.88 9.88 9.88 9.88
a The control efficiency for this emission unit is inherent to the process. Therefore, the control efficiency is applied to both uncontrolled and controlled emissions.
Tailpipe Emissions (see Tables H.86-H.88):
Total Emissions (excluding tailpipe emissions):
Total Fugitive Emissions (excluding tailpipe emissions):
Total Non-Fugitive Emissions (excluding tailpipe emissions):
Rosemont Copper ProjectEmission Inventory Information JBR ENVIRONMENTAL CONSULTANTS, INC.
November 2011Page H317
AZRP00499

CO NOX SO2 VOC H2SO4 CO2 CH4 N2O HAP Name HAP EF CO NOX SO2 VOC H2SO4 CO2a CH4
a N2O a HAP b
Mining
MN02 Blasting Blast 3-05-020-09 F 5,252 tons ANFO 67.00 17.00 2.00 0 0 566 0.02 0.005 -- -- lb/tons ANFO 175.94 44.64 5.25 0 0 1,487.50 0.06 0.01 --
Solvent Extraction and Electrowinning
SXE01 Solvent Extraction SX 4-90-001-99 F 8,760 hours 0 0 0 9.43E-05 0 0 0 0 Benzene 3.37E-07 lb/hr-ft2 0 0 0 3.77 0 0 0 0 1.35E-02
4 Primary Mix Tanks (7.75' D x 9.75' H each) 4 @ 47.2 = 188.7 ft2 9,132.9 ft2 Total Surface Area of Solvent Extraction Toluene 4.82E-06 lb/hr-ft2 1.93E-01
4 Secondary Mix Tanks (9.5' D x 9.75' H each) 4 @ 70.9 = 283.5 ft2 Ethylbenzene 2.05E-05 lb/hr-ft2 8.21E-01
3 Tertiary Mix Tanks (9.5' D x 9.75' H each) 3 @ 70.9 = 212.6 ft2 Xylenes 2.80E-05 lb/hr-ft2 1.12E+00
4 Extraction Settlers (64' L x 33' W x 3.33' H each) 4 @ 2,112 = 8,448 ft2 Others (including Hexane) 2.94E-05 lb/hr-ft2 1.18E+00
SXE02 Electrowinning Commercial Cells (EWCC) EW none NF 8,760 hours 0 0 0 0 1.57E-04 0 0 0 Cobalt Compounds 2.36E-08 lb/hr-ft2 0 0 0 0 0.02 0 0 0 2.72E-06
Controlled by Cell Ventilation Scrubbers(PC-EWCVS1/EWCVS6)
2,640 ft2
99 Control Efficiency (%)
Fuel Burning Equipment
FB01 Diesel Electrowinning Hot Water Generator (HWG) DFB 1-02-005-03 NF 8,760 hours 5.00 20.00 0.21 0.20 0 23,217 0.94 0.19 POM 3.30E-03 lb/1000 gal 0.96 3.84 0.04 0.04 0 4,453.51 0.18 0.04 6.33E-04
6.0 MMBtu/hr Formaldehyde 6.10E-02 lb/1000 gal 1.17E-02
Arsenic 4.00 lb/1012 Btu 1.05E-04
Beryllium 3.00 lb/1012 Btu 7.88E-05
Cadmium 3.00 lb/1012 Btu 7.88E-05
Chromium 3.00 lb/1012 Btu 7.88E-05
Lead 9.00 lb/1012 Btu 2.37E-04
Mercury 3.00 lb/1012 Btu 7.88E-05
Manganese 6.00 lb/1012 Btu 1.58E-04
Nickel 3.00 lb/1012 Btu 7.88E-05
Selenium 15.00 lb/1012 Btu 3.94E-04
FB02 Thickener Area Emergency Generator (TEG) ICDE3 2-02-001-02 NF 500 hours 3.50 6.00 0.0066 0.40 0 694 0.03 0.006 -- -- g/kW-hr 1.93 3.31 0.004 0.22 0 382.65 0.02 0.003 --
1,000 kW Benzene 7.76E-04 lb/MMBtu 1.82E-03
Toluene 2.81E-04 lb/MMBtu 6.59E-04
Xylenes 1.93E-04 lb/MMBtu 4.53E-04
Formaldehyde 7.89E-05 lb/MMBtu 1.85E-04
Acetaldehyde 2.52E-05 lb/MMBtu 5.91E-05
Acrolein 7.88E-06 lb/MMBtu 1.85E-05
Naphthalene 1.30E-04 lb/MMBtu 3.05E-04
Acenaphthylene 9.23E-06 lb/MMBtu 2.17E-05
Acenaphthene 4.68E-06 lb/MMBtu 1.10E-05
Fluorene 1.28E-05 lb/MMBtu 3.00E-05
Phenanthrene 4.08E-05 lb/MMBtu 9.57E-05
Anthracene 1.23E-06 lb/MMBtu 2.89E-06
Fluoranthene 4.03E-06 lb/MMBtu 9.46E-06
Pyrene 3.71E-06 lb/MMBtu 8.71E-06
Benz(a)anthracene 6.22E-07 lb/MMBtu 1.46E-06
Chrysene 1.53E-06 lb/MMBtu 3.59E-06
Table H.83 Annual Gaseous Emissions - Year 20
Emissions (tpy) - Year 20Annual Production Rate -
Year 20
Emission FactorsSCCUnit ID EF UnitsUnit Description Process Code
Non-Fug. (NF) /
Fug. (F)Rate Units
Rosemont Copper ProjectEmission Inventory Information JBR ENVIRONMENTAL CONSULTANTS, INC.
November 2011Page H318
AZRP00500

CO NOX SO2 VOC H2SO4 CO2 CH4 N2O HAP Name HAP EF CO NOX SO2 VOC H2SO4 CO2a CH4
a N2O a HAP b
Table H.83 Annual Gaseous Emissions - Year 20
Emissions (tpy) - Year 20Annual Production Rate -
Year 20
Emission FactorsSCCUnit ID EF UnitsUnit Description Process Code
Non-Fug. (NF) /
Fug. (F)Rate Units
Benzo(b)fluoranthene 1.11E-06 lb/MMBtu 2.60E-06
Benzo(k)fluoranthene 2.18E-07 lb/MMBtu 5.12E-07
Benzo(a)pyrene 2.57E-07 lb/MMBtu 6.03E-07
Indeno(1,2,3-cd)pyrene 4.14E-07 lb/MMBtu 9.72E-07
Dibenz(a,h)anthracene 3.46E-07 lb/MMBtu 8.12E-07
Benzo(g,h,i)perylene 5.56E-07 lb/MMBtu 1.30E-06
FB03 PLS Pond Area Emergency Generator (PEG) ICDE3 2-02-001-02 NF 500 hours 3.50 6.00 0.0066 0.40 0 694 0.03 0.006 -- -- g/kW-hr 1.93 3.31 0.004 0.22 0 382.65 0.02 0.003 --
1,000 kW Benzene 7.76E-04 lb/MMBtu 1.82E-03
Toluene 2.81E-04 lb/MMBtu 6.59E-04
Xylenes 1.93E-04 lb/MMBtu 4.53E-04
Formaldehyde 7.89E-05 lb/MMBtu 1.85E-04
Acetaldehyde 2.52E-05 lb/MMBtu 5.91E-05
Acrolein 7.88E-06 lb/MMBtu 1.85E-05
Naphthalene 1.30E-04 lb/MMBtu 3.05E-04
Acenaphthylene 9.23E-06 lb/MMBtu 2.17E-05
Acenaphthene 4.68E-06 lb/MMBtu 1.10E-05
Fluorene 1.28E-05 lb/MMBtu 3.00E-05
Phenanthrene 4.08E-05 lb/MMBtu 9.57E-05
Anthracene 1.23E-06 lb/MMBtu 2.89E-06
Fluoranthene 4.03E-06 lb/MMBtu 9.46E-06
Pyrene 3.71E-06 lb/MMBtu 8.71E-06
Benz(a)anthracene 6.22E-07 lb/MMBtu 1.46E-06
Chrysene 1.53E-06 lb/MMBtu 3.59E-06
Benzo(b)fluoranthene 1.11E-06 lb/MMBtu 2.60E-06
Benzo(k)fluoranthene 2.18E-07 lb/MMBtu 5.12E-07
Benzo(a)pyrene 2.57E-07 lb/MMBtu 6.03E-07
Indeno(1,2,3-cd)pyrene 4.14E-07 lb/MMBtu 9.72E-07
Dibenz(a,h)anthracene 3.46E-07 lb/MMBtu 8.12E-07
Benzo(g,h,i)perylene 5.56E-07 lb/MMBtu 1.30E-06
FB04 Main Substation Emergency Generator (MEG) ICDE3 2-02-001-02 NF 500 hours 3.50 6.00 0.0066 0.40 0 694 0.03 0.006 -- -- g/kW-hr 1.45 2.48 0.003 0.17 0 286.99 0.01 0.002 --
750 kW Benzene 7.76E-04 lb/MMBtu 1.37E-03
Toluene 2.81E-04 lb/MMBtu 4.95E-04
Xylenes 1.93E-04 lb/MMBtu 3.40E-04
Formaldehyde 7.89E-05 lb/MMBtu 1.39E-04
Acetaldehyde 2.52E-05 lb/MMBtu 4.44E-05
Acrolein 7.88E-06 lb/MMBtu 1.39E-05
Naphthalene 1.30E-04 lb/MMBtu 2.29E-04
Acenaphthylene 9.23E-06 lb/MMBtu 1.62E-05
Acenaphthene 4.68E-06 lb/MMBtu 8.24E-06
Fluorene 1.28E-05 lb/MMBtu 2.25E-05
Rosemont Copper ProjectEmission Inventory Information JBR ENVIRONMENTAL CONSULTANTS, INC.
November 2011Page H319
AZRP00501

CO NOX SO2 VOC H2SO4 CO2 CH4 N2O HAP Name HAP EF CO NOX SO2 VOC H2SO4 CO2a CH4
a N2O a HAP b
Table H.83 Annual Gaseous Emissions - Year 20
Emissions (tpy) - Year 20Annual Production Rate -
Year 20
Emission FactorsSCCUnit ID EF UnitsUnit Description Process Code
Non-Fug. (NF) /
Fug. (F)Rate Units
Phenanthrene 4.08E-05 lb/MMBtu 7.18E-05
Anthracene 1.23E-06 lb/MMBtu 2.16E-06
Fluoranthene 4.03E-06 lb/MMBtu 7.09E-06
Pyrene 3.71E-06 lb/MMBtu 6.53E-06
Benz(a)anthracene 6.22E-07 lb/MMBtu 1.09E-06
Chrysene 1.53E-06 lb/MMBtu 2.69E-06
Benzo(b)fluoranthene 1.11E-06 lb/MMBtu 1.95E-06
Benzo(k)fluoranthene 2.18E-07 lb/MMBtu 3.84E-07
Benzo(a)pyrene 2.57E-07 lb/MMBtu 4.52E-07
Indeno(1,2,3-cd)pyrene 4.14E-07 lb/MMBtu 7.29E-07
Dibenz(a,h)anthracene 3.46E-07 lb/MMBtu 6.09E-07
Benzo(g,h,i)perylene 5.56E-07 lb/MMBtu 9.79E-07
FB05 Administration Building Emergency Generator (AEG) ICDE3 2-02-001-02 NF 500 hours 3.50 6.00 0.0066 0.40 0 694 0.03 0.006 -- -- g/kW-hr 1.45 2.48 0.003 0.17 0 286.99 0.01 0.002 --
750 kW Benzene 7.76E-04 lb/MMBtu 1.37E-03
Toluene 2.81E-04 lb/MMBtu 4.95E-04
Xylenes 1.93E-04 lb/MMBtu 3.40E-04
Formaldehyde 7.89E-05 lb/MMBtu 1.39E-04
Acetaldehyde 2.52E-05 lb/MMBtu 4.44E-05
Acrolein 7.88E-06 lb/MMBtu 1.39E-05
Naphthalene 1.30E-04 lb/MMBtu 2.29E-04
Acenaphthylene 9.23E-06 lb/MMBtu 1.62E-05
Acenaphthene 4.68E-06 lb/MMBtu 8.24E-06
Fluorene 1.28E-05 lb/MMBtu 2.25E-05
Phenanthrene 4.08E-05 lb/MMBtu 7.18E-05
Anthracene 1.23E-06 lb/MMBtu 2.16E-06
Fluoranthene 4.03E-06 lb/MMBtu 7.09E-06
Pyrene 3.71E-06 lb/MMBtu 6.53E-06
Benz(a)anthracene 6.22E-07 lb/MMBtu 1.09E-06
Chrysene 1.53E-06 lb/MMBtu 2.69E-06
Benzo(b)fluoranthene 1.11E-06 lb/MMBtu 1.95E-06
Benzo(k)fluoranthene 2.18E-07 lb/MMBtu 3.84E-07
Benzo(a)pyrene 2.57E-07 lb/MMBtu 4.52E-07
Indeno(1,2,3-cd)pyrene 4.14E-07 lb/MMBtu 7.29E-07
Dibenz(a,h)anthracene 3.46E-07 lb/MMBtu 6.09E-07
Benzo(g,h,i)perylene 5.56E-07 lb/MMBtu 9.79E-07
FB06 Electrowinning Building Emergency Generator (EWEG)
ICDE1 2-02-001-02 NF 500 hours 5.00 4.43 0.0066 0.27 0 694 0.03 0.006 -- -- g/kW-hr 0.14 0.12 0.0002 0.007 0 19.13 0.0008 0.0002 --
50 kW Benzene 9.33E-04 lb/MMBtu 1.09E-04
Toluene 4.09E-04 lb/MMBtu 4.80E-05
Xylenes 2.85E-04 lb/MMBtu 3.34E-05
1,3-Butadiene 3.91E-05 lb/MMBtu 4.59E-06
Rosemont Copper ProjectEmission Inventory Information JBR ENVIRONMENTAL CONSULTANTS, INC.
November 2011Page H320
AZRP00502
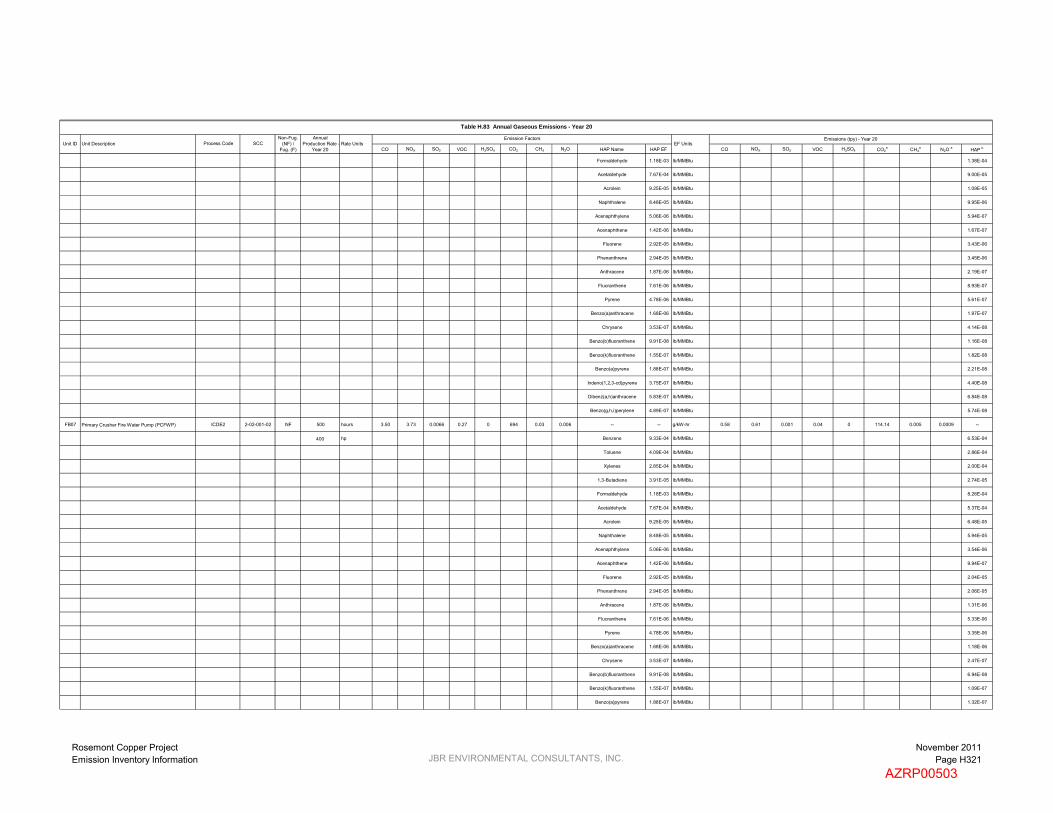
CO NOX SO2 VOC H2SO4 CO2 CH4 N2O HAP Name HAP EF CO NOX SO2 VOC H2SO4 CO2a CH4
a N2O a HAP b
Table H.83 Annual Gaseous Emissions - Year 20
Emissions (tpy) - Year 20Annual Production Rate -
Year 20
Emission FactorsSCCUnit ID EF UnitsUnit Description Process Code
Non-Fug. (NF) /
Fug. (F)Rate Units
Formaldehyde 1.18E-03 lb/MMBtu 1.38E-04
Acetaldehyde 7.67E-04 lb/MMBtu 9.00E-05
Acrolein 9.25E-05 lb/MMBtu 1.09E-05
Naphthalene 8.48E-05 lb/MMBtu 9.95E-06
Acenaphthylene 5.06E-06 lb/MMBtu 5.94E-07
Acenaphthene 1.42E-06 lb/MMBtu 1.67E-07
Fluorene 2.92E-05 lb/MMBtu 3.43E-06
Phenanthrene 2.94E-05 lb/MMBtu 3.45E-06
Anthracene 1.87E-06 lb/MMBtu 2.19E-07
Fluoranthene 7.61E-06 lb/MMBtu 8.93E-07
Pyrene 4.78E-06 lb/MMBtu 5.61E-07
Benzo(a)anthracene 1.68E-06 lb/MMBtu 1.97E-07
Chrysene 3.53E-07 lb/MMBtu 4.14E-08
Benzo(b)fluoranthene 9.91E-08 lb/MMBtu 1.16E-08
Benzo(k)fluoranthene 1.55E-07 lb/MMBtu 1.82E-08
Benzo(a)pyrene 1.88E-07 lb/MMBtu 2.21E-08
Indeno(1,2,3-cd)pyrene 3.75E-07 lb/MMBtu 4.40E-08
Dibenz(a,h)anthracene 5.83E-07 lb/MMBtu 6.84E-08
Benzo(g,h,i)perylene 4.89E-07 lb/MMBtu 5.74E-08
FB07 Primary Crusher Fire Water Pump (PCFWP) ICDE2 2-02-001-02 NF 500 hours 3.50 3.73 0.0066 0.27 0 694 0.03 0.006 -- -- g/kW-hr 0.58 0.61 0.001 0.04 0 114.14 0.005 0.0009 --
400 hp Benzene 9.33E-04 lb/MMBtu 6.53E-04
Toluene 4.09E-04 lb/MMBtu 2.86E-04
Xylenes 2.85E-04 lb/MMBtu 2.00E-04
1,3-Butadiene 3.91E-05 lb/MMBtu 2.74E-05
Formaldehyde 1.18E-03 lb/MMBtu 8.26E-04
Acetaldehyde 7.67E-04 lb/MMBtu 5.37E-04
Acrolein 9.25E-05 lb/MMBtu 6.48E-05
Naphthalene 8.48E-05 lb/MMBtu 5.94E-05
Acenaphthylene 5.06E-06 lb/MMBtu 3.54E-06
Acenaphthene 1.42E-06 lb/MMBtu 9.94E-07
Fluorene 2.92E-05 lb/MMBtu 2.04E-05
Phenanthrene 2.94E-05 lb/MMBtu 2.06E-05
Anthracene 1.87E-06 lb/MMBtu 1.31E-06
Fluoranthene 7.61E-06 lb/MMBtu 5.33E-06
Pyrene 4.78E-06 lb/MMBtu 3.35E-06
Benzo(a)anthracene 1.68E-06 lb/MMBtu 1.18E-06
Chrysene 3.53E-07 lb/MMBtu 2.47E-07
Benzo(b)fluoranthene 9.91E-08 lb/MMBtu 6.94E-08
Benzo(k)fluoranthene 1.55E-07 lb/MMBtu 1.09E-07
Benzo(a)pyrene 1.88E-07 lb/MMBtu 1.32E-07
Rosemont Copper ProjectEmission Inventory Information JBR ENVIRONMENTAL CONSULTANTS, INC.
November 2011Page H321
AZRP00503

CO NOX SO2 VOC H2SO4 CO2 CH4 N2O HAP Name HAP EF CO NOX SO2 VOC H2SO4 CO2a CH4
a N2O a HAP b
Table H.83 Annual Gaseous Emissions - Year 20
Emissions (tpy) - Year 20Annual Production Rate -
Year 20
Emission FactorsSCCUnit ID EF UnitsUnit Description Process Code
Non-Fug. (NF) /
Fug. (F)Rate Units
Indeno(1,2,3-cd)pyrene 3.75E-07 lb/MMBtu 2.63E-07
Dibenz(a,h)anthracene 5.83E-07 lb/MMBtu 4.08E-07
Benzo(g,h,i)perylene 4.89E-07 lb/MMBtu 3.42E-07
FB08 SX/EW Fire Water Pump (SXFWP) ICDE2 2-02-001-02 NF 500 hours 3.50 3.73 0.0066 0.27 0 694 0.03 0.006 -- -- g/kW-hr 0.58 0.61 0.001 0.04 0 114.14 0.005 0.0009 --
400 hp Benzene 9.33E-04 lb/MMBtu 6.53E-04
Toluene 4.09E-04 lb/MMBtu 2.86E-04
Xylenes 2.85E-04 lb/MMBtu 2.00E-04
1,3-Butadiene 3.91E-05 lb/MMBtu 2.74E-05
Formaldehyde 1.18E-03 lb/MMBtu 8.26E-04
Acetaldehyde 7.67E-04 lb/MMBtu 5.37E-04
Acrolein 9.25E-05 lb/MMBtu 6.48E-05
Naphthalene 8.48E-05 lb/MMBtu 5.94E-05
Acenaphthylene 5.06E-06 lb/MMBtu 3.54E-06
Acenaphthene 1.42E-06 lb/MMBtu 9.94E-07
Fluorene 2.92E-05 lb/MMBtu 2.04E-05
Phenanthrene 2.94E-05 lb/MMBtu 2.06E-05
Anthracene 1.87E-06 lb/MMBtu 1.31E-06
Fluoranthene 7.61E-06 lb/MMBtu 5.33E-06
Pyrene 4.78E-06 lb/MMBtu 3.35E-06
Benzo(a)anthracene 1.68E-06 lb/MMBtu 1.18E-06
Chrysene 3.53E-07 lb/MMBtu 2.47E-07
Benzo(b)fluoranthene 9.91E-08 lb/MMBtu 6.94E-08
Benzo(k)fluoranthene 1.55E-07 lb/MMBtu 1.09E-07
Benzo(a)pyrene 1.88E-07 lb/MMBtu 1.32E-07
Indeno(1,2,3-cd)pyrene 3.75E-07 lb/MMBtu 2.63E-07
Dibenz(a,h)anthracene 5.83E-07 lb/MMBtu 4.08E-07
Benzo(g,h,i)perylene 4.89E-07 lb/MMBtu 3.42E-07
Tanks
T01 C7 Distribution Tank (T-C7D) C7DT 4-03-010-19 NF 8,760 hours 0 0 0 1.08E-01 0 0 0 0 -- -- lb/hr 0 0 0 0.47 0 0 0 0 --
T02 MIBC Storage Tank (T-MIBCS) MST 4-90-999-98 NF 8,760 hours 0 0 0 3.53E-03 0 0 0 0 -- -- lb/hr 0 0 0 0.02 0 0 0 0 --
T03 Diesel Fuel Storage Tank - Heavy Vehicles 1(T-DFS-HV1)
DFSTHV 4-03-010-19 NF 8,760 hours 0 0 0 1.39E-02 0 0 0 0 n-Hexane 5.71E-06 lb/hr 0 0 0 0.06 0 0 0 0 2.50E-05
Benzene 2.74E-05 lb/hr 1.20E-04
Toluene 3.18E-04 lb/hr 1.40E-03
Ethylbenzene 4.45E-05 lb/hr 1.95E-04
m-Xylene 8.23E-04 lb/hr 3.61E-03
1,2,4-Trimethylbenzene 6.76E-04 lb/hr 2.96E-03
T04 Diesel Fuel Storage Tank - Heavy Vehicles 2(T-DFS-HV2)
DFSTHV 4-03-010-19 NF 8,760 hours 0 0 0 1.39E-02 0 0 0 0 n-Hexane 5.71E-06 lb/hr 0 0 0 0.06 0 0 0 0 2.50E-05
Benzene 2.74E-05 lb/hr 1.20E-04
Toluene 3.18E-04 lb/hr 1.40E-03
Ethylbenzene 4.45E-05 lb/hr 1.95E-04
Rosemont Copper ProjectEmission Inventory Information JBR ENVIRONMENTAL CONSULTANTS, INC.
November 2011Page H322
AZRP00504

CO NOX SO2 VOC H2SO4 CO2 CH4 N2O HAP Name HAP EF CO NOX SO2 VOC H2SO4 CO2a CH4
a N2O a HAP b
Table H.83 Annual Gaseous Emissions - Year 20
Emissions (tpy) - Year 20Annual Production Rate -
Year 20
Emission FactorsSCCUnit ID EF UnitsUnit Description Process Code
Non-Fug. (NF) /
Fug. (F)Rate Units
m-Xylene 8.23E-04 lb/hr 3.61E-03
1,2,4-Trimethylbenzene 6.76E-04 lb/hr 2.96E-03
9.00 16.76 0.06 1.51 0.02 6,040.20 0.25 0.05 0.05
175.94 44.64 5.25 3.77 0 1,487.50 0.06 0.01 3.32
184.94 61.40 5.31 5.28 0.02 7,527.70 0.31 0.06 3.37
795.06 1,068.97 1.54 76.71 -- 156,725.16 -- -- --
a CO2e emissions are calculcated by summing the individual greenhouse gas emissions multiplied by their global warming potential (GWP). GWP of CO2 = 1, GWP of CH4 = 21, GWP of N2O = 310.
b All HAP emissions are included in the facility-wide potential to emit, regardless of if they are fugitive or non-fugitive emissions.
Tailpipe Emissions (see Tables H.89-H.93):
Total Emissions (excluding tailpipe emissions):
Total Non-Fugitive Emissions (excluding tailpipe emissions):
Total Fugitive Emissions (excluding tailpipe emissions):
Rosemont Copper ProjectEmission Inventory Information JBR ENVIRONMENTAL CONSULTANTS, INC.
November 2011Page H323
AZRP00505

CO NOX SO2 VOC H2SO4 CO2 CH4 N2O HAP Name HAP EF CO NOX SO2 VOC H2SO4 CO2a CH4
a N2O a HAP b
Mining
MN02 Blasting Blast 3-05-020-09 F 52 tons ANFO 67.00 17.00 2.00 0 0 566 0.02 0.005 -- -- lb/tons ANFO 1.74 0.44 0.05 0 0 14.73 0.0006 0.0001 --
Solvent Extraction and Electrowinning
SXE01 Solvent Extraction SX 4-90-001-99 F 24 hours 0 0 0 9.43E-05 0 0 0 0 Benzene 3.37E-07 lb/hr-ft2 0 0 0 0.01 0 0 0 0 3.69E-05
4 Primary Mix Tanks (7.75' D x 9.75' H each) 4 @ 47.2 = 188.7 ft2 9,132.9 ft2 Total Surface Area of Solvent Extraction Toluene 4.82E-06 lb/hr-ft2 5.28E-04
4 Secondary Mix Tanks (9.5' D x 9.75' H each) 4 @ 70.9 = 283.5 ft2 Ethylbenzene 2.05E-05 lb/hr-ft2 2.25E-03
3 Tertiary Mix Tanks (9.5' D x 9.75' H each) 3 @ 70.9 = 212.6 ft2 Xylenes 2.80E-05 lb/hr-ft2 3.07E-03
4 Extraction Settlers (64' L x 33' W x 3.33' H each) 4 @ 2,112 = 8,448 ft2 Others (including Hexane) 2.94E-05 lb/hr-ft2 3.22E-03
SXE02 Electrowinning Commercial Cells (EWCC) EW none NF 24 hours 0 0 0 0 1.57E-04 0 0 0 Cobalt Compounds 2.36E-08 lb/hr-ft2 0 0 0 0 0.00005 0 0 0 7.46E-09
Controlled by Cell Ventilation Scrubbers(PC-EWCVS1/EWCVS6)
2,640 ft2
99 Control Efficiency (%)
Fuel Burning Equipment
FB01 Diesel Electrowinning Hot Water Generator (HWG) DFB 1-02-005-03 NF 24 hours 5.00 20.00 0.21 0.20 0 23,217 0.94 0.19 POM 3.30E-03 lb/1000 gal 0.003 0.01 0.0001 0.0001 0 12.20 0.0005 0.0001 1.73E-06
6.0 MMBtu/hr Formaldehyde 6.10E-02 lb/1000 gal 3.21E-05
Arsenic 4.00 lb/1012 Btu 2.88E-07
Beryllium 3.00 lb/1012 Btu 2.16E-07
Cadmium 3.00 lb/1012 Btu 2.16E-07
Chromium 3.00 lb/1012 Btu 2.16E-07
Lead 9.00 lb/1012 Btu 6.48E-07
Mercury 3.00 lb/1012 Btu 2.16E-07
Manganese 6.00 lb/1012 Btu 4.32E-07
Nickel 3.00 lb/1012 Btu 2.16E-07
Selenium 15.00 lb/1012 Btu 1.08E-06
FB02 Thickener Area Emergency Generator (TEG) ICDE3 2-02-001-02 NF 24 hours 3.50 6.00 0.0066 0.40 0 694 0.03 0.006 -- -- g/kW-hr 0.09 0.16 0.0002 0.01 0 18.37 0.0007 0.0001 --
1,000 kW Benzene 7.76E-04 lb/MMBtu 8.74E-05
Toluene 2.81E-04 lb/MMBtu 3.17E-05
Xylenes 1.93E-04 lb/MMBtu 2.17E-05
Formaldehyde 7.89E-05 lb/MMBtu 8.89E-06
Acetaldehyde 2.52E-05 lb/MMBtu 2.84E-06
Acrolein 7.88E-06 lb/MMBtu 8.88E-07
Naphthalene 1.30E-04 lb/MMBtu 1.46E-05
Acenaphthylene 9.23E-06 lb/MMBtu 1.04E-06
Acenaphthene 4.68E-06 lb/MMBtu 5.27E-07
Fluorene 1.28E-05 lb/MMBtu 1.44E-06
Phenanthrene 4.08E-05 lb/MMBtu 4.60E-06
Anthracene 1.23E-06 lb/MMBtu 1.39E-07
Fluoranthene 4.03E-06 lb/MMBtu 4.54E-07
Pyrene 3.71E-06 lb/MMBtu 4.18E-07
Benz(a)anthracene 6.22E-07 lb/MMBtu 7.01E-08
Chrysene 1.53E-06 lb/MMBtu 1.72E-07
SCCEmissions (tpd) - Year 20Daily Production
Rate - Year 20
Emission FactorsUnit ID EF UnitsUnit Description Process Code
Non-Fug. (NF) /
Fug. (F)
Table H.84 Maximum Daily Gaseous Emissions - Year 20
Rate Units
Rosemont Copper ProjectEmission Inventory Information JBR ENVIRONMENTAL CONSULTANTS, INC.
November 2011Page H324
AZRP00506

CO NOX SO2 VOC H2SO4 CO2 CH4 N2O HAP Name HAP EF CO NOX SO2 VOC H2SO4 CO2a CH4
a N2O a HAP bSCC
Emissions (tpd) - Year 20Daily Production Rate - Year 20
Emission FactorsUnit ID EF UnitsUnit Description Process Code
Non-Fug. (NF) /
Fug. (F)
Table H.84 Maximum Daily Gaseous Emissions - Year 20
Rate Units
Benzo(b)fluoranthene 1.11E-06 lb/MMBtu 1.25E-07
Benzo(k)fluoranthene 2.18E-07 lb/MMBtu 2.46E-08
Benzo(a)pyrene 2.57E-07 lb/MMBtu 2.89E-08
Indeno(1,2,3-cd)pyrene 4.14E-07 lb/MMBtu 4.66E-08
Dibenz(a,h)anthracene 3.46E-07 lb/MMBtu 3.90E-08
Benzo(g,h,i)perylene 5.56E-07 lb/MMBtu 6.26E-08
FB03 PLS Pond Area Emergency Generator (PEG) ICDE3 2-02-001-02 NF 24 hours 3.50 6.00 0.0066 0.40 0 694 0.03 0.006 -- -- g/kW-hr 0.09 0.16 0.0002 0.01 0 18.37 0.0007 0.0001 --
1,000 kW Benzene 7.76E-04 lb/MMBtu 8.74E-05
Toluene 2.81E-04 lb/MMBtu 3.17E-05
Xylenes 1.93E-04 lb/MMBtu 2.17E-05
Formaldehyde 7.89E-05 lb/MMBtu 8.89E-06
Acetaldehyde 2.52E-05 lb/MMBtu 2.84E-06
Acrolein 7.88E-06 lb/MMBtu 8.88E-07
Naphthalene 1.30E-04 lb/MMBtu 1.46E-05
Acenaphthylene 9.23E-06 lb/MMBtu 1.04E-06
Acenaphthene 4.68E-06 lb/MMBtu 5.27E-07
Fluorene 1.28E-05 lb/MMBtu 1.44E-06
Phenanthrene 4.08E-05 lb/MMBtu 4.60E-06
Anthracene 1.23E-06 lb/MMBtu 1.39E-07
Fluoranthene 4.03E-06 lb/MMBtu 4.54E-07
Pyrene 3.71E-06 lb/MMBtu 4.18E-07
Benz(a)anthracene 6.22E-07 lb/MMBtu 7.01E-08
Chrysene 1.53E-06 lb/MMBtu 1.72E-07
Benzo(b)fluoranthene 1.11E-06 lb/MMBtu 1.25E-07
Benzo(k)fluoranthene 2.18E-07 lb/MMBtu 2.46E-08
Benzo(a)pyrene 2.57E-07 lb/MMBtu 2.89E-08
Indeno(1,2,3-cd)pyrene 4.14E-07 lb/MMBtu 4.66E-08
Dibenz(a,h)anthracene 3.46E-07 lb/MMBtu 3.90E-08
Benzo(g,h,i)perylene 5.56E-07 lb/MMBtu 6.26E-08
FB04 Main Substation Emergency Generator (MEG) ICDE3 2-02-001-02 NF 24 hours 3.50 6.00 0.0066 0.40 0 694 0.03 0.006 -- -- g/kW-hr 0.07 0.12 0.0001 0.008 0 13.78 0.0006 0.0001 --
750 kW Benzene 7.76E-04 lb/MMBtu 6.56E-05
Toluene 2.81E-04 lb/MMBtu 2.37E-05
Xylenes 1.93E-04 lb/MMBtu 1.63E-05
Formaldehyde 7.89E-05 lb/MMBtu 6.67E-06
Acetaldehyde 2.52E-05 lb/MMBtu 2.13E-06
Acrolein 7.88E-06 lb/MMBtu 6.66E-07
Naphthalene 1.30E-04 lb/MMBtu 1.10E-05
Acenaphthylene 9.23E-06 lb/MMBtu 7.80E-07
Acenaphthene 4.68E-06 lb/MMBtu 3.95E-07
Fluorene 1.28E-05 lb/MMBtu 1.08E-06
Rosemont Copper ProjectEmission Inventory Information JBR ENVIRONMENTAL CONSULTANTS, INC.
November 2011Page H325
AZRP00507

CO NOX SO2 VOC H2SO4 CO2 CH4 N2O HAP Name HAP EF CO NOX SO2 VOC H2SO4 CO2a CH4
a N2O a HAP bSCC
Emissions (tpd) - Year 20Daily Production Rate - Year 20
Emission FactorsUnit ID EF UnitsUnit Description Process Code
Non-Fug. (NF) /
Fug. (F)
Table H.84 Maximum Daily Gaseous Emissions - Year 20
Rate Units
Phenanthrene 4.08E-05 lb/MMBtu 3.45E-06
Anthracene 1.23E-06 lb/MMBtu 1.04E-07
Fluoranthene 4.03E-06 lb/MMBtu 3.40E-07
Pyrene 3.71E-06 lb/MMBtu 3.13E-07
Benz(a)anthracene 6.22E-07 lb/MMBtu 5.25E-08
Chrysene 1.53E-06 lb/MMBtu 1.29E-07
Benzo(b)fluoranthene 1.11E-06 lb/MMBtu 9.38E-08
Benzo(k)fluoranthene 2.18E-07 lb/MMBtu 1.84E-08
Benzo(a)pyrene 2.57E-07 lb/MMBtu 2.17E-08
Indeno(1,2,3-cd)pyrene 4.14E-07 lb/MMBtu 3.50E-08
Dibenz(a,h)anthracene 3.46E-07 lb/MMBtu 2.92E-08
Benzo(g,h,i)perylene 5.56E-07 lb/MMBtu 4.70E-08
FB05 Administration Building Emergency Generator (AEG) ICDE3 2-02-001-02 NF 24 hours 3.50 6.00 0.0066 0.40 0 694 0.03 0.006 -- -- g/kW-hr 0.07 0.12 0.0001 0.008 0 13.78 0.0006 0.0001 --
750 kW Benzene 7.76E-04 lb/MMBtu 6.56E-05
Toluene 2.81E-04 lb/MMBtu 2.37E-05
Xylenes 1.93E-04 lb/MMBtu 1.63E-05
Formaldehyde 7.89E-05 lb/MMBtu 6.67E-06
Acetaldehyde 2.52E-05 lb/MMBtu 2.13E-06
Acrolein 7.88E-06 lb/MMBtu 6.66E-07
Naphthalene 1.30E-04 lb/MMBtu 1.10E-05
Acenaphthylene 9.23E-06 lb/MMBtu 7.80E-07
Acenaphthene 4.68E-06 lb/MMBtu 3.95E-07
Fluorene 1.28E-05 lb/MMBtu 1.08E-06
Phenanthrene 4.08E-05 lb/MMBtu 3.45E-06
Anthracene 1.23E-06 lb/MMBtu 1.04E-07
Fluoranthene 4.03E-06 lb/MMBtu 3.40E-07
Pyrene 3.71E-06 lb/MMBtu 3.13E-07
Benz(a)anthracene 6.22E-07 lb/MMBtu 5.25E-08
Chrysene 1.53E-06 lb/MMBtu 1.29E-07
Benzo(b)fluoranthene 1.11E-06 lb/MMBtu 9.38E-08
Benzo(k)fluoranthene 2.18E-07 lb/MMBtu 1.84E-08
Benzo(a)pyrene 2.57E-07 lb/MMBtu 2.17E-08
Indeno(1,2,3-cd)pyrene 4.14E-07 lb/MMBtu 3.50E-08
Dibenz(a,h)anthracene 3.46E-07 lb/MMBtu 2.92E-08
Benzo(g,h,i)perylene 5.56E-07 lb/MMBtu 4.70E-08
FB06 Electrowinning Building Emergency Generator (EWEG)
ICDE1 2-02-001-02 NF 24 hours 5.00 4.43 0.0066 0.27 0 694 0.03 0.006 -- -- g/kW-hr 0.007 0.006 0.000009 0.0004 0 0.92 0.00004 0.000007 --
50 kW Benzene 9.33E-04 lb/MMBtu 5.25E-06
Toluene 4.09E-04 lb/MMBtu 2.30E-06
Xylenes 2.85E-04 lb/MMBtu 1.61E-06
1,3-Butadiene 3.91E-05 lb/MMBtu 2.20E-07
Rosemont Copper ProjectEmission Inventory Information JBR ENVIRONMENTAL CONSULTANTS, INC.
November 2011Page H326
AZRP00508

CO NOX SO2 VOC H2SO4 CO2 CH4 N2O HAP Name HAP EF CO NOX SO2 VOC H2SO4 CO2a CH4
a N2O a HAP bSCC
Emissions (tpd) - Year 20Daily Production Rate - Year 20
Emission FactorsUnit ID EF UnitsUnit Description Process Code
Non-Fug. (NF) /
Fug. (F)
Table H.84 Maximum Daily Gaseous Emissions - Year 20
Rate Units
Formaldehyde 1.18E-03 lb/MMBtu 6.65E-06
Acetaldehyde 7.67E-04 lb/MMBtu 4.32E-06
Acrolein 9.25E-05 lb/MMBtu 5.21E-07
Naphthalene 8.48E-05 lb/MMBtu 4.78E-07
Acenaphthylene 5.06E-06 lb/MMBtu 2.85E-08
Acenaphthene 1.42E-06 lb/MMBtu 8.00E-09
Fluorene 2.92E-05 lb/MMBtu 1.64E-07
Phenanthrene 2.94E-05 lb/MMBtu 1.66E-07
Anthracene 1.87E-06 lb/MMBtu 1.05E-08
Fluoranthene 7.61E-06 lb/MMBtu 4.29E-08
Pyrene 4.78E-06 lb/MMBtu 2.69E-08
Benzo(a)anthracene 1.68E-06 lb/MMBtu 9.46E-09
Chrysene 3.53E-07 lb/MMBtu 1.99E-09
Benzo(b)fluoranthene 9.91E-08 lb/MMBtu 5.58E-10
Benzo(k)fluoranthene 1.55E-07 lb/MMBtu 8.73E-10
Benzo(a)pyrene 1.88E-07 lb/MMBtu 1.06E-09
Indeno(1,2,3-cd)pyrene 3.75E-07 lb/MMBtu 2.11E-09
Dibenz(a,h)anthracene 5.83E-07 lb/MMBtu 3.28E-09
Benzo(g,h,i)perylene 4.89E-07 lb/MMBtu 2.75E-09
FB07 Primary Crusher Fire Water Pump (PCFWP) ICDE2 2-02-001-02 NF 24 hours 3.50 3.73 0.0066 0.27 0 694 0.03 0.006 -- -- g/kW-hr 0.03 0.03 0.00005 0.002 0 5.48 0.0002 0.00004 --
400 hp Benzene 9.33E-04 lb/MMBtu 3.13E-05
Toluene 4.09E-04 lb/MMBtu 1.37E-05
Xylenes 2.85E-04 lb/MMBtu 9.58E-06
1,3-Butadiene 3.91E-05 lb/MMBtu 1.31E-06
Formaldehyde 1.18E-03 lb/MMBtu 3.96E-05
Acetaldehyde 7.67E-04 lb/MMBtu 2.58E-05
Acrolein 9.25E-05 lb/MMBtu 3.11E-06
Naphthalene 8.48E-05 lb/MMBtu 2.85E-06
Acenaphthylene 5.06E-06 lb/MMBtu 1.70E-07
Acenaphthene 1.42E-06 lb/MMBtu 4.77E-08
Fluorene 2.92E-05 lb/MMBtu 9.81E-07
Phenanthrene 2.94E-05 lb/MMBtu 9.88E-07
Anthracene 1.87E-06 lb/MMBtu 6.28E-08
Fluoranthene 7.61E-06 lb/MMBtu 2.56E-07
Pyrene 4.78E-06 lb/MMBtu 1.61E-07
Benzo(a)anthracene 1.68E-06 lb/MMBtu 5.64E-08
Chrysene 3.53E-07 lb/MMBtu 1.19E-08
Benzo(b)fluoranthene 9.91E-08 lb/MMBtu 3.33E-09
Benzo(k)fluoranthene 1.55E-07 lb/MMBtu 5.21E-09
Benzo(a)pyrene 1.88E-07 lb/MMBtu 6.32E-09
Rosemont Copper ProjectEmission Inventory Information JBR ENVIRONMENTAL CONSULTANTS, INC.
November 2011Page H327
AZRP00509
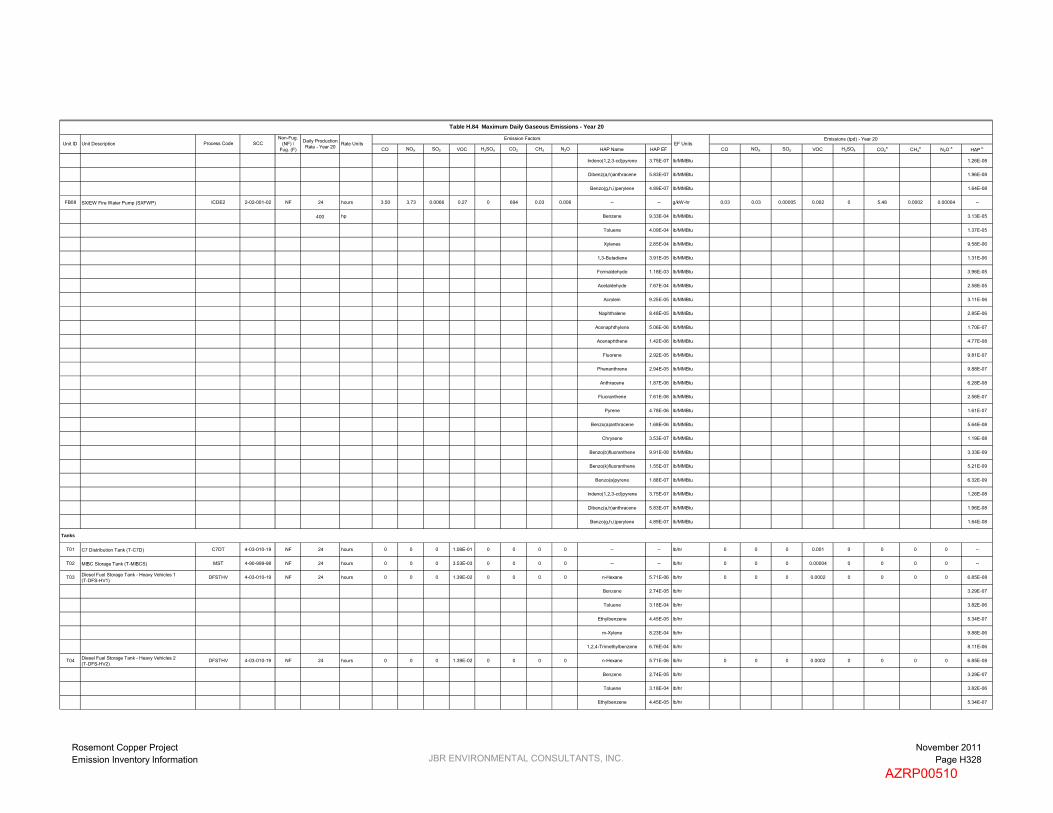
CO NOX SO2 VOC H2SO4 CO2 CH4 N2O HAP Name HAP EF CO NOX SO2 VOC H2SO4 CO2a CH4
a N2O a HAP bSCC
Emissions (tpd) - Year 20Daily Production Rate - Year 20
Emission FactorsUnit ID EF UnitsUnit Description Process Code
Non-Fug. (NF) /
Fug. (F)
Table H.84 Maximum Daily Gaseous Emissions - Year 20
Rate Units
Indeno(1,2,3-cd)pyrene 3.75E-07 lb/MMBtu 1.26E-08
Dibenz(a,h)anthracene 5.83E-07 lb/MMBtu 1.96E-08
Benzo(g,h,i)perylene 4.89E-07 lb/MMBtu 1.64E-08
FB08 SX/EW Fire Water Pump (SXFWP) ICDE2 2-02-001-02 NF 24 hours 3.50 3.73 0.0066 0.27 0 694 0.03 0.006 -- -- g/kW-hr 0.03 0.03 0.00005 0.002 0 5.48 0.0002 0.00004 --
400 hp Benzene 9.33E-04 lb/MMBtu 3.13E-05
Toluene 4.09E-04 lb/MMBtu 1.37E-05
Xylenes 2.85E-04 lb/MMBtu 9.58E-06
1,3-Butadiene 3.91E-05 lb/MMBtu 1.31E-06
Formaldehyde 1.18E-03 lb/MMBtu 3.96E-05
Acetaldehyde 7.67E-04 lb/MMBtu 2.58E-05
Acrolein 9.25E-05 lb/MMBtu 3.11E-06
Naphthalene 8.48E-05 lb/MMBtu 2.85E-06
Acenaphthylene 5.06E-06 lb/MMBtu 1.70E-07
Acenaphthene 1.42E-06 lb/MMBtu 4.77E-08
Fluorene 2.92E-05 lb/MMBtu 9.81E-07
Phenanthrene 2.94E-05 lb/MMBtu 9.88E-07
Anthracene 1.87E-06 lb/MMBtu 6.28E-08
Fluoranthene 7.61E-06 lb/MMBtu 2.56E-07
Pyrene 4.78E-06 lb/MMBtu 1.61E-07
Benzo(a)anthracene 1.68E-06 lb/MMBtu 5.64E-08
Chrysene 3.53E-07 lb/MMBtu 1.19E-08
Benzo(b)fluoranthene 9.91E-08 lb/MMBtu 3.33E-09
Benzo(k)fluoranthene 1.55E-07 lb/MMBtu 5.21E-09
Benzo(a)pyrene 1.88E-07 lb/MMBtu 6.32E-09
Indeno(1,2,3-cd)pyrene 3.75E-07 lb/MMBtu 1.26E-08
Dibenz(a,h)anthracene 5.83E-07 lb/MMBtu 1.96E-08
Benzo(g,h,i)perylene 4.89E-07 lb/MMBtu 1.64E-08
Tanks
T01 C7 Distribution Tank (T-C7D) C7DT 4-03-010-19 NF 24 hours 0 0 0 1.08E-01 0 0 0 0 -- -- lb/hr 0 0 0 0.001 0 0 0 0 --
T02 MIBC Storage Tank (T-MIBCS) MST 4-90-999-98 NF 24 hours 0 0 0 3.53E-03 0 0 0 0 -- -- lb/hr 0 0 0 0.00004 0 0 0 0 --
T03 Diesel Fuel Storage Tank - Heavy Vehicles 1(T-DFS-HV1)
DFSTHV 4-03-010-19 NF 24 hours 0 0 0 1.39E-02 0 0 0 0 n-Hexane 5.71E-06 lb/hr 0 0 0 0.0002 0 0 0 0 6.85E-08
Benzene 2.74E-05 lb/hr 3.29E-07
Toluene 3.18E-04 lb/hr 3.82E-06
Ethylbenzene 4.45E-05 lb/hr 5.34E-07
m-Xylene 8.23E-04 lb/hr 9.88E-06
1,2,4-Trimethylbenzene 6.76E-04 lb/hr 8.11E-06
T04 Diesel Fuel Storage Tank - Heavy Vehicles 2(T-DFS-HV2)
DFSTHV 4-03-010-19 NF 24 hours 0 0 0 1.39E-02 0 0 0 0 n-Hexane 5.71E-06 lb/hr 0 0 0 0.0002 0 0 0 0 6.85E-08
Benzene 2.74E-05 lb/hr 3.29E-07
Toluene 3.18E-04 lb/hr 3.82E-06
Ethylbenzene 4.45E-05 lb/hr 5.34E-07
Rosemont Copper ProjectEmission Inventory Information JBR ENVIRONMENTAL CONSULTANTS, INC.
November 2011Page H328
AZRP00510

CO NOX SO2 VOC H2SO4 CO2 CH4 N2O HAP Name HAP EF CO NOX SO2 VOC H2SO4 CO2a CH4
a N2O a HAP bSCC
Emissions (tpd) - Year 20Daily Production Rate - Year 20
Emission FactorsUnit ID EF UnitsUnit Description Process Code
Non-Fug. (NF) /
Fug. (F)
Table H.84 Maximum Daily Gaseous Emissions - Year 20
Rate Units
m-Xylene 8.23E-04 lb/hr 9.88E-06
1,2,4-Trimethylbenzene 6.76E-04 lb/hr 8.11E-06
0.39 0.63 0.0008 0.04 0.00005 88.36 0.004 0.0007 0.001
1.74 0.44 0.05 0.01 0 14.73 0.0006 0.0001 0.009
2.13 1.07 0.05 0.05 0.00005 103.09 0.004 0.0008 0.01
2.68 3.72 0.006 0.26 -- 523.53 -- -- --
a CO2e emissions are calculcated by summing the individual greenhouse gas emissions multiplied by their global warming potential (GWP). GWP of CO2 = 1, GWP of CH4 = 21, GWP of N2O = 310.
b All HAP emissions are included in the facility-wide potential to emit, regardless of if they are fugitive or non-fugitive emissions.
Tailpipe Emissions (see Tables H.89-H.93):
Total Emissions (excluding tailpipe emissions):
Total Non-Fugitive Emissions (excluding tailpipe emissions):
Total Fugitive Emissions (excluding tailpipe emissions):
Rosemont Copper ProjectEmission Inventory Information JBR ENVIRONMENTAL CONSULTANTS, INC.
November 2011Page H329
AZRP00511

CO NOX SO2 VOC H2SO4 CO2 CH4 N2O HAP Name HAP EF CO NOX SO2 VOC H2SO4 CO2a CH4
a N2O a HAP b
Mining
MN02 Blasting Blast 3-05-020-09 F 52 tons ANFO 67.00 17.00 2.00 0 0 566 0.02 0.005 -- -- lb/tons ANFO 3,484.00 884.00 104.00 0 0 29,455.36 1.19 0.24 --
Solvent Extraction and Electrowinning
SXE01 Solvent Extraction SX 4-90-001-99 F 1 hours 0 0 0 9.43E-05 0 0 0 0 Benzene 3.37E-07 lb/hr-ft2 0 0 0 0.86 0 0 0 0 3.08E-03
4 Primary Mix Tanks (7.75' D x 9.75' H each) 4 @ 47.2 = 188.7 ft2 9,132.9 ft2 Total Surface Area of Solvent Extraction Toluene 4.82E-06 lb/hr-ft2 4.40E-02
4 Secondary Mix Tanks (9.5' D x 9.75' H each) 4 @ 70.9 = 283.5 ft2 Ethylbenzene 2.05E-05 lb/hr-ft2 1.87E-01
3 Tertiary Mix Tanks (9.5' D x 9.75' H each) 3 @ 70.9 = 212.6 ft2 Xylenes 2.80E-05 lb/hr-ft2 2.56E-01
4 Extraction Settlers (64' L x 33' W x 3.33' H each) 4 @ 2,112 = 8,448 ft2 Others (including Hexane) 2.94E-05 lb/hr-ft2 2.69E-01
SXE02 Electrowinning Commercial Cells (EWCC) EW none NF 1 hours 0 0 0 0 1.57E-04 0 0 0 Cobalt Compounds 2.36E-08 lb/hr-ft2 0 0 0 0 0.004 0 0 0 6.22E-07
Controlled by Cell Ventilation Scrubbers(PC-EWCVS1/EWCVS6)
2,640 ft2
99 Control Efficiency (%)
Fuel Burning Equipment
FB01 Diesel Electrowinning Hot Water Generator (HWG) DFB 1-02-005-03 NF 1 hours 5.00 20.00 0.21 0.20 0 23,217 0.94 0.19 POM 3.30E-03 lb/1000 gal 0.22 0.88 0.009 0.009 0 1,016.78 0.04 0.008 1.45E-04
6.0 MMBtu/hr Formaldehyde 6.10E-02 lb/1000 gal 2.67E-03
Arsenic 4.00 lb/1012 Btu 2.40E-05
Beryllium 3.00 lb/1012 Btu 1.80E-05
Cadmium 3.00 lb/1012 Btu 1.80E-05
Chromium 3.00 lb/1012 Btu 1.80E-05
Lead 9.00 lb/1012 Btu 5.40E-05
Mercury 3.00 lb/1012 Btu 1.80E-05
Manganese 6.00 lb/1012 Btu 3.60E-05
Nickel 3.00 lb/1012 Btu 1.80E-05
Selenium 15.00 lb/1012 Btu 9.00E-05
FB02 Thickener Area Emergency Generator (TEG) ICDE3 2-02-001-02 NF 1 hours 3.50 6.00 0.0066 0.40 0 694 0.03 0.006 -- -- g/kW-hr 7.72 13.23 0.01 0.88 0 1,530.61 0.06 0.01 --
1,000 kW Benzene 7.76E-04 lb/MMBtu 7.28E-03
Toluene 2.81E-04 lb/MMBtu 2.64E-03
Xylenes 1.93E-04 lb/MMBtu 1.81E-03
Formaldehyde 7.89E-05 lb/MMBtu 7.41E-04
Acetaldehyde 2.52E-05 lb/MMBtu 2.37E-04
Acrolein 7.88E-06 lb/MMBtu 7.40E-05
Naphthalene 1.30E-04 lb/MMBtu 1.22E-03
Acenaphthylene 9.23E-06 lb/MMBtu 8.66E-05
Acenaphthene 4.68E-06 lb/MMBtu 4.39E-05
Fluorene 1.28E-05 lb/MMBtu 1.20E-04
Phenanthrene 4.08E-05 lb/MMBtu 3.83E-04
Anthracene 1.23E-06 lb/MMBtu 1.15E-05
Fluoranthene 4.03E-06 lb/MMBtu 3.78E-05
Pyrene 3.71E-06 lb/MMBtu 3.48E-05
Benz(a)anthracene 6.22E-07 lb/MMBtu 5.84E-06
Chrysene 1.53E-06 lb/MMBtu 1.44E-05
SCCEmissions (lb/hr) - Year 20Hourly
Production Rate - Year 20
Emission FactorsUnit ID EF UnitsUnit Description Process Code
Non-Fug. (NF) /
Fug. (F)
Table H.85 Hourly Gaseous Emissions - Year 20
Rate Units
Rosemont Copper ProjectEmission Inventory Information JBR ENVIRONMENTAL CONSULTANTS, INC.
November 2011Page H330
AZRP00512

CO NOX SO2 VOC H2SO4 CO2 CH4 N2O HAP Name HAP EF CO NOX SO2 VOC H2SO4 CO2a CH4
a N2O a HAP bSCC
Emissions (lb/hr) - Year 20Hourly Production Rate -
Year 20
Emission FactorsUnit ID EF UnitsUnit Description Process Code
Non-Fug. (NF) /
Fug. (F)
Table H.85 Hourly Gaseous Emissions - Year 20
Rate Units
Benzo(b)fluoranthene 1.11E-06 lb/MMBtu 1.04E-05
Benzo(k)fluoranthene 2.18E-07 lb/MMBtu 2.05E-06
Benzo(a)pyrene 2.57E-07 lb/MMBtu 2.41E-06
Indeno(1,2,3-cd)pyrene 4.14E-07 lb/MMBtu 3.89E-06
Dibenz(a,h)anthracene 3.46E-07 lb/MMBtu 3.25E-06
Benzo(g,h,i)perylene 5.56E-07 lb/MMBtu 5.22E-06
FB03 PLS Pond Area Emergency Generator (PEG) ICDE3 2-02-001-02 NF 1 hours 3.50 6.00 0.0066 0.40 0 694 0.03 0.006 -- -- g/kW-hr 7.72 13.23 0.01 0.88 0 1,530.61 0.06 0.01 --
1,000 kW Benzene 7.76E-04 lb/MMBtu 7.28E-03
Toluene 2.81E-04 lb/MMBtu 2.64E-03
Xylenes 1.93E-04 lb/MMBtu 1.81E-03
Formaldehyde 7.89E-05 lb/MMBtu 7.41E-04
Acetaldehyde 2.52E-05 lb/MMBtu 2.37E-04
Acrolein 7.88E-06 lb/MMBtu 7.40E-05
Naphthalene 1.30E-04 lb/MMBtu 1.22E-03
Acenaphthylene 9.23E-06 lb/MMBtu 8.66E-05
Acenaphthene 4.68E-06 lb/MMBtu 4.39E-05
Fluorene 1.28E-05 lb/MMBtu 1.20E-04
Phenanthrene 4.08E-05 lb/MMBtu 3.83E-04
Anthracene 1.23E-06 lb/MMBtu 1.15E-05
Fluoranthene 4.03E-06 lb/MMBtu 3.78E-05
Pyrene 3.71E-06 lb/MMBtu 3.48E-05
Benz(a)anthracene 6.22E-07 lb/MMBtu 5.84E-06
Chrysene 1.53E-06 lb/MMBtu 1.44E-05
Benzo(b)fluoranthene 1.11E-06 lb/MMBtu 1.04E-05
Benzo(k)fluoranthene 2.18E-07 lb/MMBtu 2.05E-06
Benzo(a)pyrene 2.57E-07 lb/MMBtu 2.41E-06
Indeno(1,2,3-cd)pyrene 4.14E-07 lb/MMBtu 3.89E-06
Dibenz(a,h)anthracene 3.46E-07 lb/MMBtu 3.25E-06
Benzo(g,h,i)perylene 5.56E-07 lb/MMBtu 5.22E-06
FB04 Main Substation Emergency Generator (MEG) ICDE3 2-02-001-02 NF 1 hours 3.50 6.00 0.0066 0.40 0 694 0.03 0.006 -- -- g/kW-hr 5.79 9.92 0.01 0.66 0 1,147.96 0.05 0.009 --
750 kW Benzene 7.76E-04 lb/MMBtu 5.46E-03
Toluene 2.81E-04 lb/MMBtu 1.98E-03
Xylenes 1.93E-04 lb/MMBtu 1.36E-03
Formaldehyde 7.89E-05 lb/MMBtu 5.55E-04
Acetaldehyde 2.52E-05 lb/MMBtu 1.77E-04
Acrolein 7.88E-06 lb/MMBtu 5.55E-05
Naphthalene 1.30E-04 lb/MMBtu 9.15E-04
Acenaphthylene 9.23E-06 lb/MMBtu 6.50E-05
Acenaphthene 4.68E-06 lb/MMBtu 3.29E-05
Fluorene 1.28E-05 lb/MMBtu 9.01E-05
Rosemont Copper ProjectEmission Inventory Information JBR ENVIRONMENTAL CONSULTANTS, INC.
November 2011Page H331
AZRP00513

CO NOX SO2 VOC H2SO4 CO2 CH4 N2O HAP Name HAP EF CO NOX SO2 VOC H2SO4 CO2a CH4
a N2O a HAP bSCC
Emissions (lb/hr) - Year 20Hourly Production Rate -
Year 20
Emission FactorsUnit ID EF UnitsUnit Description Process Code
Non-Fug. (NF) /
Fug. (F)
Table H.85 Hourly Gaseous Emissions - Year 20
Rate Units
Phenanthrene 4.08E-05 lb/MMBtu 2.87E-04
Anthracene 1.23E-06 lb/MMBtu 8.66E-06
Fluoranthene 4.03E-06 lb/MMBtu 2.84E-05
Pyrene 3.71E-06 lb/MMBtu 2.61E-05
Benz(a)anthracene 6.22E-07 lb/MMBtu 4.38E-06
Chrysene 1.53E-06 lb/MMBtu 1.08E-05
Benzo(b)fluoranthene 1.11E-06 lb/MMBtu 7.81E-06
Benzo(k)fluoranthene 2.18E-07 lb/MMBtu 1.53E-06
Benzo(a)pyrene 2.57E-07 lb/MMBtu 1.81E-06
Indeno(1,2,3-cd)pyrene 4.14E-07 lb/MMBtu 2.91E-06
Dibenz(a,h)anthracene 3.46E-07 lb/MMBtu 2.44E-06
Benzo(g,h,i)perylene 5.56E-07 lb/MMBtu 3.91E-06
FB05 Administration Building Emergency Generator (AEG) ICDE3 2-02-001-02 NF 1 hours 3.50 6.00 0.0066 0.40 0 694 0.03 0.006 -- -- g/kW-hr 5.79 9.92 0.01 0.66 0 1,147.96 0.05 0.009 --
750 kW Benzene 7.76E-04 lb/MMBtu 5.46E-03
Toluene 2.81E-04 lb/MMBtu 1.98E-03
Xylenes 1.93E-04 lb/MMBtu 1.36E-03
Formaldehyde 7.89E-05 lb/MMBtu 5.55E-04
Acetaldehyde 2.52E-05 lb/MMBtu 1.77E-04
Acrolein 7.88E-06 lb/MMBtu 5.55E-05
Naphthalene 1.30E-04 lb/MMBtu 9.15E-04
Acenaphthylene 9.23E-06 lb/MMBtu 6.50E-05
Acenaphthene 4.68E-06 lb/MMBtu 3.29E-05
Fluorene 1.28E-05 lb/MMBtu 9.01E-05
Phenanthrene 4.08E-05 lb/MMBtu 2.87E-04
Anthracene 1.23E-06 lb/MMBtu 8.66E-06
Fluoranthene 4.03E-06 lb/MMBtu 2.84E-05
Pyrene 3.71E-06 lb/MMBtu 2.61E-05
Benz(a)anthracene 6.22E-07 lb/MMBtu 4.38E-06
Chrysene 1.53E-06 lb/MMBtu 1.08E-05
Benzo(b)fluoranthene 1.11E-06 lb/MMBtu 7.81E-06
Benzo(k)fluoranthene 2.18E-07 lb/MMBtu 1.53E-06
Benzo(a)pyrene 2.57E-07 lb/MMBtu 1.81E-06
Indeno(1,2,3-cd)pyrene 4.14E-07 lb/MMBtu 2.91E-06
Dibenz(a,h)anthracene 3.46E-07 lb/MMBtu 2.44E-06
Benzo(g,h,i)perylene 5.56E-07 lb/MMBtu 3.91E-06
FB06 Electrowinning Building Emergency Generator (EWEG)
ICDE1 2-02-001-02 NF 1 hours 5.00 4.43 0.0066 0.27 0 694 0.03 0.006 -- -- g/kW-hr 0.55 0.49 0.0007 0.03 0 76.53 0.003 0.0006 --
50 kW Benzene 9.33E-04 lb/MMBtu 4.38E-04
Toluene 4.09E-04 lb/MMBtu 1.92E-04
Xylenes 2.85E-04 lb/MMBtu 1.34E-04
1,3-Butadiene 3.91E-05 lb/MMBtu 1.84E-05
Rosemont Copper ProjectEmission Inventory Information JBR ENVIRONMENTAL CONSULTANTS, INC.
November 2011Page H332
AZRP00514

CO NOX SO2 VOC H2SO4 CO2 CH4 N2O HAP Name HAP EF CO NOX SO2 VOC H2SO4 CO2a CH4
a N2O a HAP bSCC
Emissions (lb/hr) - Year 20Hourly Production Rate -
Year 20
Emission FactorsUnit ID EF UnitsUnit Description Process Code
Non-Fug. (NF) /
Fug. (F)
Table H.85 Hourly Gaseous Emissions - Year 20
Rate Units
Formaldehyde 1.18E-03 lb/MMBtu 5.54E-04
Acetaldehyde 7.67E-04 lb/MMBtu 3.60E-04
Acrolein 9.25E-05 lb/MMBtu 4.34E-05
Naphthalene 8.48E-05 lb/MMBtu 3.98E-05
Acenaphthylene 5.06E-06 lb/MMBtu 2.37E-06
Acenaphthene 1.42E-06 lb/MMBtu 6.66E-07
Fluorene 2.92E-05 lb/MMBtu 1.37E-05
Phenanthrene 2.94E-05 lb/MMBtu 1.38E-05
Anthracene 1.87E-06 lb/MMBtu 8.78E-07
Fluoranthene 7.61E-06 lb/MMBtu 3.57E-06
Pyrene 4.78E-06 lb/MMBtu 2.24E-06
Benzo(a)anthracene 1.68E-06 lb/MMBtu 7.89E-07
Chrysene 3.53E-07 lb/MMBtu 1.66E-07
Benzo(b)fluoranthene 9.91E-08 lb/MMBtu 4.65E-08
Benzo(k)fluoranthene 1.55E-07 lb/MMBtu 7.28E-08
Benzo(a)pyrene 1.88E-07 lb/MMBtu 8.82E-08
Indeno(1,2,3-cd)pyrene 3.75E-07 lb/MMBtu 1.76E-07
Dibenz(a,h)anthracene 5.83E-07 lb/MMBtu 2.74E-07
Benzo(g,h,i)perylene 4.89E-07 lb/MMBtu 2.30E-07
FB07 Primary Crusher Fire Water Pump (PCFWP) ICDE2 2-02-001-02 NF 1 hours 3.50 3.73 0.0066 0.27 0 694 0.03 0.006 -- -- g/kW-hr 2.30 2.46 0.004 0.18 0 456.55 0.02 0.004 --
400 hp Benzene 9.33E-04 lb/MMBtu 2.61E-03
Toluene 4.09E-04 lb/MMBtu 1.15E-03
Xylenes 2.85E-04 lb/MMBtu 7.98E-04
1,3-Butadiene 3.91E-05 lb/MMBtu 1.09E-04
Formaldehyde 1.18E-03 lb/MMBtu 3.30E-03
Acetaldehyde 7.67E-04 lb/MMBtu 2.15E-03
Acrolein 9.25E-05 lb/MMBtu 2.59E-04
Naphthalene 8.48E-05 lb/MMBtu 2.37E-04
Acenaphthylene 5.06E-06 lb/MMBtu 1.42E-05
Acenaphthene 1.42E-06 lb/MMBtu 3.98E-06
Fluorene 2.92E-05 lb/MMBtu 8.18E-05
Phenanthrene 2.94E-05 lb/MMBtu 8.23E-05
Anthracene 1.87E-06 lb/MMBtu 5.24E-06
Fluoranthene 7.61E-06 lb/MMBtu 2.13E-05
Pyrene 4.78E-06 lb/MMBtu 1.34E-05
Benzo(a)anthracene 1.68E-06 lb/MMBtu 4.70E-06
Chrysene 3.53E-07 lb/MMBtu 9.88E-07
Benzo(b)fluoranthene 9.91E-08 lb/MMBtu 2.77E-07
Benzo(k)fluoranthene 1.55E-07 lb/MMBtu 4.34E-07
Benzo(a)pyrene 1.88E-07 lb/MMBtu 5.26E-07
Rosemont Copper ProjectEmission Inventory Information JBR ENVIRONMENTAL CONSULTANTS, INC.
November 2011Page H333
AZRP00515

CO NOX SO2 VOC H2SO4 CO2 CH4 N2O HAP Name HAP EF CO NOX SO2 VOC H2SO4 CO2a CH4
a N2O a HAP bSCC
Emissions (lb/hr) - Year 20Hourly Production Rate -
Year 20
Emission FactorsUnit ID EF UnitsUnit Description Process Code
Non-Fug. (NF) /
Fug. (F)
Table H.85 Hourly Gaseous Emissions - Year 20
Rate Units
Indeno(1,2,3-cd)pyrene 3.75E-07 lb/MMBtu 1.05E-06
Dibenz(a,h)anthracene 5.83E-07 lb/MMBtu 1.63E-06
Benzo(g,h,i)perylene 4.89E-07 lb/MMBtu 1.37E-06
FB08 SX/EW Fire Water Pump (SXFWP) ICDE2 2-02-001-02 NF 1 hours 3.50 3.73 0.0066 0.27 0 694 0.03 0.006 -- -- g/kW-hr 2.30 2.46 0.004 0.18 0 456.55 0.02 0.004 --
400 hp Benzene 9.33E-04 lb/MMBtu 2.61E-03
Toluene 4.09E-04 lb/MMBtu 1.15E-03
Xylenes 2.85E-04 lb/MMBtu 7.98E-04
1,3-Butadiene 3.91E-05 lb/MMBtu 1.09E-04
Formaldehyde 1.18E-03 lb/MMBtu 3.30E-03
Acetaldehyde 7.67E-04 lb/MMBtu 2.15E-03
Acrolein 9.25E-05 lb/MMBtu 2.59E-04
Naphthalene 8.48E-05 lb/MMBtu 2.37E-04
Acenaphthylene 5.06E-06 lb/MMBtu 1.42E-05
Acenaphthene 1.42E-06 lb/MMBtu 3.98E-06
Fluorene 2.92E-05 lb/MMBtu 8.18E-05
Phenanthrene 2.94E-05 lb/MMBtu 8.23E-05
Anthracene 1.87E-06 lb/MMBtu 5.24E-06
Fluoranthene 7.61E-06 lb/MMBtu 2.13E-05
Pyrene 4.78E-06 lb/MMBtu 1.34E-05
Benzo(a)anthracene 1.68E-06 lb/MMBtu 4.70E-06
Chrysene 3.53E-07 lb/MMBtu 9.88E-07
Benzo(b)fluoranthene 9.91E-08 lb/MMBtu 2.77E-07
Benzo(k)fluoranthene 1.55E-07 lb/MMBtu 4.34E-07
Benzo(a)pyrene 1.88E-07 lb/MMBtu 5.26E-07
Indeno(1,2,3-cd)pyrene 3.75E-07 lb/MMBtu 1.05E-06
Dibenz(a,h)anthracene 5.83E-07 lb/MMBtu 1.63E-06
Benzo(g,h,i)perylene 4.89E-07 lb/MMBtu 1.37E-06
Tanks
T01 C7 Distribution Tank (T-C7D) C7DT 4-03-010-19 NF 1 hours 0 0 0 1.08E-01 0 0 0 0 -- -- lb/hr 0 0 0 0.11 0 0 0 0 --
T02 MIBC Storage Tank (T-MIBCS) MST 4-90-999-98 NF 1 hours 0 0 0 3.53E-03 0 0 0 0 -- -- lb/hr 0 0 0 0.004 0 0 0 0 --
T03 Diesel Fuel Storage Tank - Heavy Vehicles 1(T-DFS-HV1)
DFSTHV 4-03-010-19 NF 1 hours 0 0 0 1.39E-02 0 0 0 0 n-Hexane 5.71E-06 lb/hr 0 0 0 0.01 0 0 0 0 5.71E-06
Benzene 2.74E-05 lb/hr 2.74E-05
Toluene 3.18E-04 lb/hr 3.18E-04
Ethylbenzene 4.45E-05 lb/hr 4.45E-05
m-Xylene 8.23E-04 lb/hr 8.23E-04
1,2,4-Trimethylbenzene 6.76E-04 lb/hr 6.76E-04
T04 Diesel Fuel Storage Tank - Heavy Vehicles 2(T-DFS-HV2)
DFSTHV 4-03-010-19 NF 1 hours 0 0 0 1.39E-02 0 0 0 0 n-Hexane 5.71E-06 lb/hr 0 0 0 0.01 0 0 0 0 5.71E-06
Benzene 2.74E-05 lb/hr 2.74E-05
Toluene 3.18E-04 lb/hr 3.18E-04
Ethylbenzene 4.45E-05 lb/hr 4.45E-05
Rosemont Copper ProjectEmission Inventory Information JBR ENVIRONMENTAL CONSULTANTS, INC.
November 2011Page H334
AZRP00516
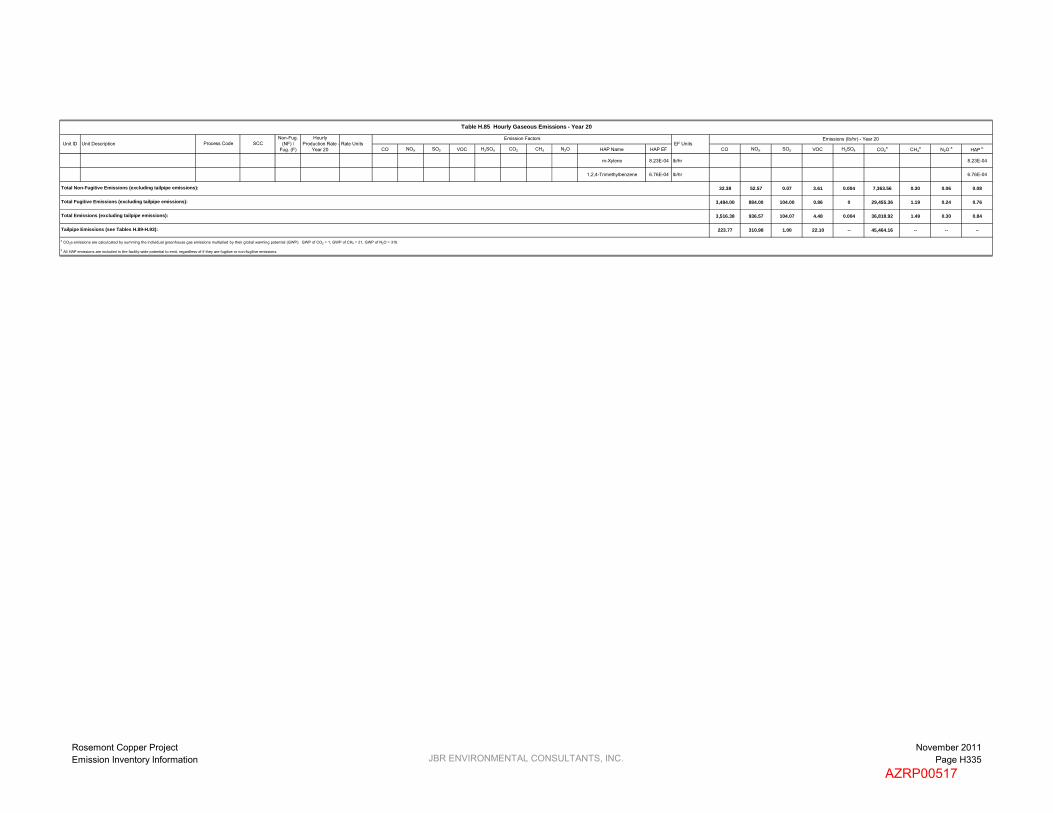
CO NOX SO2 VOC H2SO4 CO2 CH4 N2O HAP Name HAP EF CO NOX SO2 VOC H2SO4 CO2a CH4
a N2O a HAP bSCC
Emissions (lb/hr) - Year 20Hourly Production Rate -
Year 20
Emission FactorsUnit ID EF UnitsUnit Description Process Code
Non-Fug. (NF) /
Fug. (F)
Table H.85 Hourly Gaseous Emissions - Year 20
Rate Units
m-Xylene 8.23E-04 lb/hr 8.23E-04
1,2,4-Trimethylbenzene 6.76E-04 lb/hr 6.76E-04
32.38 52.57 0.07 3.61 0.004 7,363.56 0.30 0.06 0.08
3,484.00 884.00 104.00 0.86 0 29,455.36 1.19 0.24 0.76
3,516.38 936.57 104.07 4.48 0.004 36,818.92 1.49 0.30 0.84
223.77 310.98 1.00 22.10 -- 45,464.16 -- -- --
a CO2e emissions are calculcated by summing the individual greenhouse gas emissions multiplied by their global warming potential (GWP). GWP of CO2 = 1, GWP of CH4 = 21, GWP of N2O = 310.
b All HAP emissions are included in the facility-wide potential to emit, regardless of if they are fugitive or non-fugitive emissions.
Tailpipe Emissions (see Tables H.89-H.93):
Total Emissions (excluding tailpipe emissions):
Total Non-Fugitive Emissions (excluding tailpipe emissions):
Total Fugitive Emissions (excluding tailpipe emissions):
Rosemont Copper ProjectEmission Inventory Information JBR ENVIRONMENTAL CONSULTANTS, INC.
November 2011Page H335
AZRP00517
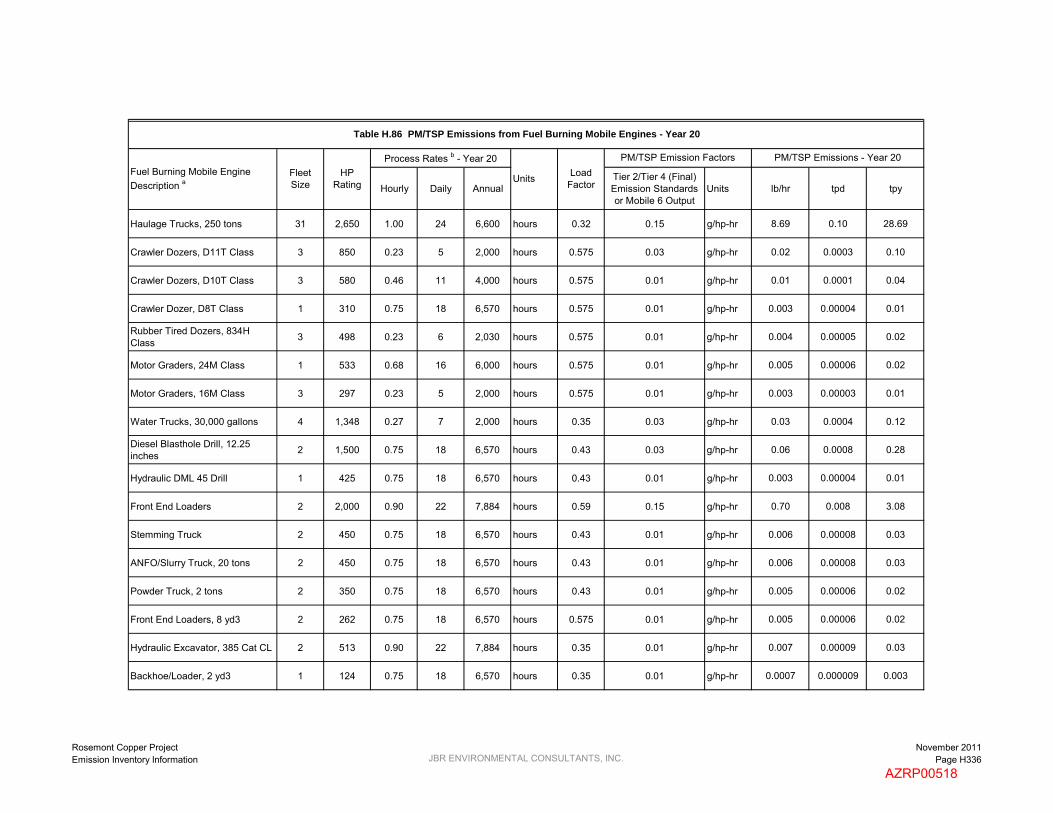
Hourly Daily AnnualTier 2/Tier 4 (Final) Emission Standards or Mobile 6 Output
Units lb/hr tpd tpy
Haulage Trucks, 250 tons 31 2,650 1.00 24 6,600 hours 0.32 0.15 g/hp-hr 8.69 0.10 28.69
Crawler Dozers, D11T Class 3 850 0.23 5 2,000 hours 0.575 0.03 g/hp-hr 0.02 0.0003 0.10
Crawler Dozers, D10T Class 3 580 0.46 11 4,000 hours 0.575 0.01 g/hp-hr 0.01 0.0001 0.04
Crawler Dozer, D8T Class 1 310 0.75 18 6,570 hours 0.575 0.01 g/hp-hr 0.003 0.00004 0.01
Rubber Tired Dozers, 834H Class 3 498 0.23 6 2,030 hours 0.575 0.01 g/hp-hr 0.004 0.00005 0.02
Motor Graders, 24M Class 1 533 0.68 16 6,000 hours 0.575 0.01 g/hp-hr 0.005 0.00006 0.02
Motor Graders, 16M Class 3 297 0.23 5 2,000 hours 0.575 0.01 g/hp-hr 0.003 0.00003 0.01
Water Trucks, 30,000 gallons 4 1,348 0.27 7 2,000 hours 0.35 0.03 g/hp-hr 0.03 0.0004 0.12
Diesel Blasthole Drill, 12.25 inches 2 1,500 0.75 18 6,570 hours 0.43 0.03 g/hp-hr 0.06 0.0008 0.28
Hydraulic DML 45 Drill 1 425 0.75 18 6,570 hours 0.43 0.01 g/hp-hr 0.003 0.00004 0.01
Front End Loaders 2 2,000 0.90 22 7,884 hours 0.59 0.15 g/hp-hr 0.70 0.008 3.08
Stemming Truck 2 450 0.75 18 6,570 hours 0.43 0.01 g/hp-hr 0.006 0.00008 0.03
ANFO/Slurry Truck, 20 tons 2 450 0.75 18 6,570 hours 0.43 0.01 g/hp-hr 0.006 0.00008 0.03
Powder Truck, 2 tons 2 350 0.75 18 6,570 hours 0.43 0.01 g/hp-hr 0.005 0.00006 0.02
Front End Loaders, 8 yd3 2 262 0.75 18 6,570 hours 0.575 0.01 g/hp-hr 0.005 0.00006 0.02
Hydraulic Excavator, 385 Cat CL 2 513 0.90 22 7,884 hours 0.35 0.01 g/hp-hr 0.007 0.00009 0.03
Backhoe/Loader, 2 yd3 1 124 0.75 18 6,570 hours 0.35 0.01 g/hp-hr 0.0007 0.000009 0.003
PM/TSP Emissions - Year 20Load
Factor
PM/TSP Emission FactorsProcess Rates b - Year 20
Units
Table H.86 PM/TSP Emissions from Fuel Burning Mobile Engines - Year 20
Fuel Burning Mobile Engine Description a
Fleet Size
HP Rating
Rosemont Copper ProjectEmission Inventory Information JBR ENVIRONMENTAL CONSULTANTS, INC.
November 2011Page H336
AZRP00518
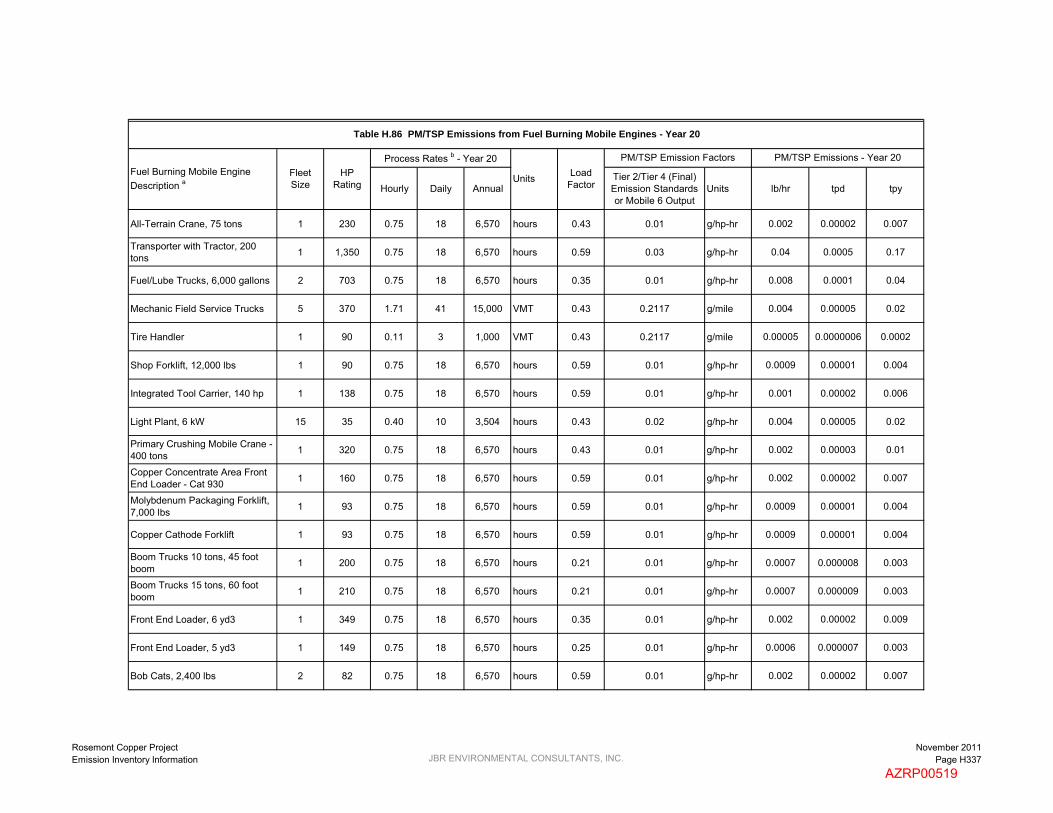
Hourly Daily AnnualTier 2/Tier 4 (Final) Emission Standards or Mobile 6 Output
Units lb/hr tpd tpy
PM/TSP Emissions - Year 20Load
Factor
PM/TSP Emission FactorsProcess Rates b - Year 20
Units
Table H.86 PM/TSP Emissions from Fuel Burning Mobile Engines - Year 20
Fuel Burning Mobile Engine Description a
Fleet Size
HP Rating
All-Terrain Crane, 75 tons 1 230 0.75 18 6,570 hours 0.43 0.01 g/hp-hr 0.002 0.00002 0.007
Transporter with Tractor, 200 tons 1 1,350 0.75 18 6,570 hours 0.59 0.03 g/hp-hr 0.04 0.0005 0.17
Fuel/Lube Trucks, 6,000 gallons 2 703 0.75 18 6,570 hours 0.35 0.01 g/hp-hr 0.008 0.0001 0.04
Mechanic Field Service Trucks 5 370 1.71 41 15,000 VMT 0.43 0.2117 g/mile 0.004 0.00005 0.02
Tire Handler 1 90 0.11 3 1,000 VMT 0.43 0.2117 g/mile 0.00005 0.0000006 0.0002
Shop Forklift, 12,000 lbs 1 90 0.75 18 6,570 hours 0.59 0.01 g/hp-hr 0.0009 0.00001 0.004
Integrated Tool Carrier, 140 hp 1 138 0.75 18 6,570 hours 0.59 0.01 g/hp-hr 0.001 0.00002 0.006
Light Plant, 6 kW 15 35 0.40 10 3,504 hours 0.43 0.02 g/hp-hr 0.004 0.00005 0.02
Primary Crushing Mobile Crane - 400 tons 1 320 0.75 18 6,570 hours 0.43 0.01 g/hp-hr 0.002 0.00003 0.01
Copper Concentrate Area Front End Loader - Cat 930 1 160 0.75 18 6,570 hours 0.59 0.01 g/hp-hr 0.002 0.00002 0.007
Molybdenum Packaging Forklift, 7,000 lbs 1 93 0.75 18 6,570 hours 0.59 0.01 g/hp-hr 0.0009 0.00001 0.004
Copper Cathode Forklift 1 93 0.75 18 6,570 hours 0.59 0.01 g/hp-hr 0.0009 0.00001 0.004
Boom Trucks 10 tons, 45 foot boom 1 200 0.75 18 6,570 hours 0.21 0.01 g/hp-hr 0.0007 0.000008 0.003
Boom Trucks 15 tons, 60 foot boom 1 210 0.75 18 6,570 hours 0.21 0.01 g/hp-hr 0.0007 0.000009 0.003
Front End Loader, 6 yd3 1 349 0.75 18 6,570 hours 0.35 0.01 g/hp-hr 0.002 0.00002 0.009
Front End Loader, 5 yd3 1 149 0.75 18 6,570 hours 0.25 0.01 g/hp-hr 0.0006 0.000007 0.003
Bob Cats, 2,400 lbs 2 82 0.75 18 6,570 hours 0.59 0.01 g/hp-hr 0.002 0.00002 0.007
Rosemont Copper ProjectEmission Inventory Information JBR ENVIRONMENTAL CONSULTANTS, INC.
November 2011Page H337
AZRP00519

Hourly Daily AnnualTier 2/Tier 4 (Final) Emission Standards or Mobile 6 Output
Units lb/hr tpd tpy
PM/TSP Emissions - Year 20Load
Factor
PM/TSP Emission FactorsProcess Rates b - Year 20
Units
Table H.86 PM/TSP Emissions from Fuel Burning Mobile Engines - Year 20
Fuel Burning Mobile Engine Description a
Fleet Size
HP Rating
Fork Lift, 2,000 lbs 1 50 0.75 18 6,570 hours 0.59 0.02 g/hp-hr 0.001 0.00001 0.004
Fork Lift, 5,000 lbs 1 63 0.75 18 6,570 hours 0.59 0.02 g/hp-hr 0.001 0.00001 0.005
Fork Lift, 3,000 lbs 2 50 0.75 18 6,570 hours 0.59 0.02 g/hp-hr 0.002 0.00002 0.009
Flat Bed Trucks, 10 tons 2 350 0.75 18 6,570 hours 0.43 0.01 g/hp-hr 0.005 0.00006 0.02
Dump Truck, 10 tons 1 250 0.34 8 3,000 VMT 0.43 0.2117 g/mile 0.0002 0.000002 0.0007
Mobile Hydraulic Crane, 60 tons 1 267 0.75 18 6,570 hours 0.43 0.01 g/hp-hr 0.002 0.00002 0.008
Truck Shop Bridge Crane, 60 tons 1 75 0.75 18 6,570 hours 0.43 0.01 g/hp-hr 0.0005 0.000006 0.002
Truck Shop Bridge Crane, 25 tons 1 24 0.75 18 6,570 hours 0.43 0.30 g/hp-hr 0.005 0.00006 0.02
CS683 Soil Compactor / Roller 2 173 0.75 18 6,570 hours 0.4 0.01 g/hp-hr 0.002 0.00003 0.01
246C Skid Steer Loader 2 73 0.75 18 6,570 hours 0.3 0.02 g/hp-hr 0.001 0.00002 0.006
RH200/340 O & K Shovel / Hitachi EX5500 1 2,520 0.75 18 6,570 hours 0.59 0.03 g/hp-hr 0.07 0.0009 0.32
Off-Road Tire Handling Truck 1 450 0.86 21 7,500 VMT 0.43 0.2117 g/mile 0.0004 0.000005 0.002
Contractor Haul Trucks, 25 tons 2 511 2.74 66 24,000 VMT 0.43 0.2117 g/mile 0.003 0.00003 0.01
Motivator for Mine Shovels 1 3,308 0.91 22 8,000 hours 0.43 0.02 g/hp-hr 0.06 0.0007 0.25
Storm Water Pond Pump 1 200 1.00 24 500 hours 1 0.01 g/hp-hr 0.004 0.00005 0.001
Mine Pit Dewatering Pump 4 100 1.00 24 500 hours 1 0.01 g/hp-hr 0.009 0.0001 0.002
Copper Concentrate Shipment Vehicles -- 450 29.60 1,021 169,872 VMT 0.43 0.2117 g/mile 0.01 0.0002 0.04
Rosemont Copper ProjectEmission Inventory Information JBR ENVIRONMENTAL CONSULTANTS, INC.
November 2011Page H338
AZRP00520

Hourly Daily AnnualTier 2/Tier 4 (Final) Emission Standards or Mobile 6 Output
Units lb/hr tpd tpy
PM/TSP Emissions - Year 20Load
Factor
PM/TSP Emission FactorsProcess Rates b - Year 20
Units
Table H.86 PM/TSP Emissions from Fuel Burning Mobile Engines - Year 20
Fuel Burning Mobile Engine Description a
Fleet Size
HP Rating
Molybdenum Concentrate Shipment Vehicles -- 450 7.40 15 2,145 VMT 0.43 0.2117 g/mile 0.003 0.000004 0.0005
Sulfuric Acid Delivery Vehicles -- 450 22.20 143 52,021 VMT 0.43 0.2117 g/mile 0.01 0.00003 0.01
Lime Delivery Vehicles -- 450 14.80 52 19,072 VMT 0.43 0.2117 g/mile 0.007 0.00001 0.004
SAG Mill and Ball Mill Grinding Balls Delivery Vehicles -- 450 14.80 23 5,858 VMT 0.43 0.2117 g/mile 0.007 0.000005 0.001
Diesel Fuel Delivery Vehicles -- 500 14.80 47 17,136 VMT 0.43 0.2117 g/mile 0.007 0.00001 0.004
Copper Cathode Shipment Vehicles -- 450 14.80 42 4,997 VMT 0.43 0.2117 g/mile 0.007 0.00001 0.001
Ammonium Nitrate Delivery Vehicles -- 450 7.40 25 6,384 VMT 0.43 0.2117 g/mile 0.003 0.000006 0.001
Miscellaneous Consumables Delivery Vehicles -- 450 7.40 48 12,486 VMT 0.43 0.2117 g/mile 0.003 0.00001 0.003
Miscellaneous Fuels and Lubricants Delivery Vehicles -- 450 7.40 7 1,110 VMT 0.43 0.2117 g/mile 0.003 0.000002 0.0003
Pickup Trucks (gasoline) 20 350 1.37 33 12,000 VMT 0.54 0.0255 g/mile 0.002 0.00002 0.007
Crew Van (gasoline) 3 350 0.91 22 8,000 VMT 0.54 0.0255 g/mile 0.0002 0.000002 0.0007
Lot Pick-Up Trucks (gasoline) 20 250 0.34 8 3,000 VMT 0.54 0.0255 g/mile 0.0004 0.000005 0.002
8.69 0.10 28.69
1.19 0.01 4.90
9.88 0.12 33.59
a Fuel burning mobile engines are diesel fuel fired unless otherwise noted.
b Except for the shipment and delivery vehicles, the process rates are for a single mobile engine. The process rates for the shipment and delivery vehicles are representative of the entire fleet.
Total Emissions from Haul Truck Engines:
Total Emissions from Other Mobile Engines:
Total Emissions from All Mobile Engines:
Rosemont Copper ProjectEmission Inventory Information JBR ENVIRONMENTAL CONSULTANTS, INC.
November 2011Page H339
AZRP00521

Hourly Daily AnnualTier 2/Tier 4 (Final) Emission Standards or Mobile 6 Output
Units lb/hr tpd tpy
Haulage Trucks, 250 tons 31 2,650 1.00 24 6,600 hours 0.32 0.15 g/hp-hr 8.69 0.10 28.69
Crawler Dozers, D11T Class 3 850 0.23 5 2,000 hours 0.575 0.03 g/hp-hr 0.02 0.0003 0.10
Crawler Dozers, D10T Class 3 580 0.46 11 4,000 hours 0.575 0.01 g/hp-hr 0.01 0.0001 0.04
Crawler Dozer, D8T Class 1 310 0.75 18 6,570 hours 0.575 0.01 g/hp-hr 0.003 0.00004 0.01
Rubber Tired Dozers, 834H Class 3 498 0.23 6 2,030 hours 0.575 0.01 g/hp-hr 0.004 0.00005 0.02
Motor Graders, 24M Class 1 533 0.68 16 6,000 hours 0.575 0.01 g/hp-hr 0.005 0.00006 0.02
Motor Graders, 16M Class 3 297 0.23 5 2,000 hours 0.575 0.01 g/hp-hr 0.003 0.00003 0.01
Water Trucks, 30,000 gallons 4 1,348 0.27 7 2,000 hours 0.35 0.03 g/hp-hr 0.03 0.0004 0.12
Diesel Blasthole Drill, 12.25 inches 2 1,500 0.75 18 6,570 hours 0.43 0.03 g/hp-hr 0.06 0.0008 0.28
Hydraulic DML 45 Drill 1 425 0.75 18 6,570 hours 0.43 0.01 g/hp-hr 0.003 0.00004 0.01
Front End Loaders 2 2,000 0.90 22 7,884 hours 0.59 0.15 g/hp-hr 0.70 0.008 3.08
Stemming Truck 2 450 0.75 18 6,570 hours 0.43 0.01 g/hp-hr 0.006 0.00008 0.03
ANFO/Slurry Truck, 20 tons 2 450 0.75 18 6,570 hours 0.43 0.01 g/hp-hr 0.006 0.00008 0.03
Powder Truck, 2 tons 2 350 0.75 18 6,570 hours 0.43 0.01 g/hp-hr 0.005 0.00006 0.02
Front End Loaders, 8 yd3 2 262 0.75 18 6,570 hours 0.575 0.01 g/hp-hr 0.005 0.00006 0.02
Hydraulic Excavator, 385 Cat CL 2 513 0.90 22 7,884 hours 0.35 0.01 g/hp-hr 0.007 0.00009 0.03
Backhoe/Loader, 2 yd3 1 124 0.75 18 6,570 hours 0.35 0.01 g/hp-hr 0.0007 0.000009 0.003
Table H.87 PM10 Emissions from Fuel Burning Mobile Engines - Year 20
PM10 Emissions - Year 20Load
Factor
PM10 Emission FactorFuel Burning Mobile Engine Description a
Fleet Size
HP Rating
Process Rates b - Year 20
Units
Rosemont Copper ProjectEmission Inventory Information JBR ENVIRONMENTAL CONSULTANTS, INC.
November 2011Page H340
AZRP00522

Hourly Daily AnnualTier 2/Tier 4 (Final) Emission Standards or Mobile 6 Output
Units lb/hr tpd tpy
Table H.87 PM10 Emissions from Fuel Burning Mobile Engines - Year 20
PM10 Emissions - Year 20Load
Factor
PM10 Emission FactorFuel Burning Mobile Engine Description a
Fleet Size
HP Rating
Process Rates b - Year 20
Units
All-Terrain Crane, 75 tons 1 230 0.75 18 6,570 hours 0.43 0.01 g/hp-hr 0.002 0.00002 0.007
Transporter with Tractor, 200 tons 1 1,350 0.75 18 6,570 hours 0.59 0.03 g/hp-hr 0.04 0.0005 0.17
Fuel/Lube Trucks, 6,000 gallons 2 703 0.75 18 6,570 hours 0.35 0.01 g/hp-hr 0.008 0.0001 0.04
Mechanic Field Service Trucks 5 370 1.71 41 15,000 VMT 0.43 0.2117 g/mile 0.004 0.00005 0.02
Tire Handler 1 90 0.11 3 1,000 VMT 0.43 0.2117 g/mile 0.00005 0.0000006 0.0002
Shop Forklift, 12,000 lbs 1 90 0.75 18 6,570 hours 0.59 0.01 g/hp-hr 0.0009 0.00001 0.004
Integrated Tool Carrier, 140 hp 1 138 0.75 18 6,570 hours 0.59 0.01 g/hp-hr 0.001 0.00002 0.006
Light Plant, 6 kW 15 35 0.40 10 3,504 hours 0.43 0.02 g/hp-hr 0.004 0.00005 0.02
Primary Crushing Mobile Crane - 400 tons 1 320 0.75 18 6,570 hours 0.43 0.01 g/hp-hr 0.002 0.00003 0.01
Copper Concentrate Area Front End Loader - Cat 930 1 160 0.75 18 6,570 hours 0.59 0.01 g/hp-hr 0.002 0.00002 0.007
Molybdenum Packaging Forklift, 7,000 lbs 1 93 0.75 18 6,570 hours 0.59 0.01 g/hp-hr 0.0009 0.00001 0.004
Copper Cathode Forklift 1 92.5 0.75 18 6,570 hours 0.59 0.01 g/hp-hr 0.0009 0.00001 0.004
Boom Trucks 10 tons, 45 foot boom 1 200 0.75 18 6,570 hours 0.21 0.01 g/hp-hr 0.0007 0.000008 0.003
Boom Trucks 15 tons, 60 foot boom 1 210 0.75 18 6,570 hours 0.21 0.01 g/hp-hr 0.0007 0.000009 0.003
Front End Loader, 6 yd3 1 349 0.75 18 6,570 hours 0.35 0.01 g/hp-hr 0.002 0.00002 0.009
Front End Loader, 5 yd3 1 149 0.75 18 6,570 hours 0.25 0.01 g/hp-hr 0.0006 0.000007 0.003
Bob Cats, 2,400 lbs 2 82 0.75 18 6,570 hours 0.59 0.01 g/hp-hr 0.002 0.00002 0.007
Rosemont Copper ProjectEmission Inventory Information JBR ENVIRONMENTAL CONSULTANTS, INC.
November 2011Page H341
AZRP00523
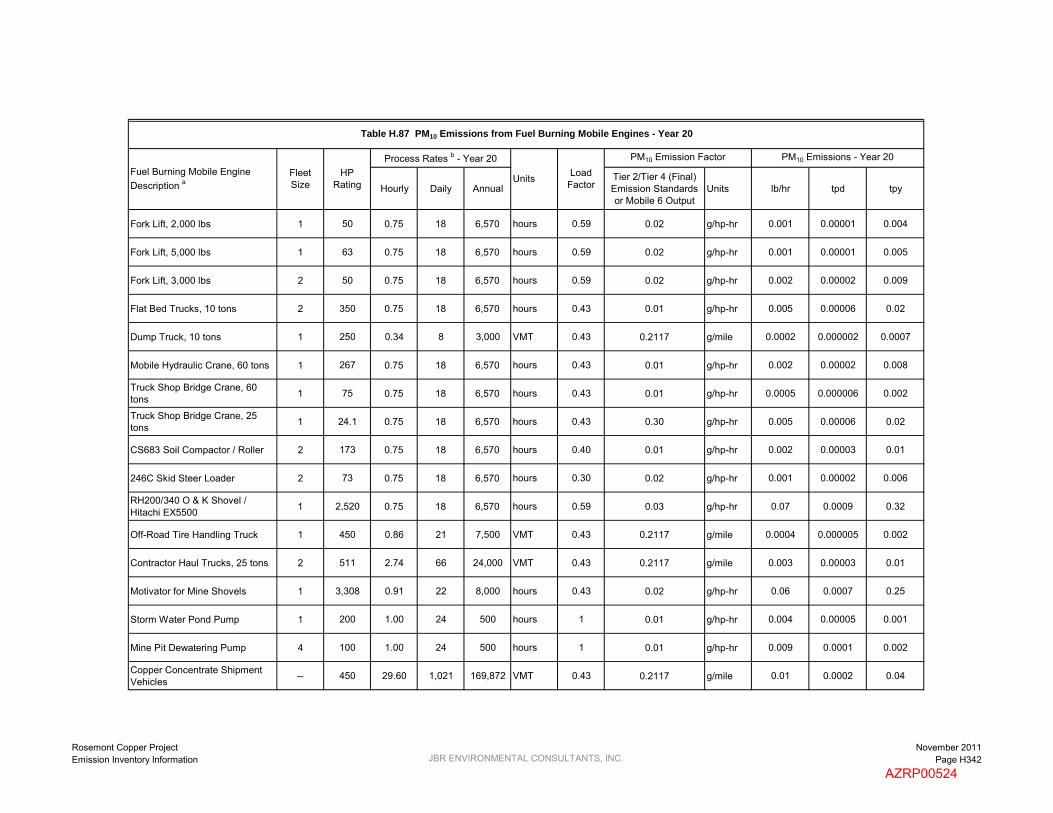
Hourly Daily AnnualTier 2/Tier 4 (Final) Emission Standards or Mobile 6 Output
Units lb/hr tpd tpy
Table H.87 PM10 Emissions from Fuel Burning Mobile Engines - Year 20
PM10 Emissions - Year 20Load
Factor
PM10 Emission FactorFuel Burning Mobile Engine Description a
Fleet Size
HP Rating
Process Rates b - Year 20
Units
Fork Lift, 2,000 lbs 1 50 0.75 18 6,570 hours 0.59 0.02 g/hp-hr 0.001 0.00001 0.004
Fork Lift, 5,000 lbs 1 63 0.75 18 6,570 hours 0.59 0.02 g/hp-hr 0.001 0.00001 0.005
Fork Lift, 3,000 lbs 2 50 0.75 18 6,570 hours 0.59 0.02 g/hp-hr 0.002 0.00002 0.009
Flat Bed Trucks, 10 tons 2 350 0.75 18 6,570 hours 0.43 0.01 g/hp-hr 0.005 0.00006 0.02
Dump Truck, 10 tons 1 250 0.34 8 3,000 VMT 0.43 0.2117 g/mile 0.0002 0.000002 0.0007
Mobile Hydraulic Crane, 60 tons 1 267 0.75 18 6,570 hours 0.43 0.01 g/hp-hr 0.002 0.00002 0.008
Truck Shop Bridge Crane, 60 tons 1 75 0.75 18 6,570 hours 0.43 0.01 g/hp-hr 0.0005 0.000006 0.002
Truck Shop Bridge Crane, 25 tons 1 24.1 0.75 18 6,570 hours 0.43 0.30 g/hp-hr 0.005 0.00006 0.02
CS683 Soil Compactor / Roller 2 173 0.75 18 6,570 hours 0.40 0.01 g/hp-hr 0.002 0.00003 0.01
246C Skid Steer Loader 2 73 0.75 18 6,570 hours 0.30 0.02 g/hp-hr 0.001 0.00002 0.006
RH200/340 O & K Shovel / Hitachi EX5500 1 2,520 0.75 18 6,570 hours 0.59 0.03 g/hp-hr 0.07 0.0009 0.32
Off-Road Tire Handling Truck 1 450 0.86 21 7,500 VMT 0.43 0.2117 g/mile 0.0004 0.000005 0.002
Contractor Haul Trucks, 25 tons 2 511 2.74 66 24,000 VMT 0.43 0.2117 g/mile 0.003 0.00003 0.01
Motivator for Mine Shovels 1 3,308 0.91 22 8,000 hours 0.43 0.02 g/hp-hr 0.06 0.0007 0.25
Storm Water Pond Pump 1 200 1.00 24 500 hours 1 0.01 g/hp-hr 0.004 0.00005 0.001
Mine Pit Dewatering Pump 4 100 1.00 24 500 hours 1 0.01 g/hp-hr 0.009 0.0001 0.002
Copper Concentrate Shipment Vehicles -- 450 29.60 1,021 169,872 VMT 0.43 0.2117 g/mile 0.01 0.0002 0.04
Rosemont Copper ProjectEmission Inventory Information JBR ENVIRONMENTAL CONSULTANTS, INC.
November 2011Page H342
AZRP00524

Hourly Daily AnnualTier 2/Tier 4 (Final) Emission Standards or Mobile 6 Output
Units lb/hr tpd tpy
Table H.87 PM10 Emissions from Fuel Burning Mobile Engines - Year 20
PM10 Emissions - Year 20Load
Factor
PM10 Emission FactorFuel Burning Mobile Engine Description a
Fleet Size
HP Rating
Process Rates b - Year 20
Units
Molybdenum Concentrate Shipment Vehicles -- 450 7.40 15 2,145 VMT 0.43 0.2117 g/mile 0.003 0.000004 0.0005
Sulfuric Acid Delivery Vehicles -- 450 22.20 143 52,021 VMT 0.43 0.2117 g/mile 0.01 0.00003 0.01
Lime Delivery Vehicles -- 450 14.80 52 19,072 VMT 0.43 0.2117 g/mile 0.007 0.00001 0.004
SAG Mill and Ball Mill Grinding Balls Delivery Vehicles -- 450 14.80 23 5,858 VMT 0.43 0.2117 g/mile 0.007 0.000005 0.001
Diesel Fuel Delivery Vehicles -- 500 14.80 47 17,136 VMT 0.43 0.2117 g/mile 0.007 0.00001 0.004
Copper Cathode Shipment Vehicles -- 450 14.80 42 4,997 VMT 0.43 0.2117 g/mile 0.007 0.00001 0.001
Ammonium Nitrate Delivery Vehicles -- 450 7.40 25 6,384 VMT 0.43 0.2117 g/mile 0.003 0.000006 0.001
Miscellaneous Consumables Delivery Vehicles -- 450 7.40 48 12,486 VMT 0.43 0.2117 g/mile 0.003 0.00001 0.003
Miscellaneous Fuels and Lubricants Delivery Vehicles -- 450 7.40 7 1,110 VMT 0.43 0.2117 g/mile 0.003 0.000002 0.0003
Pickup Trucks (gasoline) 20 350 1.37 33 12,000 VMT 0.54 0.0255 g/mile 0.002 0.00002 0.007
Crew Van (gasoline) 3 350 0.91 22 8,000 VMT 0.54 0.0255 g/mile 0.0002 0.000002 0.0007
Lot Pick-Up Trucks (gasoline) 20 250 0.34 8 3,000 VMT 0.54 0.0255 g/mile 0.0004 0.000005 0.002
8.69 0.10 28.69
1.19 0.01 4.90
9.88 0.12 33.59
a Fuel burning mobile engines are diesel fuel fired unless otherwise noted.
b Except for the shipment and delivery vehicles, the process rates are for a single mobile engine. The process rates for the shipment and delivery vehicles are representative of the entire fleet.
Total Emissions from Haul Truck Engines:
Total Emissions from Other Mobile Engines:
Total Emissions from All Mobile Engies:
Rosemont Copper ProjectEmission Inventory Information JBR ENVIRONMENTAL CONSULTANTS, INC.
November 2011Page H343
AZRP00525

Hourly Daily AnnualTier 2/Tier 4 (Final) Emission Standards or Mobile 6 Output
Units lb/hr tpd tpy
Haulage Trucks, 250 tons 31 2,650 1.00 24 6,600 hours 0.32 0.15 g/hp-hr 8.69 0.10 28.69
Crawler Dozers, D11T Class 3 850 0.23 5 2,000 hours 0.575 0.03 g/hp-hr 0.02 0.0003 0.10
Crawler Dozers, D10T Class 3 580 0.46 11 4,000 hours 0.575 0.01 g/hp-hr 0.01 0.0001 0.04
Crawler Dozer, D8T Class 1 310 0.75 18 6,570 hours 0.575 0.01 g/hp-hr 0.003 0.00004 0.01
Rubber Tired Dozers, 834H Class 3 498 0.23 6 2,030 hours 0.575 0.01 g/hp-hr 0.004 0.00005 0.02
Motor Graders, 24M Class 1 533 0.68 16 6,000 hours 0.575 0.01 g/hp-hr 0.005 0.00006 0.02
Motor Graders, 16M Class 3 297 0.23 5 2,000 hours 0.575 0.01 g/hp-hr 0.003 0.00003 0.01
Water Trucks, 30,000 gallons 4 1,348 0.27 7 2,000 hours 0.35 0.03 g/hp-hr 0.03 0.0004 0.12
Diesel Blasthole Drill, 12.25 inches 2 1,500 0.75 18 6,570 hours 0.43 0.03 g/hp-hr 0.06 0.0008 0.28
Hydraulic DML 45 Drill 1 425 0.75 18 6,570 hours 0.43 0.01 g/hp-hr 0.003 0.00004 0.01
Front End Loaders 2 2,000 0.90 22 7,884 hours 0.59 0.15 g/hp-hr 0.70 0.008 3.08
Stemming Truck 2 450 0.75 18 6,570 hours 0.43 0.01 g/hp-hr 0.006 0.00008 0.03
ANFO/Slurry Truck, 20 tons 2 450 0.75 18 6,570 hours 0.43 0.01 g/hp-hr 0.006 0.00008 0.03
Powder Truck, 2 tons 2 350 0.75 18 6,570 hours 0.43 0.01 g/hp-hr 0.005 0.00006 0.02
Front End Loaders, 8 yd3 2 262 0.75 18 6,570 hours 0.575 0.01 g/hp-hr 0.005 0.00006 0.02
Hydraulic Excavator, 385 Cat CL 2 513 0.90 22 7,884 hours 0.35 0.01 g/hp-hr 0.007 0.00009 0.03
Backhoe/Loader, 2 yd3 1 124 0.75 18 6,570 hours 0.35 0.01 g/hp-hr 0.0007 0.000009 0.003
PM2.5 Emissions - Year 20Load
Factor
PM2.5 Emission FactorProcess Rates b - Year 20
Units
Table H.88 PM2.5 Emissions from Fuel Burning Mobile Engines - Year 20
Fuel Burning Mobile Engine Description a
Fleet Size
HP Rating
Rosemont Copper ProjectEmission Inventory Information JBR ENVIRONMENTAL CONSULTANTS, INC.
November 2011Page H344
AZRP00526

Hourly Daily AnnualTier 2/Tier 4 (Final) Emission Standards or Mobile 6 Output
Units lb/hr tpd tpy
PM2.5 Emissions - Year 20Load
Factor
PM2.5 Emission FactorProcess Rates b - Year 20
Units
Table H.88 PM2.5 Emissions from Fuel Burning Mobile Engines - Year 20
Fuel Burning Mobile Engine Description a
Fleet Size
HP Rating
All-Terrain Crane, 75 tons 1 230 0.75 18 6,570 hours 0.43 0.01 g/hp-hr 0.002 0.00002 0.007
Transporter with Tractor, 200 tons 1 1,350 0.75 18 6,570 hours 0.59 0.03 g/hp-hr 0.04 0.0005 0.17
Fuel/Lube Trucks, 6,000 gallons 2 703 0.75 18 6,570 hours 0.35 0.01 g/hp-hr 0.008 0.0001 0.04
Mechanic Field Service Trucks 5 370 1.71 41 15,000 VMT 0.43 0.2117 g/mile 0.004 0.00005 0.02
Tire Handler 1 90 0.11 3 1,000 VMT 0.43 0.2117 g/mile 0.00005 0.0000006 0.0002
Shop Forklift, 12,000 lbs 1 90 0.75 18 6,570 hours 0.59 0.01 g/hp-hr 0.0009 0.00001 0.004
Integrated Tool Carrier, 140 hp 1 138 0.75 18 6,570 hours 0.59 0.01 g/hp-hr 0.001 0.00002 0.006
Light Plant, 6 kW 15 35 0.40 10 3,504 hours 0.43 0.02 g/hp-hr 0.004 0.00005 0.02
Primary Crushing Mobile Crane - 400 tons 1 320 0.75 18 6,570 hours 0.43 0.01 g/hp-hr 0.002 0.00003 0.01
Copper Concentrate Area Front End Loader - Cat 930 1 160 0.75 18 6,570 hours 0.59 0.01 g/hp-hr 0.002 0.00002 0.007
Molybdenum Packaging Forklift, 7,000 lbs 1 93 0.75 18 6,570 hours 0.59 0.01 g/hp-hr 0.0009 0.00001 0.004
Copper Cathode Forklift 1 93 0.75 18 6,570 hours 0.59 0.01 g/hp-hr 0.0009 0.00001 0.004
Boom Trucks 10 tons, 45 foot boom 1 200 0.75 18 6,570 hours 0.21 0.01 g/hp-hr 0.0007 0.000008 0.003
Boom Trucks 15 tons, 60 foot boom 1 210 0.75 18 6,570 hours 0.21 0.01 g/hp-hr 0.0007 0.000009 0.003
Front End Loader, 6 yd3 1 349 0.75 18 6,570 hours 0.35 0.01 g/hp-hr 0.002 0.00002 0.009
Front End Loader, 5 yd3 1 149 0.75 18 6,570 hours 0.25 0.01 g/hp-hr 0.0006 0.000007 0.003
Bob Cats, 2,400 lbs 2 82 0.75 18 6,570 hours 0.59 0.01 g/hp-hr 0.002 0.00002 0.007
Rosemont Copper ProjectEmission Inventory Information JBR ENVIRONMENTAL CONSULTANTS, INC.
November 2011Page H345
AZRP00527

Hourly Daily AnnualTier 2/Tier 4 (Final) Emission Standards or Mobile 6 Output
Units lb/hr tpd tpy
PM2.5 Emissions - Year 20Load
Factor
PM2.5 Emission FactorProcess Rates b - Year 20
Units
Table H.88 PM2.5 Emissions from Fuel Burning Mobile Engines - Year 20
Fuel Burning Mobile Engine Description a
Fleet Size
HP Rating
Fork Lift, 2,000 lbs 1 50 0.75 18 6,570 hours 0.59 0.02 g/hp-hr 0.001 0.00001 0.004
Fork Lift, 5,000 lbs 1 63 0.75 18 6,570 hours 0.59 0.02 g/hp-hr 0.001 0.00001 0.005
Fork Lift, 3,000 lbs 2 50 0.75 18 6,570 hours 0.59 0.02 g/hp-hr 0.002 0.00002 0.009
Flat Bed Trucks, 10 tons 2 350 0.75 18 6,570 hours 0.43 0.01 g/hp-hr 0.005 0.00006 0.02
Dump Truck, 10 tons 1 250 0.34 8 3,000 VMT 0.43 0.2117 g/mile 0.0002 0.000002 0.0007
Mobile Hydraulic Crane, 60 tons 1 267 0.75 18 6,570 hours 0.43 0.01 g/hp-hr 0.002 0.00002 0.008
Truck Shop Bridge Crane, 60 tons 1 75 0.75 18 6,570 hours 0.43 0.01 g/hp-hr 0.0005 0.000006 0.002
Truck Shop Bridge Crane, 25 tons 1 24 0.75 18 6,570 hours 0.43 0.30 g/hp-hr 0.005 0.00006 0.02
CS683 Soil Compactor / Roller 2 173 0.75 18 6,570 hours 0.4 0.01 g/hp-hr 0.002 0.00003 0.01
246C Skid Steer Loader 2 73 0.75 18 6,570 hours 0.3 0.02 g/hp-hr 0.001 0.00002 0.006
RH200/340 O & K Shovel / Hitachi EX5500 1 2,520 0.75 18 6,570 hours 0.59 0.03 g/hp-hr 0.07 0.0009 0.32
Off-Road Tire Handling Truck 1 450 0.86 21 7,500 VMT 0.43 0.2117 g/mile 0.0004 0.000005 0.002
Contractor Haul Trucks, 25 tons 2 511 2.74 66 24,000 VMT 0.43 0.2117 g/mile 0.003 0.00003 0.01
Motivator for Mine Shovels 1 3,308 0.91 22 8,000 hours 0.43 0.02 g/hp-hr 0.06 0.0007 0.25
Storm Water Pond Pump 1 200 1.00 24 500 hours 1 0.01 g/hp-hr 0.004 0.00005 0.001
Mine Pit Dewatering Pump 4 100 1.00 24 500 hours 1 0.01 g/hp-hr 0.009 0.0001 0.002
Copper Concentrate Shipment Vehicles -- 450 29.60 1,021 169,872 VMT 0.43 0.2117 g/mile 0.01 0.0002 0.04
Rosemont Copper ProjectEmission Inventory Information JBR ENVIRONMENTAL CONSULTANTS, INC.
November 2011Page H346
AZRP00528

Hourly Daily AnnualTier 2/Tier 4 (Final) Emission Standards or Mobile 6 Output
Units lb/hr tpd tpy
PM2.5 Emissions - Year 20Load
Factor
PM2.5 Emission FactorProcess Rates b - Year 20
Units
Table H.88 PM2.5 Emissions from Fuel Burning Mobile Engines - Year 20
Fuel Burning Mobile Engine Description a
Fleet Size
HP Rating
Molybdenum Concentrate Shipment Vehicles -- 450 7.40 15 2,145 VMT 0.43 0.2117 g/mile 0.003 0.000004 0.0005
Sulfuric Acid Delivery Vehicles -- 450 22.20 143 52,021 VMT 0.43 0.2117 g/mile 0.01 0.00003 0.01
Lime Delivery Vehicles -- 450 14.80 52 19,072 VMT 0.43 0.2117 g/mile 0.007 0.00001 0.004
SAG Mill and Ball Mill Grinding Balls Delivery Vehicles -- 450 14.80 23 5,858 VMT 0.43 0.2117 g/mile 0.007 0.000005 0.001
Diesel Fuel Delivery Vehicles -- 500 14.80 47 17,136 VMT 0.43 0.2117 g/mile 0.007 0.00001 0.004
Copper Cathode Shipment Vehicles -- 450 14.80 42 4,997 VMT 0.43 0.2117 g/mile 0.007 0.00001 0.001
Ammonium Nitrate Delivery Vehicles -- 450 7.40 25 6,384 VMT 0.43 0.2117 g/mile 0.003 0.000006 0.001
Miscellaneous Consumables Delivery Vehicles -- 450 7.40 48 12,486 VMT 0.43 0.2117 g/mile 0.003 0.00001 0.003
Miscellaneous Fuels and Lubricants Delivery Vehicles -- 450 7.40 7 1,110 VMT 0.43 0.2117 g/mile 0.003 0.000002 0.0003
Pickup Trucks (gasoline) 20 350 1.37 33 12,000 VMT 0.54 0.0255 g/mile 0.002 0.00002 0.007
Crew Van (gasoline) 3 350 0.91 22 8,000 VMT 0.54 0.0255 g/mile 0.0002 0.000002 0.0007
Lot Pick-Up Trucks (gasoline) 20 250 0.34 8 3,000 VMT 0.54 0.0255 g/mile 0.0004 0.000005 0.002
8.69 0.10 28.69
1.19 0.01 4.90
9.88 0.12 33.59
a Fuel burning mobile engines are diesel fuel fired unless otherwise noted.
b Except for the shipment and delivery vehicles, the process rates are for a single mobile engine. The process rates for the shipment and delivery vehicles are representative of the entire fleet.
Total Emissions from Haul Truck Engines:
Total Emissions from Other Mobile Engines:
Total Emissions from All Mobile Engines:
Rosemont Copper ProjectEmission Inventory Information JBR ENVIRONMENTAL CONSULTANTS, INC.
November 2011Page H347
AZRP00529

Hourly Daily AnnualTier 2/Tier 3 Emission Standards or Mobile 6
OutputUnits lb/hr tpd tpy
Haulage Trucks, 250 tons 31 2,650 1.00 24 6,600 hours 0.32 2.60 g/hp-hr 150.68 1.81 497.25
Crawler Dozers, D11T Class 3 850 0.23 5 2,000 hours 0.575 2.60 g/hp-hr 1.92 0.02 8.40
Crawler Dozers, D10T Class 3 580 0.46 11 4,000 hours 0.575 2.60 g/hp-hr 2.62 0.03 11.47
Crawler Dozer, D8T Class 1 310 0.75 18 6,570 hours 0.575 2.60 g/hp-hr 0.77 0.009 3.36
Rubber Tired Dozers, 834H Class 3 498 0.23 6 2,030 hours 0.575 2.60 g/hp-hr 1.14 0.01 5.00
Motor Graders, 24M Class 1 533 0.68 16 6,000 hours 0.575 2.60 g/hp-hr 1.20 0.01 5.27
Motor Graders, 16M Class 3 297 0.23 5 2,000 hours 0.575 2.60 g/hp-hr 0.67 0.008 2.94
Water Trucks, 30,000 gallons 4 1,348 0.27 7 2,000 hours 0.35 2.60 g/hp-hr 2.96 0.04 10.82
Diesel Blasthole Drill, 12.25 inches 2 1,500 0.75 18 6,570 hours 0.43 2.60 g/hp-hr 5.55 0.07 24.29
Hydraulic DML 45 Drill 1 425 0.75 18 6,570 hours 0.43 2.60 g/hp-hr 0.79 0.009 3.44
Front End Loaders 2 2,000 0.90 22 7,884 hours 0.59 2.60 g/hp-hr 12.17 0.15 53.33
Stemming Truck 2 450 0.75 18 6,570 hours 0.43 2.60 g/hp-hr 1.66 0.02 7.29
ANFO/Slurry Truck, 20 tons 2 450 0.75 18 6,570 hours 0.43 2.60 g/hp-hr 1.66 0.02 7.29
Powder Truck, 2 tons 2 350 0.75 18 6,570 hours 0.43 2.60 g/hp-hr 1.29 0.02 5.67
Front End Loaders, 8 yd3 2 262 0.75 18 6,570 hours 0.575 2.60 g/hp-hr 1.30 0.02 5.67
Hydraulic Excavator, 385 Cat CL 2 513 0.90 22 7,884 hours 0.35 2.60 g/hp-hr 1.85 0.02 8.11
Backhoe/Loader, 2 yd3 1 124 0.75 18 6,570 hours 0.35 3.70 g/hp-hr 0.27 0.003 1.16
CO Emissions - Year 20Load
Factor
CO Emission FactorProcess Rates b - Year 20
Units
Table H.89 CO Emissions from Fuel Burning Mobile Engines - Year 20
Fuel Burning Mobile Engine Description a
Fleet Size
HP Rating
Rosemont Copper ProjectEmission Inventory Information JBR ENVIRONMENTAL CONSULTANTS, INC.
November 2011Page H348
AZRP00530

Hourly Daily AnnualTier 2/Tier 3 Emission Standards or Mobile 6
OutputUnits lb/hr tpd tpy
CO Emissions - Year 20Load
Factor
CO Emission FactorProcess Rates b - Year 20
Units
Table H.89 CO Emissions from Fuel Burning Mobile Engines - Year 20
Fuel Burning Mobile Engine Description a
Fleet Size
HP Rating
All-Terrain Crane, 75 tons 1 230 0.75 18 6,570 hours 0.43 2.60 g/hp-hr 0.43 0.005 1.86
Transporter with Tractor, 200 tons 1 1,350 0.75 18 6,570 hours 0.59 2.60 g/hp-hr 3.42 0.04 15.00
Fuel/Lube Trucks, 6,000 gallons 2 703 0.75 18 6,570 hours 0.35 2.60 g/hp-hr 2.12 0.03 9.27
Mechanic Field Service Trucks 5 370 1.71 41 15,000 VMT 0.43 1.870 g/mile 0.04 0.0004 0.15
Tire Handler 1 90 0.11 3 1,000 VMT 0.43 1.870 g/mile 0.0005 0.000006 0.002
Shop Forklift, 12,000 lbs 1 90 0.75 18 6,570 hours 0.59 3.70 g/hp-hr 0.32 0.004 1.42
Integrated Tool Carrier, 140 hp 1 138 0.75 18 6,570 hours 0.59 3.70 g/hp-hr 0.50 0.006 2.18
Light Plant, 6 kW 15 35 0.40 10 3,504 hours 0.43 4.10 g/hp-hr 0.82 0.01 3.58
Primary Crushing Mobile Crane - 400 tons 1 320 0.75 18 6,570 hours 0.43 2.60 g/hp-hr 0.59 0.007 2.59
Copper Concentrate Area Front End Loader - Cat 930 1 160 0.75 18 6,570 hours 0.59 3.70 g/hp-hr 0.58 0.007 2.53
Molybdenum Packaging Forklift, 7,000 lbs 1 93 0.75 18 6,570 hours 0.59 3.70 g/hp-hr 0.33 0.004 1.46
Copper Cathode Forklift 1 93 0.75 18 6,570 hours 0.59 3.70 g/hp-hr 0.33 0.004 1.46
Boom Trucks 10 tons, 45 foot boom 1 200 0.75 18 6,570 hours 0.21 2.60 g/hp-hr 0.18 0.002 0.79
Boom Trucks 15 tons, 60 foot boom 1 210 0.75 18 6,570 hours 0.21 2.60 g/hp-hr 0.19 0.002 0.83
Front End Loader, 6 yd3 1 349 0.75 18 6,570 hours 0.35 2.60 g/hp-hr 0.53 0.006 2.30
Front End Loader, 5 yd3 1 149 0.75 18 6,570 hours 0.25 3.70 g/hp-hr 0.23 0.003 1.00
Bob Cats, 2,400 lbs 2 82 0.75 18 6,570 hours 0.59 3.70 g/hp-hr 0.59 0.007 2.59
Rosemont Copper ProjectEmission Inventory Information JBR ENVIRONMENTAL CONSULTANTS, INC.
November 2011Page H349
AZRP00531

Hourly Daily AnnualTier 2/Tier 3 Emission Standards or Mobile 6
OutputUnits lb/hr tpd tpy
CO Emissions - Year 20Load
Factor
CO Emission FactorProcess Rates b - Year 20
Units
Table H.89 CO Emissions from Fuel Burning Mobile Engines - Year 20
Fuel Burning Mobile Engine Description a
Fleet Size
HP Rating
Fork Lift, 2,000 lbs 1 50 0.75 18 6,570 hours 0.59 3.70 g/hp-hr 0.18 0.002 0.79
Fork Lift, 5,000 lbs 1 63 0.75 18 6,570 hours 0.59 3.70 g/hp-hr 0.23 0.003 1.00
Fork Lift, 3,000 lbs 2 50 0.75 18 6,570 hours 0.59 3.70 g/hp-hr 0.36 0.004 1.58
Flat Bed Trucks, 10 tons 2 350 0.75 18 6,570 hours 0.43 2.60 g/hp-hr 1.29 0.02 5.67
Dump Truck, 10 tons 1 250 0.34 8 3,000 VMT 0.43 1.870 g/mile 0.001 0.00002 0.006
Mobile Hydraulic Crane, 60 tons 1 267 0.75 18 6,570 hours 0.43 2.60 g/hp-hr 0.49 0.006 2.16
Truck Shop Bridge Crane, 60 tons 1 75 0.75 18 6,570 hours 0.43 3.70 g/hp-hr 0.20 0.002 0.86
Truck Shop Bridge Crane, 25 tons 1 24 0.75 18 6,570 hours 0.43 4.90 g/hp-hr 0.08 0.001 0.37
CS683 Soil Compactor / Roller 2 173 0.75 18 6,570 hours 0.4 3.70 g/hp-hr 0.85 0.01 3.71
246C Skid Steer Loader 2 73 0.75 18 6,570 hours 0.3 3.70 g/hp-hr 0.27 0.003 1.17
RH200/340 O & K Shovel / Hitachi EX5500 1 2,520 0.75 18 6,570 hours 0.59 2.60 g/hp-hr 6.39 0.08 28.00
Off-Road Tire Handling Truck 1 450 0.86 21 7,500 VMT 0.43 1.870 g/mile 0.004 0.00004 0.02
Contractor Haul Trucks, 25 tons 2 511 2.74 66 24,000 VMT 0.43 1.870 g/mile 0.02 0.0003 0.10
Motivator for Mine Shovels 1 3,308 0.91 22 8,000 hours 0.43 2.60 g/hp-hr 7.45 0.09 32.61
Storm Water Pond Pump 1 200 1.00 24 500 hours 1 2.60 g/hp-hr 1.15 0.01 0.29
Mine Pit Dewatering Pump 4 100 1.00 24 500 hours 1 3.70 g/hp-hr 3.26 0.04 0.82
Copper Concentrate Shipment Vehicles -- 450 29.60 1,021 169,872 VMT 0.43 1.870 g/mile 0.12 0.002 0.35
Rosemont Copper ProjectEmission Inventory Information JBR ENVIRONMENTAL CONSULTANTS, INC.
November 2011Page H350
AZRP00532

Hourly Daily AnnualTier 2/Tier 3 Emission Standards or Mobile 6
OutputUnits lb/hr tpd tpy
CO Emissions - Year 20Load
Factor
CO Emission FactorProcess Rates b - Year 20
Units
Table H.89 CO Emissions from Fuel Burning Mobile Engines - Year 20
Fuel Burning Mobile Engine Description a
Fleet Size
HP Rating
Molybdenum Concentrate Shipment Vehicles -- 450 7.40 15 2,145 VMT 0.43 1.870 g/mile 0.03 0.00003 0.004
Sulfuric Acid Delivery Vehicles -- 450 22.20 143 52,021 VMT 0.43 1.870 g/mile 0.09 0.0003 0.11
Lime Delivery Vehicles -- 450 14.80 52 19,072 VMT 0.43 1.870 g/mile 0.06 0.0001 0.04
SAG Mill and Ball Mill Grinding Balls Delivery Vehicles -- 450 14.80 23 5,858 VMT 0.43 1.870 g/mile 0.06 0.00005 0.01
Diesel Fuel Delivery Vehicles -- 500 14.80 47 17,136 VMT 0.43 1.870 g/mile 0.06 0.0001 0.04
Copper Cathode Shipment Vehicles -- 450 14.80 42 4,997 VMT 0.43 1.870 g/mile 0.06 0.00009 0.01
Ammonium Nitrate Delivery Vehicles -- 450 7.40 25 6,384 VMT 0.43 1.870 g/mile 0.03 0.00005 0.01
Miscellaneous Consumables Delivery Vehicles -- 450 7.40 48 12,486 VMT 0.43 1.870 g/mile 0.03 0.0001 0.03
Miscellaneous Fuels and Lubricants Delivery Vehicles -- 450 7.40 7 1,110 VMT 0.43 1.870 g/mile 0.03 0.00002 0.002
Pickup Trucks (gasoline) 20 350 1.37 33 12,000 VMT 0.54 15.51 g/mile 0.94 0.01 4.10
Crew Van (gasoline) 3 350 0.91 22 8,000 VMT 0.54 15.51 g/mile 0.09 0.001 0.41
Lot Pick-Up Trucks (gasoline) 20 250 0.34 8 3,000 VMT 0.54 15.51 g/mile 0.23 0.003 1.03
150.68 1.81 497.25
73.09 0.87 297.81
223.77 2.68 795.06
a Fuel burning mobile engines are diesel fuel fired unless otherwise noted.
b Except for the shipment and delivery vehicles, the process rates are for a single mobile engine. The process rates for the shipment and delivery vehicles are representative of the entire fleet.
Total Emissions from Haul Truck Engines:
Total Emissions from Other Mobile Engines:
Total Emissions from All Mobile Engines:
Rosemont Copper ProjectEmission Inventory Information JBR ENVIRONMENTAL CONSULTANTS, INC.
November 2011Page H351
AZRP00533
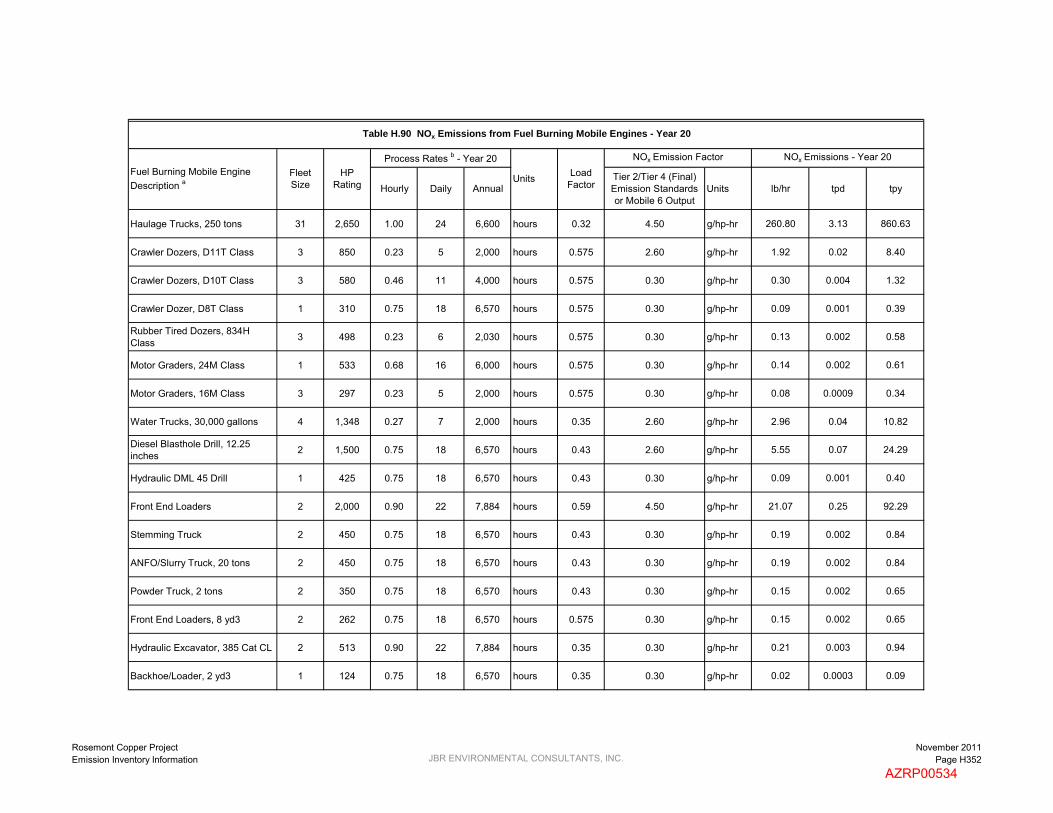
Hourly Daily AnnualTier 2/Tier 4 (Final) Emission Standards or Mobile 6 Output
Units lb/hr tpd tpy
Haulage Trucks, 250 tons 31 2,650 1.00 24 6,600 hours 0.32 4.50 g/hp-hr 260.80 3.13 860.63
Crawler Dozers, D11T Class 3 850 0.23 5 2,000 hours 0.575 2.60 g/hp-hr 1.92 0.02 8.40
Crawler Dozers, D10T Class 3 580 0.46 11 4,000 hours 0.575 0.30 g/hp-hr 0.30 0.004 1.32
Crawler Dozer, D8T Class 1 310 0.75 18 6,570 hours 0.575 0.30 g/hp-hr 0.09 0.001 0.39
Rubber Tired Dozers, 834H Class 3 498 0.23 6 2,030 hours 0.575 0.30 g/hp-hr 0.13 0.002 0.58
Motor Graders, 24M Class 1 533 0.68 16 6,000 hours 0.575 0.30 g/hp-hr 0.14 0.002 0.61
Motor Graders, 16M Class 3 297 0.23 5 2,000 hours 0.575 0.30 g/hp-hr 0.08 0.0009 0.34
Water Trucks, 30,000 gallons 4 1,348 0.27 7 2,000 hours 0.35 2.60 g/hp-hr 2.96 0.04 10.82
Diesel Blasthole Drill, 12.25 inches 2 1,500 0.75 18 6,570 hours 0.43 2.60 g/hp-hr 5.55 0.07 24.29
Hydraulic DML 45 Drill 1 425 0.75 18 6,570 hours 0.43 0.30 g/hp-hr 0.09 0.001 0.40
Front End Loaders 2 2,000 0.90 22 7,884 hours 0.59 4.50 g/hp-hr 21.07 0.25 92.29
Stemming Truck 2 450 0.75 18 6,570 hours 0.43 0.30 g/hp-hr 0.19 0.002 0.84
ANFO/Slurry Truck, 20 tons 2 450 0.75 18 6,570 hours 0.43 0.30 g/hp-hr 0.19 0.002 0.84
Powder Truck, 2 tons 2 350 0.75 18 6,570 hours 0.43 0.30 g/hp-hr 0.15 0.002 0.65
Front End Loaders, 8 yd3 2 262 0.75 18 6,570 hours 0.575 0.30 g/hp-hr 0.15 0.002 0.65
Hydraulic Excavator, 385 Cat CL 2 513 0.90 22 7,884 hours 0.35 0.30 g/hp-hr 0.21 0.003 0.94
Backhoe/Loader, 2 yd3 1 124 0.75 18 6,570 hours 0.35 0.30 g/hp-hr 0.02 0.0003 0.09
NOx Emissions - Year 20Load
Factor
NOx Emission FactorProcess Rates b - Year 20
Units
Table H.90 NOx Emissions from Fuel Burning Mobile Engines - Year 20
Fuel Burning Mobile Engine Description a
Fleet Size
HP Rating
Rosemont Copper ProjectEmission Inventory Information JBR ENVIRONMENTAL CONSULTANTS, INC.
November 2011Page H352
AZRP00534

Hourly Daily AnnualTier 2/Tier 4 (Final) Emission Standards or Mobile 6 Output
Units lb/hr tpd tpy
NOx Emissions - Year 20Load
Factor
NOx Emission FactorProcess Rates b - Year 20
Units
Table H.90 NOx Emissions from Fuel Burning Mobile Engines - Year 20
Fuel Burning Mobile Engine Description a
Fleet Size
HP Rating
All-Terrain Crane, 75 tons 1 230 0.75 18 6,570 hours 0.43 0.30 g/hp-hr 0.05 0.0006 0.21
Transporter with Tractor, 200 tons 1 1,350 0.75 18 6,570 hours 0.59 2.60 g/hp-hr 3.42 0.04 15.00
Fuel/Lube Trucks, 6,000 gallons 2 703 0.75 18 6,570 hours 0.35 0.30 g/hp-hr 0.24 0.003 1.07
Mechanic Field Service Trucks 5 370 1.71 41 15,000 VMT 0.43 7.394 g/mile 0.14 0.002 0.61
Tire Handler 1 90 0.11 3 1,000 VMT 0.43 7.394 g/mile 0.002 0.00002 0.008
Shop Forklift, 12,000 lbs 1 90 0.75 18 6,570 hours 0.59 0.30 g/hp-hr 0.03 0.0003 0.12
Integrated Tool Carrier, 140 hp 1 138 0.75 18 6,570 hours 0.59 0.30 g/hp-hr 0.04 0.0005 0.18
Light Plant, 6 kW 15 35 0.40 10 3,504 hours 0.43 3.30 g/hp-hr 0.66 0.008 2.88
Primary Crushing Mobile Crane - 400 tons 1 320 0.75 18 6,570 hours 0.43 0.30 g/hp-hr 0.07 0.0008 0.30
Copper Concentrate Area Front End Loader - Cat 930 1 160 0.75 18 6,570 hours 0.59 0.30 g/hp-hr 0.05 0.0006 0.21
Molybdenum Packaging Forklift, 7,000 lbs 1 93 0.75 18 6,570 hours 0.59 0.30 g/hp-hr 0.03 0.0003 0.12
Copper Cathode Forklift 1 93 0.75 18 6,570 hours 0.59 0.30 g/hp-hr 0.03 0.0003 0.12
Boom Trucks 10 tons, 45 foot boom 1 200 0.75 18 6,570 hours 0.21 0.30 g/hp-hr 0.02 0.0003 0.09
Boom Trucks 15 tons, 60 foot boom 1 210 0.75 18 6,570 hours 0.21 0.30 g/hp-hr 0.02 0.0003 0.10
Front End Loader, 6 yd3 1 349 0.75 18 6,570 hours 0.35 0.30 g/hp-hr 0.06 0.0007 0.27
Front End Loader, 5 yd3 1 149 0.75 18 6,570 hours 0.25 0.30 g/hp-hr 0.02 0.0002 0.08
Bob Cats, 2,400 lbs 2 82 0.75 18 6,570 hours 0.59 0.30 g/hp-hr 0.05 0.0006 0.21
Rosemont Copper ProjectEmission Inventory Information JBR ENVIRONMENTAL CONSULTANTS, INC.
November 2011Page H353
AZRP00535

Hourly Daily AnnualTier 2/Tier 4 (Final) Emission Standards or Mobile 6 Output
Units lb/hr tpd tpy
NOx Emissions - Year 20Load
Factor
NOx Emission FactorProcess Rates b - Year 20
Units
Table H.90 NOx Emissions from Fuel Burning Mobile Engines - Year 20
Fuel Burning Mobile Engine Description a
Fleet Size
HP Rating
Fork Lift, 2,000 lbs 1 50 0.75 18 6,570 hours 0.59 3.30 g/hp-hr 0.16 0.002 0.71
Fork Lift, 5,000 lbs 1 63 0.75 18 6,570 hours 0.59 3.30 g/hp-hr 0.20 0.002 0.89
Fork Lift, 3,000 lbs 2 50 0.75 18 6,570 hours 0.59 3.30 g/hp-hr 0.32 0.004 1.41
Flat Bed Trucks, 10 tons 2 350 0.75 18 6,570 hours 0.43 0.30 g/hp-hr 0.15 0.002 0.65
Dump Truck, 10 tons 1 250 0.34 8 3,000 VMT 0.43 7.394 g/mile 0.006 0.00007 0.02
Mobile Hydraulic Crane, 60 tons 1 267 0.75 18 6,570 hours 0.43 0.30 g/hp-hr 0.06 0.0007 0.25
Truck Shop Bridge Crane, 60 tons 1 75 0.75 18 6,570 hours 0.43 0.30 g/hp-hr 0.02 0.0002 0.07
Truck Shop Bridge Crane, 25 tons 1 24 0.75 18 6,570 hours 0.43 5.00 g/hp-hr 0.09 0.001 0.38
CS683 Soil Compactor / Roller 2 173 0.75 18 6,570 hours 0.4 0.30 g/hp-hr 0.07 0.0008 0.30
246C Skid Steer Loader 2 73 0.75 18 6,570 hours 0.3 3.30 g/hp-hr 0.24 0.003 1.05
RH200/340 O & K Shovel / Hitachi EX5500 1 2,520 0.75 18 6,570 hours 0.59 2.60 g/hp-hr 6.39 0.08 28.00
Off-Road Tire Handling Truck 1 450 0.86 21 7,500 VMT 0.43 7.394 g/mile 0.01 0.0002 0.06
Contractor Haul Trucks, 25 tons 2 511 2.74 66 24,000 VMT 0.43 7.394 g/mile 0.09 0.001 0.39
Motivator for Mine Shovels 1 3,308 0.91 22 8,000 hours 0.43 0.50 g/hp-hr 1.43 0.02 6.27
Storm Water Pond Pump 1 200 1.00 24 500 hours 1 0.30 g/hp-hr 0.13 0.002 0.03
Mine Pit Dewatering Pump 4 100 1.00 24 500 hours 1 0.30 g/hp-hr 0.26 0.003 0.07
Copper Concentrate Shipment Vehicles -- 450 29.60 1,021 169,872 VMT 0.43 7.394 g/mile 0.48 0.008 1.38
Rosemont Copper ProjectEmission Inventory Information JBR ENVIRONMENTAL CONSULTANTS, INC.
November 2011Page H354
AZRP00536

Hourly Daily AnnualTier 2/Tier 4 (Final) Emission Standards or Mobile 6 Output
Units lb/hr tpd tpy
NOx Emissions - Year 20Load
Factor
NOx Emission FactorProcess Rates b - Year 20
Units
Table H.90 NOx Emissions from Fuel Burning Mobile Engines - Year 20
Fuel Burning Mobile Engine Description a
Fleet Size
HP Rating
Molybdenum Concentrate Shipment Vehicles -- 450 7.40 15 2,145 VMT 0.43 7.394 g/mile 0.12 0.0001 0.02
Sulfuric Acid Delivery Vehicles -- 450 22.20 143 52,021 VMT 0.43 7.394 g/mile 0.36 0.001 0.42
Lime Delivery Vehicles -- 450 14.80 52 19,072 VMT 0.43 7.394 g/mile 0.24 0.0004 0.16
SAG Mill and Ball Mill Grinding Balls Delivery Vehicles -- 450 14.80 23 5,858 VMT 0.43 7.394 g/mile 0.24 0.0002 0.05
Diesel Fuel Delivery Vehicles -- 500 14.80 47 17,136 VMT 0.43 7.394 g/mile 0.24 0.0004 0.14
Copper Cathode Shipment Vehicles -- 450 14.80 42 4,997 VMT 0.43 7.394 g/mile 0.24 0.0003 0.04
Ammonium Nitrate Delivery Vehicles -- 450 7.40 25 6,384 VMT 0.43 7.394 g/mile 0.12 0.0002 0.05
Miscellaneous Consumables Delivery Vehicles -- 450 7.40 48 12,486 VMT 0.43 7.394 g/mile 0.12 0.0004 0.10
Miscellaneous Fuels and Lubricants Delivery Vehicles -- 450 7.40 7 1,110 VMT 0.43 7.394 g/mile 0.12 0.00006 0.009
Pickup Trucks (gasoline) 20 350 1.37 33 12,000 VMT 0.54 1.145 g/mile 0.07 0.0008 0.30
Crew Van (gasoline) 3 350 0.91 22 8,000 VMT 0.54 1.145 g/mile 0.007 0.00008 0.03
Lot Pick-Up Trucks (gasoline) 20 250 0.34 8 3,000 VMT 0.54 1.145 g/mile 0.02 0.0002 0.08
260.80 3.13 860.63
50.18 0.59 208.34
310.98 3.72 1,068.97
a Fuel burning mobile engines are diesel fuel fired unless otherwise noted.
b Except for the shipment and delivery vehicles, the process rates are for a single mobile engine. The process rates for the shipment and delivery vehicles are representative of the entire fleet.
Total Emissions from Haul Truck Engines:
Total Emissions from Other Mobile Engines:
Total Emissions from All Mobile Engines:
Rosemont Copper ProjectEmission Inventory Information JBR ENVIRONMENTAL CONSULTANTS, INC.
November 2011Page H355
AZRP00537

Hourly Daily Annual 100% Sulfur Conversion - Year 20 Units lb/hr tpd tpy
Haulage Trucks, 250 tons 31 2,650 1.00 24 6,600 hours 0.32 0.002 g/hp-hr 0.29 0.004 0.96
Crawler Dozers, D11T Class 3 850 0.23 5 2,000 hours 0.575 0.005 g/hp-hr 0.007 0.00008 0.03
Crawler Dozers, D10T Class 3 580 0.46 11 4,000 hours 0.575 0.003 g/hp-hr 0.005 0.00006 0.02
Crawler Dozer, D8T Class 1 310 0.75 18 6,570 hours 0.575 0.002 g/hp-hr 0.0008 0.00001 0.004
Rubber Tired Dozers, 834H Class 3 498 0.23 6 2,030 hours 0.575 0.005 g/hp-hr 0.004 0.00005 0.02
Motor Graders, 24M Class 1 533 0.68 16 6,000 hours 0.575 0.002 g/hp-hr 0.001 0.00002 0.006
Motor Graders, 16M Class 3 297 0.23 5 2,000 hours 0.575 0.005 g/hp-hr 0.002 0.00003 0.01
Water Trucks, 30,000 gallons 4 1,348 0.27 7 2,000 hours 0.35 0.005 g/hp-hr 0.02 0.0002 0.06
Diesel Blasthole Drill, 12.25 inches 2 1,500 0.75 18 6,570 hours 0.43 0.002 g/hp-hr 0.008 0.0001 0.04
Hydraulic DML 45 Drill 1 425 0.75 18 6,570 hours 0.43 0.002 g/hp-hr 0.001 0.00001 0.005
Front End Loaders 2 2,000 0.90 22 7,884 hours 0.59 0.001 g/hp-hr 0.01 0.0001 0.05
Stemming Truck 2 450 0.75 18 6,570 hours 0.43 0.002 g/hp-hr 0.002 0.00003 0.01
ANFO/Slurry Truck, 20 tons 2 450 0.75 18 6,570 hours 0.43 0.002 g/hp-hr 0.002 0.00003 0.01
Powder Truck, 2 tons 2 350 0.75 18 6,570 hours 0.43 0.002 g/hp-hr 0.002 0.00002 0.008
Front End Loaders, 8 yd3 2 262 0.75 18 6,570 hours 0.575 0.002 g/hp-hr 0.001 0.00002 0.006
Hydraulic Excavator, 385 Cat CL 2 513 0.90 22 7,884 hours 0.35 0.001 g/hp-hr 0.003 0.00003 0.01
Backhoe/Loader, 2 yd3 1 124 0.75 18 6,570 hours 0.35 0.002 g/hp-hr 0.0003 0.000004 0.001
SO2 Emissions - Year 20
Units Load Factor
SO2 Emission FactorProcess Rates b - Year 20
Table H.91 SO2 Emissions from Fuel Burning Mobile Engines - Year 20
Fuel Burning Mobile Engine Description a
Fleet Size
HP Rating
Rosemont Copper ProjectEmission Inventory Information JBR ENVIRONMENTAL CONSULTANTS, INC.
November 2011Page H356
AZRP00538

Hourly Daily Annual 100% Sulfur Conversion - Year 20 Units lb/hr tpd tpy
SO2 Emissions - Year 20
Units Load Factor
SO2 Emission FactorProcess Rates b - Year 20
Table H.91 SO2 Emissions from Fuel Burning Mobile Engines - Year 20
Fuel Burning Mobile Engine Description a
Fleet Size
HP Rating
All-Terrain Crane, 75 tons 1 230 0.75 18 6,570 hours 0.43 0.002 g/hp-hr 0.0006 0.000007 0.003
Transporter with Tractor, 200 tons 1 1,350 0.75 18 6,570 hours 0.59 0.002 g/hp-hr 0.004 0.00004 0.02
Fuel/Lube Trucks, 6,000 gallons 2 703 0.75 18 6,570 hours 0.35 0.002 g/hp-hr 0.004 0.00005 0.02
Mechanic Field Service Trucks 5 370 0.75 18 6,570 hours 0.43 0.002 g/hp-hr 0.005 0.00006 0.02
Tire Handler 1 90 0.75 18 6,570 hours 0.43 0.002 g/hp-hr 0.0002 0.000003 0.001
Shop Forklift, 12,000 lbs 1 90 0.75 18 6,570 hours 0.59 0.002 g/hp-hr 0.0002 0.000003 0.001
Integrated Tool Carrier, 140 hp 1 138 0.75 18 6,570 hours 0.59 0.002 g/hp-hr 0.0004 0.000004 0.002
Light Plant, 6 kW 15 35 0.40 10 3,504 hours 0.43 0.003 g/hp-hr 0.001 0.00002 0.006
Primary Crushing Mobile Crane - 400 tons 1 320 0.75 18 6,570 hours 0.43 0.002 g/hp-hr 0.0009 0.00001 0.004
Copper Concentrate Area Front End Loader - Cat 930 1 160 0.75 18 6,570 hours 0.59 0.002 g/hp-hr 0.0004 0.000005 0.002
Molybdenum Packaging Forklift, 7,000 lbs 1 93 0.75 18 6,570 hours 0.59 0.002 g/hp-hr 0.0002 0.000003 0.001
Copper Cathode Forklift 1 93 0.75 18 6,570 hours 0.59 0.002 g/hp-hr 0.0002 0.000003 0.001
Boom Trucks 10 tons, 45 foot boom 1 200 0.75 18 6,570 hours 0.21 0.002 g/hp-hr 0.0005 0.000006 0.002
Boom Trucks 15 tons, 60 foot boom 1 210 0.75 18 6,570 hours 0.21 0.002 g/hp-hr 0.0006 0.000007 0.002
Front End Loader, 6 yd3 1 349 0.75 18 6,570 hours 0.35 0.002 g/hp-hr 0.0009 0.00001 0.004
Front End Loader, 5 yd3 1 149 0.75 18 6,570 hours 0.25 0.002 g/hp-hr 0.0004 0.000005 0.002
Bob Cats, 2,400 lbs 2 82 0.75 18 6,570 hours 0.59 0.002 g/hp-hr 0.0004 0.000005 0.002
Rosemont Copper ProjectEmission Inventory Information JBR ENVIRONMENTAL CONSULTANTS, INC.
November 2011Page H357
AZRP00539
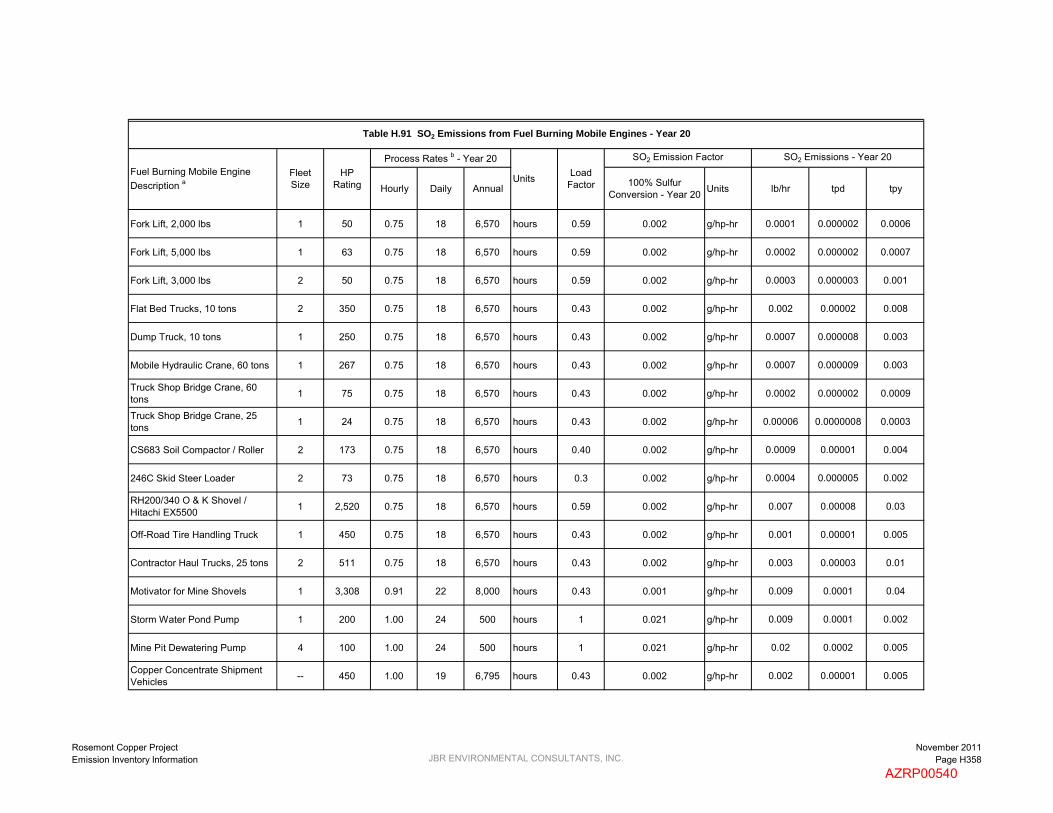
Hourly Daily Annual 100% Sulfur Conversion - Year 20 Units lb/hr tpd tpy
SO2 Emissions - Year 20
Units Load Factor
SO2 Emission FactorProcess Rates b - Year 20
Table H.91 SO2 Emissions from Fuel Burning Mobile Engines - Year 20
Fuel Burning Mobile Engine Description a
Fleet Size
HP Rating
Fork Lift, 2,000 lbs 1 50 0.75 18 6,570 hours 0.59 0.002 g/hp-hr 0.0001 0.000002 0.0006
Fork Lift, 5,000 lbs 1 63 0.75 18 6,570 hours 0.59 0.002 g/hp-hr 0.0002 0.000002 0.0007
Fork Lift, 3,000 lbs 2 50 0.75 18 6,570 hours 0.59 0.002 g/hp-hr 0.0003 0.000003 0.001
Flat Bed Trucks, 10 tons 2 350 0.75 18 6,570 hours 0.43 0.002 g/hp-hr 0.002 0.00002 0.008
Dump Truck, 10 tons 1 250 0.75 18 6,570 hours 0.43 0.002 g/hp-hr 0.0007 0.000008 0.003
Mobile Hydraulic Crane, 60 tons 1 267 0.75 18 6,570 hours 0.43 0.002 g/hp-hr 0.0007 0.000009 0.003
Truck Shop Bridge Crane, 60 tons 1 75 0.75 18 6,570 hours 0.43 0.002 g/hp-hr 0.0002 0.000002 0.0009
Truck Shop Bridge Crane, 25 tons 1 24 0.75 18 6,570 hours 0.43 0.002 g/hp-hr 0.00006 0.0000008 0.0003
CS683 Soil Compactor / Roller 2 173 0.75 18 6,570 hours 0.40 0.002 g/hp-hr 0.0009 0.00001 0.004
246C Skid Steer Loader 2 73 0.75 18 6,570 hours 0.3 0.002 g/hp-hr 0.0004 0.000005 0.002
RH200/340 O & K Shovel / Hitachi EX5500 1 2,520 0.75 18 6,570 hours 0.59 0.002 g/hp-hr 0.007 0.00008 0.03
Off-Road Tire Handling Truck 1 450 0.75 18 6,570 hours 0.43 0.002 g/hp-hr 0.001 0.00001 0.005
Contractor Haul Trucks, 25 tons 2 511 0.75 18 6,570 hours 0.43 0.002 g/hp-hr 0.003 0.00003 0.01
Motivator for Mine Shovels 1 3,308 0.91 22 8,000 hours 0.43 0.001 g/hp-hr 0.009 0.0001 0.04
Storm Water Pond Pump 1 200 1.00 24 500 hours 1 0.021 g/hp-hr 0.009 0.0001 0.002
Mine Pit Dewatering Pump 4 100 1.00 24 500 hours 1 0.021 g/hp-hr 0.02 0.0002 0.005
Copper Concentrate Shipment Vehicles -- 450 1.00 19 6,795 hours 0.43 0.002 g/hp-hr 0.002 0.00001 0.005
Rosemont Copper ProjectEmission Inventory Information JBR ENVIRONMENTAL CONSULTANTS, INC.
November 2011Page H358
AZRP00540

Hourly Daily Annual 100% Sulfur Conversion - Year 20 Units lb/hr tpd tpy
SO2 Emissions - Year 20
Units Load Factor
SO2 Emission FactorProcess Rates b - Year 20
Table H.91 SO2 Emissions from Fuel Burning Mobile Engines - Year 20
Fuel Burning Mobile Engine Description a
Fleet Size
HP Rating
Molybdenum Concentrate Shipment Vehicles -- 450 1.00 1 86 hours 0.43 0.124 g/hp-hr 0.12 0.00006 0.005
Sulfuric Acid Delivery Vehicles -- 450 1.00 6 2,081 hours 0.43 0.005 g/hp-hr 0.005 0.00001 0.005
Lime Delivery Vehicles -- 450 1.00 2 763 hours 0.43 0.014 g/hp-hr 0.01 0.00001 0.005
SAG Mill and Ball Mill Grinding Balls Delivery Vehicles -- 450 1.00 1 234 hours 0.43 0.045 g/hp-hr 0.05 0.00002 0.005
Diesel Fuel Delivery Vehicles -- 500 1.00 2 685 hours 0.43 0.016 g/hp-hr 0.02 0.00002 0.006
Copper Cathode Shipment Vehicles -- 450 1.00 1 200 hours 0.43 0.053 g/hp-hr 0.05 0.00003 0.005
Ammonium Nitrate Delivery Vehicles -- 450 1.00 1 255 hours 0.43 0.042 g/hp-hr 0.04 0.00002 0.005
Miscellaneous Consumables Delivery Vehicles -- 450 1.00 1 499 hours 0.43 0.021 g/hp-hr 0.02 0.00001 0.005
Miscellaneous Fuels and Lubricants Delivery Vehicles -- 450 1.00 1 44 hours 0.43 0.240 g/hp-hr 0.24 0.0001 0.005
Pickup Trucks (gasoline) 20 350 0.25 6 2,190 hours 0.54 0.017 g/hp-hr 0.003 0.00004 0.01
Crew Van (gasoline) 3 350 0.25 6 2,190 hours 0.54 0.0025 g/hp-hr 0.0005 0.000006 0.002
Lot Pick-Up Trucks (gasoline) 20 250 0.25 6 2,190 hours 0.54 0.017 g/hp-hr 0.002 0.00003 0.01
0.29 0.004 0.96
0.71 0.002 0.57
1.00 0.006 1.54
a Fuel burning mobile engines are diesel fuel fired unless otherwise noted.
b Except for the shipment and delivery vehicles, the process rates are for a single mobile engine. The process rates for the shipment and delivery vehicles are representative of the entire fleet.
Total Emissions from Haul Truck Engines:
Total Emissions from Other Mobile Engines:
Total Emissions from All Mobile Engines:
Rosemont Copper ProjectEmission Inventory Information JBR ENVIRONMENTAL CONSULTANTS, INC.
November 2011Page H359
AZRP00541
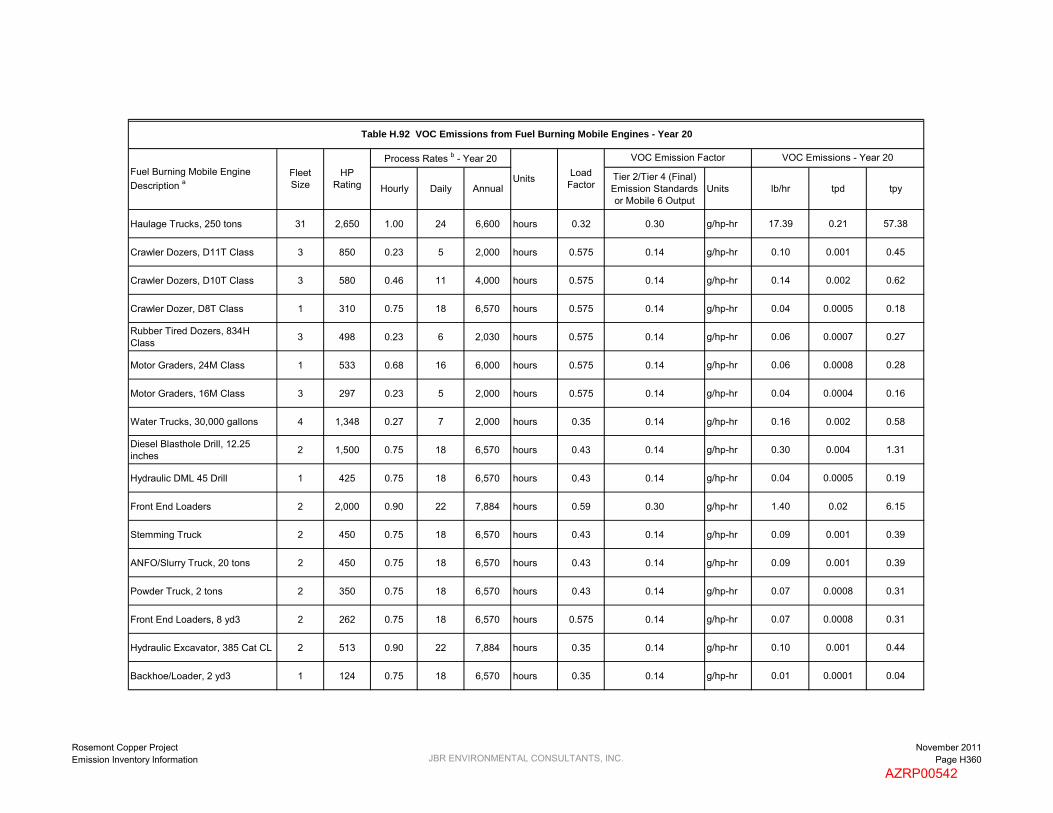
Hourly Daily AnnualTier 2/Tier 4 (Final) Emission Standards or Mobile 6 Output
Units lb/hr tpd tpy
Haulage Trucks, 250 tons 31 2,650 1.00 24 6,600 hours 0.32 0.30 g/hp-hr 17.39 0.21 57.38
Crawler Dozers, D11T Class 3 850 0.23 5 2,000 hours 0.575 0.14 g/hp-hr 0.10 0.001 0.45
Crawler Dozers, D10T Class 3 580 0.46 11 4,000 hours 0.575 0.14 g/hp-hr 0.14 0.002 0.62
Crawler Dozer, D8T Class 1 310 0.75 18 6,570 hours 0.575 0.14 g/hp-hr 0.04 0.0005 0.18
Rubber Tired Dozers, 834H Class 3 498 0.23 6 2,030 hours 0.575 0.14 g/hp-hr 0.06 0.0007 0.27
Motor Graders, 24M Class 1 533 0.68 16 6,000 hours 0.575 0.14 g/hp-hr 0.06 0.0008 0.28
Motor Graders, 16M Class 3 297 0.23 5 2,000 hours 0.575 0.14 g/hp-hr 0.04 0.0004 0.16
Water Trucks, 30,000 gallons 4 1,348 0.27 7 2,000 hours 0.35 0.14 g/hp-hr 0.16 0.002 0.58
Diesel Blasthole Drill, 12.25 inches 2 1,500 0.75 18 6,570 hours 0.43 0.14 g/hp-hr 0.30 0.004 1.31
Hydraulic DML 45 Drill 1 425 0.75 18 6,570 hours 0.43 0.14 g/hp-hr 0.04 0.0005 0.19
Front End Loaders 2 2,000 0.90 22 7,884 hours 0.59 0.30 g/hp-hr 1.40 0.02 6.15
Stemming Truck 2 450 0.75 18 6,570 hours 0.43 0.14 g/hp-hr 0.09 0.001 0.39
ANFO/Slurry Truck, 20 tons 2 450 0.75 18 6,570 hours 0.43 0.14 g/hp-hr 0.09 0.001 0.39
Powder Truck, 2 tons 2 350 0.75 18 6,570 hours 0.43 0.14 g/hp-hr 0.07 0.0008 0.31
Front End Loaders, 8 yd3 2 262 0.75 18 6,570 hours 0.575 0.14 g/hp-hr 0.07 0.0008 0.31
Hydraulic Excavator, 385 Cat CL 2 513 0.90 22 7,884 hours 0.35 0.14 g/hp-hr 0.10 0.001 0.44
Backhoe/Loader, 2 yd3 1 124 0.75 18 6,570 hours 0.35 0.14 g/hp-hr 0.01 0.0001 0.04
VOC Emissions - Year 20Load
Factor
VOC Emission FactorProcess Rates b - Year 20
Units
Table H.92 VOC Emissions from Fuel Burning Mobile Engines - Year 20
Fuel Burning Mobile Engine Description a
Fleet Size
HP Rating
Rosemont Copper ProjectEmission Inventory Information JBR ENVIRONMENTAL CONSULTANTS, INC.
November 2011Page H360
AZRP00542
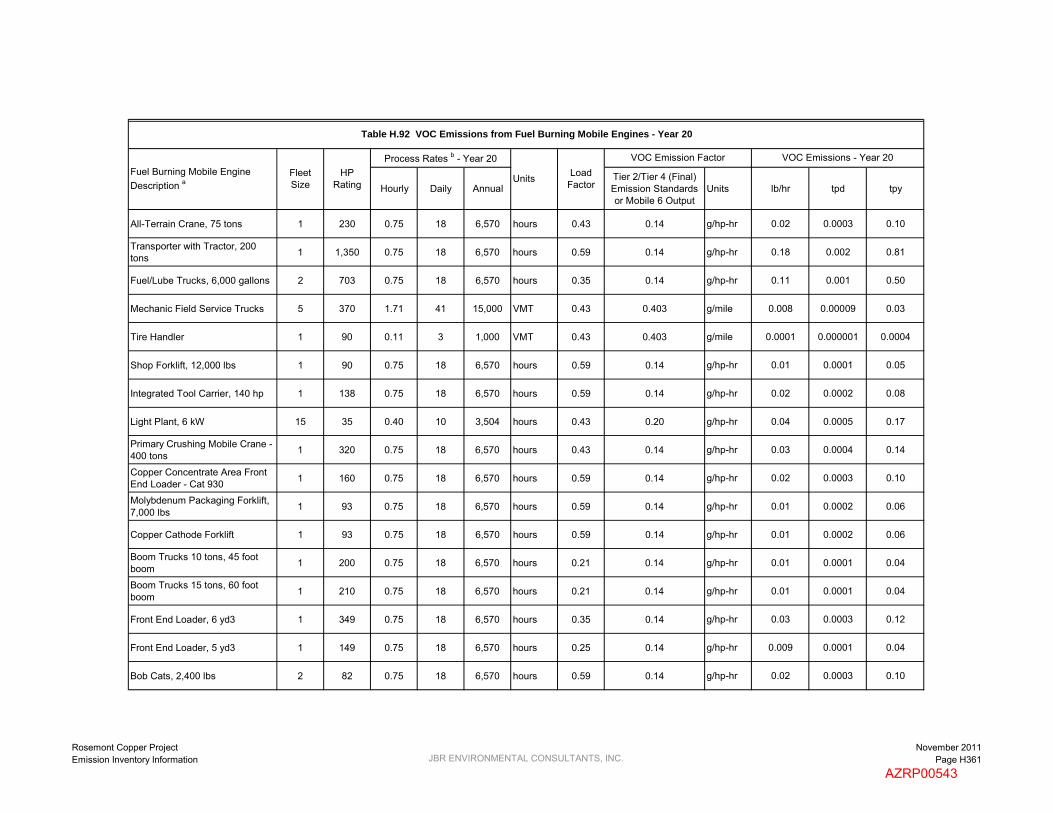
Hourly Daily AnnualTier 2/Tier 4 (Final) Emission Standards or Mobile 6 Output
Units lb/hr tpd tpy
VOC Emissions - Year 20Load
Factor
VOC Emission FactorProcess Rates b - Year 20
Units
Table H.92 VOC Emissions from Fuel Burning Mobile Engines - Year 20
Fuel Burning Mobile Engine Description a
Fleet Size
HP Rating
All-Terrain Crane, 75 tons 1 230 0.75 18 6,570 hours 0.43 0.14 g/hp-hr 0.02 0.0003 0.10
Transporter with Tractor, 200 tons 1 1,350 0.75 18 6,570 hours 0.59 0.14 g/hp-hr 0.18 0.002 0.81
Fuel/Lube Trucks, 6,000 gallons 2 703 0.75 18 6,570 hours 0.35 0.14 g/hp-hr 0.11 0.001 0.50
Mechanic Field Service Trucks 5 370 1.71 41 15,000 VMT 0.43 0.403 g/mile 0.008 0.00009 0.03
Tire Handler 1 90 0.11 3 1,000 VMT 0.43 0.403 g/mile 0.0001 0.000001 0.0004
Shop Forklift, 12,000 lbs 1 90 0.75 18 6,570 hours 0.59 0.14 g/hp-hr 0.01 0.0001 0.05
Integrated Tool Carrier, 140 hp 1 138 0.75 18 6,570 hours 0.59 0.14 g/hp-hr 0.02 0.0002 0.08
Light Plant, 6 kW 15 35 0.40 10 3,504 hours 0.43 0.20 g/hp-hr 0.04 0.0005 0.17
Primary Crushing Mobile Crane - 400 tons 1 320 0.75 18 6,570 hours 0.43 0.14 g/hp-hr 0.03 0.0004 0.14
Copper Concentrate Area Front End Loader - Cat 930 1 160 0.75 18 6,570 hours 0.59 0.14 g/hp-hr 0.02 0.0003 0.10
Molybdenum Packaging Forklift, 7,000 lbs 1 93 0.75 18 6,570 hours 0.59 0.14 g/hp-hr 0.01 0.0002 0.06
Copper Cathode Forklift 1 93 0.75 18 6,570 hours 0.59 0.14 g/hp-hr 0.01 0.0002 0.06
Boom Trucks 10 tons, 45 foot boom 1 200 0.75 18 6,570 hours 0.21 0.14 g/hp-hr 0.01 0.0001 0.04
Boom Trucks 15 tons, 60 foot boom 1 210 0.75 18 6,570 hours 0.21 0.14 g/hp-hr 0.01 0.0001 0.04
Front End Loader, 6 yd3 1 349 0.75 18 6,570 hours 0.35 0.14 g/hp-hr 0.03 0.0003 0.12
Front End Loader, 5 yd3 1 149 0.75 18 6,570 hours 0.25 0.14 g/hp-hr 0.009 0.0001 0.04
Bob Cats, 2,400 lbs 2 82 0.75 18 6,570 hours 0.59 0.14 g/hp-hr 0.02 0.0003 0.10
Rosemont Copper ProjectEmission Inventory Information JBR ENVIRONMENTAL CONSULTANTS, INC.
November 2011Page H361
AZRP00543

Hourly Daily AnnualTier 2/Tier 4 (Final) Emission Standards or Mobile 6 Output
Units lb/hr tpd tpy
VOC Emissions - Year 20Load
Factor
VOC Emission FactorProcess Rates b - Year 20
Units
Table H.92 VOC Emissions from Fuel Burning Mobile Engines - Year 20
Fuel Burning Mobile Engine Description a
Fleet Size
HP Rating
Fork Lift, 2,000 lbs 1 50 0.75 18 6,570 hours 0.59 0.20 g/hp-hr 0.01 0.0001 0.04
Fork Lift, 5,000 lbs 1 63 0.75 18 6,570 hours 0.59 0.20 g/hp-hr 0.01 0.0001 0.05
Fork Lift, 3,000 lbs 2 50 0.75 18 6,570 hours 0.59 0.20 g/hp-hr 0.02 0.0002 0.09
Flat Bed Trucks, 10 tons 2 350 0.75 18 6,570 hours 0.43 0.14 g/hp-hr 0.07 0.0008 0.31
Dump Truck, 10 tons 1 250 0.34 8 3,000 VMT 0.43 0.403 g/mile 0.0003 0.000004 0.001
Mobile Hydraulic Crane, 60 tons 1 267 0.75 18 6,570 hours 0.43 0.14 g/hp-hr 0.03 0.0003 0.12
Truck Shop Bridge Crane, 60 tons 1 75 0.75 18 6,570 hours 0.43 0.14 g/hp-hr 0.007 0.00009 0.03
Truck Shop Bridge Crane, 25 tons 1 24 0.75 18 6,570 hours 0.43 0.60 g/hp-hr 0.01 0.0001 0.05
CS683 Soil Compactor / Roller 2 173 0.75 18 6,570 hours 0.4 0.14 g/hp-hr 0.03 0.0004 0.14
246C Skid Steer Loader 2 73 0.75 18 6,570 hours 0.3 0.20 g/hp-hr 0.01 0.0002 0.06
RH200/340 O & K Shovel / Hitachi EX5500 1 2,520 0.75 18 6,570 hours 0.59 0.14 g/hp-hr 0.34 0.004 1.51
Off-Road Tire Handling Truck 1 450 0.86 21 7,500 VMT 0.43 0.403 g/mile 0.0008 0.000009 0.003
Contractor Haul Trucks, 25 tons 2 511 2.74 66 24,000 VMT 0.43 0.403 g/mile 0.005 0.00006 0.02
Motivator for Mine Shovels 1 3,308 0.91 22 8,000 hours 0.43 0.14 g/hp-hr 0.40 0.005 1.76
Storm Water Pond Pump 1 200 1.00 24 500 hours 1 0.14 g/hp-hr 0.06 0.0007 0.02
Mine Pit Dewatering Pump 4 100 1.00 24 500 hours 1 0.14 g/hp-hr 0.12 0.001 0.03
Copper Concentrate Shipment Vehicles -- 450 29.60 1,021 169,872 VMT 0.43 0.403 g/mile 0.03 0.0005 0.08
Rosemont Copper ProjectEmission Inventory Information JBR ENVIRONMENTAL CONSULTANTS, INC.
November 2011Page H362
AZRP00544

Hourly Daily AnnualTier 2/Tier 4 (Final) Emission Standards or Mobile 6 Output
Units lb/hr tpd tpy
VOC Emissions - Year 20Load
Factor
VOC Emission FactorProcess Rates b - Year 20
Units
Table H.92 VOC Emissions from Fuel Burning Mobile Engines - Year 20
Fuel Burning Mobile Engine Description a
Fleet Size
HP Rating
Molybdenum Concentrate Shipment Vehicles -- 450 7.40 15 2,145 VMT 0.43 0.403 g/mile 0.007 0.000007 0.001
Sulfuric Acid Delivery Vehicles -- 450 22.20 143 52,021 VMT 0.43 0.403 g/mile 0.02 0.00006 0.02
Lime Delivery Vehicles -- 450 14.80 52 19,072 VMT 0.43 0.403 g/mile 0.01 0.00002 0.008
SAG Mill and Ball Mill Grinding Balls Delivery Vehicles -- 450 14.80 23 5,858 VMT 0.43 0.403 g/mile 0.01 0.00001 0.003
Diesel Fuel Delivery Vehicles -- 500 14.80 47 17,136 VMT 0.43 0.403 g/mile 0.01 0.00002 0.008
Copper Cathode Shipment Vehicles -- 450 14.80 42 4,997 VMT 0.43 0.403 g/mile 0.01 0.00002 0.002
Ammonium Nitrate Delivery Vehicles -- 450 7.40 25 6,384 VMT 0.43 0.403 g/mile 0.007 0.00001 0.003
Miscellaneous Consumables Delivery Vehicles -- 450 7.40 48 12,486 VMT 0.43 0.403 g/mile 0.007 0.00002 0.006
Miscellaneous Fuels and Lubricants Delivery Vehicles -- 450 7.40 7 1,110 VMT 0.43 0.403 g/mile 0.007 0.000003 0.0005
Pickup Trucks (gasoline) 20 350 1.37 33 12,000 VMT 0.54 1.329 g/mile 0.08 0.001 0.35
Crew Van (gasoline) 3 350 0.91 22 8,000 VMT 0.54 1.329 g/mile 0.008 0.0001 0.04
Lot Pick-Up Trucks (gasoline) 20 250 0.34 8 3,000 VMT 0.54 1.329 g/mile 0.02 0.0002 0.09
17.39 0.21 57.38
4.71 0.06 19.34
22.10 0.26 76.71
a Fuel burning mobile engines are diesel fuel fired unless otherwise noted.
b Except for the shipment and delivery vehicles, the process rates are for a single mobile engine. The process rates for the shipment and delivery vehicles are representative of the entire fleet.
Total Emissions from Haul Truck Engines:
Total Emissions from Other Mobile Engines:
Total Emissions from All Mobile Engines:
Rosemont Copper ProjectEmission Inventory Information JBR ENVIRONMENTAL CONSULTANTS, INC.
November 2011Page H363
AZRP00545
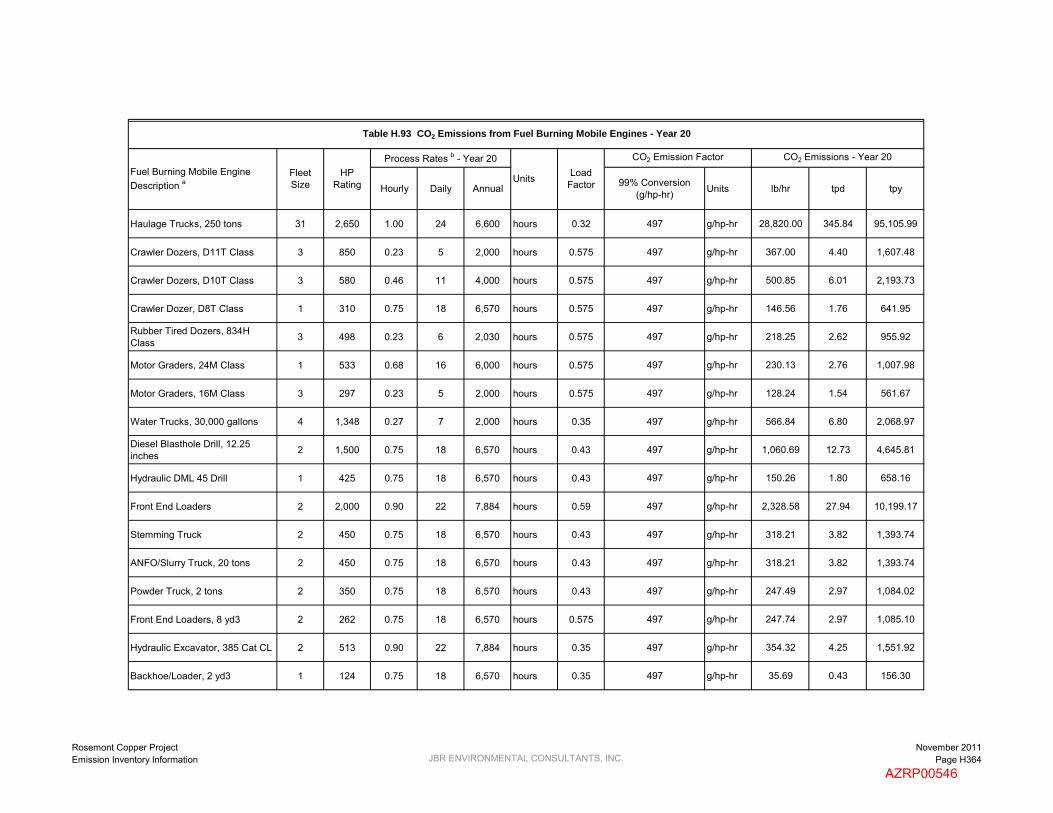
Hourly Daily Annual 99% Conversion(g/hp-hr) Units lb/hr tpd tpy
Haulage Trucks, 250 tons 31 2,650 1.00 24 6,600 hours 0.32 497 g/hp-hr 28,820.00 345.84 95,105.99
Crawler Dozers, D11T Class 3 850 0.23 5 2,000 hours 0.575 497 g/hp-hr 367.00 4.40 1,607.48
Crawler Dozers, D10T Class 3 580 0.46 11 4,000 hours 0.575 497 g/hp-hr 500.85 6.01 2,193.73
Crawler Dozer, D8T Class 1 310 0.75 18 6,570 hours 0.575 497 g/hp-hr 146.56 1.76 641.95
Rubber Tired Dozers, 834H Class 3 498 0.23 6 2,030 hours 0.575 497 g/hp-hr 218.25 2.62 955.92
Motor Graders, 24M Class 1 533 0.68 16 6,000 hours 0.575 497 g/hp-hr 230.13 2.76 1,007.98
Motor Graders, 16M Class 3 297 0.23 5 2,000 hours 0.575 497 g/hp-hr 128.24 1.54 561.67
Water Trucks, 30,000 gallons 4 1,348 0.27 7 2,000 hours 0.35 497 g/hp-hr 566.84 6.80 2,068.97
Diesel Blasthole Drill, 12.25 inches 2 1,500 0.75 18 6,570 hours 0.43 497 g/hp-hr 1,060.69 12.73 4,645.81
Hydraulic DML 45 Drill 1 425 0.75 18 6,570 hours 0.43 497 g/hp-hr 150.26 1.80 658.16
Front End Loaders 2 2,000 0.90 22 7,884 hours 0.59 497 g/hp-hr 2,328.58 27.94 10,199.17
Stemming Truck 2 450 0.75 18 6,570 hours 0.43 497 g/hp-hr 318.21 3.82 1,393.74
ANFO/Slurry Truck, 20 tons 2 450 0.75 18 6,570 hours 0.43 497 g/hp-hr 318.21 3.82 1,393.74
Powder Truck, 2 tons 2 350 0.75 18 6,570 hours 0.43 497 g/hp-hr 247.49 2.97 1,084.02
Front End Loaders, 8 yd3 2 262 0.75 18 6,570 hours 0.575 497 g/hp-hr 247.74 2.97 1,085.10
Hydraulic Excavator, 385 Cat CL 2 513 0.90 22 7,884 hours 0.35 497 g/hp-hr 354.32 4.25 1,551.92
Backhoe/Loader, 2 yd3 1 124 0.75 18 6,570 hours 0.35 497 g/hp-hr 35.69 0.43 156.30
CO2 Emissions - Year 20Load
Factor
CO2 Emission FactorProcess Rates b - Year 20
Units
Table H.93 CO2 Emissions from Fuel Burning Mobile Engines - Year 20
Fuel Burning Mobile Engine Description a
Fleet Size
HP Rating
Rosemont Copper ProjectEmission Inventory Information JBR ENVIRONMENTAL CONSULTANTS, INC.
November 2011Page H364
AZRP00546

Hourly Daily Annual 99% Conversion(g/hp-hr) Units lb/hr tpd tpy
CO2 Emissions - Year 20Load
Factor
CO2 Emission FactorProcess Rates b - Year 20
Units
Table H.93 CO2 Emissions from Fuel Burning Mobile Engines - Year 20
Fuel Burning Mobile Engine Description a
Fleet Size
HP Rating
All-Terrain Crane, 75 tons 1 230 0.75 18 6,570 hours 0.43 497 g/hp-hr 81.32 0.98 356.18
Transporter with Tractor, 200 tons 1 1,350 0.75 18 6,570 hours 0.59 497 g/hp-hr 654.91 7.86 2,868.52
Fuel/Lube Trucks, 6,000 gallons 2 703 0.75 18 6,570 hours 0.35 497 g/hp-hr 404.62 4.86 1,772.25
Mechanic Field Service Trucks 5 370 0.75 18 6,570 hours 0.43 497 g/hp-hr 654.09 7.85 2,864.92
Tire Handler 1 90 0.75 18 6,570 hours 0.43 497 g/hp-hr 31.82 0.38 139.37
Shop Forklift, 12,000 lbs 1 90 0.75 18 6,570 hours 0.59 497 g/hp-hr 43.66 0.52 191.23
Integrated Tool Carrier, 140 hp 1 138 0.75 18 6,570 hours 0.59 497 g/hp-hr 66.95 0.80 293.23
Light Plant, 6 kW 15 35 0.40 10 3,504 hours 0.43 497 g/hp-hr 99.00 1.19 433.61
Primary Crushing Mobile Crane - 400 tons 1 320 0.75 18 6,570 hours 0.43 497 g/hp-hr 113.14 1.36 495.55
Copper Concentrate Area Front End Loader - Cat 930 1 160 0.75 18 6,570 hours 0.59 497 g/hp-hr 77.62 0.93 339.97
Molybdenum Packaging Forklift, 7,000 lbs 1 93 0.75 18 6,570 hours 0.59 497 g/hp-hr 44.87 0.54 196.55
Copper Cathode Forklift 1 93 0.75 18 6,570 hours 0.59 497 g/hp-hr 44.87 0.54 196.55
Boom Trucks 10 tons, 45 foot boom 1 200 0.75 18 6,570 hours 0.21 497 g/hp-hr 34.53 0.41 151.26
Boom Trucks 15 tons, 60 foot boom 1 210 0.75 18 6,570 hours 0.21 497 g/hp-hr 36.26 0.44 158.82
Front End Loader, 6 yd3 1 349 0.75 18 6,570 hours 0.35 497 g/hp-hr 100.44 1.21 439.91
Front End Loader, 5 yd3 1 149 0.75 18 6,570 hours 0.25 497 g/hp-hr 30.63 0.37 134.15
Bob Cats, 2,400 lbs 2 82 0.75 18 6,570 hours 0.59 497 g/hp-hr 79.56 0.95 348.47
Rosemont Copper ProjectEmission Inventory Information JBR ENVIRONMENTAL CONSULTANTS, INC.
November 2011Page H365
AZRP00547

Hourly Daily Annual 99% Conversion(g/hp-hr) Units lb/hr tpd tpy
CO2 Emissions - Year 20Load
Factor
CO2 Emission FactorProcess Rates b - Year 20
Units
Table H.93 CO2 Emissions from Fuel Burning Mobile Engines - Year 20
Fuel Burning Mobile Engine Description a
Fleet Size
HP Rating
Fork Lift, 2,000 lbs 1 50 0.75 18 6,570 hours 0.59 497 g/hp-hr 24.26 0.29 106.24
Fork Lift, 5,000 lbs 1 63 0.75 18 6,570 hours 0.59 497 g/hp-hr 30.56 0.37 133.86
Fork Lift, 3,000 lbs 2 50 0.75 18 6,570 hours 0.59 497 g/hp-hr 48.51 0.58 212.48
Flat Bed Trucks, 10 tons 2 350 0.75 18 6,570 hours 0.43 497 g/hp-hr 247.49 2.97 1,084.02
Dump Truck, 10 tons 1 250 0.75 18 6,570 hours 0.43 497 g/hp-hr 88.39 1.06 387.15
Mobile Hydraulic Crane, 60 tons 1 267 0.75 18 6,570 hours 0.43 497 g/hp-hr 94.40 1.13 413.48
Truck Shop Bridge Crane, 60 tons 1 75 0.75 18 6,570 hours 0.43 497 g/hp-hr 26.52 0.32 116.15
Truck Shop Bridge Crane, 25 tons 1 24 0.75 18 6,570 hours 0.43 497 g/hp-hr 8.52 0.10 37.32
CS683 Soil Compactor / Roller 2 173 0.75 18 6,570 hours 0.4 497 g/hp-hr 113.80 1.37 498.43
246C Skid Steer Loader 2 73 0.75 18 6,570 hours 0.3 497 g/hp-hr 36.01 0.43 157.74
RH200/340 O & K Shovel / Hitachi EX5500 1 2,520 0.75 18 6,570 hours 0.59 497 g/hp-hr 1,222.50 14.67 5,354.57
Off-Road Tire Handling Truck 1 450 0.75 18 6,570 hours 0.43 497 g/hp-hr 159.10 1.91 696.87
Contractor Haul Trucks, 25 tons 2 511 0.75 18 6,570 hours 0.43 497 g/hp-hr 361.34 4.34 1,582.67
Motivator for Mine Shovels 1 3,308 0.91 22 8,000 hours 0.43 497 g/hp-hr 1,424.15 17.09 6,237.78
Storm Water Pond Pump 1 200 1.00 24 500 hours 1 497 g/hp-hr 219.26 2.63 54.82
Mine Pit Dewatering Pump 4 100 1.00 24 500 hours 1 497 g/hp-hr 438.53 5.26 109.63
Copper Concentrate Shipment Vehicles -- 450 1.00 19 6,795 hours 0.43 497 g/hp-hr 212.14 1.97 720.72
Rosemont Copper ProjectEmission Inventory Information JBR ENVIRONMENTAL CONSULTANTS, INC.
November 2011Page H366
AZRP00548

Hourly Daily Annual 99% Conversion(g/hp-hr) Units lb/hr tpd tpy
CO2 Emissions - Year 20Load
Factor
CO2 Emission FactorProcess Rates b - Year 20
Units
Table H.93 CO2 Emissions from Fuel Burning Mobile Engines - Year 20
Fuel Burning Mobile Engine Description a
Fleet Size
HP Rating
Molybdenum Concentrate Shipment Vehicles -- 450 1.00 1 86 hours 0.43 497 g/hp-hr 212.14 0.11 9.10
Sulfuric Acid Delivery Vehicles -- 450 1.00 6 2,081 hours 0.43 497 g/hp-hr 212.14 0.60 220.71
Lime Delivery Vehicles -- 450 1.00 2 763 hours 0.43 497 g/hp-hr 212.14 0.22 80.92
SAG Mill and Ball Mill Grinding Balls Delivery Vehicles -- 450 1.00 1 234 hours 0.43 497 g/hp-hr 212.14 0.11 24.86
Diesel Fuel Delivery Vehicles -- 500 1.00 2 685 hours 0.43 497 g/hp-hr 235.71 0.22 80.78
Copper Cathode Shipment Vehicles -- 450 1.00 1 200 hours 0.43 497 g/hp-hr 212.14 0.11 21.20
Ammonium Nitrate Delivery Vehicles -- 450 1.00 1 255 hours 0.43 497 g/hp-hr 212.14 0.11 27.09
Miscellaneous Consumables Delivery Vehicles -- 450 1.00 1 499 hours 0.43 497 g/hp-hr 212.14 0.15 52.98
Miscellaneous Fuels and Lubricants Delivery Vehicles -- 450 1.00 1 44 hours 0.43 497 g/hp-hr 212.14 0.11 4.71
Pickup Trucks (gasoline) 20 350 0.25 6 2,190 hours 0.54 1.08 lb/hp-hr 51.03 0.61 223.51
Crew Van (gasoline) 3 350 0.25 6 2,190 hours 0.54 1.08 lb/hp-hr 51.03 0.61 223.51
Lot Pick-Up Trucks (gasoline) 20 250 0.25 6 2,190 hours 0.54 1.08 lb/hp-hr 36.45 0.44 159.65
28,820.00 345.84 95,105.99
16,644.16 177.69 61,619.17
45,464.16 523.53 156,725.16
a Fuel burning mobile engines are diesel fuel fired unless otherwise noted.
b Except for the shipment and delivery vehicles, the process rates are for a single mobile engine. The process rates for the shipment and delivery vehicles are representative of the entire fleet.
Total Emissions from Haul Truck Engines:
Total Emissions from Other Mobile Engines:
Total Emissions from All Mobile Engines:
Rosemont Copper ProjectEmission Inventory Information JBR ENVIRONMENTAL CONSULTANTS, INC.
November 2011Page H367
AZRP00549
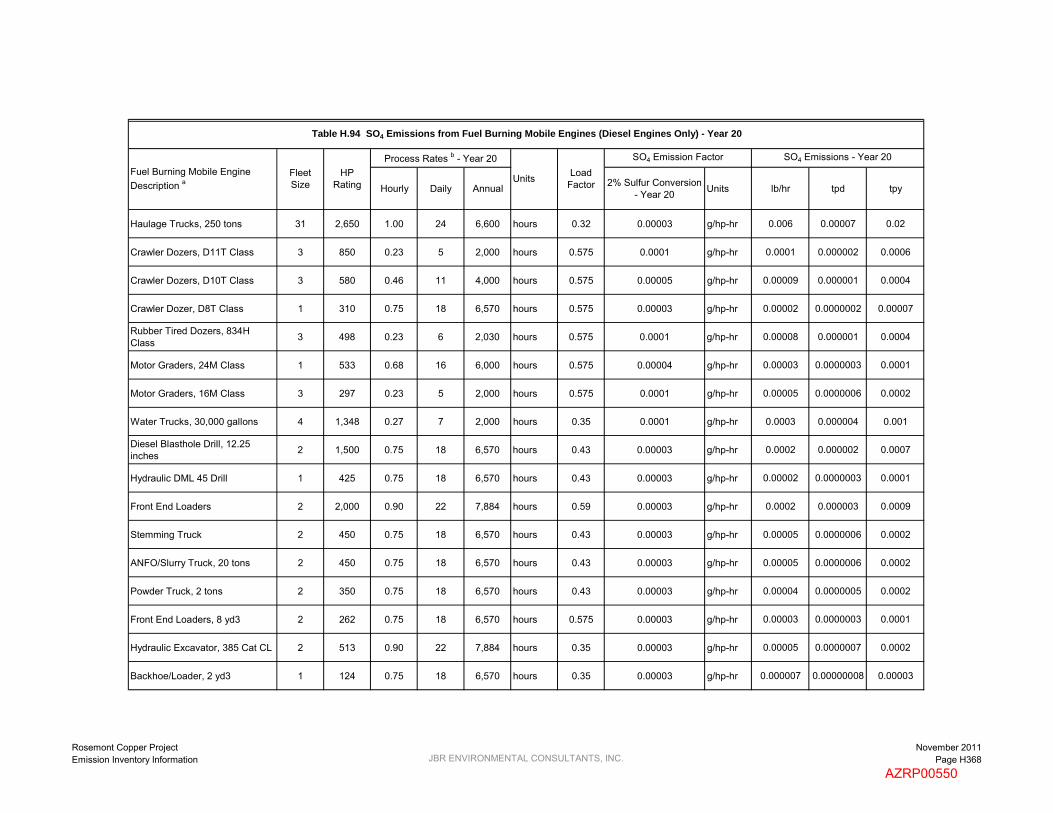
Hourly Daily Annual 2% Sulfur Conversion - Year 20 Units lb/hr tpd tpy
Haulage Trucks, 250 tons 31 2,650 1.00 24 6,600 hours 0.32 0.00003 g/hp-hr 0.006 0.00007 0.02
Crawler Dozers, D11T Class 3 850 0.23 5 2,000 hours 0.575 0.0001 g/hp-hr 0.0001 0.000002 0.0006
Crawler Dozers, D10T Class 3 580 0.46 11 4,000 hours 0.575 0.00005 g/hp-hr 0.00009 0.000001 0.0004
Crawler Dozer, D8T Class 1 310 0.75 18 6,570 hours 0.575 0.00003 g/hp-hr 0.00002 0.0000002 0.00007
Rubber Tired Dozers, 834H Class 3 498 0.23 6 2,030 hours 0.575 0.0001 g/hp-hr 0.00008 0.000001 0.0004
Motor Graders, 24M Class 1 533 0.68 16 6,000 hours 0.575 0.00004 g/hp-hr 0.00003 0.0000003 0.0001
Motor Graders, 16M Class 3 297 0.23 5 2,000 hours 0.575 0.0001 g/hp-hr 0.00005 0.0000006 0.0002
Water Trucks, 30,000 gallons 4 1,348 0.27 7 2,000 hours 0.35 0.0001 g/hp-hr 0.0003 0.000004 0.001
Diesel Blasthole Drill, 12.25 inches 2 1,500 0.75 18 6,570 hours 0.43 0.00003 g/hp-hr 0.0002 0.000002 0.0007
Hydraulic DML 45 Drill 1 425 0.75 18 6,570 hours 0.43 0.00003 g/hp-hr 0.00002 0.0000003 0.0001
Front End Loaders 2 2,000 0.90 22 7,884 hours 0.59 0.00003 g/hp-hr 0.0002 0.000003 0.0009
Stemming Truck 2 450 0.75 18 6,570 hours 0.43 0.00003 g/hp-hr 0.00005 0.0000006 0.0002
ANFO/Slurry Truck, 20 tons 2 450 0.75 18 6,570 hours 0.43 0.00003 g/hp-hr 0.00005 0.0000006 0.0002
Powder Truck, 2 tons 2 350 0.75 18 6,570 hours 0.43 0.00003 g/hp-hr 0.00004 0.0000005 0.0002
Front End Loaders, 8 yd3 2 262 0.75 18 6,570 hours 0.575 0.00003 g/hp-hr 0.00003 0.0000003 0.0001
Hydraulic Excavator, 385 Cat CL 2 513 0.90 22 7,884 hours 0.35 0.00003 g/hp-hr 0.00005 0.0000007 0.0002
Backhoe/Loader, 2 yd3 1 124 0.75 18 6,570 hours 0.35 0.00003 g/hp-hr 0.000007 0.00000008 0.00003
SO4 Emissions - Year 20
Units Load Factor
SO4 Emission FactorProcess Rates b - Year 20
Table H.94 SO4 Emissions from Fuel Burning Mobile Engines (Diesel Engines Only) - Year 20
Fuel Burning Mobile Engine Description a
Fleet Size
HP Rating
Rosemont Copper ProjectEmission Inventory Information JBR ENVIRONMENTAL CONSULTANTS, INC.
November 2011Page H368
AZRP00550

Hourly Daily Annual 2% Sulfur Conversion - Year 20 Units lb/hr tpd tpy
SO4 Emissions - Year 20
Units Load Factor
SO4 Emission FactorProcess Rates b - Year 20
Table H.94 SO4 Emissions from Fuel Burning Mobile Engines (Diesel Engines Only) - Year 20
Fuel Burning Mobile Engine Description a
Fleet Size
HP Rating
All-Terrain Crane, 75 tons 1 230 0.75 18 6,570 hours 0.43 0.00003 g/hp-hr 0.00001 0.0000001 0.00005
Transporter with Tractor, 200 tons 1 1,350 0.75 18 6,570 hours 0.59 0.00003 g/hp-hr 0.00007 0.0000009 0.0003
Fuel/Lube Trucks, 6,000 gallons 2 703 0.75 18 6,570 hours 0.35 0.00003 g/hp-hr 0.00008 0.0000009 0.0003
Mechanic Field Service Trucks 5 370 0.75 18 6,570 hours 0.43 0.00003 g/hp-hr 0.0001 0.000001 0.0004
Tire Handler 1 90 0.75 18 6,570 hours 0.43 0.00003 g/hp-hr 0.000005 0.00000006 0.00002
Shop Forklift, 12,000 lbs 1 90 0.75 18 6,570 hours 0.59 0.00003 g/hp-hr 0.000005 0.00000006 0.00002
Integrated Tool Carrier, 140 hp 1 138 0.75 18 6,570 hours 0.59 0.00003 g/hp-hr 0.000007 0.00000009 0.00003
Light Plant, 6 kW 15 35 0.40 10 3,504 hours 0.43 0.00006 g/hp-hr 0.00003 0.0000003 0.0001
Primary Crushing Mobile Crane - 400 tons 1 320 0.75 18 6,570 hours 0.43 0.00003 g/hp-hr 0.00002 0.0000002 0.00008
Copper Concentrate Area Front End Loader - Cat 930 1 160 0.75 18 6,570 hours 0.59 0.00003 g/hp-hr 0.000009 0.0000001 0.00004
Molybdenum Packaging Forklift, 7,000 lbs 1 93 0.75 18 6,570 hours 0.59 0.00003 g/hp-hr 0.000005 0.00000006 0.00002
Copper Cathode Forklift 1 93 0.75 18 6,570 hours 0.59 0.00003 g/hp-hr 0.000005 0.00000006 0.00002
Boom Trucks 10 tons, 45 foot boom 1 200 0.75 18 6,570 hours 0.21 0.00003 g/hp-hr 0.00001 0.0000001 0.00005
Boom Trucks 15 tons, 60 foot boom 1 210 0.75 18 6,570 hours 0.21 0.00003 g/hp-hr 0.00001 0.0000001 0.00005
Front End Loader, 6 yd3 1 349 0.75 18 6,570 hours 0.35 0.00003 g/hp-hr 0.00002 0.0000002 0.00008
Front End Loader, 5 yd3 1 149 0.75 18 6,570 hours 0.25 0.00003 g/hp-hr 0.000008 0.0000001 0.00003
Bob Cats, 2,400 lbs 2 82 0.75 18 6,570 hours 0.59 0.00003 g/hp-hr 0.000009 0.0000001 0.00004
Rosemont Copper ProjectEmission Inventory Information JBR ENVIRONMENTAL CONSULTANTS, INC.
November 2011Page H369
AZRP00551

Hourly Daily Annual 2% Sulfur Conversion - Year 20 Units lb/hr tpd tpy
SO4 Emissions - Year 20
Units Load Factor
SO4 Emission FactorProcess Rates b - Year 20
Table H.94 SO4 Emissions from Fuel Burning Mobile Engines (Diesel Engines Only) - Year 20
Fuel Burning Mobile Engine Description a
Fleet Size
HP Rating
Fork Lift, 2,000 lbs 1 50 0.75 18 6,570 hours 0.59 0.00003 g/hp-hr 0.000003 0.00000003 0.00001
Fork Lift, 5,000 lbs 1 63 0.75 18 6,570 hours 0.59 0.00003 g/hp-hr 0.000003 0.00000004 0.00001
Fork Lift, 3,000 lbs 2 50 0.75 18 6,570 hours 0.59 0.00003 g/hp-hr 0.000005 0.00000006 0.00002
Flat Bed Trucks, 10 tons 2 350 0.75 18 6,570 hours 0.43 0.00003 g/hp-hr 0.00004 0.0000005 0.0002
Dump Truck, 10 tons 1 250 0.75 18 6,570 hours 0.43 0.00003 g/hp-hr 0.00001 0.0000002 0.00006
Mobile Hydraulic Crane, 60 tons 1 267 0.75 18 6,570 hours 0.43 0.00003 g/hp-hr 0.00001 0.0000002 0.00006
Truck Shop Bridge Crane, 60 tons 1 75 0.75 18 6,570 hours 0.43 0.00003 g/hp-hr 0.000004 0.00000005 0.00002
Truck Shop Bridge Crane, 25 tons 1 24 0.75 18 6,570 hours 0.43 0.00003 g/hp-hr 0.000001 0.00000002 0.000006
CS683 Soil Compactor / Roller 2 173 0.75 18 6,570 hours 0.40 0.00003 g/hp-hr 0.00002 0.0000002 0.00008
246C Skid Steer Loader 2 73 0.75 18 6,570 hours 0.3 0.00003 g/hp-hr 0.000008 0.00000009 0.00003
RH200/340 O & K Shovel / Hitachi EX5500 1 2,520 0.75 18 6,570 hours 0.59 0.00003 g/hp-hr 0.0001 0.000002 0.0006
Off-Road Tire Handling Truck 1 450 0.75 18 6,570 hours 0.43 0.00003 g/hp-hr 0.00002 0.0000003 0.0001
Contractor Haul Trucks, 25 tons 2 511 0.75 18 6,570 hours 0.43 0.00003 g/hp-hr 0.00005 0.0000007 0.0002
Motivator for Mine Shovels 1 3,308 0.91 22 8,000 hours 0.43 0.00003 g/hp-hr 0.0002 0.000002 0.0008
Storm Water Pond Pump 1 200 1.00 24 500 hours 1 0.0004 g/hp-hr 0.0002 0.000002 0.00005
Mine Pit Dewatering Pump 4 100 1.00 24 500 hours 1 0.0004 g/hp-hr 0.0004 0.000005 0.00009
Copper Concentrate Shipment Vehicles -- 450 1.00 19 6,795 hours 0.43 0.00003 g/hp-hr 0.00003 0.0000003 0.0001
Rosemont Copper ProjectEmission Inventory Information JBR ENVIRONMENTAL CONSULTANTS, INC.
November 2011Page H370
AZRP00552

Hourly Daily Annual 2% Sulfur Conversion - Year 20 Units lb/hr tpd tpy
SO4 Emissions - Year 20
Units Load Factor
SO4 Emission FactorProcess Rates b - Year 20
Table H.94 SO4 Emissions from Fuel Burning Mobile Engines (Diesel Engines Only) - Year 20
Fuel Burning Mobile Engine Description a
Fleet Size
HP Rating
Molybdenum Concentrate Shipment Vehicles -- 450 1.00 1 86 hours 0.43 0.002 g/hp-hr 0.002 0.000001 0.0001
Sulfuric Acid Delivery Vehicles -- 450 1.00 6 2,081 hours 0.43 0.0001 g/hp-hr 0.0001 0.0000003 0.0001
Lime Delivery Vehicles -- 450 1.00 2 763 hours 0.43 0.0003 g/hp-hr 0.0003 0.0000003 0.0001
SAG Mill and Ball Mill Grinding Balls Delivery Vehicles -- 450 1.00 1 234 hours 0.43 0.0009 g/hp-hr 0.0009 0.0000005 0.0001
Diesel Fuel Delivery Vehicles -- 500 1.00 2 685 hours 0.43 0.0003 g/hp-hr 0.0003 0.0000003 0.0001
Copper Cathode Shipment Vehicles -- 450 1.00 1 200 hours 0.43 0.001 g/hp-hr 0.001 0.0000005 0.0001
Ammonium Nitrate Delivery Vehicles -- 450 1.00 1 255 hours 0.43 0.0008 g/hp-hr 0.0008 0.0000004 0.0001
Miscellaneous Consumables Delivery Vehicles -- 450 1.00 1 499 hours 0.43 0.0004 g/hp-hr 0.0004 0.0000003 0.0001
Miscellaneous Fuels and Lubricants Delivery Vehicles -- 450 1.00 1 44 hours 0.43 0.005 g/hp-hr 0.005 0.000002 0.0001
Pickup Trucks (gasoline) 20 350 0.25 6 2,190 hours 0.54 -- -- -- -- --
Crew Van (gasoline) 3 350 0.25 6 2,190 hours 0.54 -- -- -- -- --
Lot Pick-Up Trucks (gasoline) 20 250 0.25 6 2,190 hours 0.54 -- -- -- -- --
0.006 0.00007 0.02
0.01 0.00004 0.01
0.02 0.0001 0.03
a Fuel burning mobile engines are diesel fuel fired unless otherwise noted.
b Except for the shipment and delivery vehicles, the process rates are for a single mobile engine. The process rates for the shipment and delivery vehicles are representative of the entire fleet.
Total Emissions from Haul Truck Engines:
Total Emissions from Other Mobile Engines:
Total Emissions from All Mobile Engines:
Rosemont Copper ProjectEmission Inventory Information JBR ENVIRONMENTAL CONSULTANTS, INC.
November 2011Page H371
AZRP00553
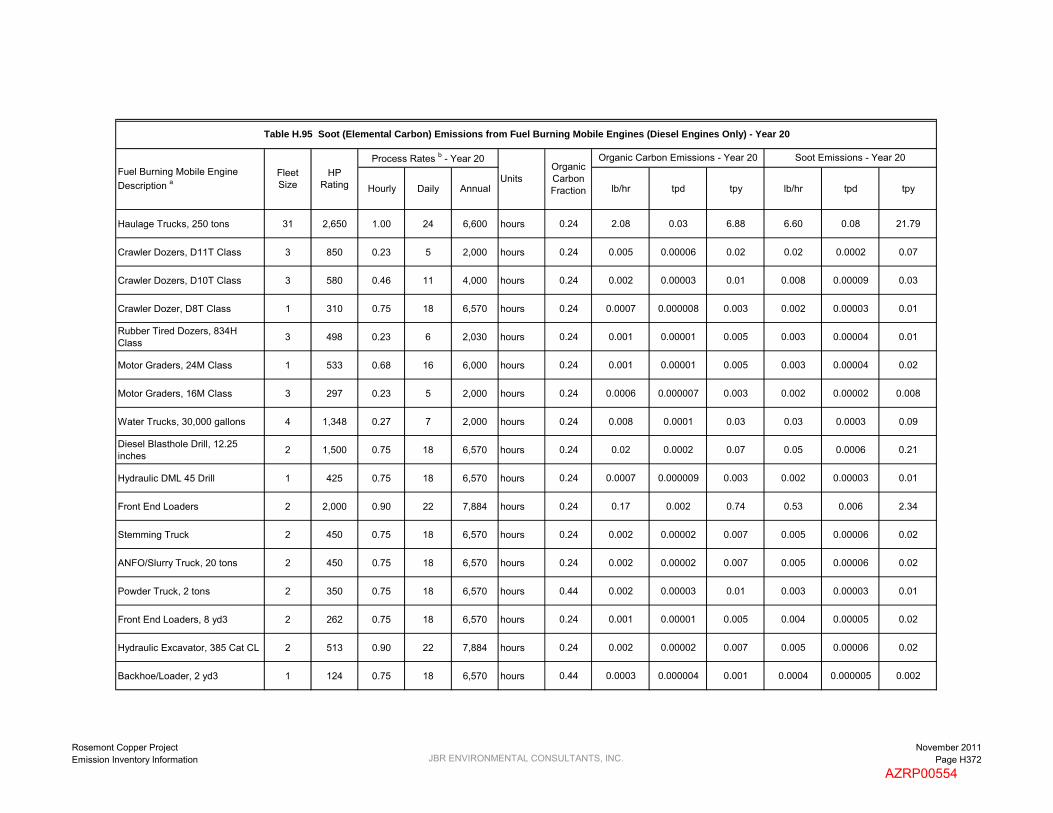
Hourly Daily Annual lb/hr tpd tpy lb/hr tpd tpy
Haulage Trucks, 250 tons 31 2,650 1.00 24 6,600 hours 0.24 2.08 0.03 6.88 6.60 0.08 21.79
Crawler Dozers, D11T Class 3 850 0.23 5 2,000 hours 0.24 0.005 0.00006 0.02 0.02 0.0002 0.07
Crawler Dozers, D10T Class 3 580 0.46 11 4,000 hours 0.24 0.002 0.00003 0.01 0.008 0.00009 0.03
Crawler Dozer, D8T Class 1 310 0.75 18 6,570 hours 0.24 0.0007 0.000008 0.003 0.002 0.00003 0.01
Rubber Tired Dozers, 834H Class 3 498 0.23 6 2,030 hours 0.24 0.001 0.00001 0.005 0.003 0.00004 0.01
Motor Graders, 24M Class 1 533 0.68 16 6,000 hours 0.24 0.001 0.00001 0.005 0.003 0.00004 0.02
Motor Graders, 16M Class 3 297 0.23 5 2,000 hours 0.24 0.0006 0.000007 0.003 0.002 0.00002 0.008
Water Trucks, 30,000 gallons 4 1,348 0.27 7 2,000 hours 0.24 0.008 0.0001 0.03 0.03 0.0003 0.09
Diesel Blasthole Drill, 12.25 inches 2 1,500 0.75 18 6,570 hours 0.24 0.02 0.0002 0.07 0.05 0.0006 0.21
Hydraulic DML 45 Drill 1 425 0.75 18 6,570 hours 0.24 0.0007 0.000009 0.003 0.002 0.00003 0.01
Front End Loaders 2 2,000 0.90 22 7,884 hours 0.24 0.17 0.002 0.74 0.53 0.006 2.34
Stemming Truck 2 450 0.75 18 6,570 hours 0.24 0.002 0.00002 0.007 0.005 0.00006 0.02
ANFO/Slurry Truck, 20 tons 2 450 0.75 18 6,570 hours 0.24 0.002 0.00002 0.007 0.005 0.00006 0.02
Powder Truck, 2 tons 2 350 0.75 18 6,570 hours 0.44 0.002 0.00003 0.01 0.003 0.00003 0.01
Front End Loaders, 8 yd3 2 262 0.75 18 6,570 hours 0.24 0.001 0.00001 0.005 0.004 0.00005 0.02
Hydraulic Excavator, 385 Cat CL 2 513 0.90 22 7,884 hours 0.24 0.002 0.00002 0.007 0.005 0.00006 0.02
Backhoe/Loader, 2 yd3 1 124 0.75 18 6,570 hours 0.44 0.0003 0.000004 0.001 0.0004 0.000005 0.002
Soot Emissions - Year 20
Table H.95 Soot (Elemental Carbon) Emissions from Fuel Burning Mobile Engines (Diesel Engines Only) - Year 20
Organic Carbon Emissions - Year 20Fuel Burning Mobile Engine Description a
Fleet Size
HP Rating
Process Rates b - Year 20
UnitsOrganic Carbon Fraction
Rosemont Copper ProjectEmission Inventory Information JBR ENVIRONMENTAL CONSULTANTS, INC.
November 2011Page H372
AZRP00554

Hourly Daily Annual lb/hr tpd tpy lb/hr tpd tpy
Soot Emissions - Year 20
Table H.95 Soot (Elemental Carbon) Emissions from Fuel Burning Mobile Engines (Diesel Engines Only) - Year 20
Organic Carbon Emissions - Year 20Fuel Burning Mobile Engine Description a
Fleet Size
HP Rating
Process Rates b - Year 20
UnitsOrganic Carbon Fraction
All-Terrain Crane, 75 tons 1 230 0.75 18 6,570 hours 0.24 0.0004 0.000005 0.002 0.001 0.00001 0.005
Transporter with Tractor, 200 tons 1 1,350 0.75 18 6,570 hours 0.24 0.009 0.0001 0.04 0.03 0.0004 0.13
Fuel/Lube Trucks, 6,000 gallons 2 703 0.75 18 6,570 hours 0.24 0.002 0.00002 0.008 0.006 0.00007 0.03
Mechanic Field Service Trucks 5 370 0.75 18 6,570 hours 0.44 0.002 0.00002 0.008 0.002 0.00003 0.01
Tire Handler 1 90 0.75 18 6,570 hours 0.51 0.00002 0.0000003 0.0001 0.00002 0.0000003 0.0001
Shop Forklift, 12,000 lbs 1 90 0.75 18 6,570 hours 0.51 0.0004 0.000005 0.002 0.0004 0.000005 0.002
Integrated Tool Carrier, 140 hp 1 138 0.75 18 6,570 hours 0.44 0.0006 0.000007 0.003 0.0007 0.000009 0.003
Light Plant, 6 kW 15 35 0.40 10 3,504 hours 0.5 0.002 0.00002 0.009 0.002 0.00002 0.009
Primary Crushing Mobile Crane - 400 tons 1 320 0.75 18 6,570 hours 0.24 0.0005 0.000007 0.002 0.002 0.00002 0.008
Copper Concentrate Area Front End Loader - Cat 930 1 160 0.75 18 6,570 hours 0.44 0.0007 0.000008 0.003 0.0009 0.00001 0.004
Molybdenum Packaging Forklift, 7,000 lbs 1 93 0.75 18 6,570 hours 0.51 0.0005 0.000005 0.002 0.0004 0.000005 0.002
Copper Cathode Forklift 1 93 0.75 18 6,570 hours 0.44 0.0004 0.000005 0.002 0.0005 0.000006 0.002
Boom Trucks 10 tons, 45 foot boom 1 200 0.75 18 6,570 hours 0.44 0.0003 0.000004 0.001 0.0004 0.000005 0.002
Boom Trucks 15 tons, 60 foot boom 1 210 0.75 18 6,570 hours 0.44 0.0003 0.000004 0.001 0.0004 0.000005 0.002
Front End Loader, 6 yd3 1 349 0.75 18 6,570 hours 0.24 0.0005 0.000006 0.002 0.002 0.00002 0.007
Front End Loader, 5 yd3 1 149 0.75 18 6,570 hours 0.44 0.0003 0.000003 0.001 0.0003 0.000004 0.001
Bob Cats, 2,400 lbs 2 82 0.75 18 6,570 hours 0.5 0.0008 0.00001 0.003 0.0008 0.00001 0.003
Rosemont Copper ProjectEmission Inventory Information JBR ENVIRONMENTAL CONSULTANTS, INC.
November 2011Page H373
AZRP00555
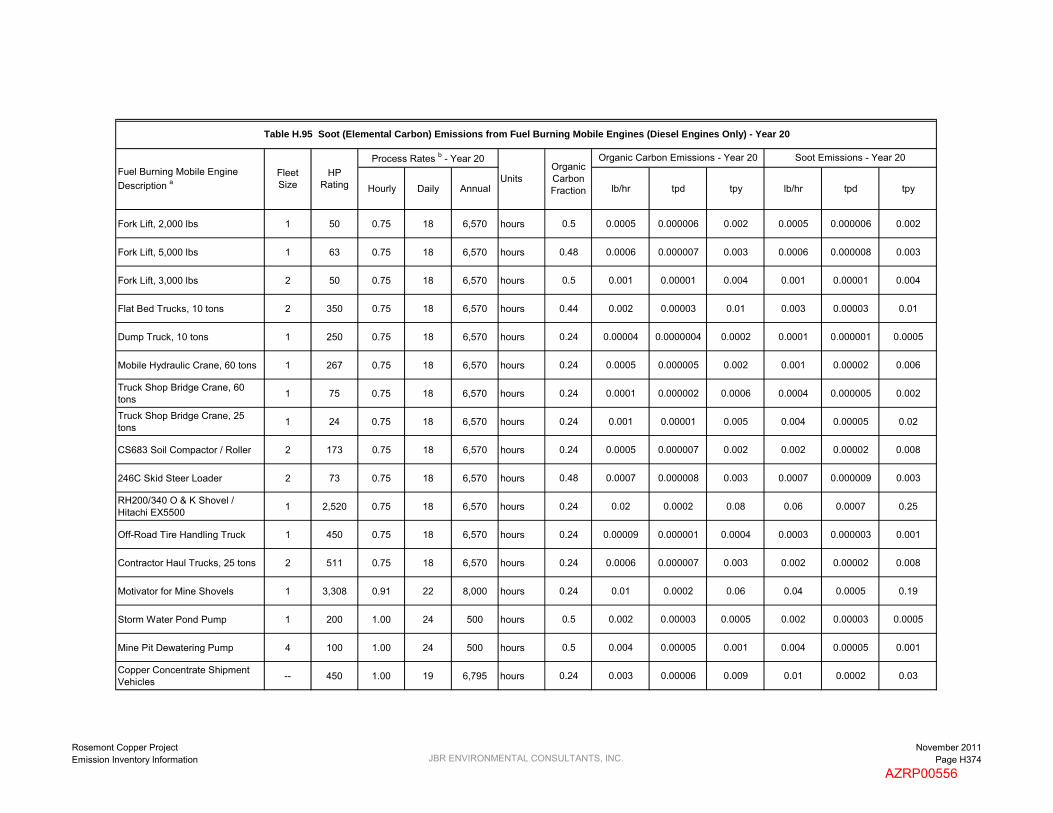
Hourly Daily Annual lb/hr tpd tpy lb/hr tpd tpy
Soot Emissions - Year 20
Table H.95 Soot (Elemental Carbon) Emissions from Fuel Burning Mobile Engines (Diesel Engines Only) - Year 20
Organic Carbon Emissions - Year 20Fuel Burning Mobile Engine Description a
Fleet Size
HP Rating
Process Rates b - Year 20
UnitsOrganic Carbon Fraction
Fork Lift, 2,000 lbs 1 50 0.75 18 6,570 hours 0.5 0.0005 0.000006 0.002 0.0005 0.000006 0.002
Fork Lift, 5,000 lbs 1 63 0.75 18 6,570 hours 0.48 0.0006 0.000007 0.003 0.0006 0.000008 0.003
Fork Lift, 3,000 lbs 2 50 0.75 18 6,570 hours 0.5 0.001 0.00001 0.004 0.001 0.00001 0.004
Flat Bed Trucks, 10 tons 2 350 0.75 18 6,570 hours 0.44 0.002 0.00003 0.01 0.003 0.00003 0.01
Dump Truck, 10 tons 1 250 0.75 18 6,570 hours 0.24 0.00004 0.0000004 0.0002 0.0001 0.000001 0.0005
Mobile Hydraulic Crane, 60 tons 1 267 0.75 18 6,570 hours 0.24 0.0005 0.000005 0.002 0.001 0.00002 0.006
Truck Shop Bridge Crane, 60 tons 1 75 0.75 18 6,570 hours 0.24 0.0001 0.000002 0.0006 0.0004 0.000005 0.002
Truck Shop Bridge Crane, 25 tons 1 24 0.75 18 6,570 hours 0.24 0.001 0.00001 0.005 0.004 0.00005 0.02
CS683 Soil Compactor / Roller 2 173 0.75 18 6,570 hours 0.24 0.0005 0.000007 0.002 0.002 0.00002 0.008
246C Skid Steer Loader 2 73 0.75 18 6,570 hours 0.48 0.0007 0.000008 0.003 0.0007 0.000009 0.003
RH200/340 O & K Shovel / Hitachi EX5500 1 2,520 0.75 18 6,570 hours 0.24 0.02 0.0002 0.08 0.06 0.0007 0.25
Off-Road Tire Handling Truck 1 450 0.75 18 6,570 hours 0.24 0.00009 0.000001 0.0004 0.0003 0.000003 0.001
Contractor Haul Trucks, 25 tons 2 511 0.75 18 6,570 hours 0.24 0.0006 0.000007 0.003 0.002 0.00002 0.008
Motivator for Mine Shovels 1 3,308 0.91 22 8,000 hours 0.24 0.01 0.0002 0.06 0.04 0.0005 0.19
Storm Water Pond Pump 1 200 1.00 24 500 hours 0.5 0.002 0.00003 0.0005 0.002 0.00003 0.0005
Mine Pit Dewatering Pump 4 100 1.00 24 500 hours 0.5 0.004 0.00005 0.001 0.004 0.00005 0.001
Copper Concentrate Shipment Vehicles -- 450 1.00 19 6,795 hours 0.24 0.003 0.00006 0.009 0.01 0.0002 0.03
Rosemont Copper ProjectEmission Inventory Information JBR ENVIRONMENTAL CONSULTANTS, INC.
November 2011Page H374
AZRP00556
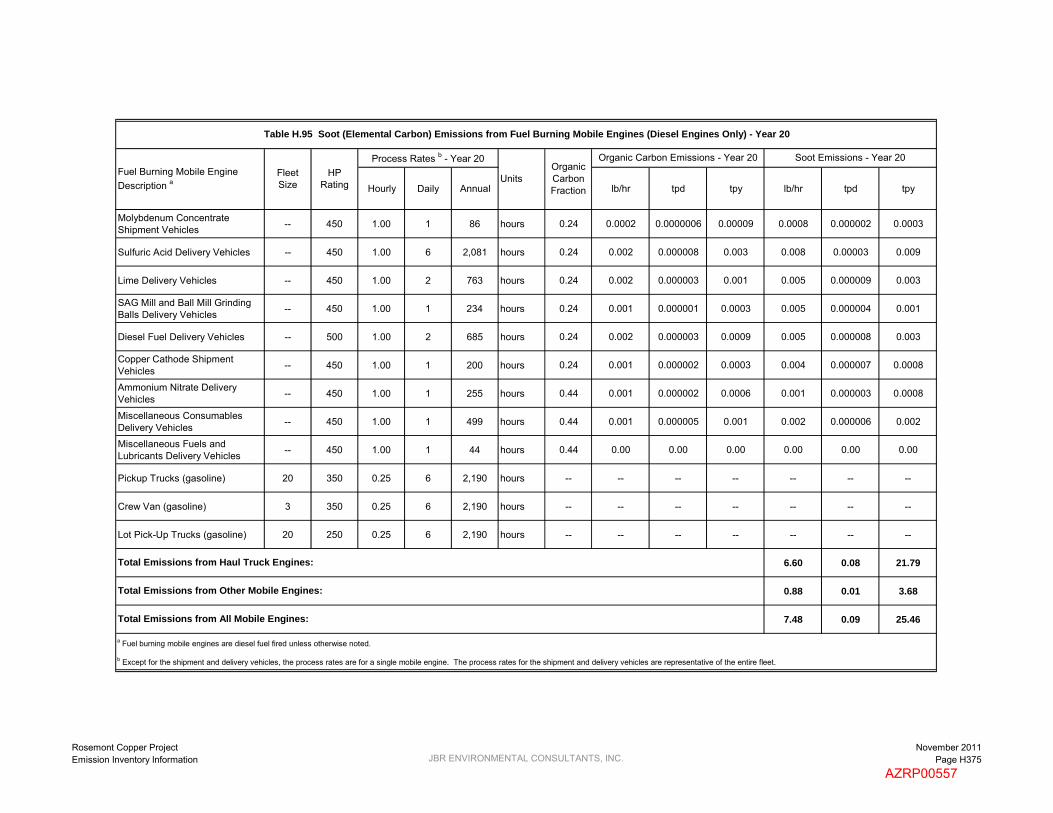
Hourly Daily Annual lb/hr tpd tpy lb/hr tpd tpy
Soot Emissions - Year 20
Table H.95 Soot (Elemental Carbon) Emissions from Fuel Burning Mobile Engines (Diesel Engines Only) - Year 20
Organic Carbon Emissions - Year 20Fuel Burning Mobile Engine Description a
Fleet Size
HP Rating
Process Rates b - Year 20
UnitsOrganic Carbon Fraction
Molybdenum Concentrate Shipment Vehicles -- 450 1.00 1 86 hours 0.24 0.0002 0.0000006 0.00009 0.0008 0.000002 0.0003
Sulfuric Acid Delivery Vehicles -- 450 1.00 6 2,081 hours 0.24 0.002 0.000008 0.003 0.008 0.00003 0.009
Lime Delivery Vehicles -- 450 1.00 2 763 hours 0.24 0.002 0.000003 0.001 0.005 0.000009 0.003
SAG Mill and Ball Mill Grinding Balls Delivery Vehicles -- 450 1.00 1 234 hours 0.24 0.001 0.000001 0.0003 0.005 0.000004 0.001
Diesel Fuel Delivery Vehicles -- 500 1.00 2 685 hours 0.24 0.002 0.000003 0.0009 0.005 0.000008 0.003
Copper Cathode Shipment Vehicles -- 450 1.00 1 200 hours 0.24 0.001 0.000002 0.0003 0.004 0.000007 0.0008
Ammonium Nitrate Delivery Vehicles -- 450 1.00 1 255 hours 0.44 0.001 0.000002 0.0006 0.001 0.000003 0.0008
Miscellaneous Consumables Delivery Vehicles -- 450 1.00 1 499 hours 0.44 0.001 0.000005 0.001 0.002 0.000006 0.002
Miscellaneous Fuels and Lubricants Delivery Vehicles -- 450 1.00 1 44 hours 0.44 0.00 0.00 0.00 0.00 0.00 0.00
Pickup Trucks (gasoline) 20 350 0.25 6 2,190 hours -- -- -- -- -- -- --
Crew Van (gasoline) 3 350 0.25 6 2,190 hours -- -- -- -- -- -- --
Lot Pick-Up Trucks (gasoline) 20 250 0.25 6 2,190 hours -- -- -- -- -- -- --
6.60 0.08 21.79
0.88 0.01 3.68
7.48 0.09 25.46
a Fuel burning mobile engines are diesel fuel fired unless otherwise noted.
b Except for the shipment and delivery vehicles, the process rates are for a single mobile engine. The process rates for the shipment and delivery vehicles are representative of the entire fleet.
Total Emissions from Haul Truck Engines:
Total Emissions from Other Mobile Engines:
Total Emissions from All Mobile Engines:
Rosemont Copper ProjectEmission Inventory Information JBR ENVIRONMENTAL CONSULTANTS, INC.
November 2011Page H375
AZRP00557