Embed Size (px)
Citation preview
Jurnal Ekonomi Malaysia 48(2) 2014 83 - 97
Fuel Subsidy Rationalisation: The Perils of the Middle Class in Malaysia
(Rasionalisasi Subsidi Bahan Api: Kesannya keatas Kelas Pertengahan di Malaysia)
Roslan Abdul-Hakim
n.".T;illilTili'i,"uUniversiti Utara Malavsia
ABSTMCT
The middle-class is reportedto experience the "middle-class squeeze", where they arefacing a decliningrelative incomeand simultaneously rising costs of living particularly with regards to housing, educqtion and health care. Besides,the middle-class is also reported to face "the middle-class trap", where on the one hand, they are regarded ai "toorich" to qualifi for any government support, but on the other hand, they found themselves in realily "not too rich"to sustain their lives withoutfacing hardships. These observations unfortunately seem to be equally true in Malaysia,which raises the need to scrutinise the likely impact of government policy on the middle-class. Iilith the recent fuelsubsidy rationqlisation in Malaysia, this paper attempts to analyse the likely welfore impact of this policy towards themiddle-class in the Malaysian society. Examining this issue is crucial and desirable since the problems faced by themiddle-class tend to be overlooked by the policy makers. In our analysis, we use various definitions of "middle-class"as suggested in the literature, and examine the direct, indirect qnd the total welfare effects of fuel subsidy removalon them using data from the Household Expenditure Survey (HES) 2004/2005 as well as the Input-Output Table for2004/2005. Ourfindings reveal that, in line with the common perception, the benefts offuel subsidy accrued mostly tothe rich. Ironically, the costs of subsidy removal are borne mostly by the middle-class in terms of the direct effect. Yetin terms of the indirect welfare effect, the costs of subsidy removal are borne equally by the middle-class as well as thelower and the upper class. Since the indirect welfure effect outweighs the direct welfare effect, we conclude that whilethe rich get most of the benefitsfromfuel subsidy, its removal hurts the middle-class the most. Ourfnding implies that
fuel subsidy rationalisation must befollowed by a practical strateglt and program to lessen the negative impact offuelsubsidy removal not only for the poori but also for the middle-clqss as well.
Kelwords: Fuel subsidy; welfure ffict; mtddle-class; Malaysia
ABSTMK
Isu berlcaitan kelas pertengahan telah dibangkitkan dalam media massa dan juga dalam penulisan akademik. Golongankelas pertengahan ini dilaporkan mengalami "pemerahan kelas pertengahan", iaitu mereka menghadapi pendapatanrelatif yang menurun dan pada masa yang sama mereka juga menghadapi peningkatan kos sara hidup teriltamanyakos perumahan, pendidikan dan kesihatan. Selain itu, kelas pertengahanjuga dilaporkan menghadapi "perangkapkelas pertenghan", iaitu dari satu segi mereka dianggap sebagai "terlalu kaya" untuk melayakkan mereka mendapatbantuan dari kerajaan, tetapi dari segi yang lain mereka pada hakikatnya mendapati diri mereka "tidak terlalu kaya"untuk mengekalkan kehidupan mereka tanpa menghadapi sebarang kesukaran. Pemerhatian inijuga dilihat berlaku diMalaysia, dan ini menimbulkan keperluan untuk meneliti kesan dasar kerajaan pada keatas kebajikan kelas pertengahanini. Kajian ini meneliti kesan kebajikan akibat dasar rasionalisasi subsidi bahan api di Malaysia terhadap kelaspertengahan dalam masyarakat Malaysia. Penelitian keatas isu ini adalah penting dan wajar kerana masalah yangdihadapi oleh kelas pertengahan agak terabai oleh pembuat dasar. Dalqm kajian ini, dengan menggunakan pelbagaidefinisi "kelas pertengahan" yang dicadangkan dalam kajian lepas, kesan langsung, kesan tidak langsung dan kesankeseluruhan penghapusan subsidi bahan api keatas kebajikan kelas pertengahan dianalisis dengan menggunakan datadaripada Penyiasatan Perbelanjaan Isi Rumah (HES) 2004/2005 serta Jadual Input-Output 2004/2005. Hasil kajianmenunjukkan bahawa, selaras dengan tanggapsn umum, manfaat daripada subsidi bahan api sebahagian besarnyadinilonati oleh golongan kaya. Ironinya, kesan langsungpenghapusan subsidi tersebut ditanggungsebahagian besarnyaoleh kelas pertengahan. Namun, dari segi kesan tidak langsung penghapusan subsidi, ianya ditanggung secara samarata oleh kelas pertengahan, kelas bawahan dan kelas atasan. Oleh kerana kesan kebajikan tidak langsung didapatilebih besar daripada kesan kebajikan.langsung, kajicut itri membuat kesimpulan bahawa walaupun golongan kayantendapat sebahagian besar manfaat daripada subsidi bahon api, namun dari segi kesan penghapusan subsidi bahanapi ianlta lebih dirasai oleh kelas pertengahan. Penenunn ini ntenuniukkan bahatra rasionalisctsi subsicli bahan opi
84 Jurnal Ekonomi Malaysiu 48(2)
mesti diikuti oleh satu strotegi dan program yang praktikal untuk.mengurangkan kescut negatifnya bukan sahaja untukgolongan miskin, tetapi juga untuk kelas per.tengahan.
Kata kunci: Subsidi bahan api; kesan kebajikan; kelas pertengahan; Malaysia
INTRODUCTION
The issues with regards to the middle-class have beenhighlighted in the mass media as well as in the academicliterature. In the western countries, such as the usn,Canada and Europe, it has been reported that not onlythere is a "disappearing middle-class" phenomenon(Levy and Murnane 1992; Jenkins 1995; Wolfson1994,1997), but the middle-class are also facing severesocio-economic problems which is termed as "themiddle-class trap". The middle-class, who is generally"neither rich nor poor", finds it difficult to sustain theirlives. While the poor qualify to receive various benefitsfrom government's welfare programs, the middle-classon the other hand is considered "too rich" to qualify forany support. For instance, while the poor may receivesubsidies to purchase a house, the middle-class are notentitled to similar benefit. The same situation could besaid with regards to education and health services. Whilethe poor are subsidised by the government for theseservices, and the rich could easily afford themselves toget quality education and health services, the middle-class on the other hand find themselves struggling hard.Worse still, the continuous rise in property prices, aswell as the rising costs of education and health servicesfurther erode their abilities to purchase decent homesand to get access to good quality services. Consequently,to sustain their lives, the middle-class finds that theyend up working their entire lives to serve their financialcommitments. Apparently, the middle class is pressuredfrom various forces to run faster just to stay at thesame place. It is therefore not surprising to find thatthe middle-class is more vulnerable to severe financialdistress. The growing cases ofbankruptcies among thisincome group indicate the severity of the situation. Themiddle-class therefore could gradually fall into "the newpoor". Unfortunately, these observations appear to beequally true in Malaysia.
In the context of the above observations, it might beinteresting to examine the likely impact of the Malaysiangovernment policy related to subsidy rationalisationon the middle-class in Malaysia. In Malaysia, subsidybears a long history as a policy instrument to eradicatepoverty. During the New Economic Policy (Nee), subsidyor free social service of basic amenities such as housing,electricity, water, health and education have been widelyused as an instrument to uplift the standard of living ofthe poor. Apparently, despite huge costs involved, it isundeniably true that subsidies proved to be a strong toolin helping the poor to get out of poverty. However, asMalaysia moves through various developrnental stages,
the changes in political and economic landscapes atboth national and international level require a dynamictransformation in policy implementation. In the NewEconomic Model (Nerra), which is specified in the TenthMalaysia Plan (2011-2015), the government is planningnot only to rationalise fuel subsidy, but also various othersubsidies and price controls (Malaysia 2010: 76-77).Basically, the aim is to remove market distortions in theeconomy, and thus consumption and investment decisionswill be made based on true price signals. Consequently,this will help improve economic efficiency and promoteeconomic growth and contribute towards realising thegoal of the NEM to become a high income nation. InMalaysia, among the different types of subsidies, subsidyon fuel has gained much attention since its allocationconstitutes a huge portion of the government annualbudget and perhaps unsustainable.In2009 for example,out of Rv74 billion expenditures on total subsidies, thesubsidy on fuel constitutes RM23.5 billion (rrunNou). Itappears that the government is facing with budget deficitand fiscal management difficulties, and the governmentis trying to find ways and means to overcome thoseproblems. Since fuel subsidy allocation constitutes one ofthe largest portions of the government total annual budgeton subsidies, reducing fuel subsidy seems appealingand practical. Besides, fuel subsidy is considered as notcost effective because it creates a substantial leakage ofbenefits to the non-poor. Accordingly, the government isphasing out fuel subsidy starting from 2004.
In this paper, we try to examine the likely impact offuel subsidy removal on household welfare, particularlyto the middle-class. Our particular interest on the middle-class arises from the fact that this group ofsociety is thegroup which is likely to face socio-economic problems,i.e. "the middle-class trap" and that government policiesin general tend to overlook their problems. The imperativeof examining this issue lies with the fact that a strongmiddle-class has been argued as essential for a vibrantdemocracy and a healthy economy.
LITERATURE REVIEW
As in the case ofsubsidies for other goods and services,many believe that fuel subsidies could benefit thesocieties as well, particularly the poor, since lowerprice of fuel will increase the welfare of the society.The lower price of fuel will also stimulate growth anddevelopment, and hence contribute to the increase inincome of the nation. Unfortunately, there is a gapbetween theory and practice, where in practice it reveals
Fuel Subsidy Rationalisation: The Perils of the Middle Class in Malaltsia
quite a different story, painting rather a gloomy picture.Recent evidence demonstrates how fuel subsidies mayturn out to be the contemporary plague of modernsociety as they harm the natural environment, benefitprimarily those groups in society that do not needsupport and might lead to fiscal crisis. ln addition, fuelsubsidies have failed the test of equity and economicefficiency. Besides, there is also evidence that, subsidies,particularly fuel subsidies, are costly when comparedto other alternative policies (Granado, Coady andGill ingham,20l0)1. This raises a question on the needfor fuel subsidy reform. Fuel subsidy reform on the otherhand, while desirable, raises the question on its likelyeffects on the welfare of society.
There are many studies investigating the likelyimpact of fuel subsidy reform on the welfare of society.For instance, a cross-country studies by Coady etal. (2006) shows that a 50o/o average increase in fuelprices results on average in a 4.6 per cent decrease inreal incomes. Besides, it also has an impact on poverty.Sugema et al. (2005), for example, in their study on thepoverty impact of fuel price adjustment in Indonesiafound that an increase in petroleum price by 29Yo willincrease poverty rate by 1.95 per cent. Besides, there arealso studies that examine the distributive effects of fuelsubsidy. For instance, Coady et al. (2010) discoveredthat over 80% ofthe total benefits on gasoline subsidiesgo to the richest 40% of households. For diesel andliquefied petroleum gas, respectively, over 65%o and7Do/oof benefits go to these income groups. Another studyby El-Said and Leigh (2006) on Gabon, reveals that therichest l0% ofthe individuals receive about one-thirdof the total subsidy. Meanwhile, the poorest 30% ofindividuals receive only 13% ofall the subsidies. Thus,these studies suggest that the benefits of fuel subsidyare regressively distributed. The benefit of maintaininglow fuel prices is captured mostly by the higher incomegroups, and hence, fuel subsidy becomes an inefficientinstrument for protecting the poor households andascertaining equity.
Despite numerous studies on the welfare effects ofsubsidy removal on society, the studies that focus on themiddle-class are still lacking. This is understandable sincepolicy debate normally give greater weight to the plightofthe poor and the poorest ofthe society. Given the factthat the plight of the middle-class tends to be overlookedin the policy discussions, it is therefore important thatthe implications of fuel subsidy removal on this incomegroup be rigorously analysed.
THE METHODOLOGY AND MODEL
THE DATA
ln es t imat ing the we l fa re e f fec t o f fue l subs idy
renroval on household welfare, we ernploy three sets
of data published by the Department of Statisticsand the lvlinistry of Domestic Trade, Cooperativesand Consumerism. The first data set is the data fromthe Household Expenditure Survey (ues) 2004/2005published by the Malaysian Department of Statistics.2The HES report (200412005) provides exhaustive dataon household expenditures for a sample of slightly morethan 12,000 selected households in Malaysia in 2004 and2005. Nevertheless, these detailed expenditure dataaremade available to the researchers for merely one-thirdof them (i.e. 4,227 households). The expenditure dataare divided into l2 major categories, ranging from foodand non-alcoholic beverages to miscellaneous goods andservices. In each category, the expenditures are brokendown into a number of sub-categories which, in furn, arebroken down into even smaller sub-categories. Of the l2major categories, only the fourth and seventh categoriescontain data on petroleum (fuel) expenditures. In thefourth category labelled as "Housing, Water, Electricity,Gas and Other Fuel", there are five sub-categories,of which the petroleum expenditures fall under theheading "Electricity, Gas and Fuel". In the seventhcategory labelled as "Transportation", there are threesub-categories. In the second sub-category labelled as"Managing the Private Transportation's Equipment",there are four "minor" categories, ofwhich the petroleumexpenditures fall under the heading "Fuel and Lubricantsfor Private Vehicles". For each household. the sum ofexpenditures on "Electricity, Gas and Fuel" and "Fueland Lubricants for Private Vehicles" is taken as theindividual household's fuel expenditures.r Adding theseindividual fuel expenditures across 4,227 householdsyields the (aggregate) household's fuel expenditures.aDividing the household's fuel expenditures by thehousehold's total expenditures yields the budget share ofthe aggregate petroleum product (i.e. fuel expendituresas a percentage oftotal expenditures). The second set ofdata is the Input-Output (I/O) table for 200412005.TheI/O table contains 120 sectors, ranging from paddy toother private services. Hence, the I/O coefficient matrixassociated with the VO table is of dimension 120'120(activity by activity).5
The third set of data is data with regards to fuel priceand fuel subsidy. Information on the prices of variouscategories offuel as well as the subsidy provided to eachrespective fuel category is made available by the Ministryof Domestic Trade, ConsumerAffairs and Cooperatives.In the context of Malaysia, there are three major fuel orpetroleum products consumed by households: RoN97,RoN95 and diesel. As of December 2010, RoN97 wassold at nu2.30/litre while its average market price wasnu2.96llitre;6 this means that the government provideda subsidy of 22.3oh. By the sarne token, noN95 wassold at nrul.90/litre while its average market price wasnu2.93/l itre; thus, the subsidy was 35.26Vo. Finally,diesel was sold at nn,ll.80/litre while its average marketprice was nu2.68/l itre; hence. the subsidy was 32.84o/o.
85

86
lf the government removes the (entire) subsidy for eachpetroleum product, then the price is expected to increaseby 28.69% for RoN97, 54.13% for noN95,
'and 49.08"/o
for diesel.T lfthe percentage increase in the price ofeachof these petroleum products is multiplied by its quantityshare8 and the resulting product is sum over the threepetroleum products, we obtain the percentage increase inthe aggregate price of petroleum products. With simplearithmetic, it can be easily shown that the aggregate priceofpetroleum is expected to increase by 50.14% shouldsubsidy be removed.e
MEASURING THE WELFARE IMPACT OF FUEL SUBSIDYREMOVAL
In order to measure the impact of an increase in theprice of fuel on the welfare of households, we followthe approach developed and employed by Coady andNewhouse (2005), and applied by Andriamihaja andVecchi (2007).In their empirical studies on Ghana andMadagascar, respectively, the impact of a higher fuel priceon the household welfare is divided into two: the directwelfare effect (owr) and the indirect welfare effect (we).As the name implies, DwE refers to the adverse impact ofdirectly consuming petroleum products (e.g. consuminggasoline for private transportation) by households whenthe prices of petroleum products increase, whereasIWE refers to the adverse impact of consuming othergoods and services (i.e. non-petroleum products) byhouseholds when their prices increase in response to arise in petroleum prices.
Algebraically, DwE can be expressed as follows:J
(1) DWE:2.; ' ' tp;uJ - l
where wro'l is the budget share of the js peholeum product,Apld is the change in the price ofthejft peholeum product,and "/is the number of petroleurn products. By the sametoken, IwE can be expressed as follows:
s(2) IWE:l,wfttLql
J - l
where w, is the budget share of the j'h good (or service),Aq, is the change in the consumer price of the j'h good(or service), and S is the number of goods and servicesavailable in the economy. Assurning that the prices of allnon-petroleum goods (and services) in the economy areaffected by a rise in petroleum prices, then
(3) Lqi=fl p"'\
whercJ,(Lp"'t) indicates that the change in the consumerprice of j'n non-petroleurn product is a function of thechange in the aggregate producer price of petroleumproducts, Lpo".'u The change in the aggregate price ofpetroleum products, in turn, is defined as the weightedsum of the change in the pr ices of a l l petro leurrproducts:
Jurnal Ekonomi Malaysict 48(2)
(4) Lp'":EU,oo""
where d, is the quantity share of the j 'h petroleumproduct. The term "quantity share of a fuel product"is not to be confused with the term "budget share of afuel product". While the former refers to the ratio ofthe quantity ofa particular fuel product to the quantityofall fuel products, the latter refers to the ratio oftheexpenditures on fuel to the expenditures on all goodsand services by households.
Substituting Eqs.(3) and (4) into Eq.(2), we obtain
1s) rwr : L wfi(Ln"'\ : fr .,r!rk a,Mf')Adding Eqs.(l) and (5) yields the total welfare effect(TWE) of a higher fuelprice:
r ! l ! . \(6) rwt :Z,;" tp;" * Er,fJ,,Z d,oo;")DWE IWE
Ofthe two, measuring owr is arelatively straightforwardtask. Basically, it involves three steps. First, we identifythe petroleum products directly consumed by householdsthat are subject to price increases. Second, we identifythe budget share ofeach petroleum product consumedby households before the price increase. Third, weidentif the price increases for each petroleum product.Once all of these steps have been performed, DwE canbe calculated by multiplying the budget share of eachpetroleum product by the percentage increase in theprice of each petroleum product and summing it over allpetroleum products. I I
Unlike DwE, calculating IwE is quite a dauntingtask due to the difnculty involved in mapping betweenproducer prices and consumer prices. Obviously, suchmapping must take into consideration the productionstructures of various sectors of the economy. In orderto circumvent this problem, we employ the price-shifting model developed and employed by Coadyand Newhouse (2005) and followed by Andriamihajaand Vecchi (2007).12 ln this model, the productiontechnology of the economy is assumed to be fullydescribed by the input-output (l/O) matrix, whichdepicts the use of sectoral inputs in the production ofsectoral outputs. ln the case of Malaysia, the I/O tablefor 200412005 contains I 20 sectors, ranging from paddyto other private services. Hence, the l/O coefficientmatrix associated with the I/O table is of dimension120'120 (activity by activity).
MEASURING THE "MIDDLE.CLASS''
Who is the middle-class? Are they being defined orcategorised for instance in terms of their material wealthpossession (e.g. incorne or consumption, employment),or by their held values (e.g. style of living or politicalviews)? Which of these factors is rnore appropriate todefine the rnicldle-class? It seeurs that it depends on who
Fuel Subsidy Rationaliscttiott: The Perils of the Middle Clctss in Malaysia
and which perspectives one is looking at it - economic,sociological or polit ical perspectives. As it is quiteproblematic to figure out clearly who the middle-class isin the society, naturally it is also quite difficult technicallyto segregate the middle-class from the rest of the society.Consequently, there is no one measure that will fullycapture the concept of middle-class.
In our analysis, the economic factor, i.e. income, istreated as the main factor in defining the middle-class.Thus, we define the middle-class as those householdswho are categorised as the middle-income group. Whiledefining middle-class in this manner might not be entirelysatisfactory nonetheless we consider this is sufficient forour purpose at hand. Nonetheless, the problem persists,how do we segregate the middle-class based on theirincome?
Fortunately, there are alreadyvarious ways suggestedin the literature to categorise the middle-class based ontheir income. First. we could divide the total householdinto quintiles. We then simply assume that the middleincome group contains those whose income falls betweenthe second, third and fourth quintile, i.e. upper middle-class, middle middle-class and lower middle-class.Defining middle-class in this way implies that 60% of thesociety is considered as the middle-class. For instance,Easterly (2001) defines the "middle class" as thoselying between the 20s and 80'h percentile on the incomedistribution. Another common measure in categorisingthe society based on their income is to group togetherthe second and third quintiles and regards this group asthe middle class. Thus, the households are grouped asthe following: top 20o/o, middle 40Yo and bottom 40%.Meanwhile, Birdsall, Graham and Pettinato (2000) definethe middle class as those betweenT5 and 125 percentof median per capita income. Quite similar definitionis suggested by Thurow (1984), where he defines themiddle-class by calculating the median income of thesociety and regards those households with income 25o/obelow and above of the median income as the middle-class. I 3
Yet another way of categorising the middle-classis to define the middle-class by income threshold.For instance, the Bank Negara Malaysia defines themiddle- income group as those who have incomethreshold between RM2000 (uso667) to nu4000(usol333) (Bank Negara Annual Report 2008). Inthis study, to ensure the robustness of the results, weemploy four definitions of middle-class in our analysis.These are: (i) middle 60%; (ii) middle 40%; (lii) +l-25%o of median income; and, (iv) income threshold ofRM2000 - RM4000.
THE FINDINGS
This section discusses the findings of the study. Ourdiscussion is focused on exarnining the welfare irrpact of
removing fuel subsidy on the "middle-class" householdin Malaysia. We discuss the direct and indirect, as wellas the total welfare impact of fuel subsidy removal on themiddle-class household in particular, as well as on theupper and lower classes. Here, we first briefly considerincome and fuel expenditure pattern of the three socialclasses and then we discuss the welfare impact of fuelsubsidy removal on them.
DESCRIPTIVE STATISTICS ANAIYSIS
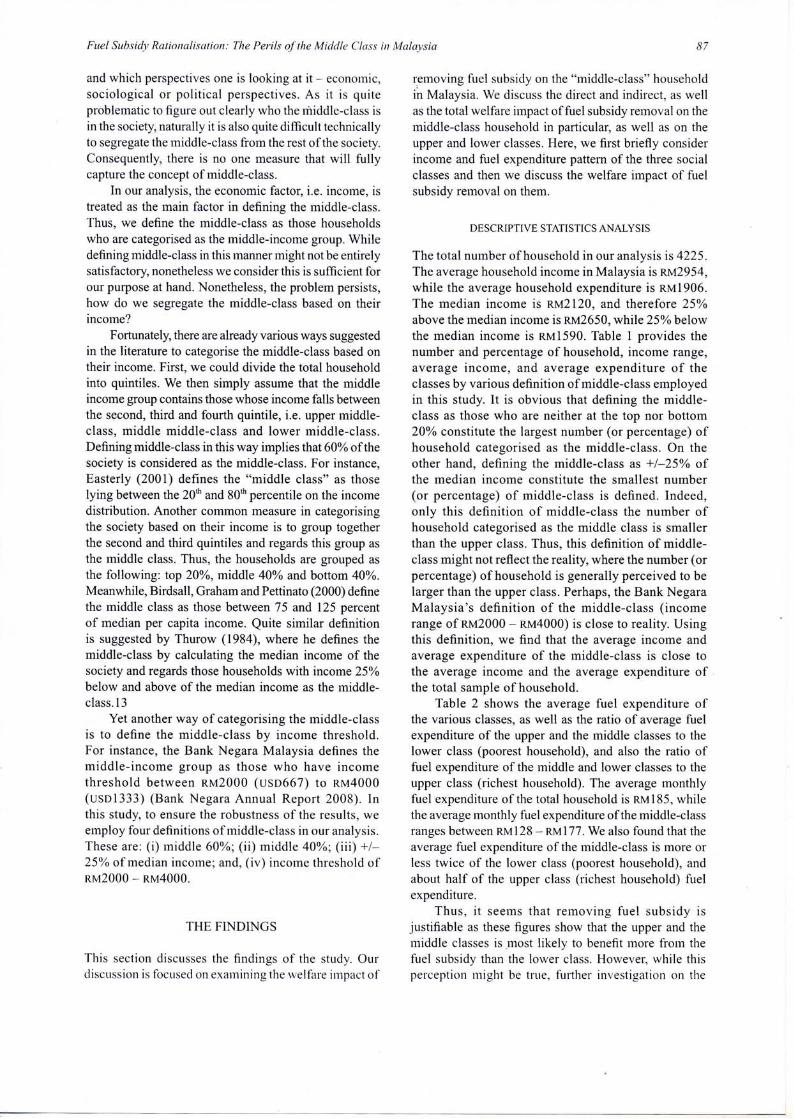
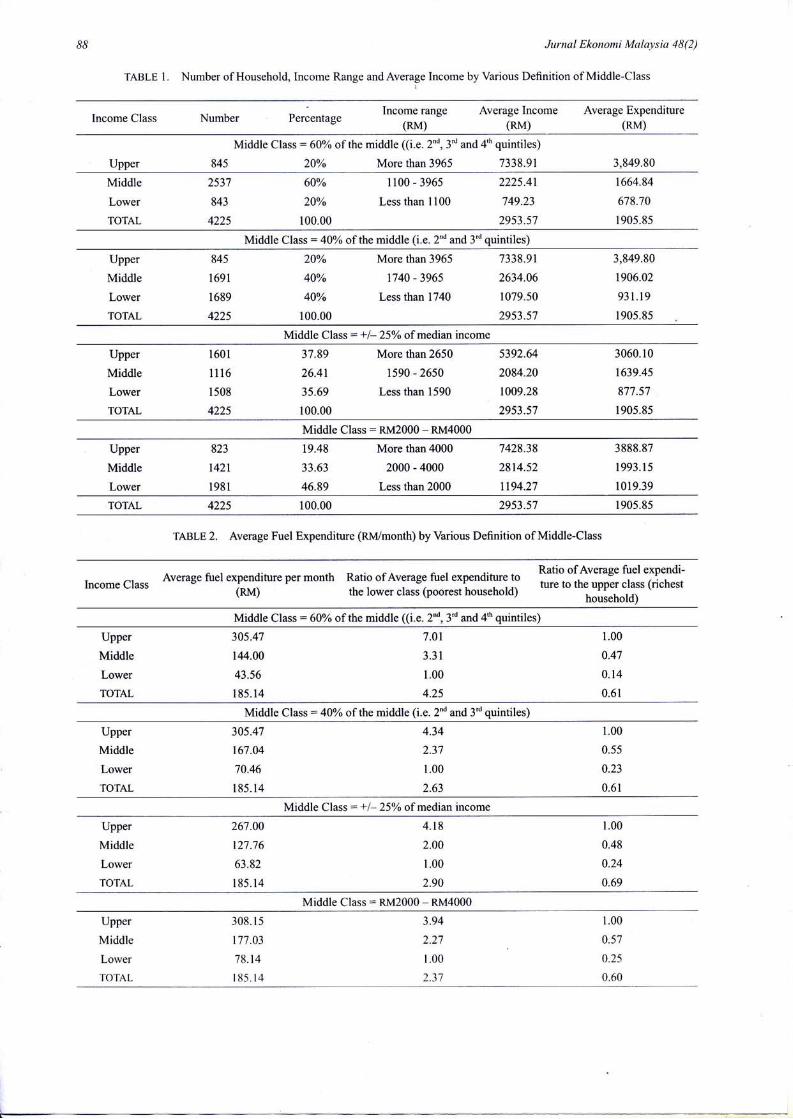
The total number of household in our analysis is 4225.The average household income in Malaysia is nu2954,while the average household expenditure is nu1906.The median income is nu2l20. and therefore 25Yoabove the median income is nu2650, while 25% belowthe median income is nu1590. Table I provides thenumber and percentage of household, income range,average income, and average expenditure of theclasses by various definition ofmiddle-class employedin this study. It is obvious that defining the middle-class as those who are neither at the top nor bottom20olo constitute the largest number (or percentage) ofhousehold categorised as the middle-class. On theother hand, defining the middle-class as +l-25%o ofthe median income constitute the smallest number(or percentage) of middle-class is defined. Indeed,only this definit ion of middle-class the number ofhousehold categorised as the middle class is smallerthan the upper class. Thus, this definition of middle-class might not reflect the reality, where the number (orpercentage) ofhousehold is generally perceived to belarger than the upper class. Perhaps, the Bank NegaraMalaysia's definit ion of the middle-class (incomerange of RM2000 - nrra4000) is close to reality. Usingthis definition, we find that the average income andaverage expenditure of the middle-class is close tothe average income and the average expenditure ofthe total sample of household.
Table 2 shows the average fuel expenditure ofthe various classes, as well as the ratio ofaverage fuelexpenditure of the upper and the middle classes to thelower class (poorest household), and also the ratio offuel expenditure of the middle and lower classes to theupper class (richest household). The average monthlyfuel expenditure of the total household is ru1185, whilethe average rnonthly fuel expenditure of the middle-classranges between RMl28 - RMl77. We also found that theaverage fuel expenditure of the middle-class is more orless twice of the lower class (poorest household), andabout half of the upper class (richest household) fuelexpenditure.
Thus, it seelns that removing fuel subsidy isjustifiable as these figures show that the upper and therniddle classes is,rnost likely to benefit more frorn thefuel subsidy than the lower class. However, while thisperception might be true, further investigatior, on the
87
88 Jurnal Ekonomi Malaysia 48(2)
TABLE I . Number of Household, Income Range and Average Income by Various Definition of Middle-Class
Income Class Number PercentageIncome range Average Income
(RM) (RM)Average Expenditure
(RM)
Upper 845
Middle Class: 60% of the middle ((i.e. 2'd, 3d and 4'h quintiles)
20% More than 3965 7338.91 3,849.80
Middle
Lower
TOTAL
2537
843
4225
60%
20%
100.00
2225.41
749.23
29s3.s7
1664.84
678.'10
1905.85
l 100 - 3965
Less than 1100
Middle Class:40% of the middle (i.e. 2'd and 3'd quintiles)
Upper
Middle
Lower
TOTAL
845
169l
1689
4225
20%
40%
40%
100.00
7338.91
2634.06
1079.50
2953.57
3,849.80
1906.02
93t.19
1905.85
More than 3965
1740 - 3965
Less than 1740
Middle Class = +l-25% of median income
Upper
Middle
Lower
TOTAL
l60 l
| 1 6
1508
4225
37.89
26.41
35.69
100.00
5392.64
2084.20
1009.28
2953.57
3060.10
1639.45
877.57
1905.85
More than 2650
1590 - 2650
Less than 1590
Middle Class = RM2000 - RM4000
Upper
Middle
Lower
823
t42l
l 98 l
19.4833.6346.89
7428.38
2814.52
1194.27
3888.87
1993.15
1019.39
More than 4000
2000 - 4000
Less than 2000
4225 100.00 2953.s7 1905.85
TABLE 2. Average Fuel Expenditure (RlvVmonth) by Various Deflnition of Middle-Class
Income ClassAverage fuel expenditure per month Ratio of Average fuel expenditure to
(RM) the lower class (poorest household)
Ratio ofAverage fuel expendi-ture to the upper class (richest
household)
Middle Class : 600/o of the middle ((i.e. 2nd, 3d and 4'h quintiles)
Upper
Middle
Lower
TOTAL
305.47
144.00
43.56
I 85 .14
7.01
3 .31
1.00
4.25
1.00
0.4'7
0.14
0.61
Middle Class = 40Yo of the middle (i.e. 2nd and 3'd quintiles)
Upper
Middle
Lower
TOTAL
305.47
167.04
70.46
I 85. 14
4.34
2.37
1.00
2.63
1.00
0.55
0.23
0.61
Middle Class = +l- 25% of median income
Upper
Middle
Lower
TOTAL
267.00
127.76
63.82
I 85 . l 4
4 . 1 8
2.00
1.00
2.90
1.00
0.48
0.24
0.69
Middle Class = RM2000 - RM4000
Upper
Middle
Lower
TOTAL
308. I 5
r77.03
78.14
I 8 5 . 1 4
3.94
2.27
t .00
2 .37
1.00
0.57
0.25
0.60
Fuel Subsidy Rationolisation: The Perils oJ the Micldle Class in Malaysia
welfare effects of fuel subsidy removal is necessarysince the welfare effects of removing fuel subsidy isquite complicated, and hence, the upper ctass might notnecessarily receive more adverse effects than the poor.
THE WELFARE EFFECTS
THE DIRECT WELFARE EFFECT (DWE)
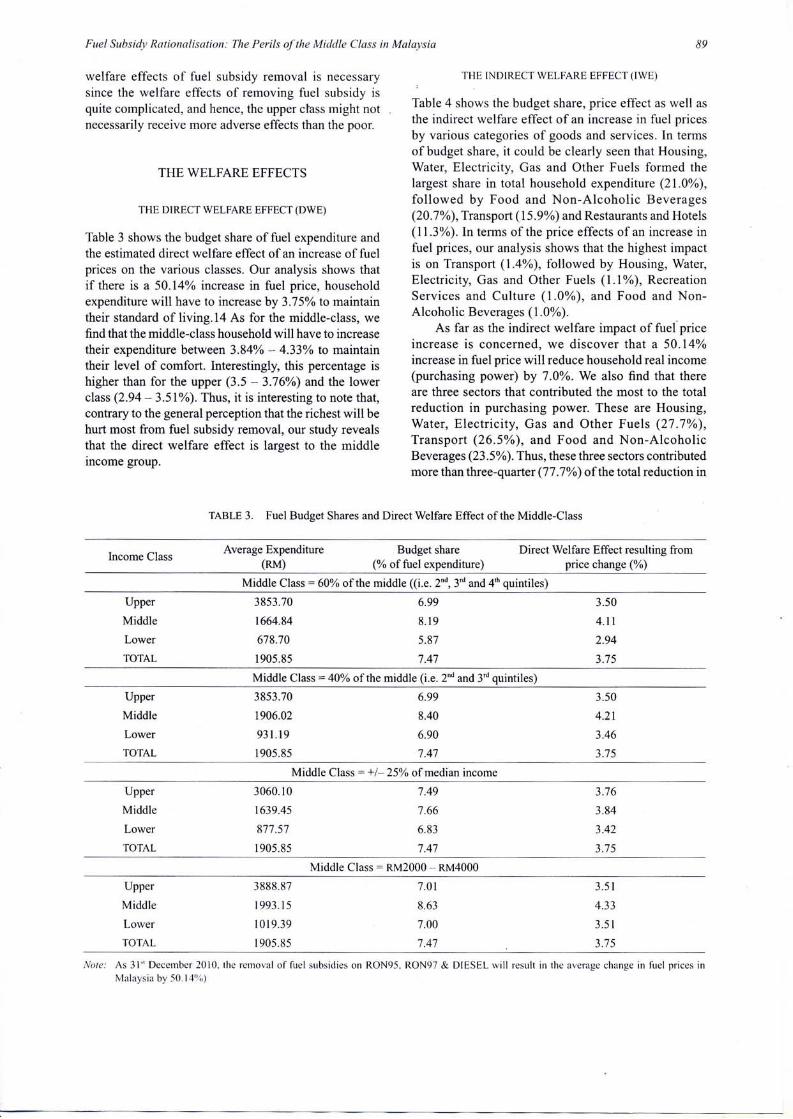
Table 3 shows the budget share offuel expenditure andthe estimated direct welfare effect of an increase of fuelprices on the various classes. Our analysis shows thatif there is a 50.14o/o increase in fuel price, householdexpenditure will have to increase by 3.75% to maintaintheir standard of living.14 As for the middle-class, wefind that the middle-class household will have to increasetheir expenditure between 3.84% - 4.33o/o to maintaintheir level of comfort. Interestingly, this percentage ishigher than for the upper (3.5 - 3.76%) and the lowerclass (2.94 - 3.51o/o). Thus, it is interesting to note that,contrary to the general perception that the richest will behurt most from fuel subsidy removal, our study revealsthat the direct welfare effect is larsest to the middleincome group.
THE INDIRECT WELFARE EFFECT (IWE)
Table 4 shows the budget share, price effect as well asthe indirect welfare effect of an increase in fuel pricesby various categories of goods and services. In termsofbudget share, it could be clearly seen that Housing,Water, Electricity, Gas and Other Fuels formed thelargest share in total household expenditwe (27.0o/o),followed by Food and Non-Alcoholic Beverages(20.7%),Transport (15.9%) and Restaurants and Hotels(11 3%). In terms of the price effects of an increase infuel prices, our analysis shows that the highest impactis on Transport (1.4%), followed by Housing, Water,Electricity, Gas and Other Fuels (l.l%), RecreationServices and Culture (1 .0%), and Food and Non-Alcoholic Beverages (1.0%).
As far as the indirect welfare impact of fuel priceincrease is concerned, we discover that a 50.14%increase in fuel price will reduce household real income(purchasing power) by 7.0%. We also find that thereare three sectors that contributed the most to the totalreduction in purchasing power. These are Housing,Water, Electricity, Gas and Other Fuels (27.7%),Transport (26.5%), and Food and Non-AlcoholicBeverages (23.5%). Thus, these three sectors contributedmore than three-quarter (77 .7%o) of thetotal reduction in
89
TABLE 3. Fuel Budget Shares and Direct Welfare Effect of the Middle-Class
lncome ClassAverage Expenditure
(P'I\'t)Budget share Direct Welfare Effect resulting from
(% offuel expenditure) price change (%o)
Middle Class = 60% of the middle ((i.e. 2nd, 3'd and 4'h quintiles)
Upper
Middle
Lower
TOTAL
3853.70
r664.84
678.70
1905.85
6.99
8. l9
5.87
7.47
3.50
4 . 1 1
2.94
3.75
Middle Class = 40%o of the middle (i.e. 2'd and 3d quintiles)
Upper
Middle
Lower
TOTAL
3853.70
1906.02
93 l . 19
1905.85
6.99
8.40
6.90
7.47
3.50
4.21
3.46
3.75
Middle Class : +l- 25% of median income
Upper
Middle
Lower
TOTAL
3060. l0
1639.45
877.57
l 905.85
7.49
7.66
6.83
7.47
3.'16
3.84
3.42
3.75
Middle Class = RM2000 - RM4000
Upper
Middle
Lower
TOTAL
3888.87
1 993.1 5
1019 .39
I 905.85
7.01
8.63
7.00
7.47
3 .51
4.33
3 .51
3 .7 5
Nore: As 3l" Decernber 2010. the removal of fuel subsidies on RON95. RON97 & DIESEL will result in the average change in fuel prices inMalaysia by 50.14"1,)
90 Jurnal Ekonomi Mala,'sut 48(2)
TABLE 4. Indirect welfare effects of removing fuel subsidies in Malaysia
Sector
Budget Shares Price Effects(%) (%)
Impact on Ex- Per cent ofTotalpenditure (%) Impact (%)
(1 x 2) /100
0 I -Food and Non-Alcoholic Beverages
02-Alcoholic Beverages and Tobacco
03-Clothing and Footwear
04-Housing, Water, Electricity, Gas andOther Fuels
O5-Fumishing, Household Equipment andRoutine Household Maintenance
06-Health
07-Transport
08-Communication
O9-Recreation Services and Culture
l0-Education
I l-Restaurants and Hotels
I 2-Miscellaneous Goods and Services
TOTAL
20.66
t .92
3.44
20.96
4.59
t .4 l
15.90
s . l 5
4.45
1.86
1 1 . 3 3
8.33
100.0
7.92
0.89
3 . 1 4
9.22
3 .3 1
| . 37
I 1.63
0.46
8.01
r .25
3.28
5.76
1.64
0.02
0 . 1 1
1 .93
0 .15
0.02
1 .85
0.02
0.36
0.02
0.37
0.48
6.97
23.48
0.24
1 .55
2',t.73
2 . 1 8
0.28
26.53
0.34
s . t2
0.33
5 .33
6.89
100.00
Note: As 31" December 2010, the removal of fuel subsidies on RON95, RON97 & DIESEL will result in the average change in fuel prices inMalaysia by 50.14%
household real income. This is not surprising at all sincethe magnitude of the indirect welfare effect basicallydepends on the size ofthe budget share as well as themagnitude of the price effects of the respective sectors.Apparently, these three sectors not only make up arelatively large share in total household expenditure,but these three sectors also suffer a relatively large priceeffects compared to the other sectors.
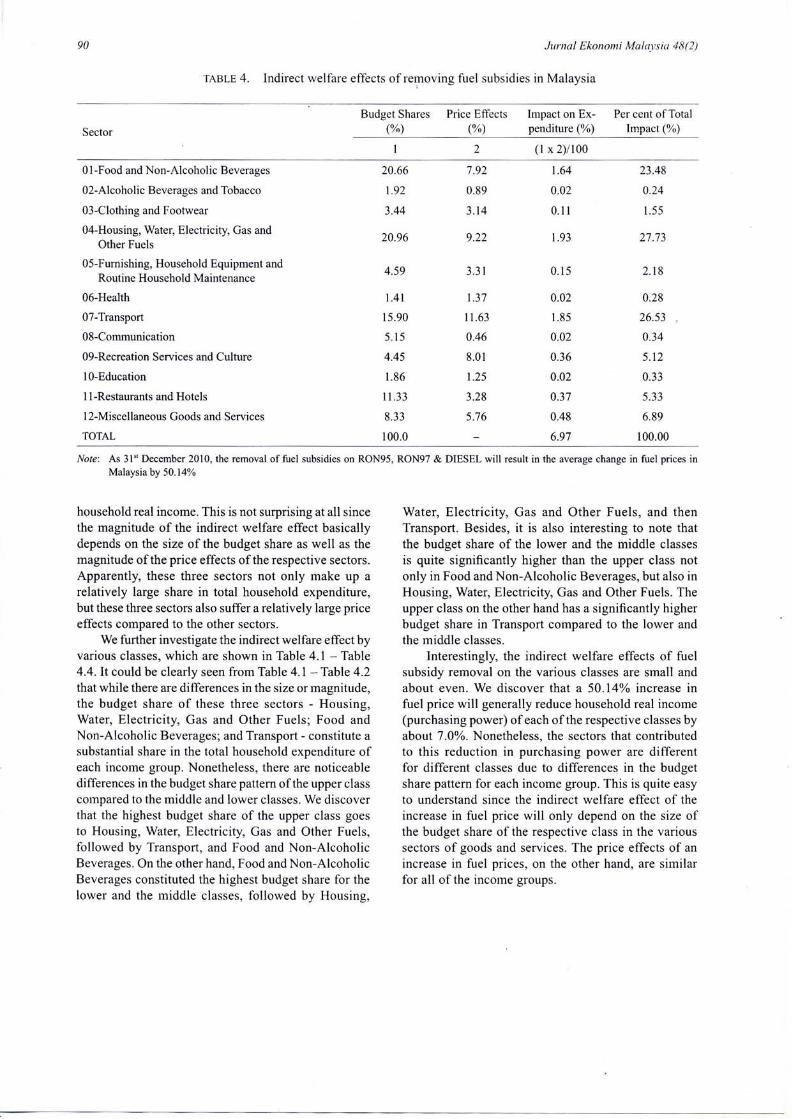
We further investigate the indirect welfare effectbyvarious classes, which are shown in Table 4.1 - Table4.4. It could be clearly seen from Table 4.1 -Table 4.2that while there are differences in the size or magnitude,the budget share of these three sectors - Housing,Water, Electricity, Gas and Other Fuels; Food andNon-Alcoholic Beverages; and Transport - constitute asubstantial share in the total household expenditure ofeach income group. Nonetheless, there are noticeabledifferences in the budget share pattern ofthe upper classcompared to the middle and lower classes. We discoverthat the highest budget share of the upper class goesto Housing, Water, Electricity, Gas and Other Fuels,followed by Transport, and Food and Non-AlcoholicBeverages. On the other hand, Food and Non-AlcoholicBeverages constituted the highest budget share for thelower and the middle classes. followed bv Housins.
Water, Electricity, Gas and Other Fuels, and thenTransport. Besides, it is also interesting to note thatthe budget share of the lower and the middle classesis quite significantly higher than the upper class notonly in Food and Non-Alcoholic Beverages, but also inHousing, Water, Electricity, Gas and Other Fuels. Theupper class on the other hand has a significantly higherbudget share in Transport compared to the lower andthe middle classes.
Interestingly, the indirect welfare effects of fuelsubsidy removal on the various classes are small andabout even. We discover that a 50.14olo increase infuel price will generally reduce household real income(purchasing power) ofeach ofthe respective classes byabout 7.0o/o. Nonetheless, the sectors that contributedto this reduction in purchasing power are differentfor different classes due to differences in the budgetshare pattern for each income group. This is quite easyto understand since the indirect welfare effect of theincrease in fuel price will only depend on the size ofthe budget share ofthe respective class in the varioussectors of goods and services. The price effects of anincrease in fuel prices, on the other hand, are sirnilarfor all of the income groups.

TABLE 4. l. Indirect Welfare Effects of Removing Fuel Subsidies by Sector andlncome Group in Malaysia (Middle Class = 60% of the middle ((i.e. 2nd, 3'd and 4'h quintiles)
\G
q
-
>J
q
\s(!
:
*FoE.bq
sqr .9! >d k
) aU !! t r- a dd - ! i 3a = xo E . ?
E ' i € \ J. o h - ad v r
EHEsEHl = = ' s = =i i t r u a = o- t r h g i I OF x ; ? € g € iF d & , r ! & z r* " b o \ d j c i bo o o F
a
E 9, ? .F=I tO E =€ Eq1 96 h
o a' =>r -_
( ) H c )= L ! : ii J E E F' J g E t r! r ' l O O
€ f B .E1 t - c g B 2
E t b D Ee p 0 6 . E E. = . = u 6 E€ q t ' = q == t E t c !- Y o t o oa \ F . - 4 Fv
r t t lo t r | \ O
t o oE 3o ( B> - of i€O E
. q 6o oo a o
c >o . 9
I ()€ x
i =X Hx iri
c.l
UPPER (Top 20% - Richest)
Budget Shares (%) (l)
Price Efl'ects (%) (2)
hnpact on Expenditure (%) (l)x(2)i 100
Percent of Total Impact (%)
15 . t 0
7.919
t . t96
17.25
1 .59
0.889
0 .014
0.20
3.093 . 1 3 50.0971.40
18.53
I 1.63
2. t55
3 l . 08
5.88
0.459
0.027
0.39
5.58
8.013
0.447
6.45
2.37
1.249
0.030
0.43
I1 .073.2790.3635.23
t9.87 5.41 r.629.221 3.3t2 r.3671.833 0.179 0.02226.43 2.58 0.32
9.90 t00.0'
5.761
0.570 6.933
8.23 100.00
MIDDLE (Middle 60%)
Budget Shares (%) ( I )Price Efl'ects (%) (2\
lmpact on Expenditure (%) ( l)x(2/100
Pcfcent of Total Impact (%)
25.5 5
7.9t91.84826.44
2 . r00.8890.0190.27
3.68
3 .135
0 . 1 1 5
t.65
14.96
I1 .63
t .740
24.90
4.87
0.459
0.022
0.32
3.88
8.013
0 .311
4.45
1 .57
t.249
0.020
0.28
I 1 . 5 73.2790.3795.43
2 l . l r 4 .12 1 .309.22t 3.312 r.367t.947 0.136 0.01827.86 1.95 0.25
7.5t 100.0
5.761
0.433 6.988
6. t9 100.00
LOWER (Bottom 20%o - Poorest)
Budget Shares (%) ( I )Price Efl'ects (%) (2)
lmpact on Expenditure (%) (l)x(2)/100
Percent of Total lmpact (%)
32.56
7.9t9
2.579
36.62
2.46
0.889
0.022
0 .31
3.68
3 .135
0 . 1 1 5
t .64
7.88
I 1.63
0.9t7
13.02
3.060.4590.0140.20
2.26
8 .013
0 . 1 8 1
2.57
l . t 4
r.249
0.014
0.20
I 1 . 0 53.2790.3625 . l 4
25.98 3.39 1.089.22t 3.3t2 r.3672.396 0.112 0.01s34.03 1.60 0.2r
5.45 100.0
5.761
0.314 7.041
4.46 100.01
Nd/e: As 3l*' December 2010, the removal of fuel subsidies on RON95, RON97 & DIESEL will result in the average change in fuel prices in Malaysia by 50.14%\o
TABLE 4.2. Indirect Welfare Effects of Removing Fuel Subsidies by Sector andIncome Group in Malaysia (Middle Class : 40% Of The Middle (.E. 2"t And 3'd Quintiles)
\oN
FJ
3F
oo . 9! >i F
oJ A
O - od t ra a4 6 6
!
o : E oF F ! ve i : a a
G v r
P g E c E dx = . : b F E( g l o
eEHegt8 6 6 € { i =F O c 4 , E t d , zt-- oo o\ o a.t
a
E 9
o ve p
- - od
E 6
a 9 ,6 F
o H o: E o 9I I o GE # 6E
E = . -E O v S
E J ! H ' z
F F g rs9 p o i . E 9. = . = 7 6- t a ' = u 1 =
I 5 ! 6 Ur t F , 7 - T
t t t lO . + h \ O
9 " o!6 !?o . l> 3g . o
, E 6o oo o o
<l i:i oc >^ O
ze0o
: ex - :tY .i/
a.l
UPPER (Top 20% - Richest)
Budget Shares (%) ( l)
Price EfTects (%) (2)
hnpact on Expenditure (%) (l)x(2)/100
Percent of Total Impact (%)
r 5 . 1 07.919r. t96l7.25
1 .59
0.889
0.014
0.20
3.09
3 . 1 3 5
0.097
1.40
18.53
11 .63
2.155
3 1 .08
5.88
0.459
0.027
0.39
5.58
8 .013
0.447
6.45
2.37
t .249
0.030
0.43
I 1.07
3.279
0.363
5.23
19.87 5.41 1.62
9.221 3.312 r.367
1.833 0.t79 0.022
26.43 2.58 0.32
9.90 100.0'
5.', l61
0.570 6.933
8.23 100.00
MIDDLE (Middle 40%)
Budget Shares (o/") (l)
Price EfTects (%) (2)
Impact on Expenditure (%) ( l)x(2)/100
Percent of Total Impact (%)
21.95
7.9r9
1 .738
24.90
2.03
0.889
0 .018
0.26
3.62
3 . 1 3 5
0 .1 14
1 .63
r 5.83
1 1.63
1 .841
26.37
5.09
0.459
0.023
0.33
4 . 1 7
8 .013
0.334
4.79
1.70
1.249
0.021
0.30
tl.67
3.279
0.383
5.48
20.75 4.24 1.36
9.22t 3.312 1.367
1.914 0.140 0.019
27.41 2.01 0.27
7 .59 100.0
5.761
0.437 6.982
6.27 100.00
LOWER (Bottom 40%o - Poorest)
Budget Shares (%) ( l)
Price Eflects (%) (2)
hnpact on Expenditure (%) (l)x(2)/100
Percent of Total Impact (%)
29.52
7.919
2.338
3 3 . 3 1
2.37
0.889
0.021
0.30
3.80
3. r350 .1 19
1.70
10.61
I1 .63
1.234
17.58
3.77
0.459
0.017
0.25
2.69
8 .013
0 .215
3.07
1 . 1 4
r.249
0 .014
0.20
1 1 . 1 8
3.279
0.367
5.22
23.63 3.60 l.r0
9.221 3.312 t.367
2. t79 0.119 0.015
31.04 1.70 0.21
6.60 100.0
5.761
0.380 7.018
5.42 100.00
\
F.
s
aAo/d: As 31"' December 2010, the removal of tuel subsidies on RON95, RON97 & DIESEL will result in the average change in fuel prices in Malaysia by 50.l4%
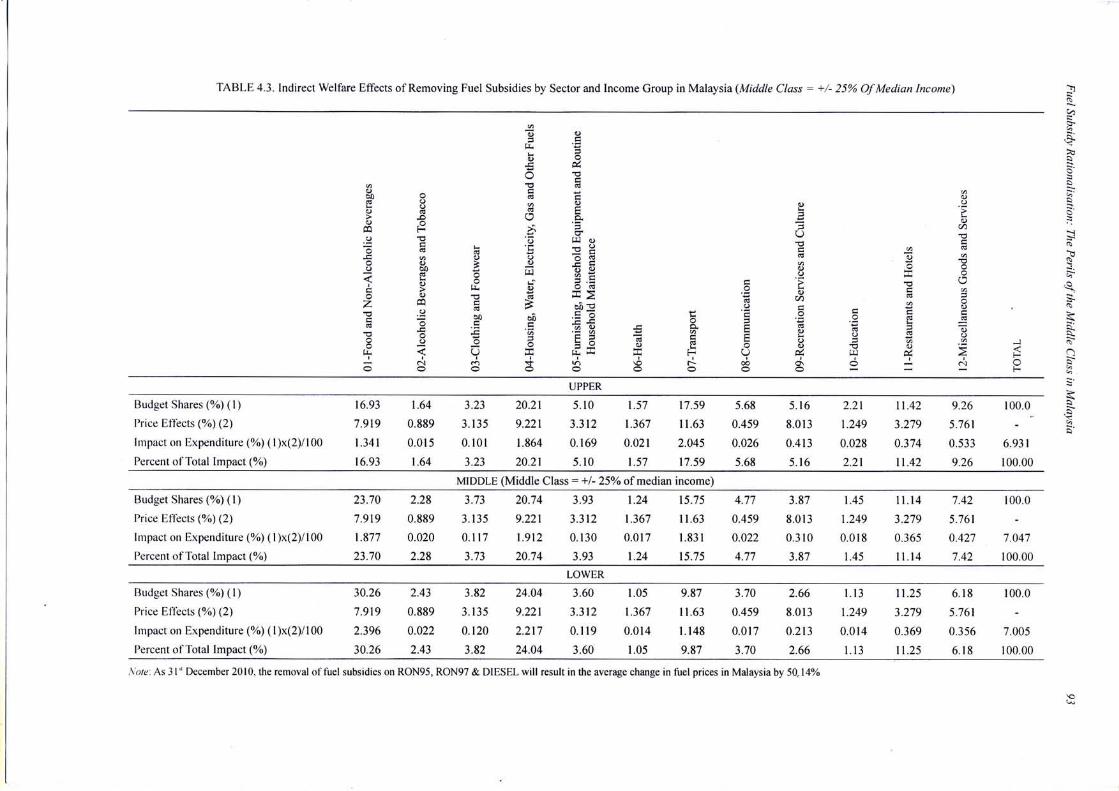
TABLE 4.3. Indirect Welfare Effects of Removing Fuel Subsidies by Sector and Income Group in Malaysia (Middle Class : +/- 25% Of Median Income)(\14
SlG
G:
S(!
:-
a=-
Eq . 9tsd L
, aU !d t ri a Gd 6 J !a = : l
Io i i , g
F ' F t u. y 6 s 6€ , d 6 d =g a a o
P ' = a d : o 'x : . : b E FgEHqSEF : ! ? : - - : . 2 JF d P , r i d ,* o 5 o \ d - i . \ bo o o F
6
E 9
o v
v =€ E
9 Pde- ' =o l r l o
L F - O
o o o 6; I = FE F . t U X€ s eE
F :'Et ..! a z.
F = oi'r,9 p b A . : 9. = . E ? E - c* 3 '=E
€; s . i € i j\ , , / J I ! *
t lc a l f l n \ O
t o o6 9L Oo ( !> . o^9 .o
, . Q aO oo o o?Hc >o . E
Ao
' E :i =x xx :'i
l l6l
UPPER
Budget Shares (%) ( I )Price Efl'ects (%) (2)
lmpact on Expenditure (%) (l)x(2)/100
Percent of Total Impact (%)
16.93
7.9t9
L341
16.93
1.64
0.889
0.015
1.64
5.68
0.459
0.026
5.68
5 . l 6
8.013
0.413
5 . l 6
2.21
1.249
0.028
2 .21
[ .42
3.279
0.374
n.42
3.23 20.21 5.10 r.57 17.593.135 9.22t 3.312 r.367 11.630.101 1.864 0.169 0.021 2.0453.23 20.21 5.10 1.57 17.59
9.26 100.0
5.76r
0.533 6.931
9.26 100.00
MIDDLE (Middle Class = +l-25o/oof median income)
Budget Shares (%) (l)
Price Eff'ects (%) (2)
Impact on Expenditure (%) (l)x(2)/100
Percent of Total Impact (%)
23.70
7.919
| .877
23.70
2.28
0.889
0.020
2.28
4.77
0.459
Q.022
4.77
3.87
8 .013
0 .310
3.87
1.45
1.249
0.01 8
1 .45
I l . l 4
3.279
0.365
I l . l 4
3.73 20.74 3.93 r.24 rs.1s3.135 9.221 3.312 r.367 11.630.1 t7 r .912 0 .130 0 .017 1 .8313.73 20.74 3.93 1.24 15.75
7.42 100.0
5.76r
0.427 '7.047
7.42 100.00
Budget Shares (%) ( l )
Price Ef'f'ects (Vo) (2)
Irnpact on Expenditure (%) ( l)x(2)/100
Percent of Total Impact (%)
30.267.9t92.39630.26
2.43
0.889
0.022
2.43
3.823 . 1 3 50.1203.82
24.04
9.221
2 .2 t7
24.04
3.60
3.312
0 .1 19
3.60
1.05
1.367
0.014
1.05
9.87
I 1.63
1 . 1 4 8
9.87
3.700.4590.0173.70
2.668.0130.2r32.66
l . l 3
1.249
0 .0 t4
1 . 1 3
n.253.2790.369| .25
6.18 r 00.05.76r0.356 7.0056. l 8 100.00
Vo/c: As 31"' December 2010, the removal of fuel subsidies on RON95, RON97 & DIESEL will result in the average change in fuel prices in Malaysia by 5Q l4%
s
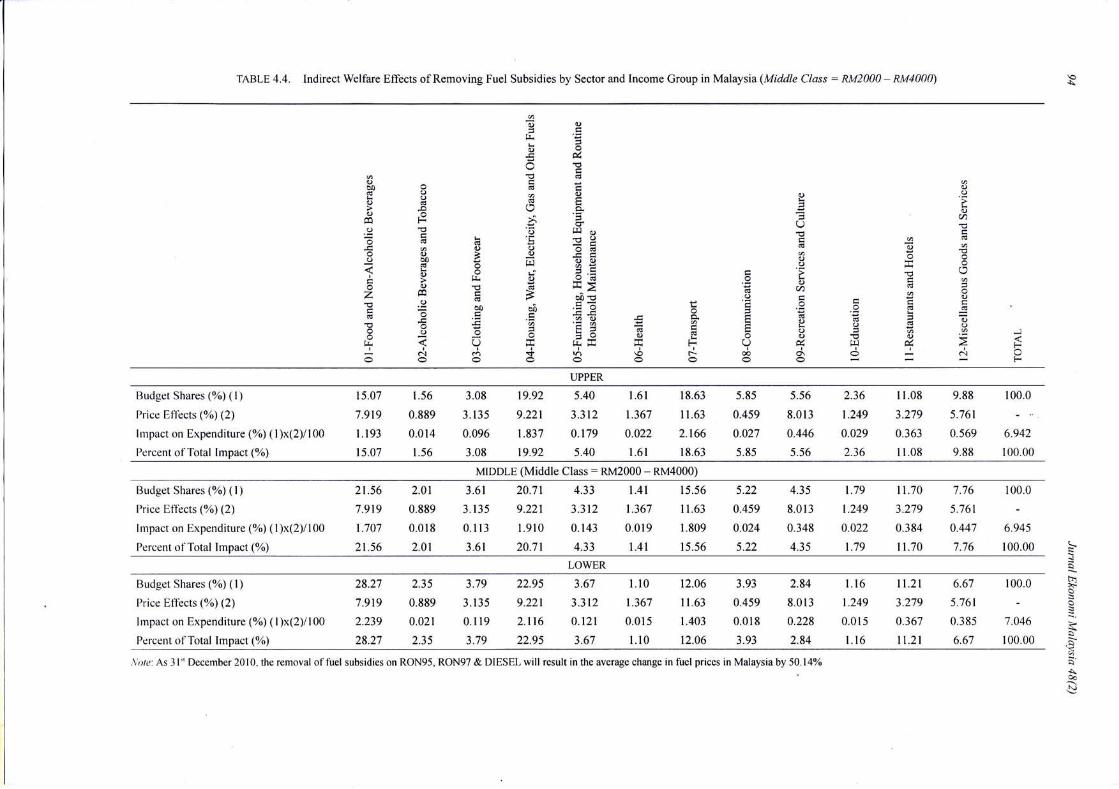
TABLE 4.4. Indirect Welfare Effects of Removine Fuel Subsidies bv Sector and Income Group in Malavsia (Middle Class : RM2000 - RM4000\
J
sF
o- . ot s >) aO !f l t rQ @d E aa = E
o : i or h
F P ! V. H 6 E 9 '6 v r
FHBsEg6 3 J oa r q
= 8 5 3 # 3F a d r l E( = € O \ O a . lo o o
a
E 9r 9
O Y1 M .
v =
a 9 ,S F
- ' ='6
Fl 6;! l - E Y
9 E 9 F! r ' i ( ) O
6 Eo !.:' ? '=
l J i O e d! - 6 * 2
F t $ q9 p a i . = 9. = . E z T - t r. . q q ' = 4 =o 6 = 6 U
r , - + r
6 $ r ) \ O
$ osB !.io 6 i> ' o
g , o
, ! oo oo h o4 i :i oc >- O
zao
=X Yx - :ri
ot
UPPER
Budget Shares (%) ( l)
Price Efl-ects (%) (2)
hnpact on Expenditure (%) ( l)x(2)/100
Percent of Total Impact (%)
15.07
7.919
1 . 1 9 3
15.07
1.56
0.889
0.014
L56
5.85
0.459
0.027
5.85
5.56
8 .013
0.446
). )o
2.36
1.249
0.029
2.36
I 1 .08
3.279
0.363
I 1.08
3.08 19.92 5.40 l.61 18.63
3.135 9.221 3.312 1.367 11.63
0.096 1.837 0.t79 0.022 2.166
3.08 19.92 5.40 l.6r 18.63
9.88 100.0
5.761
0.569 6.942
9.88 100.00
MIDDLE (Middle Class: RM2000 - RM4000)
Budget Shares (%) ( l )
Price Eff'ects (Yo) (2)
Impact on Expenditure (%) ( l)x(2)i 100
Percent of Total Impact (%)
2 t . 5 6
7.9t9
1.707
2 t .56
2.01
0.889
0 .018
2.01
5.22
0.459
0.024
5.22
4.35
8 .013
0.348
4.35
1 .79
1.249
0.022
1.79
I 1.70
3.279
0.384
I 1 .70
3.61 20.7 | 4 .33 r .4r 15.56
3.135 9.221 3.312 1.367 11.63
0 .113 1 .910 0 .143 0 .019 1 .809
3.61 20.7 | 4 .33 l .4 l 15.56
7.76 100.0
5.761
0.447 6.945
7 .76 100.00
Budget Shares (%) ( l)
Price Efl'ects (%) (2)
Lnpact on Expenditure (%) (l)x(2)/100
Percent of Total Impact (%)
28.27
7.919
2.239
28.27
2.35
0.889
0.021
2.35
3.79
3 . 1 3 5
0 .1 19
3.79
22.95
9.221
2.116
22.95
3.67
3.312
0.121
3.67
L l 0
r .367
0.015
l . l 0
12.06
I 1.63
1.403
12.06
3.93
0.459
0 .018
3.93
2.84
8 .013
0.228
2.84
l . l 6
1.249
0 .015
l . l 6
n . 2 l
3.279
0.367
n . 2 l
6.67 100.0
5.',t61
0.385 7.046
6.67 100.00
:
!+
=
\i-.
Vrrre: As 3 l'' December 20 I 0. the removal of fuel subsidies on RON95, RON97 & DIESEL will result in the average change in fuel prices in Malaysia by 50. l4%
Fuel Subsidy Rationalisation: The Perils ol the Middle Class in Malavsia
THE TOTAL WELFARE EFFECT (TWE)
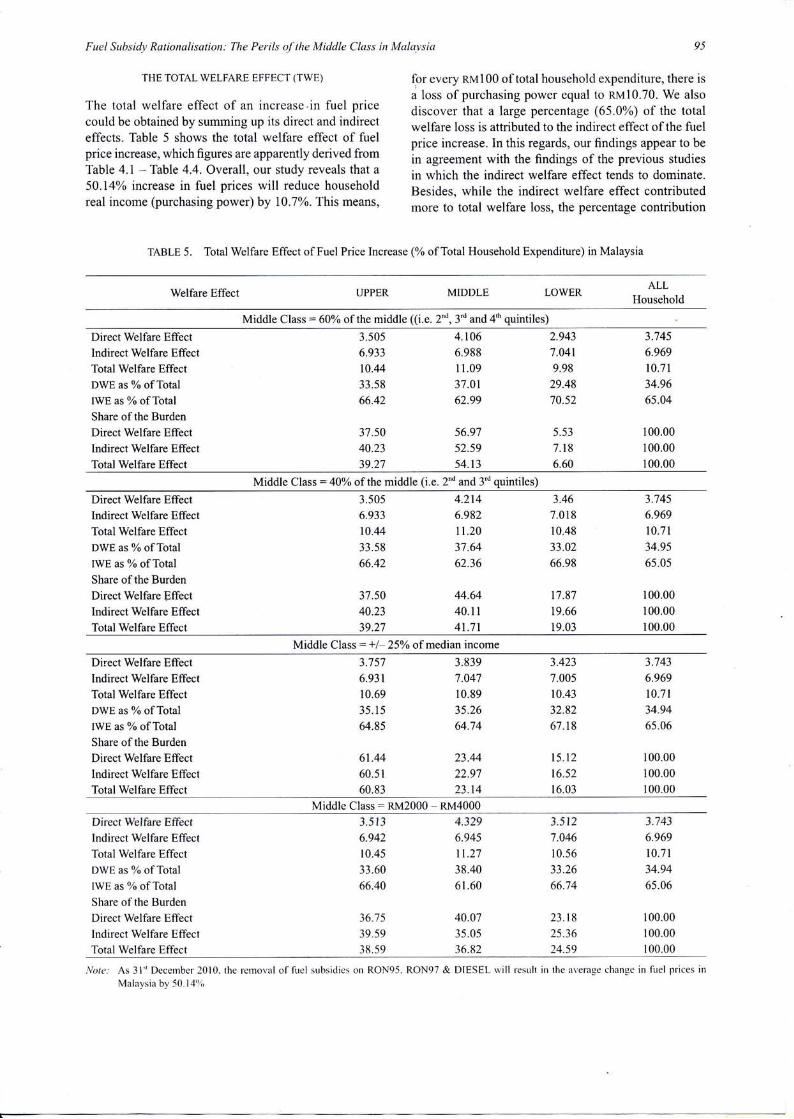
The total welfare effect of an increase.in fuel pricecould be obtained by summing up its direct and indirecteffects. Table 5 shows the total welfare effect of fuelprice increase, which figures are apparently derived fromTable 4.1 - Table 4.4. Overall, our study reveals that a50.14% increase in fuel prices will reduce householdreal income (purchasing power) by 10.7%. This means,
for every RM100 of total household expenditure, there isa loss of purchasing power equal to nv10.70. We alsodiscover that a large percentage (65.0%) of the totalwelfare loss is attributed to the indirect effect of the fuelprice increase. ln this regards, our findings appear to bein agreement with the findings of the previous studiesin which the indirect welfare effect tends to dominate.Besides, while the indirect welfare effect contributedmore to total welfare loss, the percentage contribution
95
TABLE 5. Total Welfare Effect of Fuel Price Increase (o/o of Total Household Expenditure) in Malaysia
Welfare Effect UPPER MIDDLE LOWERALL
Household
Middle Class = 60% of the middle ((i.e. 2nd, 3'd and 4'h quintiles)
Direct Welfare Effect
Indirect Welfare Effect
Total Welfare Effect
DWE as % of Total
IWE as % of Total
Share of the Burden
Direct Welfare Effect
Indirect Welfare Effect
Total Welfare Effect
3.505 4.1066.933 6.98810.44 11.0933.58 37.0166.42 62.99
37.50 56.9',140.23 52.5939.27 54.13
2.9437.0419.9829.4870.52
5.537 . l 86.60
3.7456.96910.7134.9665.04
100.00100.00100.00
Middle Class : 40Yo of the middle (i.e. 2o and3'o quintiles)
Direct Welfare Effect
Indirect Welfare Effect
Total Welfare Effect
DWE as %o of Total
IWE as % of Total
Share ofthe Burden
Direct Welfare FffectIndirect Welfare Effect
Total Welfare Effect
3.5056.93310.4433.5866.42
37.5040.2339.27
4.2146.98211.2037.6462.36
44.6440.1 141.71
3.467 .01810.4833.0266.98
t7.8719.6619.03
3.7456.96910.7134.9565.05
100.00100.00100.00
Middle Class : +l-25oA of median income
Direct Welfare Effect
Indirect Welfare Effect
Total Welfare Effect
DWE as % of Total
IWE as % of Total
Share ofthe Burden
Direct Welfare Effect
Indirect Welfare Effecl
Total Welfare Effect
3.7576.93110.693 5 . 1 564.85
61.4460.5160.83
3.8397.04710.8935.2664.74
23.4422.9723 . t4
J . + Z J
7.00510.4332.8267 .18
15.1216.5216.03
3 . t + 5
6.96910.7134.9465.06
100.00100.00100.00
Middle Class = RM2000 - RM4000
Direct Welfare Effect
Indirect Welfare Effect
Total Welfare Effect
DWE as % of Total
IWE as % of Total
Share of the Burden
Direct Welfare Effect
Indirect Welfare Effect
Total Welfare Effect
3 .5 r36.94210.4533.6066.40
36.7539.s938.59
4.3296.945I t .2738.4061 .60
40.0735.0536.82
3.5127.04610.563.1 .zo
66.'74
2 3 . 1 825.3624.59
3.7436.96910.7134.9465.06
100.00100.00100.00
Ncr re : As3 l "December20 l0 . t he remova l o f f ue l subs id i esonRON95 .RON9T&DIESELw i l l r esu l t i n t hea r , e ragechange in fue l p r i ces i n
Malaysia by 50. 14'Z '
96
of the indirect welfare effect is noticeably quite higherfor the lower class compared to the rest of the incomeclasses. This implies that the rise in the general price ofgoods and services (due to fuel price increase) affectsthe lower class more than the upper and middle classes.
We also discover another interesting observation,which is worthy to be highlighted. Our analysis revealsthata50.l4%o increase in fuel prices will reduce middle-class household real income (purchasing power) byranging from 10.9% - 11.3yo, which is noticeablyhigher than the upper and lower classes, regardless ofthe definition of the middle-class used. Our findingsalso show that in terms of the burden of the total welfareeffects, the share of the middle-class is higher than theupper and lower classes when middle-class is definedas middle 60%o and middle 40%. Thus, our findingsgenerally imply that the middle-class is hurt most fromthe fuel subsidy removal. Perhaps, this is due to the factthat their fuel budget share is larger than that ofthe upperor the lower classes.
SUMMARY AND CONCLUSIONS
The intention ofthe government to carry out fuel subsidyreform in Malaysia entails investigation on the impactof subsidy removal on household welfare, particularlyon the middle-class. While the rationale for reducingsubsidy is to ease the financial burden of the governmentis commonly understood, its consequences on the welfareof the middle-class however remain to be discovered.This study is motivated by the desire to explore thelikely effect of subsidy removal on the welfare of themiddle-class since the question with regards to the plightof the middle-class has been highlighted in the massmedia as well as in the academic literature such as the"middle-class squeeze", or "the middle-class trap". Webelieve that examining the likely impact of fuel subsidyremoval would shed some light on the debate about themiddle-class.
Based on the empirical evidences discovered inour study, it can be concluded that our findings lendsupport to the commonly held view that the upper class(richest section of the society) benefitted the most fromfuel subsidy. Therefore, removing fuel subsidy appearsjustifiable. However, while fuel subsidy reform appearsto be justified, nonetheless it must be managed properly.As our study reveals, removing fuel subsidy not onlyhurt the poor, but quite surprisingly, it also indicatedthat it is the middle-class that will be hit the most. Thus,our finding calls for a careful implernentation of the fuelsubsidy reform to mitigate its impact on these groups.The reform rnust be followed by a practical strategy andprogram to lessen the impact on the lower as well as onthe middle income group. Perhaps to help compensatethem, several mitigating rneasures are needed. Some ofthe pract ica l pol icy implernentat ions inc ludes arnong
Jurnal Ekonomi Malaysict 48(2)
others: wider provision of affordable houses especially in
the city, ensuring a stable food price through promotion
and incentives targeting at increasing local supplies. The
study has also shown that households are spending a large
proportion of their income on hire purchase. Reduction
in import tariff will certainly be translated into lower
price of cars and will help them to allocate some of the
saving to lessen their burden. It is therefore suggested
that a major adjustment in import tariff for cars is carried
out as to ensure that people could afford to buy cars at a
reasonable price.
ENDNOTES
I The study by Granado, Coady and Gillingham (2010) ondeveloping countries shows that the cost oftransferring onedollarto the 20olo poorest households via gasoline subsidyis around 33 dollars (i.e., $1/0.03). They further arguedthat, if 1 5 out ofevery I 00 dollars to be allocated to a safetynet program is absorbed by administrative costs and 80%oofthe remaining 85 dollars inbeneficiary transfers reachesthe poor (or 68% ofthe total budget), then the cost-benefitratio for such a program is 1.5 dollars (i.e., $1/0.68). Thisshows that the opportunity cost of subsidising fuel is highand costly. This justifies the subsidy reform embarked uponby many countries including Malaysia.
2 The last HES data is HES 200912010, but has not yet beenpublished at the time this research was conducted. HESdata are generally considered to be high quality data, andare extensively used in various researches.
3 By the same token, the individual household's totalexpenditures are defined as the sum of expenditures onall goods and services for each household.
4 Similarly, adding the individual household's totalexpenditures across 4,227 households yields the(aggregate) household's total expenditures.
5 The last estimated I/o table is in 2009/2010, but has notyet been published at the time this research was conducted)
6 The term "average market price" is used because the actualmarket price differs across three broad geographical areasin Malaysia: Peninsular Malaysia, Sarawak and Sabah.
7 All of the stated fuel prices are taken from (providedby) the Ministry of Domestic Trade, Cooperative andConsumerism.
8 Of the three, RON95 captures 56.3% of the quantity share,diesel 35%, and RON97 8.7% (calculated from figuresprovided by the Ministry of Domestic Trade, Cooperativeand Consumerism).
9 Lp'" - >'r=, Arnni" - 6oornrLpro,.", * d*,r,unrAp*o.r* t
6o;.".rLpoi"""t: (0.563 x 28.69) + (0.35 x 54.13) + (0.087x 49.08) = 50.14%.
I 0 Note that q is used to denote the consumer price of a goodwhile p the producer price of a good.
1l In this study, our calculation using a simple arithrneticshows that the removal of fuel subsidy will increase theaggregate price of petroleum by 50.14o/o. For the DwE,we irnposed a strong assumption that household's donot substituting away from fuel when there is a changein price. This can be interpreted as short run impactrvhere households are rrot flexible enough to adjust theirconsurrrpt ion orr fuel.
Fuel Subsidy Rationalisation: The Perils of the Middle Class in Mulat;sict
12 As for the IWE, we implicitly assumed zero demand priceelasticity which is also considered as a short term impact.
l3 The various measures of the middle class sriggested in theliterature have been discussed by Ravallion (2010).
14 This estimation should be cautiously interpreted srnce weare using data from the HES 200412005 data. It should bementioned here that in 200412005, most household appearto use RON97 since the govemment did not remove thesubsidy on fuel yet. Hence, it is not surprising to findthat RON97 formed the largest share of fuel expenditurein 200412005. Fuel subsidy is reduced, particularly onRON97, starting in 2009.
REFERENCES
Andriamihaja, A. A. and Vecchi, G. 2007. An Evaluation of theWelfare Impact of Higher Energy Prices in Madagascar.Africa Region Working Paper Series No. 106, June 28,2007.
Bank Negara Malaysia. 2009. Bank Negara Annual Report2008.
Birdsall, N., Graham, C. and Pettinato, S. 2000. Stuck In TheTunnel: Is Globalization Muddling The Middle Class?Brookings Institution, Center on Social and EconomicDynamics wP No. 14,2000.
Coady, D andNewhouse, D. 2005. Evaluating the DistributionofReal Income Effects oflncreases in Petroleum ProductPrices in Ghana, International Monetary Fund, mimeo.
Coady, D, Gillingham, R., Ossowski, R., Piotrowski, J., Tareq,S. and Tyson, J. 20 10. Petroleum product subsidies: Costly,inequitable and rising. IMF Staff Position Note, SPN/l 0/05.Washington D.C: Intemational Monetary Fund.
Coady, D., El-Said, M., Gillingham, R., Kpodar, K., Medas, P.and Newhouse, D. 2006. The magnitude and distribution of
' fuel subsidies: Evidence from Bolivia, Ghana, Jordan, Maliand Sri Lanka. IMF Working Paper,06 (247). WashinglonD.C: Intemational Monetary Fund.
Easterly, W. 2001. The middle class consensus and economicdevelopment. Journal of Economic Growth 6(4): 3 17 -335 -
El-Said, M. and Leigh, D. 2006. Fuel price subsidies in Gabon:Fiscal cost and distributional impact. IMF Working Paper,06 (243). Washington D.C: International Monetary Fund.
Granado, J., Coady, D. and Gillingham, R. 2010. The unequalbenefits of fuel subsidies: A review of evidence for
. developing countr ies, IMF Working Paper, l0(202),Washington D.C: Intemational Monetary Fund.
Jenkins, S. P. 1995. Did the middle class shrink during the1980s? UK evidence from kernel density est imates.Economics Letters 49'. 407 413.
Levy, F. and Mumane, R. J. 1992. U.S. Earnings levels andeamings inequality: Areview of recent trends and proposedexplanations. Journal of Economic Literature, AmericanEconomic Association 30(3): I 333-138 l.
Malaysia. 2070. Tenth Malaysian Plan 20II-2015. KualaLumpur: National Printers.
PEMANDU. undated. http://w\ilw.ngv.com.my/documents/949_pemandusubsidy.pdf.
Sugema, L, Hasan, M., Oktaviani, R., Viliani, A. and Ritonga,H. 2005. Dampak kenaikan harga BBM dan efektivitasprogram kompensasi. INDEF Working Paper. http://www.indef.or.id/download/pubs/BBM.PDF
Thurow, L. 1984. The disappearance of the middle Class. NewYork Times, February 5, Section F3.
Wolfson, M. C. 1994. When inequalities diverge. AmericanEconomic Review 84( Papers and Proceedings): 353-358.
Wolfson, M. C. 1997. Divergent inequalities: Theory andempirical results. Review of Income and Wealth 43'.401421.
Roslan Abdul-Hakim*Othman Yeop AbdullahGraduate School of BusinessUniversiti Utara Malaysia06010 UUM Sintok, Kedah Darul AmanMAI-AYSIA
Russayani Ismail**Nor Azam Abdul-Razak*i!*School ofEconomicsFinance and BankingUniversiti Utara Malaysia06010 UUM Sintok, Kedah Darul AmanMALAYSIA
*[email protected]**[email protected]* **[email protected]
97