Embed Size (px)
Citation preview
ROTATING BIOLOGICAL CONTACTOR PILOT STUDY: FORT KAMEHAMEHA WASTEWATER TREATMENT PLANT,
PEARL HARBOR, HAWAII
Gordon L. Dugan
Dean K. Takiguchi
Special Report 9:19:86
September 1986
PREPARED FOR
Rotating Biological Contactor Pilot Study, Fort Kamehameha Wastewater Treatment Plant
Contract N62742-84-C-0152
Navy Public Works Center, U.S. Department of the Navy Pacific Division, Naval Facilities Engineering Command
Pearl Harbor, Hawaii 96860
Project Period: 31 January 1985-26 August 1986
Principll Investigator: Gordon L. Dugan
WATER RESClJRCES ~EARCB CEN'IER University of Hawaii at Manoa
2540 Dole Street Honolulu, Hawaii 96822
iii
A self-contained pilot unit (including primary and secondary sedi
mentation) complete with electric motor driven plastic discs (surface area
awroximately 500 ft Z), located at the u.s. Navy's 7.5 ngd Fort Kamehameha
Wastewater Treatment Plant (VMl'P) at Pearl Harbor, oahu, Hawaii, was operated fran July 1985 to July 1986 at four different op:rating mcx:1es:
hydraulic loadings of 1.5, 3.0, and 5.0 gpd/ftZ (flat disc area) with discs
exposed; and 5.0 gpd/ft Z with discs COV'ered. '!he influent for the RBC unit
was primary clarifier effluent, which was very brackish for wastewater
(4000-5000 rrg/l chloride). In addition, wastewater fran industrial-type
op:rations that use and disdlarge controlled/treated concentrations of
heavy netals were received at the~. '!he median effluent BCDs concerr
trations for the first two hydraulic loading rates <1.5 and 3.0 gpd/ftZ)
were respectively 2.0 and 8.0 rrg/l, with corresponding respective median
suspended solids values of 8.0 and 7.5 ngil. 'lnese values were CXJIlparable
with the present ~ operation utilizing the activated sludge process.
Hydraulic loadings at 5.0 gpd/ft Z prCNided median effluent BCD5 concentra
tions in the 30 to 35 ng/l range. Heavy metal concentrations in the waste
water flows of the ~ and RBC unit were considerably belav the level of
concern, while sane accumulation of heavy metals was noted for the higher
concentrations of suspended am settled solids-the mixed liquor suspended
solids and the rCM and digested sludge. Replacing the existing activated
sludge canponent with an RBC canponent being hydraulically loaded at
3.0 gpd/ft2 would require an estimated capital cost of approximately
$2,500,000, which would require nearly 20 years to repay in electrical cost
savings, based on a 10¢/kWh electrical cost, that increases in cost at an
annual rate of 5%, and an interest rate of 8% compounded annually.
Kgywords: rCM wastewater, biochanical oxygen demand, chemical oxygen demand, wastewater treatment, secondary wastewater, primary wastewater treatment, suspended solids; rotating biological contactor, wastewater treatment efficiency, Fort Kamehameha ~, oahu

ABSIRACT • . . . . . . . . . . . . . . . . . . . . . . . . . . . . . . !N'IRaXJCFION • . . . . . . . . . . . . . . . . . ~IVES AND SCDPE • . . . . . . . . . . . . . . . . . . . . . . . . FORT KAMEHAMEHA ww.rP • . . . . . . . . . . . . . . . . . . . . . ME'lHcror..a;y • . . . . . . . . . . . . . . . . . . . . . . . . RESULTS AND DISQJSSION • . . . . . . . . . . . . . . . .
Heavy Metal Determinations. . . . . . . . . . . • • · . · . . . . me CDSTS: CAPITAL,
capi tal Costs •
OPERATION AND MAIN'IENANCE • . . . . · . . . . . . . . . . . . . . . . . . . . . . . . · . . . .
~ration and Maintenance Costs • • . . . . . . . OONCLUSIONSe e e e ~ ~ ~ . . . . . . . . . . . . . . . . . . . AO<NClVLE:[X;MENTS • . . . . . . . . . . . . . . . . . . . . · . . . . REFERENCES CITED . . . . . . . . . . . . . . . . . . . . · . . . . APPENDICES • . . . . . . . . . . . . . . . . . . . . . . . . . . ~ . .
Figures
1. Location Map of Fort Kameharneha Wastewater Treatment Plant, Pearl Harbor, Oahu • • • • • • • • • • • • • • • . . . .
2. Fort Kameharneha Wastewater Treatment Plant Process FlCM Schematic • • • • • • . . . . . . . . . . . . . .
3. Fort Kameharneha Wastewater Treatment Plant Site Plan • . . . .
Tables
v
iii
1
3
4
7
11
20
23
24
26
29
31
31
35
5
6
8
1. Wavelengths and Slit Widths for Heavy Metal Analysis. 11
2. Operation Schedule for Pilot RBC Unit for Fort Karneharneha WWTP. 11
3. Median Constituent Concentrations of WWTP and Pilot RBC Unit, Fort Kamehameha WWl'P. . . . . . . . . . 14
4. Comparison of RBC Operation in Northwest United States. 18

vi
5. Median Heavy Metal Concentratioo Samples fran Fort KaInehaIIleha mrP. • • • • • • • • • • • • • • • • • • • • • •• 21
6. Capital Cost Canparisons for Proposed 7.5 ngd RBC Canponent for Fort KamehaIneha WWI'P. • • • • • • • • • • • • •• 25
7. Present Worth of Electrical Cost savings, mc vs. Activated Sludge, Fort KamehaIneha WWI'P. • • • • • • • • • • • • 28

The rotating biological contact or (RBC) has had several names asso
ciated with the process, such as bio-disc, rotating biological surface, and
biological fixed-film rotating diSCI however, the presently roost po};W.ar
name is RBC. The RaC treatment process consists of an attached (fixed)
gr<Mth biological treatment unit followed ~ a clarifier, which is similar
to the trickling filter process. As such the RBC treatment process has a
much greater capacity to withstand shock loads in can};arison to the acti
vated sludge process, a suspended gr<Mth process, which itself has ntmlerous
processes and mode of operation variations. '!be RBC unit can be installed
in series or };arallel, in sizes that range in suitability for single-family
residential use to capacities up to several million gallons per day.
The mc basic treatJnent uni t consists of closely sp:1ced, shaft
mounted, rotating discs that generally have awroximately 40% of their sur
faces subnerged in wastewater. Numerous surface configurations for the
discs have been developed ~ various manufacturers. '!be discs are usually
exclusively constructed of sane type of plastic with a generally irregular
surface that increases the surface area. '!he shaft-IOOllIlted, closely sp:1ced
discs revolve at a slow speed ~ a low-energy consuming electric motor
equiH;led with a gear reducer and a chain-and-spocket assembly or by an air
drive unit. The air-driven units introduce canpressed air to the bottan of
the discs which have inverted vanes. This variation with disc motion in
duced ~ canpressed air is more energy intensive than the low energy re
quired for the electric motors used to rotate the shafts. However,
air-driven units have resulted in less shaft maintenance and repairs.
Bianass (biological slime) grows on the surface of the discs which
are slowly rotated in the wastewater and then exposed to the air where
oxygen that is areorbed pranotes the metabolism of the attached micro
organisms. In addition, the shearing force exerted on the biomass sloughs
off excess gr<Mth in the clarifier/sedimentation basin where it is gener
ally rEmOlJed mechanically and recirculated to the primary clarifier c:aIr
ponent for further treatment, or transferred to the solids handling section of the treatment plant.
The concept of treating wastewater ~ the RBC principle was first con
ceived in Germany in 1900 by Weigland and was described in his patent as

2
consisting of a cylinder constructed of wooden slats. But it was not until
the 1930s that this particular design was built am tested, and eventually
prCNed unsuccessful because of severe clogging problems. Further investi
gation of the RBe concept did not take place in Europe until the mid-1950s
(Tsuji 1982) •
Research re-canmenced on the RBe process in 1955 by Hans Hartman am Franz Popel at the Technical University of Stuttgart, West Germany am by
1960 the first commercial facility, using the RBe process was placed on
line in Europe (Autotrol Corp. 1983; Tsuji 1982). In 1965 independent
developnent of the RBe system was begun in the United States by Allis
Chalmers, who were testing rotating discs for chemical proceSSing a~ica
tions. After learning of the European develcpnents of the RBe process
Allis-Chalmers arranged a licensing agreement with the German manufacturer
for manufacture and sale of the system, which was marketed in the United
States and in Europe under the trade name, Bio-Disc (Autotrol Corp. 1983).
'!he first cxmnercial installation in the United States was put in
operation in 1969 at the Eiler Cheese canpany in DePere, Wisconsin (Birks
and Hynek 1971). By the latter part of the 1970s over 3000 RBe systems
were installed worldwide (Bio-Shafts, Inc. 1977).
Studies involving Rae units in Hawaii were initiated at the laboratory
bench-scale level in a Master of Science thesis project in 1974 (Victor
197 4) • 'Ibis was followed in 1977 by a Water Resources Research Center
(WRRC) project (Griffith, Young, and Chun 1978) in which a pilot plant
size, first generation Rae unit was tested at a local wastewater treatment
plant CNer a 5-mo period. A Master of Science thesis (Griffith 1977) was
produced fran this project. Because the major portion of oahu's treated
municipal wastewater effluent total flow bas a high salinity () 1000 ngll
chloride) concentration, the WRRC sponsored a project (Dugan 1984) involv
ing the treatment of primary effluent fran the Sand Island Wastewater
Treatment Plant (l\W.rP) at ~e laboratory bench-scale level. The chloride
content of the Sand Island WWTP effluent ranged from approximately 1200 to
2000 ngll (Dugan 1983). '!he RBC treatment of the higher salinity Sand
Island WWTP primary effluent proved to meet secondary treatment in terms of
carbonaceous 5-day biochemical oxygen demand (BCDs ) am suspended solids
(SS), based on the WI'P's average raw and primary wastewater concentra
tions. Prior to this time only Pescod and Nair (1972) aIParently had

3
reported RBe treatment of wastewater in tropical and subtropical climates,
and none of the RBe studies in the tropical type climates awarently dealt
with high saline (> 1000 mg/l chloride) municipal wastewater.
'!he u.s. Navy's 7.5 IIgd deSign flow capacity Fort Kamehameha rMIP,
which will be described in a subsequent section, receives a very high
salinity wastewater that includes inputs fran heavy retals process opera
tions. The wastewater presently receives secondary treatment I:¥ the acti
vated sludge process; however, because of the increased cost of electrical
power Q1. Oahu and the RBC's reIXltation to withstand shock loading, the u.s. Navy sponsored this pilot research project through funding to the water
Resources Research Genter.
'!he success of the laboratory bP.Jlch-sc.ale RBe treatment of t.he high
salinity (1200-2000 mg/l chloride) Sand Island WWTP primary effluent
pranpted the u.s. Navy to sponsor further study at the pilot-scale level
(-1000 gpd) by using the high saline (-4000-5000 mg/l chloride) Fort
Kamehameha WWTP effluent which also receives wastewater fran heavy netal
process operations. Thus, the general cbjective was to determine the per
formance of a pilot RBC unit at the u.s. Navy's Fort Kamehameha ~ at the
south inlet of Pearl Harbor, oahu. QUy the efficiency of the RBC opera
tion lIlder various conditions was studied.
Specific research cbjectives included the following:
1. To operate, maintain, and monitor the RBC unit for a 12-mo perioo
at the Fort Kamehameha WWTP at loading parameters specific to the
influent wastewater characteristics
2. To obtain sufficient data to Ck>cument the ability of the RBC unit
to consistently achieve 85% BOOs and total suspended solids re
lIlO\Tal and to produce a nitrified effluent
3. To identify limitations of the RBe process to handle shock load
ings of organics and inorganics.
The monitoring parameters for the RBe's influent and effluent included
BOOs, suspended solids (SS), heavy netals, chemical oxygen demand (CCD),
nitrogen, total phosphorus, chloride, grease and oil, temperature, and pH.

4
krJ other analysis CNer and above the routine sanitary analysis was also
conducted, as deemed necessary, for the evaluation of the RBC unit.
Aesthetic aspects, such as odors and fly breeding, were documented in
records of naintenance performed during the course of the study period.
The performance of the pilot RBC was canpared with the ~'s operat
ing activated sludge unit, based on records prCNided to WRRC. Monthly
status refX)rts were prepared and sul::mitted to the U. S. Navy by WRRC. A
cost estimate is included for converting the Fort Kamehameha v.wIP to RBC
treatment, as well as an operation and maintenance comparison between RBC
treatment and the present activated sludge process.
The gCNernment was resfX)nsible for the following sUR?Ort for the
project:
1. PrCNide the site and utilities for the rxototype (pilot) RBC unit
and assist in the initial setup and any relocation to other areas
of the plant as required for e\7aluatioo J;X.IrPOses
2. PrCNide autanatic wastewater collection samplers and wastewater to
the RBC uni t ~ neans of a plIIlp
3. Collect and temporarily store the wastewater samples that are
collected ~ the automatic wastewater samplers for pickup ~ project (WRRC) personnel
4. Conduct the routine (same as normally conducted at the ~)
laboratory analysis on the influent and effluent of the RBC unit
and prCNide the results to WRRC.
The Fort Karneharneha \ttWl'P, a secondary wastewater treatment plant that
has a design flow of 7.5 mgd and presently treats approximately 5 to 6 rngd,
is located adjacent to the entrance to Pearl Harbor, southern oahu, as
sham in Figure 1. '!he general area around the Fort Kameharneha wrrI'P,
which is considered fairly dry by Oahu standards, receives a median annual
rainfall of awroximately 21 in. (525-530 mn) (Giambelluca, Nullet, and
Schroeder 1986).
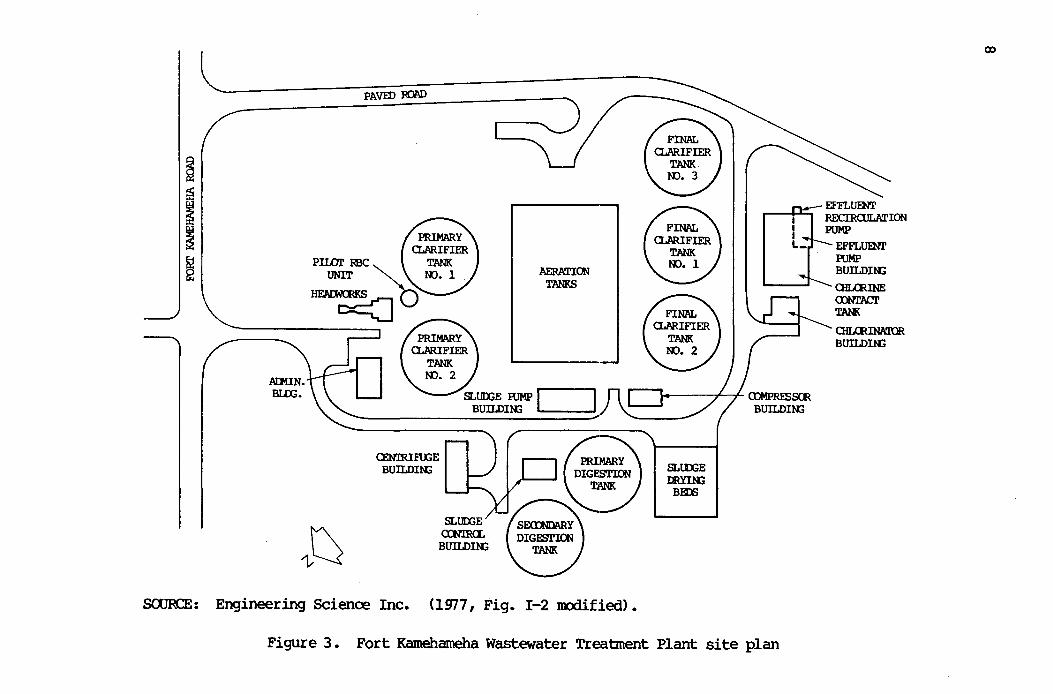
A schematic flow diagram for the v.wIP is presented in Figure 2
while the general site layout of the treatment COfI\IX>nents is outlined in

Moonoluo Hwy.
SClJRCE: Engineering Science Inc. (lfJ77, Fig. 1-1>.
J,;3 V
Figure 1. Location map of Fort Kamehameha Wastewater Treatment Plant, Pearl Harbor, oahu
5

Pr imary Clarifier Effluent Sample pt.
---Plant Influent
Grit Disposal
Digester Sludge Sample
pt.
Supernatant
Centr ifuge Stmp
Effluent Recirculation
foLSS Sample
pt.
AERATIOO TANKS
Centrate
Polymer
P
CEN'lRIFOOES
SOORCE: Engineering Science Inc. (En7, Fig. I-3 IOOdified).
Dewatered Sludge to Disposal
Effluent
Purrp3 ~'-'l ~r-'~ !
r---------~~',t !
<m.auNE CDNT1C1'
TANK
! --...1-
Ocean ~fall
Plant Effluent Simple pt.
Primary flCM
_._.- Alternative flCM
0Punp
Figure 2. Fort Kamehameha Wastewater Treatment Plant process flow schanatic
0\

7
Figure 3. The design treatment criteria for the various treatment canpo
nents are listed in Appendix Table A.I.
'Ibe secondary treabnent at the Fort Kamehameha WWI'P is achieved ~ a
conventional activated sludge process that also includes shredding, grit
remOl7al, primary sedimentation, aeration, secondary clarification, dis
infection of effluent, and solids handling by anaerobic digestioo and
centrifuge dewatering. 'Ibe WWI'P receives wastewater from the Pearl Harbor
Naval Facilities and Hickam Air Force Base as well as wastewater fran an
Arn\Y source which enters the wastewater flow fran Hickam Air Force Base.
Incoming wastewater is primarily danestic with snall anounts of industrial
wastewater, and ship wastewater that is pumped fran the unloading dock to
the WWTP (Engineering Science Inc. lm7). 'Ibere is concern Oller ~tential
heavy netals input to the wastewater stream fran the industrial sources and
its ~ssible effect 00 the biological treatment process, particularly since
the Fort Kamehameha WWI'P is well known for its high salinity, typically
4000 to 5000 mg/l chloride.
The pilot RBC unit utilized for the project was obtained through the
cooperation of Michael Croston, a representative for QlS Rotordisk Inc.,
Mississauga, Ontario, Canada, on a oo-cost basis. 'Ibe RBC unit, designed
for a canplete household or relatively small volume wastewater flCM, is
rated ~ the manufacturer to have a treatment capacity of 750 gpd. 'Ibe RBC
unit has sludge storage capacity on the influent and effluent sides so as
to simulate primary clarification (if oot already prCNided) and also pro
vide secondary (or final) clarification to collect the sloughed-off bianass
fran the discs; thus a separate sedimentation unit following the pilot RBC
unit was not necessary. A manufacturer's brochure, describing the features
of the pilot RBC unit (the Rotorobic System) is presented in Appendix B.
The pilot RBC unit consists of 42 separate 34 in. diam discs rotated
on a shaft that is chain driven ~ a 1/4 hp single Fhase electric motor.
The resulting flat effective surface area of the discs is slightly roore
than 500 ft2. The mit's shell is constructed of fiberglass and the discs
are a piastic mesh, which prCNides a higher actual disc surface area. How-
~
I ~ ~
l_----, PAvm~
1,l:}
CEN'IRIFUiE BUILDIH:;
AERATIOO TANKS
SClJRCE: Engineering Science Inc. (lf517, Fig. 1-2 IOOdif.ied).
SLtI:GE mY.[H:;
BED)
CI~ION I PUMP
I EFFLUENT L_
== 00N'l'1ICI' TMI<
<lfLCIUNA'roR BUILDIH:;
Figure 3. Fort Kamehameha Wastewater Treabnent Plant site plan
co

9
ever, this could be a moot p>int as the bianass tends to cover the mesh
openings, thus, for this study the 500- ft l (46 .45 ml) flat surface area
value was used for calculation plrp>ses. A fiberglass cover for the discs
was also prOlJided for optional use.
The pilot RBC unit was delivered to the Fort Kamehameha WWTP l¥ WRRC
project members. The personnel at the WWTP, under the direction of SUper
intendent Joe Hanna, set up the unit, and prOlJided am installed an influ
ent plIIlp, plumbing, and the electrical facilities and {XMer necessary to
operate the RBC unit under the scheduled designed loading conditions. For
convenience the RBC unit was set up adjacent to the primary clarifier Tank
No. I near the iWll'P1 s Mninistration Building (Fig. 3).
The personnel at Fort Kamehameha WWl'P were scheduled to install the
~site sang;>lers for the RBC unit, to collect and teJrlX>rarily store an
aliquot of the wastewater samples collected l¥ the autanatic sang;>ler for
biweekly pickup l¥ WRRC personnel, and to analyze the collected canposite
RBe influent and effluent sang;>les for the routine constituents parameters,
which are presently being used to monitor the operating efficiency of the
WWl'P. The projected monitoring parameters which the WWl'P personnel were
scheduled to perform, if they were also being conducted for their normal
treabnent efficiency roonitoring schedule, included: BCD. (total and
soluble), SS, 000, nitrogen, total phosphorus, chloride, terrq:lerature, and
pH. Analysis for grease and oil would also be coOOucted if the analysis
was also being performed for other locations of the wastewater stream. But
because grease and oil samples have a well-knCMIl reputation for being
difficult to conduct on a reliable and consistant basis, analysis for this
test is not usually considered routine. It was mutually agreed that if
grease and oil analyses were being conducted l¥ WRRC in a related project,
the Fort Kamehameha samples would also be tested.
The constituent analysis results for the influent and effluent RBC
sarrples as well as the other related routine laboratory analysis performed
l¥ and/or arranged l¥ Fort Kamehameha personnel were to be prOlJided to WRRC
so that the performance of the RBC unit could be canpared to the efficiency
of the present treabnent USing the conventional activated sludge process.
Aliquots of canposited samples, reM wastewater, primary effluent, and final
WWl'P effluent, were also prOlJided to WRRC for heavy metals analysis even
though this aspect was not specified in the original contract.

10
WRRC personnel made biweekly pickups of the oomposited samples
collected and stored at the WWTP for heavy metals analysis. nIring the
biweekly canposite sample pick-up grab samples fran other sampling points
(RBC effluent, secondary clarifier effluent, aeration tank MLSS, raw
sludge, and digested sludge) were also collected to canplanent the heavy
metal analysis for the WWTP in general. Also during the biweekly visit,
the operating conditions of the RBC were checked, for exanple, t:wdraulic
flow rate, relative buildup and pattern of the growth of the attached bio
mass on the discs, the general operating conditions of the RBC unit, and
any observed aesthetic concerns, such as odors and fly breeding.
The heavy metal analysis performed by WRRC was conducted in the
Department of Civil EngineeringIWRRC water Quality Laboratory, located
in Holmes Hall, University of Hawaii at Manoa, approximately 10 miles fran
the Fort Kamehameha WWTP.
All glassware and plasticware used in the project for heavy metal
analysis were washed by soaking in 50% (1:1) nitric acid at roan teIrQ?era
ture for at least 24 hr and then rinsed five times with distilled deionized
water. '!be samples for heavy metal analysis were collected, preserved, and
stored at 4°C in high density polyethylene plastiC containers. Preserva
tion consisted of adding reagent grade nitric acid (BOO3) at a rate of
1.5 ml. HID3/l of sample except for the sludge samples which were preserved
at twice this concentration. With the exception of the RBC and aeration
tank MLSS samples, all other samples were performed by the nitric acid
digestion methcd (302 D) in Standard Methods, (AmA, RilWA, and WPCF 1985).
The heavy metal analysis consisted of testing for an array of typical
heavy metals by utilizing the recently a~red Perkin-Elmer Model 2380
Atanic Absorption spectrqilotaneter. '!be test involves direct aspiration
atanic absorption into an air-acethylene flame, following the procedure
described in Standard Methods (APHA, WiWA, and WPCF 1985). A separate
hollow cathcde lamp is required for one or more (depending on the individ
ual constituent being analyzed for) specific constituents. The wavelengths
and slit width used for the various heavy metal analyses are presented in
Table 1.
'!be RBC lUli t was scheduled to operate ClVer a l2-mo pericd, which
included the time required for installation, check out of the mechanical
and hydraulic flUlctions, and the establishment of bianass on the discs.

TABLE 1. WAVELEN;'lHS AND SLIT W1DIHS FOR HEAVY METAL RlALYSIS
Heavy wavelength Slit Width Metal (nm) (nm)
Silver Cacinium Chranium Coa:>er Iron Nickel Lead Zinc
328.1 228.8 359.4 324.8 248.8 232.0 217.0 213.9
0.7 0.7 0.7 0.2 0.2 0.2 0.7 0.7
11
Because of the 1.mcertainties of the foregoing the projected operating
schedule for the project (Table 2) was established after the RBC unit was
installed and operating properly.
TMLE 2. OPERATION s:HmJLE FOR PILar RBC 'UNIT FOR FORT KAMEHAMEHA WWI'P
TIME PERICD
(100)
3.5
1.3
1.2
1.0
*Flat disc area.
Hydraulic Loading (gpdlftz*)
1.5
3.0
5.0
5.0
DISCS
RESULTS AND DIsaJSSION
Cover Conditions
exposed discs
exposed discs
exposed discs
covered discs
'!he chanical analytical results of the IOOnitoring parameters for the
operation of the pilot RBC unit and corresponding parameters for the Fort
Kameharneha WWI'P rEM wastewater and final discharge efflUent for the four
sepa.rate operation schedules (Table 2) are tabulated in Aa:>endix Table e.l.
As can be noted the daily WWl'P (effluent) flCM rate was generally in the
5 to 6 ngd range, although flCMS above and belCM this range occurred
fra;{uently.
'!he pilot me unit, placed on line on 31 May 1985, received a rela-

12
tively 1CM l'¥draulic loading rate (-1.0 gpd/ft Z of disc area) until 1 July
1985 to pranote and acclimate bianass grorth on the discs. '!be first Ihase
of the project was initiated on 2 July. After the initial Ihase of the
project camnenced, the operation of the RBC unit was relatively continuous
for (Her 7 IOOnths (July 1985 to mid-February 1986), which covered the final
two Ihases (Table 2) of l'¥draulic loading <1.5 am 3.0 gpdIftZ of disc sur
face area, respectively). HCMever, major periods of operational stqpage
occurred during the final two l'¥draulic loading phases (5.0 gpd/ftZ, with
out and with the discs covered, respectively).
'!be stq.pages were mainly the result of malfunctioning of the influent
pumFS, not having a standby punp (furnished am installed l:¥ Fort Kameha
meha lWn'P) with a sufficient pumping capacity range, and not having enough
electrical circuit capacity (which necessitated re-wiring) for the higher
pumping rates. A relatively 1Gi-f1CM pump that could handle the suspended
matter in the primary effluent (influent to the RBC unit) was necessary for
the first operational phase and over three-fold increased flCMS were re
quired for the succeeding phase.
In addition the Fort Kamehameha personnel were under time constraints,
which understandably dictated that the operation of the l\Wl'P receive high
priority. Ne\Tertheless, the first two Ihases, which were considered the
most likely full-scale RBC operational rCIDJes, functioned essentially as
scheduled in Table 2, except that the second phase (3.0 gpdIftZ) was oper
ated approximately twice as long as scheduled because an influent pump
and/or electrical capacity restricted operation at the next higher rate
(5.0 gpd/ft Z).
'!he median values (derived fran AW. Table C.I) of the major IOOnitor
ing chemical constituents and their reJnOllal rates via treatment are pre
sented in Table 3. Median values are considered desirable for canparative
purposes, inasnuch as individual constituent values, for one reason or
another, can be quite high or ICM for a limited period of time, and thus
could significantly distort average values (Her a given period of time.
The BOOs median values for the influent rEM wastewater rCIDJed fran
72 to 92 ng/l, which is on the ICM side for predaninately rrunicipal type
wastewater, whereas, the unusually high chloride level (4000-5000 ngll)
tabulated in lq:penclix Table C.1 indicates significant dilution. '!he
respective BOOs loading rates based on median BCDs values for the four

13
operating phases were 1.00, 1.80, 3.75, and 3.83 lb/lOOO ftl of disc area
for the hydraulic loading rates (Table 1) of 1.5, 3.0, 5.0 gpd/ft l with
discs exposed and 5.0 gpd/ftl with cover in place. '!hese canpare to sug
gested maximum BCDs loadings of 15 to 20 lb/lOOO ft l with nitrification
(U.S. Environnental Protection Al:jency 1985), and far below the maximum
loading of 6.4 lbIlOOO ftl recommended ~ the U.S. Environmental Protection
Agency (1985) fran a review of the operating characteristics of 23 me facilities throughout the United States. The latter recommended maximum
loading was the result of the excessive growth of nuisance organisms which
inhibited dissolved oxygen concentrations in the first stage (discs) load
ing.
The median pH values of Table 3 were near the neutral level, but the
pH values of the RBC unit effluent were awroximately one-half of a pH unit
higher than the Wl'P final effluent which received activated sludge second
ary treatment. The attached algal growth 00 the discs could have contrib
uted to the increased pH through the uptake of HCOJ/(»z.
'!he median BOO, concentration values (Table 3) of the primary clari
fier effluent experienced during the four RBe operational phases were lower
than typically expected for municip:il. operations, with the first opera
tional Ibase being the highest at 102 ng/l. However, during the first
phase quite high (> 365 ng/!) BCD, concentrations occurred 17 times, but
out of the 55 total BCD 15 values they did not significantly influence the
median value. Q1ly one BCD, value was recorded in the second operational
phase (3.0 gpd/ft J ). '!be BOO, concentration values for the primary
clarifier effluent carq:are to "text book" values of 130 ng/l (200 ng/l raw
wastewater and 35% primary clarifier BCD, removal efficiency), which is
essentially the same as the l24-ngll value reported ~ the U.S. Fnviron
nental Protection Agency's (1985) review of 16 me facilities in the United
States.
The BOO, median concentration values of the presently operated Fort
Kameharneha WWTP utilizing activated sludge secondary treatment were very
low (2.0-3.0 ngll) and the corresponding BOO, renOllal efficiencies were
very high (96 to 98% based on raw wastewater) during the four RBe opera
tional Ibases as shOtm in Table 3.
'lhe median BOOs concentrations of the RBC effluent were similarly
very low (2.0 ngI!) and relatively low (8.3 ng/!) during the first two
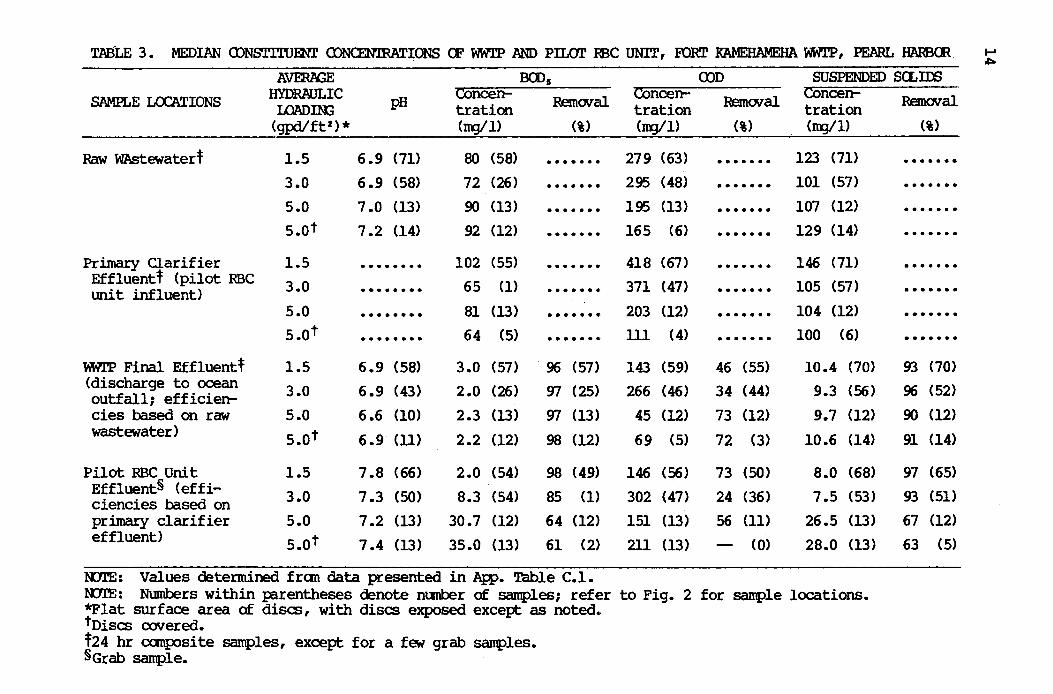
TABLE 3. MEDIAN CDNSTITUmI' CDNCEN'lRATIONS CF WWTP AND PILGl' mc UNIT, FORT I<AMEHAMEHA WWl'P, PEARL HARBCR ..... os:..
AVEru'-ill: BCDs <nD SUSPENDED SCLIDS
SAMPLE LOCATIONS HYDRAULIC pH concerr RemOlJal
COncerr RemOIlal
COncerr Removal LOADlliG tration tration tration
(gpd/ftZ)* (m¥l) (') (m¥1> (') (m¥l) (')
Raw WAste\oliatert 1.5 6.9 (71) 80 (58) · ....... 279 (63) · ...... 123 (71) · ...... 3.0 6.9 (58) 72 (26) · ....... 295 (48) · ...... 101 (57) · ...... 5.0 7.0 (13) 90 (13) .. . . . . .. 195 (13) ....... 107 (12) · ...... 5.0t 7.2 (14) 92 (12) ........ 165 (6) · ...... 129 (14) · ......
Primary Clarifier 1.5 . .. . .. . . 102 (55) . ....... 418 (67) . ...... 146 (71) · ...... Eff1uentt (pilot RBC 3.0 65 (1) 371 (47) 105 (57) uni t influent) ........ · ....... . ...... · ......
5.0 . .. .. ... 81 (13) • ••••• fI 203 (12) · ...... 104 (12) · ...... 5.0 t .. .. . .. . 64 (5) ......... 111 (4) · ...... 100 (6) .......
WWTP Final Eff1uentl 1.5 6.9 (58) 3.0 (57) 96 (57) 143 (59) 46 (55) 10.4 (70) 93 (70) (discharge to ocean 3.0 6.9 (43) 2.0 (26) g] (25) 266 (46) 34 (44) 9.3 (56) 96 (52) outfall; efficierr cies based on raw 5.0 6.6 (10) 2.3 (13) g] (13) 45 (12) 73 (12) 9.7 (12) 90 (12) waste\oliater)
5.0t 6.9 (11) 2.2 (12) 98 (12) 69 (5) 72 (3) 10.6 (14) 91 (14)
Pilot RBC Unit 1.5 7.8 (66) 2.0 (54) 98 (49) 146 (56) 73 (SO) 8.0 (68) 97 (65) EffluentS (effi-
3.0 7.3 (SO) 8.3 (54) 85 (1) 302 (47) 24 (36) 7.5 (53) 93 (51) ciencies based on primary clarifier 5.0 7.2 (13) 30.7 (12) 64 (12) 151 (13) 56 (11) 26.5 (13) 67 (12) effluent) 5.0 t 7.4 (13) 35.0 (13) 61 (2) 211 (13) (0) 28.0 (13) 63 (5)
tUm: Values determined fran data presented in AW. Table C.1. IDl'E: Numbers within p:lrentheses denote nunber of samples; refer to Fig. 2 for sanp1e locations. *F1at surface area of discs, with discs exposed except as noted .. tDiscs oovered. l24 hr canposite samples, except for a few grab sanp1es. SGrab sanp1e.
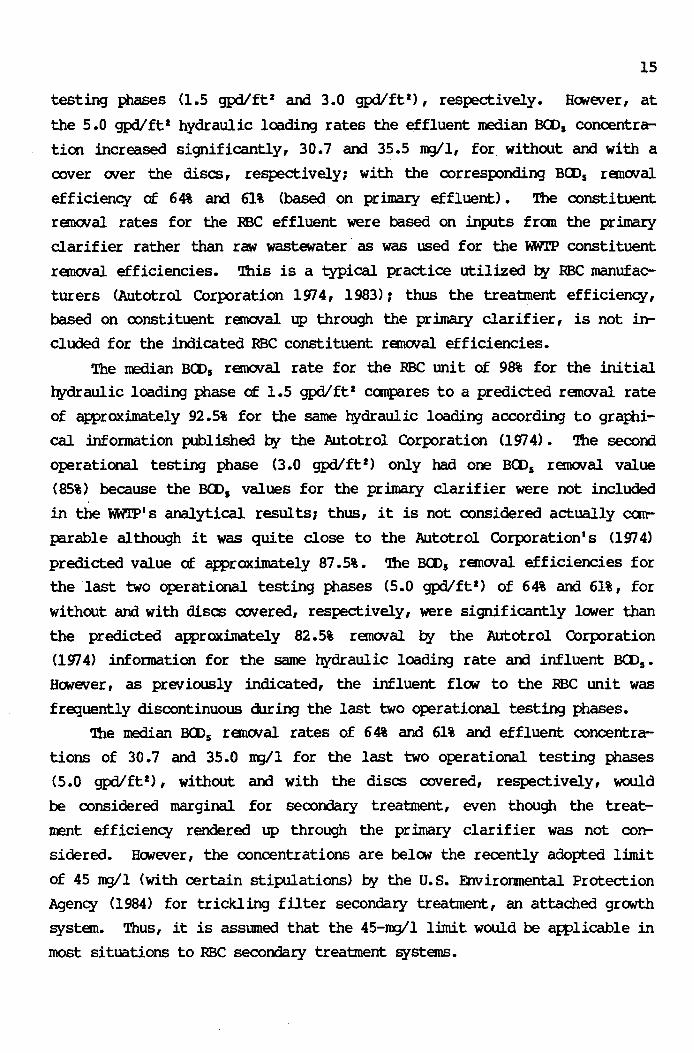
15
testing phases (1.5 gpd/ft Z and 3.0 gpd/ft l ), respectively. HCMever, at
the 5.0 gpd/ft Z hydraulic loading rates the ~fluent median BOOs concentra
tion increased significantly, 30.7 and 35.5 ngll, for without and with a
cover wer the discs, respectively; with the corresponding BCD, rEmwal
efficiency of 64% and 61% (based on primary effluent). '!he constituent
ranwal rates for the RBC effluent were based on inputs fran the primary
clarifier rather than raw wastewater· as was used for the M'7l'P constituent
remcNal efficiencies. '!his is a typical practice utilized ~ RBC manufac
turers (Autotrol Corporation 1974, 1983); thus the treatment efficiency,
based on constituent remcNal up through the primary clarifier, is not in
cluded for the indicated RBC constituent remCNal efficiencies.
The median BOO, ranoval rate for the RBC unit of 98% for the initial
hydraulic loading phase of 1.5 gpd/ft Z canpares to a predicted remwal rate
of approximately 92.5% for the same hydraulic loading according to graphi
cal information published ~ the Alltotrol Corporation (1974). '!he secooo
operational testing phase (3.0 gpd/ftl) only had one BCD, rEm0\7al value
(85%) because the BCD, values for the primary clarifier were not included
in the ww.rpl s analytical results; thus, it is not considered actually catr
parable although it was quite close to the Alltotrol Corporation1s (1974)
predicted value of approximately 87.5%. '!he BCD, remwal efficiencies for
the last two operational testing phases (5.0 gpd/ft') of 64% and 61%, for
without and with discs covered, respectively, were significantly lower than
the predicted approximately 82.5% remwal by the Alltotrol Corporation
(197 4) information for the same hydraulic loading rate and influent BCD,.
However, as previously indicated, the influent flow to the RBC unit was
frequently discontinuous Wring the last two operational testing phases.
'!he median BCD, remwal rates of 64% and 61% and effluent concentra
tions of 30.7 and 35.0 ngll for the last two operational testing phases
(5.0 gpd/ftl) , without and with the discs covered, respectively, would
be considered marginal for secondary treatment, even though the treat
ment efficiency rendered up through the primary clarifier was not con
sidered. H<Mever, the concentrations are belCM the recently adopted limit
of 45 ngll (with certain stipulations) by the U. S. Enviromnental Protection
Agency (1984) for trickling filter secondary treatment, an attached growth
system. Thus, it is assumed that the 45-ngll limit would be awlicable in
most situations to RBC secondary treatment systems.

16
The soluble median BCDs values of Appendix Table C.2 for the RBC
effluent prcxluced median values of <2, 4.1, and 10 ng/l for the operational
phases one to three, respectively. No soluble BCDs values were d:>tained
during the final };base. In canparison to the median mc effluent BOOs
concentrations (Table 3) the soluble BOOs values were less than one-half
of the total BOOs values, although the first phase involved a < 2 vs. a
2.0 value. Sane equipnent manufacturers rely IOOre on soluble BCDs than
total BCDs for monitoring purposes since it is assumed that the biological
treatment system is more effective in renoving the soluble portion of the
BOOs. Although this assumption is prcbably valid to a significant degree,
suspended and colloidal BOOs materials W1doubtedly adhere to biological
grarth material and are consequently ranOV'ed, and/or metabolized to a
varying degree, when the biological material is renoved fran the treatment
system.
The median roD values for the various testing phases appeared to be
generally inconsistent. Wess biological inhibition is present, a typical
and reasonable correlation should be ev ident between BCDs and roD. The Q)D
value is nearly always higher than the BCDs value W1less unusual high rates
of nitrification occur that could utilize significant quantities of
dissolved oxygen. '!be general practice IlOVl, hcMever, is to use a
nitrification inhibitor in the BOOs test and thus have only carbonaceous
BOOs, which tends to normalize the test. As is particularly E!Ilident for
the WWl'P final effluent and the first two operational testing phases for
the RBC unit (determined fran Table 3), a very low BCDs to roD ratio would
typically indicate BCDs inhibition. But the aforanentioned inconsistency
of the roD data, and the relatively close agreement between total organic
carbon ('lQC) and BOOs for the RBC unit's effluent (AW. Table C.l), lends
credence to the reliability of the BCDs data OV'er the OOD values. Olloride
concentrations of > 2000 ng/l are known to inhibit the reliability of the
roD test (APHA, NtMA, and WPCF 1985). '!hus, the high dlloride content of
the samples (4000 to 5000 JIg/I range) may have altered the accuracy of the
roD test.
'!he median suspended solids (SS) concentration pattern (Table 3) for
the WWl'P final effluent and the RBC effluent appeared to follow the same
general pattern as encoW1tered for BCDs , which again lends credence to the
BOOs concentration values. While the median BOOs for the \W1I'P effluent

17
varied fran 2.0 to 3.0 ugll for the four qlerational test Iilases, the
median ss of the WWI'P effluent had a similar very tight range of 9.3 to
10.6 ng/l. The median effluent BCDs for the RBe's first operation! test
Plase u.s gpd/ft2) had a corresponding SS value of 8.0 ugll, which is
essentially that produced in the WWI'P effluent, but surprisingly, during
the second operation Iilase (3.0 gpd/ftZ) when the RBe effluent BCDs iIr
creased to 8.3 ngll, the corresponding SS value (7.5 ngll> remained essen
tially the same. The notable increase of the RBe effluent's median BOOs
concentrations during the final two operation test Plases (5.0 gpd/ftZ)
without and with the discs covered of 30.7 and 35.0 ng/l, respectively, did
not show the same proportional increases for the SS concentration values of
26.5 and 28.0, but the range differences between BCDs and SS were quite
close. It should be noted that the WWI'P final effluent values were d:r
tained fran 24-br oamposite samples, whereas the RBe effluent constituent
concentrations were based on grab samples.
A canparison is shown of the longer term operation of me systems
treating municipal strength wastewater in the northwest (U.S.) in terms of
hydraulic loading (gpd/ftZ); total BCDs ; soluble BCDs ; and suspended solids
(Table 4). Interestingly, the lowest reported total and soluble BCDs
average concentrations were for Tillamook, Oregon, which had the highest
(average) hydraulic loading 2.71 gpd/ft Z <125% of design capacity). The
eleven RBe systems reported in Table 4 are in the temperate zone, which
experiences wide annual temperature differences (well below freezing to
> 100°F, whereas the average ambient temperature at the Fort Kamehameha
WWI'P was in the mid-70's, with rare extremes fran slightly below 60°F to
slightly above 90°F.
The treatment efficiency of the RBe unit decreases when the waste
water temperatures are below 55°F, but no apparent awreciable increase
is evident in temperatures above 55°F. Inhibition of the biological
process occurs generally when wastewater temperatures exceed 86°F (Autotrol
Corporation 1978; u.S. Erwironmental Protection Agency 1980; Davies and
Pretorius 1975). '!he typical average wastewater temperature on oahu is
near the mean ambient temperature. Considering the temperature differ
ences, the first two operation testing phases of the pilot RBe unit
(Table 3), respectively, were quite canparable with the results of the
various RBe systems tabulated in Table 4, which would have had inhibited

.... <Xl
TABLE 4. Q)MPARISOO CF RBC OPERATION IN N:R'IHWEST UNITED STATES
HYDRAULIC BCDs TSS SCLtBLE BCD, (ngll> % DESIGN UX'ATION LOADIt-l; III out In out In OUt OfrVe ESt. SCLtBLE Ba>,
(gpd/ftZ) * (ng/l) (ngll> Predicts carbon (lbII000 ft Z )
Wapato, WA 1.37 199 16 148 9 86 8 5 84
Woodland, WA 1.64 184 20 230 16 69 10 5 5 (3) 43
Wilsonville, CR 0.44 244 9 241 6 112 6 5 5 (3) 21
Union, CR 1.60 206 13 158 6 III 6.5 9 123
Tq:.penish, WA 2.20 132 9 125 6 57 5 6 63
Tillamook, CR 2.71 169 4 236 20 51 2 6 125
Enumclaw,WA 1.67 177 19 215 15 71 9.5 9.5 117
Herminston, CR 0.87 175 21 204 14 53 10 5 5 (3) 37
Battle Ground, WA 0.94 224 10 244 10 90 5 5 113
Blaine, WA 1.00 154 18 139 13 72 9 5 5 (3) 38
Woodburn, CR Canning 0.81 324 16 357 6 137 (2) 10 9.5 70 Non-Canning 1.92 26 (2) 8.5 5 5 (2)
saJRCE: Interoffice correspondence (25 Jan. 1984) to Albert TSllji, M.C. Nottingham, Honolulu, HI, fran Ray Ankaitis, Envirex, 49 ()Jail Court-RID. 216, walnut Creek, CA 94596.
ID.I'E: All WWl'P data are l-yr averages, except Woodburn, Oregon and Battle Ground, Washington; Soluble and carbon soluble BCD, data for WocxJ:>urn, Oregon are actual plant data; At 50% of design (BCD, ) or less, all data available indicate that effluent soluble Ba>, is 50% carbon and 50% nitrogenous.
*Hydraulic loading per surface area of discs.
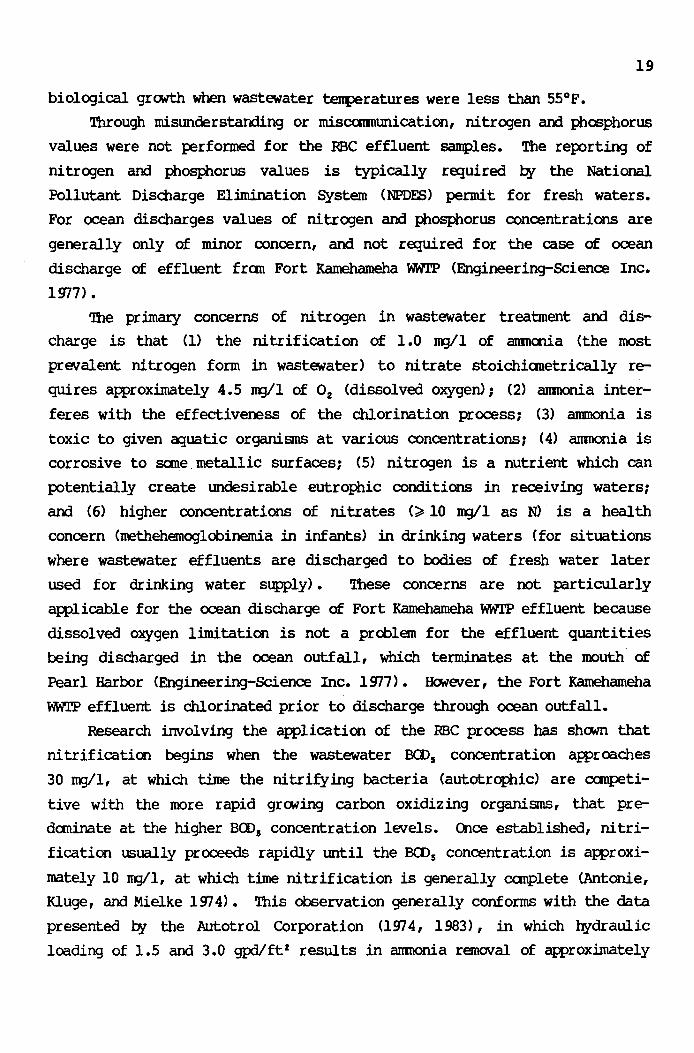
19
biological growth when wastewater temperatures were less than 55°F.
'Ihrough misunderstanding or miscamllmication, nitrogen and phosphorus
values were not performed for the RBC effluent samples. The reporting of
nitrogen and phOSJ:ilorus values is typically required ~ the National
Pollutant Disdlarge El.imination System (NPDFS) permit for fresh waters.
For ocean disdlarges values of nitrogen and phosphorus concentrations are
generally only of minor concern, and not required for the case of ocean
discharge of effluent fran Fort Kamehameha WWrP (Engineering-SCience Inc.
19]7) •
'!he pr mary concerns of nitrogen in wastewater treatment and dis
charge is that (1) the nitrification of 1.0 ngll of aImlarla (the most
prevalent nitrogen form in wastewater> to nitrate stoichianetrically re
quires approximately 4.5 ngll of O2 (dissolved oxygen); (2) amnonia inter
feres with the effectiveness of the chlorination process; (3) ammonia is
toxic to given aquatic organisms at various concentrations; (4) ammonia is
corrosive to sane metallic surfaces; (5) nitrogen is a nutrient which can
potentially create undesirable eutrophic conditions in receiving waters;
and (6) higher concentrations of nitrates (~10 ngll as N> is a health
concern (methehemoglobinemia in infants) in drinking waters (for situations
where wastewater effluents are discharged to bodies of fresh water later
used for drinking water supply). '!hese concerns are not particularly
applicable for the ocean discharge of Fort Kamehameha WWTP effluent because
dissolved oxygen l:imitation is not a problem for the effluent quantities
being disdlarged in the ocean outfall, which terminates at the mouth of
Pearl Harbor (Engineering-SCience Inc. 19]7). However, the Fort Kamehameha
WWTP effluent is chlorinated prior to discharge through ocean outfall.
Research involving the application of the RBC process has shCMIl that
nitrification begins when the wastewater BOOs concentration approaches
30 ngll, at which time the nitrifying bacteria (autotrophic) are canpeti
tive with the more rapid grCMing carbon oxidizing organisms, that pre
daninate at the higher BOOs concentration levels. cnce established, nitri
fication usually proceeds rapidly until the BOOs concentration is approxi
mately 10 no/l, at which time nitrification is generally canplete CAntonie,
Kluge, and Mielke 19]4). '!his observation generally conforms with the data
presented ~ the Autotrol Corporation (lg]4, 1983), in which hydraulic
loading of 1.5 and 3.0 gpd!ft2 results in anmonia removal of awroximately

20
98% and 80%, respectively, when the influent BCD, is 100 lD3Il. AWarently at the hydraulic loading rate utilized for the last two
operatiooal test ~s (5.0 gpd/ft2) , the progression of nitrification was
limited as armnonia goes off scale when the influent armnonia nitrogen ex
ceeds 13 ngll. When the influent amnonia is 13 ngll, the effluent amnonia
nitrogen is projected to be awroximately 6 ngll (Autotrol Corporation
1983). HcMever, a temperature correction factor increases the nitrifica
tion rate CNer the base rate scale value Of 1.0 by 1.4 at 65°F, which is
the highest value listed on the scale (Autotrol Corporation 1983). '!be
Water Pollution Control Federation and American Society of Civil Engineers
(1974) deSign manual recaranends a hydraulic loading for RBC systems of 0.75
to 2.0 gpd/ft2--dependent on influent BOO, and anmonia concentrations-when
nitrification is a primary consideration.
Heavy Metal Determinations
The results of the heavy metal determinations for the six sanpling
locations throughout the Fort Kamehameha l\WI'P, including the influent
(primary clarifier effluent), plus the effluent RBC unit, for the four
operational test P1ases (Table 2) are presented in ~ndix Table 0.1. '!be
median concentrations of the heavy netal concentrations for the various
sanpling locations and operational test Ihases in AFPendix Table 0.1 are
tabulated in Table 5. Also shown in Table 5 are the applicable heavy metal
concentration limits for the primary {Public Health Regulations 1981> and
Secondary Drinking Water Regulations (0. S. Enviromnental Protection Agency
1979), the City and County of Honolulu's regulations for industrial waste
water discharges (Division of Wastewater Management 1982), and the Federal
Guidelines for State and Local Pretreabnent Programs (1977). '!hese heavy
metal concentration limits do not apply to the sanples collected and re
ported in Appendix Table 0.1 and Table 5. '!bey are presented only for can
parisons of magnitude p..1I'poses of the liquid samples (excluding rCM and
digested sludge, and the aeration tank's mixed liquor suspended solids).
Primary drinking water regulations are set for J;Xlblic health, and adherence
to the limits must be met, whereas, secondary regulations are for public
welfare, with limits being recaunended.
N:>ne of the individual liquid samples of ~ndix Table 0.1 exceeded

"i"'
TABLE 5. MEDIAN HEAVY METAL CONCEN'IRATION SAMPLES FROM FORT KAMEHAMEHA WWTP, PEARL HARBCR, HllWAII
SAMR.E LOCATIOO HYmJ\lJLIC LQADDG Silver Cadnium Olranium Cower Ircn Nickel Lead Zinc
(gpdltt') * (ng/lJ
Raw Wastewater t 1.5 0.03 (33) 0.02 (33) 0.0 (33) 0.1 (33) 1.2 (33) 0.1 (33) 0.1 (33) 0.18 (33) 3.0 0.03 (20) 0.01 (20) 0.0 (20) 0.1 (20) 0.8 (20) 0.1 (20) 0.1 (20) 0.15 (20) 5.0 0.03 (2) 0.02 (2) 0.1 (2) 0.1 (2) 0.7 (2) 0.1 (2) 0.1 (2) 0.17 (2)
Primary Effluentt 1.5 0.05 (35) 0.02 (35) 0.0 (35) 0.1 (35) 1.9 (35) 0.1 (35) 0.1 (35) 0.35 (35) 3.0 0.04 (22) 0.00 (22) 0.0 (22) 0.2 (22) 1.1 (22) 0.1 (22) 0.1 (22) 0.19 (22) 5.0 0.05 (12) 0.02 (12) 0.0 (12) 0.2 (12) 1.1 (12) 0.1 (12) 0.1 (12) 0.15 (12)
RBe Effluent' 1.5 0.02 (34) 0.02 (34) 0.0 (34) 0.0 (34) 0.1 (32) 0.1 (34) 0.1 (32) 0.06 (34) 3.0 0.01 (25) 0.01 (25) 0.0 (25) 0.0 (25) 0.1 (24) 0.1 (25) 0.1 (25) 0.01 (25) 5.0 0.02 (4) 0.02 (4) 0.1 (4) 0.1 (4) 0.3 (4) 0.0 (4) 0.1 (4) 0.02 (4) 5.0S 0.02 (6) 0.01 (6) 0.1 (6) 0.0 (6) 0.4 (6) 0.1 (6) 0.0 (6) 0.05 (6)
Aeraticn Tank MLsst 1.5 0.21 (24) 0.04 (24) 0.2 (24) 1.1 (24) 8.7 (24) 0.2 (24) 0.4 (24) 0.92 (24) 3.0 0.16 (6) 0.04 (6) 0.3 (6) 1.3 (6) 9.3 (6) 0.2 (6) 0.4 (6) 0.86 (6)
Secondary Effluent' 1.5 0.02 (32) 0.01 (33) 0.0 (33) 0.0 (33) 0.2 (33) 0.1 (32) 0.0 (33) 0.04 (33) 3.0 0.01 (23) 0.01 (23) 0.0 (23) 0.0 (23) 0.1 (22) 0.0 (23) 0.0 (23) 0.05 (23) 5.0 0.02 (2) 0.01 (2) 0.1 (2) 0.1 (2) 0.3 (2) 0.1 (2) 0.1 (2) 0.07 (2)
Final Effluentt 1.5 0.01 (2) 0.02 (2) 0.0 (2) 0.1 (2) 0.1 (2) 0.0 (2) 0.0 (2) 0.04 (2) 3.0 0.02 (l) 0.00 (l) 0.0 (l) 0.2 (l) 0.2 (l) 0.0 (l) 0.0 (l) 0.02 (l)
5.0 0.03 (l) 0.01 (l) 0.1 (l) 0.1 (l) 0.6 (l) 0.1 (l) 0.0 (l) O.ll (l)
5.0S 0.01 (l) 0.01 (l) 0.0 (l) 0.0 (l) 0.9 (l) 0.0 (l) 0.0 (l) 0.04 (l)
Raw Sludge' 1.5 0.05 (4) 0.38 (4) 5.2 (4) 29.1 (4) 226 (4) 4.0 (4) 1.4 (4) 27.2 (4)
Digested Sludge' 1.5 0.18 (5) 0.42 (5) 8.3 (5) 46.9 (5) 378 (5) 1.1 (5) 3.0 (5) 35.1 (5) 3.0 0.21 (l) 0.38 (l) 8.4 (l) 46.3 (l) 475 (l) 1.1 (l) 2.6 (l) 35.5 (l)
Drinking water Regulations: Primaryl 0.05 0.01 0.05 0.05 Secondary' 1.0 0.3 5.0
City & Colmty of Honolulu Industrial Wastewater 0.43 0.69 2.77 3.38 3.98 0.6 2.61 Discharge Provisions: I
Federal Guidelines' for Inhibitory 'Ihreshold Limit:
l-lRa/5-SOb 1.0 Activated Sludge 5.0 10-100 1000 1.0-2.5 0.1 0.0~10 lInaerobic Digestion 0.2 5-50 1'50-500b 1.0-10 5 ....... 5-10
KJlE: Values determined fran data presented in AW. Table D.l. SDiscs oovered. KJlE: Nultlers within puentheses denote nunber of sanples taken, lDepartment of Health (1981).
see Figure 2 for sanple locations. 'U.S. Envirmnental. Protection l\gency (1979). ~Flat surface area of discs, with discs exposed except as noted. IDivision of wastewater Management (1982). 24 hr canposi te sanple. 'U.S. Envirmnental. Protection 1V:Jeooy (1977). ~ fGrab sanple. ClBexavalent. brrivalent.

22
the City and County of Honolulu's industrial wastewater discharge (1982)
regulations (not awlicable to Fort Kamehameha VMrP) and, as noted in
Table 5, the median values of all the liquid sanples, except iron, were
at or belCM the drinking water regulations. 'Ibere is no drinking water
regulation for nickel, but the liquid median values are quite lCM (maximum
0.2 nw'l). None of the individual sanples (App. Table A.l) for cower and
zinc, and only two forcacinium exceeded the drinking water regulations.
'!he concentration limit established for iron was set because of color
staining of laundered goods and plumbing fixtures, and undesirable tastes
in beverages (U.S. Environmental Protection Agency 1979) • In terms of the
reported potential inhibitory effect on the activated sludge &y'stem, only
cower, lead, and possibly the lCMer threshold range for zinc (a wide band)
exceeded the median respective heavy netal values of Table 5. Neverth&
less, individual slug loads did exceed the threshold limits (see AW. Table D.l) • HCM€'Iler, the high treatment efficiency resulting fran the
activated sludge treatment &y'stem strongly indicates that if heavy metal
inhibition did occur, it was very negligible.
'!he aCClDllulation of heavy netals in the sanples containing higher
suspended and settleable solids concentrations, mixed liquor suspended
solids, and rEM and digested sludge is expectedly awa,rent in Table 5.
'!he median concentration of silver in the mixed liquor suspended solids
is awroximately the same as the digested sludge samples and the median
caanium concentration for rEM and digested sludge is awroximately the
same. But with the exception of nickel, the remaining median heavy netal
concentrations were higher in the digested sludge sanples. '!he nedian con
centration of nickel in the rEM sludge was approximately four times higher
than the digested sludge sanples, the reason for which is not known except
possibly that the concentration of nickel had recently increased in the
rEM sludge, and sufficient time had not elapsed for introduction into the
digested sludge. Further sanpling and analysis would be required to con
finn this hypothesis. Nevertheless, the median concentration of nickel is
still quite lCM. Of the potential heavy metal inhibition to anaerobic
digestion based on the Federal Guidelines (Table 5), only cower, zinc, and
especially iron, exceeded the threshold limit. '!he operation efficiency
of the anaerobic digestor was not within the scope of the project, thus,
anaerobic monitoring parameters were not provided to WRRC for €'Ilaluation.

23
CNerall, hcMever, it is obvious that the introduction of heavy netals into
the wastewater stream leading to the Fort Kamehameha WWTP is being carmend
ably controlled and not of ~rent present concern to the lower concentra
tion wastewater flow stream. It is notable that the median raw wastewater
heavy netal concentration values are very canp:irable (both above and below)
to the values reported ~ Nanura and Young (1974) for an 11-100 study of the
City and County of Honolulu's Wahiawa WWTP which received an average flCM
of 4.54 rna/day (L2 JI9l) fran the tCMn of Wahiawa in central oahu.
me 0lSTS: CAPITAL, OPERATION AND MAINTENANCE
When considering various engineering alternatives, a key element is
the total cost CNer the given deSign period or, expressed differently, the
time value of money. For the present situation a financial estimate is a
necessary aspect that must be e-valuated, among others (e.g., treatment
efficiency, dependability, and aesthetic considerations) when considering
the potential replacement of the present Fort Kamehameha ~ conventional
activated sludge canponent (aeration tank, air blowers, and awurtenances)
with an RBC system.
As previously presented, the pilot RBC unit could uniformally produce,
with hydraulic loadings up to 3.0 gpd/ftZ, an effluent (fran brackish
wastewater) well within the BCDs and SS remCNal and final effluent con
centration range that is considered to be secondary treatment (85% and
30 ngll, respectively). As mentioned earlier in this report, roost
municip:il-sized RBC systems with hydraulic loadings up to 3.0 gpd/ftZ
function quite well in the temperate zone. 'lhus, RBC operations on Oahu,
with daily Dean temperatures always> 55°C (below which the bianass on mc units are inhibited), are expected to perform satisfactorily. For evalua
tion purposes the 3.0 gpd/ftZ hydraulic loading rate will be used for
siz ing purposes.
Final evaluations, in addition to capital cost, can be highly influ
enced ~ projected assumptions, such as interest rate, life of the can
ponent, operation and maintenance cost, and future cost of utilities and
materials. 'lhus, for meaningful projections, assumptions have to be as
reasonable as possible, based on presently available information. Informa-

24
tion obtained for a different time period, at locations other than oahu,
and for different design p:lrameters will have to be normalized to a carmon
technical and econanic base to expedite the evaluation of the alternatives
under consideration. HQtlever, as in any engineering conceptual econanic
evaluation, the presented results have to be considered ~s being aWlicable
CNer a somewhat undefined range (in a p:lrticular magnitude) since a refined
cost analysis, without detailed plans, is not feasible or even possible at
this stage. The results of such an econanic evaluation, hQtlever, should
have a major effect on whether or not further consideration is warranted.
Capi tal Costs
Capital costs for installing a 7.5 ngd RBC treatment canponent at the
Fort Karnehameha iW1.l'P, obtained fran four different sources, are presented
in Table 6. The cost data were updated to August 1986 by using the Engi
neering News-Record Construction Cost Index <1985, 1986) 1 where awlicable@
'!he design flow values were cbtained for or adjusted to 7.5 ngd average
wastewater flow. No scaling factor was used because an estimated 80% of
the RBC canponent cost (less freight) consisted of relatively canplete
manufactured items. A freight allowance fran the u.s. west Coast to oahu
of $285 ,000 was added to the final figures after each hydraulic loading
rate was adjusted to 3.0 gpdIft2• No credit was allotted for potential
salvage of the existing activated sludge treatment canponent (such as air
blowers, piping) and, in turn, no expenses were assigned for its demoli
tion.
As can be noted, the first two sources (Table 6) of cost data are fran
the Envirex Compa~ (controllers/owners of Aerotrol Corporation); the last
two are fran u.s. Enviromnental Protection Agency (l980a, 1 980b) publi
cations, based on a collection of anpirical data fran operating WWTP plants
up to the mid-1970s. '!he u.s. Envirormental Protection Agency (l980a;
third cost source of Table 6) did not include a hydraulic loading rate,
thus, a prorated value was not determined. '!he fourth cost data source
(U.S. Envirormental Protection Agency 1980b) was based on a conservative
hydraulic loading of 1.0 gpd/ft2 with several additional cost items added
lConstruction costs obtained fran u.s. Engineering News-Record 214(l2) : 98-101 (1985); Engineering market trends, Engineering News-Record 217 (7) : 37 (1986) •

TABLE 6. CAPITAL <n)T CDMPARISCNS FOR mo:rosm 7.5 KiD RBC CDMPONENT FOR FORT KAMEHAMEHA WWI'P, PEARL HARBOR, HNiAII
25
HYDRAULIC LOADINi RATE ~anically Air-Driven
Driven Discs Discs (gp:l/ft') ($1000) ($1000)
Envirex Co. design for Hcnouliuli lttWl'P adjusted fran 25-7.5 ngd (see AW. Table E.l for details) 2.4
PRCRATED 3.0 2,0656
Autotrol Design Manual 3,300a ,f Example <Autotrol 1983) 2.0
(see AW. Table E.2, examples 4 & 17 for details) 2.1 2,562a ,f
PRrnATED 3.0 2,53ab,f
EPA Construction Cost Unspecified; 5,341a ,c-e Manual (U. S. EPA 1980a) assumed <3.0
NO!' mORATED (unknown hydraulic loading)
EPA C'.anponent Costs l3,893a ,d (0. S. EPA 1980b) 1.0
PRrnATED 3.0 4,916b
IDlE: Potential salvage value for existing activated sludge treatment canponent and costs for demolition were excluded. mc costs are for Wlcovered Wli ts.
~cludeS freight costs to oahu. clncludes $285,000 freight dlarges fran u.s. west coast to oahu. ,;Assumed to be mechanically driven discs. ~O% added to estimated 20% of nOl'lIlanufactured canponents for construction and assent>ly on Oahu. ~O% added for nonconstruction costs recatmended by EPA <1980b).
Includes present worth of p:YNer costs; no additional cost assigned for gconstruction on Oahu. Adjusted by Engineering News:-Record <1985, 1986) to August 1986 where aw1icab1e.
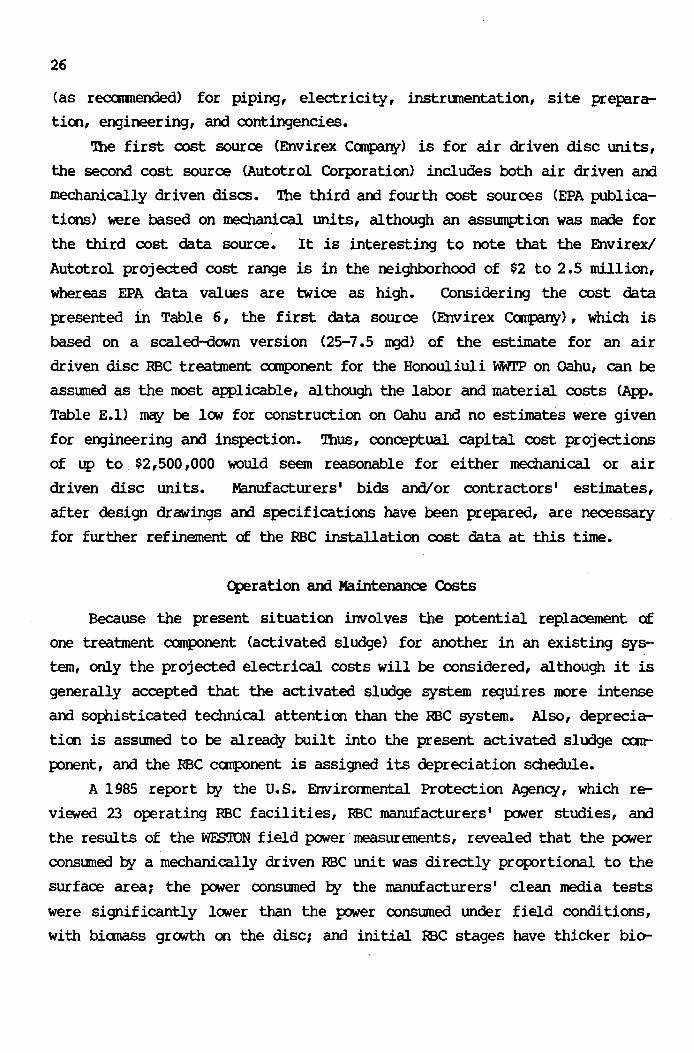
26
(as reccmnended) for piping, electricity, instrlJIlelltation, site prepara
tim, engineering, and contingencies.
'nle first cost source (Envirex~) is for air driven disc W'lits,
the second cost source <Autotrol Corporation) includes both air driven and
mechanically driven discs. '!be third arx1 fourth cost sources (EPA publica
tions) were based on mechanical W'lits, although an assumption was made for
the third cost data source. It is interesting to note that the Envirexl
Autotrol projected cost range is in the neighborhood of $2 to 2.5 million,
whereas EPA data values are twice as high. Considering the cost data
presented in Table 6, the first data source (Envirex ~), which is
based on a scaled-down version (25-7.5 ngd) of the estimate for an air
driven disc RBe treatment canponent for the Honouliuli WWl'P on oahu, can be
assumed as the roost appl icable, although the labor and material costs (App.
Table E.l) may be lCM for construction on oahu and no estimates were given
for enJineering and inspection. Thus, conceptual capital cost projections
of up to. $2,500,000 would seem reasonable for either mechanical or air
driven disc units. Manufacturers' bids and/or contractors' estimates,
after design drawings arx1 speCifications have been prepared, are necessary
for further refinement of the RBe installation cost data at this time.
cperation and Maintenance Costs
Because the present situation invol ves the potential replacement of
one treatment canponent (activated sludge) for another in an existing sys
tem, only the projected electrical costs will be considered, although it is
generally accepted that the activated sludge system requires more intense
arx1 sophisticated technical attention than the RBe system. Also, deprecia
tim is assumed to be already built into the present activated sludge can
ponent, and the RBe canponent is assigned its depreciation sdledule.
A 1985 report by the u.s. EnviroIJIIental Protection Agency, which re
ViEWed 23 operating RBe facilities, me manufacturers' power studies, and
the results of the WES'lON field power measurements, revealed that the power
consumed by a mechanically driven RBe unit was directly proportional to the
surface area; the power consumed by the manufacturers' clean media tests
were significantly lCMer than the pc7tler consumed under field conditions,
with bianass grCMth on the disc; and initial me stages have thicker bier

27
mass which consumes more power and can lead to septic conditions (particu
larly in the initial stages of a multi-stage system) for mechanically
driven units (SUWlanental air may be required).
Mechanically driven disc unit's power consumption py standard
(l00 ,000 ft I) and high-densi ty roodia shafts (ISO ,000 ft I) at rotational
speeds of 1.6 rpn were ct>served in the field to be 2.3 and 3.4 kWh/shaft,
respectively; whereas air driven discs, with canbined standard- and high
density media shafts, rotating at 1.2 rpn, required 3.6 kWh/lOO,OOO ft Z
shaft. It should be noted that the <1Verall power consumption for mechani
cal driven units are essentially the same as their respective areas and
power consumption (100,000 ftl:lSO,OOO ft l .., 2.3 kWh:3.4 kWh).
Based on the foregoing a mechanically driven RBC disc facility, loaded
hydraulically at 3.0 gpd/ft Z and treating 7.5 ngd of primary treated waste
water, would consume $SO ,000 worth of electricity if the electrical cost
were 10¢/kWh, whereas, an air-driven unit would require $79,000 of electri
city under the same given conditions, (rounded off to the nearest $1000)
(0. s. Env irormental Protection Agency 1985). Interestingly, the $7 9 ,000
electrical costs for an air driven RBC facility is nearly identical (well
within $1000) to the electrical cost projected py the Envirex CQIlpal¥ (AW. Table E.l) for the 25 ngd Honouliuli ww.rP on oahu, if adjusted to a 7.5-ngd
facility at a 3.0 gpd/ft Z hydraulic loading.
'!he present aeration ba.sin at the Fort Kamehameha WWTP is sUfPlied air
fran three air blCMers, each driven by a 125-hp motor, operating 24 hr/day.
At an electrical cost of 10¢/kWh, the annual power cost for the three
blCMers (375 hp) is equal to $245,000. Again, this value is the same as
was projected for a CCJ'I'IP=irison activated sludge system (sul:merged turbines)
by Envirex Canpany (App. Table E.l) for the 25 ngd Honouliuli ww.rP if the
flow rate were adjusted to 7.5 ngd.
As previously stated, only the electrical cost differential between
the present activated sludge system at Fort Kamehameha WWTP and the re
placement of the aeration basin by a mc component will be considered.
Because of the uncertainties of future electrical costs, its ba.se cost will
be assumed to be 10¢/kWh with increases of 5% per year for a 15 yr canpo
nent life which should be a conservative projection. However, the close
proximity of the ocean tends to deteriorate products made of metal; thus, a
15 yr projected life may not be out of line, although plastics are heavily
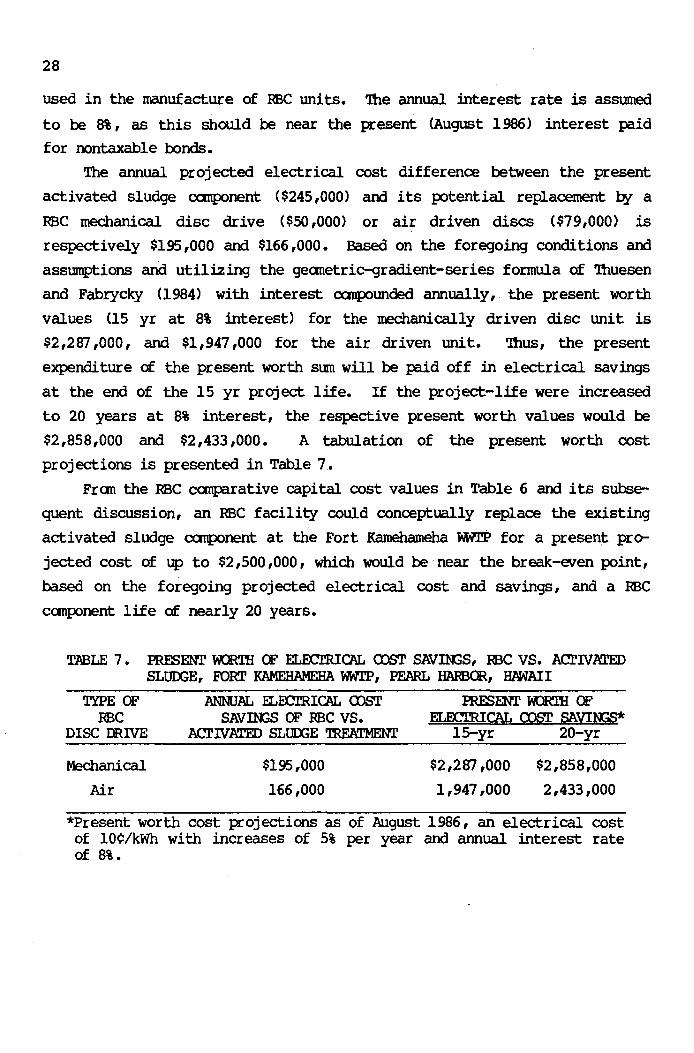
28
used in the manufacture of RBC units. '!he annual interest rate is assumed
to be 8%, as this should be near the present (August 1986) interest paid
for oontaxable bonds.
The annual projected electrical cost difference between the present
activated sludge canponent ($245,000) and its potential replacement by a
RBC mechanical disc drive ($50 ,000) or air driven discs ($79,000) is
respectively $195,000 and $166,000. Based on the foregoing conditions and
assumptions and utilizing the geometric-gradient-series formula of '!huesen
and Fabrycky (1984) with interest canpounded annually, the present worth
values U5 yr at 8% interest) for the mechanically driven disc unit is
$2,287 ,000, and $1,947,000 for the air driven unit. '!hus, the present
expendi ture of the present worth sum will be paid off in electrical savings
at the end of the 15 yr project life. If the project-life were increased
to 20 years at 8% interest, the respective present worth values would be
$2,858,000 and $2,433,000. A tabulation of the present worth cost
projections is presented in Table 7.
From the RBe canparative capital cost values in Table 6 and its subse
quent discussion, an RBe facility could conceptually replace the existing
activated sludge canponent at the Fort Kamehameha WWTP for a present peojected cost of up to $2,500,000, which would be near the break-even point,
based on the foregoing projected electrical cost and savings, and a RBe
canponent life of nearly 20 years.
TPBLE 7. !'RESENT rtami CF ELECl'RICAL (l)ST SAVDl1S, RBe VS. ACl'IVATED SLtJOOE, FORT KAMEHAMEHA WWTP, PEARL HARBOR, HAWAII
TYPE OF ANNUAL ELECrRICAL Q)ST mESENT ~ CF RBC SAvm;s OF RBe VS. ELOCTRICAL c:osr SAVIN:iS*
DISC DRIVE ACl'IVATED SLUOOE 'lREATMENI' l5-yr 20-yr
Mechanical
Air
$195,000
166,000
$2,287,000 $2,858,000
1,947,000 2,433,000
*Present worth cost projections as of August 1986, an electrical cost of 10¢/kWh with increases of 5% per year and annual interest rate of 8%.

29
<DNCLUSIONS
'!he pilot RBe unit, located at the Fort Kamehameha WW1'P am operated
with sane shutdowns for influent p.!Ilp malfunctioning fran July 1985 to July
1986, was prograrrmed to receive four different hydraulic loadings and/or
exposed and covered disc modes, namely 1.5, 3.0, am 5.0 gpd/ft Z (flat disc
area) with discs exposed, and 5.0 gpd/ft Z with discs covered. '!he analyti
cal results for BOOs and suspended solids (SS) at the initial loading of
1.5 gpd/ftZ shCMed very high treatment efficiency, with respective median
BOOs and SS effluent concentrations of 2.0 and 8.0 mgll am corresponding
median removal efficiencies of 98 am 97% (Table 3). The efficiencies for
this loading rate were quite similar to the efficiencies of the present
WWTP operation which uses activated sludge treatment. The treatment effi
ciency of the second hydraulic loading rate (3.0 gpd/ftZ) was not as high
as the initial loading, but still quite high for secondary treatment, with
respective median effluent values of 8.3 am 7.5 for BOOs and SSe
'!he treatment efficiencies of the third and fourth operational test
modes decreased significantly for the 5.0 gpd/ftZ hydraulic loading rates
for exposed and covered discs, respectively. '!he median BOOs values
were 30.7 and 35.0 mgll while the corresponding SS values were 26.5 and
28.0 mgll. Such efficiencies may be accepted for secondary treatment since
the RBe system is an attached grCMth system, hCMever, efficiencies in this
range fran a pilot unit would have to be considered marginal when project
ing to a full-scale treatment operation.
'!he operation of the pilot RBe unit at Fort Kamehameha ~ (utilizing
primary clarifier effluent as its input) proved that aR;>arently no par
ticular inhibiting grCMth factors occurred during its operation and no
aesthetic proolems (such as odors am flybreeding) were observed or
reported. The unit appeared to function at awroximately the same effi
ciency range as reported in the literature and/or by manufacturers' deSign
manuals. Indications are that a REC canponent could function at the Fort
Kamehameha WWTP, in replacement of the present activated sludge oamponent,
at a hydraulic loading rate of 3.0 gpd/ftz. Ambient tetr{)eratures belaY
55°F tend to inhibit the REC's biological grCMth on the discs, but since
oahu's average daily tenq?erature is always above this value, concern for
this aspect is eliminated.

30
'lWo cautions should be noted when evaluating the data. One, the sur
face area of the discs were considered flat, thus, areas around the 0pen
ings in the disc were not considered since the bianass on the discs tends
to grow aver these openings and to thereby approximate a flat surface.
Nevertheless, if sane additional area around the openings were considered
(e.g., an additional 10 to 15%), the indicated hydraulic loading would
reduce accordingly. 'lWo, as the flow rate decreases, the difficulty of
holding it at a constant low flCM rate increases due to plugging aOO/or
throttling down the flCM. Thus, the scheduled flCM rate for the initial
hydraulic flCM rate (1.5 gpd/ft2) may have actually averaged slightly lCMer
and tended to make it aR?ear to have a higher treatment efficiency. HeM
ever, this latter aspect is only speculation.
The 7.5 ngd Fort Kamehameha ~ which uses activated sludge secondary
treatment and presently handles an average flCM of 5 to 6 ngd, a~rs to
be extremely efficient in terms of BCD 5 and SS reJIlOllal and lCM effluent
concentrations, based on analytical data cbserved fran July 1985 to July
1986. Wastewater entering the m7.rP is highly brackish (4,000-5,000 rrgll
chloride) and is re};X>rted to include industrial discharges that contain
concentrations of heavy netals, although such wastewaters are sUtp:>sed to
be controlled aOO/or treated before discharging into the ra!tl wastewater
flow.
'!he monitoring of an array of heavy netals (Table 5) over the pre
viously nentioned 12-100 period fran sarcples of ra!tl wastewater, primary
clarifier effluent, secondary clarifier effluent, and final effluent,
revealed very lCM concentrations of heavy netals. sane heavy netals,
notably cower and zinc, were even belCM drinking water regulations.
Sanples with higher suspended and settleable solids (activated sludge
mixed liquor suspended solids, and the ra!tl and digested sludge) had higher
aca.unulated concentrations, as expected, but they should be of no particu
lar concern if dis};X>sed properly in a landfill.
Based on the results of the pilot RBC unit and cost data rotained fran
various sources and reasonable assumptions, it is projected that an RBC
canponent could replace the present activated sludge unit at the Fort
Kamehameha WWl'P for a capital cost approaching $2,500 ,000, if the loading
for the RBC facility were approximately 3.0 gpd/ft 2. Since this is a can
};X>nent replacement in a presently operating system, only the differential

31
projected electrical cost savings will be considered, which are calculated
to be $195,000 and $166,000, respectively, for RBC mechanically driven disc
units and air driven lD'lits. utilizing an electrical cost of 10¢/kWh with
5% increases per year and an 8% interest rate canpOlmded annually, the pro
jected present worth for a l5-yr period would be $2,287 ,000 and $1,947,000
for mechanically driven discs and air driven discs, respectively, while
for a 20-yr period these respective values increase to $2,858,000 and
$2,433,000. Fran these projections it a~ars that the potential repla~
ment of an RBC canponent for the existing activated sludge canponent could
be considered near the break-even point in terms of electrical savings for
the given assumptions.
Special awreciation is extended to Joe Hanna, Superintendent, Fort
Kamehameha Wastewater Treatment Plant and his persormel for their coopera
tion, technical assistance, installation of e:;{uipnent, collection of waste
water samples, and arrangements for the performance of chemical analyses.
We wish to thank Michael Croston, representative for OIS Rotordisk Inc.,
Mississauga, Ontario, canada, for arranging the no-cost use of the pilot
RBC unit (the Rotorooic System). '!he projected RBC capital costs and oper
ation and maintenance costs provided t¥ Albert Tsuji, with M.C. Nottingham
of Hawaii, Ltd., were very useful and deeply awreciated.
REFEREtU.S CITED
American Public Health Association, American water Works Association, and Water Pollution Control Federation. 1985. standard nethods for the examination of water and wastewater. 16th ed. Washington, D. C. : AmA, MiMA, and WPCF.
Antonie, R.L.; Kluge, D.L.; and Mielke, J.H. rotating disk wastewater treatment plant. 46(3):498-511.
1974. Evaluation of a water Pollut. Control Fed.
Autotrol Corporation. 1974. BIo-SURF process package plants for secondary wastewater treatment. Brochure No. 974-1.1.2, Milwaukee, Wisconsin.

32
Autotro1 Corporation. 1983. waste treatment systems design manual. Bi<rSystems Division, Milwaukee, Wisconsin.
Bi<rShafts, Incorporated. lfJ77. Rotating biological discs. (Broc:hure)
Birks, C.W., and Hynek, R.J. 1971. Treatment of cheese processing wastes by bio-disc process. In PrOCH 26th Purdue Wustrial waste Conf. at Purdue University, 26:89-105.
Davies, T.R., and Pretorius, W.A. 1975. Denitrification with a bacterial disk unit. water Res. 9:459.
Department of Health. 1981. Potable water systems. In Title II, Administrative Rules, chap. 20, State of Hawaii, Honolulu, Hawaii.
Division of Wastewater Management. 1982. Revised ordinances of Honolulu, 1978, as amended, relating to sewers. In Industrial wastewater Discharge Provisions, chap. 11 (1969), Department of Public Works, City and County of Honolulu.
Dugan, G.L. 1983. "Upgrading municipal effluent by pulsed-bed filtration: Sand Island Wastewater Treatment Plant, oahu, Hawaii." Special Rep. 6:13:83, water Resources Research Center, University of Hawaii at Manoa, Honolulu.
Dugan, G.L. 1984. "Rotating biological contactor for brackish wastewater effluent treatment." Special Rep. 3:12:84, water Resources Research Center, University of Hawaii at Manoa, Honolulu.
Engineering-Science, Inc. 1977. ~ration and maintenance manual, Fort Kameharneha Wastewater Treatment Facilities, Pearl Harbor, Hawaii. Report prepared for the Naval Facilities Engineering Command, Pacific Division, PNFEC Library, Bldg. 258, Makalapa, Pearl Harbor, Hawaii 96860.
Giambelluca, T.W.; Nullet, M.A.; and Schroeder, T.A. 1986. Rainfall atlas of Hawaii. Rep. IG6, Division of Water and Land Developnent, Department of Land and Natural Resources, State of Hawaii (prepared by Water Resources Research Center, University of Hawaii at Manoa, Honolulu). 267 W.
Griffith, G.T. 1978. "Rotating disc treatment systems for suburban developnents and high density resorts in Hawaii." Master's thesis (Civil Engineering), University of Hawaii at Manoa, Honolulu.
Griffith, G.T.; Young, R.H.F.; and Chun, M.J. 1978. Rotating disc sewage treatment systems for suburban developnent and high-densi ty resorts of Hawaii. Tech. Rep. No. 116, Water Resources Research Center, University of Hawaii at Manoa, Honolulu.
Nanur a, M. M., and Young, R. H. F • 197 4. Fate of heavy metals in the sewage treatment process. Tech. Rep. No. 82, Water Resources Research Center, University of Hawaii, Honolulu. 26 W.

33
Pescod, M.B., and Nair, J. V. 1972. Biological disc filtration for tropical waste treatment. water Resour. Res. 6: ISO 9-23.
Tsuj i, Audrey. 1982. "A mWlicip:U. wastewater treatment process - Rotating biological conductors CRBC). " Directed Research Report (CE 699), Department of Civil Engineering, University of Hawaii at Manoa, Hcnolulu.
u.s. Environnental Protection Agency. 1977. Federal guidelines state and local pretreabnent prOCJress. Tech. Rep. M<D-43, EPA:-43 01 9-7 0-017 a, Construction Grants Program, Municipal Construction Division, washington, D.C. 20460.
u.s. Enviromnental Protection Agency. 1978. Analysis of o~ration and maintenance costs for municip:U. wastewater treabnent systems. Tech. Rep. MOr-39, EPAl430 9-77-015, Office of Program Operations, washingtoo, D.C. 20460.
u.s. Environmental Protection Agency. 1979. National secondary drinking water regulations. EPA-570/9-76-o00, Office of Drinking Water, Washington, D.C. 20460. 37 pp.
U.S. Enviromnental Protection Agency. 1 980a. Construction costs for municipal wastewater treabnent plants: 1973-1978. Tech. Rep. FRD-l1, EPA 430/9-80-003, Facility Re;;{uiranents Division, Washington, D.C. 20460.
u.s. Envirol'JIlental Protection Agency. 1980b. Innovative and alternative technology assessment manual. CD-53, Office of Water Program Operations (WH-547), Washington, D.C. 20460.
u.s. Enviromnental Protection Agency. 1981. Operation and maintenance costs for municip:U. wastewater facilities. Tech. Rep. FRD-22, EPA 430/9-81-004, Facility Re;;{uirements Division, Washington, D.C. 20460.
u.s. Environnental Protection Agency. 1984. T.F. (fixed media) plants now only r8:'Iuired to meet <45 ng/l BCDs/SS unless they are presently meeting lCMer values. Fed. Reg., pt. 11,40 CFR, pt. 122, NPDES, vol. 49, 00. 49, p. 37708 (20 Sept. 1984).
u.s. Envirormental Protection Agency. 1985. Review of current mc performance and design procedures. EPA/600/S2-85/033, water Engineering Research Laboratory, Cincinnati, Ohio 45268.
Victor, D.H. 1975. "Evaluation of a rotating disc unit for the treabnent of municip:U. wastewater." Master's thesis (Civil Engineering), University of Hawaii at Manoa, Honolulu.
water Pollution Control Federation and American Society of Civil Engineers. 1977. Wastewater treatment plant design. Landcaster, Pennsylvania: Landcaster Press.
Wells Corporation. 1980. "The rotorroic system, total on-site sewage treatment" (brochure) • 653 Manhatten Beach Boulevard, Suite I, Manhatten Beach, Cal ifornia 90266.

APPENDIX <DNl'ENTS
. . . . . . ~ WWTP DeSign Criteria. •
B. Pilot mc Brochure. . . . . . . . . . . . . . . . . . . . C. Chemical Analyses. . . . . . . . . . . . . . . . . . D. Heavy Metal Analyses. • . . . . . . . . . . .
E.l. Capital Costs and Operation and Maintenance Expense. . . E.2. Examples of mc Sizing, Capital and Operation Costs
35
37
• • 41
• • •• 47
• • •• 59
69
for a Design Flow of 7.5 ngd, by Autotrol. Corporation. • • • • • 81
Appendix Tables
A.l. Fort Kamehameha Wastewater Treatment Plant.
C.l. O1emical Analyses and Performance Characteristics of Pilot RBC Unit and Overall Treatment Plant,
• • • • • • • • 39
Fort Kamehameha M'lI'P. • • • • • • • • • • • • • • • • • • • • • • 48
D.l. Heavy Metal Concentration at Various Locations Throughout Fort Kamehameha M'lI'P • • • • • • • • • • • • • • • • • 61

37
APPENDIX A. \tM.l'P DESIGN OUTERIA

39
APPENDIX TlIBLE !rl. FORT KAMEHAMEHA WASTEWATER 'IREATMENl' PLAN!' DESIGN CRITERIA
Influent Characteristics
Average Design Dry Weather Flai, rrgd Average Peak Wet Weather Flai, rrgd Instantaneous Peak Flai, rrgd Total Dissolved Solids, ng/l Suspended Sol ids, rIg/I BCDs Concentration, ng/l
HeaCiworks
NJmber of Barminutors Capaci ty of Each Barminutor, rrgd Barminutor Size, in.
Aerated Grit Chambers
N.Jnber of Units Length x Width x Depth per Basin, ft Total Volume, gal Detention Time, min Air SUWly Capacity, ftl/min
Prirna(y Settling Tanks
NJmber of Units Diameter x Depth, ft Total Volume, gal Surface Loading Ar1IlF, gpd/ft2 Weir Overflai Rate Ar1IlF, gpd/ft Detention Time All'JF, hr
Aeration Tanks
Number of Tanks Total Volume, gal Hydraulic Detention Time, hr BOOs Loading, Present Conditions, lb/day MLSS, ng/l Organic Loading, lb BOOs/lb MLVSS • day Air ReqUirement, cfm
saJRCE: Engineering Science Inc. (lfJ77). *Assumed to be one magnitude too high.
7.5 16.0 23.0
75,000* 240 240
2 15 36
2 16.5 x 10 x 8.6 SWD
21,300 4.1
350
2 80 x 9 SWD
679,000 747
14,960 2.2
6 2,6fJ7 ,000
8.6 4,400
700-1,500 0.25
6,960

40
APPENDIX TiWLE h-l.-COntinued
Secondary Clarifiers
~r of Units Diameter x Depth, ft Total VolllI1e, gal Surface Loading at AIl'lF, gpd/ft2 Weir CNerlflQri Rate at ArklF, gpd/ft Detention Time, hr
Chlorine Contact Tank
Number of Chlorinators Capacity of Each Chlorinator, lb/day Estimated Ollorine Feed Rate at
AIl'lF, lb/ day Basin Volume, gal Detention Time at :EWWF, min Detention Time at AIl'JF, min
Anaerobic Digesters
N.Jnber of Units Diameter x Depth, ft Total Volume, ft 3
Organic Loading, lb VMlft3/day Volatile Solids, lb/day Detention Time at 2% Solids, day
Centrifuges
NlInber of Units Bowl Length x Diameter, in. Solids Feed Cap:tcity of Each Unit, lbIhr Capacity of Each Feed Plm1p, gpn Dewatered Sludge Cake Moisture Content, %
Sludge DrYing Beds
a.md:ler of Beds Total Area, ftl
Effluent Punping System
NJmber of Pump:; Capacity of Each Pump, gpn
3 80 x 9
1,018,000 500
9,970 3.26
2 2,000
625 182,400
16.5 35
2 75 x 18
155,300 0.10
7,500 22
2 72 x 36
1,000 100
25
3 6,000
3 8,000

41
APPENDIX B. PILOl' me BKXEJRE

43
THE ROTOROBIC SYSTEM TOTAL ON-SITE SEWAGE TREATMENT
. EFFICIENT AEROBIC PROCESSING THROUGH THE SIMPLICITY OF RBC TECHNOLOGY RELIABLE PERFORMANCE UNMATCHED BY ANY OTHER RESIDENTIAL SEPTIC OR MECHANICAL SEWAGE TREATMENT SYSTEM. .
NO PUMPS. NO FILTERS. NO COMPRESSORS.
Y#elles CORPORATION ... in lhe Hycor tradillon 01 englOeiJring ellcellenCB.

44
THE ROTOROBle SYSTEM:
EFFECTIVE, RELIABLE WASTEWATER PROCESSING SPECIFICALLY ENGINEERED FOR RESIDENTIAL AND COMMERCIAL USE. The Rotoroble system Is a compact, mechanical sewage treatment process specifically engineered for Individual homesltes and light commercial duty. When sewer service is not practical, or a septic tank Is not feasible, the Rotoroblc system Is a proven and reliable alternative.
The Rotorobic system uses the patented Rotordlsk™process developed by CMS Equipment, Ltd., Canada. The Rotoroblc processor is the only CMS/Rotordlsk'"unlt available In the United States for residential and small business use.
The Rotorobic process is a major departure from other approaches to on-site wastewater treatment. The Rotorobic system Is an unusually reliable and powerful aerobic sewage treatment unit used in conjunction with an ordinary filter bed or leach field.
The aerobic unit Itself is built around a simple and highly dependable sewage processor known to engineers as an RBC, or Rotating Biological Contactor. RBC units have long been used In central municipal sewage plants. Now, this proven, limetested technology Is available for home and small business applications. The Rotoroblc processor is the only RBC system currently available that Is specifically designed for residential applications up to 1000 gallons per day.
Unlike complicated extended aeration devices, the Rotorobic processor employs no pumps, filters, or compressors that can leak, clog, Or fail. The Rotoroblc RBC mechanism has few moving parts, making it Inherently simple and trouble·free. Output from the unit meets or exceeds EPA standards for secondary quality effluent. Equally important, the Rotorobic processor will continue to meet these standards under sudden overload or persistent underflow conditions.
WHEN A SEPTIC SYSTEM CAN'T DO THE JOB, THE ROTOROBIC PROCESSOR MEETS THE CHAUENGE: • Improper soil conditions. • High groundwater tables. • little or no soil over the bedrock. • An older leach field has become clogged. • Geological condillons cause polluted
effluent to be returned to tht! local groundwater.
• Site too close to lakes and streams. • Space limitations do not allow for an
adequate leach field.
EVEN IN AREAS WITH SEWER SERVICE, THE ROTOROBIC SYSTEM IS AN ECONOMICAL ALTERNATIVE WHEN: • Construction of a connector line to the
sewer main Is too expensive. • Sewer connection charges are prohibitive. • Effluent Is subject to expensive sewer
surcharges. • Pre-treatment of effluent Is needed to
meet minimum standards for discharge to the local sewers.
The Rotoroblc processor removes more than 90% of the organle pollutants from the wastewater, leaving less than 10% of the job to be done In the leach field. Because so much of the sewage breakdown occurs within the unit Itself, even under extreme condilions, an effective, reliable treatment system can be designed.
The output of the Rotoroblc unit is so clean, many applications require only a sub-surface or above-ground filter bed of properly selected sand. Poor soil conditions, high groundwater, or shallow soill<iyers are no problem for the Rotoroblc system.
The Ideal alternative to septic tank technology In new construction, the Rotoroblc processor is also an economical long-term repair for old or failing septic systems. In addition to slgnlfleantly relieving the load on an aging leach field, Rotoroblc ou tfIow actually reverses tile field deterioration and Improves the porosity of the soil. If used to pre-treat wastewater before discharge to the local sewer system, the Rotoroblc unit pays for itself In reduced municipal surcharges.
POWERFUL RBC PROCESSING In organic waste treatment, aerobic biological reactions (those that take place In the presence of oxygen) are far more vigorous and efficient than anaerobic or septic reactions (those that take place In the absence of oxygen.) Thus, aerobic sewage treatment proceeds much more rapidly and purifies far more completely than septic treatment.
The superiority of aerobic processing and the mechanical simplicity of Rotorobic RBC technology make the Rotorobic system dramatically different from any other residential septic or mechanical sewage treatment process.
Within the self-contained Rotoroble processor colonies of microorganisms (naturally present In domestic wastes) grow on Rotoroble's BloMesh TM media discs. A small electric motor slowly rotates the half· submerged discs through the wastewater. This alternately exposes the biomass to the sewage and to the air, continually aerating the microorganisms to sustain the aerobic process and promote the efficient breakdown of the organic pollutants. This simple, yet effective mechanism Is the key to the Rotoroble processor's trouble-free record of reliable service proven In hundreds of Installations.
QUALITY COMPARISON OF ON·SlTE WASTE TREATMENT UNITS
oum.ow CtiARACTEfMTIC
IOOt"",}1
S5rno}1 DOInG}I
ANAEAOBtC UNITS'
TYPICAl SEPHCTANK
100
"'" AEROIIC UNITS'
,,. .. OUTflOW NSF ClASS tl'[ NSF Cl.A6S" [!2!~C; CHARACTEmsTlC rno.n..~
8O~~JI eo 20 20 SSIflQJI lOO 40 26
Noo.e.,ClIT~_ .... IfOOII_.t .. ., ... 1lI~s--t.,_~_c ... I>4 ____ ._c ..... ~. 1lI_"' ___ lO __
CONSISTENT, DEPENDABLE PERFORMANCE Rotoroblc's RBC technology is remarkably dependable. The process Is selfcompensating over a wide range of fluctuating demands. Rotorobic Is a particularly tough performer under "shock loading," a sudden sharp Increase In the organic workload. Unlike some systems, Rotoroblc wiU continue to perform properly despite repeated cycles of underflow or overload (25-400% of design flow) with little or no adverse effect on effluent quality.
ROTOR ZONE
PRtMARY SETTUNG CHAMBER One-plecB molded fiberglass outer shell.
Mokted fiberglass Inner tank. Exclusive Splro·How'·wairlng assures maximum flow contact with the bkHnass
ROTOR BEARINGS Aircraft·quallty, heavy·duly. Sealed against moisture.
CHAIN COUPLtNG
FINAL SETTLING CHAMBER

TYPICAL INSTALLATION
CROWN TO DIVERT SURFACE WATER 1·2%. TOPSOIL, PLANT WITH GRASS
018'
4' ASS OR PVC PERF. DlST. PIPE
'SLOPE OF FEED PIPE TO FACILITATE MIN. FLOW VELOCITY OF APPROX. 2 F.P'S. WITH GRAVITY DISCHARGE
ENERGY EFFICIENT. EASY TO MAINTAIN Designed to run continuously, Rotoroblc's low rpm and steady surge·free operation assures extremely long life and low energy costs, typically less than IOC per day. Many years of trouble·free performance are engineered Into each Rotoroblc unit. All components are selected for extra·long life and heavy-duty service.
There are no pump., compressors, valve., micro·computers, or electronic control. to fall. Rotorobic has no screens, diffusers, or filters to clog-or clean. There are no exposed gears or submerged parts to corrode; all components are above the waterline. In addition, the unit produces NO flammable gasses, and NO odor.
MEDIA PANELS Polyethylene Bio"'~shT"'panel& provide optimum biomass retention and flow-through
DRIVESHAFT ASSEMBLY AII·steel construction. All metal parts cadmium plated for couosion protection.
SCUM BAFFLE
Unit Illustrated: Rotoroble 750
POWER CONSUMPTION COMPARISON
TREATMENT WAnS/PERSON/DAY TECHNOLOGY Oillused Air 166
Mechanical Aeralion 93 Ditch Lagoon Aeration ., ROTOROBICTtI Processor 20
Totally enclosed and vibration-free, the Rotorobic processor Is Virtually noiseless. The lightweight fiberglass top Is completely removable for easy servicing. In the rare Instance that replacement parts are needed, all Items are standard off·the-shelf Industrial components always available from your local Rotoroblc dealer. But with no pumps to prime, no required "dosing" with bacteria, and no "mixed liquor/suspended solids" ratios to worry about, the Rotoroblc processor Is practically maintenance free. Twice a year, • your Rotorobic dealer will perform a routine service check, and when necessary, pump out the accumulated sludge. • (Recommended service Interval. Local regulations may differ.'
This Is all the servicing normally needed to Insure trouble-free, reliable performance unmatched by any other mechanical sewage treatment system.
35 years of successful RBC technology and the Welles Corporation commitment to products of unparalled excellence In engineering and design make the Rotorobic system the sensible choice over other waste treatment methods. Solid warranties and a dedication to local alter-sales service further guarantee dependable, worry-free operation year after year.
ROTOROBIC FEATURES
• A TOTAL WASTEWATER TREATMENT PROCESS
• HIGHLY EFFECTIVE
• DEPENDABLE RBC TECHNOLOGY
• SIMPLE, TROUBLE-FREE DESIGN
• PROVEN IN THE COLD
• EXTREMELY LOW MAINTENANCE
• ENERGY-EFFICIENT, ECONOMICAL OPERATION
• EASILY HANDLES SUDDEN OVERLOAD OR UNDERFLOW
• WIDE RANGE OF APPLICATIONS
• WORKS WHERE OTHER SYSTEMS CAN'T DO THE JOB
• IDEAL FOR LONG TERM REPAIR OR RETROFIT
• READILY INSTALLED AND SERVICED BY YOUR LOCAL DEALER
• ENVIRONMENTALLY RESPONSIBLE
• HEAVY-DUTY, LONG LIFE COMPONENTS
• NO SUBMERGED PARTS
• NO COMPLICATED COMPRESSORS, COMPONENTS, OR ELECTRONIC CONTROLS
• NO FILTERS TO CLOG OR CLEAN
• SELF-CONTAINED, TOTALLY ENCLOSED
• NOISELESS, ODORLESS, AND VIBRATION-FREE
• CAPACITIES TO 1000 GALLONS PER DAY
• PRODUCES NO FLAMMABLE GASSES
45

46
ROTOROBIC/ROTORDISK SYSTEMS ARE INSTALLED AND OPERATING IN THESE VARIED APPLICATIONS:
• Residential Housing • Commercial Establishments • Condominiums • Shopping Malls • Cluster Housing • Restaurants • Apartments • Parks and Campgrounds • Nursing homes • Golf Courses • Vacation homes • Sports Cen"ters • Hotels and Motels • Rest Stops • Mobile Homes • Logging and Construction Camps
Units with capacities over 1000 gal./day are available under the name Rotordisk™from CMS Equipment, Ltd., Canada. Consult your dealer.
,. f .,
TREATMENT DRY Model No. CAPACITY WEIGHT
(giJ.IJday) llbs .)
ROTOROBtC 500 500 400
ROTOROBtC 750 750 700
ROTOROBtC 1000 1000 BOO EXTERNAL CONNECTIONS: 4 - d,am. ASS ELECTRIC MOTOR; Slngl. PIl ... 110.. 60 eyel.
UNIT HEIGHT
• 68
59
59
·unlt wldlh (g) moasured al shoulder helghl (e)
TECHNICAL DATA UNIT DIMENSIONS ~nch .. )
BURIAl. SHOULDER EFFLUENT INFL.UENT DEPTH HEIGHT WATERLINE WATERLINE
b c d . 60.5 43.5 33 35
47 40 30 32.5
47 40 30 32.5
Available Options • Lightweight concrete outer shell • Solar power package • Trouble alarm • Chlorinator for treating final effluent • Extended warranty • Financing
SLUDGE STORAGE
UNIT UNIT PRIMARY FINAL L.ENGTH WIDTH 4(:u. It ,) (CU . II .) I g'
59 69 16.9 2.9
71 88 23.4 4.0
71 88 23.4 4.0
Rotoroblc™ is a trademark of Welles Corporation, exclusive U.S . distributors of Rotordisk™ residential-sized waste treatment systems. Rotordisk™ is a patented product of CMS Equipment, Ltd., Toronto, Canada . '
¥lelles CORPORATION ... In Itle Hycor tradillon 01 engineering excellence.
653 Manhattan Beach Boulevard, Suite I Manhattan Beach, California 90266 (213) 470·1292 (213) 545·1921 TELEX: 804294 - SPEEDEX ATL
Your local Rotoroblc dealer 15 :
~' 1981 Wellea Cotpotalion. Prlnled In U.S,A. WR·1829 2.5M
47
APPENDIX C. OIEMICAL ANALYSES

48
APPENDIX TABLE C.l. CliEMICAL ANALYSES AND PERFORMANCE 0lARACl'ERISTICS OF PILOl' RBC UNIT AND ~ '.IREATMENI' PLAN!', FORT KAMEHAMEHA WWI'P, PEARL HARBOR, HNVAII
Raw Wastewatera Final Effluenta,b,c
~
Flow Effl.
(ugd)
~ BCD. em ss
--(Irg/l)-
07/02 6.50 6.7 93 177 156 07/04 5.90 6.7 88 395 130
07/07 4.86 6.8 82 390 83
07/09 6.20 6.7 80 300 132
07/10 5.50 6.8 117 390 155
07/11 6.20 6.9 III 313 155
07/14 5.00 6.7 91 618 100
07/15 5.10 7.1 75 276 103
07/16 5.58 7.6 71 185 134
07/28 5.72 6.8 32 151 58
07/29 6.30 6.9 70 197 103
07/31 6.65 7.0 107 299 123
08101 5.77 6.9 51 707 132
08104 5.17 7.0 40 200 78
08105 5.29 7.0 367 220
08106 6.45 7.0 64 304 287
08107 5.06 6.9 98 94 86
08108 5.67 8.0 72 108 75
08111 4.84 7.0 104 363 208
08112 5.44 6.8 305 217
08113 5.07 6.9 96 181 135
08114 5.55 6.9 75 105 97
08115 5.67 6.8 34 79
08118 5.14 6.9 74 478 102
08120 5.60 7.8 630 594 504
08121 5.56 7.0 118 50 169
08122 6.13 7.0 120 279 79
08125 5.56 6.9 89 132
08126 6.25 6.8 55 74
08127 5.40 6.9 100 121 448
08128 5.74 6.8 84 109
08129 5.46 6.9 78 213 ill
09102 4.98 6.8 80 94 100
pH Cone.
(ng/l)
6.9 3.6
6.9 <2.0
7.0 2.6
6.8 <2.0
7.4 4.5
7.4 3.7
3.6
7.5 3.5
7.2 <2.0
7.0 2.0
7.1 2.2
6.9 4.0
7.3 2.0 2.0
7.0
6.9 2.0
7.1 5.2
6.9 5.6
2.1
6.6
7.0 2.0
7.1 3.0
6.9 2.0
3.9
6.7 <2.0
7.0 6.3
7.0 6.6
2.0
6.8 4.0
6.9 3.0
6.9 2.1
6.8 2.0
6.7 2.0
BCDs em ss R&
lOO'Val (\)
96
97
97
98
96
97
96
95
97
94
97
96
96
95
97
95
92
98
98
96
94
95
99
95
95
98
93
97
98
97
98
R&Cone. lOO'Val
R&Cone. lOO'Val
(ng/l) (\) (ng/l) (\)
169 "5 10.4
368 7 10.8
224 43 14.4
158 47 6.2
93 76 8.2
152 51 11.0
445 28 13.8
175 37 12.8
11.6
97 36 10.6
66 66 10.6
91 70 9.1
o 100 11.0 44 78 7.6 83 77 8.6
7 98 7.6
58 38 9.6
72 33 10.0
142 61 10.0
146 52 9.3
112 38 7.4
39 63 13.4
11.0
111 77 14.3
6 99 6.6
o 100 13.8
11.4
6.8
11.4
64 47 12.2
5.5
72 66 7.8
4 96 8.0
93
92
69
95
95
93
86
88
91
82
92
93
92 90
96
97
89
87
95
96
95
86
86
86
99
92
86
95
85
97
95
93
92
IDre: Constituent values obtained fran analysis performed (or arranged to be analyzed) by Fort Kamehameha hWl'P.
tpffi: "X" means effluent greater than influent. ~4-hr canposite sanple. l:£iSd'larged to ocean outfall. ':Efficiencies for final effluent based on raw wastewater inputs. '71at surface area of discs.

APPENDIX TABLE C.l.-COntinued
ROl'ATIro BICL03ICAL <DNrJ\CroR
Influenta ,e Effluentf , 9
BCD, aD SS pH
--ng/l--
~
64 252 85 8.0 68 375 100 8.0
79 394 95 8.2
212 285 301 8.1
125 969 290 8.1 112 403 231 8.0
52 175 139 8.1
64 1!1l 85 7.9
63 210 46 7.4
55 203 86 8.0
50 283 81 8.1
255 318 550 8.1
108 1596 1126 8.0
258 1096 1510 8.2
435 293 7.5
159 836 1278 7.7
460 910 1208 7.5
388 943 1106 7.4
370 865 1386 7.7
944 1078 7.8 490 1172 1388 8.0
620 1085 2044 7.5
388 766 1545 8.0
580 1555 1610 7.8
990 1374 1490 7.7
1140 1118 1670 7.7
1350 1086 1819 7.7
525 1088 1935 7.6
393 1278 1450 7.7
538 1069 1535 7.6
365 1082 1420 7.8
315 1101 1565 7.8
255 1016 1227 7.9
?ww primary effluent.
Cl.
(ng/U
4196
4313
4313
3963
3846
3788
3963
4371
4021
3903
4021
4371
4429
4079
4487
4138
3788
3846
2739
4371 4254
4313
4313
3374
5285
5566
5679
5791
5623
5622
5904
5791
5679
Sol. Re= Cone. lOOVal BCD.
(ng/l) (%) (IIJ3/U
37.8
2.0
2.0
2.0
2.0
<2.0
2.0
<2.0
6.6
4.8
3.5
8.6
2.0
<2.0
2.0
10.3
9.0
11.4
2.0 3.9
3.0
3.9
6.0
8.3
17.6
16.3
<2.0
<3.0
<2.0
<2.0
<2.0
<2.0
41 !1l
97
99
98
98
96
97
90
91
93
97
98
99
99
98
98
97
99
99
99
99
99
98
99
99
99
99
99
99
99
<6.0
<2.0
2.6
<2.0
<2.0
<2.0
12.4
2.0
<2.0
<2.0
7.6
5.7
4.6 2.0
<2.0
<3.0
<2.0
<2.0
3.9 6.9
25.0
<2.0
<2.5
<3.6
<2.0
<2.0
<2.0
Grab sanp1es. ~fficiencies based on inputs fram primary clarifier. -'"Discs exposed, unless otherwise noted. ~iscs a:wered. JEPA determined values.
Re= Cone. lOO\I'al
(ng/U (%)
354
220
217
132
162
153
47
187
86
145
132
30
185
72
88
35
171 182
112
12
55
260
121
X
41
45
54
83
62
73
5
59
29
53
98
83
83
89
96
80
81 90
99
93
83
89
'roC
(ng/U
31.1
9.3
7.8
7.9
8.6
9.3
6.2
3.1
9.7
2.3
6.5
7.4
7.3
8.2
7.0
6.2
6.2
8.0
12.3
4.5 10.0
10.9
4.2
6.5
7.9 13.6
8.9
8.2
7.8
8.8
7.1
9.1
3.9
Cone.
(ng/l>
286.4 30.8
3.6
15.8
13.0 12.1
16.4
4.2
18.8
32.6
4.8
8.6
17.3
14.0
9.2
3.4
2.0
3.1
31.0
2.7 4.5
3.8
3.7
6.3
5.8 23.3
15.3
3.9
6.2
5.4
3.4
3.8
4.8
SS Re=
lOO\I'al (%)
X
69
96
95
96
95
88
95
87
62
94
98
98
99
97
99
99
99
98
99 99
99
99
99
99 99
99
99
99
99
99
99
99
49
Average Hydaulic lDading (~ ft,)d,h
1.5
1.5
1.5
1.5
1.5
1.5
1.5
1.5
1.5
1.5
1.5
1.5
1.5
1.5
1.5
1.5
1.5
1.5
1.5 1.5
1.5
1.5
1.5
1.5
1.5
1.5
1.5
1.5
1.5
1.5
1.5
1.5
1.5

50
APPENDIX TABLE C.l.-continued
~
FICM Effl.
Raw wastewatera
pH BCD. OOD SS
--(ng/l>-
pH
09103 5.59 6.9
09104 5.86 7.0
09105 5.55 6.9
09108 5.03 7.0
09109 5.38 6.6
09110 5.67 6.8
09lli 6.16 6.7 106
477 176 6.7
319 220 7.1
87 135
71 112
265 159
107 148 155 196
09112 5.93 6.9 44 92 66
71
126 09115 6.94
09116 6.13
09117 5.58
09118 5.21
09119 5.32
09122 4.93
09123 6.78
09124 5.78
09125 5.80
09126 5.40
09129 4.78
09130 5.30
10/01 5.63
10102 5.50
10103 5.82
10/06 5.38
10107 5.44
10/08 5.24
10/09 5.68
10110 5.72
10114 4.97
10/15 6.30
10116 6.44
10/17 6.30
10120 9.35
10/21 7.12
10/22 7.04
10/24 6.34
10/27 5.75
10128 5.86
6.8 52 120
6.8 li8 357
6.9 38 267
7.0 89 340
6.6 109 257
6.9 79 315
7.0 64 332
6.9 75 271
6.8 80 322
6.8 44 303
6.7 liO
6.8 162 422
6.8 48 216
6.6 122 341
6.6 90 410
7.0 70 246
6.8 200 301
7.7 136 360
7.6 120 158
6.7 100 365
6.9 33 181
6.7 595
7.0 191
6.8 103 381
6.9 7.5 41 j
6.9 <46 j
7.0 52 j
6.9 34 281
5.8 254
84
164
ll3
107
108
159
154
106
70
204
69
139
101
82
250
309
230
174
95
194
184
181
45
lli
85
109
70
95
6.8
7.0
6.7
7.0
7.0
7.0
7.0
7.0
7.0
7.0
6.9
7.0
6.8
6.6
6.9
7.3
6.8
6.5
6.9
6.5
6.7
6.7
6.4
6.5
6.6
6.8
6.2
6.7
Cone.
(ngll>
2.5
2.0
2.0
2.0
5.0
4.2
2.0
3.4
3.2
4.4
3.2
3.8
3.8
7.6
4.0
7.0
7.0
3.0
3.0
3.0
7.4
3.2
3.0 j
<2.7 j
<2.7 j
2.0
Final Efflueota ,b,c BCDs <XJ)
Re- Re-lOO'Jal Cone. lOO'Jal
(') (ng/l) (')
98
95
98
95
94
96
fJ7
95
96
95
93
98
92
94
96
90
fJ7
98
98
fJ7
78
93
94
95
94
68
26
104
100
143
92
li3
210
197
316
156
171
236
187
181
355
190
ISO 172
298
146
219
246
158
129
231
162
261
36
246
79
54
86
92
X
X
46
14
27
41
26
7
39
46
29
31
44
X
X
64
20
13
64
li
18
56
18
36
10
56
81
35
72
79
ss Re
Cone. lOO'Jal
(ng/l) (')
6.8
7.5
8.0
7.8
11.0
8.6
18.2
16.4
li.2
9.5
10.4
6.9
9.5
6.0
li.9
6.3
11.4
5.9
10.4
li.5
12.0
17.0
18.2
12.9
7.1
7.6
9.0
15.7
9.4
10.7
8.6
12.4
14.2
li.8
12.8
15.4
9.0
96
97
94
93
93
94
91
75
91
89
94
94
91
94
93
96
89
92
95
83
91
83
78
95
98
fJ7
95
83
95
94
95
72
87
86
88
95
96

APPENDIX TABLE C.1.-continued
Effluentf ,9
Cl. BCD, Sol. BCD. aD SS pH Re= Cone. IOOI/'al BCD.
Re= Cone. IOOI/'al
'IOC Cone.
--ngll-- (ngiU (ngiU (\) (ngiU (ug/U (\) (ngiU (ngll)
661 1018 7.8 5570
1129 1052 7.6 5454 609 642 7.8 5342-
1045 1570 7.8 5117
1215 1810 7.8 6129 2.8
1166 1925 7.9 5623 <2.0
435 )2000 2090 7.7 5342 3.0
410 1242 1620 7.8 5566 9.0
85 222 91 7.8 4632 <2.0
84 409 134 7.8 4725 <2.0
57 282 79 7.8 4632 <2.0
58 397 88 7.8 4354 <2.0
72 147 99 7.8 4076 <2.0
116 515 266 8.0 4493 <2.0
67 439 198
53 298
63 312
44 389
241
89 296
90 265
115 S04
99 370
85 180
85 219
102 272
80 74
55 314
65 152
418
101
83 360
100 7.8
76 8.1
79 8.1
55 7.7
116 7.7
90 7.8
137 7.6
139 7.2
126 7.3
94 7.5
86 7.1
91 7.1
81 7.5
99 7.2
98 7.3
92 7.5
88 7.3
62
86
67
128
4076
3799
3799
4401
4540
4493
4586
5416
4632
4818
4493
4308
4215
5235
S012
4177
5347
67 339 102 7.5 4845
271 103 7.5 4845
2.0
2.0
2.0 2.0
2.0
14.6
4.6
46.2
20.1
43.0
7.6
5.5
96
11
71
96
34
70
99 <2.0 191
98 <2.0 129
98 <2.0 222
98 <2.0 171
96 <2.0 184
96 <2.0 175
97 <2.0 125
98 <2.0 287
96
97
93
98
84
96
53
69
48
92
2.0
2.0
5.4
2.0
29.4
::'2.3
23.4
<2.0
2.7
128
254
277
173
146
167
202
131
284
289
139
256
81
123
32
154
113
234
226
85 12.2
99 10.7
88 10.7
91 13.0
97 11.2
94 13.3 )90 5.0
90 10.4
X 7.2
73 10.6
35 11.6
56 10.7
15 11.2
44 9.7
57
19
29
28
51
37
60
65
X
X
49
X
74
19
92
X
69
31
17
11.3
11.3
12.4
11.4
11.3
15.4
13.5
22.0
16.5
20.0
17.4
15.1
16.1
15.7
25.2
13.8
19.5
8.3
12.7
4.1
3.9
6.2
3.8
3.0
6.4
16.3
55.1
12.1
4.6
5.9
4.3
3.1
4.7
19.0
6.0
7.0
10.9
23.9
106.2
4.1
34.3
9.9
15.4
13.1
10.5
7.6
11.2
9.6
17.0
36.8
81.0
7.2
8.4
10.8
SS Re=
lIlOITal (\)
99
99
99
99
99
99
99
97
87
97
93
95
96
98
81
92
91
80
79
X
97
75
92
84
85
88
91
88
88
82
58
X
92
87
92
51
Average Hydaulic
Loading (~ ftl)d,h
1.5
1.5
1.5
1.5
1.5
1.5
1.5
1.5
1.5
1.5
1.5
1.5
1.5
1.5
1.5
1.5
1.5
1.5
1.5
1.5
1.5
1.5
1.5
1.5
1.5
1.5
1.5
1.5
1.5
1.5
1.5
1.5
1.5
1.5
1.5
1.5
1.5
1.5

52
APPENDIX TABLE C.l.-continued
F1Qi Effl.
Raw wastewatera Final Effluenta,b,C BCD, OOD
BCD, aD SS pH Reo- Reo-Cone. lIICNal Cone. IOOVal
SS
Cone.
(1193) -(ngll>-- (ngll> (\) (ngll> (\) (ngll)
ReolIICNal
(\)
~ 10129 5.60 6.9 45 313
10/30 5.63 6.7 342
10/31 5.SO
11103 5.23
11104 5.06
11105 6.19
11106 5.42
11107 5.61
11111 4.98
11112 5.07
·11113 5.22
11114 5.62
11117 40SO
11118 5.90
11119 5.50
11120 5.22
11/21 5.31
11124 4.75
11125 5.43
11126 5.56
11128 4.51
12101 4.43
12102 4.21
12103 4.50
6.7 426
6.8 29 434
6.7 41
6.7 30
6.6 37 387
6.6 25
6.7 70 S03
7.7 <1.0 324
6.6 96 424
6.8 46 329
6.9 82 487
7.7 141 308
7.1 ISO 322
7.1 115 430
7.4 100 1142
7.1 56 404
7.4 59 379
7.0 68 S04
7.4 73 610
7.0 810
7.4 294
6.8 377
330
79 6.5
60 6.9
III
79
64
61
58
59
70
93
89
101
rn 123
125
94
112
87
rn 119
96
90
63
77
92
114
93
67
94
90
6.6
6.8
7.0
6.2
7.5
7.0
6.9
6.9
7.1
6.9
7.0
6.8
7.0
6.7
7.0
6.7
7.3
7.8
6.9
7.1
345 133 6.8
6.7 403 101
12104 3.99 7.1
12105 5.23 7.0
12108 5.32 7.0
12109 5.98 6.8
12110 5.58 6.8
12112 5.79 6.8
12119 5.20 6.9
12122 5.04 6.9
12123 5.83 7.4
12125 4.74 6.8
12126 5.51 6.8
12129 5.15 6.9
12130 5.49 6.8
324 1125 6.7
454 74
407 113
538
129
2.0
2.0
<1.0
<1.0
<1.0
<1.0
2.5
<1.0
2.1
2.0
2.0
2.3
2.2
3.2
2.0
2.0
2.0
2.0
2.0
96
93
98
rn rn 96
96
X
98
96
98
98
99
rn 98
96
rn rn rn
98
266
245
280
217
356
277
243
309
266
280
209
253
190
382
348
445
592
580
197
207
226
274
263
282
291
268
327
69 8.2
22 12.2
42
35
44
29
15
43
6
45
9
35
41
83
5
8
12
3
28
33
45
32
9.0
8.8
9.0
9.8
6.6
12.2
7.0
15.2
7.0
6.6
12.2 8.4
5.7
4.6
6.0
8.7
6.0
7.8
6.4
7.0
8.6
8.8
5.1
14.2
17.6
16.8
14.4
6.8
21 8.8
35 13.1
13 16.8
36 9.9
34 15.5
39
13.4
97
96
98
98
98
99
95
98
98
rn rn 98
99
99
98
98
98
99
92
86
89
94
88
81
75
85
92
93
87
99
87
86
90

APPENDIX TABLE C.l.-continued RC1l'ATIK; BICLcxaCAL <D~
Influenta,e
BCDs em ss pH Cl Re= Cone. lIIO'Ial
--110/1-- (110/1> (110/1> (\)
~
65 182 102 7.4 4901
354 118 7.4 4734
309 94 7.3 4511
320 96 7.3 5012
9.7
7.3
3.7 6.9
4.9
3.0
2.2
364
80 7.3
101
83 7.7 4678
93
451 101 7.4 5347 21.5
349 126 7.6 4511 219 91 7.7 4455 12.5
340 92 7.5 4901 >50.0
472 102 7.7 5068 5.9
414 113 7.6 4623 10.3
285 96 7.6 4233 5.6
499 133 7.2 4288 6.0
377 106 7.5 4455 19.0
472 105 7.5 4511 12.5
331 101 7.6 4814 5.8
664 .110 7.6 4338 10.0 456 128 7.6 4549 5.2
610 135 7.6 4814 4.5
386 106 7.7 4708 2.0
466 188 7.7 4761 8.1
294 108 7.6 4391 9.7
105
131
134
324
102
5.0
5.8
18.6
10.4
627 233 7.5 4179 >8.3 532 170 7.4 4285 5.8
1400 1532 7.4 4391 12.4
309 171 7.3 4761
389 85 7.4 4920 9.0
301 7.2 4920 7.6
88 10.2
85
Effluentf ,9
Sol. BCD.
em RE.=
Cone. lIIO'Ial (110/1) (110/1) (\)
'lOC
(110/1>
2.0 112 38 13.3
257 27 13.3
2.0 . 287 7 13.1
Cone.
(m;V1>
2.0 280 13 11.8 5.8 2.0 17
2.3 7.8
2.0
2.0
284 22 12.8 6.4
6.2
12.0 263 42 14.3 14.5
325 7 15.5 20.7
3.2 256 X 13.5 37.2
8.2 309 97 14.6 28.0
5.2 450 5 12.4 5.0
6.4 272 34 16.7 4.3
4.5 242 15 14.4 4.3
4.4 288 42 14.9 3.8
7.1 327 13 18.5 17.5
6.3 401 15 16.4 9.7
5.7 361 X 13.9 5.6
3.4 451 32 14.5 5.5
3.4 542 X 13.8 9.6
2.5 347 43 12.1 12.8
2.0 413 X 11.6 7.2
5.6 243 48 15.1 4.1
6.9 178 39 13.3 4.1
2.1
2.0
8.2
3.2
>5.4
6.2
4.5
3.0
4.3
4.1
444 29 22.2
480 10 16.0
302 78 14.7
297 4 7.0
14.4
293 3 13.8
9.0
15.6
400
13.6
15.6
5.6
9.3
6.8
7.5
7.7
ss RE.=
lIIO'Ial (\)
94 79
93
92
93
86
84
59
70
95
96
96
97
83
91
94
95
93
91
93
98
96
91
88
X
96
93
97
99
96
91
53
Average Bydaulic Loading (~ ftl)d,h
3.0
3.0
3.0
3.0
3.0
3.0
3.0
3.0
3.0
3.0 3.0
3.0
3.0
3.0 3.0
3.0
3.0
3.0
3.0
3.0
3.0
3.0
3.0
3.0
3.0 3.0
3.0
3.0
3.0
3.0
3.0
3.0
3.0
3.0
3.0
3.0
3.0

54
APPENDIX TABLE e.l.-continued
Raw wastewatera Final Eff1uenta ,b,c BCD. ClD F1a./
Effl. pH BCD. aD SS pH Re- Re-Cone. IWJal Cone. lIDVal
--(m;y'1)- (m;y'l> (\) (m;y'l> (\)
~
01101 5.02 6.9 62
01102 6.00 6.9 161 01105 5.53 6.9 99
01106 5.97 6.7 126
01107 5.82 6.8 123
01108 6.04 6.7 100
01109 6.17 7.0 84
01112 5.43 6.8
01113 5.67 6.9
01114 5.16 6.8
01115 5.08 6.8
01116 5.43 6.8
01120 4.68 6.9
01121
01122
01/23
01126
01127
01128
01129
01130
02105
02106
02109
02110
5.59 6.8 5.44 7.3
5.49 7.7
5.52 7.0
5.46 6.9
5.57 6.8
5.89 7.0
6.12 7.0
6.41 7.0
6.14 6.6
5.20 6.8
5.61 6.5
105
68
105
126
329 67
124
358 92
305 145
501 120
449 125
354 11l
558 91
6.8
6.7
6.6
6.8
6.9
6.6
6.8
205 485 6.7
302 ll4 221 144 6.5
418 174 6.4
395 105
363 175
447 169
354 102
101 90
410 152
468 185
508 133
326 133
493 ll9
566 ll3
153
702
6.6 6.4
6.8
7.0
6.6
6.5
6.7
6.7
7.0
7.0
7.2
4.3
2.4 12.8
<2.0
3.6
4.5
2.1
9.2
2.6
2.0
2.8
93
99
87
98
rn 96
98
91
96
98
98
254
232
328
172
308
308
329
199
155
228
300
219 266
222
353
256
357
255
457
450
586
(Pilot ROC W'lit not operating fran 11 Feb. to 31 Mar. 1986.)
23
24
35
62
13
45
X
34
30
45
24
40 40
37
X
38
30
22
7
20
17
04101 5.05 7.2 108 230 114 6.7 7.2 93 45 80
04102 4.82 6.9 99 205 109 6.5 <2.0 rn 45 78
04103 4.99 7.1 96 160 84 6.5 <2.0 98 40 75 04106 4.54 6.9 50 95 62 2.3 95 20 79
04107 5.06 7.0 63 170 71 6.8 2.7 96 50 71
04108 5.46 7.1 73 180 126 6.5 <2.0 rn 20 89
04109 5.48 7.4 90 160 140 6.3 <2.0 98 90 44
04110 4.67 7.3 90 195 105 6.52.9 97 45 77
04113 4.39 7.1 71 120 76 <2.0 rn 35 71
06/18 5.90 7.2 94 260 128 6.6 2.0 98
06/19 6.12 7.2 140 162 6.9 6.4 95
06/22 5.40 6.7 102 169 6.6 94
06/23 5.90 7.3 ll3 180 7.1 2.3 98
ss Cone.
(ng/l>
9.6
ll.2 45.8
11.2
14.6
13.0
13.7
29.8
8.6
23.6
53.8
5.6
5.4 16.4
11.8
9.7
18.1
7.5
5.4
7.7
40.9
11.2
8.6
6.6
7.4
9.3 8.4
10.1
10.1
15.4
20.4
3.9
18.6
31.9
25.3 15.2
87
96
rn rn
98
85
rn 89
87
99
99 90
88
89
88
96
96
94
66
90
94
94
93
89 86
86
92
89
81
95
85
80
85 92

APPENDIX TABLE C.l.-continued
Influenta ,e Effluentf,g
Cl BCD. Sol. BCD, roD SS pH Re= Cone. lOOVal B(]),
Re- 'lOC Cone. lOOVal Cone.
(ng/l> --ngll-- (ng/l> (ng/l> (%) (ng/l) (ng/l> (%) (ng/l)
847 572 7.2 5026 10.2 761 7.3 4655 10.1
115 7.2 4523 10.4
467 122 7.2 4920 10.4
478 100 7.2 4497 8.5
371 91 7.3 4481 8.2
326 86 7.0 4529 26.4
436 llO 7.3 4091 3.2
III 59 7.2 4140 3.8
304 102 7.1 3945 82.7
292 105 7.4 4140 82.0
380 ll3 7.1 3701 86.2
466 70 7.2 4286 5.1
351 127 7.1 4286 5.3 360 108 7.1 4334 6.6
304 95 7.0 4775 2.4
365 97 7.1 4821 12.3
338 104 7.3 4334 13.0
370 85 7.2 3896 5.2
405 93 7.3 3945 13.2 390 183 7.2 4627 5.4
100 658 III 7.1 4821 88.5
54 489 104 7.3 3765 19.8
81 126 7.5 4061 15.6
86 536 7.3 4145 29.3
61 190
83 160 179 355
75 ISO
82 240
72 140
71 205
78 200
100 195
ISO
78 7.1
130 7.1
238 6.9
78 7.2
98 7.2
91 7.3
85 7.2
103 7.4
191 7.3
6.7
7.4
7.3
7.4
3699
4254
3930
3468
3930
3930
3484
3457
3808
4361
4874
5387
5489
48.0
20.8
62.0
32.0
81.5
19.0
12.0
65.0
48.0
7.5
23.0
22.0
6.2 382
2.0 273
3.0
3.6 352
3.9 397
3.2 399
11.4 398
2.0 180
2.0 301
67.8 279
59.0 180
>35.0 287
2.0 316
5.0 291
4.8 286
325
5.1 324 3.7 399
5.5 351
5.7 581
3.0 298
13 56.5 488
63 10.0 381
81 7.1 544
66 9.9 556
21
75
65
57
1
74
83
35
70
70
151
65
155
70
70
160
140
225
128
373
219
55 11.9 5.5
10.5 10.9 9.3 3.5
25 11.8 7.3
17 12.6 5.6
X 14.5 6.8
X 16.3 46.0 59 10.5 7.2
X 14.1 4.9
8 23.5 12.9
38 35.7 19.3
24 25.4 24.8
32 15.1 4.6
17 17.7 5.6
21 19.5 7.5
X 22.3 24.5
11 16.5 16.5
X 17.3 9.2
5 18.5 8.3
X 17.9 6.6 24 16.0 5.8
II 29.6 33.3
22 21.0 17.3
17.1 18.4
X 21.1 28.0
63
56 57
57
35
SO
66
80
28
X
23.2
23.8
35.5
26.7
39.9
26.5
24.9
32.0
39.4
12.8
11.7
13.7
14.7
58.0
16.8
9.3
46.8
56.8
32.4
36.0
42.0
49.2
18.4
13.4
28.0
24.4
ss Re
lOO\7al (%)
99
99
97
94
94
93
47
93
92
87
82
78
93
96
93
74
83
91
90
93
97
70
83
85
25
87
96
40
42
64
58
59
74
55
Average Hydaulic Loading (~ ft,)d,h
3.0
3.0
3.0
3.0
3.0
3.0
3.0
3.0
3.0
3.0
3.0
3.0
3.0
3.0 3.0
3.0
3.0
3.0
3.0
3.0 3.0
5.0
5.0
5.0
5.0
5.0
5.0
5.0
5.0
5.0
5.0
5.0
5.0
5.0
5.0 i
5.0 i
5.0 i
5.0 i

56
APPENDIX TllBLE C.l.-continued
~ 'lRF.Ml£NT FLANT
Bmt Hmitewate,a final Effl~nta,5,c mTE Flow B(J). (XJ) SS
Effl. pH B(J). aD SS pH Roe- Roe- Roe-Cone. IOO\7al Cone. IOO\7al Cone. IOO\7al (ngel) --(ng/lJ- (ng/l) (%) (ng/lJ (%) (ng/l) (%)
~
06/24 5.75 7.2 125 191 7.1 2.6 98 11.9 94
06/26 5.19 7.1 88 136 7.1 <2.0 98 6.7 95
06129 4.42 6.6 105 10.1 90
06/30 4.50 7.2 129 6.5 6.1 95 07/01 4.50 7.3 85 ISO 125 6.5 <2.0 98 93 38 12.8 90
07/02 5.07 7.6 90 43 86 6.6 <2.0 98 69 X 6.1 93
07/06 5.20 7.1 83 95 3.8 95 147 7.3 92 07/07 5.60 7.1 68 341 129 6.6 2.4 96 73 79 8.3 94
07/14 5.70 7.4 48 42 39 6.9 <2.0 96 11.1 72
07/15 5.50 7.4 105 179 137 7.0 <2.0 98 50 72 18.4 87

57
APPENDIX TABLE C.l.-continued
0CIl'ATIlC BICLCGlCAL CDNTJl.CIOR InfluentA,e Effluentf,9 Average
BCD. aD SS Hydaulic BCD. CDD SS pH Cl k= Sol. Re= 'lOC Re= Loading
Cone. lOOITal BCD. Cone. lOOITal
Cone. lOOITal (~
--ng/l-- (ng/I) (ng/l) (%) (ng/I) (ng/I) (%) (ng/I) (ng/I) (%) ftl)d, i
12M. 7.0 57f51 54.0 111 20.0 56.0 5.0
7.4 4463 35.0 60 19.5 40.4 5.0
104 7.2 4514 52.0 271 24.8 38.0 63 5.0 82 7.5 4053 39.0 194 7.3 36.0 56 5.0
70 119 105 7.5 3488 30.0 57 211 X 12.0 27.6 74 5.0
84 22 103 7.5 4001 29.0 65 29 X 13.2 25.6 75 5.0
7.3 5079 35.0 223 9.0 75 5.0
64 359 96 7.7 4104 91.0 X 436 X 37.3 230 X 5.0
50 66 7.6 4599 30 6.2 16.2 50 5.0
38 103 78.0 X 5.0

59
APPENDIX D. HFAVY METAL ANALYSES

61
APPENDIX TJ\BLE 0.1. HFAVY METAL COOCENllOO.'ICNS AT VARIOOS IJX'ATIONS 'lBRC(X;1OJT FORT KAMEHAMEHA ~, PEARL HARBffi, HNiAII
AVERK;E HFAVY METALS
DATE HYDRAIJLIC Ag Cd Cr OJ Fe Ni Pb Zn LOADIN3 (gpd/ft2) * (ng/l)
RAW WASTE.WATERt
07/02185 1.5 0.04 0.02 0.0 0.4 2.2 0.2 0.1 0.18 07/05/85 1.5 0.00 0.02 0.0 0.2 1.3 0.1 0.2 0.14 07/09/85 1.5 0.00 0.01 0.1 0.2 0.8 0.1 0.1 0.11 07/12185 1.5 0.02 0.03 0.0 0.3 1.4 0.1 0.1 0.21 07/16/85 1.5 0.02 0.02 0.0 0.1 0.8 0.1 0.1 0.16 07/19/85 1.5 0.00 0.03 0.0 0.3 7.0 0.1 0.1 0.55 07/23/85 1.5 0.02 0.01 0.0 0.1 0.7 0.1 0.1 0.12 07/26/85 1.5 0.04 0.01 0.0 0.1 1.0 0.1 0.1 0.12 07/30/85 1.5 0.06 0.04 0.2 0.0 1.2 0.1 0.1 0.14 08102/85 1.5 0.06 0.01 0.0 0.2 2.1 0.1 0.1 0.20 08106/85 1.5 0.00 0.03 0.0 0.2 2.8 0.1 0.1 0.27 08/09/85 1.5 0.05 0.02 0.0 0.1 0.8 0.1 0.0 0.10 08113/85 1.5 0.03 0.02 0.0 0.2 1.4 0.1 0.2 0.23 08116/85 1.5 0.04 0.02 0.1 0.2 0.7 0.1 0.1 0.11 08120/85 1.5 0.03 0.02 0.0 0.1 1.1 0.1 0.0 0.13 08123/85 1.5 0.03 0.01 0.0 0.1 1.1 0.1 0.0 0.12 08127/85 1.5 0.05 0.02 0.0 0.1 0.3 0.0 0.2 0.07 08/30/85 1.5 0.05 0.02 0.1 0.1 1.0 0.1 0.4 0.18 09/03/85 1.5 0.02 0.02 0.1 0.1 0.5 0.0 0.1 0.37 09/10/85 1.5 0.02 0.02 0.1 0.2 1.3 0.1 0.1 0.17 09/13/85 1.5 0.02 0.02 0.1 0.1 0.6 0.1 0.1 0.36 09/17/85 1.5 0.03 0.03 0.1 0.2 1.4 0.1 0.1 0.19 09/20/85 1.5 0.04 0.03 0.2 0.2 1.2 0.1 0.1 0.18 09/24185 1.5 0.05 0.03 0.0 0.1 1.5 0.1 0.1 0.22 09/27/85 1.5 0.05 0.02 0.0 0.1 0.7 0.3 0.1 0.11 10/01/85 1.5 0.03 0.01 0.0 0.2 2.6 0.1 0.1 0.42 10/04185 1.5 0.04 0.02 0.0 0.0 0.8 0.2 0.1 0.14 10/08185 1.5 0.07 0.02 0.1 0.3 2.2 0.2 0.1 0.37 10/11/85 1.5 0.04 0.03 0.0 0.1 6.5 0.1 0.2 0.30 10/15/85 1.5 0.04 0.03 0.0 0.1 1.8 0.1 0.2 0.18 10/18185 1.5 0.02 0.04 0.0 0.1 3.7 0.3 0.4 0.26 10/22/85 1.5 0.11 0.01 0.0 0.2 2.8 0.0 0.0 0.26 10/25/85 1.5 0.01 0.06 0.0 0.1 0.3 0.3 0.2 0.15 10/29/85 3.0 0.05 0.01 0.1 0.0 0.7 0.1 0.1 0.09 11/01/85 3.0 0.05 0.03 0.0 0.1 0.8 0.2 0.2 0.11 11/05/85 3.0 0.05 0.03 0.0 0.1 0.6 0.2 0.2 0.46 11112185 3.0 0.04 0.02 0.2 0.1 0.6 0.1 0.1 0.10 11/lS/85t 3.0 0.02 0.03 0.0 0.1 0.8 0.1 0.1 0.18 11/15/85 3.0 0.02 0.01 0.0 0.1 0.4 0.1 0.2 0.09
NJlE: Refer to Figure 2 for sample locations. *Flat surface area of discs, with discs exposed except as noted. t24-hr composite sample except as noted. tGrab sample.

62
APPENDIX TABLE D.1.-COntinued
A\TERH3E HFAVY METALS HYDRAULIC Ag Cd Cr CU Fe Ni Pb Zn LOADIro (gpd/ft2) * (ng/1)
11/19/85 3.0 0.05 0.01 0.1 0.1 0.9 0.1 0.1 0.15 11/26/85 3.0 0.05 0.01 0.0 0.2 0.9 0.0 0.0 0.57 11129/85 3.0 0.01 0.02 0.0 0.1 0.6 0.0 0.1 0.10 12103/85 3.0 0.12 0.01 0.2 0.5 5.1 0.2 0.1 0.50 12106/85 3.0 0.01 0.00 0.1 0.1 0.5 0.1 0.1 0.17 12113/85 3.0 0.03 0.01 0.0 0.2 0.8 0.1 0.2 0.26 12120/85 3.0 0.03 0.02 0.1 0.1 0.9 0.1 0.1 0.18 12/24185 3.0 0.03 0.02 0.1 0.1 1.0 0.1 0.1 0.15 12131/85 3.0 0.02 0.01 0.0 0.0 0.6 0.1 0.1 0.45 01/06/86 3.0 0.03 0.02 0.0 0.2 0.9 0.1 0.1 0.15 01/10/86 3.0 0.01 0.00 0.0 0.1 0.6 0.1 0.2 0.11 01/17/86 3.0 0.01 0.00 0.0 0.0 0.7 0.1 0.1 0.10 01/24186 3.0 0.03 0.03 0.0 0.1 0.8 0.2 0.1 O.ll 01/28/86 3.0 0.03 0.03 0.1 0.1 1.0 0.1 0.2 0.14 02104186 5.0 0.03 0.02 0.1 0.1 0.7 0.1 0.1 0.16 02107/86 5.0 0.03 0.02 0.1 0.1 0.7 0.1 0.1 0.18
PRIMARY CIARIFIER EFFLtJEN.["t
06/14185 1.5 0.01 0.00 0.2 0.5 0.6 0.4 0.1 0.13 07/02185 1.5 0.01 0.00 0.0 0.2 0.9 0.0 0.2 0.13 07/05/85 1.5 0.02 0.00 0.0 0.1 0.8 0.1 0.1 0.10 07/09/85 1.5 0.04 0.00 0.0 0.3 2.6 0.0 0.1 0.34 07/12185 1.5 0.06 0.01 0.0 0.3 2.5 0.0 0.0 0.36 07/16/85 1.5 0.02 0.00 0.0 0.1 0.8 0.1 0.1 0.12 07/19185 1.5 0.05 0.00 0.0 0.3 3.4 0.2 0.0 0.42 07/23/85 1.5 0.04 0.00 0.0 0.2 1.2 0.0 0.1 0.17 07/26/85 1.5 0.02 0.00 0.0 0.2 1.3 0.2 0.1 0.30 07/30/85 1.5 0.12 0.04 0.3 0.1 0.7 0.1 0.1 0.11 08102185 1.5 0.20 0.02 0.2 1.2 10.8 0.4 0.2 1.18 08106/85 1.5 0.11 0.00 0.1 -0.5 4.2 0.2 0.0 0.40 08109/85 1.5 0.12 0.01 0.4 2.2 12.2 0.0 0.1 1.01 08113/85 1.5 0.20 0.02 0.2 1.5 3.3 0.1 0.1 0.84 08116/85 1.5 0.24 0.00 0.4 2.4 16.3 0.4 0.0 1.92 08120/85 1.5 0.22 0.04 0.0 1.8 10.6 0.2 0.2 1.38 08123/85 1.5 0.12 0.02 0.4 2.4 15.4 0.4 0.2 1.98 08/27/85 1.5 0.12 0.06 0.5 2.0 14.6 0.4 0.4 1.87 08130/85 1.5 0.24 0.02 0.4 2.2 13.0 0.4 0.4 1.84 09/03/85 1.5 0.18 0.06 0.5 1.4 12.8 0.4 0.2 1.21 09/06/85 1.5 0.01 0.00 0.0 0.1 0.4 0.0 0.0 0.09 09/10/85 1.5 0.26 0.04 0.3 2.2 13.0 0.2 0.2 1.78 09/12185 1.5 0.28 0.02 0.3 2.2 12.4 0.4 0.2 1.78 09/17/85 1.5 0.03 0.02 0.0 0.3 1.9 0.0 0.1 0.27 09/20/85 1.S 0.07 0.02 0.2 0.2 1.6 0.2 0.0 0.29
IDlE: Refer to Figure 2 for sample locations. *F1at surface area of discs, with discs exposed except as noted. t24-hr oamposite sample except as noted.

63
APPENDIX TABLE D.1.--COntinued
A~ HFAVY METALS
DATE HYDRADLIC
1Ig Cd Cr CU Fe Ni Pb Zn LQN)IR; (gpd/ft2) * (ng/1)
09/24/85 1.5 0.11 0.03 0.1 0.4 3.8 0.1 0.0 0.56 09/27/85 1.5 0.04 0.02 0.0 0.1 1.1 0.3 0.1 0.37 10/01/85 1.5 0.03 0.06 0.0 0.3 1.3 0.1 0.1 0.41 10/04185 1.5 0.09 0.04 0.1 0.2 2.0 0.4 0.4 0.20 10/08185 1.5 0.02 0.02 0.0 0.1 1.0 0.0 0.1 1.89 10/11/85 1.5 0.05 0.02 0.0 0.1 1.3 0.1 0.2 0.14 10/15/85 1.5 0.03 0.04 0.0 0.1 1.1 0.0 0.0 0.17 10/18185 1.5 0.02 0.00 0.0 0.1 1.0 0.1 0.1 0.22 10/22/85 1.5 0.03 0.00 0.1 0.1 0.9 0.1 0.1 O.ll 10/25/85 1.5 0.04 0.00 0.0 0.2 1.3 0.1 0.1 0.17 10/29/85 3.0 0.03 0.01 0.1 0.2 1.1 0.1 0.1 0.15 11101/85 3.0 0.06 0.00 0.0 0.1 1.1 0.1 0.2 0.14 11/05/85 3.0 0.02 0.00 0.0 0.1 0.7 0.1 0.0 0.10 11/08185 3.0 0.03 0.00 0.0 0.2 1.3 0.0 0.1 0.16 11/12/85 3.0 0.02 0.01 0.0 0.1 1.0 0.2 0.1 0.16 11115/85 3.0 0.04 0.00 0.0 0.1 0.9 0.0 0.1 0.23 11119/85 3.0 0.05 0.00 0.0 0.1 1.0 0.1 0.0 0.20 11/22/85 3.0 0.02 0.00 0.0 0.1 1.1 0.0 0.1 0.28 11/26/85 3.0 0.02 0.00 0.0 0.2 1.5 0.0 0.1 0.18 11/29/85 3.0 0.02 0.00 0.0 0.2 1.4 0.2 0.2 0.18 12106/85 3.0 0.06 0.04 0.0 0.2 1.8 0.0 0.2 0.20 12110/85 3.0 0.02 0.00 0.1 0.2 1.4 0.1 0.2 0.18 12113/85 3.0 0.02 0.00 0.0 0.2 1.2 0.0 0.1 0.20 12117/85 3.0 0.05 0.00 0.0 0.4 3.1 0.1 0.1 0.33
. 12124185 3.0 0.14 0.02 0.2 2.2 18.2 0.2 0.0 1.84 12127/85 3.0 0.02 0.00 0.0 0.1 0.4 0.0 0.0 0.05 12131/85 3.0 0.04 0.00 0.0 0.1 0.5 0.1 0.1 0.09 01/07/86 3.0 0.00 0.01 0.0 0.1 0.5 0.0 0.0 0.10 01/10/86 3.0 0.06 0.01 0.1 0.1 0.9 0.1 0.1 0.19 01117/86 3.0 0.05 0.01 0.1 0.2 1.1 0.1 0.1 0.19 01/24186 3.0 0.26 0.03 0.2 1.2 9.8 0.2 0.2 0.84 01128/86 3.0 0.07 0.02 0.0 0.2 1.2 0.1 0.1 0.58 02104186 5.0 0.04 0.01 0.1 0.2 1.1 0.1 0.1 0.14 02107/86 5.0 0.05 0.02 0.1 0.1 1.0 0.1 0.0 0.13 02l11/86t 5.0 0.02 0.02 0.1 0.2 0.7 0.1 0.1 0.95 02l14186f 5.0 0.04 0.02 0.0 0.2 1.1 0.1 0.1 0.14 02l18186f 5.0 0.07 0.02 0.1 0.3 1.8 0.1 0.2 0.21 02l25/86f 5.0 0.10 0.03 0.0 0.1 0.9 0.0 0.1 0.16 02/28186f 5.0 0.02 0.02 0.0 0.0 0.5 0.1 0.2 0.75 03/04l86f 5.0 0.03 0.03 0.0 0.2 0.7 0.2 0.0 0.19 03/11/86f 5.0 0.06 0.03 0.0 0.2 1.1 0.1 0.1 0.11 03/14186f 5.0 0.03 0.02 0.0 0.2 0.7 0.1 0.0 0.13 03/18186f 5.0 0.07 0.02 0.1 0.1 0.6 0.3 0.2 0.10 03/21/86t 5.0 0.06 0.03 0.0 0.1 1.1 0.1 0.1 0.17
IDlE: Refer to Figure 2 for sample locations. *F1at surface area of discs, with discs exposed except as noted. tGrab sample.

64
APPENDIX TABLE D.1.-continued
AVEEW;E HEAVY METALS
DATE HYDRAULIC Ag Cd Cr CU Fe Ni Pb Zn LOADIR;
<gpdlft')* <ugll>
ROl'ATIR; BIQImlCAL OONl'ACIDR EFFLUENIi
06/14/85 1.5 0.01 0.00 0.1 0.2 0.1 0.0 0.1 0.13 07/02185 1.5 0.02 0.02 0.1 0.0 0.1 0.1 0.1 0.07 07/05/85 1.5 0.01 0.00 0.0 0.0 0.1 0.0 0.1 0.05 07/09/85 1.5 0.01 0.03 0.0 0.0 0.0 0.1 0.1 0.07 07/12185 1.5 0.01 0.01 0.0 0.1 0.0 0.0 0.1 0.06 07/16/85 1.5 0.02 0.04 0.0 0.0 0.1 0.1 0.1 0.04 07/19/85 1.5 0.02 0.00 0.0 0.2 0.0 0.1 0.2 0.10 07/23/85 1.5 0.00 0.00 0.0 0.0 0.0 0.1 0.1 0.03 07/26/85 1.5 0.02 0.01 0.0 0.0 0.1 0.0 0.2 0.05 07/30/85 1.5 0.01 0.04 0.1 0.0 0.0 0.2 0.2 0.04 08102185 1.5 0.03 0.00 0.0 0.1 0.1 0.2 0.2 0.11 08106/85 1.5 0.09 0.03 0.1 0.2 0.1 0.1 0.3 0.07 08/09/85 1.5 0.03 0.00 0.0 0.3 0.1 0.3 0.12 08/13/85 1.5 0.01 0.03 0.0 0.0 0.1 0.0 0.1 0.05 08/16/85 1.5 0.00 0.02 0.0 0.0 0.1 0.1 0.36 08120/85 1.5 0.00 0.00 0.1 0.0 0.1 0.0 0.0 0.05 08123/85 1.5 0.03 0.01 0.1 0.1 0.1 0.1 0.04 08/27/85 1.5 0.03 0.03 0.0 0.1 0.2 0.2 0.32 08130/85 1.5 0.01 0.05 0.1 0.0 0.0 0.1 0.2 0.05 09/03/85 1.5 0.03 0.01 0.1 0.0 0.0 0.1 0.0 0.02 09/06/85 1.5 0.00 0.00 0.2 0.0 0.1 0.1 0.2 0.06 09/10/85 1.5 0.03 0.03 0.0 0.0 0.1 0.1 0.0 0.07 09/l3/85 1.5 0.02 0.00 0.0 0.0 0.0 0.3 0.1 0.05 09/17/85 1.5 0.02 0.05 0.1 0.2 0.1 0.0 0.0 0.36 09/20/85 1.5 0.08 0.10 0.0 0.2 1.0 0.0 0.1 0.27 09/24/85 1.5 0.02 0.02 0.0 0.0 0.0 0.2 0.0 0.03 09/27/85 1.5 0.07 0.07 0.5 0.8 0.2 0.0 0.0 0.45 10/01/85 1.5 0.02 0.02 0.0 0.0 0.1 0.2 0.0 0.06 10/08185 1.5 0.00 0.06 0.9 0.0 0.1 0.2 0.3 0.07 10/ll/85 1.5 0.02 0.01 0.0 0.1 0.1 0.0 0.2 0.03 10/15/85 1.5 0.04 0.08 0.0 0.1 0.3 0.1 0.0 0.01 10/18185 1.5 0.15 0.08 0.1 0.0 0.2 0.3 0.3 0.06 10/22/85 1.5 0.03 0.02 0.0 0.0 0.2 0.1 0.3 0.04 10/25/85 1.5 0.01 0.04 0.1 0.0 0.2 0.2 0.1 0.06 10/29/85 3.0 0.04 0.00 0.0 0.0 0.2 0.0 0.0 0.01 11/01/85 3.0 0.00 0.05 0.0 0.0 0.1 0.1 0.3 0.02 11/05/85 3.0 0.03 0.01 0.3 0.0 0.2 0.2 0.0 0.03 11/08/85 3.0 0.01 0.02 0.0 0.1 0.3 0.1 0.3 0.10 11/12185 3.0 0.00 0.03 0.0 0.0 0.1 0.0 0.1 0.00 11/15/85 3.0 0.00 0.05 0.1 0.0 0.0 0.0 0.02 11/19/85 3.0 0.02 0.02 0.1 0.0 0.2 0.1 0.0 0.01 11/22/85 3.0 0.01 0.02 0.0 0.0 0.1 0.1 0.1 0.02
IDl'E: Refer to Figure 2 for sample locations. *Flat surface area of discs, with discs exposed except as noted. fGrab sample.

65
APPENDIX TABLE O.l.-continued
AVERlGE HEAVY METALS
DATE HYDRAULIC Ag Cd Cr CU Fe Ni Pb Zn LO.ZIDIN;
(gpd/ftZ)* (ng/1)
11126/85 3.0 0.03 0.02 0.0 0.0 0.1 0.0 0.1 0.00 11/29/85 3.0 0.00 0.01 0.0 0.0 0.0 0.1 0.1 0.00 12103185 3.0 0.00 0.01 0.0 0.0 0.2 0.1 0.0 0.01 12109/85 3.0 0.01 0.01 0.0 0.0 0.1 0.3 0.2 0.02 12110/85 3.0 0.02 0.01 0.1 0.0 0.2 0.0 . 0.2 0.03 12/13/85 3.0 0.02 0.02 0.8 0.1 0.1 0.2 0.2 0.02 12120/85 3.0 0.00 0.01 0.1 0.0 0.1 0.0 0.1 0.01 12127/85 3.0 0.00 0.01 0.0 0.0 0.1 0.1 0.1 0.00 12131/85 3.0 0.00 0.00 0.1 0.0 0.3 0.3 0.1 0.01 01/03/86 3.0 0.01 0.03 0.0 0.0 0.0 0.0 0.1 0.01 01/07/86 3.0 0.00 0.00 0.3 0.0 0.2 0.1 0.2 0.00 01/10/86 3.0 0.00 0.01 0.0 0.1 0.0 0.1 0.1 0.00 01/14186 3.0 0.02 0.00 0.1 0.0 0.0 0.0 0.0 0.02 01/17/86 3.0 0.12 0.02 0.0 0.3 0.1 0.0 0.1 0.06 01/24186 3.0 0.00 0.00 0.0 0.3 0.0 0.1 0.1 0.00 01/28186 3.0 0.01 0.01 0.0 0.0 0.2 0.1 0.0 0.01 01/31/86 3.0 0.03 0.02 0.1 0.0 0.1 0.1 0.0 0.01 02107/86 5.0 0.03 0.03 0.1 0.1 0.3 0.0 0.0 0.02 02/21/86 5.0 0.01 0.01 0.0 0.0 0.1 0.0 0.1 0.02 04108186 5.0 0.01 0.01 0.0 0.1 0.4 0.1 0.2 0.11 04lW86 5.0 0.00 0.00 0.1 0.1 0.2 0.0 0.1 0.02 06/17/86 5.0S 0.02 0.01 0.1 0.0 0.4 0.1 0.0 0.05 06/20/86 5.0S 0.02 0.01 0.1 0.0 0.5 0.2 0.0 0.05 06/24186 5.0S 0.02 0.00 0.1 0.0 0.2 0.0 0.1 0.02 06/27/86 5.0S 0.01 0.01 0.0 0.1 0.3 0.0 0.1 0.04 07/01/86 5.0S 0.00 0.01 0.1 0.0 0.2 0.1 0.0 0.04 07/03/86 5.0S 0.01 0.01 0.1 0.0 0.4 0.0 0.0 0.05
MIXED LIQOOR SUSPEIDID SOLIDS {AERATION TAN<) t
07/02185 1.5 0.06 0.03 0.2 0.8 7.9 0.2 0.4 0.52 07/05/85 1.5 0.10 0.04 0.5 1.7 13.7 0.3 0.5 1.25 07/09/85 1.5 0.06 0.05 0.4 1.6 10.5 0.2 0.5 1.04 07/12185 1.5 0.20 0.04 0.6 1.8 12.4 0.3 0.6 1.38 07/16/85 1.5 0.20 0.05 0.3 1.5 10.0 0.2 0.5 1.08 07/19/85 1.5 0.03 0.03 0.4 1.2 9.1 0.2 0.4 0.91 07/23185 1.5 0.21 0.03 0.1 1.0 7.8 0.2 0.4 0.77 07/26/85 1.5 0.23 0.03 0.3 0.9 9.6 0.2 0.4 0.74 07/30/85 1.5 0.24 0.04 0.2 1.0 8.8 0.2 0.5 0.74 08/02/85 1.5 0.04 0.06 0.4 1.8 15.4 0.4 0.5 1.77 08106/85 1.5 0.22 0.04 0.2 1.1 7.0 0.2 0.4 0.81 08/09/85 1.5 0.23 0.03 0.2 1.4 8.3 0.2 0.4 0.70 08113/85 1.5 0.24 0.04 0.2 0.9 8.0 0.2 0.3 0.63
ID1'E: Refer to Figure 2 for sample locations. *Flat surface area of discs, wi til discs exposed except as noted. tGrab sample. SOiscs covered.

66
APPENDIX TABLE D.1.--continued
AVElUIGE HEAVY METALS
DATE IDDRADLIC
1v;3 Cd Cr CU Fe Ni Ph Zn LO.lIDIK; (gpd/ft2) * (ng/!)
08116/85 1.5 0.27 0.05 0.3 1.3 9.7 0.3 0.4 1.21 08123/85 1.5 0.27 0.01 0.2 1.2 8.6 0.3 0.2 1.43 08/27/85 1.5 0.28 0.07 0.4 1.2 8.7 0.4 0.1 1.40 09/10/85 1.5 0.10 0.04 0.2 1.0 7.2 0.2 0.4 0.86 09/13/85 1.5 0.21 0.01 0.2 1.0 6.1 0.0 0.2 0.96 09/20/85 1.5 0.19 0.12 0.1 1.0 6.8 0.0 0.0 0.84 09/24/85 1.5 0.21 0.08 0.2 1.1 9.3 0.2 0.4 1.05 09/27/85 1.5 0.19 0.08 0.1 0.9 7.9 0.2 0.2 0.93 10/08185 1.5 0.20 0.04 0.0 0.9 6.6 0.2 0.3 0.64 10/11/85 1.5 0.19 0.04 0.0 0.7 7.5 0.1 0.4 0.69 10/22/85 1.5 0.24 0.04 0.2 0.9 12.0 0.3 0.0 1.01 11/22/85 3.0 0.22 0.04 0.2 1.2 10.0 0.2 0.5 0.93 11/26/85 3.0 0.22 0.03 0.3 1.2 8.0 0.2 0.3 0.78 11/29/85 3.0 0.02 0.03 0.5 1.3 10.2 0.3 0.3 0.83 12110/85 3.0 0.27 0.04 0.5 1.4 9.9 0.2 0.5 1.05 121l3/85 3.0 0 .. 03 0.04 0.1 1.2 7.9 0.2 0.4 0.84 12117/85 3.0 0.09 0.04 0.1 1.3 8.7 0.2 0.4 0.88
SEXX>IDARY CLARIFIER EFFLUENl.'f 07/02185 1.5 0.02 0.01 0.0 0.0 0.2 0.1 0.0 0.03 07/05/85 1.5 0.03 0.01 0.0 0.0 0.2 0.0 0.0 0.07 07/09/85 1.5 0.00 0.01 0.0 0.0 0.0 0.1 0.0 0.04 07/12185 1.5 0.00 0.00 0.1 0.0 0.1 0.0 0.0 0.01 07/16/85 1.5 0.02 0.01 0.0 0.1 0.4 0.1 0.2 0.08 07/19185 1.5 0.00 0.01 0.0 0.0 0.3 0.2 0.1 0.04 07/23/85 1.5 0.01 0.02 0.0 0.0 0.1 0.0 0.0 0.00 07/26/85 1.5 0.02 0.01 0.1 0.0 0.1 0.0 0.1 0.02 07/30/85 1.5 0.12 0.02 0.0 0.0 0.0 0.0 0.2 0.03 08/02185 1.5 0.07 0.00 0.0 0.0 0.3 0.1 0.0 0.04 08106/85 1.5 0.02 0.00 0.2 0.1 0.2 0.1 0.0 O.ll 08109/85 1.5 0.02 0.02 0.1 0.0 0.2 0.1 0.0 0.10 08113/85 1.5 0.03 0.00 0.1 0.0 0.2 0.0 0.0 0.04 08116/85 1.5 0.04 0.00 0.0 0.0 0.2 0.1 0.1 0.03 08120/85 1.5 0.01 0.02 0.0 0.0 0.2 0.1 0.0 0.01 08123/85 1.5 0.00 0.00 0.2 0.0 0.2 0.0 0.2 0.03 08127/85 1.5 0.05 0.00 0.1 0.0 0.2 0.1 0.1 0.04 08130/85 1.5 0.05 0.02 0.1 0.0 0.1 0.3 0.05 09/03/85 1.5 0.03 0.00 0.1 0.0 0.2 0.0 0.0 0.02 09/10/85 1.5 0.16 0.00 0.1 0.0 0.2 0.2 0.1 0.03 09/13/85 1.5 0.07 0.02 0.0 0.1 0.3 0.1 0.2 0.07 09/17/85 1.5 0.04 0.00 0.2 0.0 0.1 0.1 0.1 0.04 09/20/85 1.5 0.03 0.01 0.0 0.1 0.3 0.1 0.2 0.09 09/24/85 1.5 0.06 0.01 0.2 0.1 0.4 0.2 0.2 0.04
NJl'E: Refer to Figure 2 for sample locations. *Flat surface area of discs, with discs exposed except as noted. fGrab sample.

67
APPENDIX TABLE D.1.-continued
A~E HFAVY METALS
DATE HYDRAULIC
Ag Cd Cr CU Fe Ni Pb Zn LOADIOO (gpd/ft2) * (ng/I)
09/27/85 1.5 0.07 0.03 0.3 0.0 0.1 0.2 0.0 0.03 10/01/85 1.5 0.02 0.00 0.0 0.0 0.1 0.1 0.0 0.01 10/04185 1.5 0.01 0.00 0.1 0.0 0.2 0.0 0.0 0.02 10/08185 1.5 0.01 0.00 0.1 0.0 0.2 0.0 0.0 0.01 10/11/85 1.5 0.02 0.0 0.0 0.2 0.0 0.0 0.05 10/15/85 1.5 0.02 0.01 0.1 0.0 0.1 0.0 0.0 0.04 10/18185 1.5 0.01 0.00 0.0 0.1 0.2 0.1 0.0 0.06 10/22/85 1.5 0.01 0.00 0.0 0.0 0.1 0.0 0.0 0.03 10/25/85 1.5 0.02 0.01 0.0 0.0 0.2 0.1 0.0 0.06 10/29/85 3.0 0.01 0.01 0.0 0.1 0.1 0.0 0.0 0.02 11/01/85 3.0 0.03 0.02 0.0 0.0 0.1 0.0 0.0 0.05 11/05/85 3.0 0.01 0.00 0.0 0.0 0.1 0.0 0.0 0.03 11/08185 3.0 0.02 0.01 0.0 0.0 0.1 0.1 0.1 0.07 11112/85 3.0 0.03 0.00 0.0 0.0 0.1 0.0 0.1 0.03 11/15/85 3.0 0.01 0.03 0.1 0.0 0.1 0.0 0.0 0.08 11119/85 3.0 0.03 0.02 0.0 0.0 0.1 0.0 0.0 0.05 11/22/85 3.0 0.01 0.00 0.0 0.0 0.0 0.0 0.0 0.04 11/26/85 3.0 0.00 0.00 0.1 0.0 0.1 0.0 0.1 0.03 11129/85 3.0 0.01 0.01 0.1 0.1 0.7 0.1 0.1 0.43 12106/85 3.0 0.00 0.02 0.1 0.0 0.6 0.2 0.1 0.08 12110/85 3.0 0.01 0.02 0.1 0.0 0.4 0.1 0.1 0.05 121l3/85 3.0 0.01 0.00 0.1 0.1 0.6 0.2 0.0 0.10 12117/85 3.0 0.00 0.01 0.0 0.0 0.4 0.2 0.1 0.05 12124185 3.0 0.00 0.00 0.0 0.1 0.2 0.0 0.0 0.04 12127/85 3.0 0.02 0.00 0.0 0.1 0.4 0.0 0.0 0.05 12131/85 3.0 0.00 0.01 0.0 0.0 0.1 0.0 0.0 0.03 01/07/86 3.0 0.00 0.01 0.0 0.1 0.5 0.0 0.0 0.10 01/10/86 3.0 0.01 0.00 0.0 0.0 0.1 0.1 0.1 0.06 01/17/86 3.0 0.02 0.02 0.0 0.0 0.1 0.0 0.1 0.00 01/24186 3.0 0.02 0.01 0.0 0.1 0.1 0.0 0.1 0.04 01128/86 3.0 0.02 0.00 0.0 0.1 0.1 0.1 0.0 0.04 01/31/86 3.0 0.01 0.01 0.1 0.0 0.0 0.0 0.00 02104186 5.0 0.02 0.00 0.0 0.0 0.3 0.1 0.0 0.05 02107/86 5.0 0.01 0.02 0.1 0.1 0.2 0.0 0.1 0.09
FINAL Et'F'LUENl't
07/02185 1.5 0.01 0.01 0.0 0.0 0.0 0.0 0.0 0.02 07/05/85 1.5 0.01 0.02 0.0 0.2 0.2 0.0 0.0 0.05 12103/85 3.0 0.02 0.00 0.0 0.2 0.2 0.0 0.0 0.02 02l2l/86 5.0 0.03 0.01 0.1 0.1 0.6 0.1 0.0 0.11 07/01/86 5.0§ 0.01 0.01 0.0 0.0 0.9 0.0 0.0 0 .• 04
Wl'E: Refer to Figure 2 for sample locations. *Flat surface area of discs, with discs exposed except as noted. t24-hr composite sample except as noted. §Discs covered.

68
APPENDIX TABLE D.1.-COntinued AVERlV3E HFAVY METALS
DATE HYDRAIJLIC
Ag Cd Cr CU Fe Ni Pb Zn I.(W)IN:;
(gpd/ftZ) * (ng/1)
RAW SLUDGET 09/17/85 1.5 0.02 0.53 5.9 58.0 264 4.6 2.1 32.1 09/20/85 1.5 0.13 0.46 6.7 33.8 260 5.0 2.0 34.7 09/24/85 1.5 0.02 0.18 4.1 24.1 191 2.9 0.6 22.2 09/27/85 1.5 0.07 0.29 4.5 24.4 192 3.4 0.8 2l.0
~IGFSl'ED SLUDGEt 09/20/85 1.5 0.13 0.35 6.0 40.5 288 0.9 2.1 28.9 10/04185 1.5 0.25 0.44 9.6 47.9 373 1.1 3.3 37.8 10/11185 1.5 0.05 0.45 9.4 46.9 380 1.1 3.2 35.1 10/15/85 1.5 0.18 0.42 7.3 48.2 378 1.2 2.9 35.6 10/25/85 1.5 0.20 0.37 8.3 45.2 405 1.1 3.0 34.6 11/01/85 3.0 0.21 0.38 8.4 46.3 475 1.1 2.6 35.5
N1I'E: Refer to Figure 2 for sample locations. *F1at surface area of discs, with discs exposed except as noted. tGrab sample.

69
APPENDIX E.l. CAPITAL COOTS AND OPERATION AND MAIN'lENAlO: EXPENSE
Material prcwided, with the ~rmission to utilize in this report, by Albert Tsuji, and M.e. Nottingham of Hawaii, Ltd., Honolulu, Hawaii

Dote
To
Subject
71
.Inter-Offi\;~ Envirex
January 25, 1984 --_._---_. --
Albert Tsuji
a Rexnord Company
cc: Dick Davie Ed Saffran
Process Design Proposal for the Honouliuli Wastewater Treatment Facility
Dear Albert:
Enclosed is a binder containing our Process Design Proposal for the subject project. Also included are data and technical papers dealing with the RBC process and the AERO-SURF RBC process.
As you will note, the attached design does not vary too much from the design presented to the City and County of Honolulu back in 1980. Due to the tight land requirements, the previous submitted layout works the best.
As we did in 1980, the following is the energy consumption comparison between the proposed RBC process in the Turbine Aerator Activated Sludge Process previously considered.
At~per KW the energy usage will be: $O.10x(375+125HP 0.745) x 24 x 3~= $326,310 per year for the Rotating Biological Contactor process and 10.10x{1,125+125HP 0.745) x 24 x 365 = $815,556 per year for the Submerged Turbine Activ~ted Sludge Process.
The difference works out to be $489,246 per year, or $9,784,940 savings over 20 year life of plant.
Please let me know if further data or help is required.
Very truly yours,
§tiS RAlsos

72
Flow, D~:I~ A"~r8ae
F=lo wJ N1~)Cjh1L1n'1 t40LJrI~
I=low 1 Pea k-
l=low M: n il')'0m ,
'BO.I>~
'BODS-
'BODs (Solu b Ie)
PS$
TSS
Wa~tewaie( T(rr'lftr.;tu re
'80'0,"
TsS
No+es
25.0N16D
~? 5" Nt G-P
GI.OMG-D
\'7. 9 MG-D
441000 Ib~/da'ts
2.1/ m~/e
(IDe WI~ Ie) 35'. iVO 'b~ /d" ~ 17~ I'na It G(fa-ter than 55 QF
I. E',.,,,ire,>c QS+imafe of v~lue~ are 'Shown ~~ ps,eVltht'si$.
2. Ihclv~+da I 'BODs load i~ assul't'~d -to be Ie~s fhal"'l 10'1.:> of the toT. I 80DS'
?>.£n,,:rex a~&)01e!> 1haT 4he abOol~ ".lIeU'S ind""cl.e BODS', fJH a-N6V'1d. TS'S re-lIJf'Y\ lroWi ~I""c:li~ Cond:f.iot"lj"'8 ~~5tems.

DE~I(;tJ CALCU\..ATIONS
Pri l'I"\a r,& Tre:lil-fl~ n-t
T'jpe: Grit Re,.,-.oval and Pt"irn8r~ cl~r"rfic_+io",
BODS R~/Ylolled! NoT arr/i~~ble a~ +he J2'Be d~:'a'" i-s based 0...,
SDI.., I:)le BODS
5ec..ond~r"~ Tre~tmenT
T'jpe ~ FlE:I2o-sv~F ~ot43-t;h~ Bjolo~ j ~;J' Coflta~tor~ (esc)
I .... f/..,ent Sol&Jble BODs
SoloJble BODs '= ToTal B01>, - (TS~7<O"")
losrYlS/e = ~11W\41e. -('?2Ma/e .,cO.,)
Ef'flue","'" Soluble BODs-
IC. 8' Sur-face Area e a I(!u/ a t:ons
FroM F1~120-SlJeF' CUNe" (C·IA)J the h~dra'.";e lo_d (~.LJr4i't"'i""cL to
,..~d\Jee SQI",ble Bobs frbh"l 108 r'r'3/..t. to 'S" WId lei ~ ~.403edh. ft.
No tQrnreratvre ~orree:fj"V\ is ... etu:rec£.jc9~ the fe""'~~e tefrlf~r-+&Jre
i~ area+~(" th~1"I 55"F
73

74
Med:a ~",.f .. ce Area i21tu;red..
$urf.ace At'''- t?e1oJ:r«cL = Avera~e 1>.l;'~ ~Icw -:- ~, L.
10, 41G, ", 51' k. = 2.5,oooJooo~pcL -+ e,4~fd/s~. ff.
£1v~rrnet'lf 6elec.T;Qn
T2~'''n'\mlllnJe.cJ. tVumber "f Sioaaes: TwJc (2.) or' Th('e~ (1)
Sice(~",,....f.ee _re.)c{ flr~t ~t.B8e: 4) ~oo, 000 ffL min.
Stand~r'd l>en:.;toa tJJ~d;;a \"(\u~+ be IJsed in ~:t'5t st-ae.
~iih 1>~,,~Hd I"led'. shoulJ be lJ~eJ i:s. $ubsc, ... ~",,+ sia"eS
E'11J:rrn"'~i : 4S'-F\1.I7ofR.:>L. l'<1oclel 703-2.51 S-f .... t:l. .. ,-c/. DI'I"~H'a AE.eo-su£~ I2SC
~s,eMblje~, esch w:th 110,000 s'i' ff, cf 'Surface .. rea fc!>r a
+ct:a.' cf 4)'350 ) 000 ~~ • .ft. of medl a '5urfa~~ :ii "ea.
4S"-~uToTrec)L .. Mc::Id.e1 ?"-~51 t-li1'" Det'\':IH4 fJ£"~O- SuR.F RaG
~~5 ~M bl i~, e_~ wah 1'1-2.) aoe, Sf' Tt. CT- ~lJr.f~,~ st". for a
tota.l er tG,'30o} 000 s,,;4, cf W)edia 5vrface a rea.
lOTAL 5u,-f'ace .,e_ q'r'D\llded ...... :11 be " , .3L1-0, 000 '"1' #. ",.
1c>,'H~I~(.1 s1'(J., of tr'\ed:a svrf.c.1! .rea r,etp",;rcd. ..
E1U~PrY'lc?"..t l'ol'l.f~,",,.,;t:on and lcV'!t:l. l2e1'vi~mt't'\t:!>
See at1achecL s k.crfche-s and drZlwi"S s.

E'1"'~ rmet"'lt
HONCh/LIUJ..IJ
OAHIJ, H AWA II
9-5 -80 e4!";s~&.. 1-23-~1f
CA PI IA L- C O~. t::"S., NI A T e:~
If5-f'tlooel 70.3-251 FlEEo-:5ue.F .~~~mblip~ 4S"-Nl~~1 161-25"1 A£i!D-5tJR..F :a~seMbliE"~ 90- AE~o-Suel=' l=":be('~ l:as~ ~o"er~ 90 - A~(' head~(. witj;. d j';;u".-r.
75
1- Hem 0+ c::.~eclt.. Df it\~tall:atiD" fd"~("+-"'r 1- I+~r)\ 1>1 ~p;,.,.e fsn $
1- If.el"l"t of ;-rar'l~f()('t_"io ... to Wf"~i ~D~~t dod:! TOTAL- ~ "1,900/000
1- Hen'\ 0'; O~es 1"\ F'''~:ah-t ifd d
~bo,.. and Nl.,+erial E:dllYlaies
L3b()r-5~_?f :tI -st.lI_tiOh(ihCI. c.'_ne Hme) 45)000
L~bor-c:9:'" J..~iildf'r :h-:rf;d/~~ ;0.... /8)000
Labor-t:b~("3/a'5s ~over jl'o~tafl~t:ot'" 63)000
Mi!>l!. ~:r f:q>i"1 4~OOO
B/o..vers (inc/. elec...fr:c'ill) 150)Ol:>O
B'ol4l~r Bu 1/ d; "1 @ «so/si' fl. 2..00,000
COtJt~~TE @ .#1!Joo /t..u..., ~ d. ',080,000
Increase these prices by 10%:* 1.10 x $6,501,000 = $7,151,000
Ad:'! contractor's peofit* and contingencies: Assume 15% of non-equipment items (0.15 x 1,761,000) 264,000
$7,415,000
950,000 $8,365,000
Sub-Total
Ad:'! $950,000 for ocean freight:*
*As per reocmnendatim of Albert Tsuji, M.e. Nottingham of Hawaii, Ltd., Hcno1ulu, Hawaii, AugUst 1986.

76
E"!I T 1M ATE'£) A I ~ 1C.f'(lIJIe.e H\ c:; l.JT
At-JD
TOTAL .:,. r'1",\r .. d .p.~f" :;;,ve,.a8e CJrer.a+i"~ t!ond:t-;ottS t~ IS,OOO$CENI
;orAL e~t~ty\~+ed d;s~ha('ae. p,.~s'S..,,.t! • ~ '3.0 psIG-
U$e 3 blowers run" ' .... ~I each ra+ed for ~OOOSC~M @ ~,o PSfc:r
N~""H~f?late Motor f.lorS~fo""(I(" 12"",:r~mt"..,+~~ . Nat)l~r'~.fe
Q"'il1,J:i r f.lo~r '111~~
3
ToTAL. "'or~~eDj/jtr
375
l 2. 5'
Notei. Si .... ce l2ellJr" SIIJd1e ~~ s te'1'\o\ i ~ P"Io-t- ret 1)'1 recC. J no add :+ion .. (
po~er w;" b~ re; .... ired. for ihis par+io" (W~~~e sludg-e
fl)"'rit\a wUI be re' .... r~cI) e. r+ is rt?aDmmeViJetP t"t-t_-I is h'\" 11~~()h1 of 5o?>o .~&&~+ion8.
acr be frov'IJe& .£,- st~",tR- b(t Furposes
:3 .. 1he "a(Y1erliilt~ ~OrSerOcA4'r:~ 12.5', The adcJa/ bfak-
hl>r~~fotAJ~J for eDhti:+io",- 0.( ,6,000 st!fm @:3·l:>fs:Q
is iOO,o hh P (-fff"D)G 'l~ kw !b/ol.4l~r]

Maintenance Schedule
Air Drive System
Daily: 1. Inspect pillO\'I blocks. blowers. motors. drives. etc. for
operation. ChecK shafts for uniform rotation and proper
speed. Report any unusual noises or operation.
Weekly: 1. Inspect oil level on blowers and fill as needed.
Monthly:
2. Wipe down oil' and grease around unit.
1. Clean air intake filters.
2. Greas~ blower bearings.
2 Months:
3 Months:
6 Months:
3. ChecK blower v-belts, wear, tension alignment.
1.' Check oi 1 in blowers.
l.
1.
Lubricate main shaft bearings.
Lubricate electric motors. .' . .
.2.. Co~~ stub.en~s of.shaft and pillow blocks with grease.
Estimate'd times for the above maintenance are: .
Daily - 2 minut.s/blower
2 minuts/shaft
Weekly - 6 minutes/shaft
- 10 minutes/blower
Monthly - 3~ minutes/blower
2 'Months - 30 minutes/blower
3 Months - 10 minutes/shaft
6 ;~onths - 5 minutes/blo:ver
- 30 minutes/shaft Total Hours Estimates
Per .Shaft
12.17
5.20
0.67
1.00 19.04
Man/Hr/Yr Per Blower
12.17
8.67
7.00
3.00
0.17
31.01
77
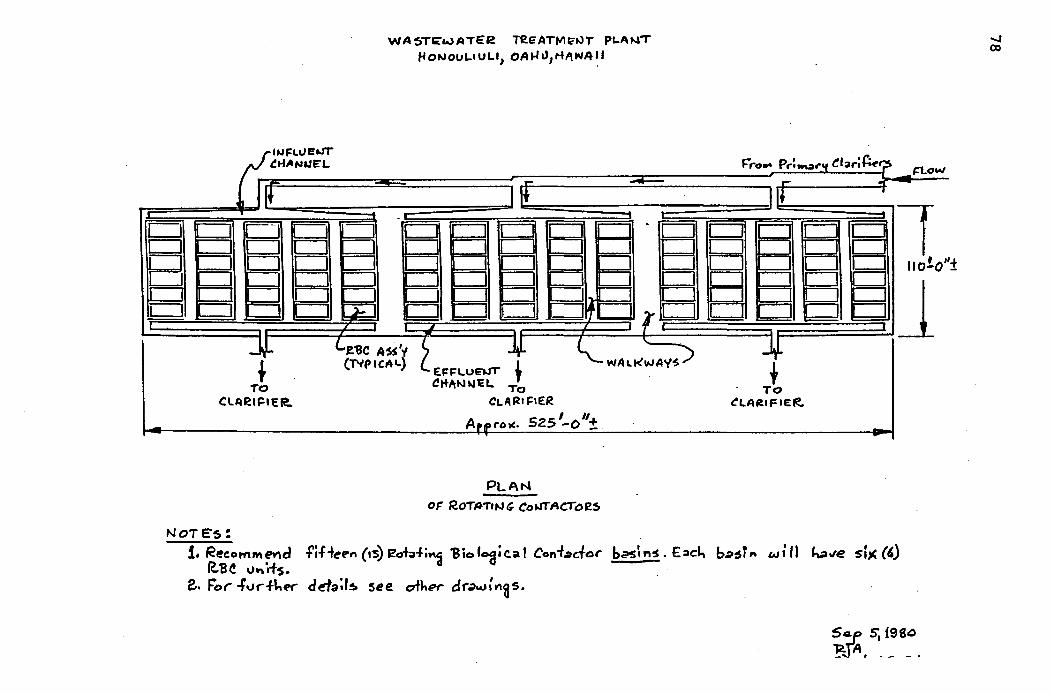
r=I CJ
WA5Tlir:wATE2 T2eATtllce~T PLAt-lT
tfONOIJL.ULI, OAt.h),HAWA~'
now
1 Ilolo"f
Ii' '=" mt' '==" m :=t' '==" '==-" ......... 1'-f l'F-" "===', '==', '==" '==fIJ _ J I II y II.
~ To
CLAelC:IEra.
NoT E'5:
E~J:l.UE"..rr 1 at+"t.hJcL. T~
CLAR.I='ER
A 5, /I
IO,.,.OK. 25 -0 +
PLAN
or RoT~TI'" G Co..rrACTDe~
1. R~eornM Md fif tt"E"n (IS) ~o-b""il'\~ 'B io 'oa; c.a t Con"'~d-t:)r b~~ "~ . t :lch b;:sT" w;" "-'"e sf)( (') R.:e e "'''' iis.
e, F"o(" .f"'rf\..tor d€taa~ see C1fl,E't" dr"'...,:I"I~s.
5~ S.19Sa 'J;t~ - ....... - _.
..... CO

)
~.
o . o ....... -,
. --.... -.... .... .... .... , ...
; 0
Sl . i ... lOG
: .. , ..
1442 sERIIs 3200 BLOWER
TYPICAL PERfORMAKCE
I"LET COMOITIO"S - AIR • 1~.7 PSIA , 70PF
I PI,
• PI, • PI,
.... a ·0 .. =;: ~ .... .... .... .... =3 ..: ,. ..
.. .. ... .. . . ,. .. .... .. .... ,. "'0 .. . -..... .. ..... . z· ~S u .. ~
a a ..
... .. .. .. . .. ... .. ~. ,. .... .. .. -.....
u ..... - .. ..... _0 .... .. a ... .. .. ~
79
IILET ,til COIUeTiO. '01 nUl TUI
no. IILET COI'ITI~.' ... , . • IUIUII "I ., 2 " • 10 40 56 70 10 27 38 47 1i0 " 19 23 70 0 0 0 to 12 17 21
110 25 35 ., ISO }5 49 61
he. IIH. .IUSUIE .11
-I,. 2 • • 20 492 689 853 .. }92 548 679 .. }l0 .}5 538 n 247 H6 429 12 195 273 }}8 10 151 212 262
• I I} 158 196
• 79 III 1}7
" 49 69 85 2 22 }I 38
rr-•• SIL
0 0 0 0 I 23 32 40 Z 42 59 73 3 59 83 103
S, • .. ". .lEnulE .11 Ir. 2 " • .Ii 278 389 482
•• 196 27. 339 . 7 131 183 227
•• 19 III I}1
•• 35 49 61 1.0 0 0 0 1.1 32 45 56 1.2 59 93 103 I. , B3 116 14' I.' 104 146 IBI 1.1 124 174 215 I.' 141 199 245
.... ,00 110 .. ,ISO 100 ,,0 tOO I" 700 JlO tOO '10 toO
'''Le T (OND' liONS
GAl
sP. U.
T"'" .,
VACUUM "MO.
'USS. PI"
_.
SPUD •• r.M.
C E R T I f I CAT I 0 " or, •• TINe CUSTOM,a
'OINT 'NUT e,w
'vaCHASI oao[. NO.
0'''. 'Al IS. .,. SA"" S 0"0'. NO. .... DAT[
IN'
DISCH_ T[M'. . , ..
Th. corr.ctlon tabl •• If. UI.d to correct the Inl.t capac It, curv •• at a ,IYln RPM. Inhrpohh In the tabl •• a. requlr.d and wh.n .or. than on. corr.ctlon I. b.ln, •• d., add and/or subtract a, Indlcatad.
Brake hors.pow.r I. d.p.nd.nt onl, on IPe.d and pr •• ,ur. and II unaffected b, capaclt, correction ••
for diff.rentlal pr."ur. curv •• oth.r than shown. Int.rpolat. b.tw •• n •• I.tlng curv •••

81
APPENDIX E.2. EXAMPLES OF RBC SIZm;, CAPITAL AND OPERATION CDS'IS FOR
A DESIGN FI..ClV OF 7.5 ngd, BY AIJ'lO'lROL CORroRATION (1983)

EXAMPLE NO.2 At a design flow of 7.5 MGD for the wastewater in Example No.1, it is required to produce an effluent of 30 mg/ltotal BOD (15 mg/I soluble BOD).
AERO-SURF PROCESS
1. Surface area calculation a. Influent soluble BOD = 75 mg/I
Effluent soluble BOD = 15 mg/I b. Hydraulic loading = 3.45 gpd/ ft2 fror:n Figure C-l A
c. Surface area = 7.5 x 1 ()6 gpd =2.17 x 1 ()6 IF 3.45 gpd/fF
2. Size of the first stage a. Effluent soluble BOD> 12 mg/I,therefore standard media
must be used. b. From Figure C-2A size of first stage = 43% c. Surface area = 2.17 x 10· x 0.43 = 0.93 x 10· fF
3. Media distribution Balance of surface area is Hi-Density media
4. Choice of configuration a. Standard media assemblies each have 100,000 It' b. Standard media assemblies (all in first stage)
0.93 x 1 ()O - 9.3 use 10 0.10 x 1 ()6
c. Hi-Density media area = 2.17 x 10· -1.0 xl ()6 = 1.17 x 10. fF
d. Hi-Density media assemblies each have 150,000 ft2 e. Hi-Density media assemblies =
1.1 7 x 10· = 7.8 use 8 0.15 x 10·
t. Two or three stage operation is recommended with second stage area ~ first stage
g. A possible configuration is: 2(SSSSS + HHHH) = 18
Where: Number preceding parentheses indicates the number of parallel flow paths or bays
"S" is a standard media assembly
"H" is a Hi-Density media assembly
S's or H's immediately inside parentheses indicate units in first stage
Balance of S's and H's separated by "plus" signs indicate the placement of units in subsequent stages
Number after "equal sign" is the total number of units
C 1879 AUTOTROL CORPORATION
83
CHAPTERC DOMESTIC WASTE DESIGN PROCEDURES
PAGE 26
5. Blower Selection a. & b.
Stage RPM profile and air requirements from Table C-3 and Figure C-7 (or Figure C-8)
NO. CFM STAGES RPM UNITS PER UNIT TOTAL ---
1 2
Total
1.3 1.0
10 8
18
160 115
1600 920
2520
c. At 54 CFM per kw power = 2520 -i- 54 = 47 kw(63 hpj d. Operating blower capacity = 2520 x 1.2 = 3024 CFM e. Minimum installed blower capacity = 18 units x 250
CFM/unit = 4500 CFM I. Blower recommendation:
Operating capacity is greater than 2000 CFM. Therefore, 3 blowers are to be used. Each blower is to provide a flow rate of 3024 -l- 2 = 1512 CFM ambient air at 3.0 psi. Total installed capacity is 1512 x 3 = 4536 CFM.
BIO-SURF PROCESS
1. Surface area calculation a. Influent soluble BOD = 75 mg/l
Effluent soluble BOD = 15 mg/l b. Hydraulic loading = 3.2 gpd/ft2 from Figure C-l B
c. Surface area = 7.5 x 10⁶
gpd = 2.34 x 10. ft2 3.2 gpd/f\'
2. Size of first stage a. From Figure C-3 overall soluble BOD loading 2.0
Ib/day/l000 ft2 b. From Figure C-2B size of first stage = 50%
c. Surface area = 2.34 x 1 Q6 x 0.50 = 1.17 x 10· It'
3. Media distribution Figure C-2B indicates that no Hi-Density media can be used.
4. Choice of configuration a. Total number of standard media assemblies required =
2.34 x 10· = 234 24 0.1 x 10. . use
b. Media assemblies in first stage = 1.17 x 10· O~ = 11.7 use 12
c. From Table C-2, 2 or 3 slages are recommended with stage two ~ 50% stage one
d. Possible configurations are: 3 (SSSS + SS + SS) = 24
or 4 (SSS + SS + S) = 24
or 6 (SS + S + S) = 24
AUTOTROL CORPORATION - Bla-Systems Division
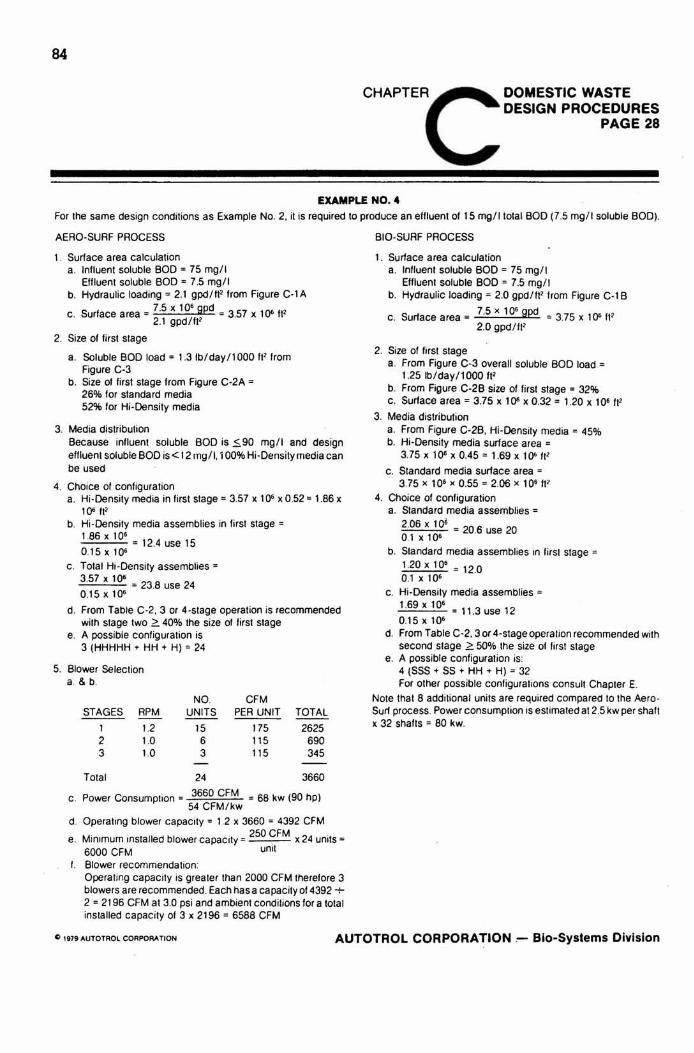
84
CHAPTEAC DOMESTIC WASTE DESIGN PROCEDURES
PAGE 28
EXAMPLE NO.4 For the same design conditions as Example No. 2, it is required to produce an effluent of 15 mg/I total BOD (7 .5 mg/ I soluble BOD).
AERO-SURF PROCESS
1. Surface area calculation a. tnfluent soluble BOD = 75 mg/I
Effluent soluble BOD = 7.5 mg/I b. HydrauliC loading = 2.1 gpd/ft2 from Figure C-1A
c . Surface area = 7.5 x 10; gpd = 3.57 x 1 ()6 II' 2.1 gpd IF
2. Size of first stage
a. Soluble BOD load = 1.3Ib/day/l000 II' from Figure C-3
b. Size of first stage from Figure C-2A =
26% for standard media 52% for Hi-Density media
3. Media distribution Because influent soluble BOD is $,90 mg/l and design effluent soluble BOD is < t2 mg/I, 1 00% Hi -Density media can be used
4. Choice of configuration a. Hi·Density media in first stage = 3.57 x 1 ()6 x 0.52 = 1.86 x
1 ()6 It' b. Hi-Density media assemblies in first stage =
1.86 x 10· = 12.4 use 15 0.15 x 10·
c . Totat Hi-Density assembties =
3.57 x 10· = 23.8 use 24 0.15xl0·
d. From Table C-2, 3 or 4-stage operation is recommended with stage two ~ 40% the size of first stage
e. A possible configuration is 3 (HHHHH + HH + H) = 24
5. Blower Selection a. & b.
STAGES RPM
1 1.2 2 1.0 3 1.0
TOlal
NO. UNITS
15 6 3
24
CFM PER UNIT TOTAL
175 2625 115 690 115 345
3660
c . Power Consumption = 3660 CFM = 68 kw (90 hpj 54 CFM/kw
d. Operating blower capacity = 1.2 x 3660 = 4392 CFM
e. Minimum installed blower capacity = 250 CFM x 24 units = 6000 CFM unit
t. Blower recommendation: Operating capacity is greater than 2000 CFM therefore 3 blowers are recommended. Each has a capacity of 4392 -;-2 = 2t96 CFM at 3.0 psi and ambient conditions for a total installed capacity of 3 x 2196 = 6588 CFM
BIO-SURF PROCESS
1. Surface area calculation a. Influent soluble BOD = 75 mg/l
Effluent soluble BOD = 7.5 mg/l b. Hydraulic loading = 2.0 gpd/IF from Figure C-l B
c. Surface area = 7.5 x 10· gpd = 3.75 x 1 ()6 IF 2.0 gpd/IF
2. Size of first stage a. From Figure C-3 overall soluble BOD load =
1.25 Ib/day/l000 fF b. From Figure C-2B size of first stage = 32% c. Surface area = 3.75 x 1 ()6 x 0.32 = 1.20 x 10· It'
3. Media distribution a. From Figure C-2B, Hi-Density media = 45% b. Hi-Density media surface area =
3.75 x 1()6 x 0.45 = 1.69 x 1()6 ft2
c. Standard media surface area = 3.75 x 10· x 0.55 = 2.06 x 10· IF
4. Choice of configuration a. Standard media assemblies =
2.06 x 10· = 206 20 0.1 x 10. . use
b. Standard media assemblies in lirst stage = 1.20 x 10· = 12.0 0.1 x 10'
c. Hi-Density media assemblies =
1.69 x 10' = 11 .3 use 12 0.15 x 10'
d. From Table C-2, 3 or 4-stage operation recommended with second stage ~ 50% the size of first stage
e. A possible configuration is: 4 (SSS + SS + HH + H) = 32 For other possible configurations consult Chapter E.
Note that 8 additional units are required compared to the AeroSurf process. Power consumption is estimated at 2.5 kw per shaft x 32 shafts = 80 kw.
C> '979 AUTOTROL CORPORATiON AUTOTROL CORPORATION- Blo-Systems Division

85
PAGE 33
CHAPTER E CAPITAL AND OPERATING COSTS
EXAMPLE NO. 17
To demonstrate the present worth procedure, a comparison of the Aero-Surf and Bio-Surf designs in Example NO.4 in Chapter C will be made.
AERO-SURF PROCESS
Capital Cost
Hi-Density media assembly total installed cost = $47,500(1)
Total capital cost = 24 units x $47,500/unit = $1,140,000
Power Cost
Present worth =68 kw x $008/kw-hr(2) x24hr/dx365d/yr x 11.47 present worth factor (3) = $546,600
Maintenance Cost
Blowers: Present worth 31.2 m-hr/blower-yr (4) x 2 operating blowers x $10/m-hr xll.47PWF=$7,157
Shafts: present worth = 2 m-hrlshaft-yr(4) x 24 shafts x $10 I m-hr x 11.47 PWF = $5,506
Totat Maintenance Present Worth = $12,660
Total Present Worth = $1,699,300
BIO-SURF PROCESS
Capital Cost
Standard media assembly total installed cost = $43,500 (1)
Hi-Density media assembly total installed cost = $47,500 (1)
Total Capital Cost: 20 standard units x $43,500/unit =$ 870,000 12 Hi-Density units x $47.500/unit = 570,000
$1.440,000
Power Cost
Power consumption = 32 units x 2.5 kw/unit (5) = 80 kw
Present worth = 80 kw x $0.08/kw-hr x 24 hr/d x 365 d/yr x 11.47 PWF = $643,000
Maintenance Cost
For shafts and drives
Present worth = 43.2 m-hrlshaft-yr x 32 shafts x $10/m-hr x 11.47 PWF = $158.560
Total Present Worth = $2,242,000
The total present worth for Ihe Aero-Surf process in this example is more Ihan 30% lower than for the Bio-Surf process.
'" 1979 AUTOTROL CORPORATION
(I) Includes media assembly, drive system, enclosure, tankage. freight and installation costs.
(2) Estimated average cost of power for 20-year period. This is an alternative to escalating power cost over the 20-year period.
(3) From Table E-Il (4) From Table E-12 (5) This value is for Autotrol mechanical drive Blo-Surf media.
The value for various competitive mechanical drive RBC systems is about 50% higher.
AUTOTROL CORPORATION - Bio Systems Division