Embed Size (px)
Citation preview
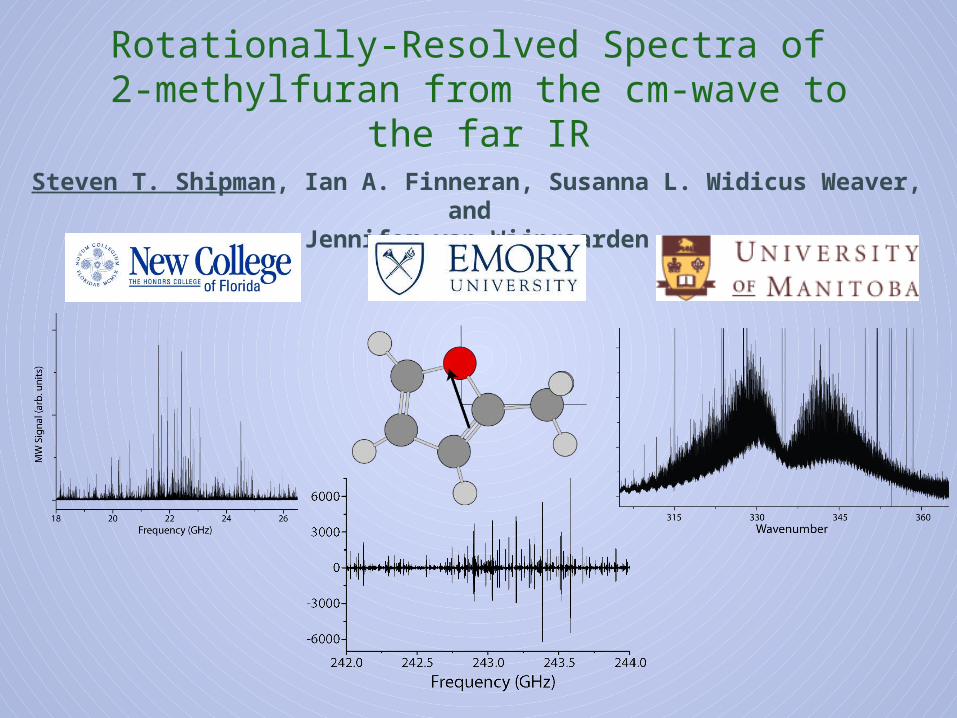
Rotationally-Resolved Spectra of 2-methylfuran from the cm-wave to the
far IRSteven T. Shipman, Ian A. Finneran, Susanna L. Widicus Weaver, and
Jennifer van Wijngaarden
2-methylfuran
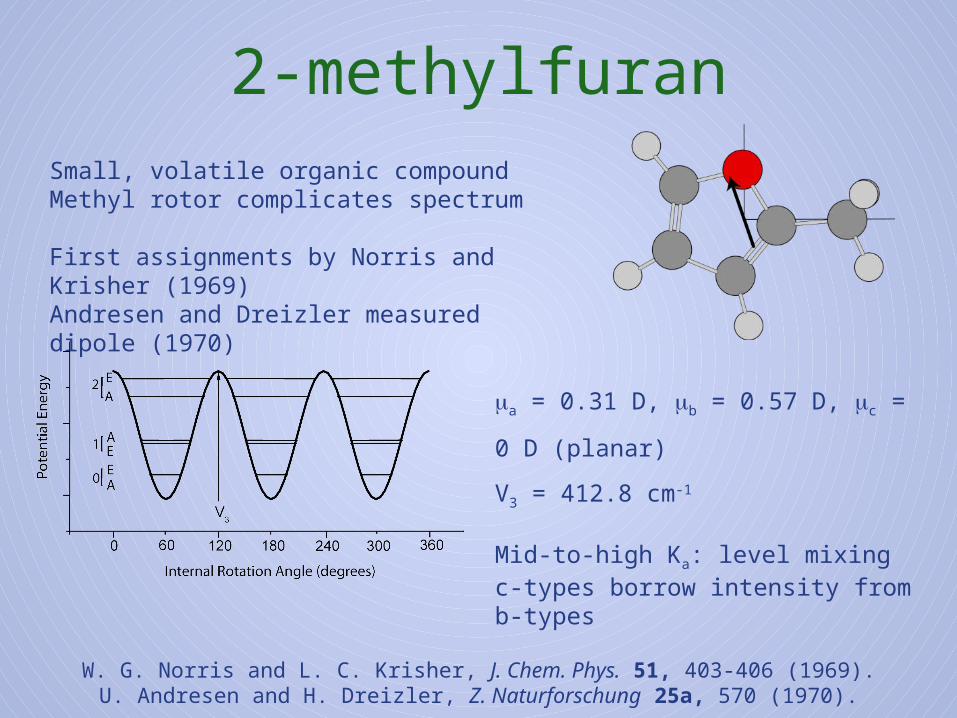
W. G. Norris and L. C. Krisher, J. Chem. Phys. 51, 403-406 (1969).U. Andresen and H. Dreizler, Z. Naturforschung 25a, 570 (1970).
Small, volatile organic compoundMethyl rotor complicates spectrum
First assignments by Norris and Krisher (1969)Andresen and Dreizler measured dipole (1970)
ma = 0.31 D, mb = 0.57 D, mc = 0
D (planar)
V3 = 412.8 cm-1
Mid-to-high Ka: level mixing c-types borrow intensity from b-types
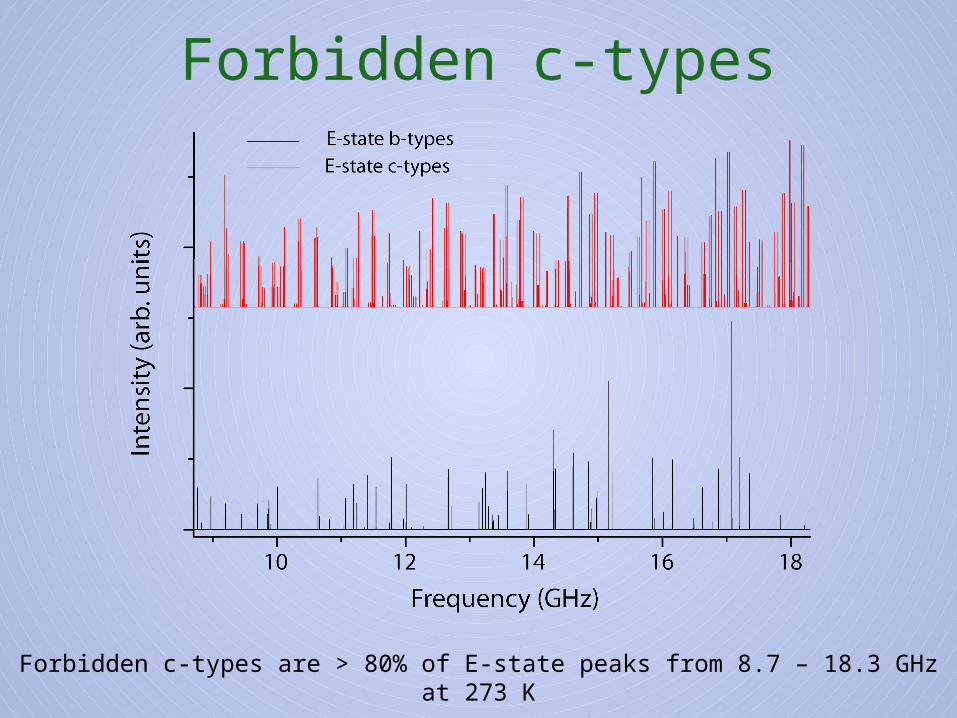
Forbidden c-types
Forbidden c-types are > 80% of E-state peaks from 8.7 – 18.3 GHz at 273 K
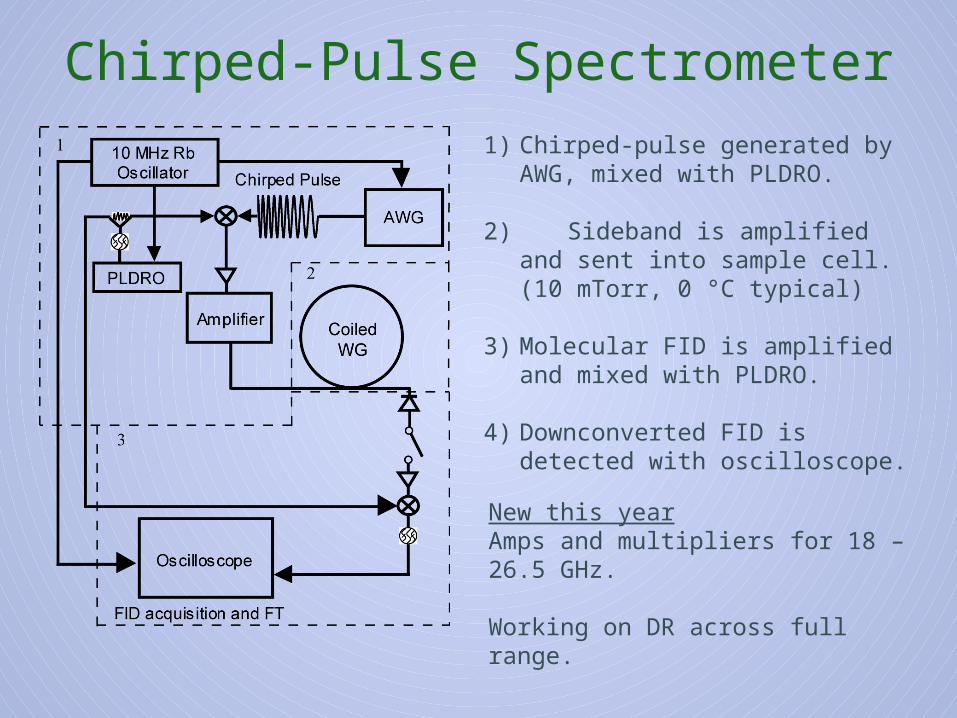
1) Chirped-pulse generated by AWG, mixed with PLDRO.
2) Sideband is amplified and sent into sample cell. (10 mTorr, 0 °C typical)
3) Molecular FID is amplified and mixed with PLDRO.
4) Downconverted FID is detected with oscilloscope.
Chirped-Pulse Spectrometer
New this yearAmps and multipliers for 18 – 26.5 GHz.
Working on DR across full range.
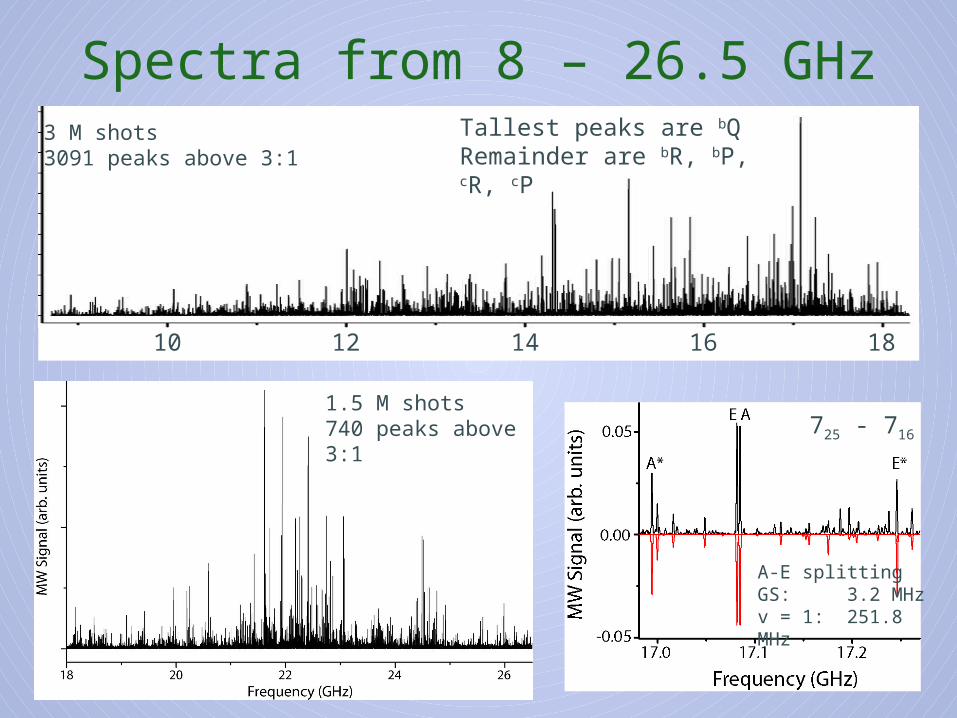
Spectra from 8 – 26.5 GHz
A-E splittingGS: 3.2 MHzv = 1: 251.8 MHz
725 - 716
3 M shots3091 peaks above 3:1
Tallest peaks are bQ Remainder are bR, bP, cR, cP
10 12 14 16 18
1.5 M shots740 peaks above 3:1
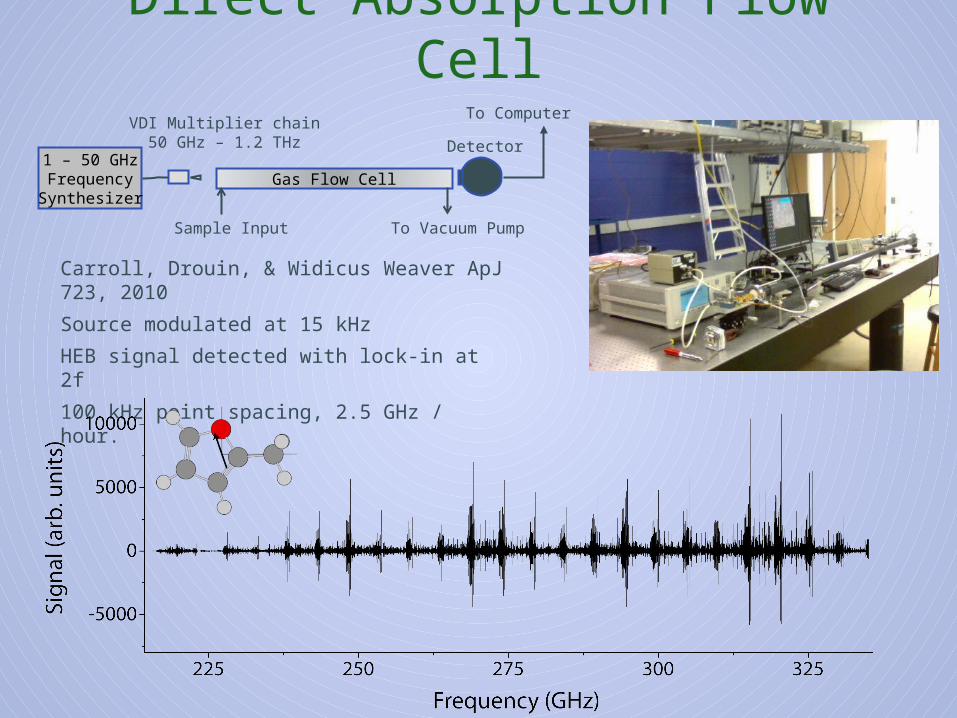
1 – 50 GHzFrequencySynthesizer
VDI Multiplier chain50 GHz – 1.2 THz Detector
Gas Flow Cell
To Computer
Sample Input To Vacuum Pump
Carroll, Drouin, & Widicus Weaver ApJ 723, 2010
Source modulated at 15 kHz
HEB signal detected with lock-in at 2f
100 kHz point spacing, 2.5 GHz / hour.
Direct Absorption Flow Cell
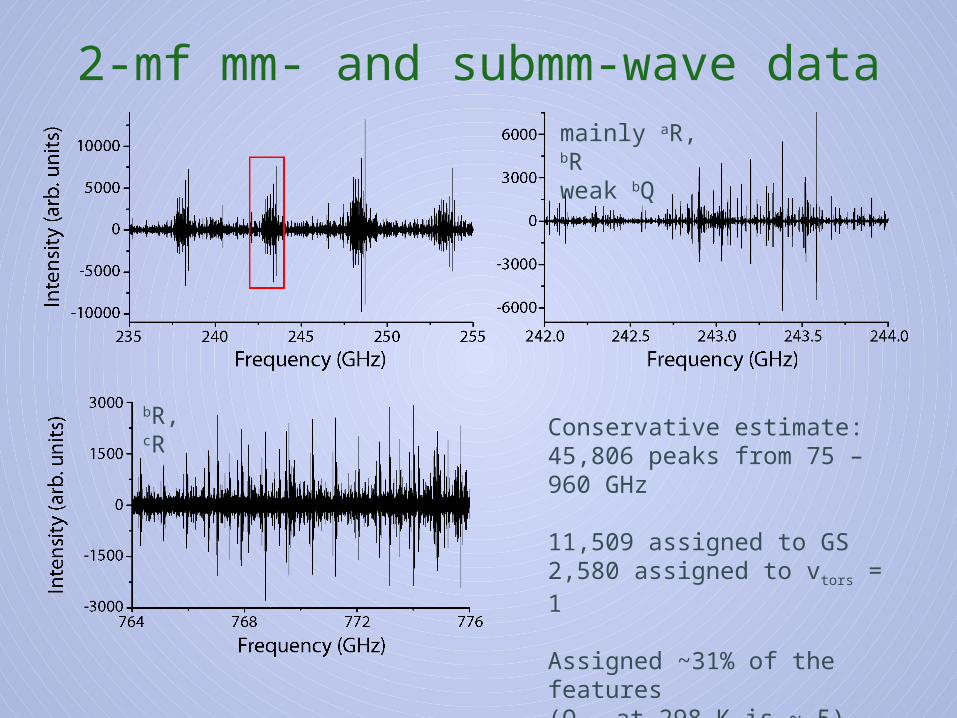
2-mf mm- and submm-wave datamainly aR, bRweak bQ
bR, cR
Conservative estimate:45,806 peaks from 75 – 960 GHz
11,509 assigned to GS2,580 assigned to vtors = 1
Assigned ~31% of the features(Qvib at 298 K is ~ 5)
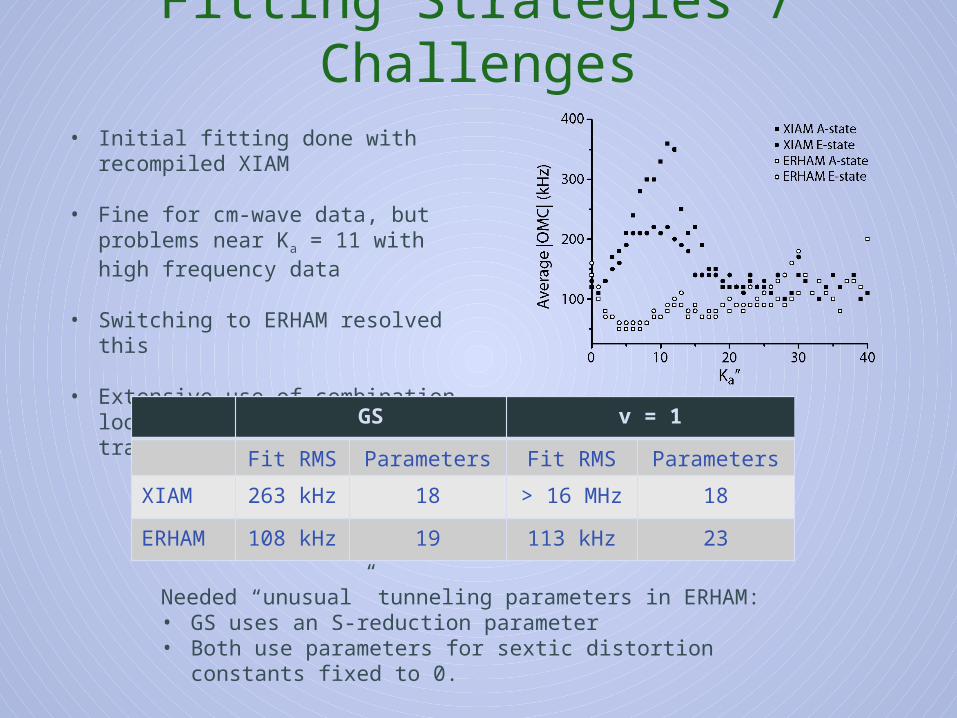
Fitting Strategies / Challenges
Needed “unusual” tunneling parameters in ERHAM:• GS uses an S-reduction parameter• Both use parameters for sextic distortion constants fixed to 0.
• Initial fitting done with recompiled XIAM
• Fine for cm-wave data, but problems near Ka = 11 with high frequency data
• Switching to ERHAM resolved this
• Extensive use of combination loops in assignment of weak bQ transitions
GS v = 1
Fit RMS Parameters Fit RMS Parameters
XIAM 263 kHz 18 > 16 MHz 18
ERHAM 108 kHz 19 113 kHz 23
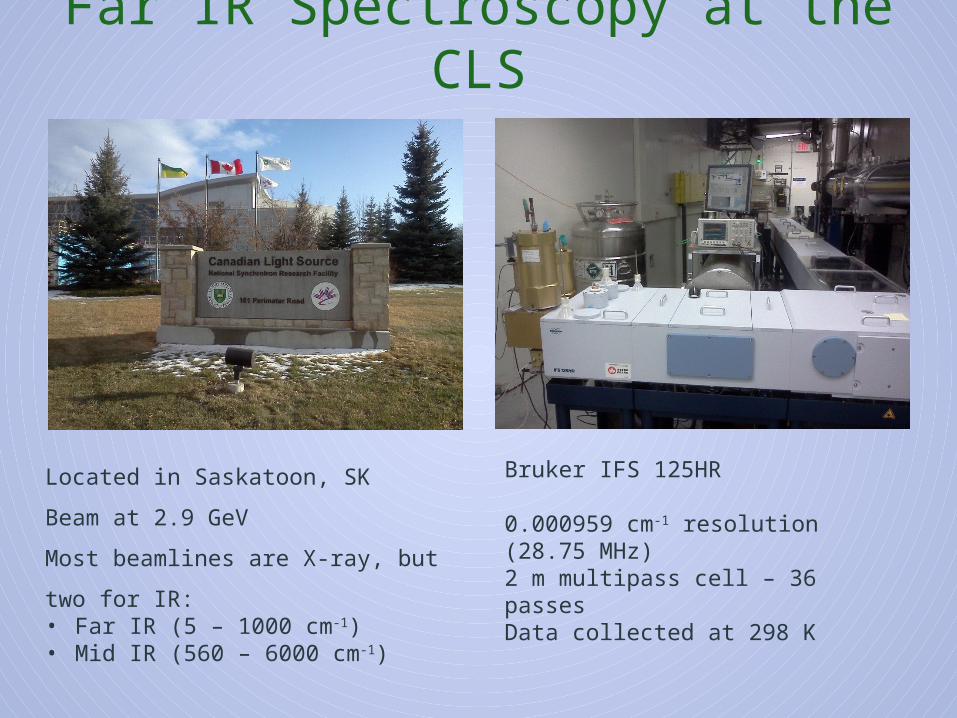
Far IR Spectroscopy at the CLS
Bruker IFS 125HR
0.000959 cm-1 resolution (28.75 MHz)2 m multipass cell – 36 passesData collected at 298 K
Located in Saskatoon, SK
Beam at 2.9 GeV
Most beamlines are X-ray, but two
for IR: • Far IR (5 – 1000 cm-1)• Mid IR (560 – 6000 cm-1)

2-mf Vibrational Modes
237.4 cm-1, 6.6out-of-plane bend
339.3 cm-1, 2.4in-plane bend
603.3 cm-1, 7.2ring puckering mode
628.7 cm-1, 1.3ring puckering mode
B3LYP / 6-311++G(d,p), with anharmonic frequency corrections
Si detector
Ge/Cu detector
Low pressure
High pressure
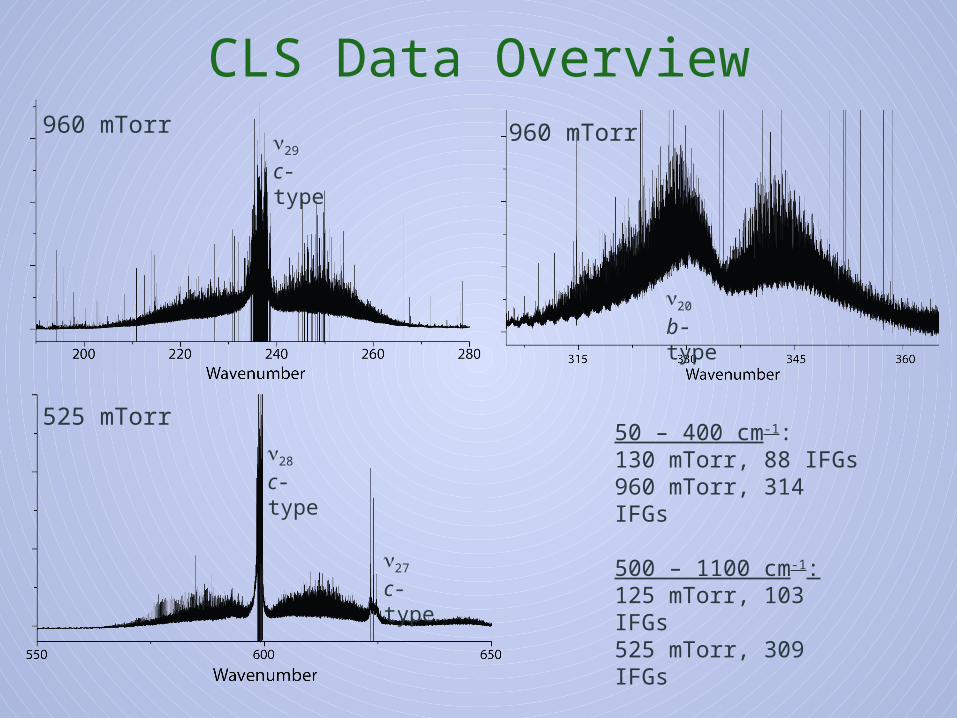
50 – 400 cm-1:130 mTorr, 88 IFGs960 mTorr, 314 IFGs
500 – 1100 cm-1:125 mTorr, 103 IFGs 525 mTorr, 309 IFGs
Roughly 5 IFGs / hour
CLS Data Overviewn29
c-type
n20
b-type
n28
c-type
n27
c-type
960 mTorr 960 mTorr
525 mTorr
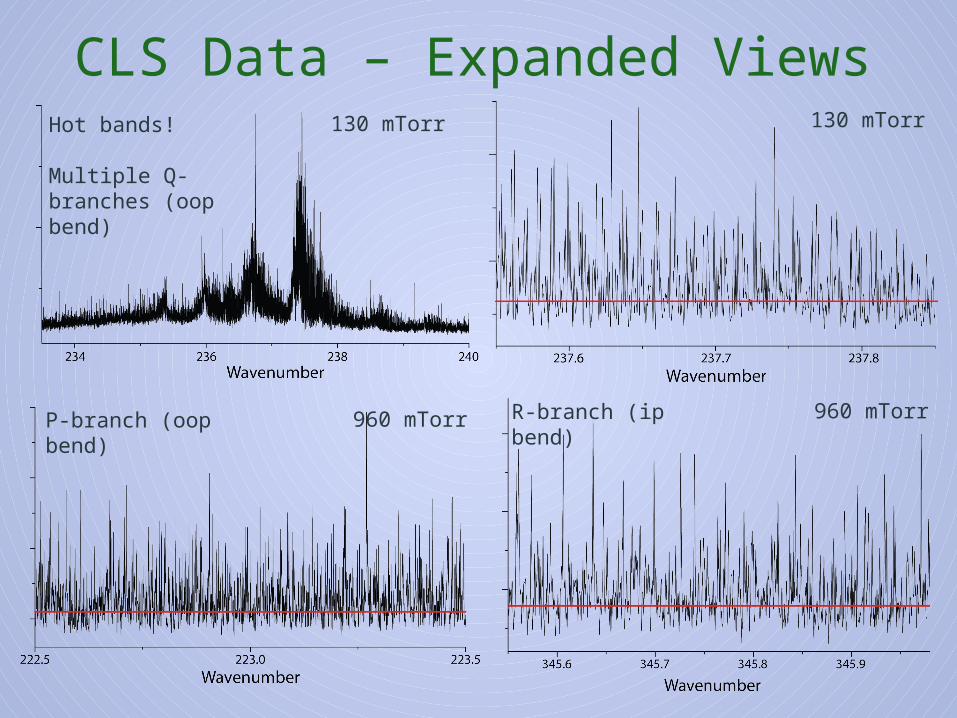
CLS Data – Expanded ViewsHot bands!
Multiple Q-branches (oop bend)
R-branch (ip bend)
130 mTorr
960 mTorr
130 mTorr
P-branch (oop bend)
960 mTorr
Summary and Future Work
• Beam time from August 8 – 13. Use chilled cell to reduce number of
hot bands.
• Fit far IR data, use constants as starting point for U-lines in 8.7 – 960
GHz data.
• Use full data set as testbed for developing more automated fitting
routines.
Future work:
Comprehensive fit of 2-methylfuran ground and first excited states.
Fitting with ERHAM was more successful than with XIAM; some strangeness with tunneling parameters, though.
Room-temperature data collected from 50 – 400 cm-1 and 500 – 1100 cm-1. Analysis greatly complicated by hot bands.
Acknowledgments
Funding
Dr. Brant Billinghurst
Canadian Light Source
van Wijngaarden groupUniversity of Manitoba
Widicus Weaver group
Emory University
Shipman groupNew College of
Florida
Noah Anderson (2012)Brittany Gordon (2013)
Erin Kent (2013)Sophie Lang (2014)
Morgan McCabe (2014)
Sam McCamant (2013)Christian Metzger
(2013)Maria Phillips (2013)
Ben Rooks (2013)Suzanne Setti (2014)

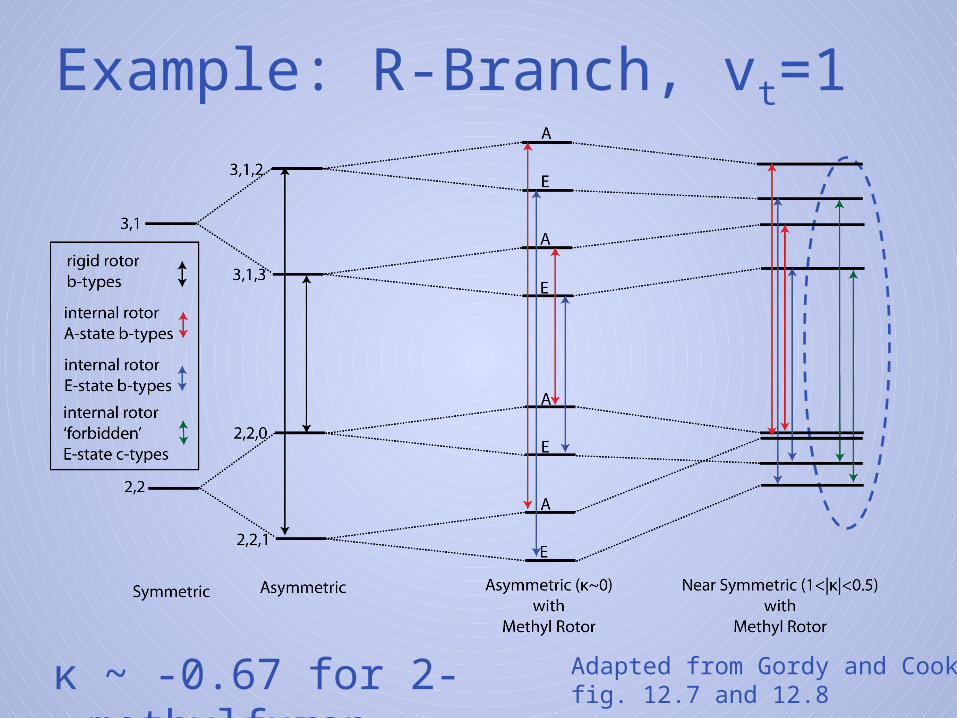
κ ~ -0.67 for 2-methylfuran Adapted from Gordy and Cook, fig. 12.7 and 12.8
Example: R-Branch, vt=1
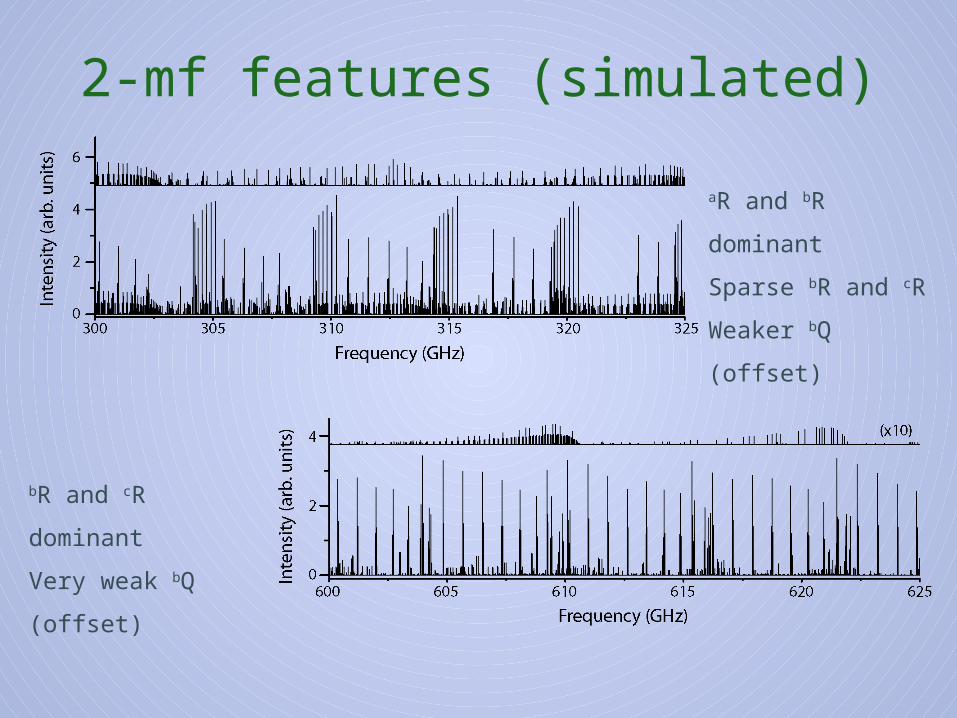
2-mf features (simulated)
aR and bR
dominant
Sparse bR and cR
Weaker bQ (offset)
bR and cR
dominant
Very weak bQ
(offset)
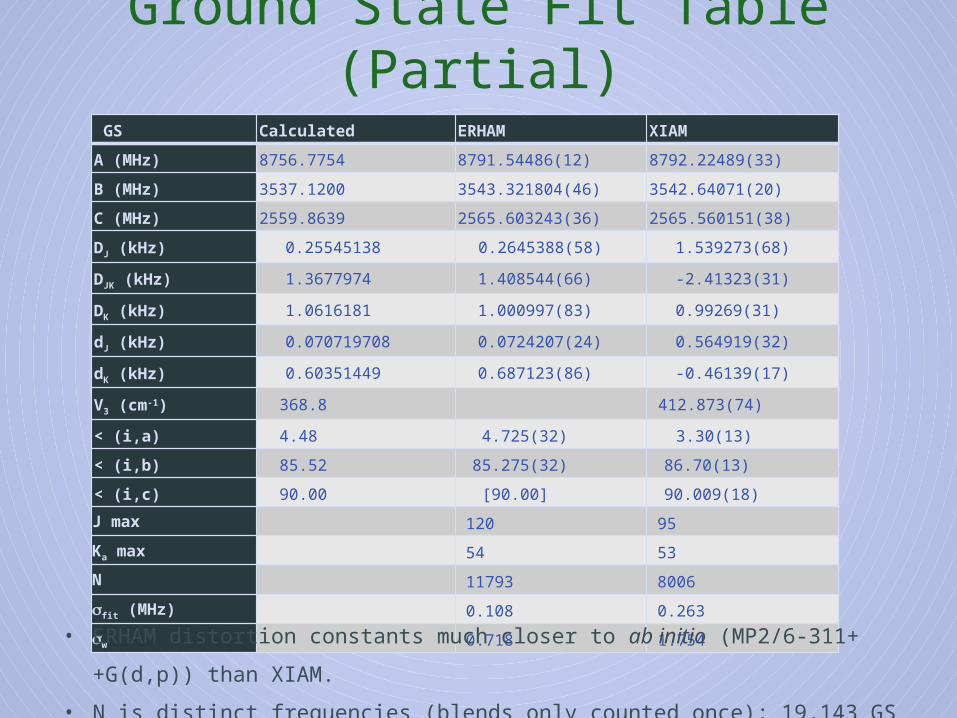
Ground State Fit Table (Partial) GS Calculated ERHAM XIAM
A (MHz) 8756.7754 8791.54486(12) 8792.22489(33)
B (MHz) 3537.1200 3543.321804(46) 3542.64071(20)
C (MHz) 2559.8639 2565.603243(36) 2565.560151(38)
DJ (kHz) 0.25545138 0.2645388(58) 1.539273(68)
DJK (kHz) 1.3677974 1.408544(66) -2.41323(31)
DK (kHz) 1.0616181 1.000997(83) 0.99269(31)
dJ (kHz) 0.070719708 0.0724207(24) 0.564919(32)
dK (kHz) 0.60351449 0.687123(86) -0.46139(17)
V3 (cm-1) 368.8 412.873(74)
< (i,a) 4.48 4.725(32) 3.30(13)
< (i,b) 85.52 85.275(32) 86.70(13)
< (i,c) 90.00 [90.00] 90.009(18)
J max 120 95
Ka max 54 53
N 11793 8006
sfit (MHz) 0.108 0.263
sw 0.718 1.754
• ERHAM distortion constants much closer to ab initio (MP2/6-311++G(d,p)) than XIAM.
• N is distinct frequencies (blends only counted once); 19,143 GS transitions in fit.
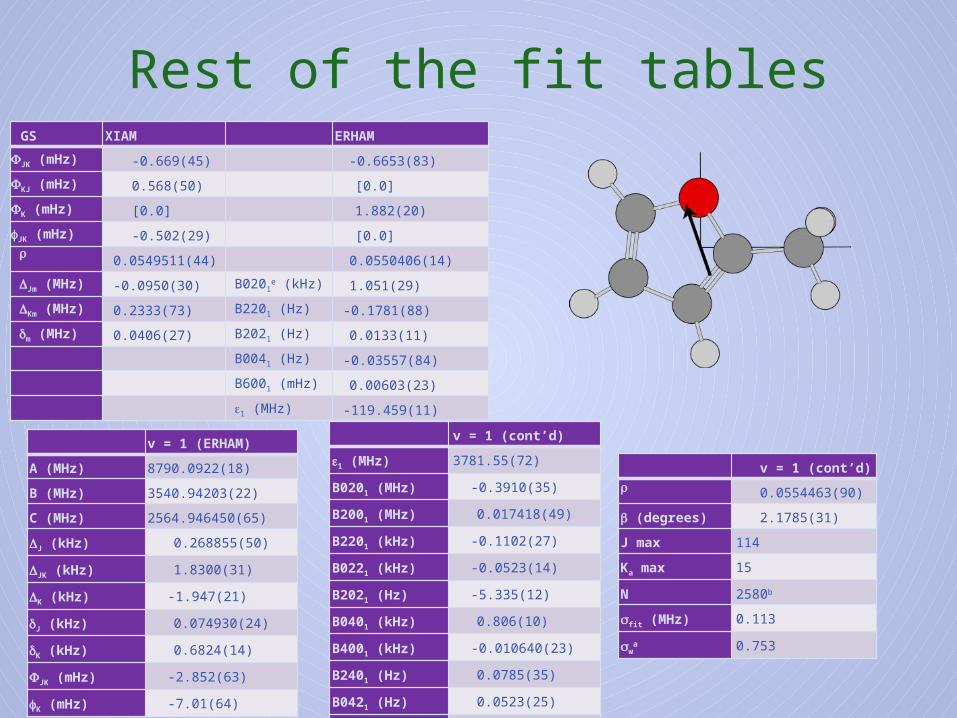
Rest of the fit tables
v = 1 (ERHAM)
A (MHz) 8790.0922(18)
B (MHz) 3540.94203(22)
C (MHz) 2564.946450(65)
DJ (kHz) 0.268855(50)
DJK (kHz) 1.8300(31)
DK (kHz) -1.947(21)
dJ (kHz) 0.074930(24)
dK (kHz) 0.6824(14)
FJK (mHz) -2.852(63)
fK (mHz) -7.01(64)
v = 1 (cont’d)
e1 (MHz) 3781.55(72)
B0201 (MHz) -0.3910(35)
B2001 (MHz) 0.017418(49)
B2201 (kHz) -0.1102(27)
B0221 (kHz) -0.0523(14)
B2021 (Hz) -5.335(12)
B0401 (kHz) 0.806(10)
B4001 (kHz) -0.010640(23)
B2401 (Hz) 0.0785(35)
B0421 (Hz) 0.0523(25)
B4201 (mHz) 1.354(61)
GS XIAM ERHAM
FJK (mHz) -0.669(45) -0.6653(83)
FKJ (mHz) 0.568(50) [0.0]
FK (mHz) [0.0] 1.882(20)
fJK (mHz) -0.502(29) [0.0]r 0.0549511(44) 0.0550406(14)
DJm (MHz) -0.0950(30) B0201e (kHz) 1.051(29)
DKm (MHz) 0.2333(73) B2201 (Hz) -0.1781(88)
dm (MHz) 0.0406(27) B2021 (Hz) 0.0133(11)
B0041 (Hz) -0.03557(84)
B6001 (mHz) 0.00603(23)
e1 (MHz) -119.459(11)
v = 1 (cont’d)r 0.0554463(90)
b (degrees) 2.1785(31)
J max 114
Ka max 15
N 2580b
sfit (MHz) 0.113
swa 0.753
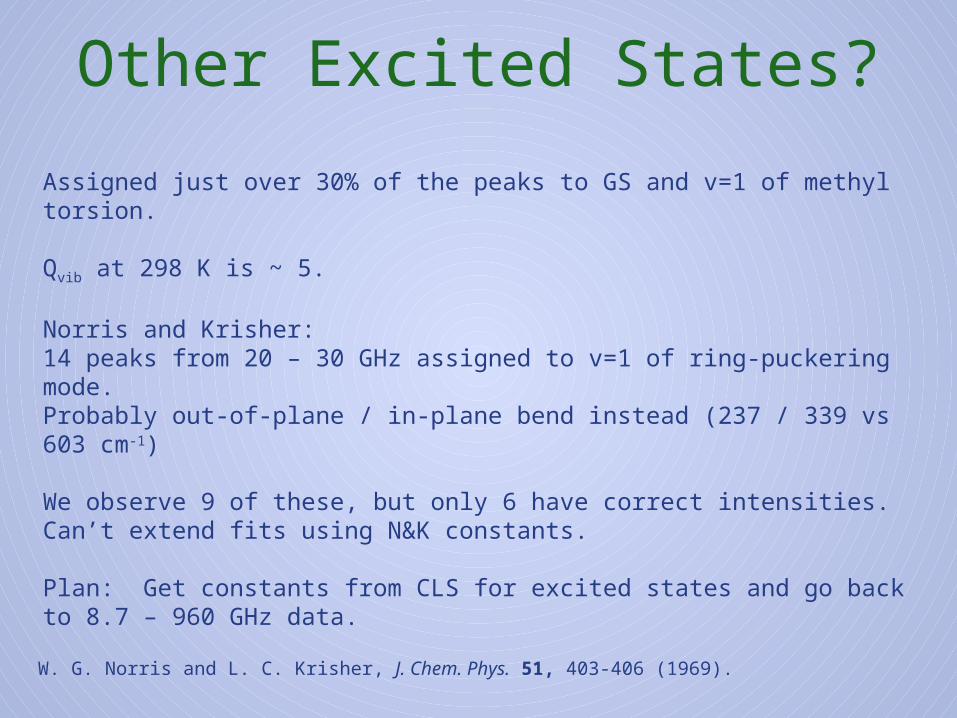
Other Excited States?
W. G. Norris and L. C. Krisher, J. Chem. Phys. 51, 403-406 (1969).
Assigned just over 30% of the peaks to GS and v=1 of methyl torsion.
Qvib at 298 K is ~ 5.
Norris and Krisher: 14 peaks from 20 – 30 GHz assigned to v=1 of ring-puckering mode.Probably out-of-plane / in-plane bend instead (237 / 339 vs 603 cm-1)
We observe 9 of these, but only 6 have correct intensities. Can’t extend fits using N&K constants.
Plan: Get constants from CLS for excited states and go back to 8.7 – 960 GHz data.


![1 ECE Department [I/O] ³ Input/Output Cubed Kevin Eykholt Tom Finneran Chris Pitoniak Shamit Som](https://img.pdfslide.net/doc/110x75/56649ce05503460f949aa47b/1-ece-department-io-inputoutput-cubed-kevin-eykholt-tom-finneran-chris.jpg)