Embed Size (px)
Citation preview
1
ROUND ROBIN TEST FOR COMPOSITE-TO-BRICK SHEAR BOND
CHARACTERIZATION
Maria Rosa Valluzzi1, Daniel V. Oliveira
2, Angelo Caratelli
3, Giulio Castori4, Marco Corradi4, Gianmarco de Felice5,
Enrico Garbin1, David Garcia6, Leire Garmendia6, Ernesto Grande7, Ugo Ianniruberto3, Arkadiusz Kwiecień8,
Marianovella Leone9, Gian Piero Lignola10, Paulo B. Lourenço2, Marialaura Malena
5, Francesco Micelli9, Matteo
Panizza1, Catherine G. Papanicolaou11, Andrea Prota10, Elio Sacco7, Thanasis C. Triantafillou11, Alberto Viskovic12,
Bogusław Zając8, Gina Zuccarino12
1: University of Padova, Department of Civil, Environmental, Architectural Engineering, Via Marzolo 9, 35131 Padova (Italy), tel.
and fax: +39 049 8275576, e-mail: [email protected] 2: ISISE - University of Minho, Department of Civil Engineering, Guimaraes (Portugal) 3: University of Roma Tor Vergata, Department of Civil Engineering, Rome (Italy) 4: University of Perugia, Department of Civil and Environmental Engineering, Perugia (Italy) 5: University Roma Tre, Department of Structures, Rome (Italy) 6: Tecnalia Research & Innovation, Bilbao (Spain) 7: University of Cassino and Southern Lazio, Department of Civil and Mechanical Engineering, Cassino (Italy) 8: Cracow University of Technology, Faculty of Civil Engineering, Cracow (Poland) 9: University of Salento, Department of Engineering for Innovation, Lecce (Italy) 10: University of Naples "Federico II", Department of Structural Engineering, Naples (Italy) 11: University of Patras, Department of Civil Engineering, Patras (Greece) 12: University of Chieti-Pescara “G. D’Annunzio”, Department of Engineering and Geology, Pescara (Italy)
Abstract
The paper presents the experience of a working group within the Rilem Technical Committee 223-MSC
‘Masonry Strengthening with Composite materials’, aimed at developing a standardized, reliable procedure
for characterizing the bonding mechanism of masonry elements strengthened with composite materials under
shear actions. Twelve laboratories from European universities and research centers were involved. Two
different set-ups were compared, for single-lap and double-lap shear tests (the latter in two versions). Four
kinds of fiber fabrics, i.e., glass, carbon, basalt and steel, were applied with epoxy resins (wet lay-up system)
to clay brick units, for a total of 280 monotonic tests. The results provided information regarding the
response of externally bonded-to-brick composites in terms of observed failure mechanisms, load capacity,
effective transfer length, and bond shear stress-slip behavior. The test results of the twelve laboratories
constitute a set of statistically representative data which may conveniently be used for setting appropriate
design provisions and guidelines.
Keywords
Masonry, bond, clay brick, FRP, SRP, shear test
1. INTRODUCTION
Composite materials are increasingly proposed for strengthening existing constructions, even in the field of
masonry buildings belonging to cultural heritage. In particular, externally bonded (EB) fiber-reinforced
2
systems, for both fiber-reinforced polymer (FRP) and steel-reinforced polymer (SRP) are mostly adopted to
strengthen structural components such as walls (both in- and out-of-plane) (Schwegler 1994; Ehsani et al.
1997; Triantafillou et al. 1997 and Triantafillou 1998; Albert et al. 1998; Luciano et al. 1998; Gilstrap et al.
1998; Velasquez-Dimas et al. 2000; Hamoush et al. 2001; Corradi et al. 2002; Valluzzi et al. 2002; Kuzik et
al. 2003; Cecchi et al. 2004; Galati et al. 2004; Ascione et al. 2005; Hamid et al. 2005; El-Gawady et al.
2005; Shrive 2006; Prota et al. 2006; Mosallam 2007), to improve performance in arches and vaults (to
repair cracks and increase global ductility), (Briccoli Bati et al. 2000 and 2001; Foraboschi 2001 and 2004;
Lourenço et al. 2001; Luciano et al. 2001; Valluzzi et al. 2001; Barbieri et al. 2002; Ciesielski et al. 2004;
Basilio et al. 2004; Borri et al. 2007; De Lorenzis et al. 2005 and 2007; Oliveira et al. 2010) or to confine
columns or pillars (Micelli et al. 2004; Aiello et al. 2005 and 2007; Nurchi et al. 2005; Corradi et al. 2007).
In all these kinds of applications, the advantages of using composites are well-known and include: tensile
strength with negligible addition of loads, feasibility and versatility in applications, and corrosion resistance.
In addition, the more recent use of steel products, besides fiber-reinforced ones, adds to the above-mentioned
advantages the possibility of folding the strips, as well as application with inorganic materials such as matrix
(e.g., mortars based on hydraulic binders), to improve compatibility and removability (Borri et al. 2007;
Cancelli et al. 2007; Papanicolaou et al. 2007, 2008 and 2011; Garmendia et al. 2011). The prospects of other
recent mineral fibers (e.g., basalt) or natural ones as reinforcing materials (e.g., flax, hemp) are also
promising, to reduce obtrusiveness and improve sustainability (Wambua et al. 2003; Zampaloni et al. 2007;
Garmendia et al. 2011).
The most critical phenomenon influencing the effectiveness of intervention is debonding of the reinforcing
system from its substrate. This is a brittle phenomenon and should therefore be avoided. For this reason,
clarification and characterization of behavior at the composite-masonry interface is essential, and involves
two important issues: (i) definition of proper experimental procedures; and, (ii) identification of suitable
parameters to be used in design formulations and assessment. As regards actions perpendicular to the
surface, the simple test method proposed by ASTM C1583 (2004) to measure pull-off strength is easy to
perform both in the laboratory and in situ for quality control, and also provides the reference strength to be
used in simplified models for design (Valluzzi et al. 2001). Nevertheless, it is the behavior under action
parallel to the surface of the substrate which is involved in most common applications on structural
components. In this context, despite the very widespread use of composites in construction and structural
upgrading, specific design rules are still far from generally agreed upon, as are experimental procedures for
parameter characterization. Therefore, although various kinds of research are provided in the literature on
this subject, there is a great need for harmonization of test methods, for good reproducibility and reliable
comparison of results. This is particularly urgent for masonry structures, especially in the case of
applications in the historical field, in which lack of knowledge may severely compromise their preservation
(Valluzzi 2008), and the considerable variability of types and mechanical properties should be taken into
account.
3
As regards codes, the two guidelines available at international level, CNR DT-200 (2004), released by the
Italian Research Council, and ACI 440.7R-10 (2010), issued by the American Concrete Institute, are based
on different approaches concerning bonding on masonry, adopting for this material the results of studies on
reinforced concrete. They propose design parameters evaluated through empirical coefficients related to
various factors (fracture energy or ultimate strains, respectively). However, the ACI guidelines do not take
into account substrate properties, whereas the CNR ones express the reference factor through masonry
strength. These coefficients thus still need proper refinement, from further and specifically oriented
experimental campaigns.
As regards testing procedures, many methods have been developed for concrete elements, examples being
the single-lap shear test (Chajes et al. 1996; Täljsten 1997), double-lap pull-pull shear test (Lee et al. 1999;
Nakaba et al. 2001), double-lap push-pull shear test (Camli et al. 2007) and beam-type test (De Lorenzis et
al. 2001). Regarding masonry, a fundamental contribution toward clarifying these aspects was made by
several research groups who tested bonding on clay bricks (Briccoli Bati et al. 2009; Capozucca 2010;
Garbin et al. 2010; Grande et al. 2011a and 2011b), stone elements (Aiello et al. 2003 and 2006; Faella et al.
2009) and masonry prisms (Casareto et al. 2003; Oliveira et al. 2011). The double-lap push-pull shear test,
also known as the double-shear push or near-end supported double-shear test (Yao et al. 2004), is the most
frequently adopted, mainly because it allows a universal testing machine to be used. Nevertheless, its
reliability in comparison with the single-lap shear test is questionable, due to the difficulty of reproducing
specimen symmetry (usually a single brick between two strips of fabric or laminate glued on both sides) and
consequently ensuring equal distribution of load between the strips (Mazzotti et al. 2009). A basic problem
for double-lap test set-ups concerns the correct alignment of the load on the specimen. This discussion on
masonry is still open, and good synergy from researchers is therefore needed, for proper progress in its
understanding.
In this connection, the RILEM Technical Committee 223 ‘Masonry Strengthening with Composite materials’
(223-MSC TC) has been working since 2007, aiming at: (i) systematization of current knowledge on the
structural behavior of masonry strengthened with composites, including experimental, analytical/modeling
works, and collection of case studies; (ii) specification of limitations and capabilities of the various
reinforcing systems in different contexts (modern or historical); (iii) identification of the most critical aspects
influencing intervention effectiveness and their experimental characterization with reliable procedures; (iv)
proposals for recommendations or guidelines as contributions to pre-standards to clarify specific problems of
composites applied to masonry. The TC has more than 45 people belonging to 27 institutions representative
of 13 countries. A data warehouse allowing the storage and comparison in real time of data published in the
literature has been produced (https://rilem223dwh.isqweb.it/), and a comprehensive state-of-the-art report
will be finalized. Moreover, as bonding emerged as the most critical problem affecting interventions, a
Round Robin Test (RRT) was proposed, focusing on the application of fabrics as EB-FRP/SRP to masonry
and behavior under shear actions. In its first phase, the possible influence of mortar bed joints was neglected,
4
so that composites were only applied to units. This was done in order to reduce the number of variables and
to keep as the main objective clarification of the influence of some important aspects related to bonding
under shear actions, i.e., reinforcing materials, test set-up, bond length, measurement patterns, etc. Twelve
institutions were involved: Cracow University of Technology (Poland), University of Minho (Portugal),
University of Patras (Greece), eight Italian university laboratories (University of Cassino and Southern
Lazio, University of Chieti-Pescara, University of Naples ‘Federico II’, University of Perugia, University
Roma Tre, University of Roma Tor Vergata, University of Salento, and University of Padova), and the
applied research center Tecnalia (Spain). Starting from December 2009 for specimen manufacture, tests were
concluded by the twelve laboratories in about six months.
In this paper, preliminary choices, characterization of basic materials, preparation of specimens, and test
execution phases are described. The main experimental results are then discussed, in terms of comparison of
performance among various composites and the influence of different aspects.
The final aim of this investigation is the development of a standardized, reliable procedure to study the
debonding mechanism of masonry elements strengthened by composite materials and to identify significant
parameters for harmonizing laboratory experimental procedures, to be drafted in specific recommendations.
2. EXPERIMENTAL WORK
Eight laboratories from Italy and four from other European countries (Poland, Portugal, Spain, Greece) were
involved in the RRT. Each laboratory carried out Single-Lap Shear Tests (SLST) and/or Double-Lap Shear
Tests (DLST) on specimens reinforced with four types of EB composites, applied with epoxy resins: glass
(GFRP), basalt (BFRP), carbon (CFRP) and steel (SRP). A soft mud clay brick was considered as reference
for the masonry substrate. Some fixed parameters and conditions were also preliminarily agreed upon: the
width of the composite (50 mm), its bonded length (160 mm), measurement patterns (with strain gauges and
transducers), and displacement and acquisition rates (preferably 0.005 mm/sec and at least 5Hz,
respectively). Load was applied monotonically and measured either by the load cell of the universal machine
and/or by additional load cells, with ultimate capacities varying from 20 to 500 kN. Tests were performed in
displacement control mode until complete detachment (or rupture) of the composite strip.
SLST were performed by seven institutions, which made their own set-ups; the specimen was composed of a
single brick with a composite strip glued to one side. For DLST, the specimen was composed of a single strip
reversed into a U-shape and glued at its ends to the two faces of the substrate. Two configurations were
tested, in order to assess the influence of the curvature of the reinforcement (since too high curvatures may
induce premature rupture of the strip): i) specimens DL55, composed of a single brick, in which the diameter
of the curved part was equal to unit thickness, i.e., 55 mm; ii) specimens DL110, obtained by gluing together
two bricks with a thin layer of resin, giving a double thickness of 110 mm.
5
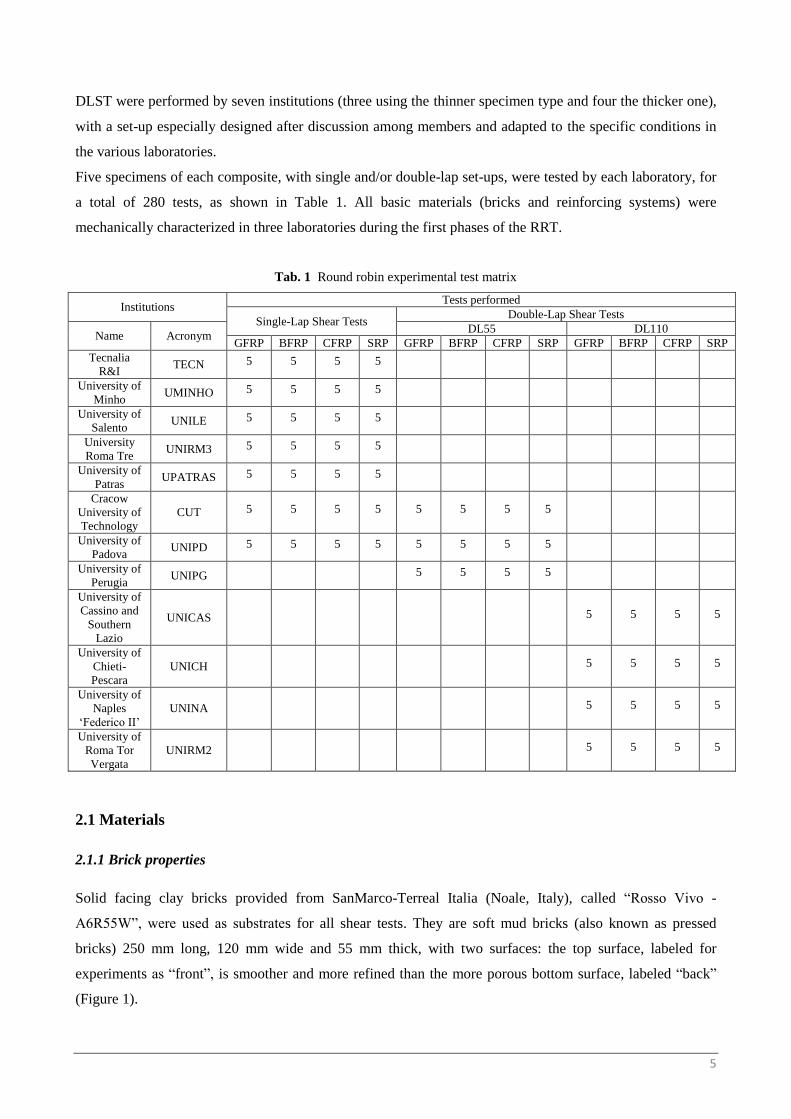
DLST were performed by seven institutions (three using the thinner specimen type and four the thicker one),
with a set-up especially designed after discussion among members and adapted to the specific conditions in
the various laboratories.
Five specimens of each composite, with single and/or double-lap set-ups, were tested by each laboratory, for
a total of 280 tests, as shown in Table 1. All basic materials (bricks and reinforcing systems) were
mechanically characterized in three laboratories during the first phases of the RRT.
Tab. 1 Round robin experimental test matrix
Institutions Tests performed
Single-Lap Shear Tests Double-Lap Shear Tests
Name Acronym DL55 DL110
GFRP BFRP CFRP SRP GFRP BFRP CFRP SRP GFRP BFRP CFRP SRP
Tecnalia
R&I TECN 5 5 5 5
University of
Minho UMINHO 5 5 5 5
University of
Salento UNILE 5 5 5 5
University
Roma Tre UNIRM3 5 5 5 5
University of
Patras UPATRAS 5 5 5 5
Cracow
University of
Technology
CUT 5 5 5 5 5 5 5 5
University of
Padova UNIPD 5 5 5 5 5 5 5 5
University of
Perugia UNIPG 5 5 5 5
University of
Cassino and
Southern
Lazio
UNICAS 5 5 5 5
University of
Chieti-
Pescara
UNICH 5 5 5 5
University of
Naples
‘Federico II’
UNINA 5 5 5 5
University of
Roma Tor
Vergata
UNIRM2 5 5 5 5
2.1 Materials
2.1.1 Brick properties
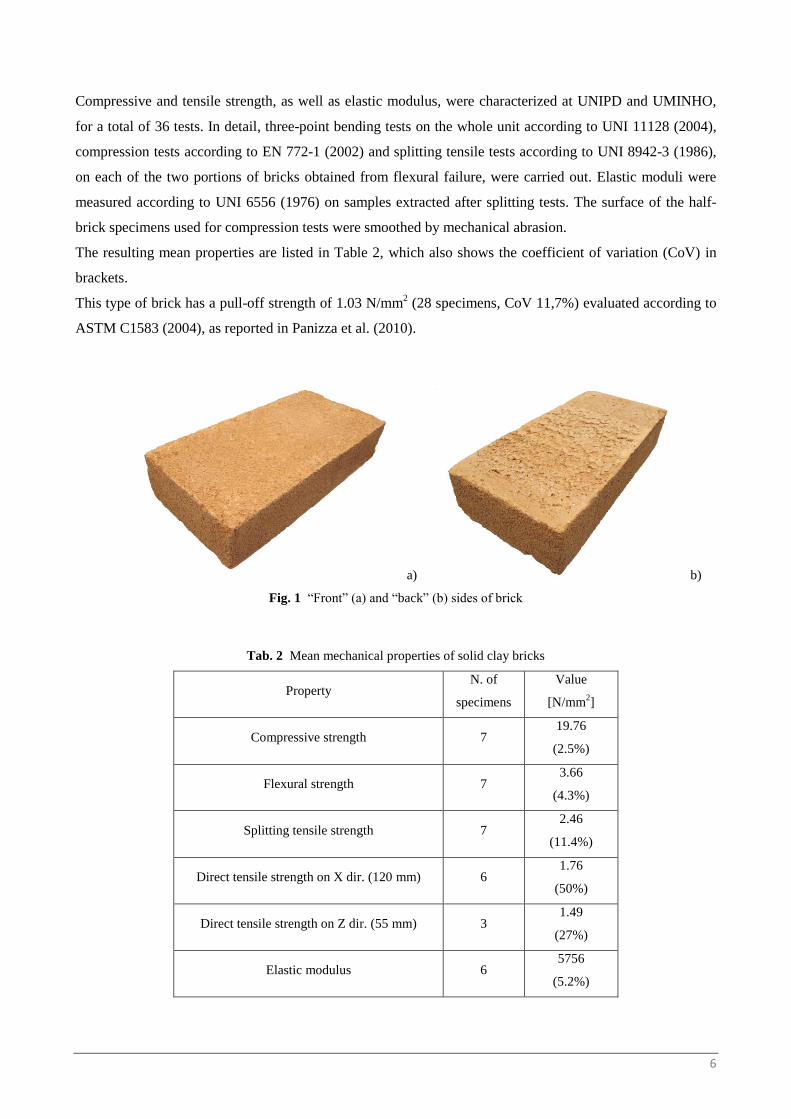
Solid facing clay bricks provided from SanMarco-Terreal Italia (Noale, Italy), called “Rosso Vivo -
A6R55W”, were used as substrates for all shear tests. They are soft mud bricks (also known as pressed
bricks) 250 mm long, 120 mm wide and 55 mm thick, with two surfaces: the top surface, labeled for
experiments as “front”, is smoother and more refined than the more porous bottom surface, labeled “back”
(Figure 1).
6
Compressive and tensile strength, as well as elastic modulus, were characterized at UNIPD and UMINHO,
for a total of 36 tests. In detail, three-point bending tests on the whole unit according to UNI 11128 (2004),
compression tests according to EN 772-1 (2002) and splitting tensile tests according to UNI 8942-3 (1986),
on each of the two portions of bricks obtained from flexural failure, were carried out. Elastic moduli were
measured according to UNI 6556 (1976) on samples extracted after splitting tests. The surface of the half-
brick specimens used for compression tests were smoothed by mechanical abrasion.
The resulting mean properties are listed in Table 2, which also shows the coefficient of variation (CoV) in
brackets.
This type of brick has a pull-off strength of 1.03 N/mm2 (28 specimens, CoV 11,7%) evaluated according to
ASTM C1583 (2004), as reported in Panizza et al. (2010).
a) b)
Fig. 1 “Front” (a) and “back” (b) sides of brick
Tab. 2 Mean mechanical properties of solid clay bricks
Property N. of
specimens
Value
[N/mm2]
Compressive strength 7 19.76
(2.5%)
Flexural strength 7 3.66
(4.3%)
Splitting tensile strength 7 2.46
(11.4%)
Direct tensile strength on X dir. (120 mm) 6 1.76
(50%)
Direct tensile strength on Z dir. (55 mm) 3 1.49
(27%)
Elastic modulus 6 5756
(5.2%)
7
2.1.2 Reinforcing system: properties of composites and resins
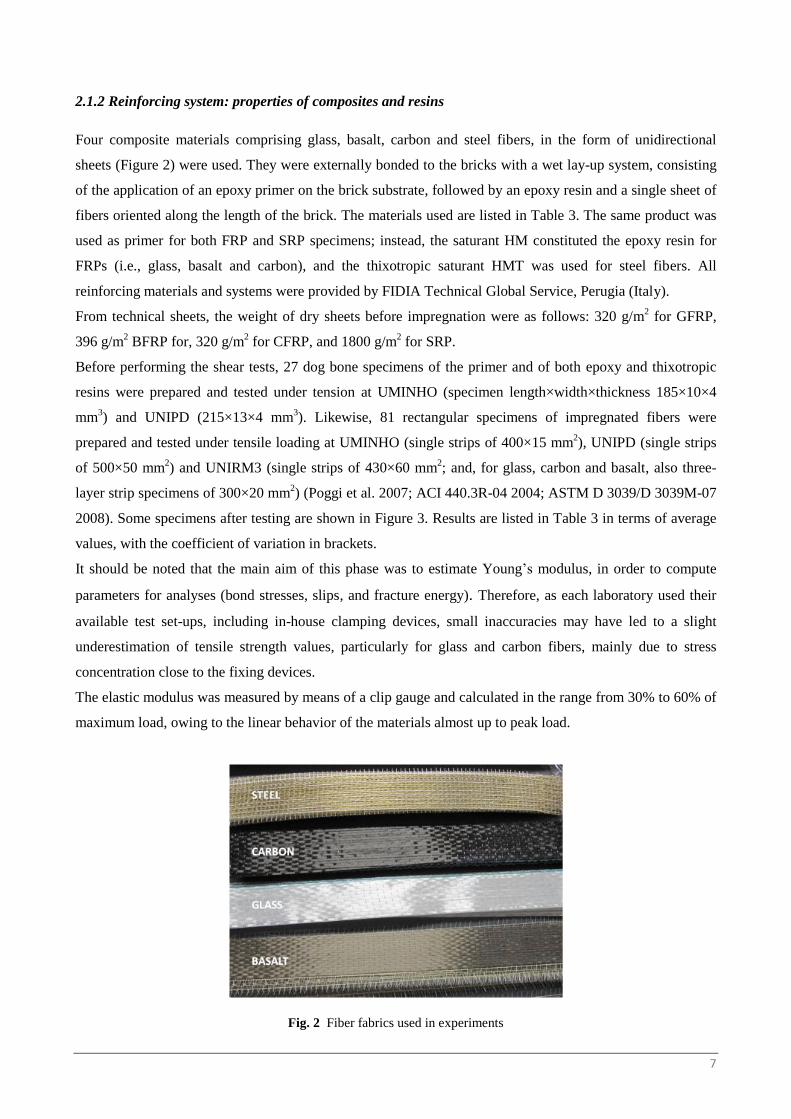
Four composite materials comprising glass, basalt, carbon and steel fibers, in the form of unidirectional
sheets (Figure 2) were used. They were externally bonded to the bricks with a wet lay-up system, consisting
of the application of an epoxy primer on the brick substrate, followed by an epoxy resin and a single sheet of
fibers oriented along the length of the brick. The materials used are listed in Table 3. The same product was
used as primer for both FRP and SRP specimens; instead, the saturant HM constituted the epoxy resin for
FRPs (i.e., glass, basalt and carbon), and the thixotropic saturant HMT was used for steel fibers. All
reinforcing materials and systems were provided by FIDIA Technical Global Service, Perugia (Italy).
From technical sheets, the weight of dry sheets before impregnation were as follows: 320 g/m2 for GFRP,
396 g/m2 BFRP for, 320 g/m
2 for CFRP, and 1800 g/m
2 for SRP.
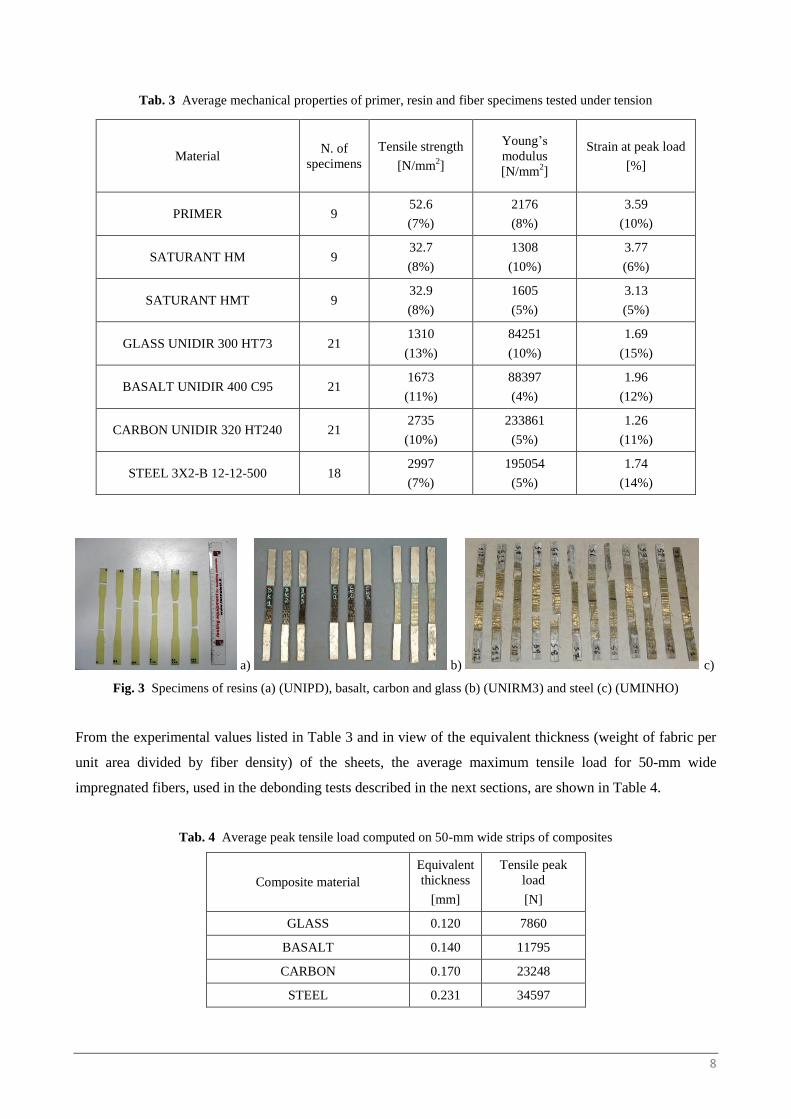
Before performing the shear tests, 27 dog bone specimens of the primer and of both epoxy and thixotropic
resins were prepared and tested under tension at UMINHO (specimen length×width×thickness 185×10×4
mm3) and UNIPD (215×13×4 mm
3). Likewise, 81 rectangular specimens of impregnated fibers were
prepared and tested under tensile loading at UMINHO (single strips of 400×15 mm2), UNIPD (single strips
of 500×50 mm2) and UNIRM3 (single strips of 430×60 mm
2; and, for glass, carbon and basalt, also three-
layer strip specimens of 300×20 mm2) (Poggi et al. 2007; ACI 440.3R-04 2004; ASTM D 3039/D 3039M-07
2008). Some specimens after testing are shown in Figure 3. Results are listed in Table 3 in terms of average
values, with the coefficient of variation in brackets.
It should be noted that the main aim of this phase was to estimate Young’s modulus, in order to compute
parameters for analyses (bond stresses, slips, and fracture energy). Therefore, as each laboratory used their
available test set-ups, including in-house clamping devices, small inaccuracies may have led to a slight
underestimation of tensile strength values, particularly for glass and carbon fibers, mainly due to stress
concentration close to the fixing devices.
The elastic modulus was measured by means of a clip gauge and calculated in the range from 30% to 60% of
maximum load, owing to the linear behavior of the materials almost up to peak load.
Fig. 2 Fiber fabrics used in experiments
8
Tab. 3 Average mechanical properties of primer, resin and fiber specimens tested under tension
Material N. of
specimens
Tensile strength
[N/mm2]
Young’s
modulus
[N/mm2]
Strain at peak load
[%]
PRIMER 9 52.6
(7%)
2176
(8%)
3.59
(10%)
SATURANT HM 9 32.7
(8%)
1308
(10%)
3.77
(6%)
SATURANT HMT 9 32.9
(8%)
1605
(5%)
3.13
(5%)
GLASS UNIDIR 300 HT73 21 1310
(13%)
84251
(10%)
1.69
(15%)
BASALT UNIDIR 400 C95 21 1673
(11%)
88397
(4%)
1.96
(12%)
CARBON UNIDIR 320 HT240 21 2735
(10%)
233861
(5%)
1.26
(11%)
STEEL 3X2-B 12-12-500 18 2997
(7%)
195054
(5%)
1.74
(14%)
a) b) c)
Fig. 3 Specimens of resins (a) (UNIPD), basalt, carbon and glass (b) (UNIRM3) and steel (c) (UMINHO)
From the experimental values listed in Table 3 and in view of the equivalent thickness (weight of fabric per
unit area divided by fiber density) of the sheets, the average maximum tensile load for 50-mm wide
impregnated fibers, used in the debonding tests described in the next sections, are shown in Table 4.
Tab. 4 Average peak tensile load computed on 50-mm wide strips of composites
Composite material
Equivalent
thickness
[mm]
Tensile peak
load
[N]
GLASS 0.120 7860
BASALT 0.140 11795
CARBON 0.170 23248
STEEL 0.231 34597
9
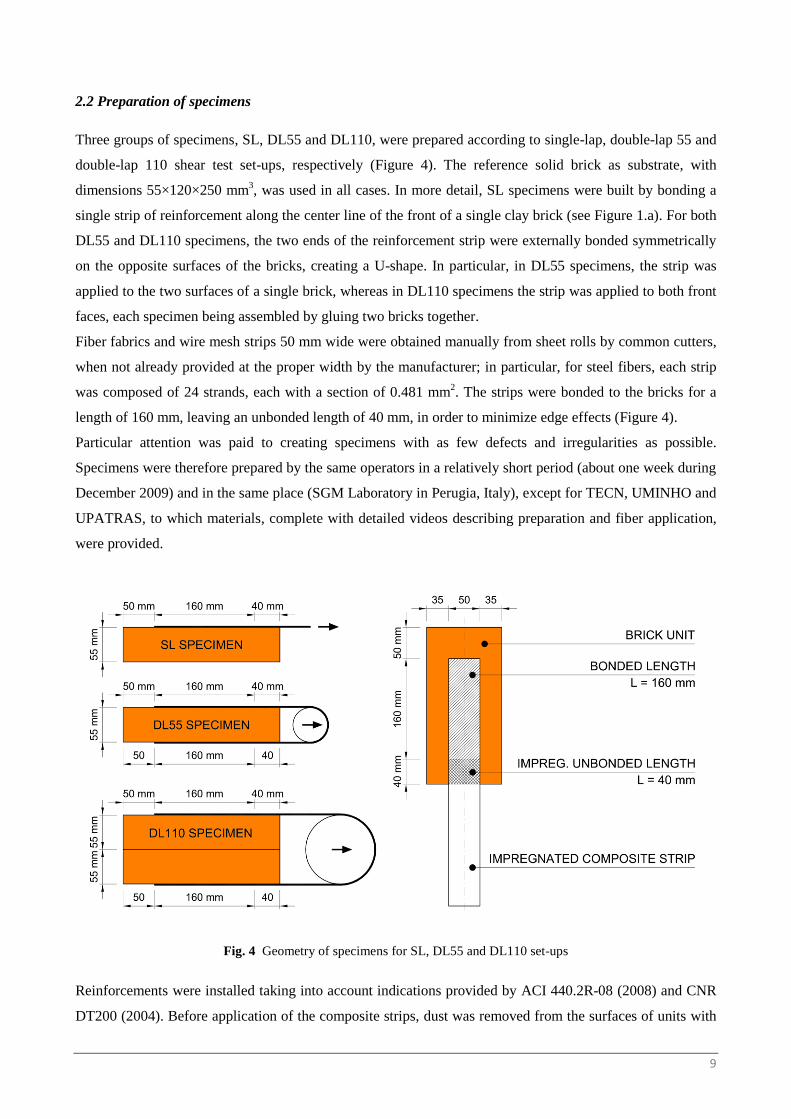
2.2 Preparation of specimens
Three groups of specimens, SL, DL55 and DL110, were prepared according to single-lap, double-lap 55 and
double-lap 110 shear test set-ups, respectively (Figure 4). The reference solid brick as substrate, with
dimensions 55×120×250 mm3, was used in all cases. In more detail, SL specimens were built by bonding a
single strip of reinforcement along the center line of the front of a single clay brick (see Figure 1.a). For both
DL55 and DL110 specimens, the two ends of the reinforcement strip were externally bonded symmetrically
on the opposite surfaces of the bricks, creating a U-shape. In particular, in DL55 specimens, the strip was
applied to the two surfaces of a single brick, whereas in DL110 specimens the strip was applied to both front
faces, each specimen being assembled by gluing two bricks together.
Fiber fabrics and wire mesh strips 50 mm wide were obtained manually from sheet rolls by common cutters,
when not already provided at the proper width by the manufacturer; in particular, for steel fibers, each strip
was composed of 24 strands, each with a section of 0.481 mm2. The strips were bonded to the bricks for a
length of 160 mm, leaving an unbonded length of 40 mm, in order to minimize edge effects (Figure 4).
Particular attention was paid to creating specimens with as few defects and irregularities as possible.
Specimens were therefore prepared by the same operators in a relatively short period (about one week during
December 2009) and in the same place (SGM Laboratory in Perugia, Italy), except for TECN, UMINHO and
UPATRAS, to which materials, complete with detailed videos describing preparation and fiber application,
were provided.
Fig. 4 Geometry of specimens for SL, DL55 and DL110 set-ups
Reinforcements were installed taking into account indications provided by ACI 440.2R-08 (2008) and CNR
DT200 (2004). Before application of the composite strips, dust was removed from the surfaces of units with
10
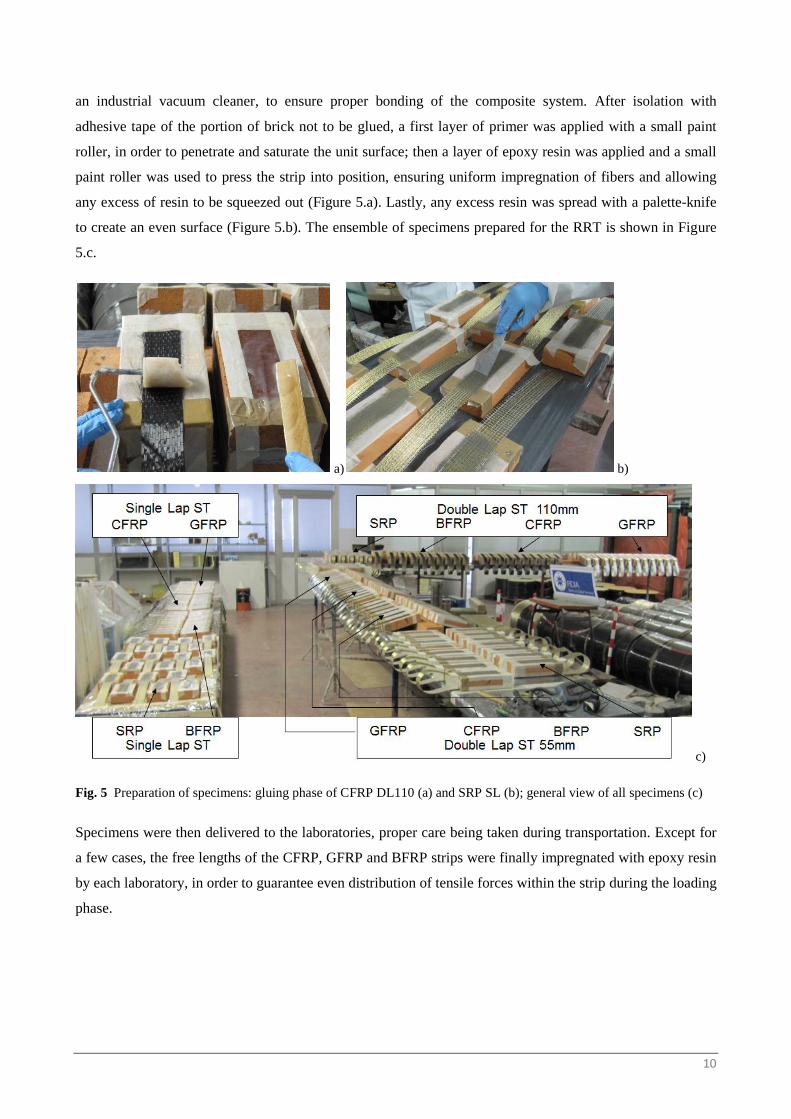
an industrial vacuum cleaner, to ensure proper bonding of the composite system. After isolation with
adhesive tape of the portion of brick not to be glued, a first layer of primer was applied with a small paint
roller, in order to penetrate and saturate the unit surface; then a layer of epoxy resin was applied and a small
paint roller was used to press the strip into position, ensuring uniform impregnation of fibers and allowing
any excess of resin to be squeezed out (Figure 5.a). Lastly, any excess resin was spread with a palette-knife
to create an even surface (Figure 5.b). The ensemble of specimens prepared for the RRT is shown in Figure
5.c.
a) b)
c)
Fig. 5 Preparation of specimens: gluing phase of CFRP DL110 (a) and SRP SL (b); general view of all specimens (c)
Specimens were then delivered to the laboratories, proper care being taken during transportation. Except for
a few cases, the free lengths of the CFRP, GFRP and BFRP strips were finally impregnated with epoxy resin
by each laboratory, in order to guarantee even distribution of tensile forces within the strip during the loading
phase.
11
2.3 Test set-ups
2.3.1 Lay-out of strain and displacement transducers
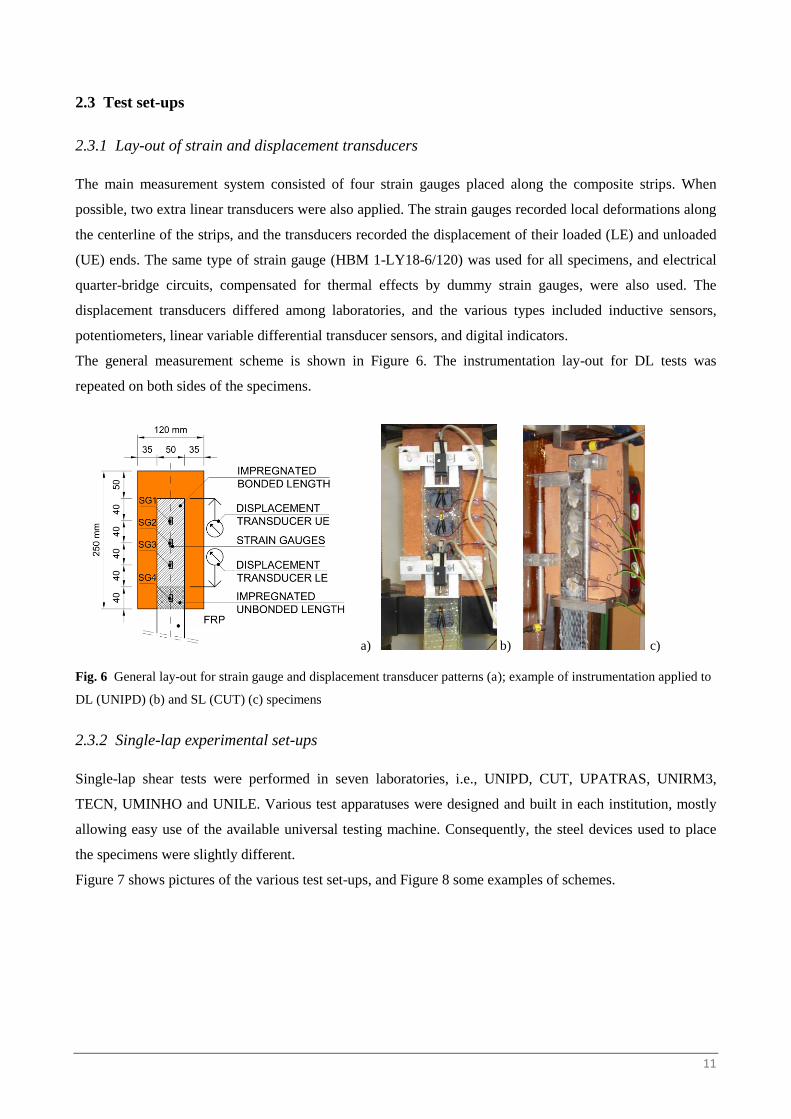
The main measurement system consisted of four strain gauges placed along the composite strips. When
possible, two extra linear transducers were also applied. The strain gauges recorded local deformations along
the centerline of the strips, and the transducers recorded the displacement of their loaded (LE) and unloaded
(UE) ends. The same type of strain gauge (HBM 1-LY18-6/120) was used for all specimens, and electrical
quarter-bridge circuits, compensated for thermal effects by dummy strain gauges, were also used. The
displacement transducers differed among laboratories, and the various types included inductive sensors,
potentiometers, linear variable differential transducer sensors, and digital indicators.
The general measurement scheme is shown in Figure 6. The instrumentation lay-out for DL tests was
repeated on both sides of the specimens.
a) b) c)
Fig. 6 General lay-out for strain gauge and displacement transducer patterns (a); example of instrumentation applied to
DL (UNIPD) (b) and SL (CUT) (c) specimens
2.3.2 Single-lap experimental set-ups
Single-lap shear tests were performed in seven laboratories, i.e., UNIPD, CUT, UPATRAS, UNIRM3,
TECN, UMINHO and UNILE. Various test apparatuses were designed and built in each institution, mostly
allowing easy use of the available universal testing machine. Consequently, the steel devices used to place
the specimens were slightly different.
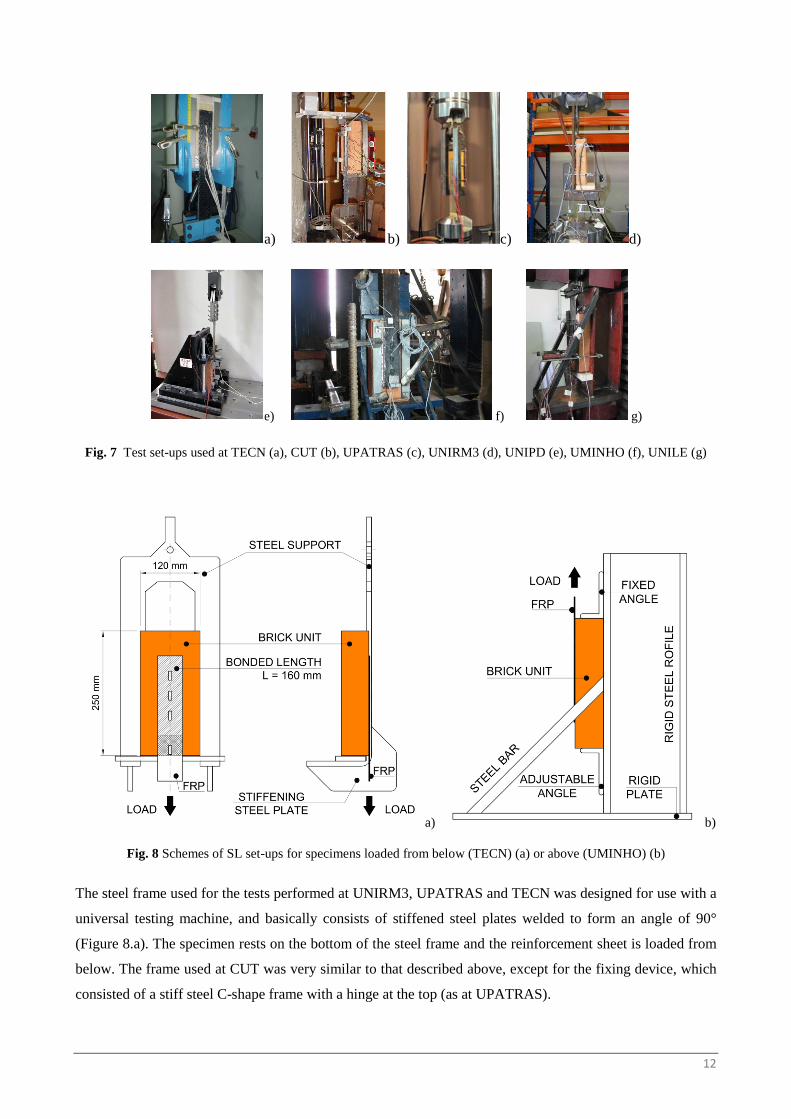
Figure 7 shows pictures of the various test set-ups, and Figure 8 some examples of schemes.
12
a) b) c) d)
e) f) g)
Fig. 7 Test set-ups used at TECN (a), CUT (b), UPATRAS (c), UNIRM3 (d), UNIPD (e), UMINHO (f), UNILE (g)
a) b)
Fig. 8 Schemes of SL set-ups for specimens loaded from below (TECN) (a) or above (UMINHO) (b)
The steel frame used for the tests performed at UNIRM3, UPATRAS and TECN was designed for use with a
universal testing machine, and basically consists of stiffened steel plates welded to form an angle of 90°
(Figure 8.a). The specimen rests on the bottom of the steel frame and the reinforcement sheet is loaded from
below. The frame used at CUT was very similar to that described above, except for the fixing device, which
consisted of a stiff steel C-shape frame with a hinge at the top (as at UPATRAS).
13
Instead, the steel device used at UMINHO and UNILE was designed to be fixed to already available rigid
steel testing frames, and the reinforcement sheet was loaded from above. The device is made of a steel
profile welded to a rigid plate and stiffened with two diagonal bars (Figure 8.b). The specimen was
positioned on the steel device and firmly clamped to it. The system used at UNIPD was similar to the latter,
apart from the shape of the steel profiles and the fixing at its base.
In all cases, the loaded end of the composite strip was glued between two plates (aluminum, steel or GFRP),
in order to ensure uniform transmission of load in the clamped area. This system was designed ad hoc by
each of the laboratories, by means of bolts, glue, or a combination of both. In particular, UNILE, UNIRM3
and CUT simply glued the end of the reinforcement between two aluminum plates; the same procedure was
used at UPATRAS, but with GFRP tabs. A combination of bolts and rapid vinyl-ester resin was used for
specimens prepared at UNIPD and UMINHO; TECN chose a clamping system which only had bolts. In the
last case, the surface of the steel tabs was roughened, in order to limit slippage between tab and composite
strip.
All laboratories, except TECN, used both displacement transducers and strain gauges.
2.3.3 Double-lap experimental set-ups
Double-lap shear tests were performed in seven laboratories. UNIPD, CUT and UNIPG carried out tests on
DL55 specimens, and UNICAS, UNINA, UNICH and UNIRM2 adopted the set-up for DL110 specimens.
Unlike the single-lap test set-ups, in which each laboratory designed its own testing frame, the main features
of the DL test set-up were discussed among the partners before it was produced. In particular, the following
main characteristics were agreed upon: geometrical symmetry of the apparatus, to ensure self-equilibrated
set-ups; ball joints at the ends of the steel frame to minimize the effects of any small misalignments; a roller
device to pull the reinforcement to guarantee even loading of the two composite strips; ability of the set-up to
accommodate several specimen geometries, in particular, the one- or two-brick thick specimens (types DL55
and DL110, as in Figure 4); adaptability of the set-up to universal testing machines.
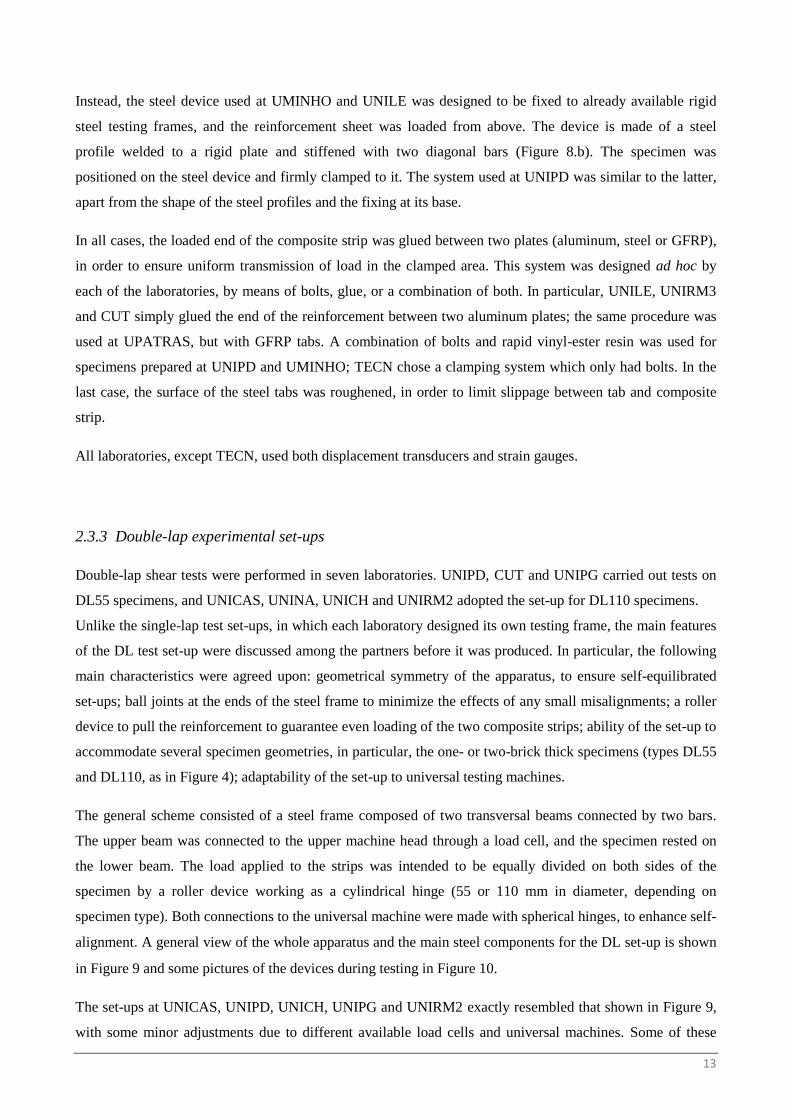
The general scheme consisted of a steel frame composed of two transversal beams connected by two bars.
The upper beam was connected to the upper machine head through a load cell, and the specimen rested on
the lower beam. The load applied to the strips was intended to be equally divided on both sides of the
specimen by a roller device working as a cylindrical hinge (55 or 110 mm in diameter, depending on
specimen type). Both connections to the universal machine were made with spherical hinges, to enhance self-
alignment. A general view of the whole apparatus and the main steel components for the DL set-up is shown
in Figure 9 and some pictures of the devices during testing in Figure 10.
The set-ups at UNICAS, UNIPD, UNICH, UNIPG and UNIRM2 exactly resembled that shown in Figure 9,
with some minor adjustments due to different available load cells and universal machines. Some of these
14
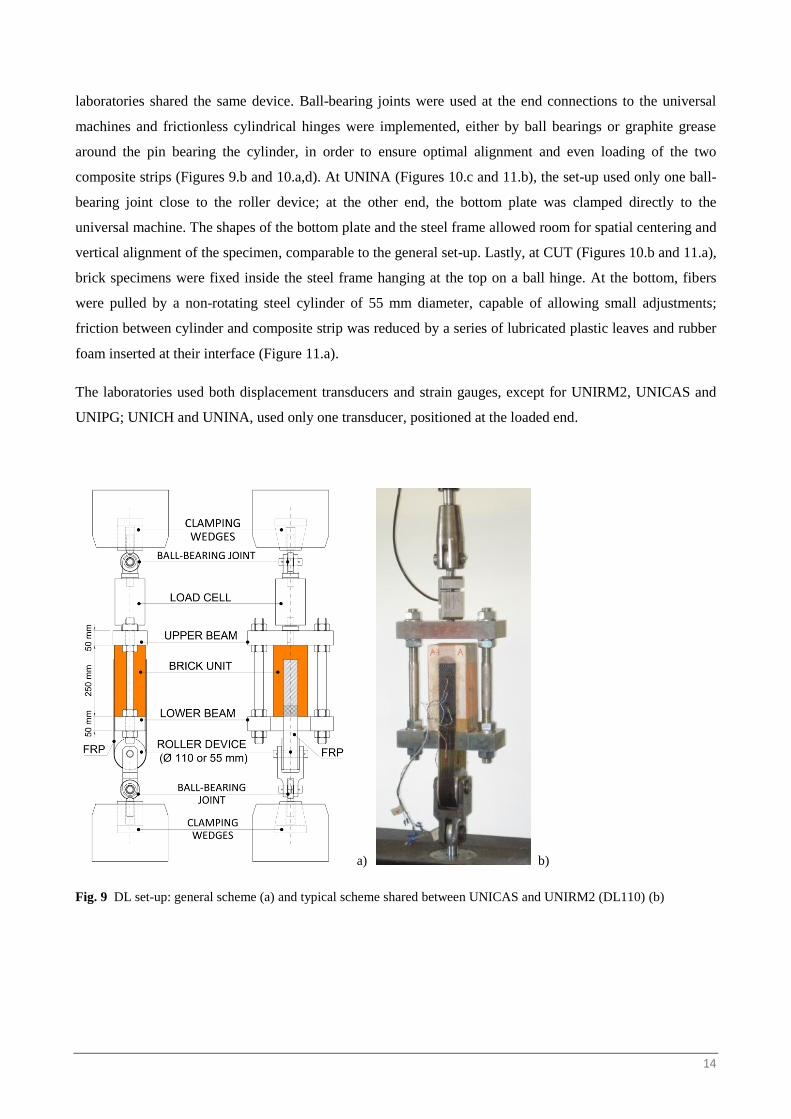
laboratories shared the same device. Ball-bearing joints were used at the end connections to the universal
machines and frictionless cylindrical hinges were implemented, either by ball bearings or graphite grease
around the pin bearing the cylinder, in order to ensure optimal alignment and even loading of the two
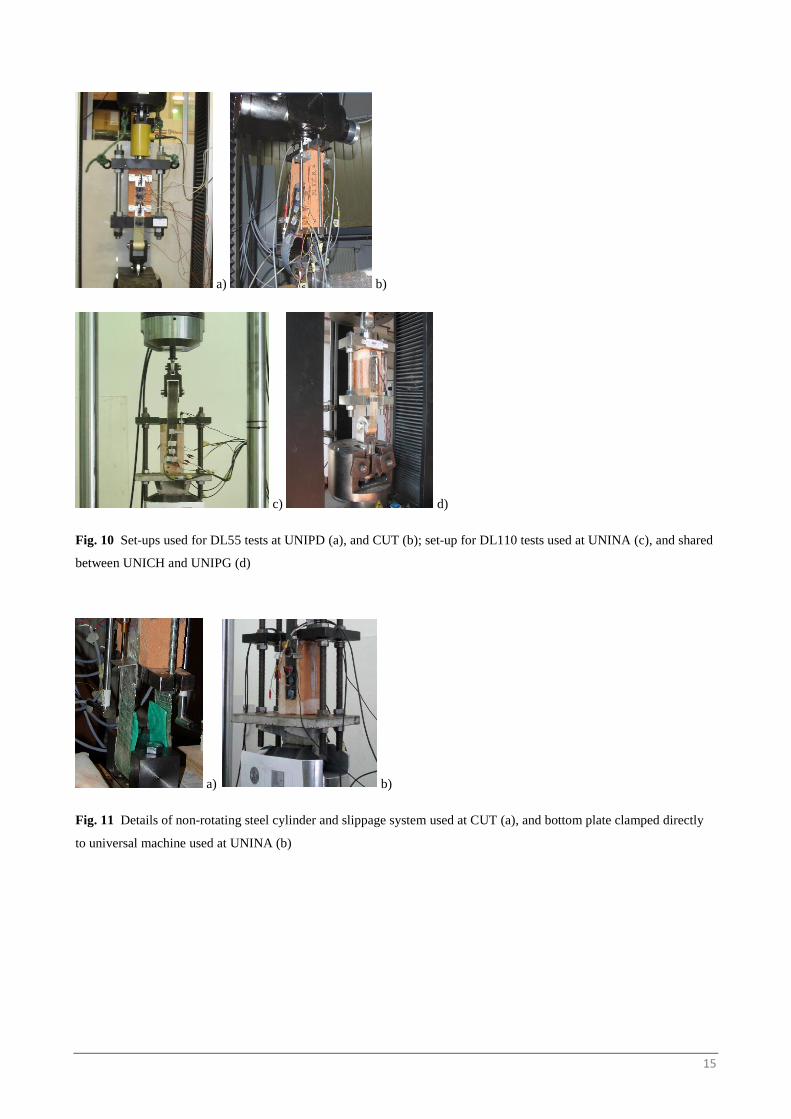
composite strips (Figures 9.b and 10.a,d). At UNINA (Figures 10.c and 11.b), the set-up used only one ball-
bearing joint close to the roller device; at the other end, the bottom plate was clamped directly to the
universal machine. The shapes of the bottom plate and the steel frame allowed room for spatial centering and
vertical alignment of the specimen, comparable to the general set-up. Lastly, at CUT (Figures 10.b and 11.a),
brick specimens were fixed inside the steel frame hanging at the top on a ball hinge. At the bottom, fibers
were pulled by a non-rotating steel cylinder of 55 mm diameter, capable of allowing small adjustments;
friction between cylinder and composite strip was reduced by a series of lubricated plastic leaves and rubber
foam inserted at their interface (Figure 11.a).
The laboratories used both displacement transducers and strain gauges, except for UNIRM2, UNICAS and
UNIPG; UNICH and UNINA, used only one transducer, positioned at the loaded end.
a) b)
Fig. 9 DL set-up: general scheme (a) and typical scheme shared between UNICAS and UNIRM2 (DL110) (b)
15
a) b)
c) d)
Fig. 10 Set-ups used for DL55 tests at UNIPD (a), and CUT (b); set-up for DL110 tests used at UNINA (c), and shared
between UNICH and UNIPG (d)
a) b)
Fig. 11 Details of non-rotating steel cylinder and slippage system used at CUT (a), and bottom plate clamped directly
to universal machine used at UNINA (b)
16
3. EXPERIMENTAL RESULTS AND ANALYSIS
The results of shear tests are discussed for each of the four composite materials and then compared overall.
In the following sections, the outcomes from the various laboratories concerning each composite material are
analysed in terms of maximum load, by grouping SL and DL specimens. The influence on failure mode of
some aspects concerning set-ups and features of specimens are also discussed. Additional information on the
debonding process is also given, through a selection of significant -slip curves, as well as typical strain
profiles along the bonded length. This also allowed estimation of a possible range of variation of the
effective transfer length for each of the four materials. Lastly, general behavior during loading is expressed
by comparing the significant load vs. global displacement curves (measured by transducers, where
available).
For data analysis, the following assumptions were made for all four materials:
- for DLST, the total load was equally subdivided between the two sides of the brick, and that value
was then compared with SLST results;
- to determine the interface -slip relationship from data recorded by the strain gauges, the average
shear stress between two subsequent strain gauges was estimated by Equation 1, and the related
slipping by Equation 2 (Taljsten 1997; Ferracuti et al. 2007):
⁄ ( )
( ) (1)
where Ar, br are the transversal section and width of the reinforcement, respectively; Er is the average
Young’s modulus (as in Table 3), and are the strain and abscissa of the i-th gauge,
respectively.
By assuming perfect bonding between reinforcement and substrate in the very last zone of the
anchorage (i.e., no slip occurs at the end of the bonded strip) and by neglecting any deformation of
the substrate, slip si+1/2 in the mid-point between the i-th and (i+1)-th gauges can be estimated by
integrating the strain distribution along the reinforcement:
⁄ ∑ ( )
( )
(2)
where a piecewise uniform strain approximation is adopted and i is the distance between the (i-1)-th
and i-th gauges.
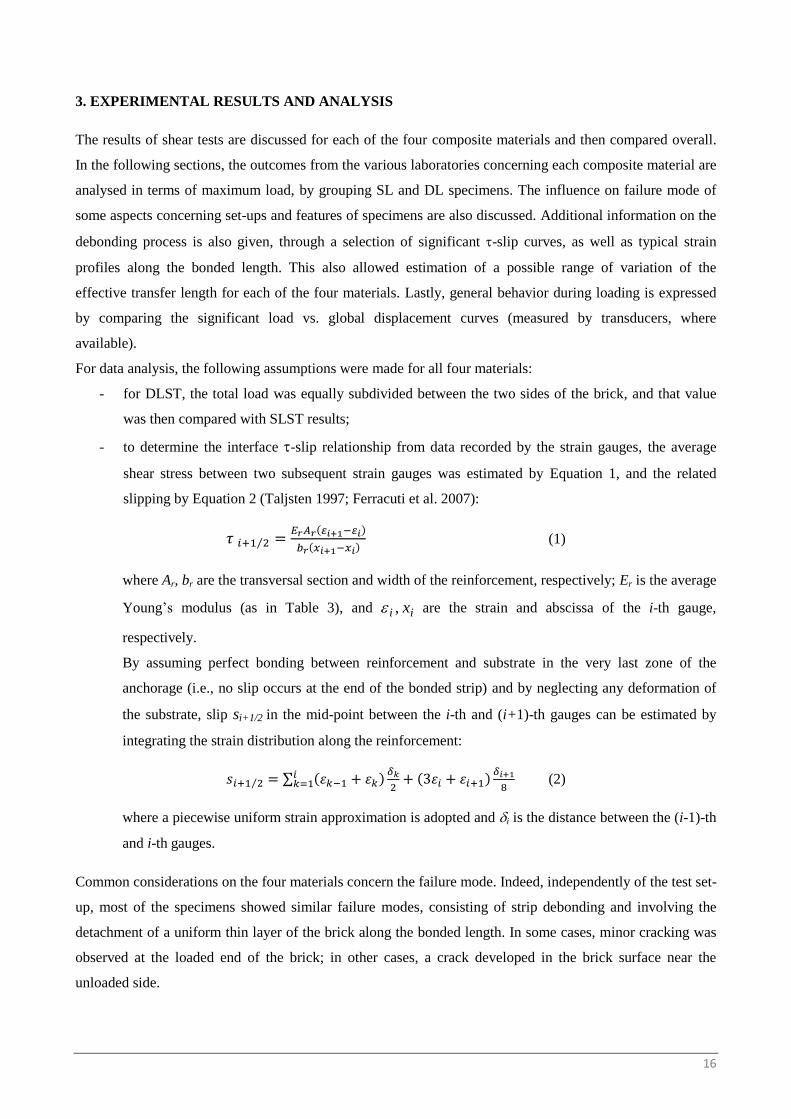
Common considerations on the four materials concern the failure mode. Indeed, independently of the test set-
up, most of the specimens showed similar failure modes, consisting of strip debonding and involving the
detachment of a uniform thin layer of the brick along the bonded length. In some cases, minor cracking was
observed at the loaded end of the brick; in other cases, a crack developed in the brick surface near the
unloaded side.
ii x ,
17
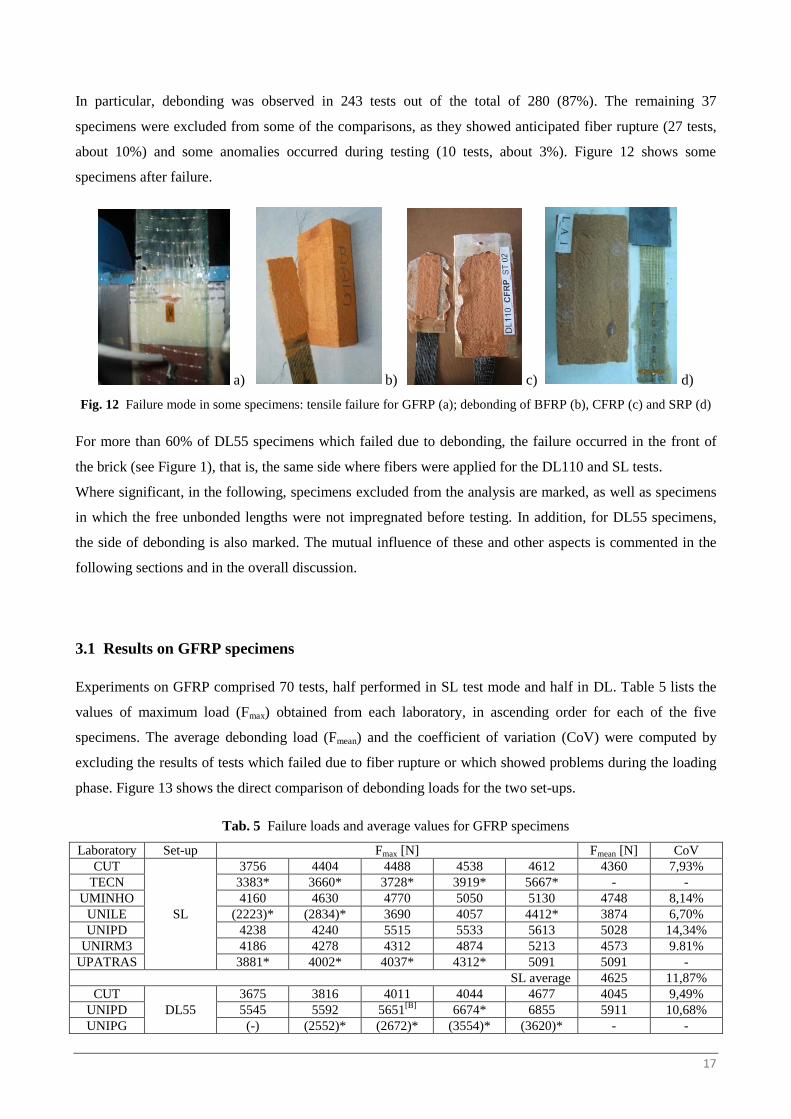
In particular, debonding was observed in 243 tests out of the total of 280 (87%). The remaining 37
specimens were excluded from some of the comparisons, as they showed anticipated fiber rupture (27 tests,
about 10%) and some anomalies occurred during testing (10 tests, about 3%). Figure 12 shows some
specimens after failure.
a) b) c) d)
Fig. 12 Failure mode in some specimens: tensile failure for GFRP (a); debonding of BFRP (b), CFRP (c) and SRP (d)
For more than 60% of DL55 specimens which failed due to debonding, the failure occurred in the front of
the brick (see Figure 1), that is, the same side where fibers were applied for the DL110 and SL tests.
Where significant, in the following, specimens excluded from the analysis are marked, as well as specimens
in which the free unbonded lengths were not impregnated before testing. In addition, for DL55 specimens,
the side of debonding is also marked. The mutual influence of these and other aspects is commented in the
following sections and in the overall discussion.
3.1 Results on GFRP specimens
Experiments on GFRP comprised 70 tests, half performed in SL test mode and half in DL. Table 5 lists the
values of maximum load (Fmax) obtained from each laboratory, in ascending order for each of the five
specimens. The average debonding load (Fmean) and the coefficient of variation (CoV) were computed by
excluding the results of tests which failed due to fiber rupture or which showed problems during the loading
phase. Figure 13 shows the direct comparison of debonding loads for the two set-ups.
Tab. 5 Failure loads and average values for GFRP specimens
Laboratory Set-up Fmax [N] Fmean [N] CoV
CUT
SL
3756 4404 4488 4538 4612 4360 7,93%
TECN 3383* 3660* 3728* 3919* 5667* - -
UMINHO 4160 4630 4770 5050 5130 4748 8,14%
UNILE (2223)* (2834)* 3690 4057 4412* 3874 6,70%
UNIPD 4238 4240 5515 5533 5613 5028 14,34%
UNIRM3 4186 4278 4312 4874 5213 4573 9.81%
UPATRAS 3881* 4002* 4037* 4312* 5091 5091 -
SL average 4625 11,87%
CUT
DL55
3675 3816 4011 4044 4677 4045 9,49%
UNIPD 5545 5592 5651[B]
6674* 6855 5911 10,68%
UNIPG (-) (2552)* (2672)* (3554)* (3620)* - -
18
UNICAS
DL110
4513* 4719 4819 4910 6220 5167 13,67%
UNICH 3835 3935 4884 4984 5015 4531 13,08%
UNINA 4178 4564* 4642 4742 5526 4772 11,72%
UNIRM2 4505 4616 4952 5280 5320 4935 7,54%
DL average 4850 15,61%
Total average 4747 14,16% “*”: fiber rupture occurred instead of debonding / “( )”: non-impregnated fibers in unbonded lengths / “-”: results not available,
owing to problems in data acquisition / “[B]”: debonding of back of brick
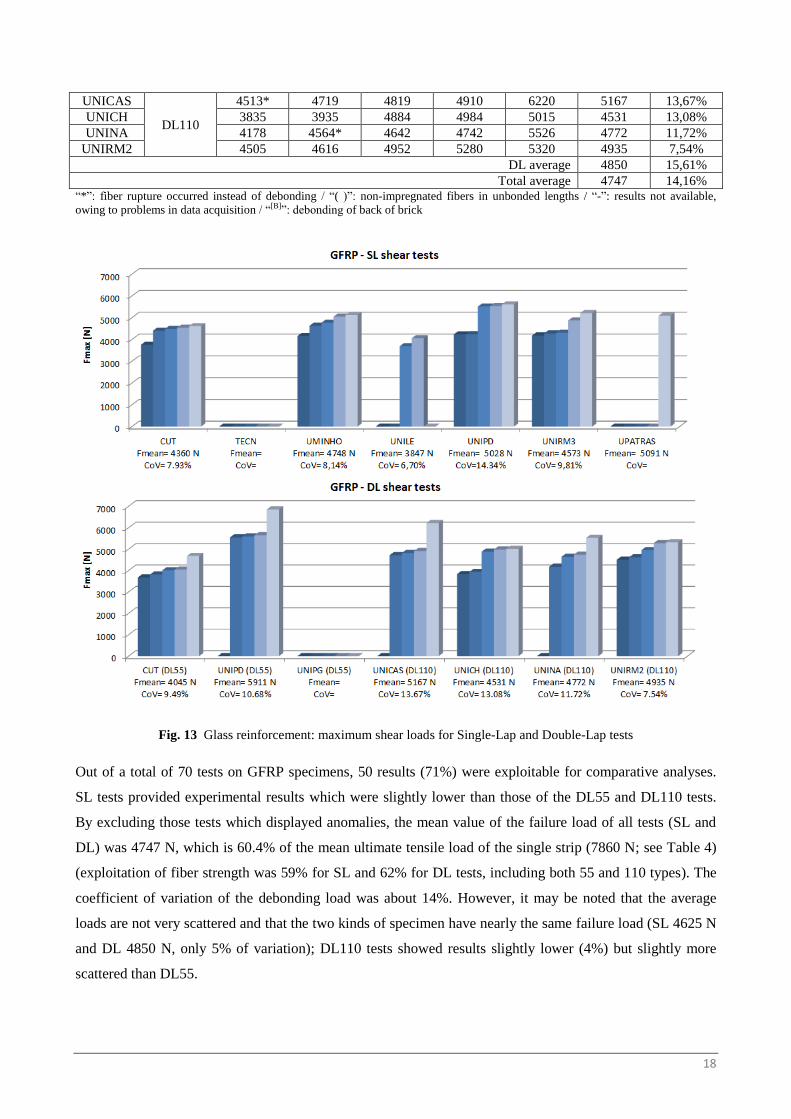
Fig. 13 Glass reinforcement: maximum shear loads for Single-Lap and Double-Lap tests
Out of a total of 70 tests on GFRP specimens, 50 results (71%) were exploitable for comparative analyses.
SL tests provided experimental results which were slightly lower than those of the DL55 and DL110 tests.
By excluding those tests which displayed anomalies, the mean value of the failure load of all tests (SL and
DL) was 4747 N, which is 60.4% of the mean ultimate tensile load of the single strip (7860 N; see Table 4)
(exploitation of fiber strength was 59% for SL and 62% for DL tests, including both 55 and 110 types). The
coefficient of variation of the debonding load was about 14%. However, it may be noted that the average
loads are not very scattered and that the two kinds of specimen have nearly the same failure load (SL 4625 N
and DL 4850 N, only 5% of variation); DL110 tests showed results slightly lower (4%) but slightly more
scattered than DL55.

19
The mean failure load obtained by individual laboratories varied from 3874 N to 5911 N (CoV 7-14%); the
corresponding mean reinforcement strain at maximum load, measured at failure, was 0.84 10-2
(CoV
19.61%) and was about 50% of the average ultimate strain of the glass strip (1.69 10-2
).
According to the test results, the fractile 5% of the distribution of the debonding load was 3783 N for the 50-
mm wide strip adopted.
To point out the effect of any additional restraints due to some specificities of the DL set-ups used at CUT
and UNINA (see Fig. 11), the average values can also be computed without the results obtained at these
laboratories. Average loads of 5091 N (CoV 14.33%) and 4830 N (CoV 13.84%) were obtained by
considering all the other more similar testing machines, for DL tests and for the total of DL and SL tests,
respectively. The lack of hinges at the base of the system may have caused a reduction of about 5% or 2% of
the average maximum loads, computed for only DL or all tests, respectively.
For all specimens with non-impregnated unbonded strips portions (both for SL and DL tests) fiber rupture
was observed before any debonding could occur. Nonetheless, fiber rupture also occurred with the
impregnated GFRP strips. Indeed, although only 10% of specimens were non-impregnated before testing,
more than 27% (19 specimens) of the total number failed, due to fiber rupture, thus highlighting the specific
brittleness of the GFRP and the particular care needed in the impregnation of strips during specimen
preparation. Aspects such as the uneven thickness of the impregnating agent, or the lack of fiber straightness
during and after impregnation, may have caused uneven distribution of the load among the fibers in the strip
and premature rupture of the GFRP composite.
Results showed that the SL and DL55 test set-ups affect fiber rupture more than DL110: 34% (12
specimens), 33% (5) and 10% (2) of tests were excluded due to this effect, respectively. For SL specimens, a
too thin or too thick layer of resin at the clamping device may have been responsible for slippage of the
loaded end of the strip in the test machine. Another factor may have been the types of clamping device used
(mechanical or hydraulic/pneumatic). In addition, some SL set-ups may have suffered from non-uniform
load distribution over the reinforcement width.
Some representative axial strain profiles along the bonded length (160 mm) obtained during testing are
shown in Figure 14. The strain gauges applied to the bonded length were: SG1 (40 mm position), SG2 (80
mm) and SG3 (120 mm). SG4 is positioned out of the bonded length (160 mm), assuming uniform strain
profile throughout the unbonded portion (see Figure 6). Profiles were recorded for load levels between 0.2
and 1 of the failure load, as shown in the plots. Except for some of the laboratories, which had some
problems with strain gauge recordings, good agreement in strain profiles was obtained, independently of test
set-up.
20
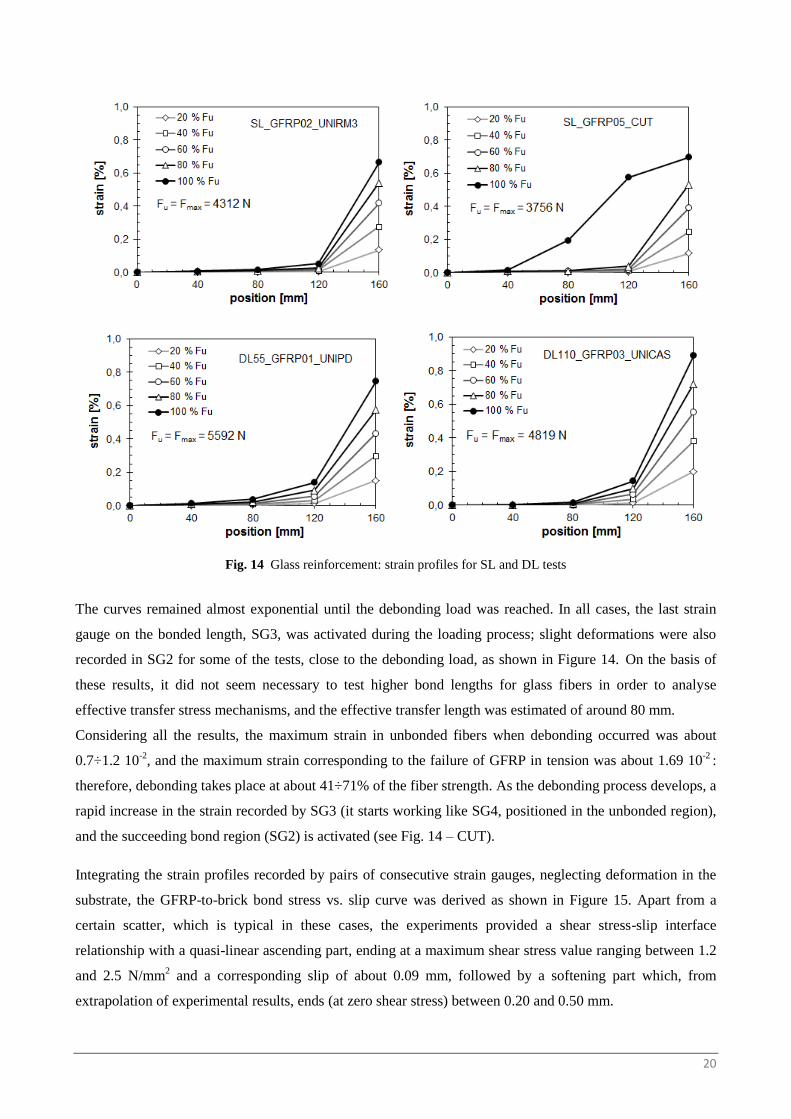
Fig. 14 Glass reinforcement: strain profiles for SL and DL tests
The curves remained almost exponential until the debonding load was reached. In all cases, the last strain
gauge on the bonded length, SG3, was activated during the loading process; slight deformations were also
recorded in SG2 for some of the tests, close to the debonding load, as shown in Figure 14. On the basis of
these results, it did not seem necessary to test higher bond lengths for glass fibers in order to analyse
effective transfer stress mechanisms, and the effective transfer length was estimated of around 80 mm.
Considering all the results, the maximum strain in unbonded fibers when debonding occurred was about
0.7÷1.2 10-2
, and the maximum strain corresponding to the failure of GFRP in tension was about 1.69 10-2
:
therefore, debonding takes place at about 41÷71% of the fiber strength. As the debonding process develops, a
rapid increase in the strain recorded by SG3 (it starts working like SG4, positioned in the unbonded region),
and the succeeding bond region (SG2) is activated (see Fig. 14 – CUT).
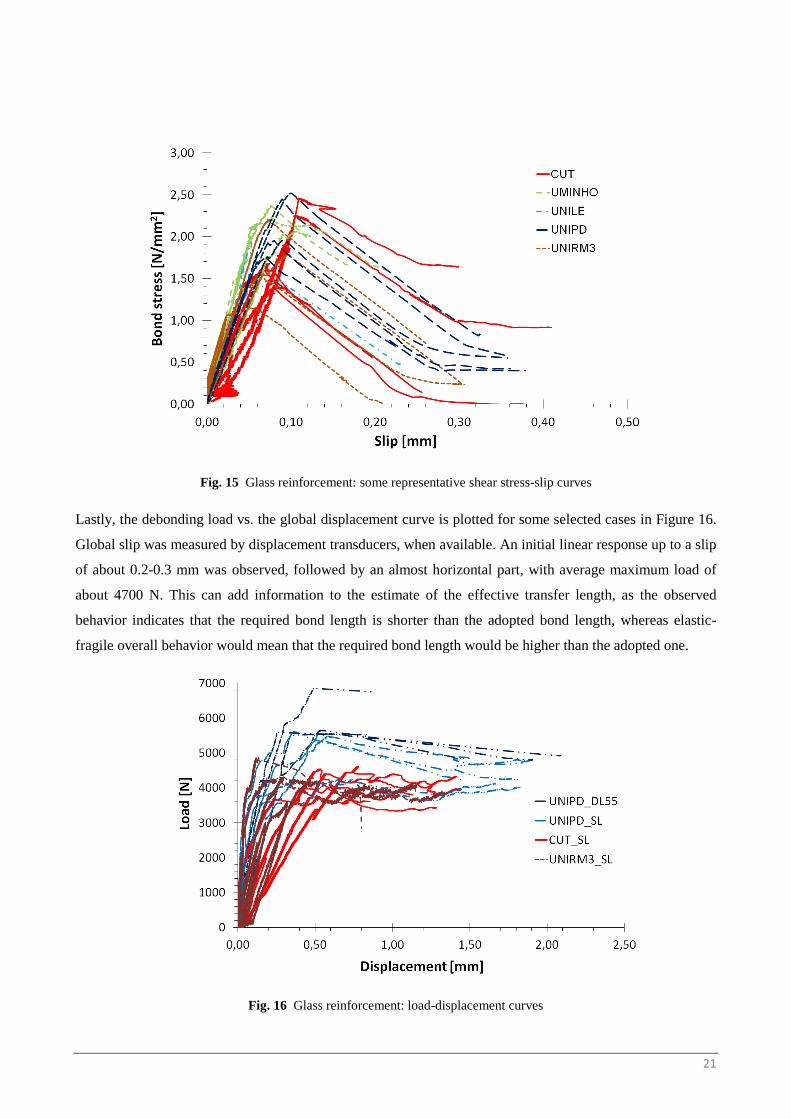
Integrating the strain profiles recorded by pairs of consecutive strain gauges, neglecting deformation in the
substrate, the GFRP-to-brick bond stress vs. slip curve was derived as shown in Figure 15. Apart from a
certain scatter, which is typical in these cases, the experiments provided a shear stress-slip interface
relationship with a quasi-linear ascending part, ending at a maximum shear stress value ranging between 1.2
and 2.5 N/mm2 and a corresponding slip of about 0.09 mm, followed by a softening part which, from
extrapolation of experimental results, ends (at zero shear stress) between 0.20 and 0.50 mm.
21
Fig. 15 Glass reinforcement: some representative shear stress-slip curves
Lastly, the debonding load vs. the global displacement curve is plotted for some selected cases in Figure 16.
Global slip was measured by displacement transducers, when available. An initial linear response up to a slip
of about 0.2-0.3 mm was observed, followed by an almost horizontal part, with average maximum load of
about 4700 N. This can add information to the estimate of the effective transfer length, as the observed
behavior indicates that the required bond length is shorter than the adopted bond length, whereas elastic-
fragile overall behavior would mean that the required bond length would be higher than the adopted one.
Fig. 16 Glass reinforcement: load-displacement curves
22
Generally, in the laboratories where displacement transducers were also used, the highest displacement
values at maximum load were measured on the side where the failure occurred. In particular, the average
maximum displacements were 0.87 mm, 0.76 mm and 0.83 mm for DL110, DL55 and SL specimens,
respectively.
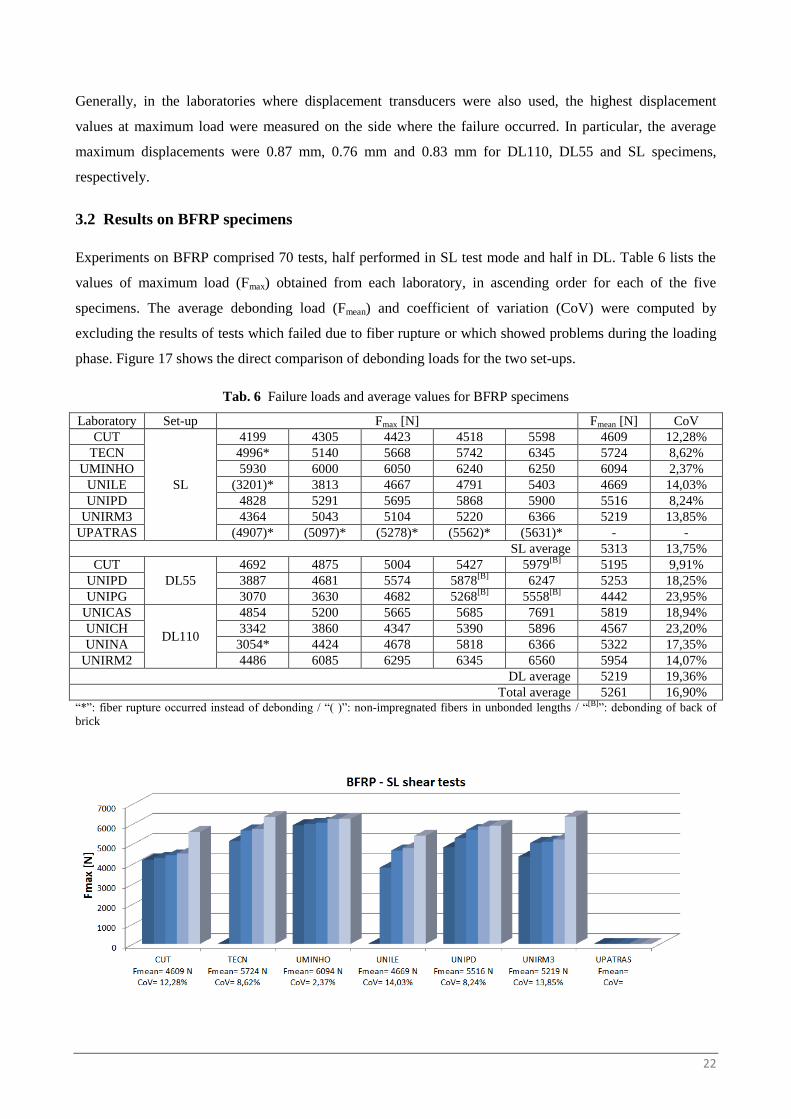
3.2 Results on BFRP specimens
Experiments on BFRP comprised 70 tests, half performed in SL test mode and half in DL. Table 6 lists the
values of maximum load (Fmax) obtained from each laboratory, in ascending order for each of the five
specimens. The average debonding load (Fmean) and coefficient of variation (CoV) were computed by
excluding the results of tests which failed due to fiber rupture or which showed problems during the loading
phase. Figure 17 shows the direct comparison of debonding loads for the two set-ups.
Tab. 6 Failure loads and average values for BFRP specimens
Laboratory Set-up Fmax [N] Fmean [N] CoV
CUT
SL
4199 4305 4423 4518 5598 4609 12,28%
TECN 4996* 5140 5668 5742 6345 5724 8,62%
UMINHO 5930 6000 6050 6240 6250 6094 2,37%
UNILE (3201)* 3813 4667 4791 5403 4669 14,03%
UNIPD 4828 5291 5695 5868 5900 5516 8,24%
UNIRM3 4364 5043 5104 5220 6366 5219 13,85%
UPATRAS (4907)* (5097)* (5278)* (5562)* (5631)* - -
SL average 5313 13,75%
CUT
DL55
4692 4875 5004 5427 5979[B]
5195 9,91%
UNIPD 3887 4681 5574 5878[B]
6247 5253 18,25%
UNIPG 3070 3630 4682 5268[B]
5558[B]
4442 23,95%
UNICAS
DL110
4854 5200 5665 5685 7691 5819 18,94%
UNICH 3342 3860 4347 5390 5896 4567 23,20%
UNINA 3054* 4424 4678 5818 6366 5322 17,35%
UNIRM2 4486 6085 6295 6345 6560 5954 14,07%
DL average 5219 19,36%
Total average 5261 16,90% “*”: fiber rupture occurred instead of debonding / “( )”: non-impregnated fibers in unbonded lengths / “[B]”: debonding of back of
brick
23
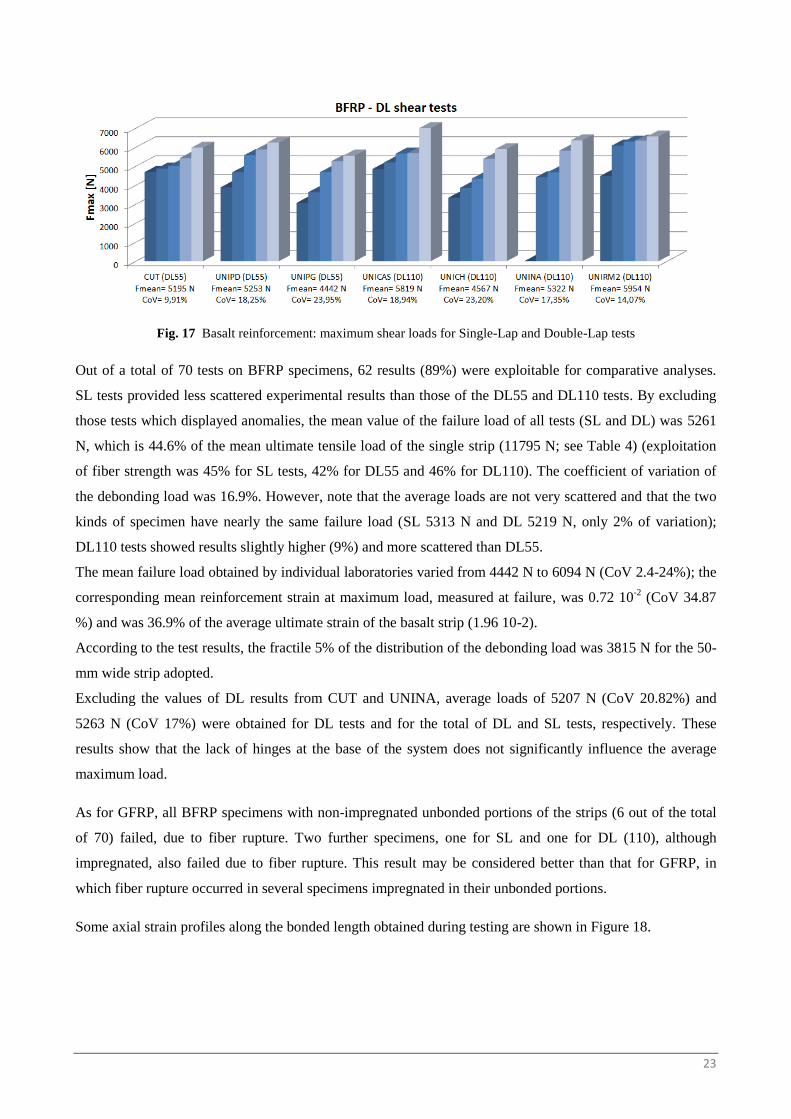
Fig. 17 Basalt reinforcement: maximum shear loads for Single-Lap and Double-Lap tests
Out of a total of 70 tests on BFRP specimens, 62 results (89%) were exploitable for comparative analyses.
SL tests provided less scattered experimental results than those of the DL55 and DL110 tests. By excluding
those tests which displayed anomalies, the mean value of the failure load of all tests (SL and DL) was 5261
N, which is 44.6% of the mean ultimate tensile load of the single strip (11795 N; see Table 4) (exploitation
of fiber strength was 45% for SL tests, 42% for DL55 and 46% for DL110). The coefficient of variation of
the debonding load was 16.9%. However, note that the average loads are not very scattered and that the two
kinds of specimen have nearly the same failure load (SL 5313 N and DL 5219 N, only 2% of variation);
DL110 tests showed results slightly higher (9%) and more scattered than DL55.
The mean failure load obtained by individual laboratories varied from 4442 N to 6094 N (CoV 2.4-24%); the
corresponding mean reinforcement strain at maximum load, measured at failure, was 0.72 10-2
(CoV 34.87
%) and was 36.9% of the average ultimate strain of the basalt strip (1.96 10-2).
According to the test results, the fractile 5% of the distribution of the debonding load was 3815 N for the 50-
mm wide strip adopted.
Excluding the values of DL results from CUT and UNINA, average loads of 5207 N (CoV 20.82%) and
5263 N (CoV 17%) were obtained for DL tests and for the total of DL and SL tests, respectively. These
results show that the lack of hinges at the base of the system does not significantly influence the average
maximum load.
As for GFRP, all BFRP specimens with non-impregnated unbonded portions of the strips (6 out of the total
of 70) failed, due to fiber rupture. Two further specimens, one for SL and one for DL (110), although
impregnated, also failed due to fiber rupture. This result may be considered better than that for GFRP, in
which fiber rupture occurred in several specimens impregnated in their unbonded portions.
Some axial strain profiles along the bonded length obtained during testing are shown in Figure 18.
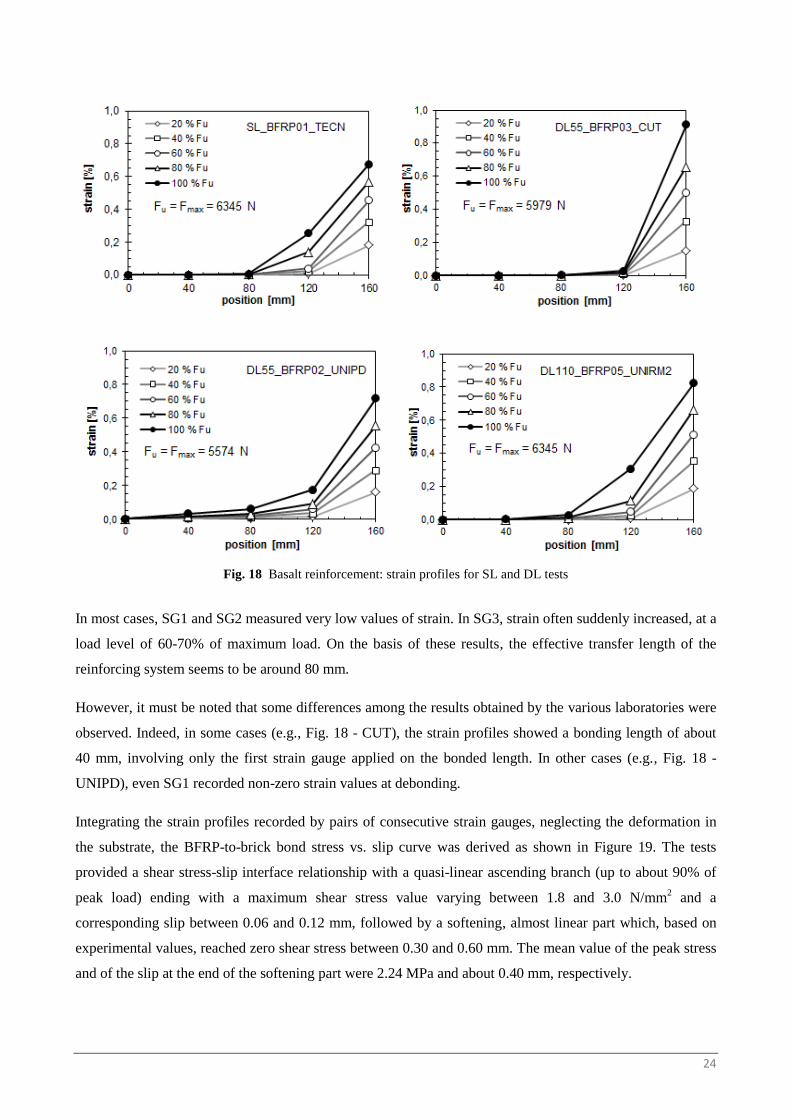
24
Fig. 18 Basalt reinforcement: strain profiles for SL and DL tests
In most cases, SG1 and SG2 measured very low values of strain. In SG3, strain often suddenly increased, at a
load level of 60-70% of maximum load. On the basis of these results, the effective transfer length of the
reinforcing system seems to be around 80 mm.
However, it must be noted that some differences among the results obtained by the various laboratories were
observed. Indeed, in some cases (e.g., Fig. 18 - CUT), the strain profiles showed a bonding length of about
40 mm, involving only the first strain gauge applied on the bonded length. In other cases (e.g., Fig. 18 -
UNIPD), even SG1 recorded non-zero strain values at debonding.
Integrating the strain profiles recorded by pairs of consecutive strain gauges, neglecting the deformation in
the substrate, the BFRP-to-brick bond stress vs. slip curve was derived as shown in Figure 19. The tests
provided a shear stress-slip interface relationship with a quasi-linear ascending branch (up to about 90% of
peak load) ending with a maximum shear stress value varying between 1.8 and 3.0 N/mm2 and a
corresponding slip between 0.06 and 0.12 mm, followed by a softening, almost linear part which, based on
experimental values, reached zero shear stress between 0.30 and 0.60 mm. The mean value of the peak stress
and of the slip at the end of the softening part were 2.24aMPa and about 0.40 mm, respectively.
25
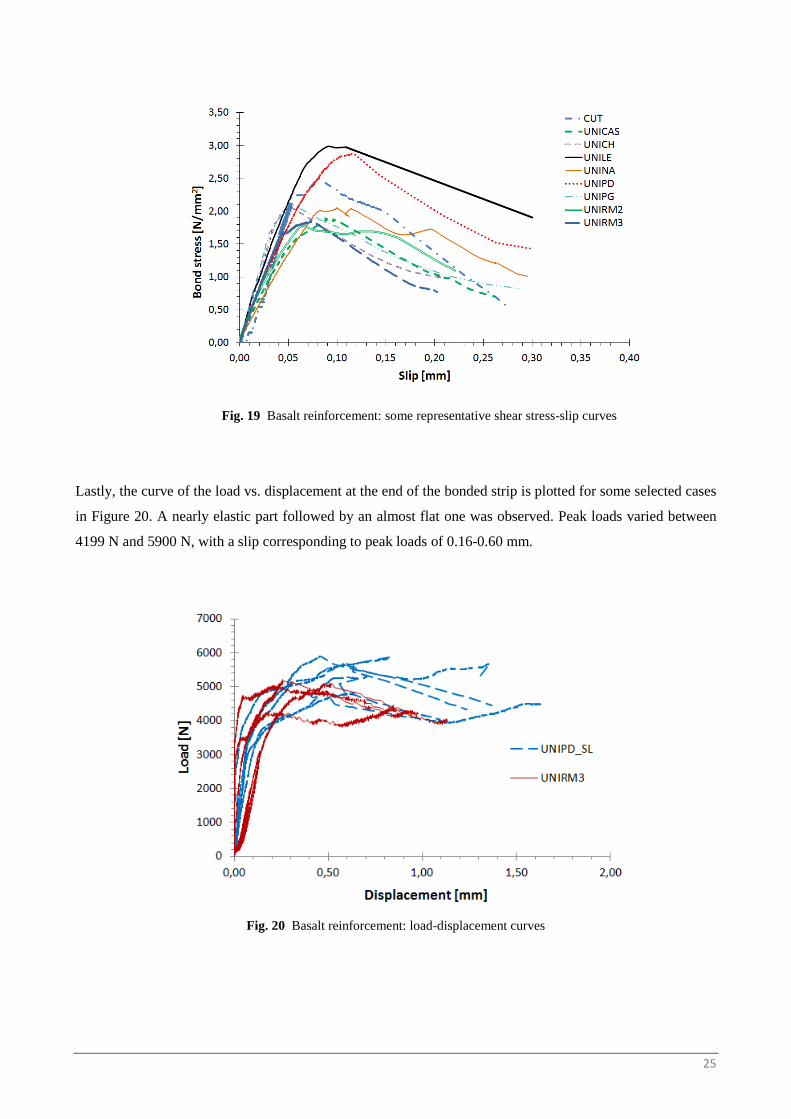
Fig. 19 Basalt reinforcement: some representative shear stress-slip curves
Lastly, the curve of the load vs. displacement at the end of the bonded strip is plotted for some selected cases
in Figure 20. A nearly elastic part followed by an almost flat one was observed. Peak loads varied between
4199 N and 5900 N, with a slip corresponding to peak loads of 0.16-0.60 mm.
Fig. 20 Basalt reinforcement: load-displacement curves
26
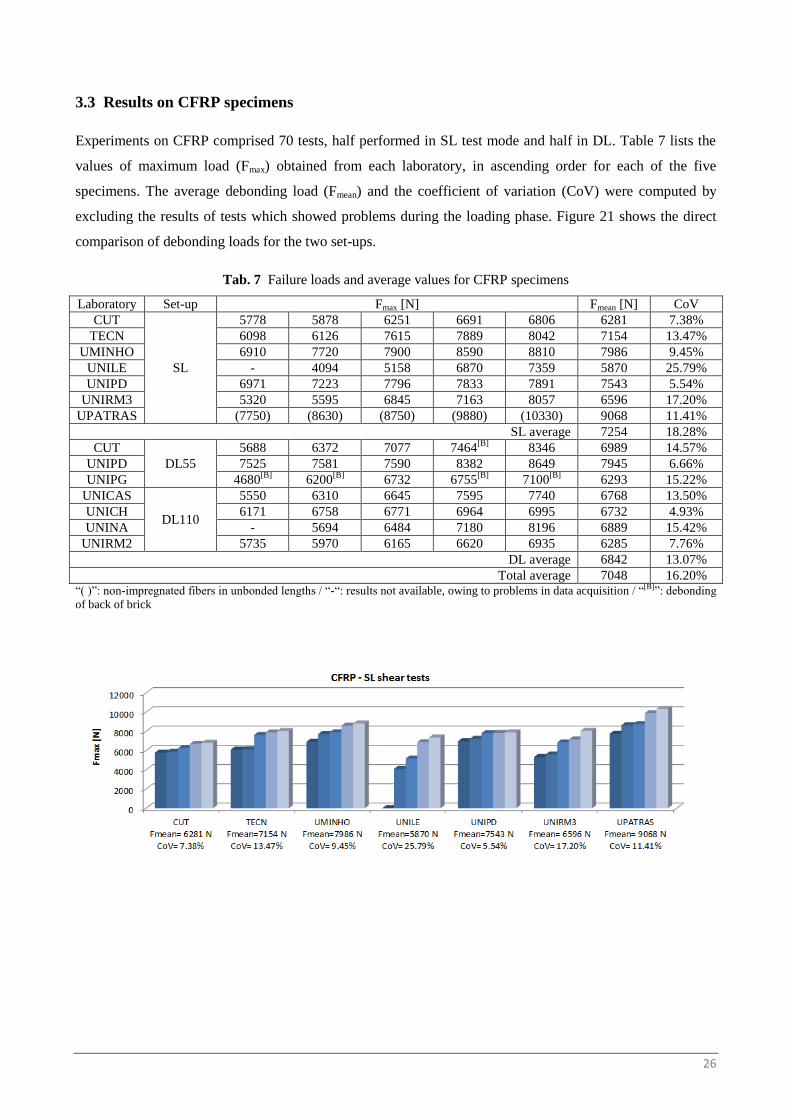
3.3 Results on CFRP specimens
Experiments on CFRP comprised 70 tests, half performed in SL test mode and half in DL. Table 7 lists the
values of maximum load (Fmax) obtained from each laboratory, in ascending order for each of the five
specimens. The average debonding load (Fmean) and the coefficient of variation (CoV) were computed by
excluding the results of tests which showed problems during the loading phase. Figure 21 shows the direct
comparison of debonding loads for the two set-ups.
Tab. 7 Failure loads and average values for CFRP specimens
Laboratory Set-up Fmax [N] Fmean [N] CoV
CUT
SL
5778 5878 6251 6691 6806 6281 7.38%
TECN 6098 6126 7615 7889 8042 7154 13.47%
UMINHO 6910 7720 7900 8590 8810 7986 9.45%
UNILE - 4094 5158 6870 7359 5870 25.79%
UNIPD 6971 7223 7796 7833 7891 7543 5.54%
UNIRM3 5320 5595 6845 7163 8057 6596 17.20%
UPATRAS (7750) (8630) (8750) (9880) (10330) 9068 11.41%
SL average 7254 18.28%
CUT
DL55
5688 6372 7077 7464[B]
8346 6989 14.57%
UNIPD 7525 7581 7590 8382 8649 7945 6.66%
UNIPG 4680[B]
6200[B]
6732 6755[B]
7100[B]
6293 15.22%
UNICAS
DL110
5550 6310 6645 7595 7740 6768 13.50%
UNICH 6171 6758 6771 6964 6995 6732 4.93%
UNINA - 5694 6484 7180 8196 6889 15.42%
UNIRM2 5735 5970 6165 6620 6935 6285 7.76%
DL average 6842 13.07%
Total average 7048 16.20% “( )”: non-impregnated fibers in unbonded lengths / “-“: results not available, owing to problems in data acquisition / “[B]”: debonding
of back of brick
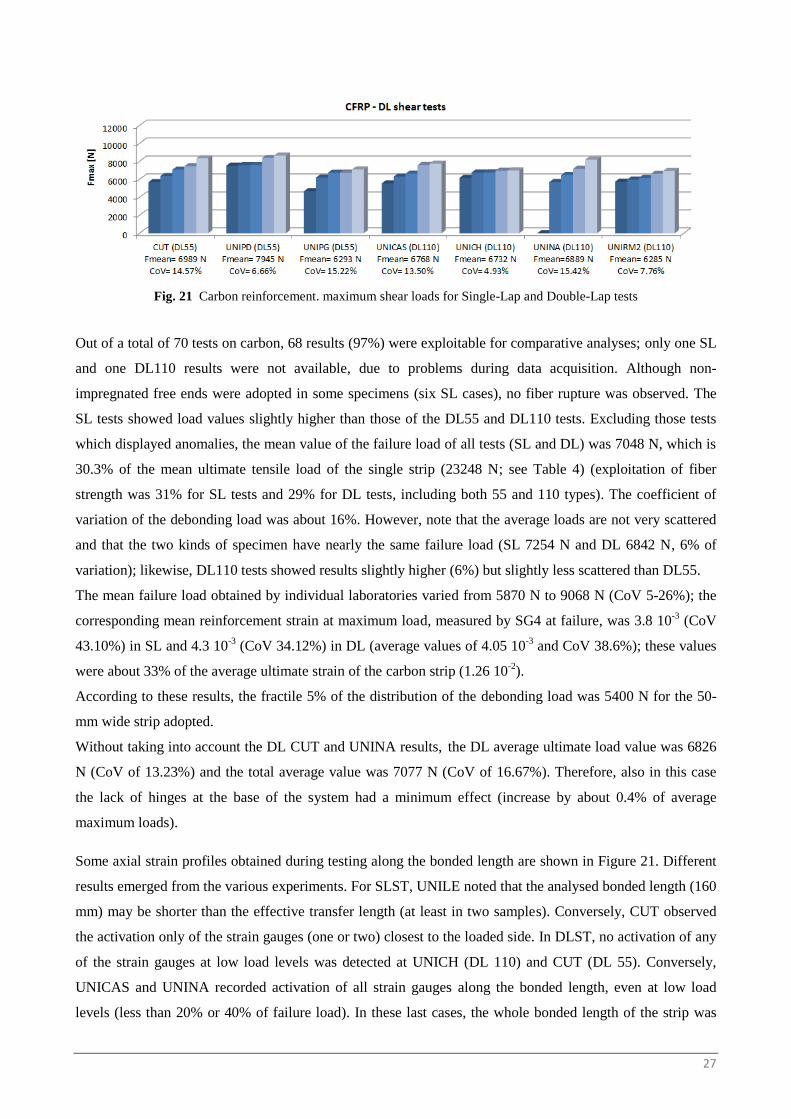
27
Fig. 21 Carbon reinforcement. maximum shear loads for Single-Lap and Double-Lap tests
Out of a total of 70 tests on carbon, 68 results (97%) were exploitable for comparative analyses; only one SL
and one DL110 results were not available, due to problems during data acquisition. Although non-
impregnated free ends were adopted in some specimens (six SL cases), no fiber rupture was observed. The
SL tests showed load values slightly higher than those of the DL55 and DL110 tests. Excluding those tests
which displayed anomalies, the mean value of the failure load of all tests (SL and DL) was 7048 N, which is
30.3% of the mean ultimate tensile load of the single strip (23248 N; see Table 4) (exploitation of fiber
strength was 31% for SL tests and 29% for DL tests, including both 55 and 110 types). The coefficient of
variation of the debonding load was about 16%. However, note that the average loads are not very scattered
and that the two kinds of specimen have nearly the same failure load (SL 7254 N and DL 6842 N, 6% of
variation); likewise, DL110 tests showed results slightly higher (6%) but slightly less scattered than DL55.
The mean failure load obtained by individual laboratories varied from 5870 N to 9068 N (CoV 5-26%); the
corresponding mean reinforcement strain at maximum load, measured by SG4 at failure, was 3.8 10-3
(CoV
43.10%) in SL and 4.3 10-3
(CoV 34.12%) in DL (average values of 4.05 10-3
and CoV 38.6%); these values
were about 33% of the average ultimate strain of the carbon strip (1.26 10-2
).
According to these results, the fractile 5% of the distribution of the debonding load was 5400 N for the 50-
mm wide strip adopted.
Without taking into account the DL CUT and UNINA results, the DL average ultimate load value was 6826
N (CoV of 13.23%) and the total average value was 7077 N (CoV of 16.67%). Therefore, also in this case
the lack of hinges at the base of the system had a minimum effect (increase by about 0.4% of average
maximum loads).
Some axial strain profiles obtained during testing along the bonded length are shown in Figure 21. Different
results emerged from the various experiments. For SLST, UNILE noted that the analysed bonded length (160
mm) may be shorter than the effective transfer length (at least in two samples). Conversely, CUT observed
the activation only of the strain gauges (one or two) closest to the loaded side. In DLST, no activation of any
of the strain gauges at low load levels was detected at UNICH (DL 110) and CUT (DL 55). Conversely,
UNICAS and UNINA recorded activation of all strain gauges along the bonded length, even at low load
levels (less than 20% or 40% of failure load). In these last cases, the whole bonded length of the strip was
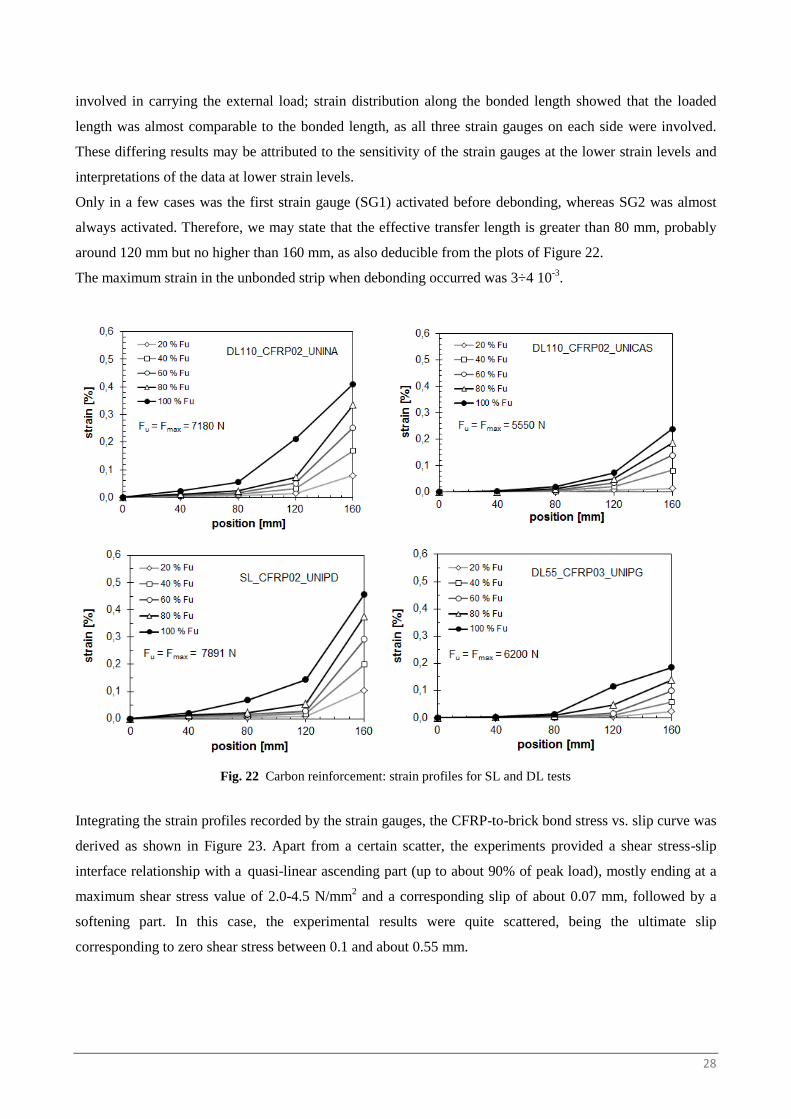
28
involved in carrying the external load; strain distribution along the bonded length showed that the loaded
length was almost comparable to the bonded length, as all three strain gauges on each side were involved.
These differing results may be attributed to the sensitivity of the strain gauges at the lower strain levels and
interpretations of the data at lower strain levels.
Only in a few cases was the first strain gauge (SG1) activated before debonding, whereas SG2 was almost
always activated. Therefore, we may state that the effective transfer length is greater than 80 mm, probably
around 120 mm but no higher than 160 mm, as also deducible from the plots of Figure 22.
The maximum strain in the unbonded strip when debonding occurred was 3÷4 10-3
.
Fig. 22 Carbon reinforcement: strain profiles for SL and DL tests
Integrating the strain profiles recorded by the strain gauges, the CFRP-to-brick bond stress vs. slip curve was
derived as shown in Figure 23. Apart from a certain scatter, the experiments provided a shear stress-slip
interface relationship with a quasi-linear ascending part (up to about 90% of peak load), mostly ending at a
maximum shear stress value of 2.0-4.5 N/mm2 and a corresponding slip of about 0.07 mm, followed by a
softening part. In this case, the experimental results were quite scattered, being the ultimate slip
corresponding to zero shear stress between 0.1 and about 0.55 mm.
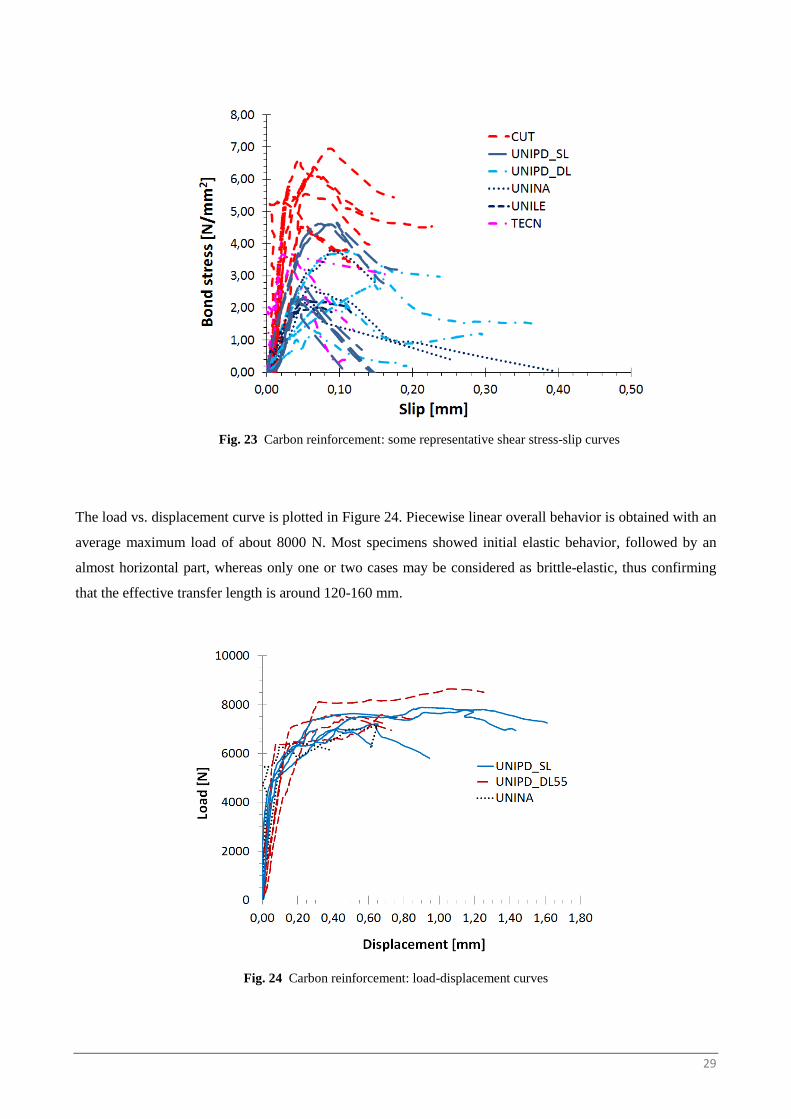
29
Fig. 23 Carbon reinforcement: some representative shear stress-slip curves
The load vs. displacement curve is plotted in Figure 24. Piecewise linear overall behavior is obtained with an
average maximum load of about 8000 N. Most specimens showed initial elastic behavior, followed by an
almost horizontal part, whereas only one or two cases may be considered as brittle-elastic, thus confirming
that the effective transfer length is around 120-160 mm.
Fig. 24 Carbon reinforcement: load-displacement curves
30
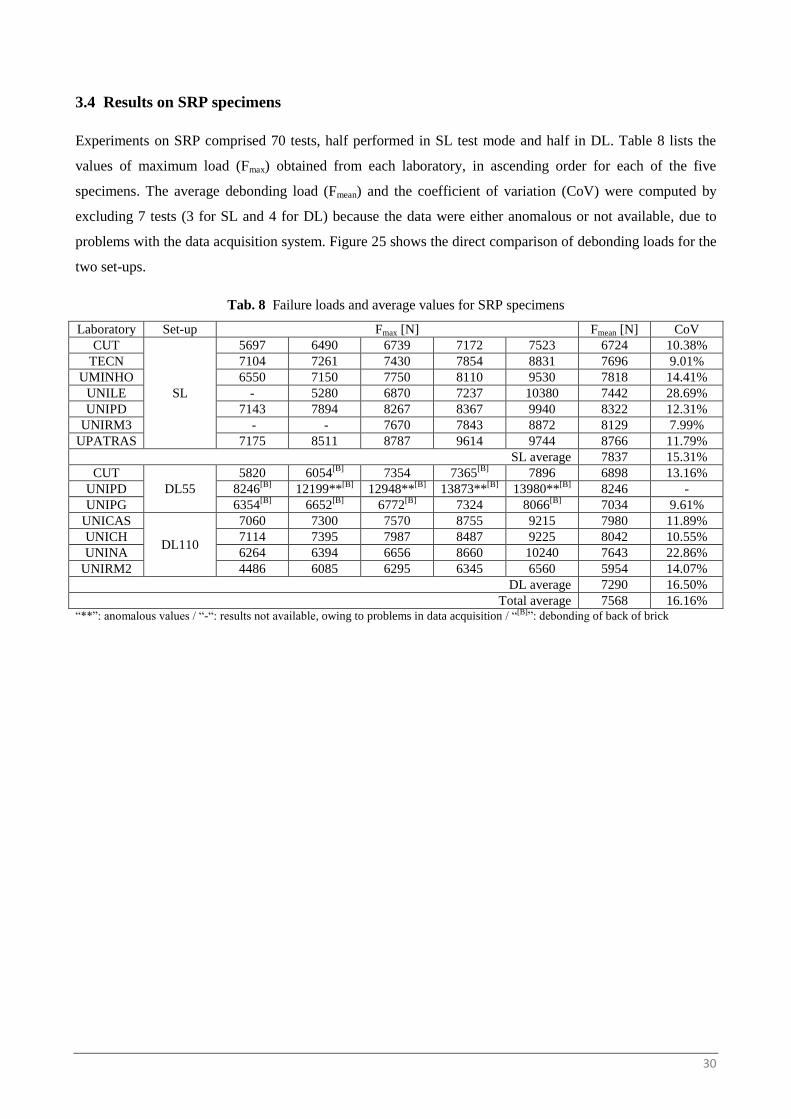
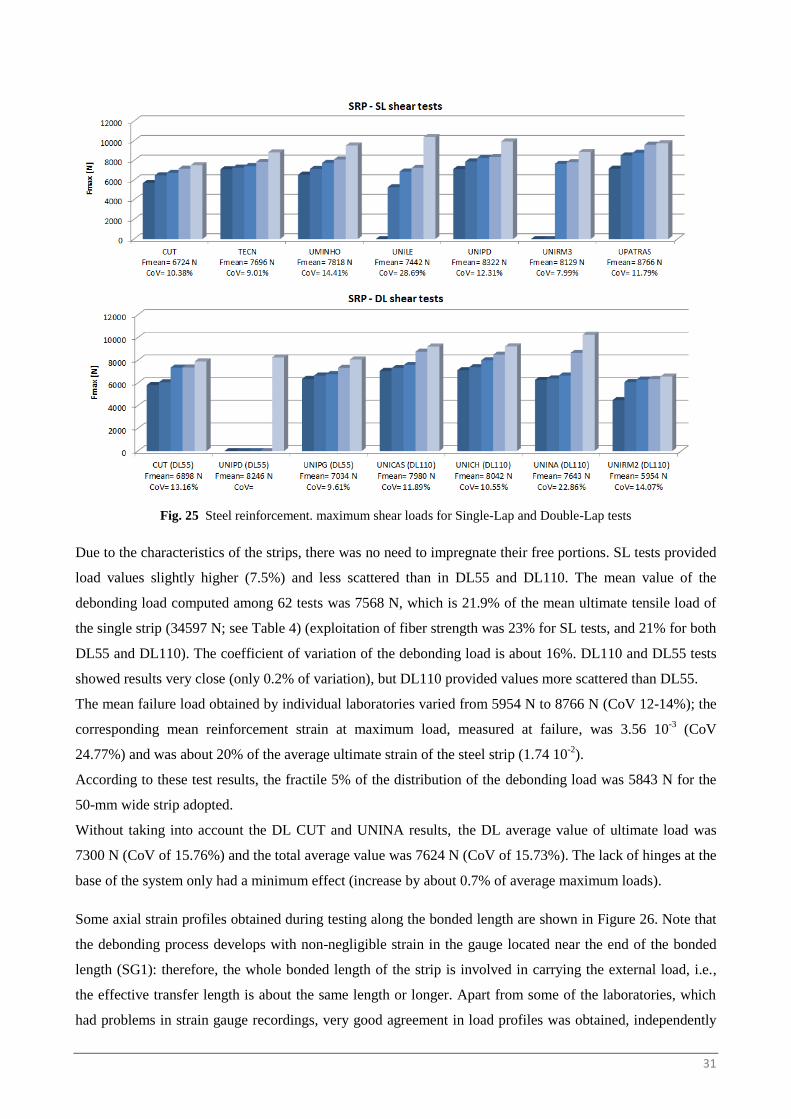
3.4 Results on SRP specimens
Experiments on SRP comprised 70 tests, half performed in SL test mode and half in DL. Table 8 lists the
values of maximum load (Fmax) obtained from each laboratory, in ascending order for each of the five
specimens. The average debonding load (Fmean) and the coefficient of variation (CoV) were computed by
excluding 7 tests (3 for SL and 4 for DL) because the data were either anomalous or not available, due to
problems with the data acquisition system. Figure 25 shows the direct comparison of debonding loads for the
two set-ups.
Tab. 8 Failure loads and average values for SRP specimens
Laboratory Set-up Fmax [N] Fmean [N] CoV
CUT
SL
5697 6490 6739 7172 7523 6724 10.38%
TECN 7104 7261 7430 7854 8831 7696 9.01%
UMINHO 6550 7150 7750 8110 9530 7818 14.41%
UNILE - 5280 6870 7237 10380 7442 28.69%
UNIPD 7143 7894 8267 8367 9940 8322 12.31%
UNIRM3 - - 7670 7843 8872 8129 7.99%
UPATRAS 7175 8511 8787 9614 9744 8766 11.79%
SL average 7837 15.31%
CUT
DL55
5820 6054[B]
7354 7365[B]
7896 6898 13.16%
UNIPD 8246[B]
12199**[B]
12948**[B]
13873**[B]
13980**[B]
8246 -
UNIPG 6354[B]
6652[B]
6772[B]
7324 8066[B]
7034 9.61%
UNICAS
DL110
7060 7300 7570 8755 9215 7980 11.89%
UNICH 7114 7395 7987 8487 9225 8042 10.55%
UNINA 6264 6394 6656 8660 10240 7643 22.86%
UNIRM2 4486 6085 6295 6345 6560 5954 14.07%
DL average 7290 16.50%
Total average 7568 16.16% “**”: anomalous values / “-“: results not available, owing to problems in data acquisition / “[B]”: debonding of back of brick
31
Fig. 25 Steel reinforcement. maximum shear loads for Single-Lap and Double-Lap tests
Due to the characteristics of the strips, there was no need to impregnate their free portions. SL tests provided
load values slightly higher (7.5%) and less scattered than in DL55 and DL110. The mean value of the
debonding load computed among 62 tests was 7568 N, which is 21.9% of the mean ultimate tensile load of
the single strip (34597 N; see Table 4) (exploitation of fiber strength was 23% for SL tests, and 21% for both
DL55 and DL110). The coefficient of variation of the debonding load is about 16%. DL110 and DL55 tests
showed results very close (only 0.2% of variation), but DL110 provided values more scattered than DL55.
The mean failure load obtained by individual laboratories varied from 5954 N to 8766 N (CoV 12-14%); the
corresponding mean reinforcement strain at maximum load, measured at failure, was 3.56 10-3
(CoV
24.77%) and was about 20% of the average ultimate strain of the steel strip (1.74 10-2
).
According to these test results, the fractile 5% of the distribution of the debonding load was 5843 N for the
50-mm wide strip adopted.
Without taking into account the DL CUT and UNINA results, the DL average value of ultimate load was
7300 N (CoV of 15.76%) and the total average value was 7624 N (CoV of 15.73%). The lack of hinges at the
base of the system only had a minimum effect (increase by about 0.7% of average maximum loads).
Some axial strain profiles obtained during testing along the bonded length are shown in Figure 26. Note that
the debonding process develops with non-negligible strain in the gauge located near the end of the bonded
length (SG1): therefore, the whole bonded length of the strip is involved in carrying the external load, i.e.,
the effective transfer length is about the same length or longer. Apart from some of the laboratories, which
had problems in strain gauge recordings, very good agreement in load profiles was obtained, independently
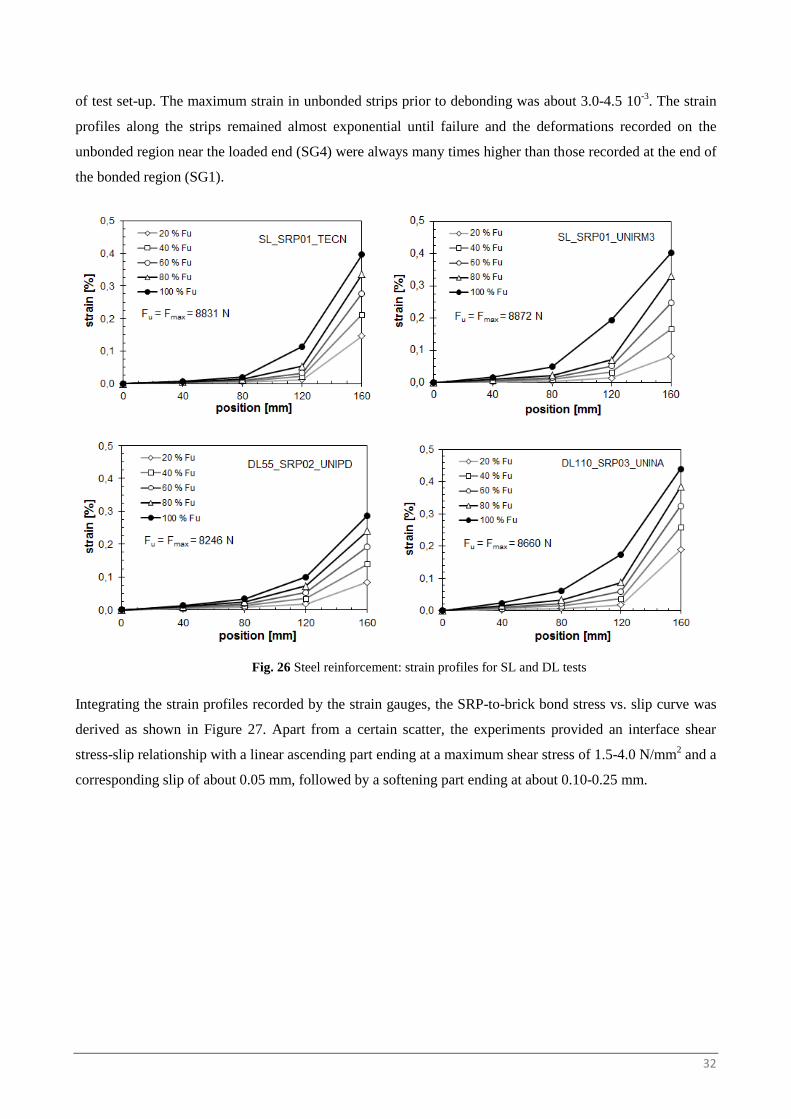
32
of test set-up. The maximum strain in unbonded strips prior to debonding was about 3.0-4.5 10-3
. The strain
profiles along the strips remained almost exponential until failure and the deformations recorded on the
unbonded region near the loaded end (SG4) were always many times higher than those recorded at the end of
the bonded region (SG1).
Fig. 26 Steel reinforcement: strain profiles for SL and DL tests
Integrating the strain profiles recorded by the strain gauges, the SRP-to-brick bond stress vs. slip curve was
derived as shown in Figure 27. Apart from a certain scatter, the experiments provided an interface shear
stress-slip relationship with a linear ascending part ending at a maximum shear stress of 1.5-4.0 N/mm2 and a
corresponding slip of about 0.05 mm, followed by a softening part ending at about 0.10-0.25 mm.
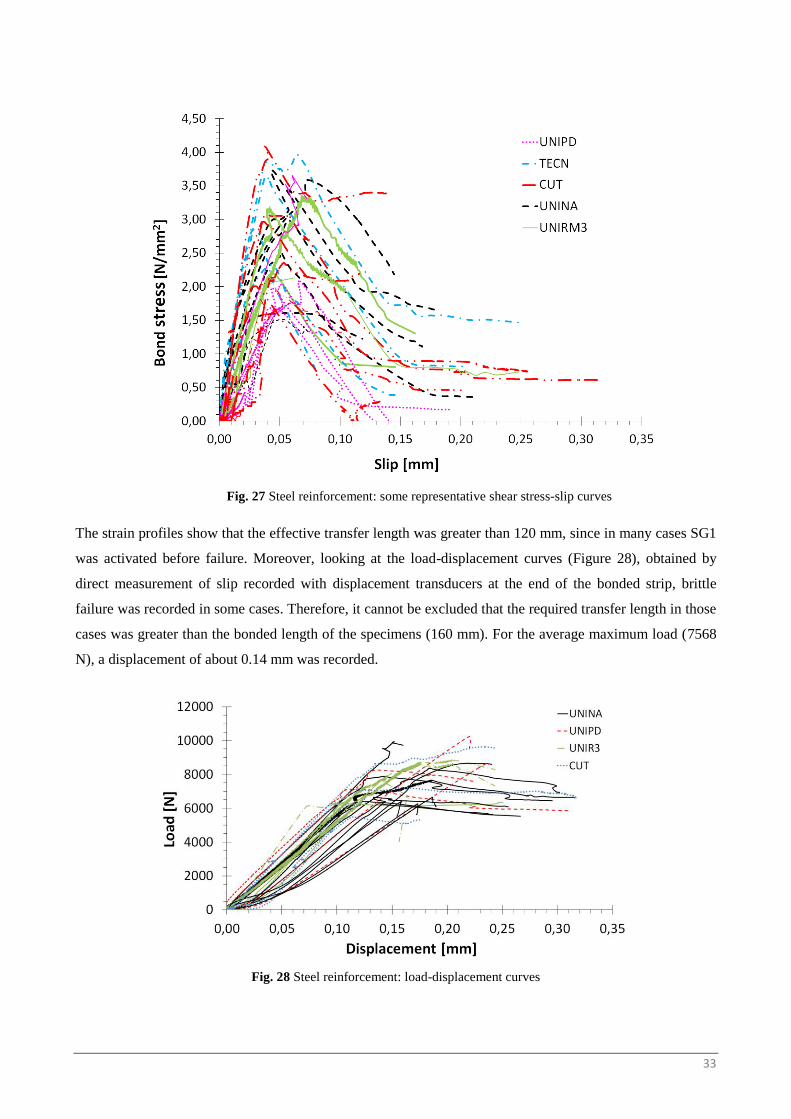
33
Fig. 27 Steel reinforcement: some representative shear stress-slip curves
The strain profiles show that the effective transfer length was greater than 120 mm, since in many cases SG1
was activated before failure. Moreover, looking at the load-displacement curves (Figure 28), obtained by
direct measurement of slip recorded with displacement transducers at the end of the bonded strip, brittle
failure was recorded in some cases. Therefore, it cannot be excluded that the required transfer length in those
cases was greater than the bonded length of the specimens (160 mm). For the average maximum load (7568
N), a displacement of about 0.14 mm was recorded.
Fig. 28 Steel reinforcement: load-displacement curves
34
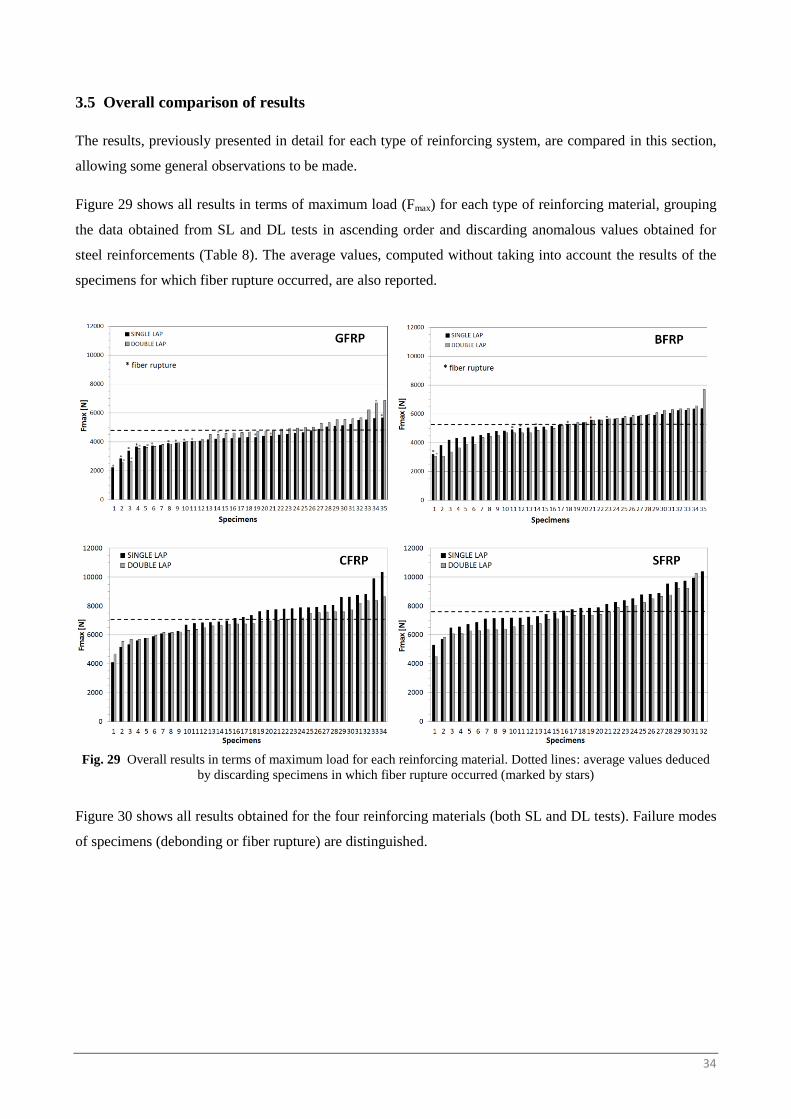
3.5 Overall comparison of results
The results, previously presented in detail for each type of reinforcing system, are compared in this section,
allowing some general observations to be made.
Figure 29 shows all results in terms of maximum load (Fmax) for each type of reinforcing material, grouping
the data obtained from SL and DL tests in ascending order and discarding anomalous values obtained for
steel reinforcements (Table 8). The average values, computed without taking into account the results of the
specimens for which fiber rupture occurred, are also reported.
Fig. 29 Overall results in terms of maximum load for each reinforcing material. Dotted lines: average values deduced
by discarding specimens in which fiber rupture occurred (marked by stars)
Figure 30 shows all results obtained for the four reinforcing materials (both SL and DL tests). Failure modes
of specimens (debonding or fiber rupture) are distinguished.
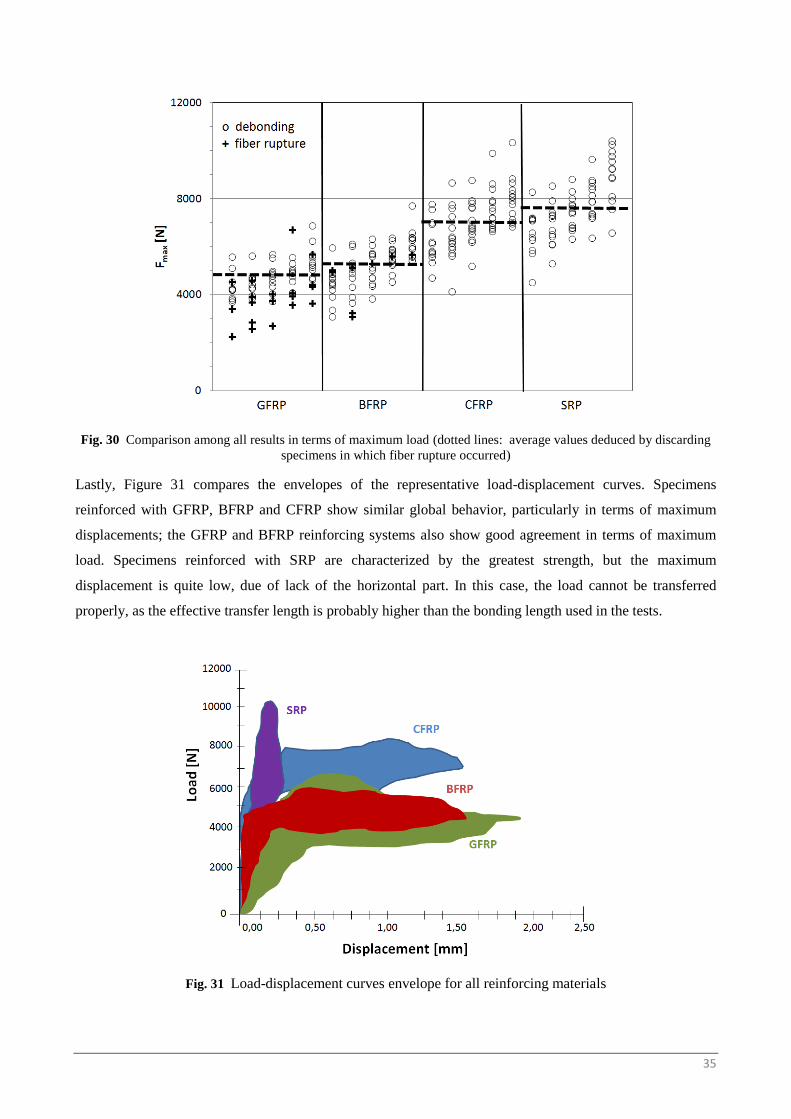
35
Fig. 30 Comparison among all results in terms of maximum load (dotted lines: average values deduced by discarding
specimens in which fiber rupture occurred)
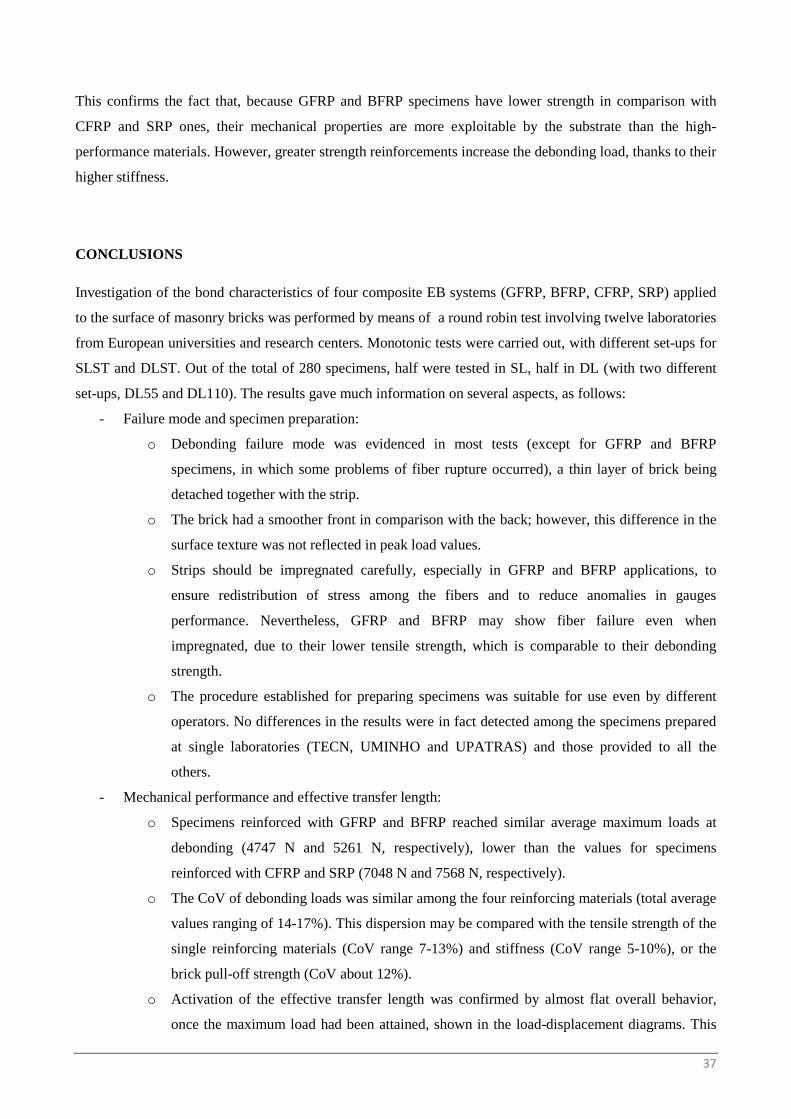
Lastly, Figure 31 compares the envelopes of the representative load-displacement curves. Specimens
reinforced with GFRP, BFRP and CFRP show similar global behavior, particularly in terms of maximum
displacements; the GFRP and BFRP reinforcing systems also show good agreement in terms of maximum
load. Specimens reinforced with SRP are characterized by the greatest strength, but the maximum
displacement is quite low, due of lack of the horizontal part. In this case, the load cannot be transferred
properly, as the effective transfer length is probably higher than the bonding length used in the tests.
Fig. 31 Load-displacement curves envelope for all reinforcing materials
36
This data processing allows us to make the following comments:
- Fiber rupture only affects specimens strengthened with the GFRP and BFRP systems. In particular,
most of the cases of fiber rupture were those strengthened with GFRP (19 specimens, 27% of the
total of 70 tests). This behavior is due to the fact that the average debonding load of GFRP is about
60% of the tensile failure load, so that, when stress concentration occurs due to experimental
imperfections, tensile failure takes place instead of debonding.
- Comparing the average value of the failure load of each type of reinforcing material, the specimens
reinforced with GFRP strips had the lowest values (average 4747 N), while those strengthened with
SRP had the highest ones (7568 N). Nevertheless, specimens strengthened with BFRP had an
average maximum load (5261 N) similar to that of specimens strengthened with GFRP, and those
strengthened with CFRP had an average maximum load (7048 N) similar to that of specimens
strengthened with SRP. It is worth noting that higher axial stiffness of the reinforcement gives a
higher debonding load, due to an increasing of the effective transfer length.
- The results in terms of debonding load (Fmax) deduced from the SL and DL tests are in accord for all
types of EB systems within acceptable limits, although the values deduced from SL are often larger
than those of DL. This may depend on the non-equal distribution of the load between the two sides
of DL specimens, which occurs mostly for stiffer materials (CFRP and SRP), perhaps due to defects
in the accommodation of the reinforcement round the roller device. Conversely, for GFRP
strengthening, SL showed lower values than DL, probably due to the greater difficulty in providing
perfect alignment of the load in the SL device, which may induce stress concentration in the bond.
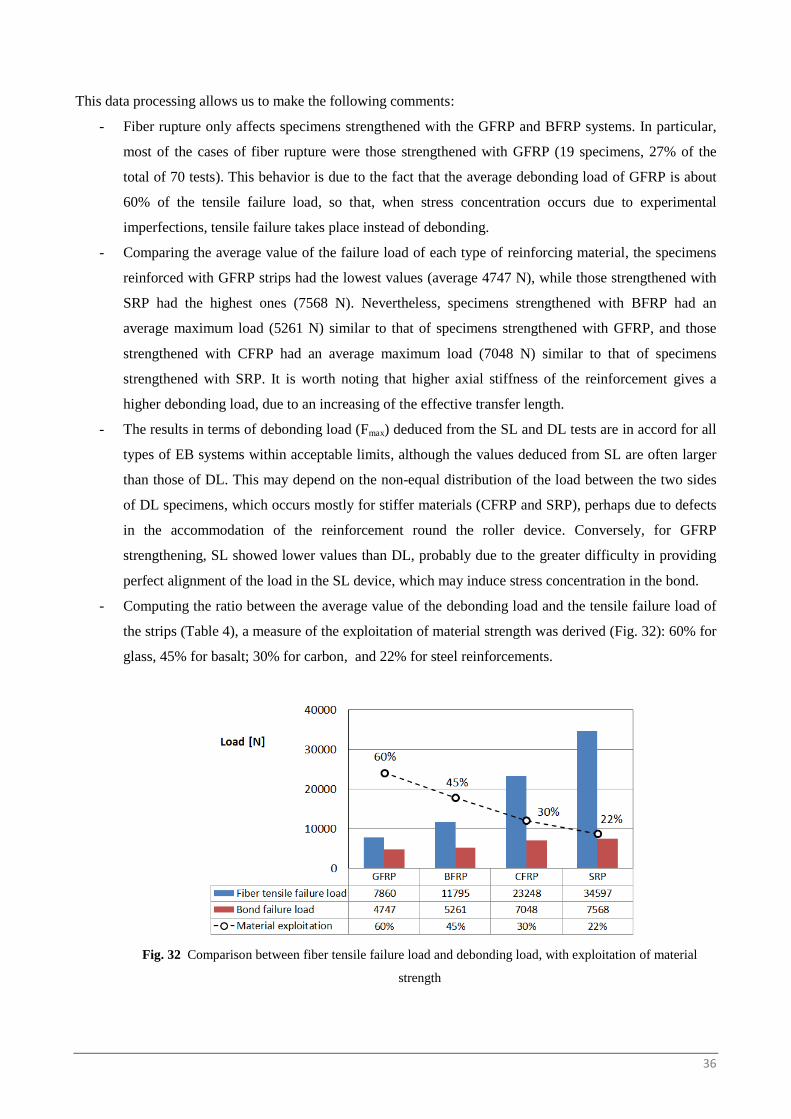
- Computing the ratio between the average value of the debonding load and the tensile failure load of
the strips (Table 4), a measure of the exploitation of material strength was derived (Fig. 32): 60% for
glass, 45% for basalt; 30% for carbon, and 22% for steel reinforcements.
Fig. 32 Comparison between fiber tensile failure load and debonding load, with exploitation of material
strength
37
This confirms the fact that, because GFRP and BFRP specimens have lower strength in comparison with
CFRP and SRP ones, their mechanical properties are more exploitable by the substrate than the high-
performance materials. However, greater strength reinforcements increase the debonding load, thanks to their
higher stiffness.
CONCLUSIONS
Investigation of the bond characteristics of four composite EB systems (GFRP, BFRP, CFRP, SRP) applied
to the surface of masonry bricks was performed by means of a round robin test involving twelve laboratories
from European universities and research centers. Monotonic tests were carried out, with different set-ups for
SLST and DLST. Out of the total of 280 specimens, half were tested in SL, half in DL (with two different
set-ups, DL55 and DL110). The results gave much information on several aspects, as follows:
- Failure mode and specimen preparation:
o Debonding failure mode was evidenced in most tests (except for GFRP and BFRP
specimens, in which some problems of fiber rupture occurred), a thin layer of brick being
detached together with the strip.
o The brick had a smoother front in comparison with the back; however, this difference in the
surface texture was not reflected in peak load values.
o Strips should be impregnated carefully, especially in GFRP and BFRP applications, to
ensure redistribution of stress among the fibers and to reduce anomalies in gauges
performance. Nevertheless, GFRP and BFRP may show fiber failure even when
impregnated, due to their lower tensile strength, which is comparable to their debonding
strength.
o The procedure established for preparing specimens was suitable for use even by different
operators. No differences in the results were in fact detected among the specimens prepared
at single laboratories (TECN, UMINHO and UPATRAS) and those provided to all the
others.
- Mechanical performance and effective transfer length:
o Specimens reinforced with GFRP and BFRP reached similar average maximum loads at
debonding (4747 N and 5261 N, respectively), lower than the values for specimens
reinforced with CFRP and SRP (7048 N and 7568 N, respectively).
o The CoV of debonding loads was similar among the four reinforcing materials (total average
values ranging of 14-17%). This dispersion may be compared with the tensile strength of the
single reinforcing materials (CoV range 7-13%) and stiffness (CoV range 5-10%), or the
brick pull-off strength (CoV about 12%).
o Activation of the effective transfer length was confirmed by almost flat overall behavior,
once the maximum load had been attained, shown in the load-displacement diagrams. This
38
was detected for specimens reinforced with GFRP, BFRP and CFRP; only specimens
reinforced with SRP showed overall elastic brittle behavior, thus confirming that the
effective transfer length was higher than the adopted bonded length (160 mm).
o In particular, the effective transfer length was lower for specimens reinforced with GFRP
and BFRP (about 80 mm) in comparison with those reinforced with CFRP (between 120 and
160 mm) and with SRP (higher than 160 mm), due to the lower stiffness of the fibers.
o Exploitation of fiber strength (i.e., ratio between tensile failure load and debonding load)
was higher for specimens reinforced with GFRP and BFRP (45-60%) than those reinforced
with CFRP and SRP (22-30%); in GFRP and BFRP specimens, the debonding load was
closer to the tensile strength of the reinforcement.
- Measurement system and test set-up:
o The lay-out of the strain gauges allowed deriving the strain profiles and the τ-slip behavior.
Extra displacement transducers were useful in providing global load-displacement curves.
o However, in many cases, the data recorded by the strain gauges and displacement
transducers were incorrect or difficult to interpret, due to various problems such as
misalignment of fibers at the measuring points or defects in the adhesion of the transducer
supports to the strips.
o In the case of DLST, the stress evaluation provided by the gauges on both sides of the bricks
displayed differences, apparently related mainly to local effects, such as the non-uniform
distribution of stresses in the fibers, rather than to the unequal distribution of load between
the two sides of the brick.
o In some cases, comparisons of the slip obtained by integrating the strain profile along the
strip also showed some non-negligible differences, which may have depended on brick
strain, micro-displacements during loading neglected in integration, or the above-mentioned
non-uniform strain distribution in the fibers.
o The DL set-up, especially designed and agreed upon among partners, turned out to be easily
implemented in the laboratory with common electromechanical or servo-hydraulic universal
machines; it allowed simple self-equilibrated tests to be carried out, and the load can be
assumed to be evenly distributed between the two composite strips, due to mechanical
constraints (e.g., ball joints and roller device).
o DL55 and DL110 set-ups showed very similar results: considering each single reinforcing
material, the variation of mean loads ranged from 0.2 to 9% between the two systems;
except for CFRP, DL110 showed results slightly more scattered than DL55.
o Therefore, the higher curvature of the strip adopted in DL55 set-up did not influence
significantly the results. Proper impregnation of the curved unbonded length, also helps to
avoid stress concentration.
39
o Testing efficiency may be affected by different boundary conditions, ought to modifications
made on the DL test set-up. Nevertheless, in the present experiments, only slight effects
were observed on the results, in case of lacking of the hinge at the base. Of course, care in
centering the specimen correctly is particularly recommended.
o SL set-ups require specific testing frames and care in load alignment, but are not affected by
uncertainties in the values of load applied to the strip. Results showed higher sensitivity to
the brittleness of fibers with respect to DLST.
o Nevertheless, in the ambit of each single reinforcing material, mean values of debonding
loads differ in a small range (2-7.5%) between SL and DL set-ups.
o The SL system also requires particular care in clamping the free end of the strip. Although
several systems were adopted by the various laboratories, no particular differences in results
were recorded.
The presented experiments investigated the bond efficiency of EB composites applied to masonry bricks,
with the aim of clarifying the influence of various reinforcing systems and test set-ups. A good match
between the two set-ups and good repeatability in various laboratory conditions were found. Although the
composite-to-brick bond is probably the major contributor to the behavior of external bond strips applied to
brick masonry, it is worth recalling that other factors can also play an important role in evaluations, such as:
the presence of mortar joints, misalignment of bricks, substrate and environmental conditions, and care in
application. In this perspective, further experiments are needed, to investigate higher bond lengths
(especially for CFRP or SRP), various composite material thicknesses; various substrates (e.g., stone) with
differing mechanical properties; differing properties of adhesives; the presence of mortar joints (by tests on
masonry prisms); cyclic behavior; and the influence of hydro-thermal and aggressive environmental
conditions (e.g. salty). Some of this work has already been planned within the framework of TC 223-MSC as
an extension and/or integration to the understanding of the bonding phenomenon.
Acknowledgments
The authors would like to thank the companies which supported the whole experimental project: Fidia
Technical Global Service and SGM Laboratory, Perugia (Italy), for providing composite materials and for
making available facilities for making specimens, respectively; and SanMarco-Terreal Italia, Noale (Venice,
Italy) for providing the bricks.
In particular, grateful thanks also go to those members of the above companies involved in the project: Paolo
Casadei (Fidia Technical Global Service, Italy) and Franco Favaro (SanMarco-Terreal Italia, Italy), as well
as all the experts, laboratory technicians and undergraduates and Ph.D. students from the participating
institutions, including: Stanisław Kańka (Cracow University of Technology, Poland); Alberto Zinno,
Gaetano Manfredi (University of Naples, Italy); Kyriakos Karlos (University of Patras, Greece); Samuele
40
Biondi, Ana Di Evangelista, Elena Candigliota, Carlo Di Cintio (University “G. D’Annunzio” of Chieti -
Pescara, Italy); Giuseppe Paci, Antonio Borri, Alessio Molinari (University of Perugia, Italy); Zila Rinaldi
(University of Roma Tor Vergata, Italy); Maura Imbimbo (University of Cassino and Southern Lazio); Irene
Carbone (University Roma Tre, Italy); Maria Antonietta Aiello (University of Salento, Italy); José-Tomás
San-José, Pello Larrinaga, Josu Lucena (Tecnalia Research & Innovation, Spain).
REFERENCES
ACI 440M Guide Draft-1 (2004) Guide for the design and construction of externally bonded FRP system for
strengthening unreinforced masonry structures, ACI Committee 440, Farmington Hills, Michigan, USA
ACI 440.2R-08 (2008) Guide for the design and construction of externally bonded FRP systems for strengthening
concrete structures. ACI Committee 440, Farmington Hills, Michigan, USA
ACI 440.3R-04 (2004) Guide Test Methods for Fiber-Reinforced Polymers (FRPs) for Reinforcing or Strengthening
Concrete Structures. ACI Committee 440, Farmington Hills, Michigan, USA
ACI 440.7R-10 (2010) Guide for design and construction of externally bonded frp systems for strengthening
unreinforced masonry structures. ACI Committee 440, Farmington Hills, Michigan, USA Aiello MA, Micelli F, Valente L (2005) Circular masonry columns confined with FRP. In: Composites in Construction
- CCC2005, Proc. of the 3rd
Int. Conf., Lyon, France Aiello MA, Micelli F, Valente L (2007) Structural upgrading of masonry columns by using composite reinforcements.
ASCE J. of Composites for Construction, 11(6): 650-658 Aiello MA, Sciolti MS (2005) Influence of moistness and high temperature on bond between FRP reinforcement and
calcarenite ashlars. In: Composites in Construction - CCC2005, Proc. of the 3rd
Int. Conf., Lyon, France Aiello MA, Sciolti MS (2003) Experimental investigation on bond between FRP sheets and natural masonry blocks. In:
Proc. of 10th Int. Conf. on Structural Faults and Repair SF&R-2003, London, UK Aiello MA, Sciolti MS (2006) Bond analysis of masonry structures strengthened with CFRP sheets. Construction and
Building Materials, 20 (1): 90-100 Albert ML, Cheng JJR, Elwi AE (1998) Rehabilitation of unreinforced masonry walls with externally applied fiber-
reinforced polymers. In: Struct. Eng. Rep. No. 226, Dept. of Civ. and Envir. Eng., University of Alberta, Canada Ascione L, Feo L, Fraternali F (2005) Load carrying capacity of 2D FRP/strengthened masonry structures. Composites
Part B, 36 (8): 619-626 ASTM C1583 (2004) Standard test method for tensile strength of concrete surfaces and the bond strength or tensile
strength of concrete repair and overlay materials by direct tension (pull-off method), American Society for Testing
and Materials, USA
ASTM D 3039/D 3039M – 07 (2008) Standard Test Method for Tensile Properties of Polymer Matrix Composite
Materials), American Society for Testing and Materials, USA Barbieri A, Borri A, Corradi M, Di Tommaso A (2002) Dynamic behaviour of masonry vaults repaired with FRP:
experimental analysis. In: Proc. of the 6th
Int. Conf, British Masonry Society, 7-16, UK Basilio I, Oliveira D, Lourenço P (2004) Optimal FRP strengthening of masonry arches. In: Brick and Block Masonry
Conference, Proc. of the 13th
Int. Conf., Amsterdam, Netherlands Borri A, Casadei P, Castori G, Ebaugh S (2007) Research on composite strengthening of masonry arches. In: Fiber
Reinforced Polymer Reinforcement for Concrete Structures - FRPRCS-8, Proc. of the 8th
Int. Symp., Patras, Greece Borri A, Castori G, Grazini A (2007) Seismic upgrading of historical masonry buildings with steel reinforced grout
(SRG). In: Fiber Reinforced Polymer Reinforcement for Concrete Structures - FRPRCS-8, Proc. of the 8th
Int.
Symp., Patras, Greece Briccoli Bati S, Rovero L (2000) Consolidation of masonry arches with carbon-fiber reinforced plastics. In: Proc. of
12th
Int. Brick/Block Conference, Madrid, Spain Briccoli Bati S, Rovero L (2001) Experimental validation of a proposed numerical model for the FRP consolidation of
masonry arches. In: Structural Analysis of historical construction - SAHC 2001, Proc. of the 3rd
Int. Conf., Guimaraes, Portugal, 1057-1066
Briccoli Bati S, Rovero L (2009) Bond strength between brick and CFRP strips. In: Mechanics of masonry structures
strengthened with composite materials: modeling, testing, design, control - MuRiCo3, Proc. of the 3rd
Nat. Conf.,
Venice, Italy, 146-152
Camli US, Binici B (2007) Strength of carbon fiber reinforced polymers bonded to concrete and masonry. Construction
and Building Materials, 21: 1431-1446
Cancelli AN, Aiello MA, Casadei P (2007) Experimental investigation on bond properties of SRP/SRG – Masonry
systems. In: Fiber Reinforced Polymer Reinforcement for Concrete Structures - FRPRCS-8, Proc. of the 8th
Int.
Symp., Patras, Greece
41
Capozucca R (2010). Experimental FRP/SRP-historic masonry delamination. Composite Structures, 92: 891-903 Casareto M, Oliveri A, Romelli A, Lagomarsino S (2003) Bond behavior of FRP laminates adhered to masonry.
Advancing with Composites. In: Plast-2003, Proc. of the Int. Conf., Milan, Italy Cecchi A, Milani G, Tralli A (2004) In-plane loaded CFRP reinforced masonry walls: mechanical characteristics by
homogenisation procedures. Composites Science and Technology, 64: 2097-2112 Chajes MJ, Finch WWJr, Januszka TF, Thomson TA (1996) Bond and force transfer of composite material plates
bonded to concrete. ACI Structural J., 93 (2): 295-303
Ciesielski R, Ciurej H, Kwiecień A (2004) Application of CFRP laminates as strengthening of cracked brick arches. In:
Structural Analysis of Historical Construction - SAHC 2004, Proc. of the 4rd Int. Conf., Padova, Italy, 1357-1365
CNR DT200 (2004) Guide for the design and construction of an externally bonded FRP system for strengthening
existing structures. Italian National Research Council, Rome, Italy Corradi M, Borri A, Vignoli A (2002) Strengthening techniques tested on masonry structures struck by the Umbria-
Marche earthquake of 1997-1998. Construction and Building Materials, 16 (4): 229-239 Corradi M, Grazini A, Borri A (2007) Confinement of brick masonry columns with CFRP materials. Composites
Science and Technology, 67 (9): 1772-1783 De Lorenzis L, Dimitri R, La Tegola A (2005) Strengthening of masonry edge vaults with FRP composites. In:
Composites in Construction - CCC2005, Proc. of the 3rd
Int. Conf., Lyon, France De Lorenzis L, Dimitri R, La Tegola A (2007) Reduction of the lateral thrust of masonry arches and vaults with FRP
composites. Construction and Building Materials, 21 (7): 1415-1430 Ehsani MR, Saadatmanesh H, Al-Saidy A (1997) Shear behavior of URM retrofitted with FRP overlays. ASCE J. of
Composites for Construction, 1 (1): 17-25 El-Gawady MA, Lestuzzi P, Badoux M (2005) Aseismic retrofitting of unreinforced masonry walls using FRP.
Composites Part B, 37 (2): 148-162 EN 772-1 (2002) Methods of test for masonry units -Part 1: Determination of compressive strength
Faella C, Martinelli E, Paciello S, Perri F (2009) Composite materials for masonry structures: the adhesion issue. In:
Proc. of 3rd
Conf. on Mechanics of masonry structures strengthened with composite materials: modeling, testing,
design, control – MuRiCo3, Venice (Italy): 266-273 Ferracuti B, Savoia M, Mazzotti C (2007) Interface law for FRP-concrete delamination. Composite Structures 80: 523-
531 Foraboschi P (2001) Strength assessment of masonry arch retrofitted using composite reinforcements. Masonry
International, 15 (1): 17-25
Foraboschi P (2004) Strengthening of masonry arches with Fiber-Reinforced Polymer strips. ASCE J. of Composites
for Construction, 8 (3): 191-202
Galati N, Micelli F, Tumialan JG, La Tegola A, Nanni A (2004) Comparison between FRP strengthening techniques on
the Out-of-Plane behaviour of URM masonry walls. In: Innovative Materials and Technologies for Construction and
Restoration - IMTCR04, Proc. of the 1st Int. Conf., Lecce, Italy, 440-457
Garbin E, Panizza M, Valluzzi MR (2010) Experimental assessment of bond behaviour of FRP on brick masonry.
IABSE Structural Engineering International, 20 (4): 392-399
Garmendia L, San-José JT, García D, Larrinaga P (2011) Rehabilitation of masonry arches with compatible advanced
composite material. Construction and Building Materials, 25 (12), 4374-4385
Gilstrap JM, Dolan CW (1998) Out-of-plane bending of FRP-reinforced masonry walls. Composites Science and
Technology, 58 (8): 1277-1284
Grande E, Imbimbo M, Sacco E (2011a) Bond behaviour of CFRP laminates glued on clay bricks: Experimental and
numerical study. Composites Part B: Engineering. 42(2): 330-340
Grande E., Imbimbo M, Sacco E (2011b) Bond behavior of historical clay bricks strengthened with Steel Reinforced
Polymers (SRP). Materials, 4(3): 585-600
Hamid AA, El-Dakhakhni WW, Hakam ZHR, Elgaaly M (2005) Behavior of Composite Unreinforced Masonry - Fiber-
Reinforced Polymer wall assemblages under In-Plane loading. ASCE J. of Composites for Construction, 9 (1): 73-
83 Hamoush S, McGinley M, Mlakar P, Scott D, Murray K (2001) Out-of-plane strengthening of masonry walls with
Reinforced Composites. ASCE J. of Composites for Construction, 5 (3): 139-145 https://rilem223dwh.isqweb.it/ (access June 1
st 2011).
Kuzik MD, Elwi AE, Roger Cheng JJ (2003) Cyclic flexure tests of masonry walls reinforced with Glass Fiber Reinforced Polymer sheets. ASCE J. of Composites for Construction, 7 (1): 20-30
Lee YJ, Boothby TE, Bakis CE, Nanni A (1999) Slip modulus of FRP sheets bonded to concrete. ASCE J. of
Composites for Construction, 3(4): 161-167 Lourenço P, Poças Martins JP (2001) Strengthening of the architectural heritage with composite materials. In:
Composites in Construction - CCC2001, Proc. of the 1st Int. Conf., Porto, Portugal
Luciano R, Marfia S, Sacco E (2002) Reinforcement of masonry arches by FRP materials: experimental tests and numerical investigations. In: Proceedings of ICCI’02 International Conference on FRP Composite in Infrastructures, San Francisco, USA
Luciano R, Sacco E (1998) Damage of masonry panels reinforced by FRP sheets. International J. of Solids and Structures, 35 (15): 1723-1741
42
Mazzotti C, Savoia M, Ferracuti B (2009) A new single-shear set-up for stable debonding of FRP–concrete joints.
Construction and Building Materials 23 (2009) 1529–1537 Micelli F, De Lorenzis L, La Tegola A (2004) FRP-confined masonry columns under axial loads: experimental results
and analytical model. Masonry International, 17 (3): 95-108 Mosallam AS (2007) Out-of-plane flexural behavior of unreinforced red brick walls strengthened with FRP composites.
Composites: Part B, 38: 559-574 Nakaba K, Kanakubo T, Furuta T, Yoshizawa H (2001) Bond behavior between Fiber-Reinforced Polymer laminates
and concrete. ACI Structural J., 98 (3): 359-367 Nurchi A, Valdes M (2005) Strengthening of stone masonry columns by means of cement-based composite wrapping.
In: Composites in Construction - CCC2005, Proc. of the 3rd
Int. Conf., Lyon, France Oliveira DV, Basilio I, Lourenço PB (2010) Experimental behavior of FRP strengthened masonry arches. ASCE J. of
Composites for Construction, 14(3), pp. 312-322 Oliveira DV, Basilio I, Lourenço PB 2011. Experimental bond behavior of FRP sheets glued on brick masonry, ASCE
J. of Composites for Construction, 15(1), pp. 32-41 Panizza M, Garbin E, Valluzzi MR, Modena C (2010) Experimental investigation on local aspects of the FRP
strengthening of masonry arches, In: 8th
Monubasin Symposium ‘Monuments in the Mediterranean Basin’, Patras, Greece, May 31 to June 2, 2010
Papanicolaou CG, Triantafillou TC, Lekka M (2011) Externally bonded grids as strengthening and seismic retrofitting materials of masonry panels. Construction and Building Materials 25: 504-514
Papanicolaou CG, Triantafillou TC, Karlos K, Papathanasiou M (2007) Textile-reinforced mortar (TRM) versus FRP as strengthening material of URM walls: in-plane cyclic loading. RILEM Materials and Structures, 40(10): 1081-1097
Papanicolaou CG, Triantafillou TC, Papathanasiou M, Karlos K (2008) Textile-reinforced mortar (TRM) versus FRP as strengthening material of URM walls: out-of-plane cyclic loading. RILEM Materials and Structures, 41(1):143-157
Poggi C, Fava G (2007) COKIT: un sistema per la caratterizzazione dei materiali compositi per le costruzioni. In: Il
controllo di accettazione di materiali fibrorinforzati per il rinforzo strutturale. I quaderni tecnici di Assocompositi,
vol I, Tecnedit Ed. (in Italian)
Prota A, Marcari G, Fabbrocino G, Manfredi G, Aldea C (2006) Experimental In-Plane behavior of tuff masonry
strengthened with cementitious matrix-grid composites. ASCE J. of Composites for Construction, 10 (3): 223-233 Schwegler G (1994) Masonry construction strengthened with fiber composites in seismically endangered zones. In:
Earthquake Engineering, Proc. of the 10th Europ. Conf., Rotterdam, The Netherlands, 454-458 Shrive NG (2006) The use of fibre reinforced polymers to improve seismic resistance of masonry. Construction and
Building Materials, 20 (4): 269-277 Täljsten B (1997) Defining anchor lengths of steel and CFRP plates bonded to concrete. Int. J. of Adhesion and
Adhesives, 19: 319-327 Triantafillou TC (1998) Strengthening of masonry structures using epoxy-bonded FRP laminates. ASCE J. of
Composites for Construction, 2(2): 96-104 Triantafillou TC, Fardis MN (1997) Strengthening of historic masonry structures with composite materials. RILEM
Materials and Structures, 30: 486-496 UNI 11128 (2004) Prodotti da costruzione di laterizio - Tavelloni, tavelle e tavelline - Terminologia, requisiti e metodi
di prova (in Italian) UNI 6556 (1976) Prove sui calcestruzzi. Determinazione del modulo elastico secante a compressione (in Italian) UNI 8942-3 (1986) Prodotti di laterizio per murature. Metodi di prova (in Italian) Valluzzi MR (2008) Strengthening of masonry structures with Fibre Reinforced Plastics: from modern conception to
historical building preservation, In: Structural Analysis of Historic Construction – SAHC08, vol. 1, Bath (UK): 33–45
Valluzzi MR, Tinazzi D, Modena C (2002) Shear behavior of masonry panels strengthened by FRP laminates. Construction and Building Materials, Special Issue, 16(7): 409-416
Valluzzi MR, Valdemarca M, Modena C (2001) Behavior of brick masonry vaults strengthened by FRP laminates. ASCE J. of Composites for Construction, August 2001, (5)3: 163-169
Velazquez-Dimas JI, Ehsani MR, Saadatmanesh H (2000) Out-of-Plane behavior of brick masonry walls strengthened with fiber composites. ACI Structural J., 97(3): 377-387
Wambua P, Ivens J, Verpoest I (2003) Natural fibres: can they replace glass in fibre reinforced plastics? Composites Science and Technology, 63: 1259–1264
Yao J, Teng JG, Chen JF (2004) Experimental study on FRP-to-concrete bonded joints. Composites: Part B, 36: 99-113 Zampaloni M, Pourboghrat F, Yankovich SA, Rodgers BN, Moore J, Drzal LT, Mohanty AK, Misra M (2007) Kenaf
natural fiber reinforced polypropylene composites: A discussion on manufacturing problems and solutions. Composites Part A, 38:1569–1580