Embed Size (px)
Citation preview
Rous River Flood Study
ROUS RIVER WAY
Planning Proposal / Rezoning
NEWLAND DEVELOPERS PTY LTD
FEBRUARY 2012
REVISION 07
This document has been prepared for the sole benefit, use and information of Yeats Consulting
Pty Ltd. The liability of Yeats Consulting Pty Ltd and its employees in respect of the information
contained in the report shall not extend to any third party.
This document has been reviewed and approved by the following appropriately qualified and
experienced Registered Professional Engineer of Queensland (RPEQ)
Brett Taylor (RPEQ No. 7817)
Yeats Consulting Pty Ltd
Level 1, 193 Ferry Road
Southport Qld 4215
PH: 07 5571 2232
FAX: 07 5503 1672
www.yeats.com.au

Document history and status
Revision Date issued Reviewed by
Approved by Date approved
Revision type
01 27/05/2011 CS BT 27/05/2011 Draft
02 10/06/2011 CS BT 10/06/2011 General Amendments
03 17/06/2011 CS BT 17/06/2011 Final Draft
04 20/07/2011 CS BT 20/06/2011 Final
05 24/11/2011 CS BT 24/11/2011 Council RFI
06 16/12/2011 CS BT 16/12/2011 General Amendments
07 16/12/2011 CS BT 16/12/2011 Updated Flood Scenarios
Distribution of copies
Revision Copy no Quantity Issued to
01 1 1.pdf Newland Developers Pty Ltd
02 1 1.pdf Newland Developers Pty Ltd
03 1 1.pdf Newland Developers Pty Ltd
04 1 1.pdf Newland Developers Pty Ltd
05 1 1.pdf Newland Developers Pty Ltd
06 1 1.pdf Newland Developers Pty Ltd
07 1 1.pdf Newland Developers Pty Ltd
Printed: 5 March 2012
Last saved: 02/03/2012 15:43
File name: G:\YC0291 Riva Vue Estate\07 Reports\03 Flood Study\YC0291 Flood Study R007.docx
Author: Tom Watt
Project manager: Garth Osmond
Name of organisation: Yeats Consulting Pty Ltd
Name of project: YC0291 Rous River Flood Study
Name of document: YC0291 Flood Study R007.docx
Document version: REV 07
Project number: YC0291

Executive Summary
In Response to the terms of a Memorandum Of Understanding between Tweed Shire Council and
Barnby Developments Pty Ltd a Flood Study of the Riva Vue development has been prepared by
Yeats Consulting Pty Ltd. This study was carried out using the 2D hydraulic modelling program
TUFLOW to simulate the flood behaviour of the Rous River adjacent to the subject site for a range
of design storm events and filling scenarios.
In accordance with the NSW Floodplain Development Manual, the proposed filling of the subject
land has been considered on both an individual and cumulative basis. This was achieved by
modelling the following scenarios:
• Scenario 1: Existing conditions as modelled in the Tweed Valley Flood Study 2009 Update,
provided by Tweed Shire Council;
• Scenario 2A: Earthworks associated with the development of Riva Vue Stages 1-3;
• Scenario 2B: Earthworks, including filling approximately 2.4ha, associated with the
development of Riva Vue Stages 1-4;
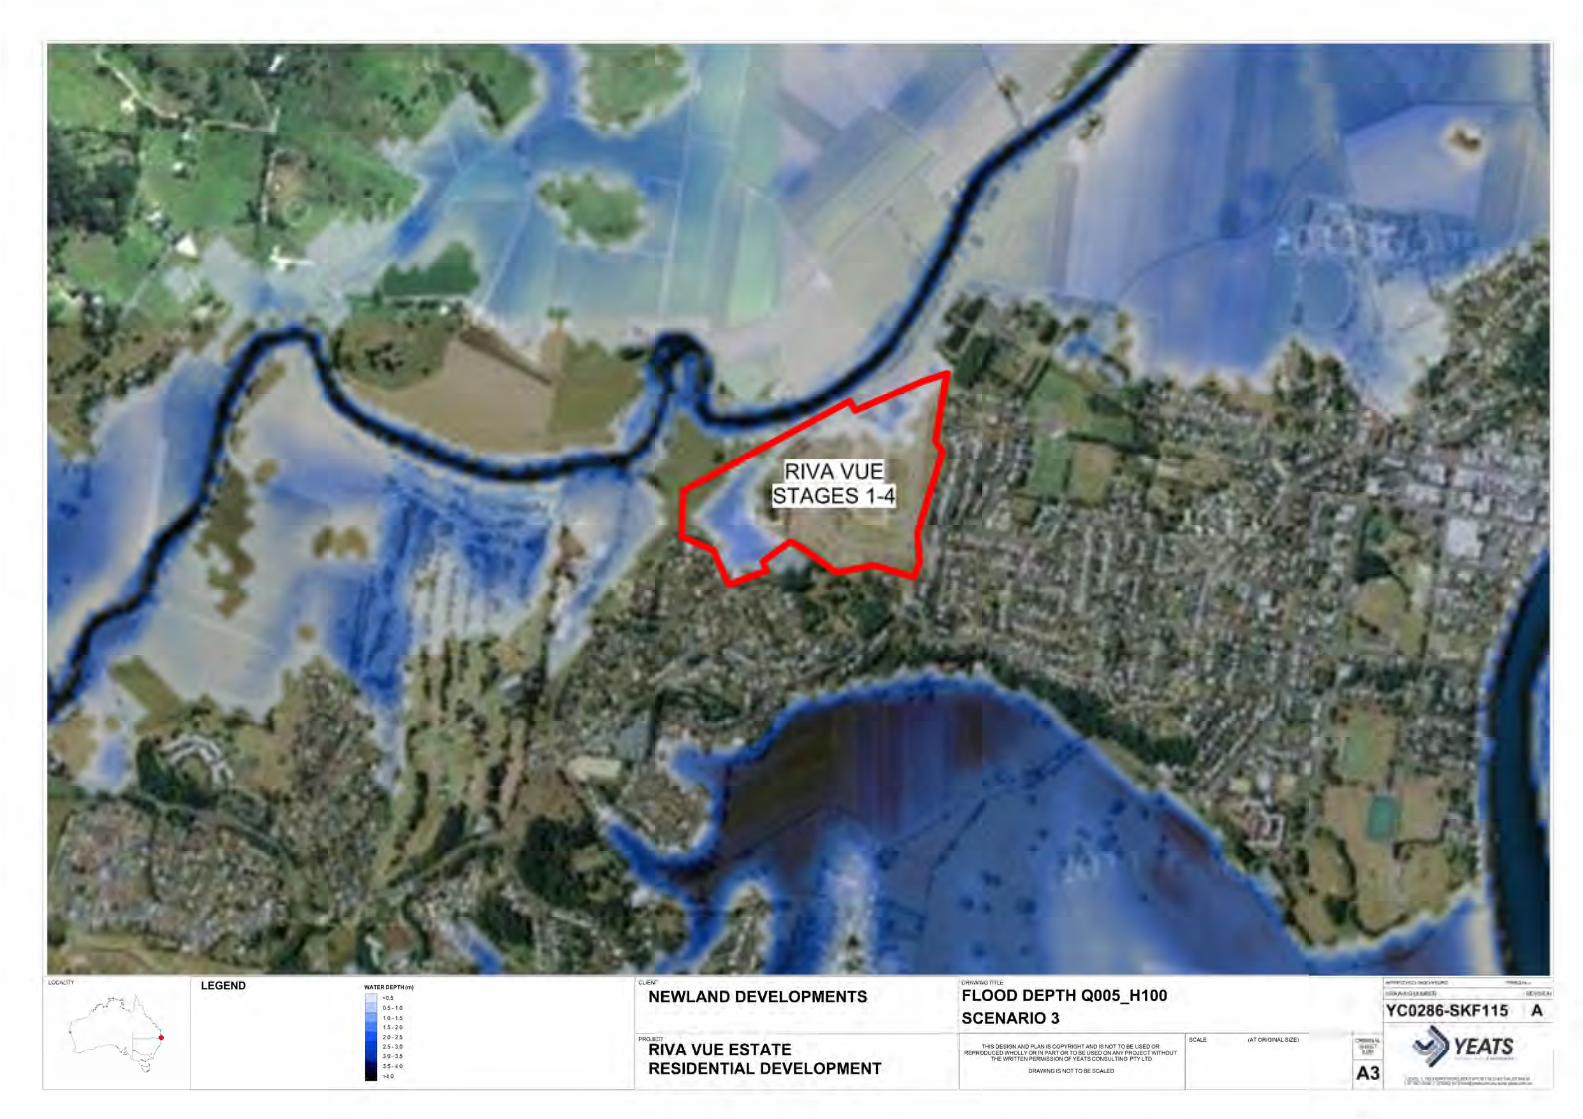
• Scenario 3: Earthworks associated with the extension of Rous River Way to the intersection of
Cane/Queensland Road utilising details supplied by Tweed Shire Council. This scenario also
incorporates filling approximately 3.3ha of the currently Agricultural Protection zoned, Lot 22
on DP1080322, above the Q100 flood level. This was done to simulate future residential
development over Lot 22 even though it is not included in the existing urban footprint or
future urban release area under the Far North Coast Regional Strategy 2006-2031; and
• Scenario 4: A cumulative scenario incorporating scenario 2A, 2B and 3 detailed above.
An analysis of the impacts of these scenarios on the flood levels, velocities and duration on the
areas surrounding the subject site, compared to the pre-developed scenario, was then
undertaken. The results of this analysis are then utilised to produce maps depicting the Flood
Depth and Water Level Increase for each of the Storm Events and Impact Scenarios.
The modelling demonstrates that stages 1-3 have minimal impacts on the flood levels
surrounding the site, and negligible affects approximately 1km upstream and downstream of the
site. It also demonstrates that while the proposed stage 4 will cause flood levels to increase in the
areas surrounding the site, the increase will be less than 15mm and occurs over rural land to the
north and the golf course and rural land to the west of the Riva Vue Estate. These increases are
therefore less than the acceptable limit of 15mm over urban land and 50mm over rural land as
set down by Tweed Shire Council officers at a meeting on the 26th of September 2005.
The main contributing scenario for impacts to the flood levels is the connection of Rous River Way
to Queensland / Cane Road and filling of Lot 22 above the Q100 flood level. This is demonstrated
in Impact Scenario B, with results showing an increase in flood depths of more than 50mm over
the land adjacent to Lot 22. The alignment of the Rous River adjacent to Lot 22 exposes much of
that lot to inundation, as in effect it forms part of a floodway. When viewing flood maps from the
scenarios that do not include filling within Lot 22, it is clear that the entire lot is inundated by
flood water for all storm events. Therefore filling within Lot 22 will result in significant increases in
flood levels over the surrounding land.

In summary, this report concludes that, for all scenarios, excepting connection of Rous River Way
and filling of Lot 22, rezoning and subsequent filling of Stage 4 of Riva Vue Estate as proposed
will not have significant adverse impacts and would not be inconsistent with Council's adopted
acceptable limits for flood level increases.
Contents
1 Introduction ................................................................................... 6
1.1 Background .............................................................................................................. 6
1.2 Site Description ........................................................................................................ 6
1.2.1 Location ........................................................................................................ 6
1.2.2 Topography ................................................................................................... 6
1.3 Objectives ................................................................................................................ 8
1.4 Scope ...................................................................................................................... 8
2 Methodology ................................................................................... 9
3 Results ......................................................................................... 10
3.1 Changes to Flood Behaviour ..................................................................................... 10
3.2 Design Events ......................................................................................................... 10
3.3 Impact Scenario A1 ................................................................................................. 11
3.3.1 Changes to Flood Depths - Impact Scenario A1 ................................................ 11
3.3.2 Changes to Flood Velocity - Impact Scenario A1 ............................................... 11
3.4 Impact Scenario A2 ................................................................................................. 12
3.4.1 Changes to Flood Depths - Impact Scenario A2 ................................................ 12
3.4.2 Changes to Flood Velocity - Impact Scenario A2 ............................................... 12
3.5 Impact Scenario B ................................................................................................... 13
3.5.1 Changes to Flood Depths - Impact Scenario B.................................................. 13
3.5.2 Changes to Flood Velocity - Impact Scenario B ................................................ 13
3.6 Impact Scenario C ................................................................................................... 14
3.6.1 Changes to Flood Depths - Impact Scenario C ................................................. 14
3.6.2 Changes to Flood Velocity - Impact Scenario C ................................................ 14
3.7 Impact Scenario D ................................................................................................... 15
3.7.1 Changes to Flood Depths - Impact Scenario D ................................................. 15
3.7.2 Changes to Flood Velocity - Impact Scenario D ................................................ 15
3.8 Changes to Flood Duration - All Development Scenarios ............................................... 16
4 Trunk Drainage Infrastructure Analysis ........................................ 17
5 Summary and Conclusions ............................................................ 18
6 References.................................................................................... 19
Appendices
A Study Area Locality Plan
B Flood Point Locations
C Flood Extents Mapping
D Flood Event Graphs
List of Tables
Table 3.1 Design Events .................................................................................. 11
Table 3.2 Change in Flood Depth - Impact Scenario A1........................................ 11
Table 3.3 Change in Flood Velocity - Impact Scenario A1 ..................................... 12
Table 3.4 Change in Flood Depth - Impact Scenario A2........................................ 12
Table 3.5 Change in Flood Velocity - Impact Scenario A2 ..................................... 13
Table 3.6 Change in Flood Depth - Impact Scenario B ......................................... 13
Table 3.7 Change in Flood Velocity - Impact Scenario B ....................................... 13
Table 3.8 Change in Flood Depth - Impact Scenario C ......................................... 14
Table 3.9 Change in Flood Velocity - Impact Scenario C ....................................... 14
Table 3.10 Change in Flood Depth - Impact Scenario D ......................................... 15
Table 3.11 Change in Flood Velocity - Impact Scenario D ...................................... 15
List of Figures
Figure 1.1 Site Location (Source: Google Maps) ..................................................... 7
Figure 1.2 Site Aerial Photo (Source: Google Earth) ............................................... 7
Rous River – Flood Study Page 6 Ref: YC0291 Flood Study R007.docx
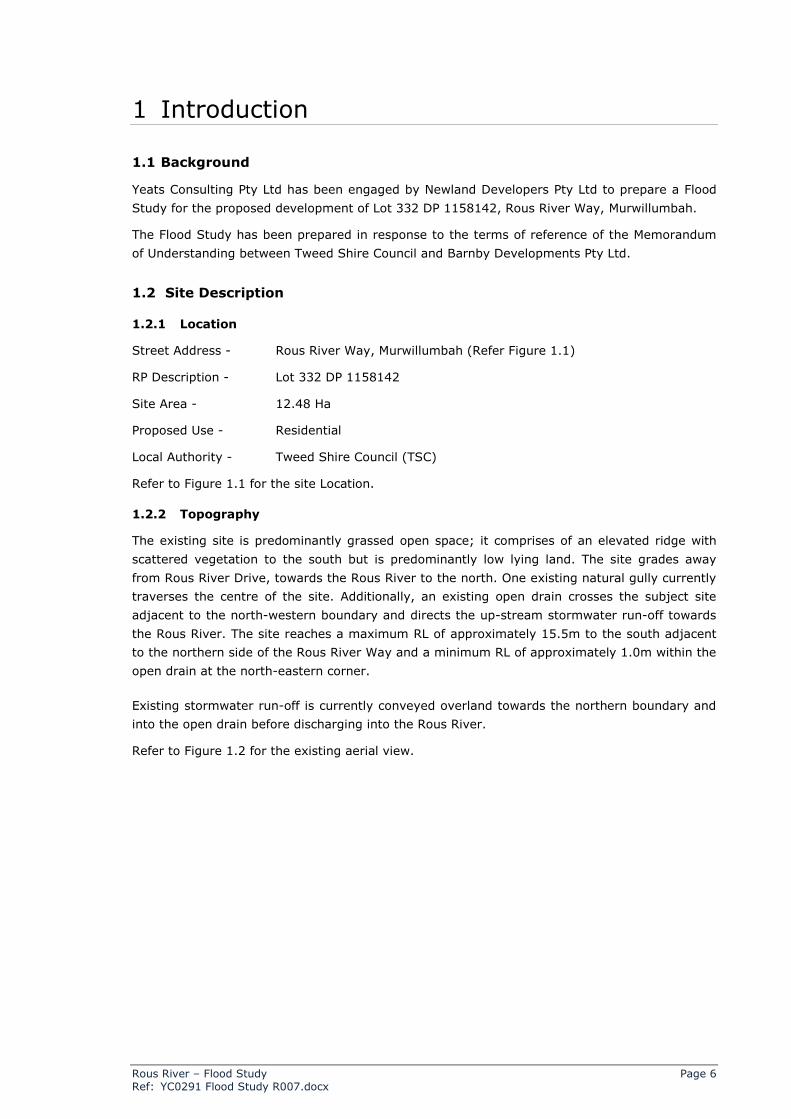
1 Introduction
1.1 Background
Yeats Consulting Pty Ltd has been engaged by Newland Developers Pty Ltd to prepare a Flood
Study for the proposed development of Lot 332 DP 1158142, Rous River Way, Murwillumbah.
The Flood Study has been prepared in response to the terms of reference of the Memorandum
of Understanding between Tweed Shire Council and Barnby Developments Pty Ltd.
1.2 Site Description
1.2.1 Location
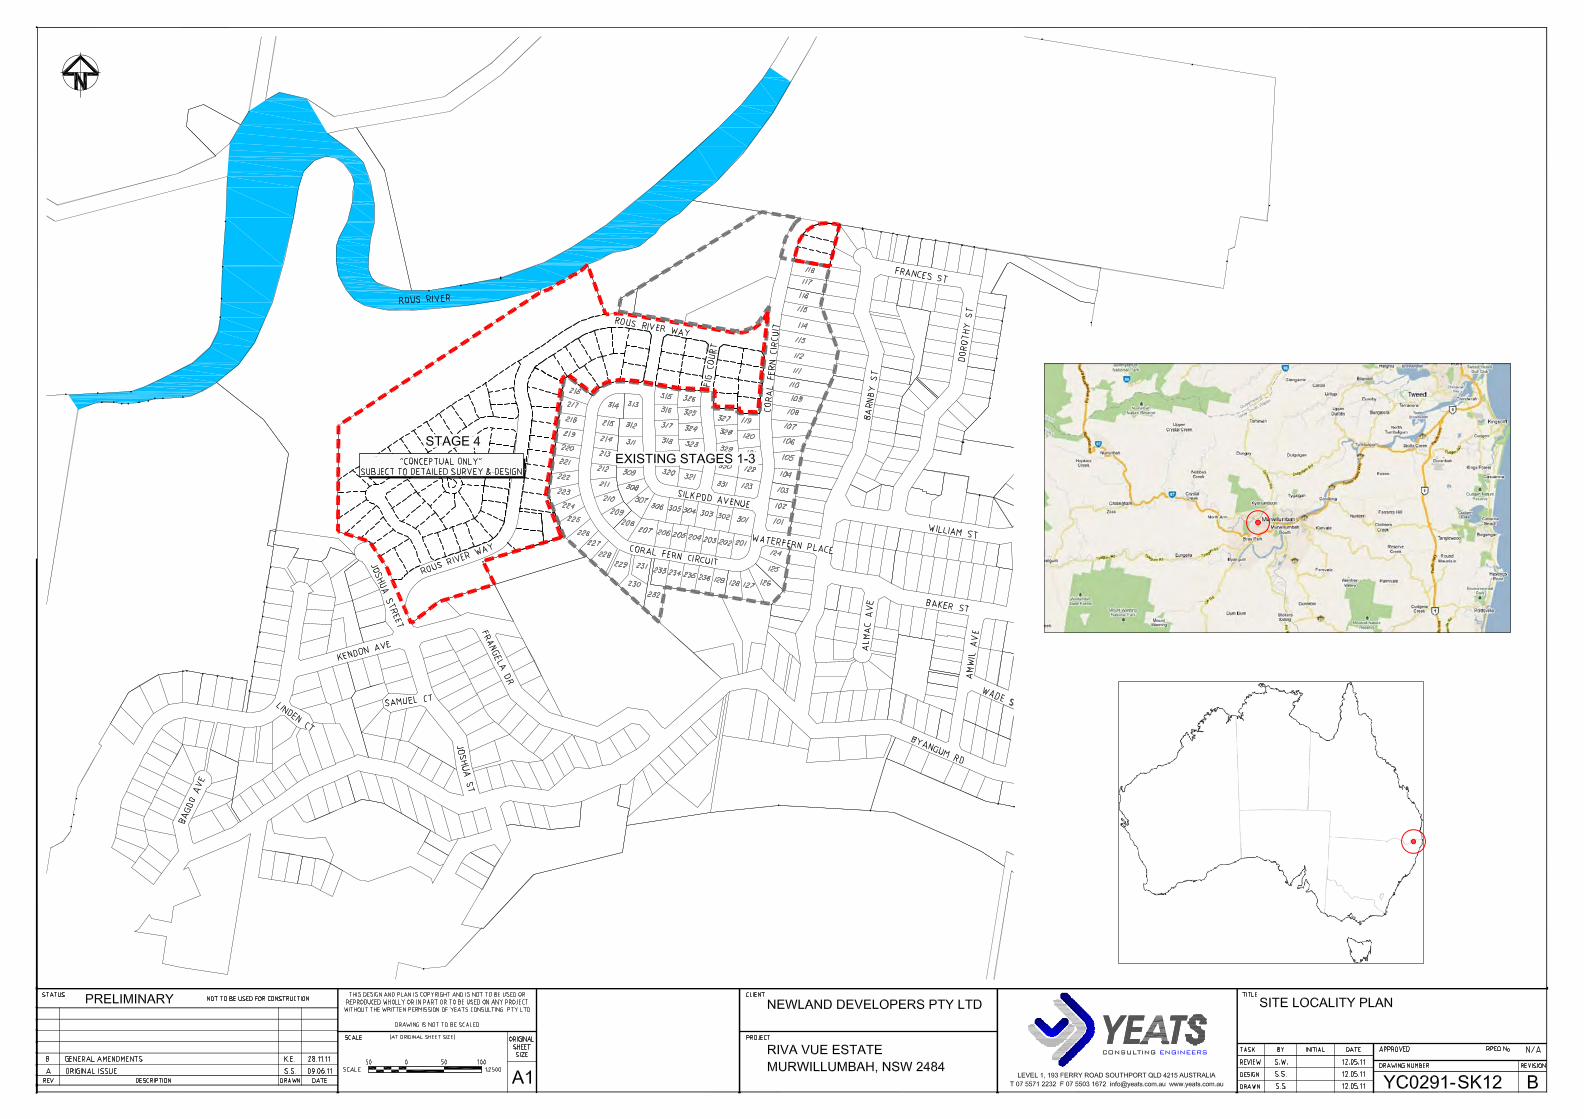
Street Address - Rous River Way, Murwillumbah (Refer Figure 1.1)
RP Description - Lot 332 DP 1158142
Site Area - 12.48 Ha
Proposed Use - Residential
Local Authority - Tweed Shire Council (TSC)
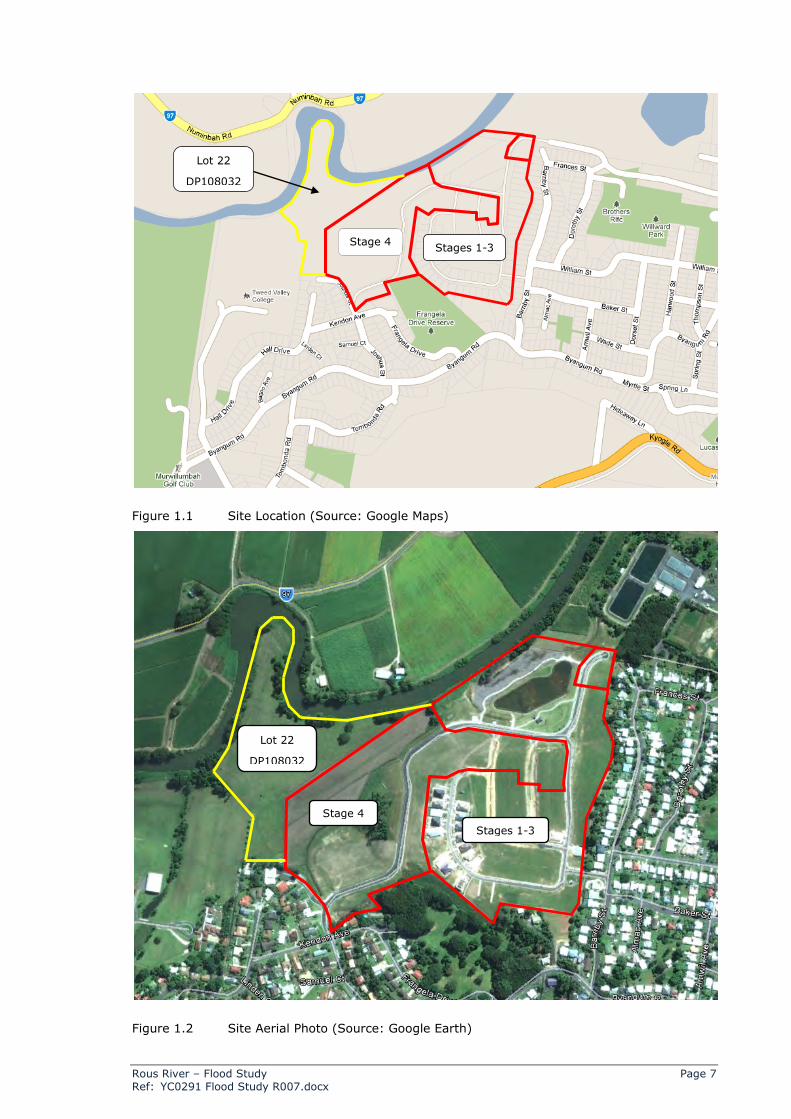
Refer to Figure 1.1 for the site Location.
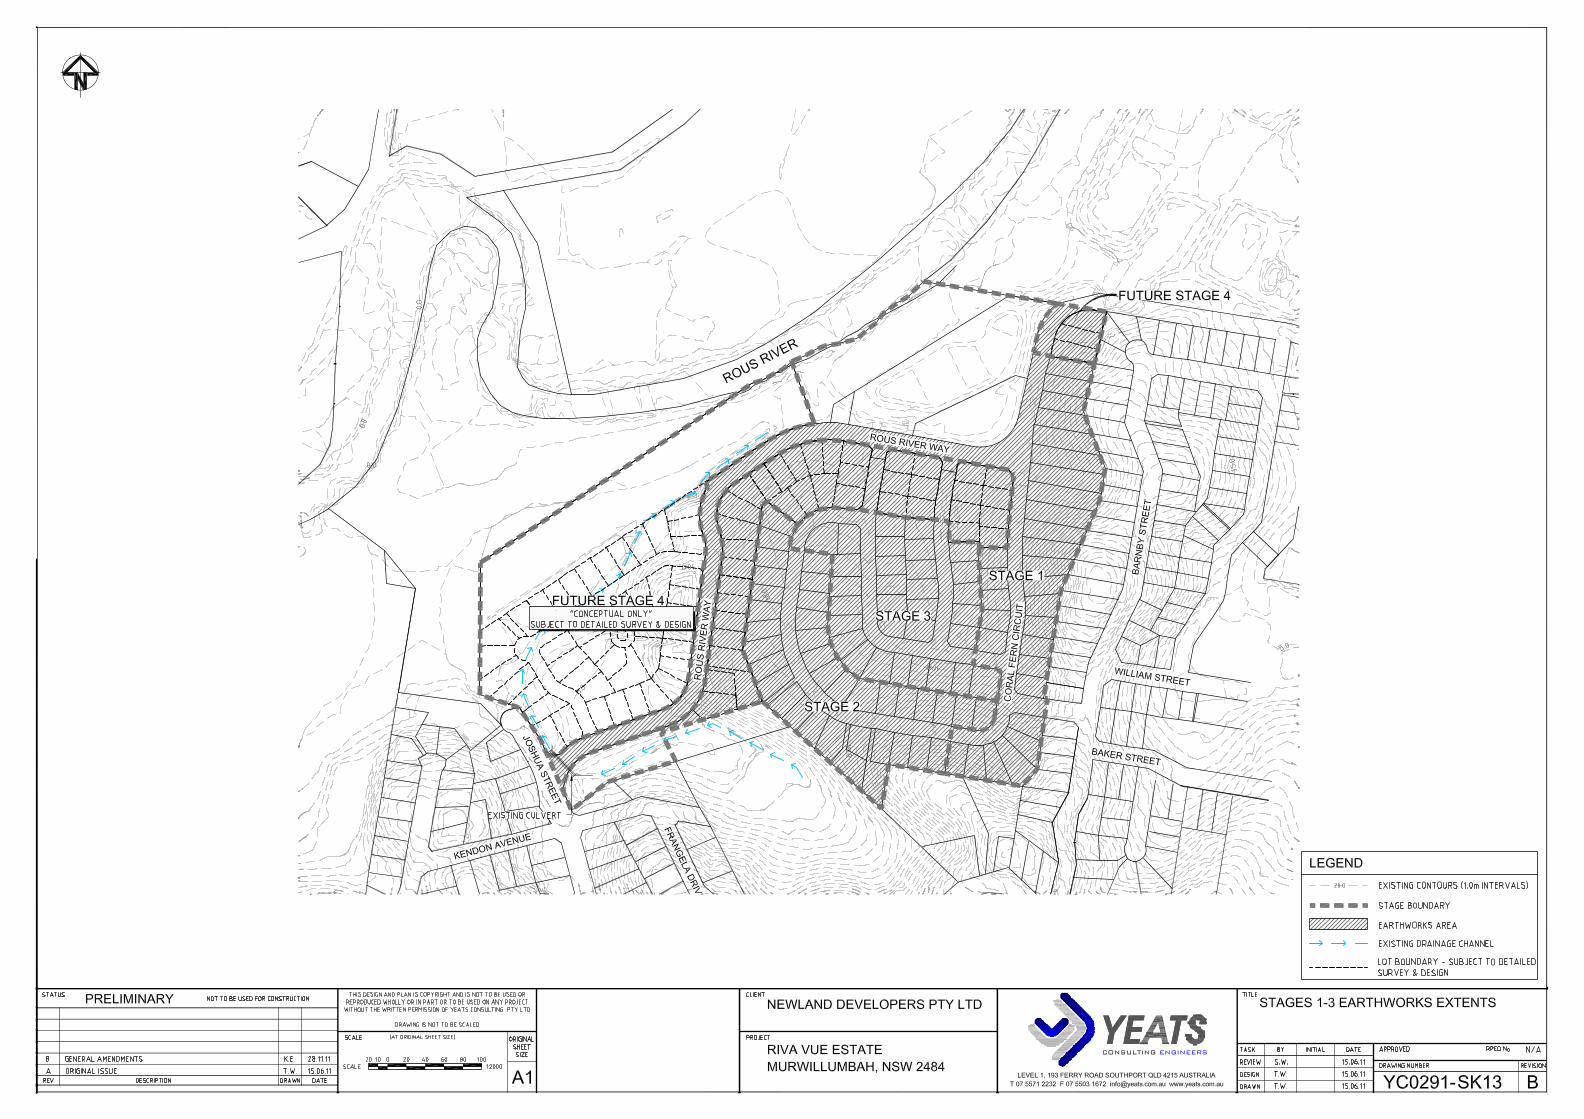
1.2.2 Topography
The existing site is predominantly grassed open space; it comprises of an elevated ridge with
scattered vegetation to the south but is predominantly low lying land. The site grades away
from Rous River Drive, towards the Rous River to the north. One existing natural gully currently
traverses the centre of the site. Additionally, an existing open drain crosses the subject site
adjacent to the north-western boundary and directs the up-stream stormwater run-off towards
the Rous River. The site reaches a maximum RL of approximately 15.5m to the south adjacent
to the northern side of the Rous River Way and a minimum RL of approximately 1.0m within the
open drain at the north-eastern corner.
Existing stormwater run-off is currently conveyed overland towards the northern boundary and
into the open drain before discharging into the Rous River.
Refer to Figure 1.2 for the existing aerial view.
Rous River – Flood Study Page 7 Ref: YC0291 Flood Study R007.docx
Figure 1.1 Site Location (Source: Google Maps)
Figure 1.2 Site Aerial Photo (Source: Google Earth)
Stage 4
Lot 22
DP108032
Stage 4
Stages 1-3
Stages 1-3
Lot 22
DP108032
Rous River – Flood Study Page 8 Ref: YC0291 Flood Study R007.docx
1.3 Objectives
The objectives, as defined by the terms of reference of the MOU, are:
• Assessment of the potential impacts of the proposed filling of the subject land on local flood
behaviour for a range of flood intensities; and
• Assessment of flood mitigation works necessary to address impacts of the development on
local flood behaviour.
1.4 Scope
The general approach and methodology to achieve the above objectives are again defined in the
MOU, and are summarised below:
• Investigate the 5 year, 20 year, and 100 year ARI regional flood events;
• Investigate the 5 year ARI event coupled with a 100 year storm surge event including
climate change parameter of 0.9m sea level increase;
• Investigate the 100 year ARI event with additional climate change parameter of 10%
increased rainfall intensity;
• Report on changes to peak flood level, flood velocity and duration of inundation due to the
development;
• Report on impacts on major trunk drainage in the local catchment;
• Include not only the proposed filling due to stage 4, but also the filling carried out as part of
stages 1-3 of Riva Vue;
• The potential future filling of the adjoining rural allotment, Lot 22 on DP108032, in
accordance with the NSW Floodplain Development Manual; and
• Filling due to the future road connection between Rous River Way and Cane/Queensland
Roads.
Rous River – Flood Study Page 9 Ref: YC0291 Flood Study R007.docx
2 Methodology
Council’s Tweed Valley TUFLOW Flood model has been obtained and used as the basis for the
flood study. The hydrology associated with the model will not be updated, with only the
hydraulic components amended to reflect the associated development. As the development has
been staged, with stages 1-3 already developed, four separate scenarios have been modelled to
show the effects of stages 1-3, stages 1-4, the extension of Rous River Way combined with the
filling of Lot 22 on DP1080322 and a cumulative scenario. The steps taken to produce the final
model are detailed below:
• Review the development location and nominate the areas where earthworks are to take
place;
• Using the 40m grid, create two z point GIS layers, one for stages 1-3 and one for stages 1-
4, using the associated post-development DEM’s;
• Obtain the Rous River Way extension design from Council and create a GIS layer
representing the proposed road construction and future filling to Lot 22 on DP1080322
above the Q100 flood level;
• Update the TUFLOW geometry (.tgc) and control (.tcf) files using the new GIS layers
created above;
• Create runs for the various ARI’s for each of the two development scenarios nominated
above (stages 1-3, and stages 1-4);
• Create runs for the various ARI’s for the proposed road construction of Rous River Road and
Cane / Queensland Road connection scenario and future filling of Lot 22 as nominated
above; and
• Review and present the results.

Rous River – Flood Study Page 10 Ref: YC0291 Flood Study R007.docx
3 Results
3.1 Changes to Flood Behaviour
Changes to the existing flood behaviour of the Rous River, in the vicinity of the Riva Vue
Development, has occurred due to filling within existing flood prone areas. As mentioned in
section 2, the various scenarios modelled as part of this report include:
• Existing conditions in the 'Tweed Valley Flood Model' provided by T.S.C, to be known as
'Scenario 1';
• Earthworks associated with the development of (existing) Riva Vue Stages 1-3, to be known
as 'Scenario 2A';
• Earthworks, including filling approximately 2.4ha, associated with the proposed
development of Riva Vue Stage 1-4, to be known as 'Scenario 2B';
• Earthworks associated with the future extension of Rous River Way and urban development
of Lot 22 on DP1080322, to be known as 'Scenario 3'; and
• Earthworks associated with the development of Riva Vue Stage 1-4, Rous River Way
extension and urban development of Lot 22, to be known as 'Scenario 4'.
Results and discussions on the changes to the flood behaviour for the various scenarios outlined
above are presented in the following sections. These results have been presented as the
following 'Impact Scenarios':
• Impact of Scenario 2A compared to Scenario 1, to be known as 'Impact Scenario A1';
• Impact of Scenario 2B compared to Scenario 1, to be known as 'Impact Scenario A2';
• Impact of Scenario 3 compared to Scenario 1, to be known as 'Impact Scenario B';
• Impact of Scenario 4 compared to Scenario 1, to be known as 'Impact Scenario C'; and
• Impact of Scenario 4 compared to Scenario 3, to be known as 'Impact Scenario D'.
Note: Scenario 4 and Impact Scenario's C and D have been modelled and provided on the basis
that they are a requirement of the MOU and the NSW Floodplain Development Manual.
However, Lot 22 which is immediately adjoining and upstream of the subject site, is zoned
1(b2) Agricultural Protection under Tweed Local Environment Plan 2000. Further to this, Lot 22
is not included in the existing urban footprint or as a future urban release area under the Far
North Coast Regional Strategy 2006-2031. Therefore its potential to be rezoned and ultimately
filled to facilitate urban development is negligible.
The tabulated results contained within the following sections have been compiled to the
standard form of presentation of results as depicted with the BMT WBM “Digital outputs of
Tweed Valley Flood Study 2009 Update” memo provided with the TUFLOW model from Tweed
Shire Council.
3.2 Design Events
As per the MOU, following design events modelled to determine the changes to flood behaviour
associated with the various Impact Scenarios are in accordance with the Tweed Valley Flood
Study 2009 Update prepared by BMT WBM. Details of these events are presented in Table 3.1
below.

Rous River – Flood Study Page 11 Ref: YC0291 Flood Study R007.docx
Table 3.1 Design Events
Notation Rainfall Event Storm Surge Event
Q005_H005 5 year ARI 5 year ARI
Q005_H100 5 year ARI 100 year ARI
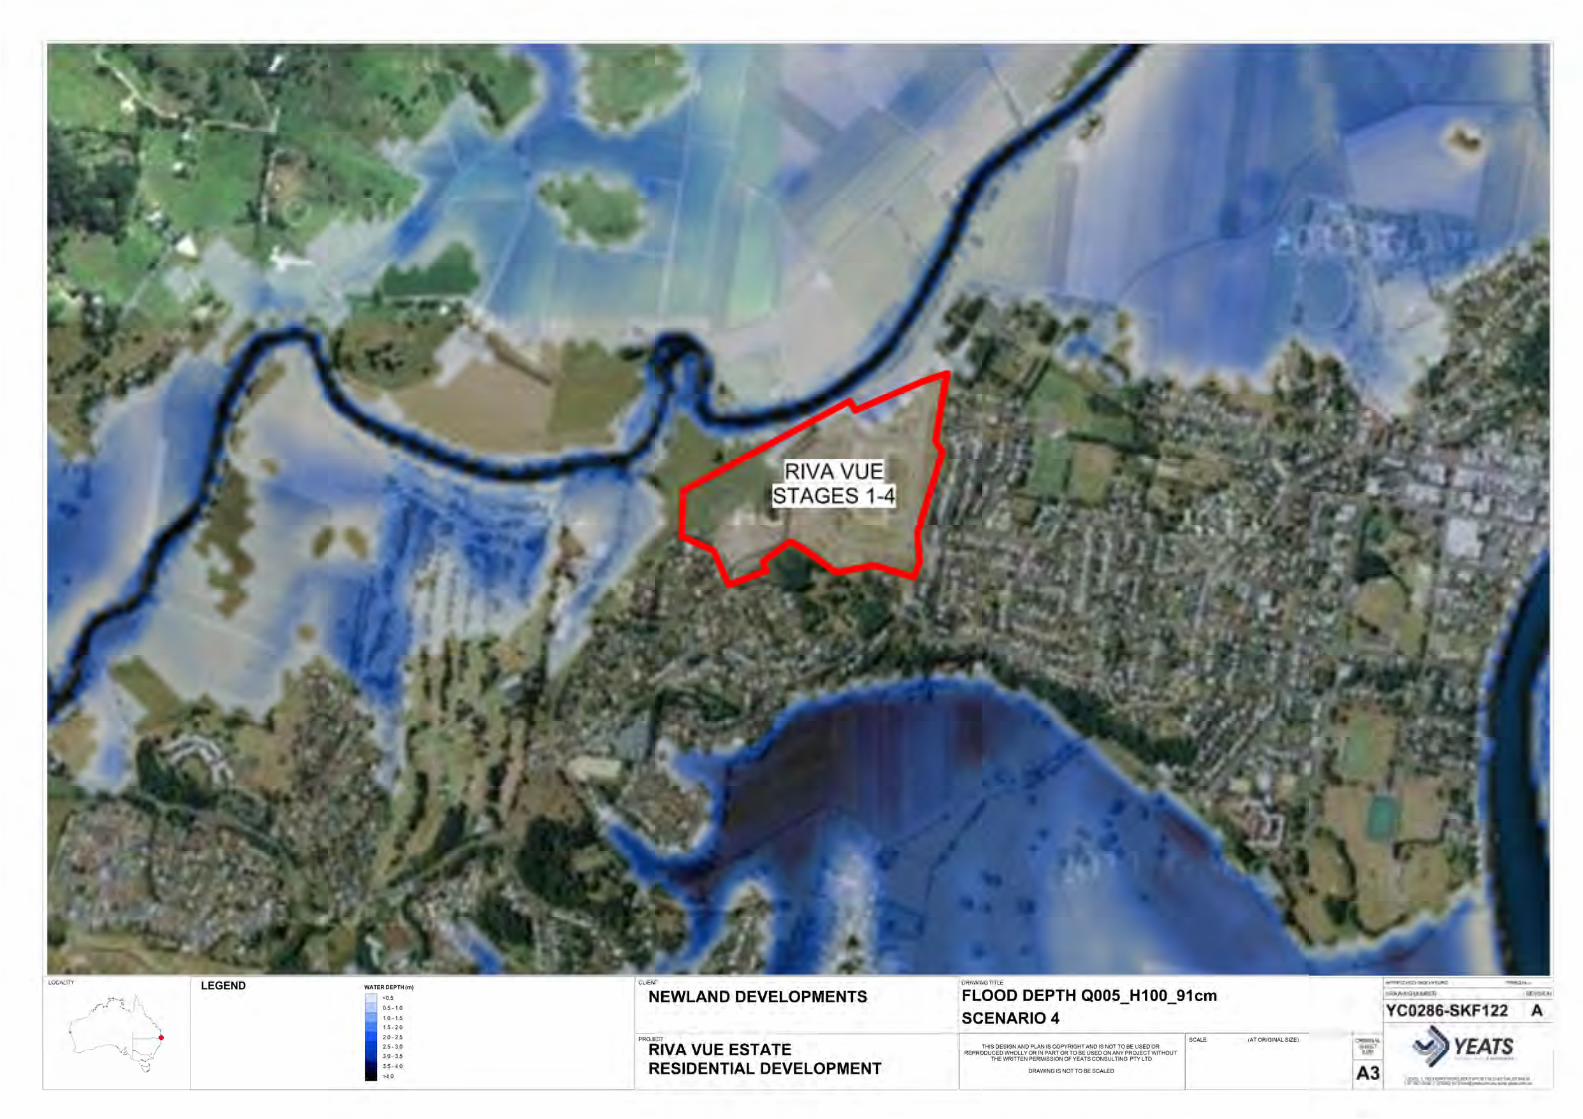
Q005_H100_91cm (Sea level increase) 5 year ARI 100 year ARI + 91cm
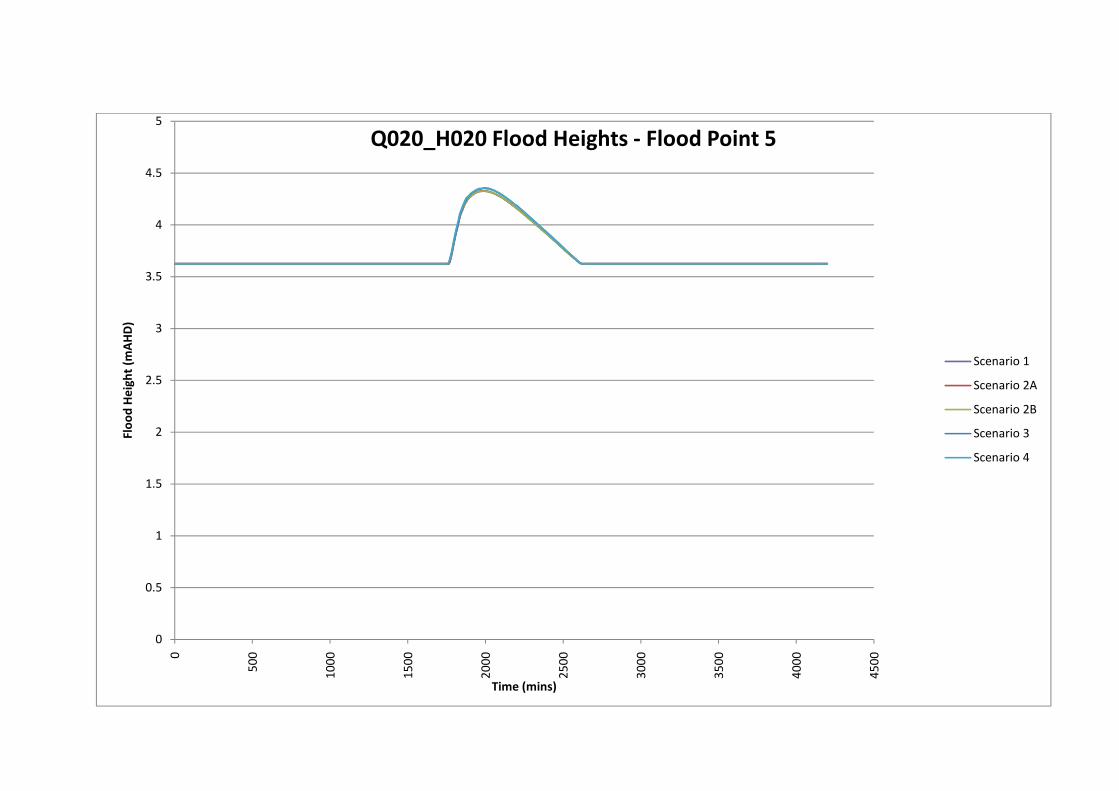
Q020_H020 20 year ARI 20 year ARI
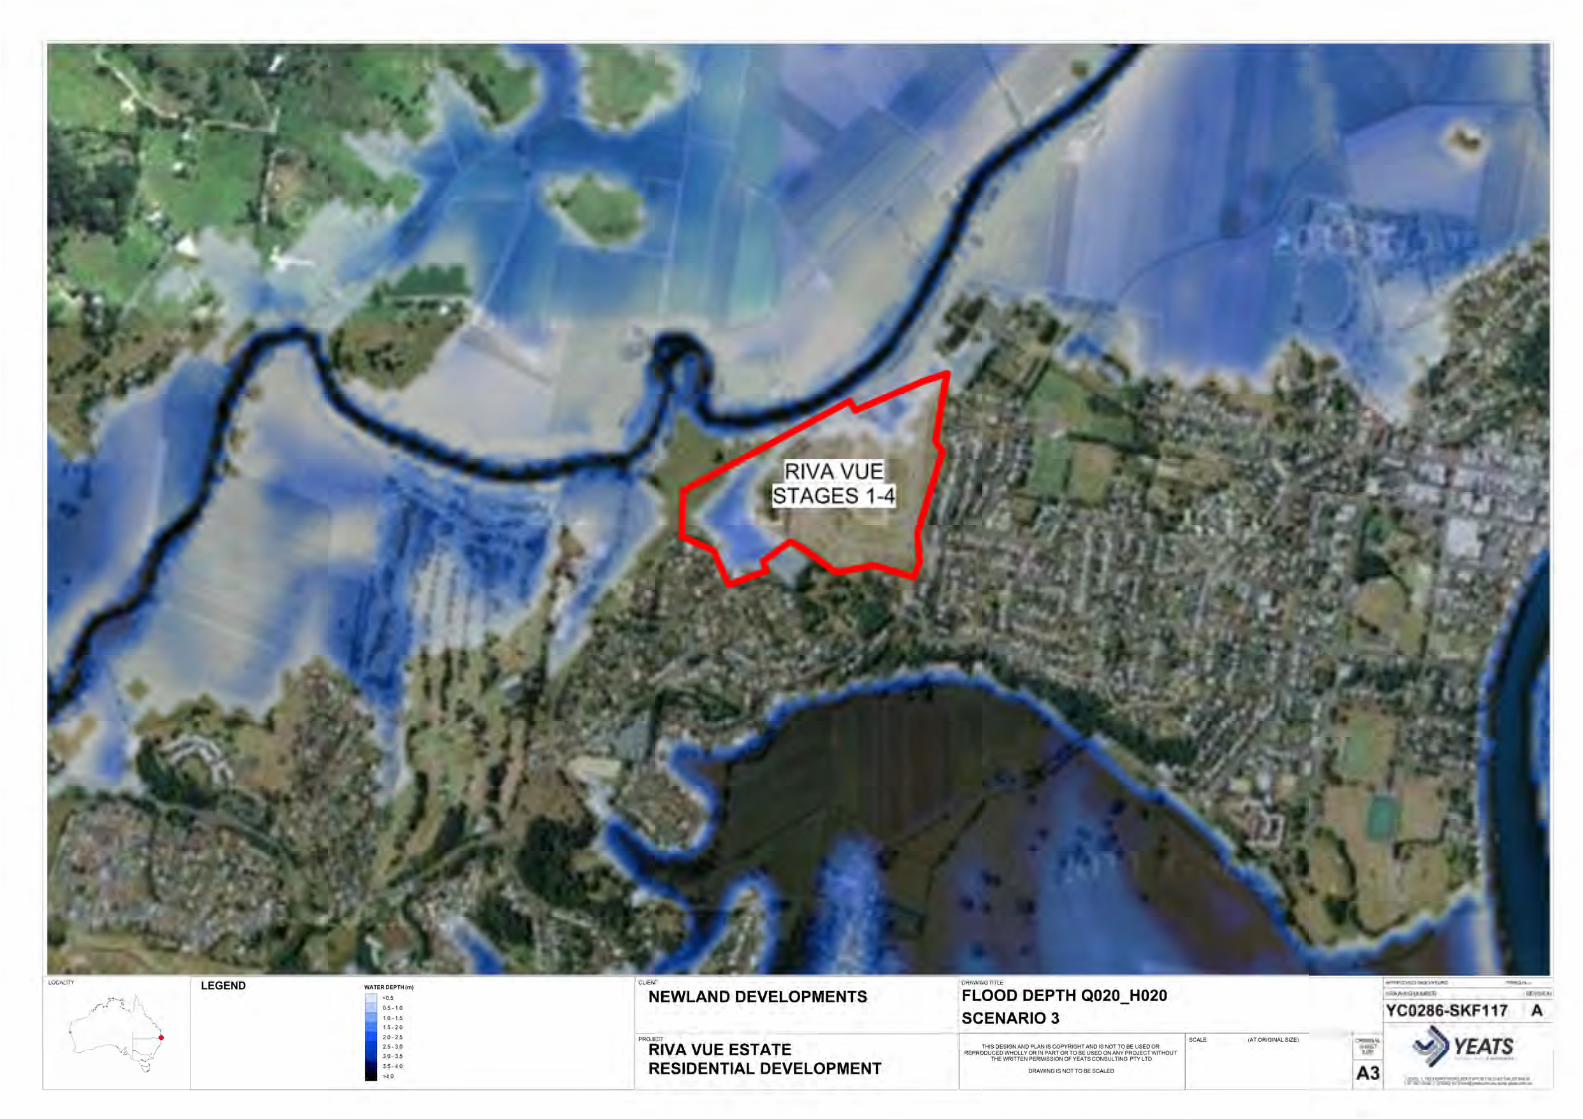
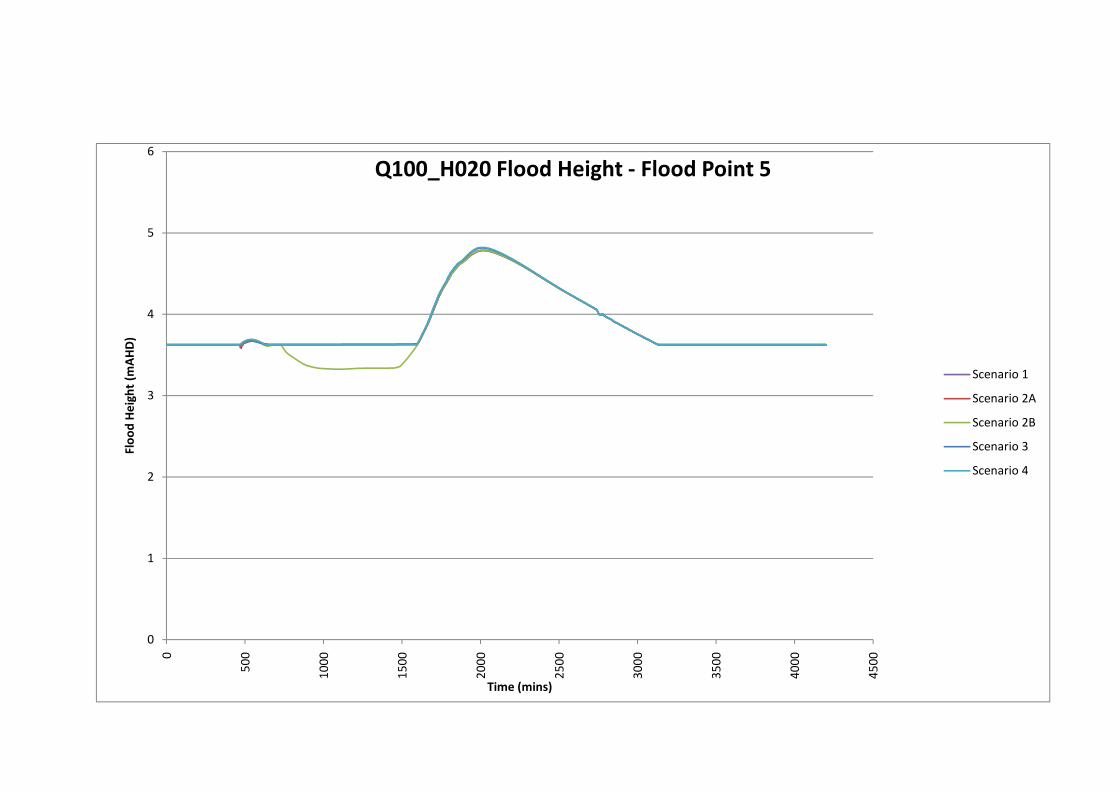
Q100_H020 100 year ARI 20 year ARI
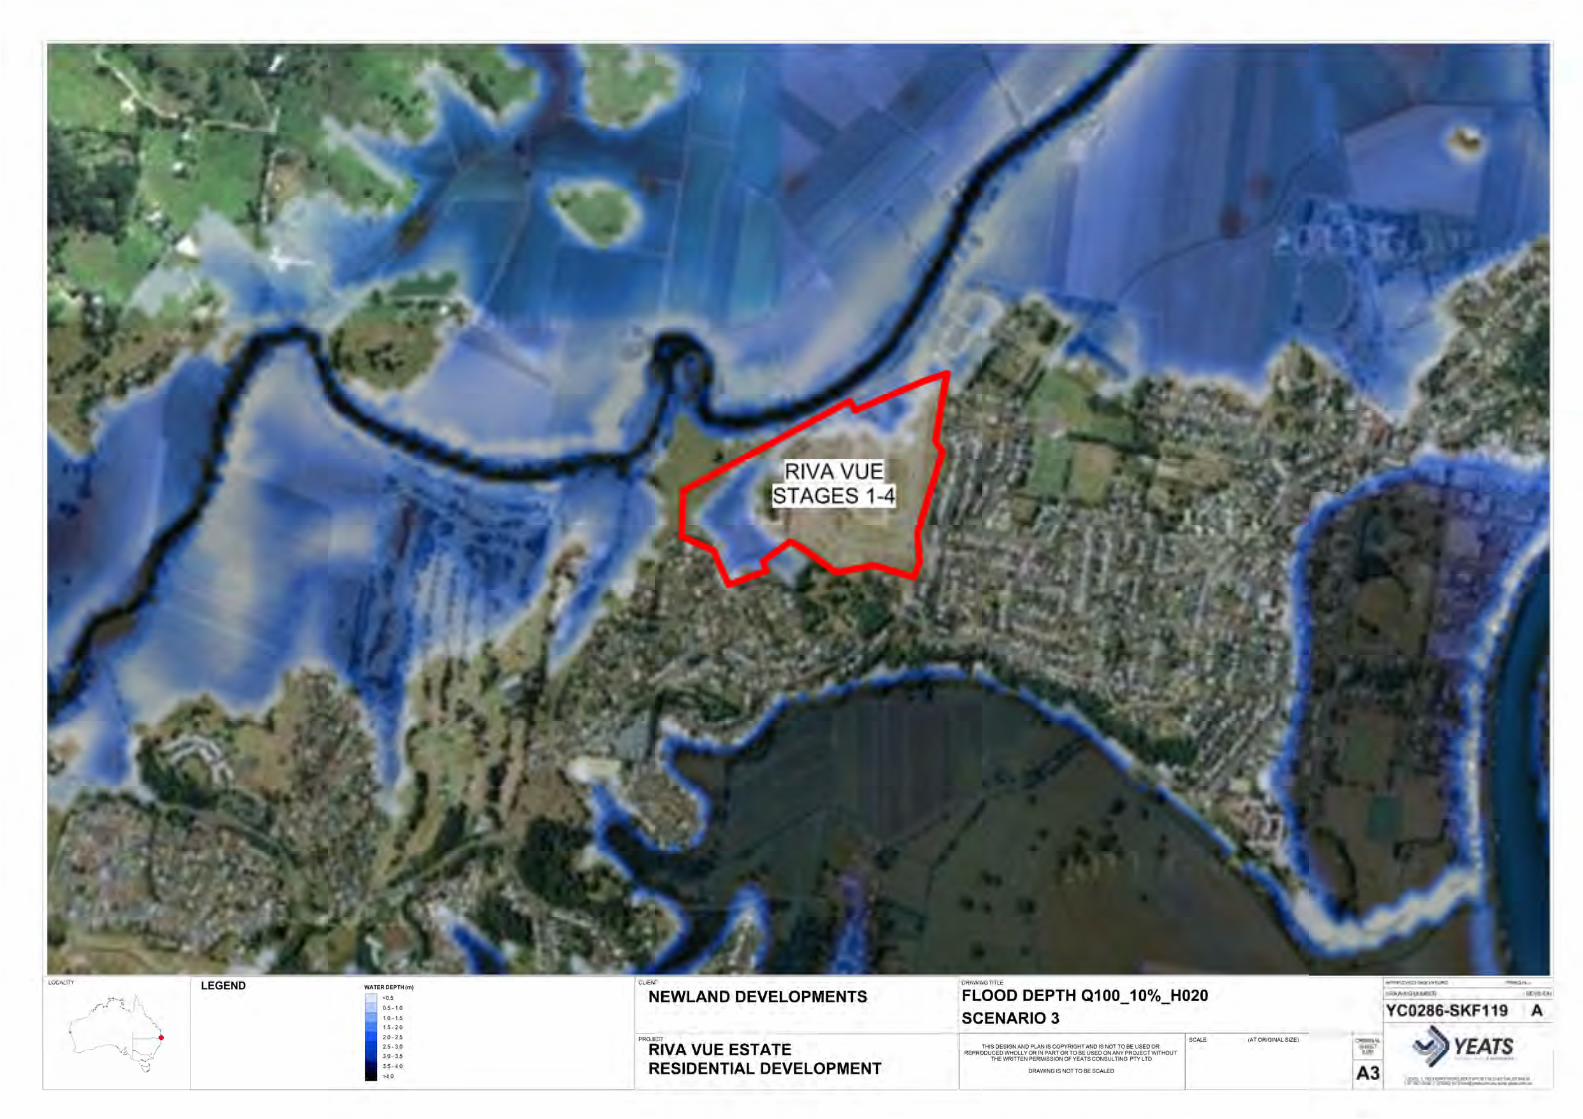
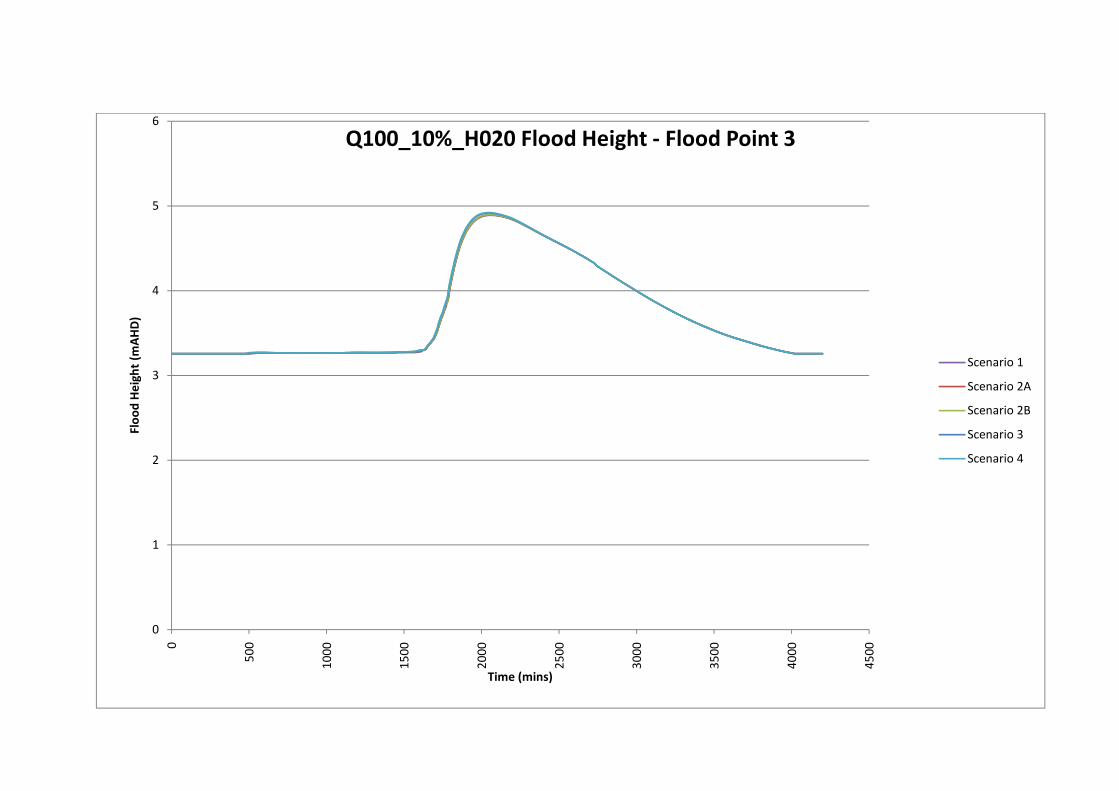
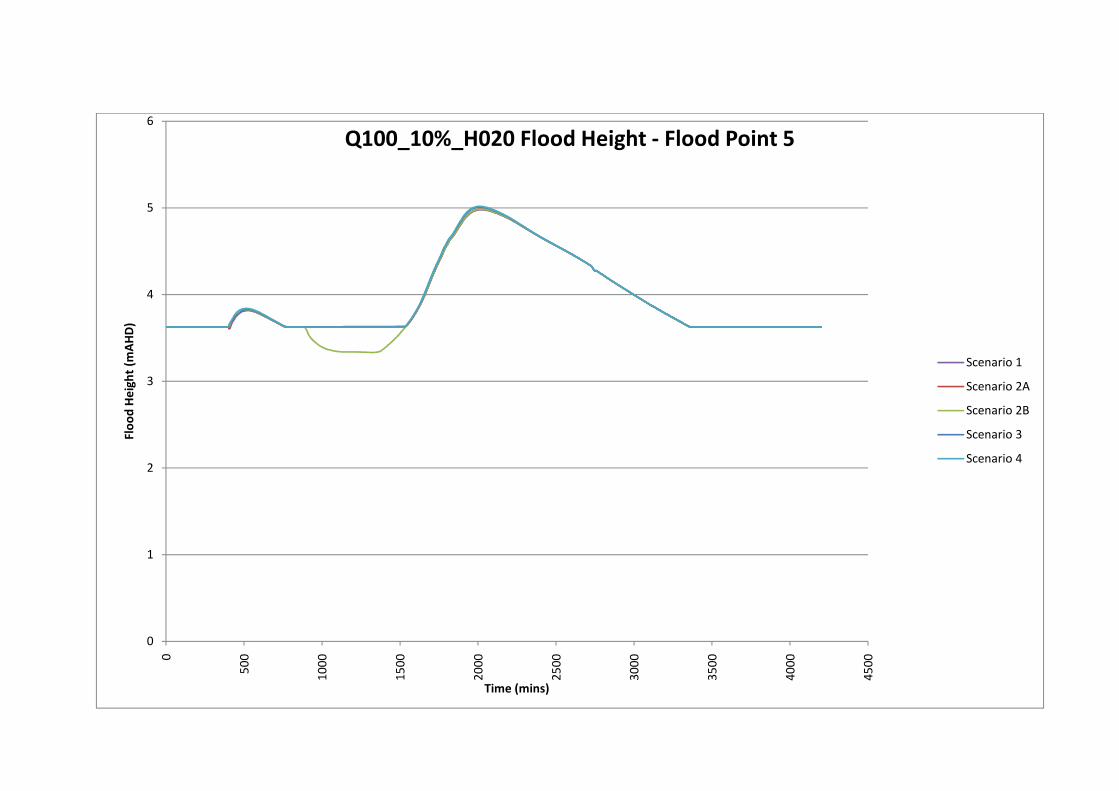
Q100_10% (Climate change scenario) 100 year ARI + 10% 20 year ARI
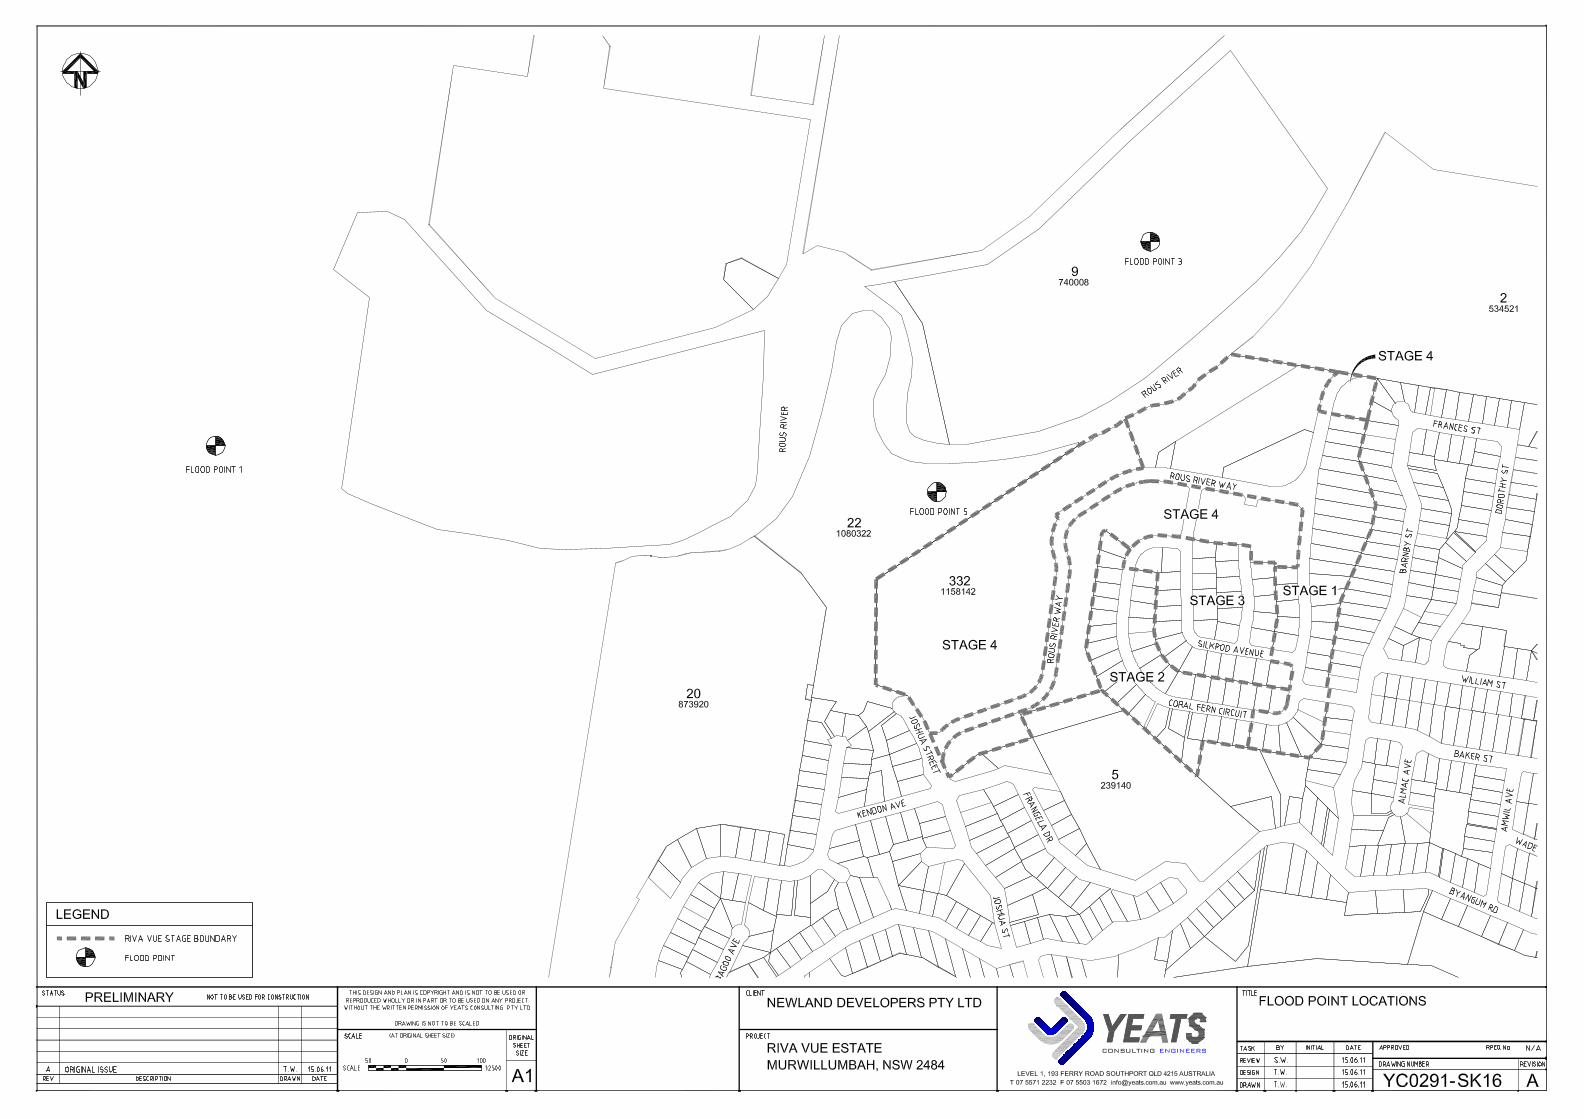
The flood depths, velocities and durations have been recorded in three separate points around
the site (Flood_Pt1, Flood_Pt3, Flood_Pt5) as shown on drawing YC0291-SK16 which is
presented in appendix B. The changes recorded at each of these flood points are presented in
the following sections for each of the impact scenarios described in Section 3.1.
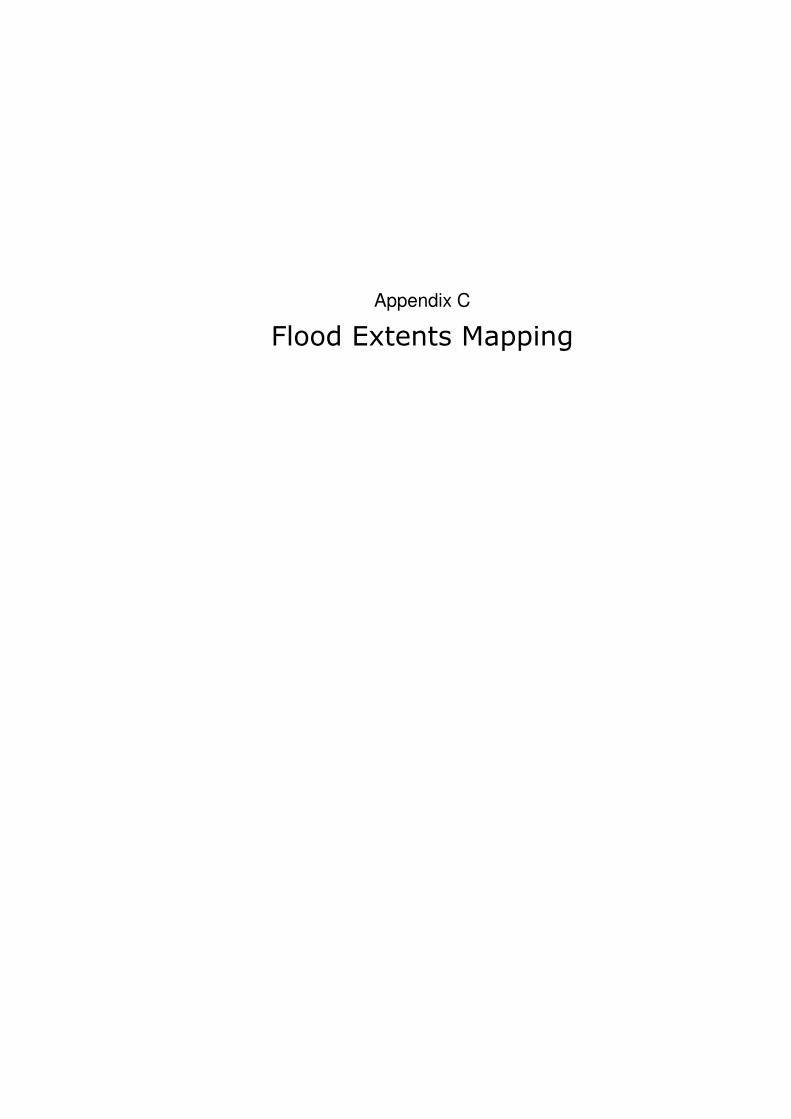
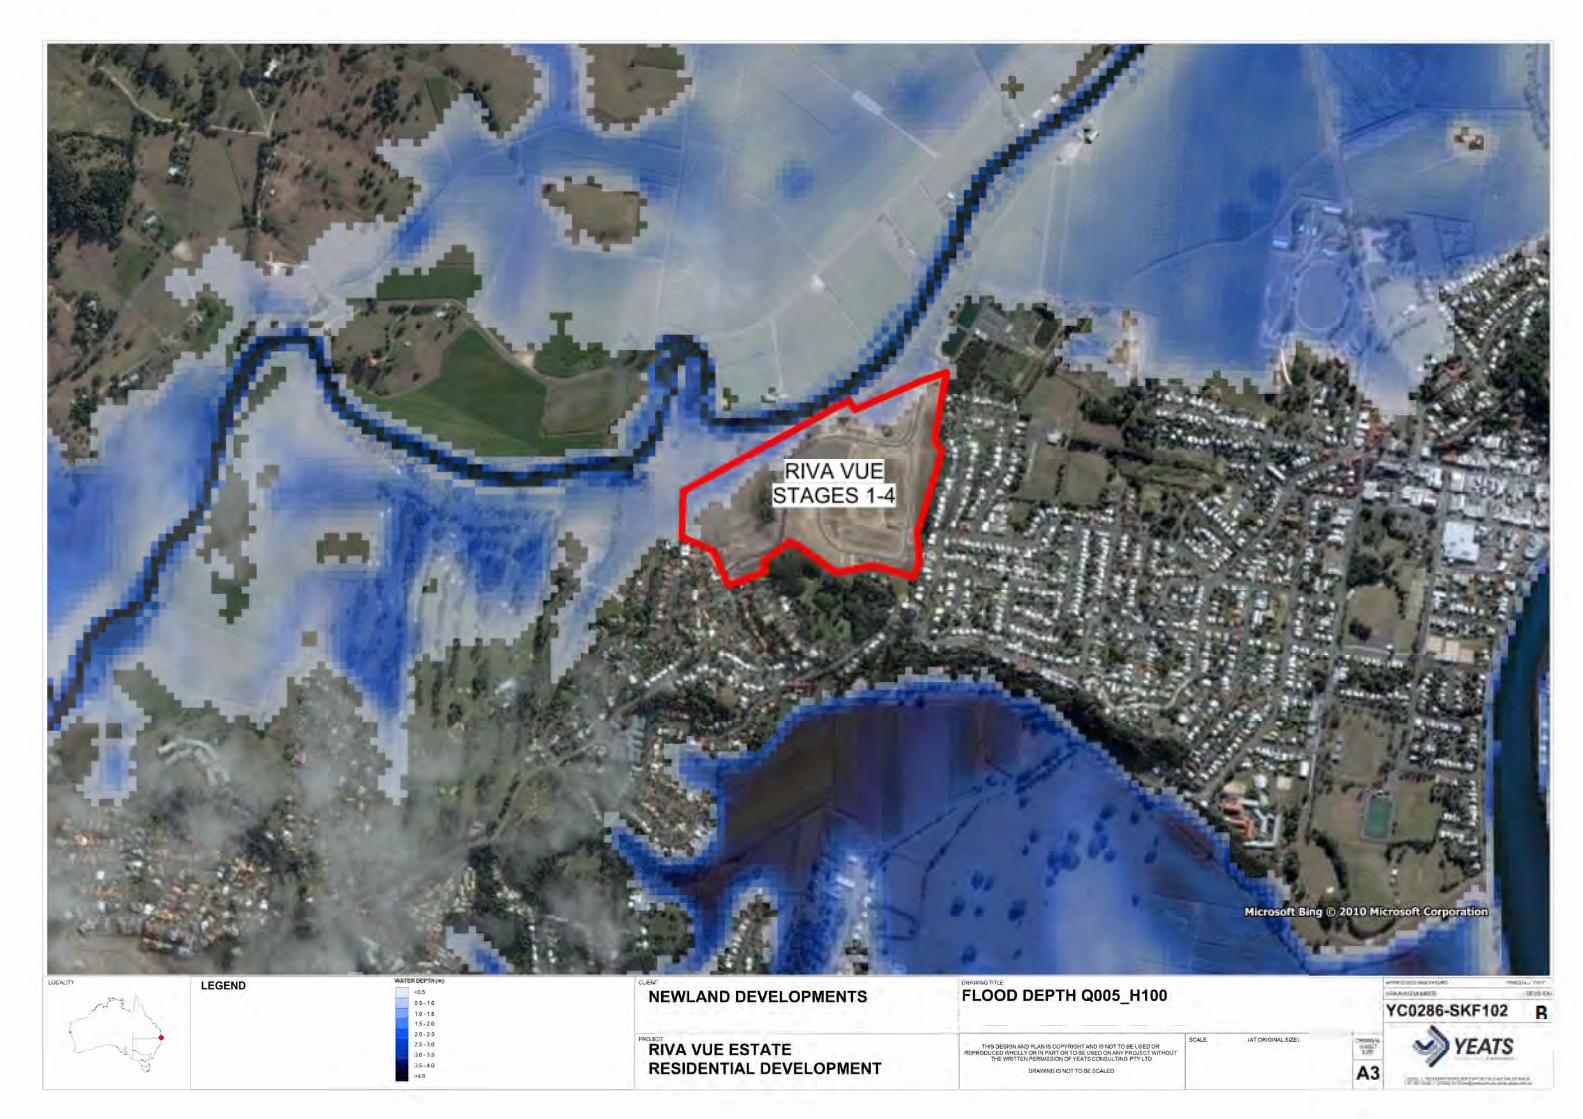
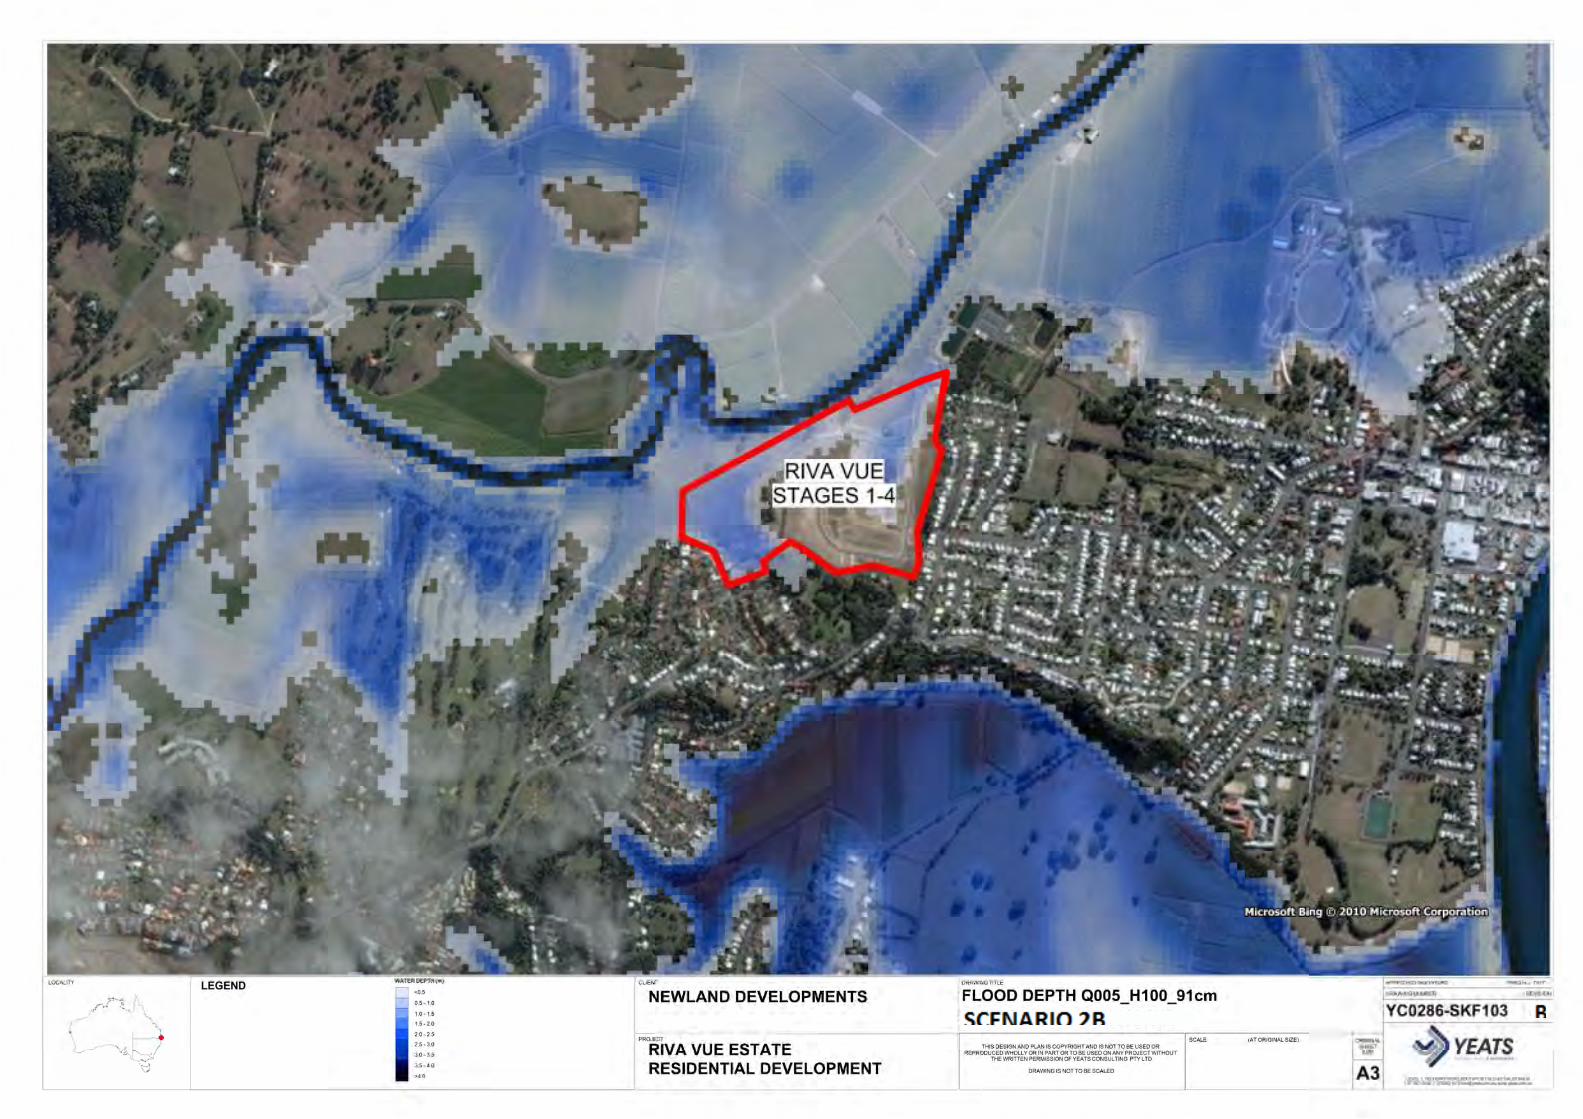
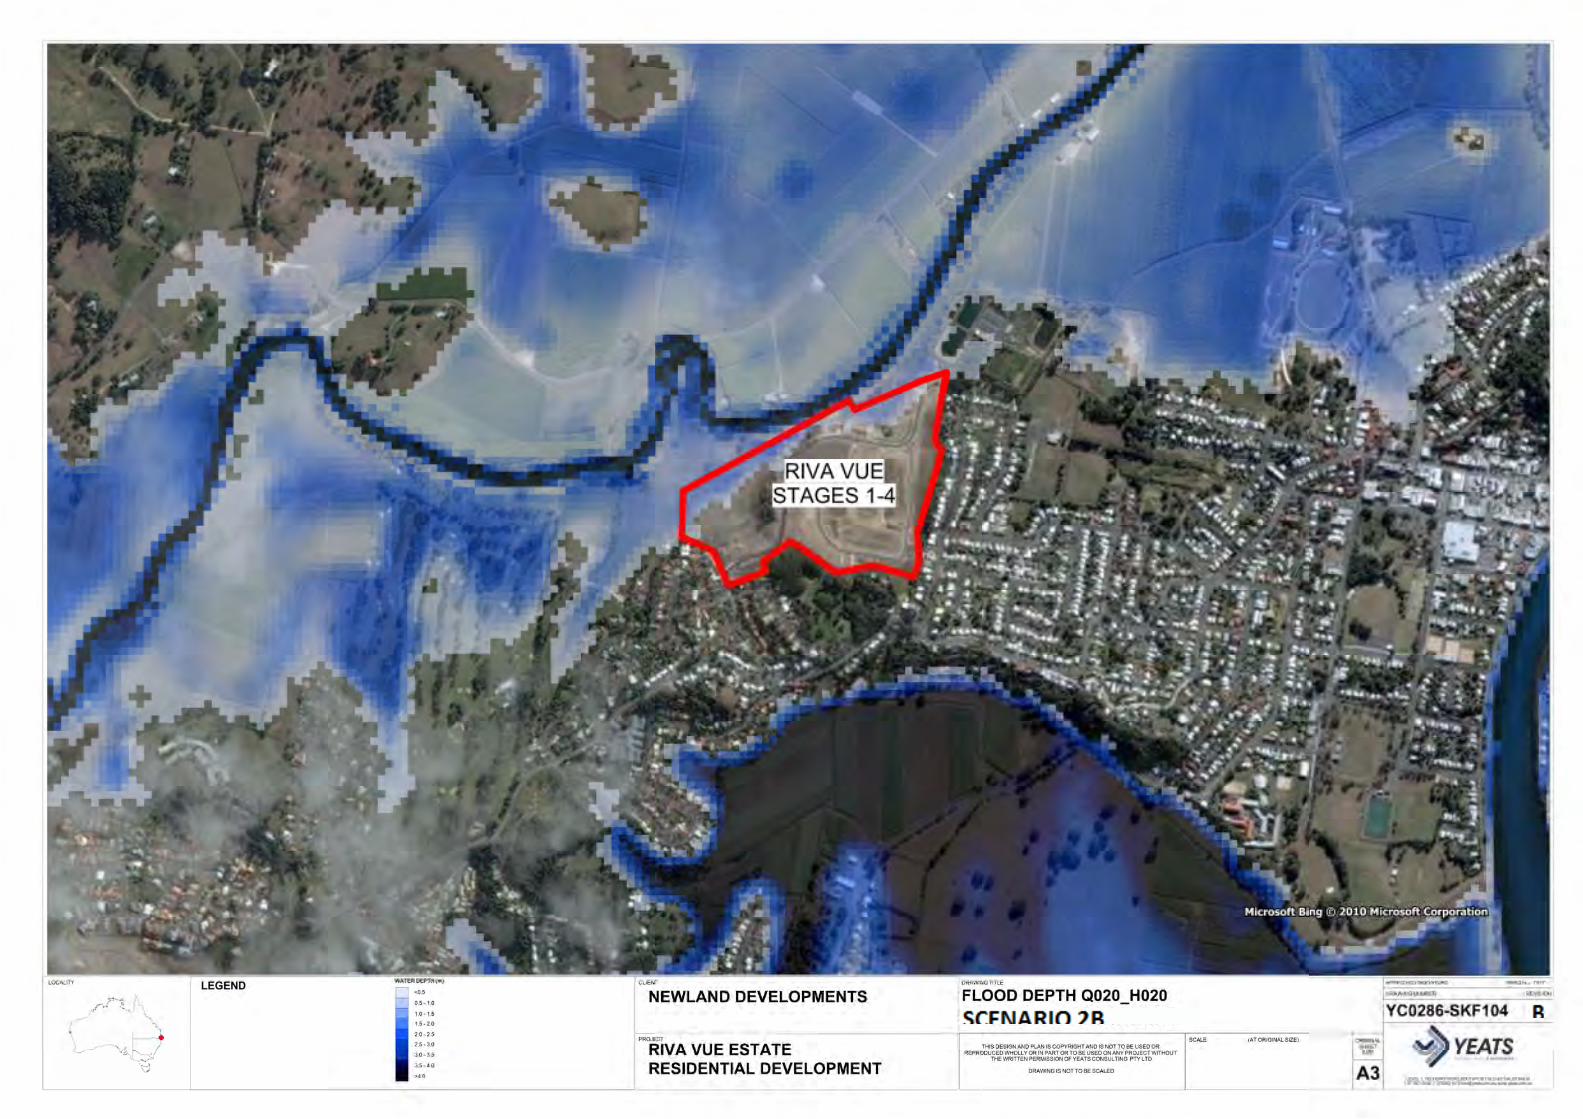
Further to this, maps depicting the peak Flood Depth and peak Water Level Increase for each
Design Event are presented in Appendix C.
3.3 Impact Scenario A1
The following section of the report has identified the changes in the flood characteristics
associated to the existing stages 1-3 only of Riva Vue Estate.
3.3.1 Changes to Flood Depths - Impact Scenario A1
The most noticeable change on average to the flood level attributed to this vicinity of the
development is at Flood_Pt5 which is located adjacent to Riva Vue Stages 1-3. The changes in
flood depths in the vicinity of the development, due to the effect of the above filling activities,
are presented in Table 3.2 below:
Table 3.2 Change in Flood Depth - Impact Scenario A1
ARI Change in Flood Depth at
Flood_Pt1
Change in Flood Depth at
Flood_Pt3
Change in Flood Depth at
Flood_Pt5
Q005_H005 +2.5mm -0.3mm +2.0mm
Q005_H100 +2.5mm +1.2mm +2.3mm
Q005_H100_91cm
+2.2mm +0.9mm +2.2mm
Q020_H020 +3.6mm +2.3mm +4.8mm
Q100_H020 +6.9mm +4.6mm +7.0mm
Q100_10% +8.8mm +5.0mm +8.7mm
3.3.2 Changes to Flood Velocity - Impact Scenario A1
The most noticeable change on average to the flood velocity attributed to this vicinity of the
development is at Flood_Pt5 which is located adjacent to Riva Vue Stages 1-3. The changes in
flood velocity in the vicinity of the development, due to the effect of the above filling activities,
are presented in Table 3.3 below:

Rous River – Flood Study Page 12 Ref: YC0291 Flood Study R007.docx
Table 3.3 Change in Flood Velocity - Impact Scenario A1
ARI Change in Flood Velocity at
Flood_Pt1
Change in Flood Velocity at
Flood_Pt3
Change in Flood Velocity
at Flood_Pt5
Q005_H005 +0.0026m/s -0.0025m/s +0.0041m/s
Q005_H100 -0.0242m/s +0.0025m/s +0.0044m/s
Q005_H100_91cm
-0.0010m/s +0.0026m/s +0.0047m/s
Q020_H020 -0.0045m/s +0.0112m/s +0.0083m/s
Q100_H020 +0.0339m/s -0.0276m/s +0.0531m/s
Q100_10% +0.0007m/s +0.0440m/s +0.0099m/s
3.4 Impact Scenario A2
The following section of the report has identified the changes in the flood characteristics of the
combined effect of stages 1 – 4 of Riva Vue Estate.
3.4.1 Changes to Flood Depths - Impact Scenario A2
The most noticeable change on average in the flood level attributed to this vicinity of the
development is at Flood_Pt1 which is located upstream of Riva Vue Stages 1-4. The changes in
flood depths in the vicinity of the development, due to the effect of the above filling activities,
are presented in Table 3.4 below:
Table 3.4 Change in Flood Depth - Impact Scenario A2
ARI Change in Flood Depth at
Flood_Pt1
Change in Flood Depth at
Flood_Pt3
Change in Flood Depth at
Flood_Pt5
Q005_H005 +5.0mm +0.3mm +3.7mm
Q005_H100 +4.8mm +0.2mm +3.6mm
Q005_H100_91cm
+4.4mm +0.4mm +3.0mm
Q020_H020 +3.2mm +4.5mm +1.9mm
Q100_H020 +8.1mm +5.6mm +5.4mm
Q100_10% +9.9mm +5.8mm +6.7mm
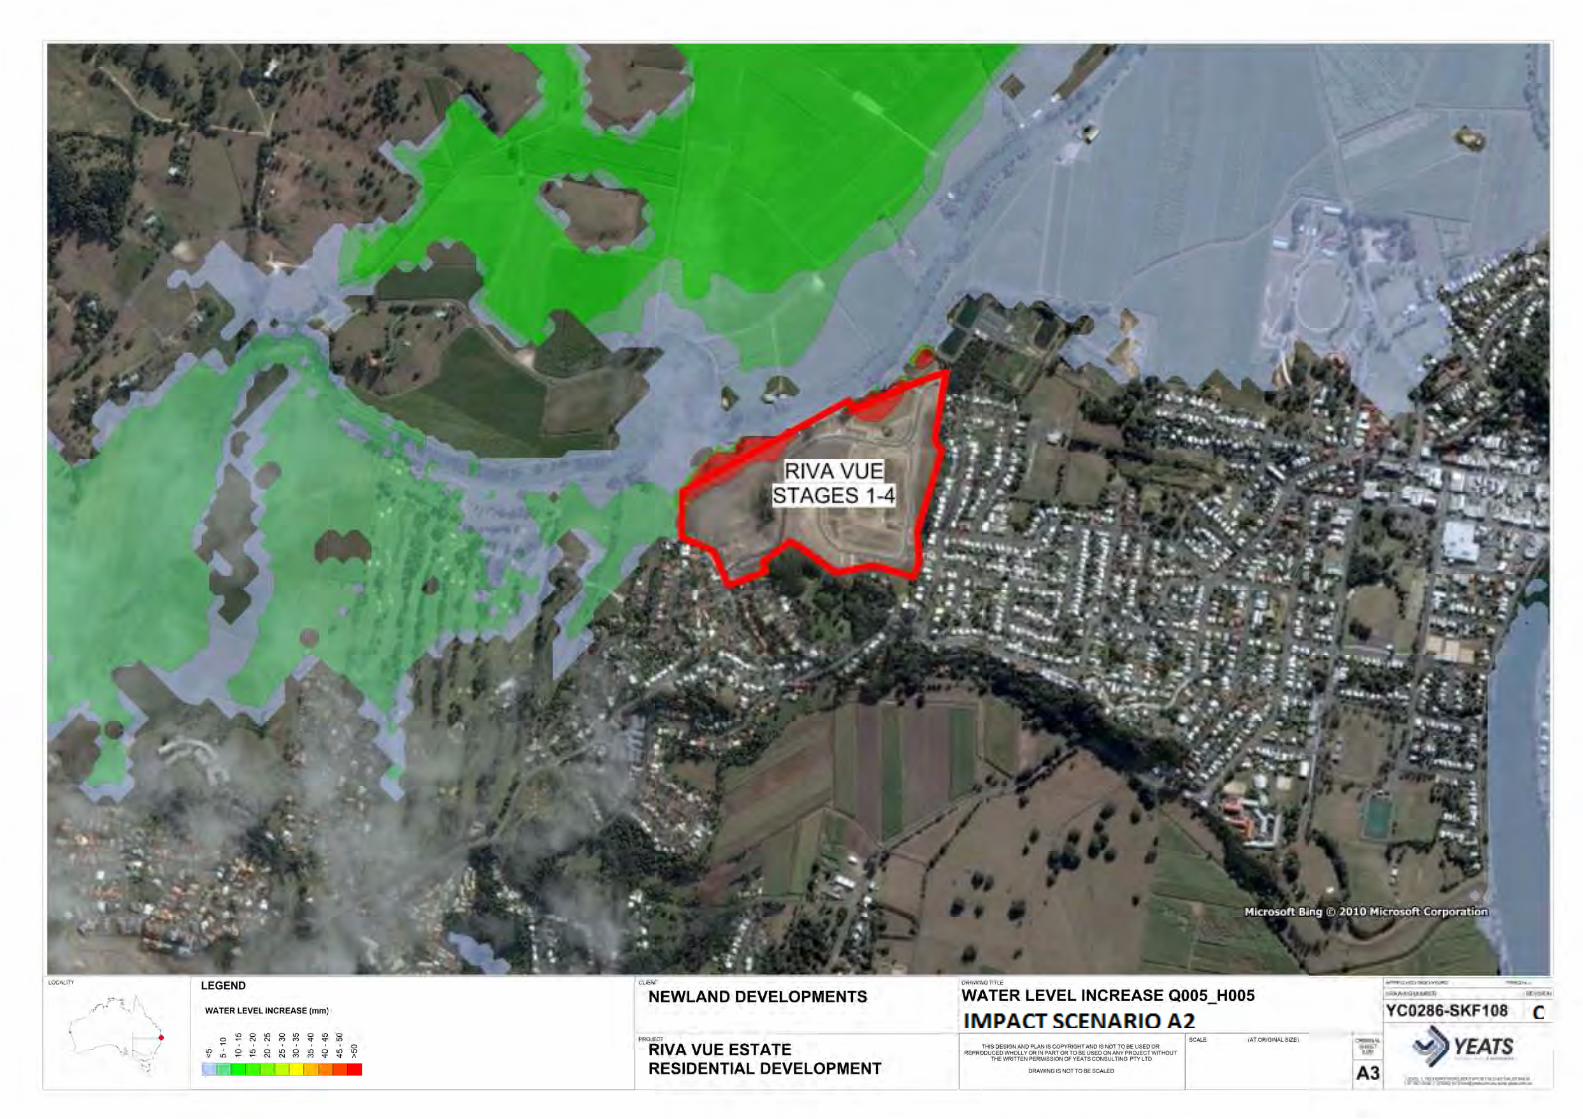
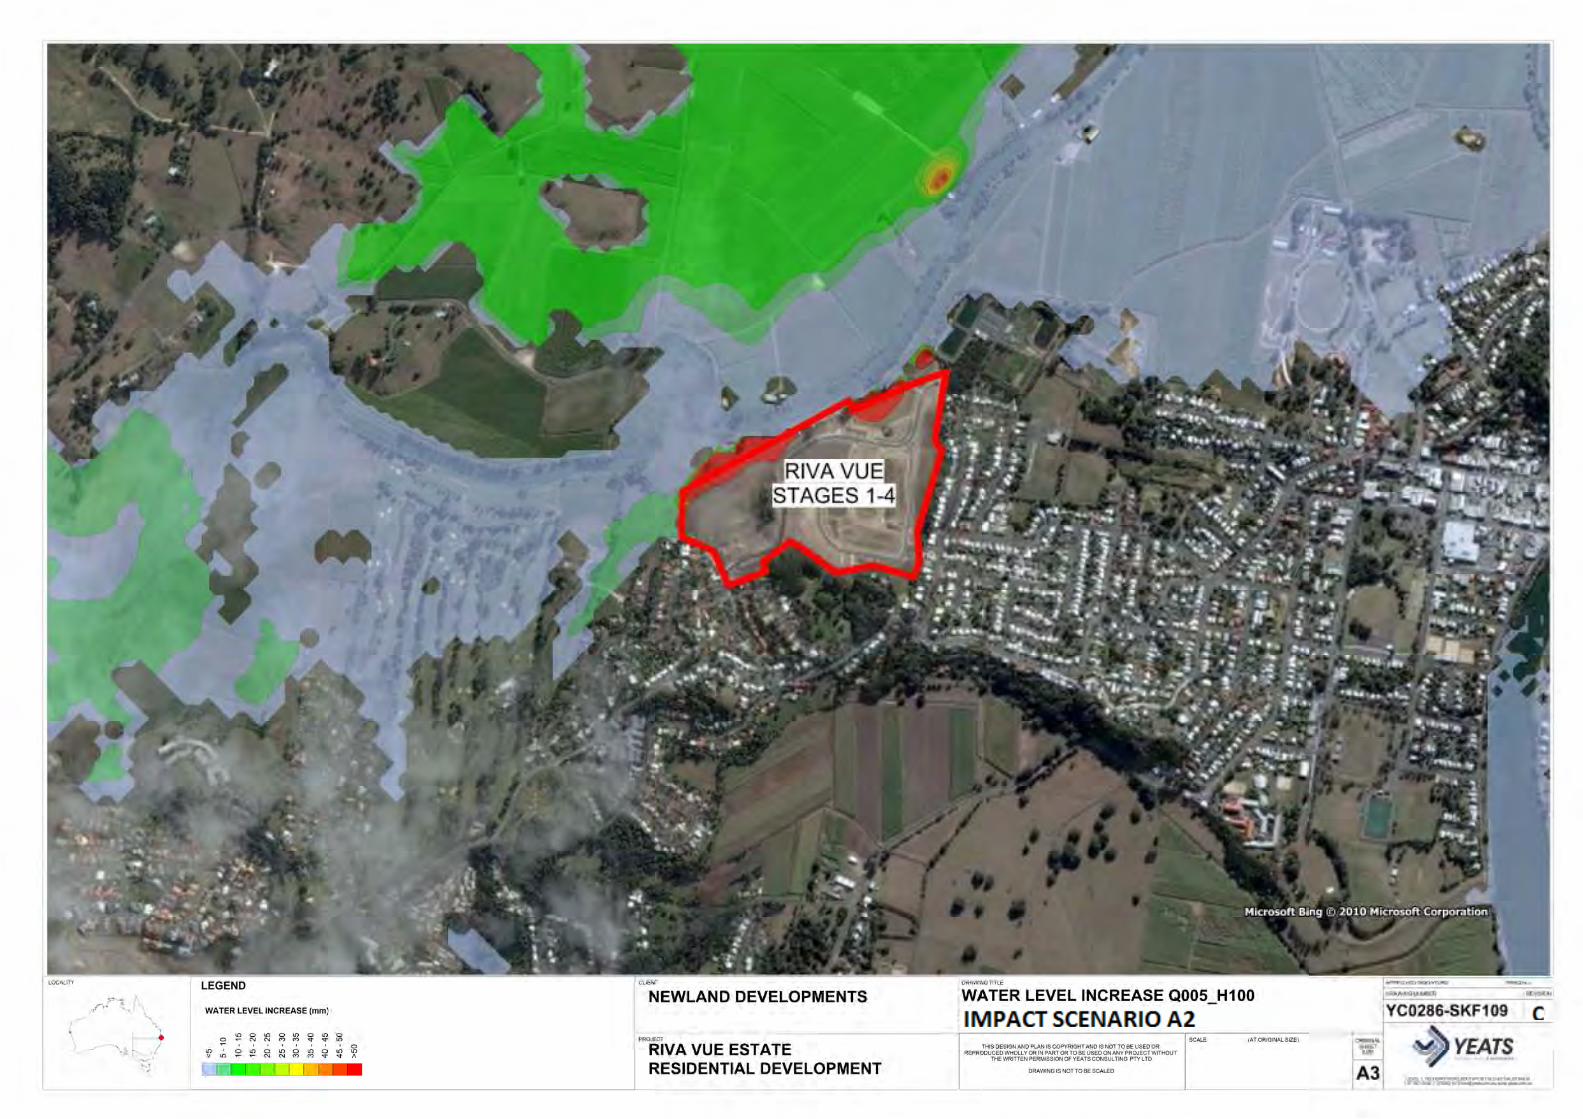
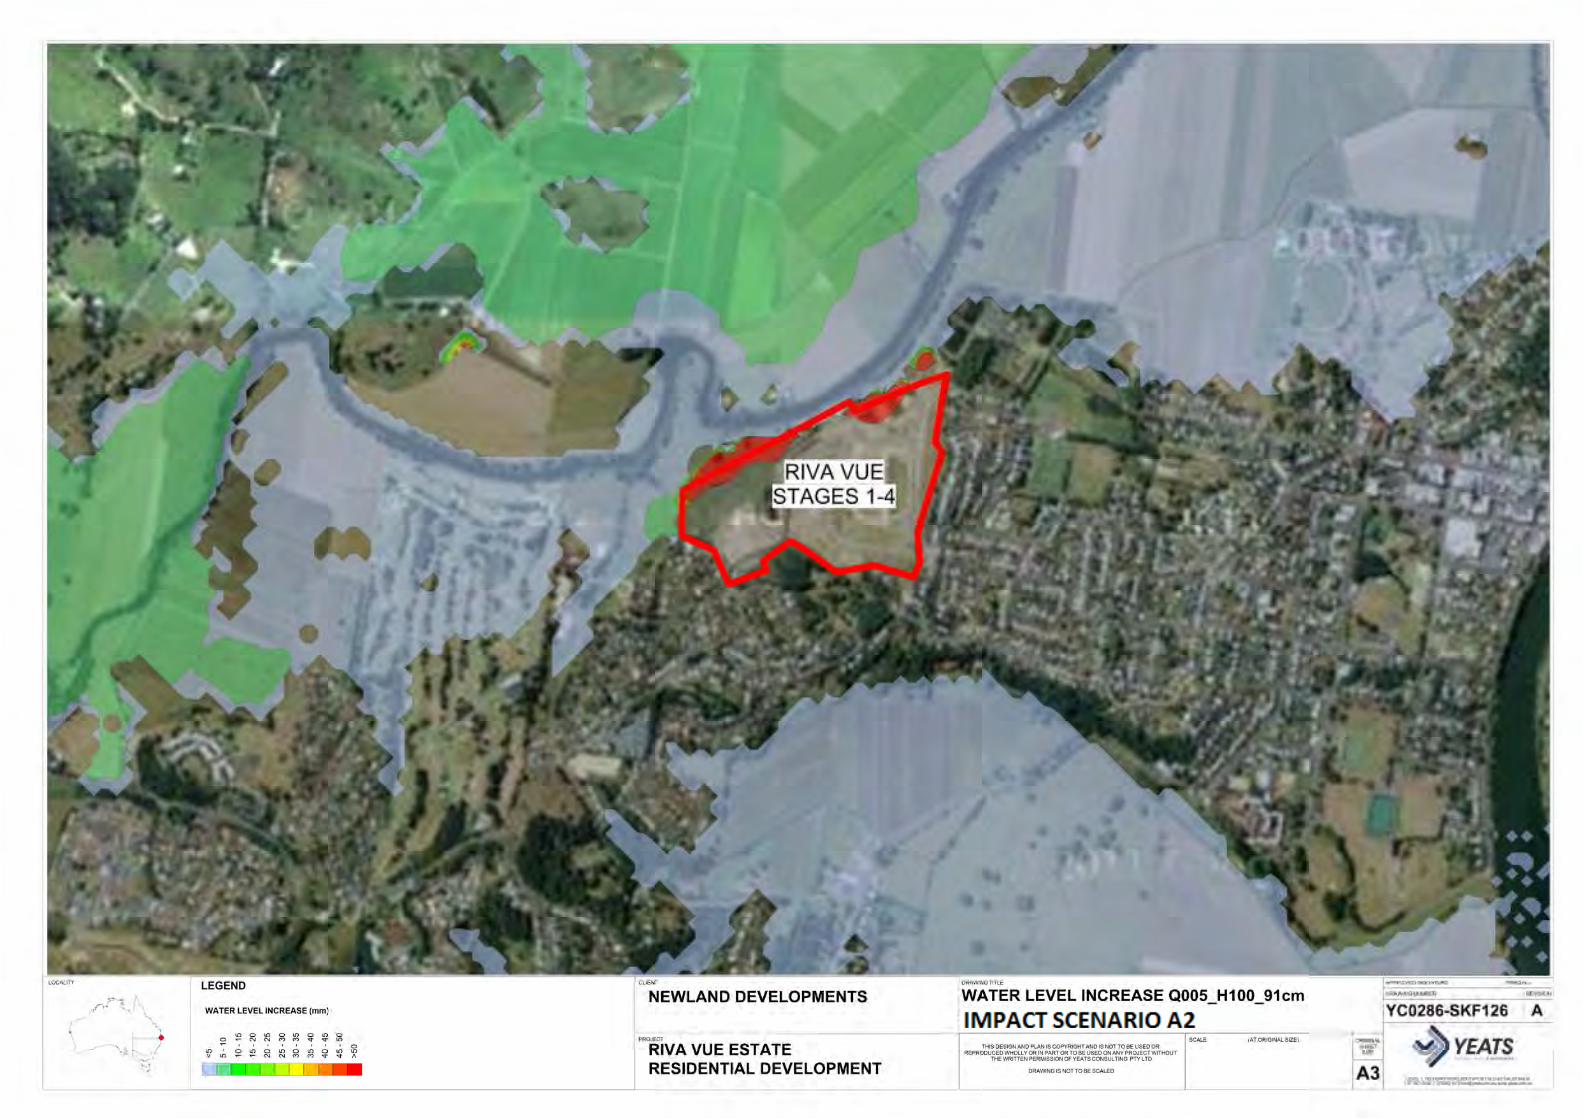
The changes in flood depths occurring in Impact Scenario A2 in the areas surrounding Riva Vue
Estate are shown graphically on Drawings YC0291-SKF108 - 112, 126 - 127 in Appendix C.
These drawings demonstrate that although the earthworks associated with Stages 1-4 of the
Riva Vue Estate cause an increase in flood depths in the vicinity of the development, the
increase is generally less than 15mm and occurs over the rural land to the north and west of the
development. This increase is below the acceptable limit of 15mm in urban areas and 50mm in
rural areas as defined by Tweed Shire Council officers at a meeting on the 26th of September
2005, in relation to a rezoning at Fernvale Road/Wardrop Valley Road.
3.4.2 Changes to Flood Velocity - Impact Scenario A2
The most noticeable change on average to the flood velocity attributed to this vicinity of the
development is at Flood_Pt1 which is located upstream of Riva Vue Stages 1- 4. The changes in
flood velocity in the vicinity of the development, due to the effect of the above filling activities,
are presented in Table 3.5 below:
Rous River – Flood Study Page 13 Ref: YC0291 Flood Study R007.docx
Table 3.5 Change in Flood Velocity - Impact Scenario A2
ARI Change in Flood Velocity at
Flood_Pt1
Change in Flood Velocity at
Flood_Pt3
Change in Flood Velocity
at Flood_Pt5
Q005_H005 -0.0225m/s -0.0046m/s -0.0270m/s
Q005_H100 +0.0025m/s +0.0044m/s -0.0268m/s
Q005_H100_91cm
+0.0006m/s +0.0048m/s -0.0270m/s
Q020_H020 -0.0038m/s -0.0062m/s -0.0391m/s
Q100_H020 +0.0341m/s +0.0010m/s +0.0194m/s
Q100_10% +0.0009m/s -0.0139m/s -0.0239m/s
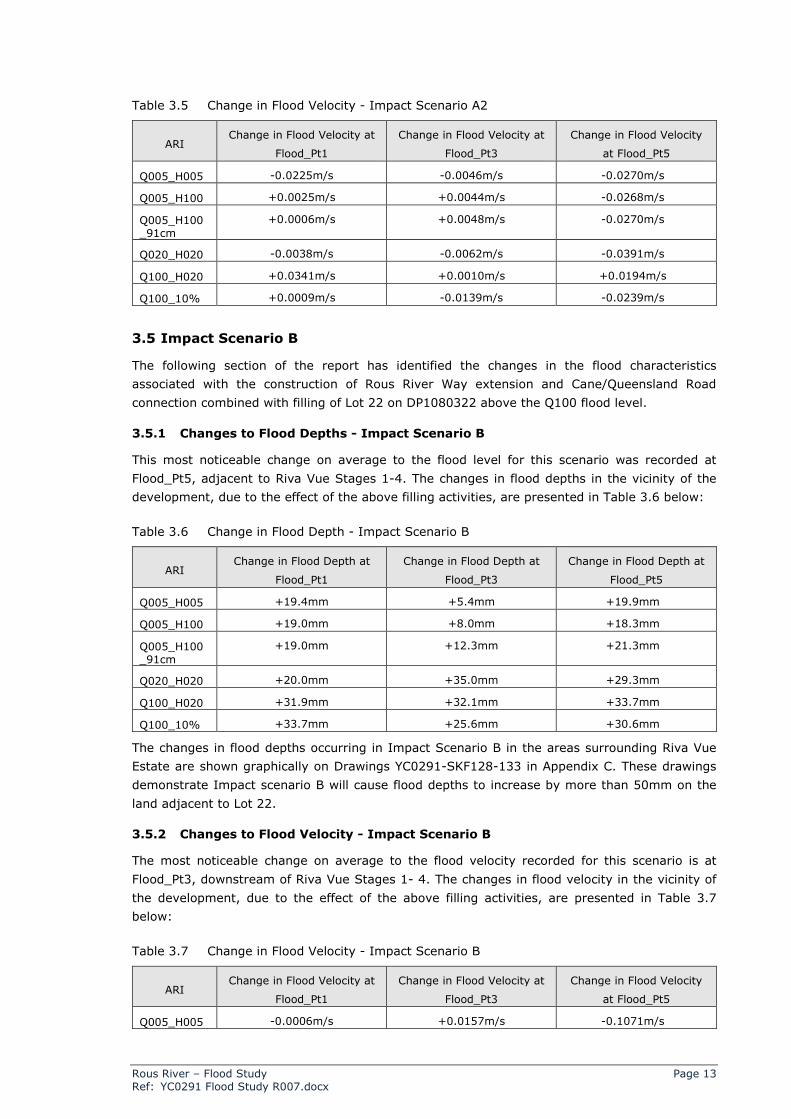
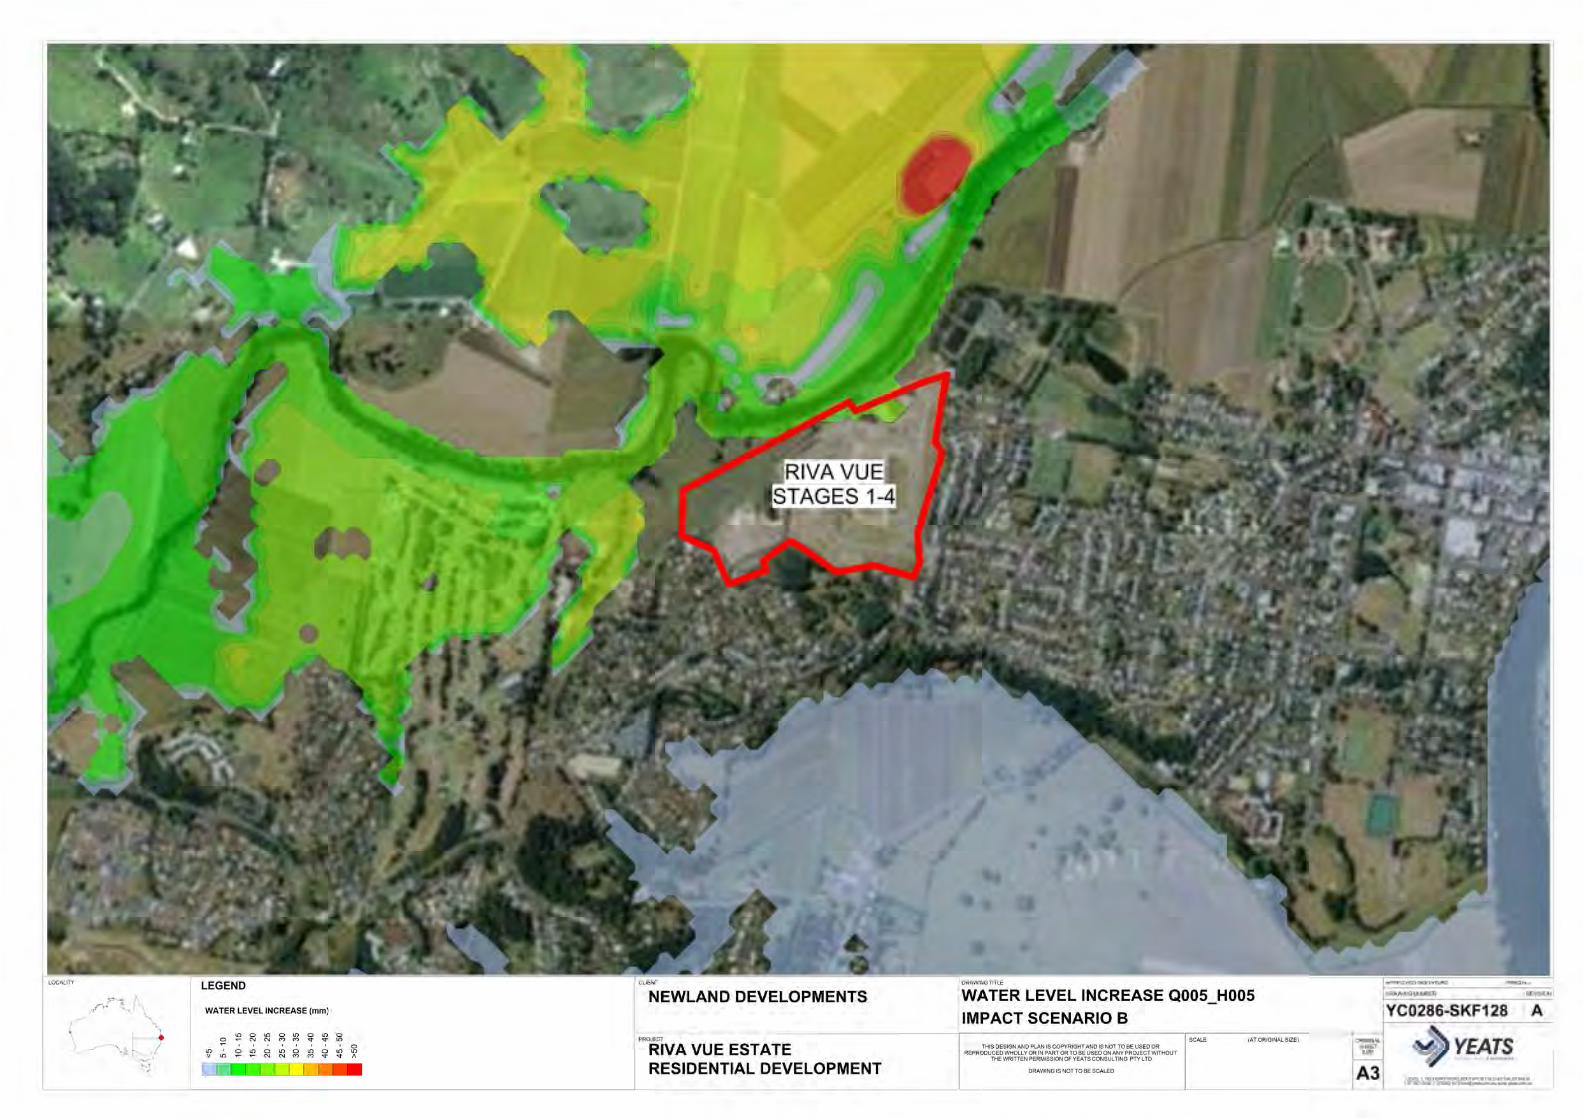
3.5 Impact Scenario B
The following section of the report has identified the changes in the flood characteristics
associated with the construction of Rous River Way extension and Cane/Queensland Road
connection combined with filling of Lot 22 on DP1080322 above the Q100 flood level.
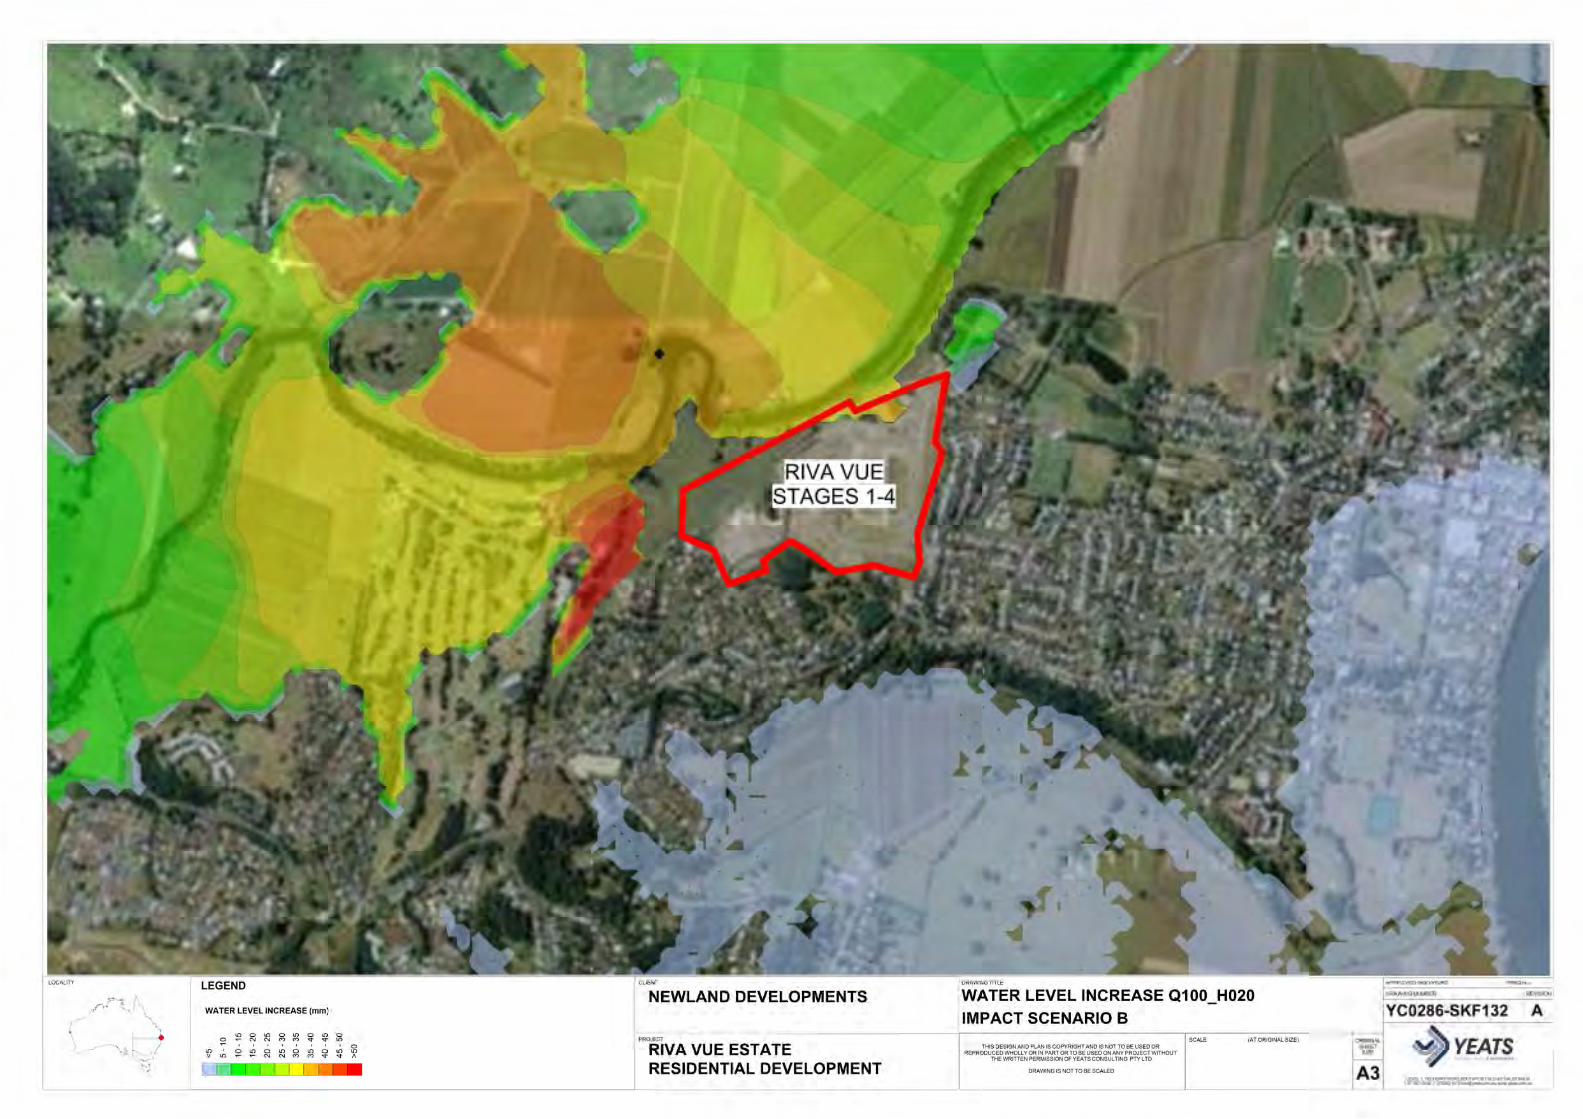
3.5.1 Changes to Flood Depths - Impact Scenario B
This most noticeable change on average to the flood level for this scenario was recorded at
Flood_Pt5, adjacent to Riva Vue Stages 1-4. The changes in flood depths in the vicinity of the
development, due to the effect of the above filling activities, are presented in Table 3.6 below:
Table 3.6 Change in Flood Depth - Impact Scenario B
ARI Change in Flood Depth at
Flood_Pt1
Change in Flood Depth at
Flood_Pt3
Change in Flood Depth at
Flood_Pt5
Q005_H005 +19.4mm +5.4mm +19.9mm
Q005_H100 +19.0mm +8.0mm +18.3mm
Q005_H100_91cm
+19.0mm +12.3mm +21.3mm
Q020_H020 +20.0mm +35.0mm +29.3mm
Q100_H020 +31.9mm +32.1mm +33.7mm
Q100_10% +33.7mm +25.6mm +30.6mm
The changes in flood depths occurring in Impact Scenario B in the areas surrounding Riva Vue
Estate are shown graphically on Drawings YC0291-SKF128-133 in Appendix C. These drawings
demonstrate Impact scenario B will cause flood depths to increase by more than 50mm on the
land adjacent to Lot 22.
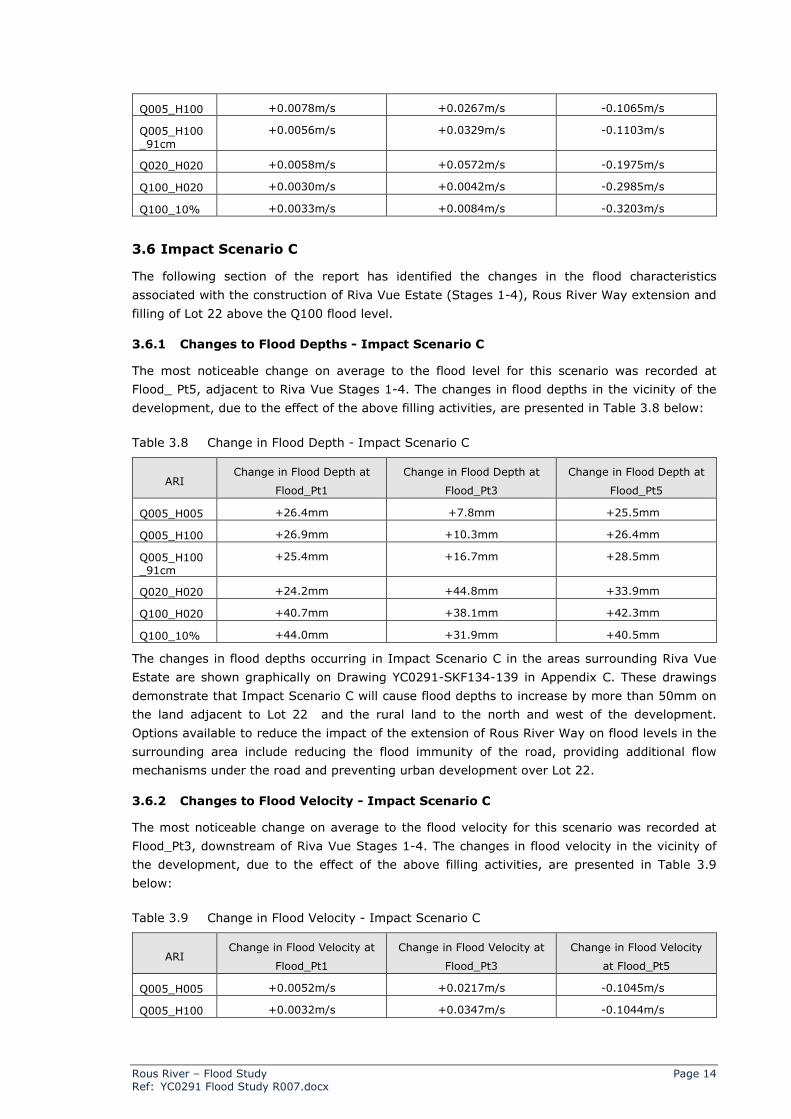
3.5.2 Changes to Flood Velocity - Impact Scenario B
The most noticeable change on average to the flood velocity recorded for this scenario is at
Flood_Pt3, downstream of Riva Vue Stages 1- 4. The changes in flood velocity in the vicinity of
the development, due to the effect of the above filling activities, are presented in Table 3.7
below:
Table 3.7 Change in Flood Velocity - Impact Scenario B
ARI Change in Flood Velocity at
Flood_Pt1
Change in Flood Velocity at
Flood_Pt3
Change in Flood Velocity
at Flood_Pt5
Q005_H005 -0.0006m/s +0.0157m/s -0.1071m/s
Rous River – Flood Study Page 14 Ref: YC0291 Flood Study R007.docx
Q005_H100 +0.0078m/s +0.0267m/s -0.1065m/s
Q005_H100
_91cm
+0.0056m/s +0.0329m/s -0.1103m/s
Q020_H020 +0.0058m/s +0.0572m/s -0.1975m/s
Q100_H020 +0.0030m/s +0.0042m/s -0.2985m/s
Q100_10% +0.0033m/s +0.0084m/s -0.3203m/s
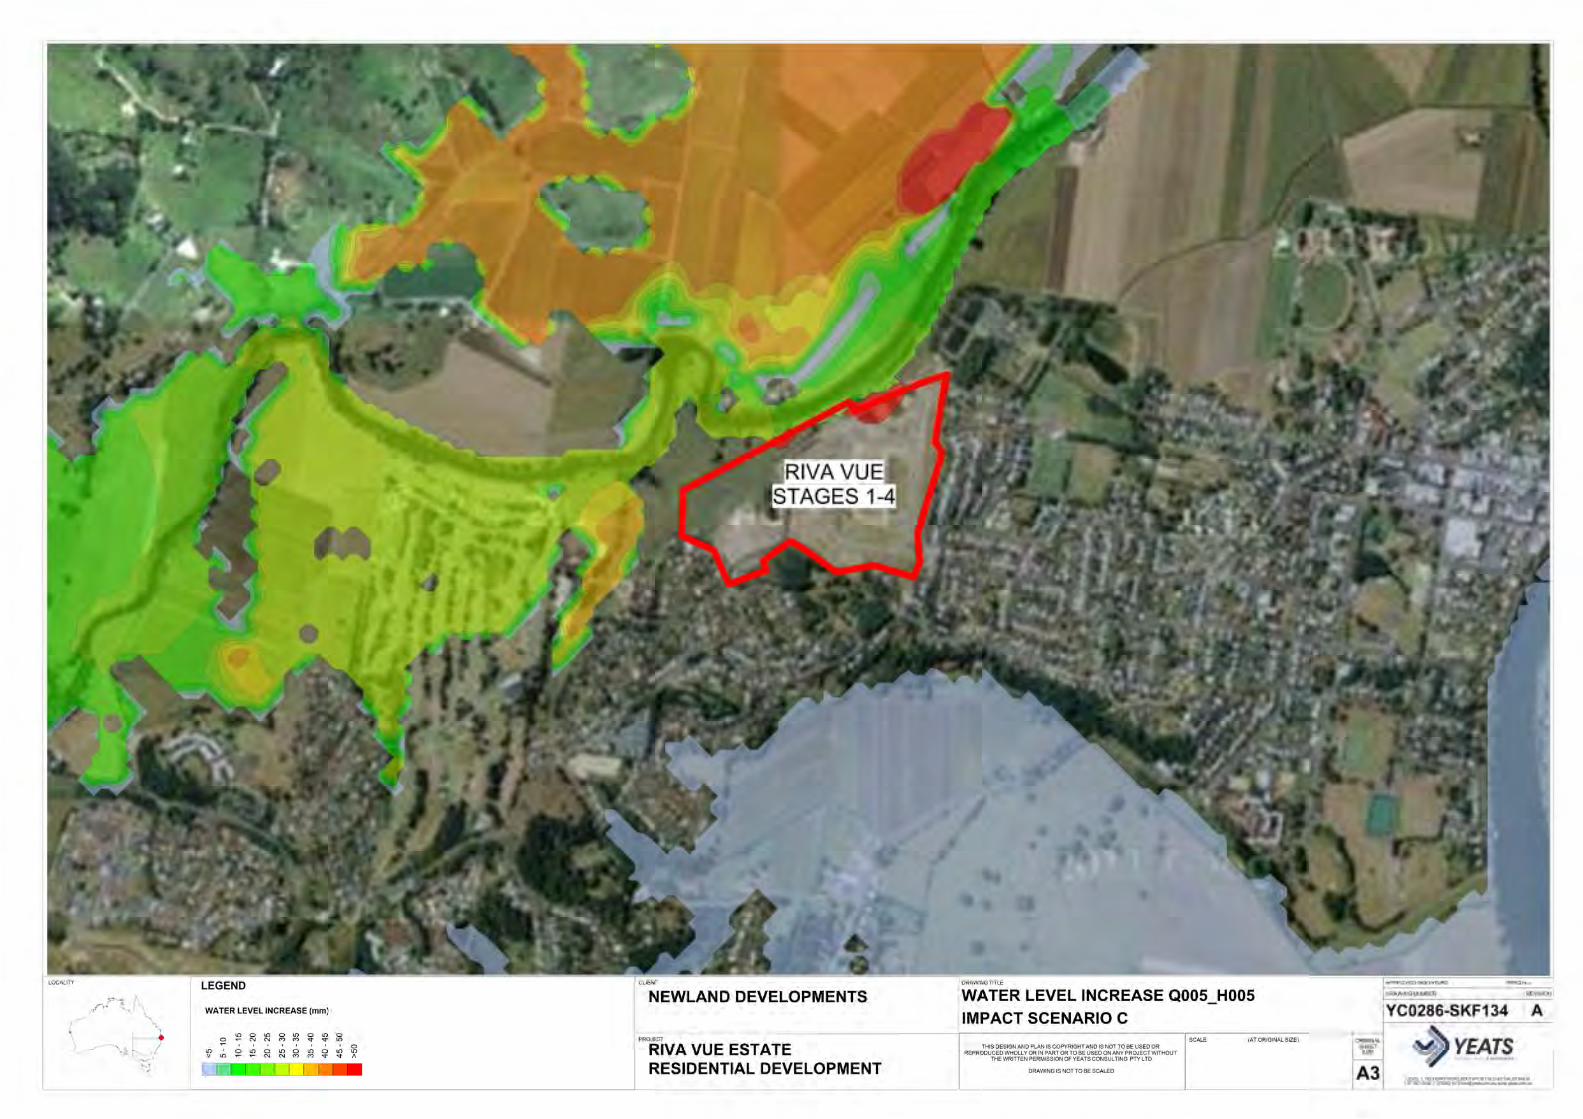
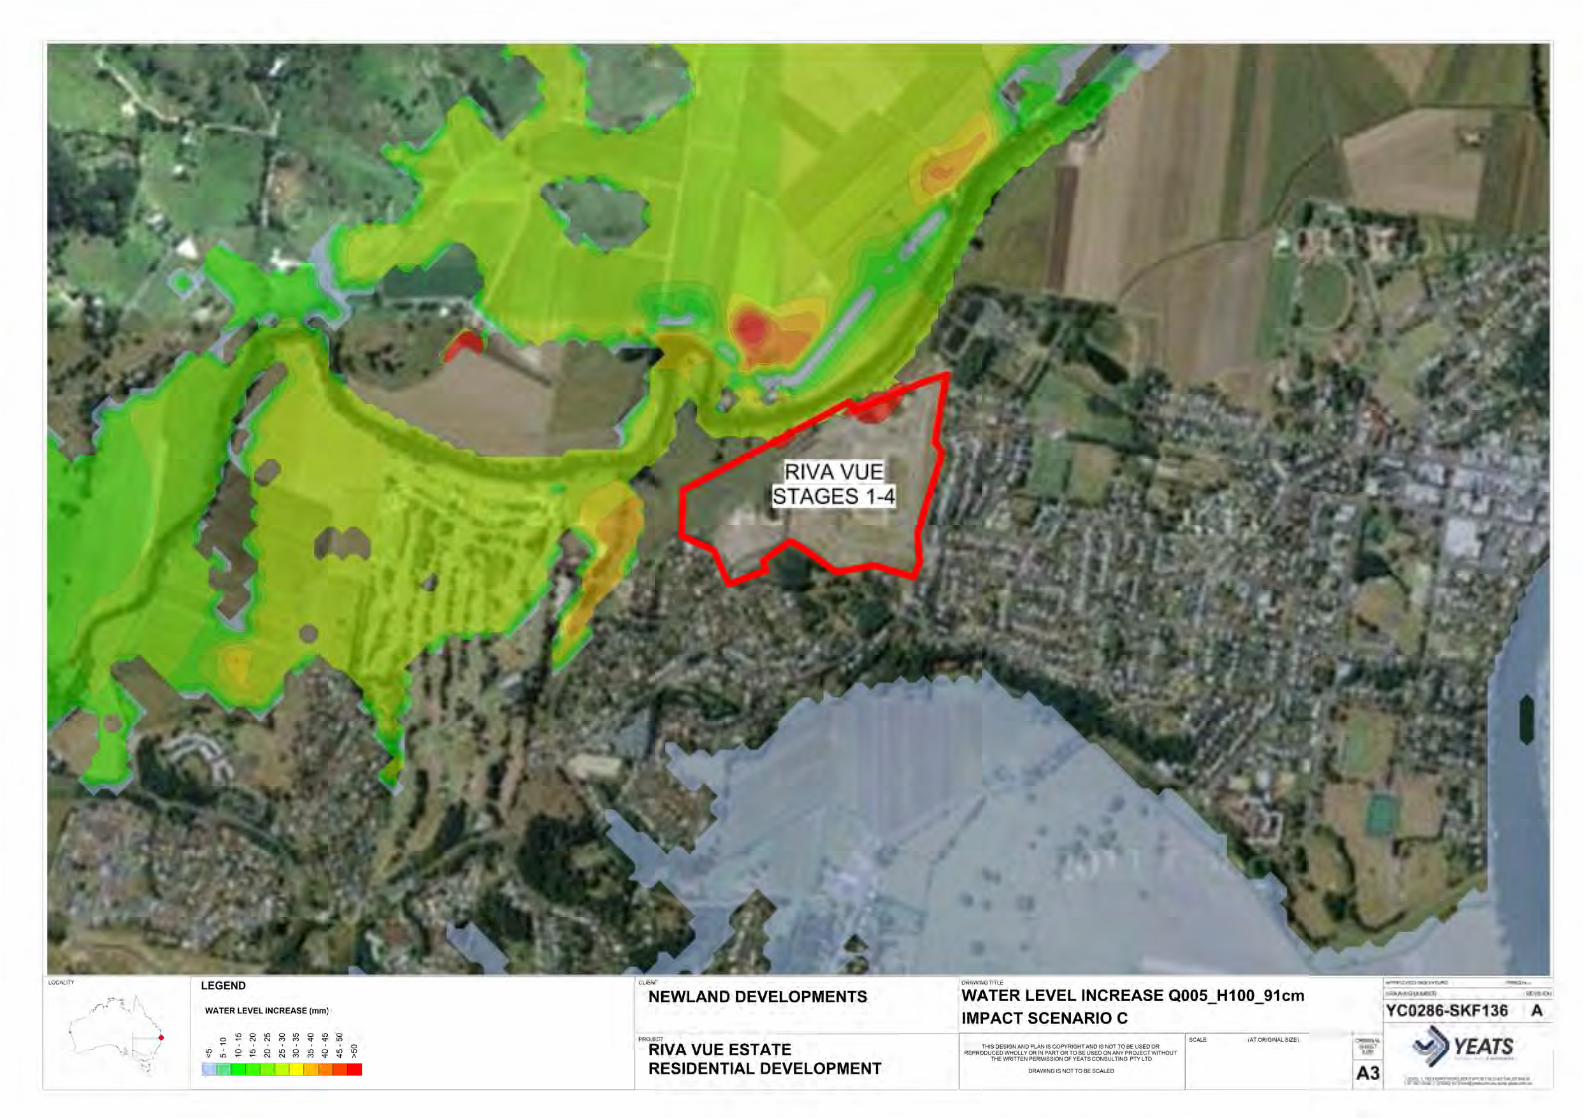
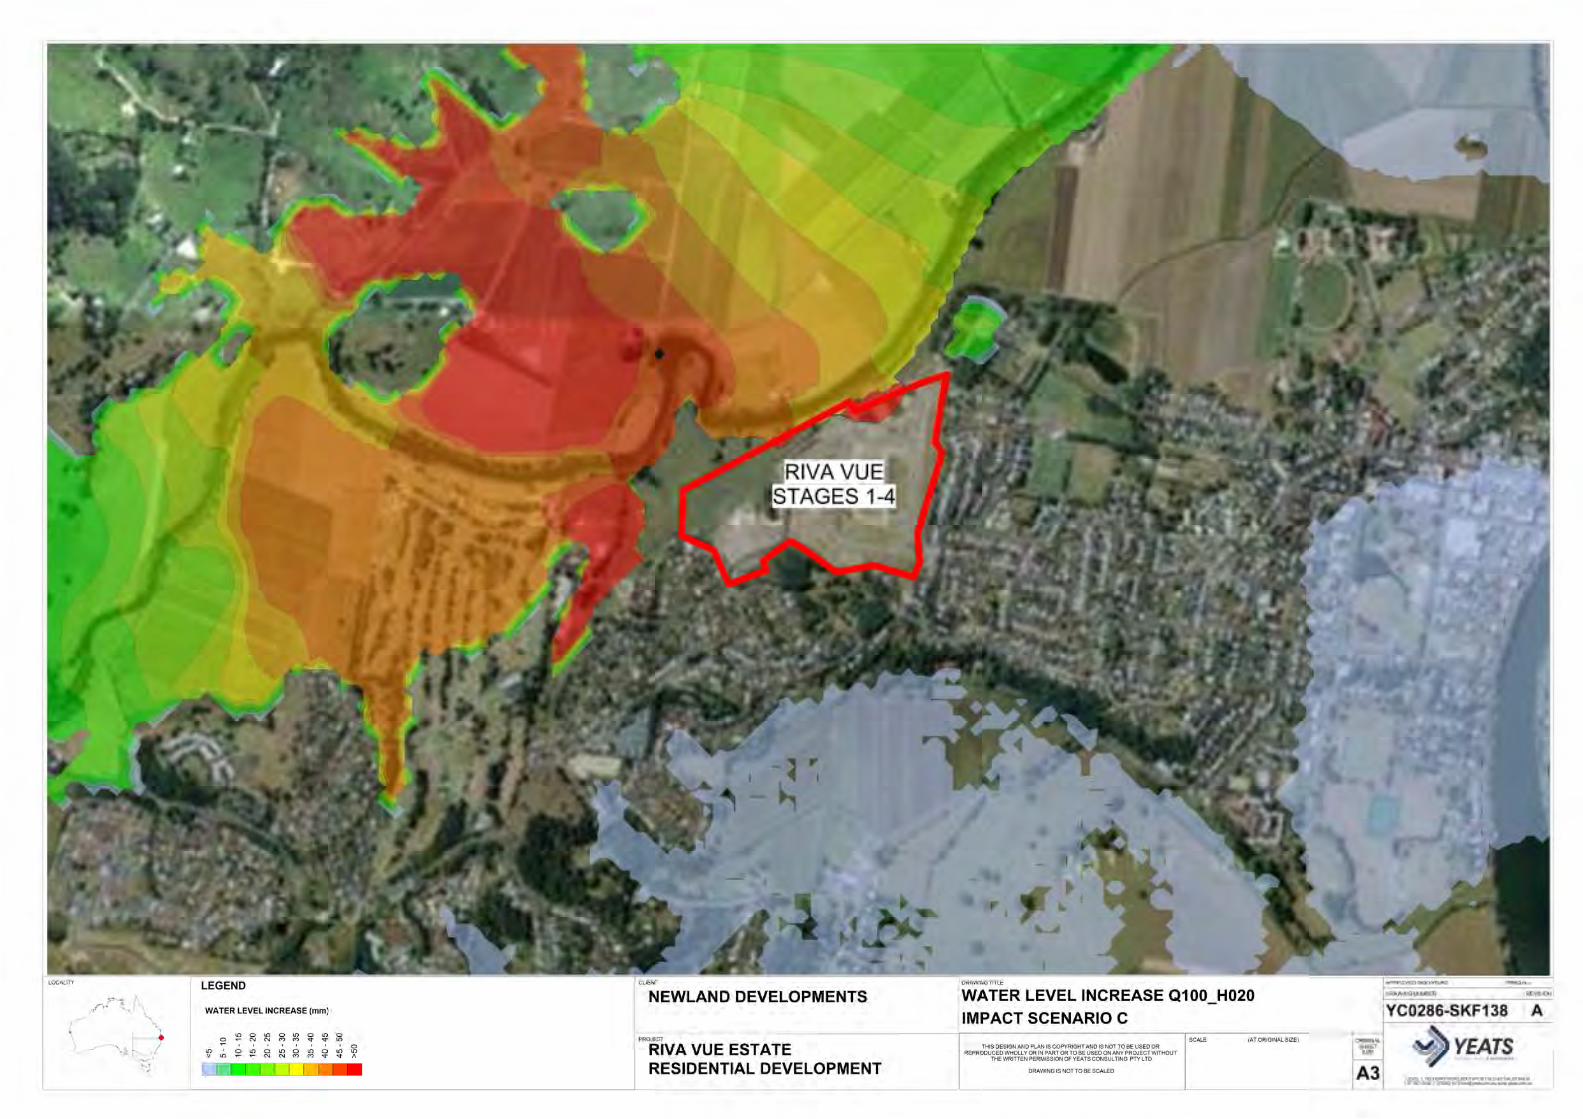
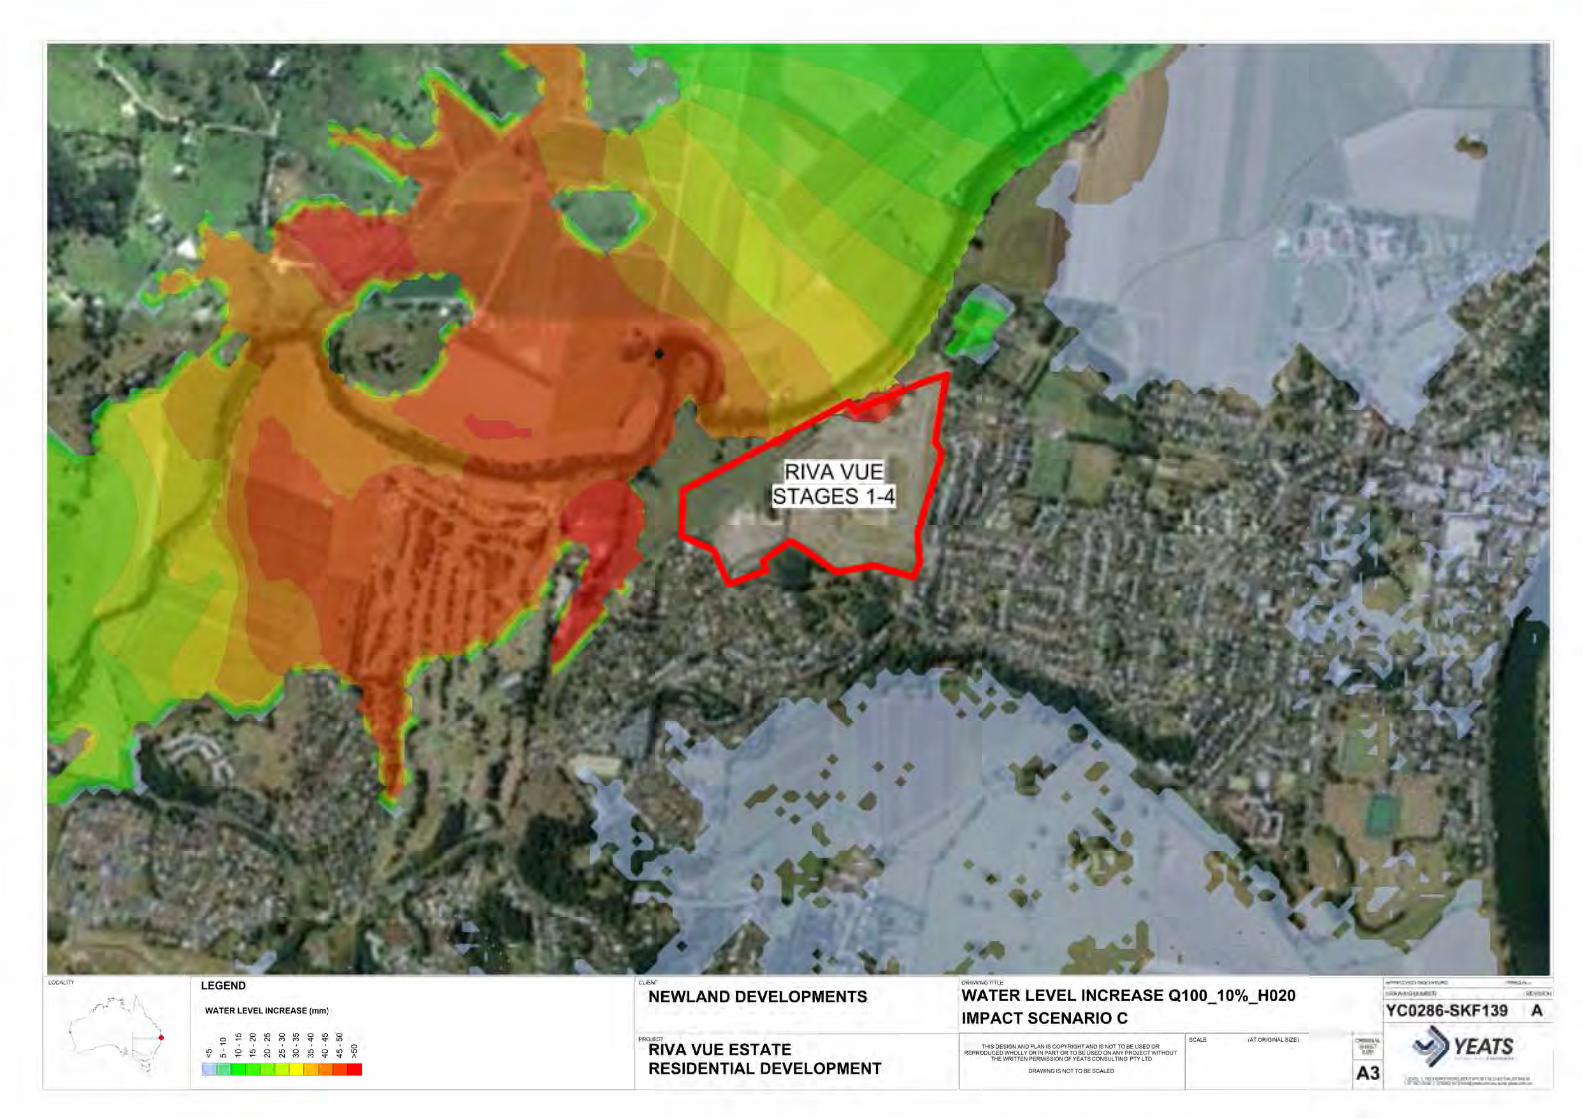
3.6 Impact Scenario C
The following section of the report has identified the changes in the flood characteristics
associated with the construction of Riva Vue Estate (Stages 1-4), Rous River Way extension and
filling of Lot 22 above the Q100 flood level.
3.6.1 Changes to Flood Depths - Impact Scenario C
The most noticeable change on average to the flood level for this scenario was recorded at
Flood_ Pt5, adjacent to Riva Vue Stages 1-4. The changes in flood depths in the vicinity of the
development, due to the effect of the above filling activities, are presented in Table 3.8 below:
Table 3.8 Change in Flood Depth - Impact Scenario C
ARI Change in Flood Depth at
Flood_Pt1
Change in Flood Depth at
Flood_Pt3
Change in Flood Depth at
Flood_Pt5
Q005_H005 +26.4mm +7.8mm +25.5mm
Q005_H100 +26.9mm +10.3mm +26.4mm
Q005_H100_91cm
+25.4mm +16.7mm +28.5mm
Q020_H020 +24.2mm +44.8mm +33.9mm
Q100_H020 +40.7mm +38.1mm +42.3mm
Q100_10% +44.0mm +31.9mm +40.5mm
The changes in flood depths occurring in Impact Scenario C in the areas surrounding Riva Vue
Estate are shown graphically on Drawing YC0291-SKF134-139 in Appendix C. These drawings
demonstrate that Impact Scenario C will cause flood depths to increase by more than 50mm on
the land adjacent to Lot 22 and the rural land to the north and west of the development.
Options available to reduce the impact of the extension of Rous River Way on flood levels in the
surrounding area include reducing the flood immunity of the road, providing additional flow
mechanisms under the road and preventing urban development over Lot 22.
3.6.2 Changes to Flood Velocity - Impact Scenario C
The most noticeable change on average to the flood velocity for this scenario was recorded at
Flood_Pt3, downstream of Riva Vue Stages 1-4. The changes in flood velocity in the vicinity of
the development, due to the effect of the above filling activities, are presented in Table 3.9
below:
Table 3.9 Change in Flood Velocity - Impact Scenario C
ARI Change in Flood Velocity at
Flood_Pt1
Change in Flood Velocity at
Flood_Pt3
Change in Flood Velocity
at Flood_Pt5
Q005_H005 +0.0052m/s +0.0217m/s -0.1045m/s
Q005_H100 +0.0032m/s +0.0347m/s -0.1044m/s

Rous River – Flood Study Page 15 Ref: YC0291 Flood Study R007.docx
Q005_H100_91cm
-0.0281m/s +0.0407m/s -0.1076m/s
Q020_H020 -0.0077m/s -0.0478m/s -0.1949m/s
Q100_H020 +0.0039m/s +0.0823m/s -0.2949m/s
Q100_10% +0.0042m/s +0.0011m/s -0.3153m/s
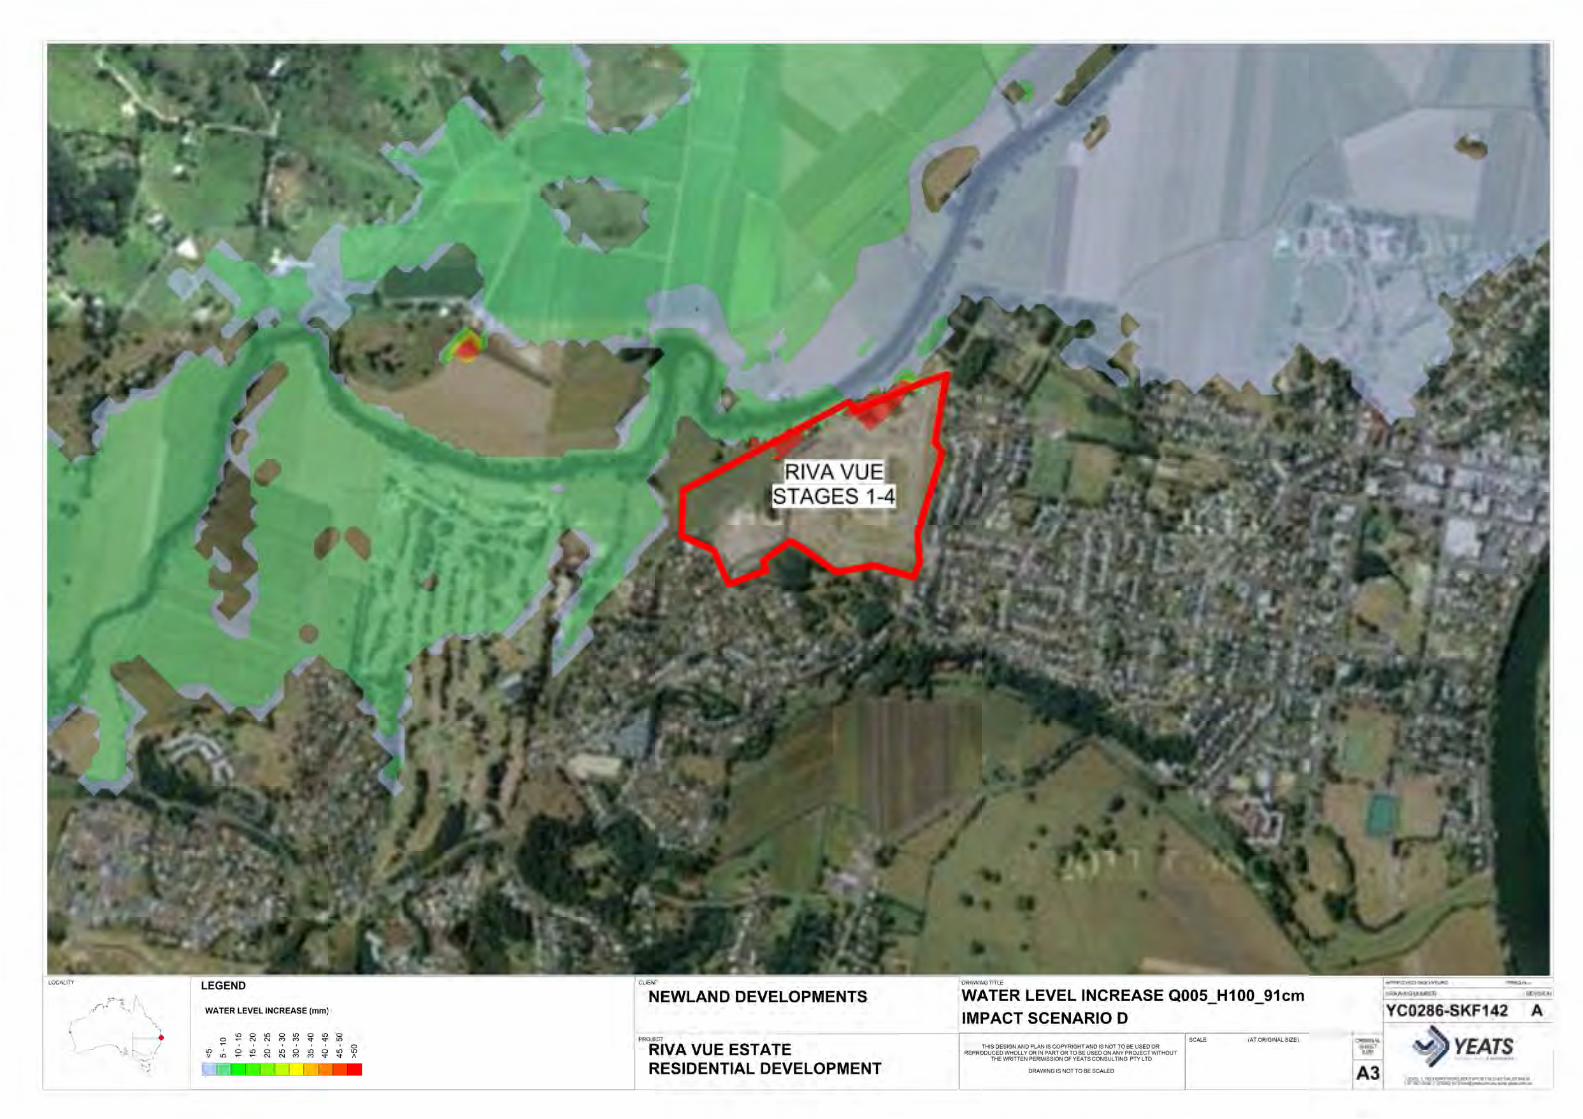
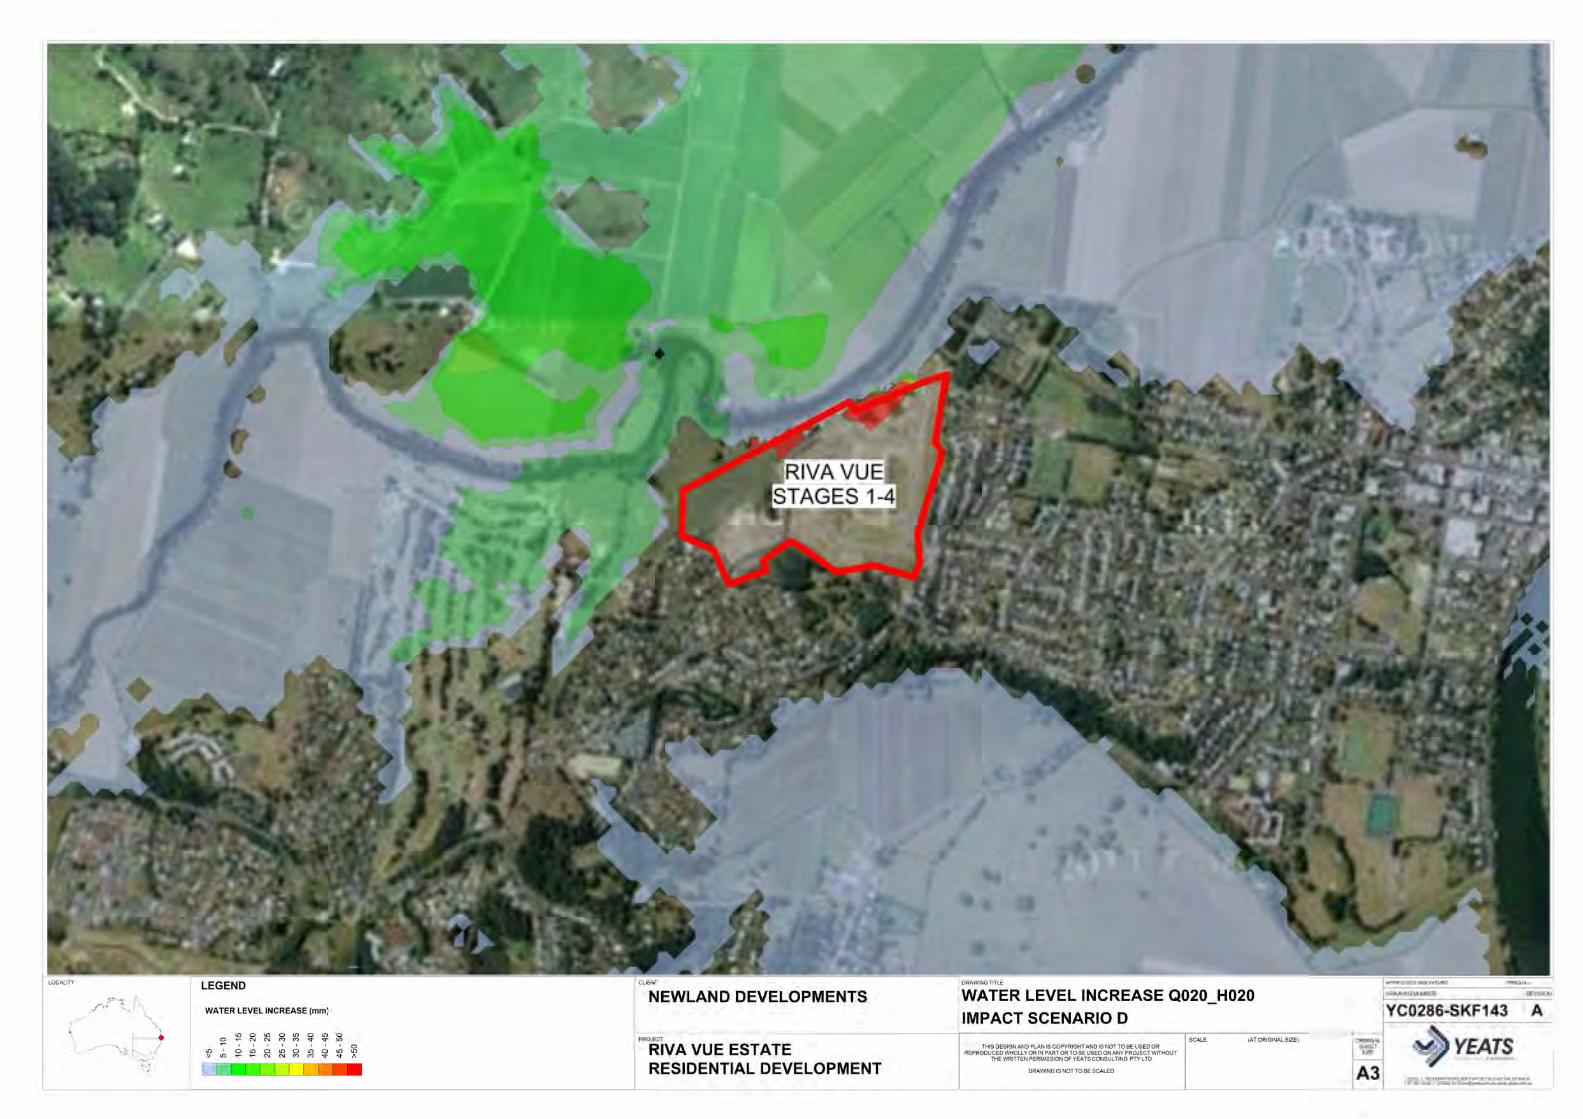
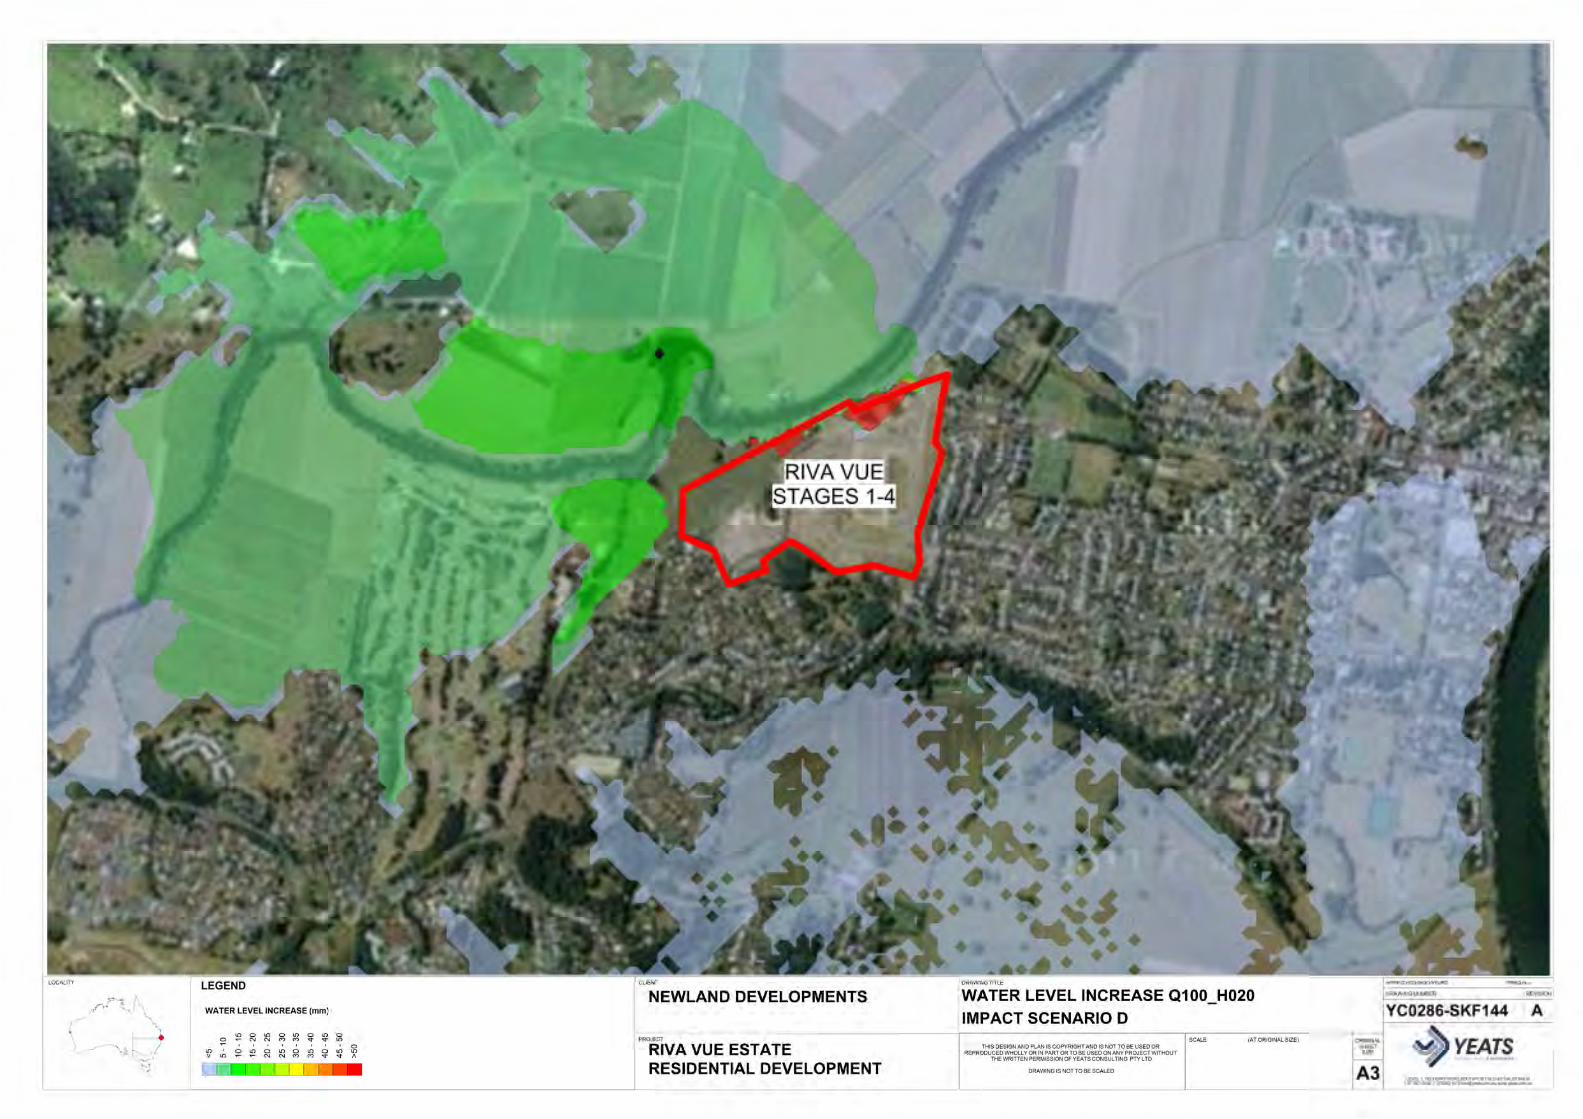
3.7 Impact Scenario D
The following section of the report has identified the changes in the flood characteristics
associated with the construction of Riva Vue Estate (Stages 1-4), Rous River Way extension and
filling of Lot 22 above the Q100 flood level compared to Impact scenario B.
3.7.1 Changes to Flood Depths - Impact Scenario D
The most noticeable change on average to the flood level for this scenario was recorded at
Flood_ Pt1 which is located upstream of Riva Vue Stages 1- 4. The changes in flood depths in
the vicinity of the development, due to the effect of the above filling activities, are presented in
Table 3.10 below:
Table 3.10 Change in Flood Depth - Impact Scenario D
ARI Change in Flood Depth at
Flood_Pt1
Change in Flood Depth at
Flood_Pt3
Change in Flood Depth at
Flood_Pt5
Q005_H005 +7.0mm +2.4mm +5.6mm
Q005_H100 +7.9mm +2.3mm +8.1mm
Q005_H100_91cm
+6.4mm +4.4mm +7.2mm
Q020_H020 +4.2mm +9.8mm +4.6mm
Q100_H020 +8.8mm +6.0mm +8.6mm
Q100_10% +10.3mm +6.3mm +9.9mm
The changes in flood depths occurring in Impact Scenario D in the areas surrounding Riva Vue
Estate are shown graphically on Drawing YC0291-SKF140-145 in Appendix C. These drawings
demonstrate that although the earthworks associated with Stages 1-4 of the Riva Vue Estate
cause an increase in flood depths from Impact Scenario B in the vicinity of the development, the
increase is generally less than 15mm and occurs over the rural land to the north and west of the
development.
3.7.2 Changes to Flood Velocity - Impact Scenario D
The most noticeable change on average to the flood velocity for this scenario was recorded at
Flood_Pt3, downstream of Riva Vue Stages 1-4. The changes in flood velocity in the vicinity of
the development, due to the effect of the above filling activities, are presented in Table 3.11
below:
Table 3.11 Change in Flood Velocity - Impact Scenario D
ARI Change in Flood Velocity at
Flood_Pt1
Change in Flood Velocity at
Flood_Pt3
Change in Flood Velocity
at Flood_Pt5
Q005_H005 +0.0058m/s +0.0060m/s +0.0026m/s
Q005_H100 -0.0046m/s +0.0080m/s +0.0021m/s
Q005_H100_91cm
-0.0337m/s +0.0078m/s +0.0027m/s

Rous River – Flood Study Page 16 Ref: YC0291 Flood Study R007.docx
Q020_H020 -0.0135m/s -0.0094m/s +0.0026m/s
Q100_H020 +0.0009m/s +0.0781m/s +0.0036m/s
Q100_10% +0.0009m/s -0.0073m/s +0.0050m/s
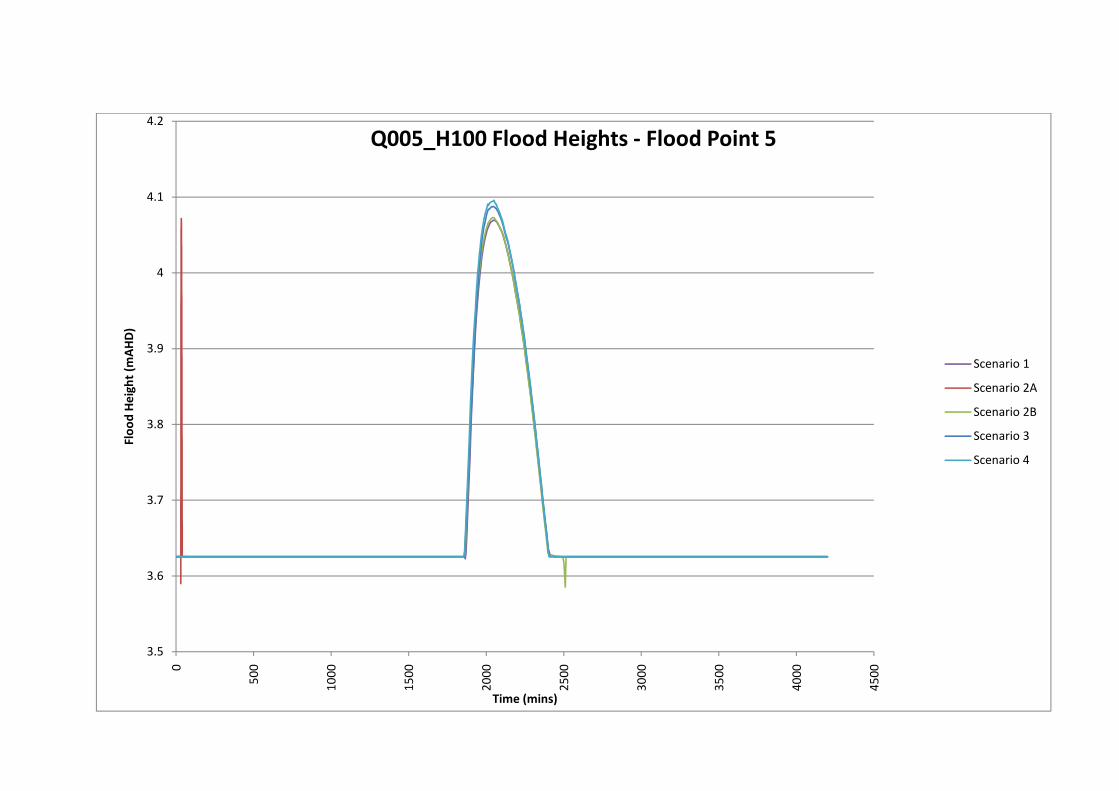
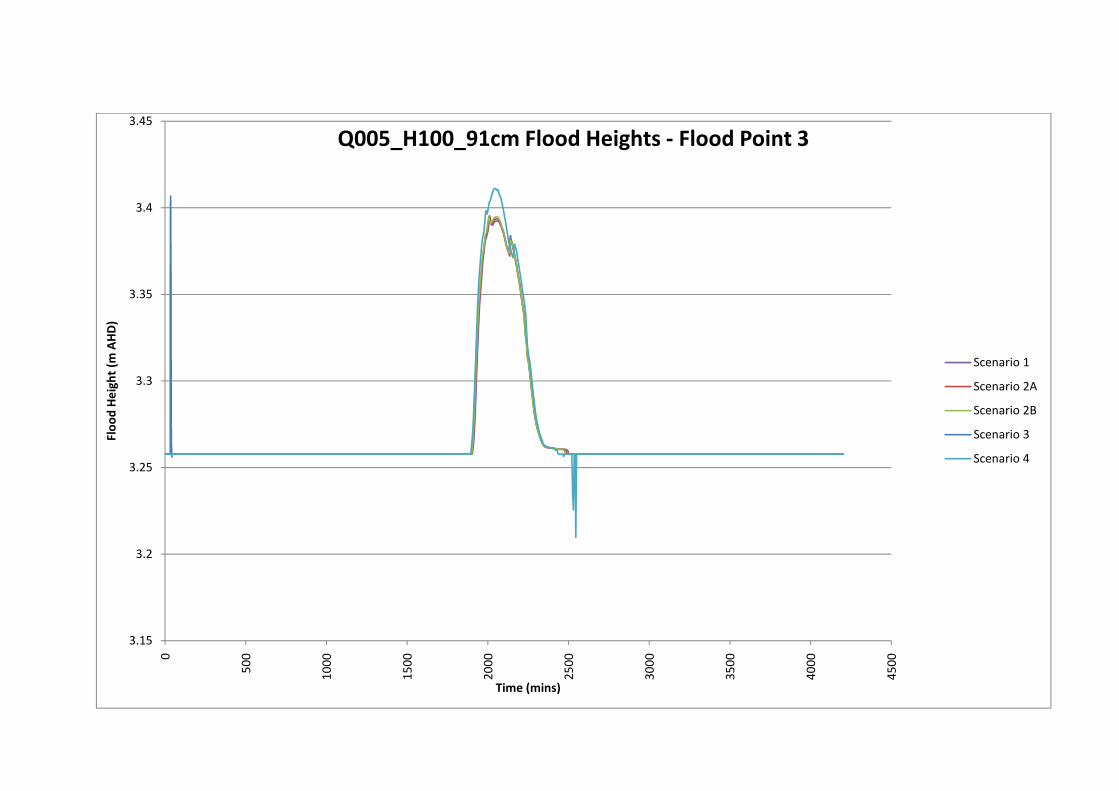
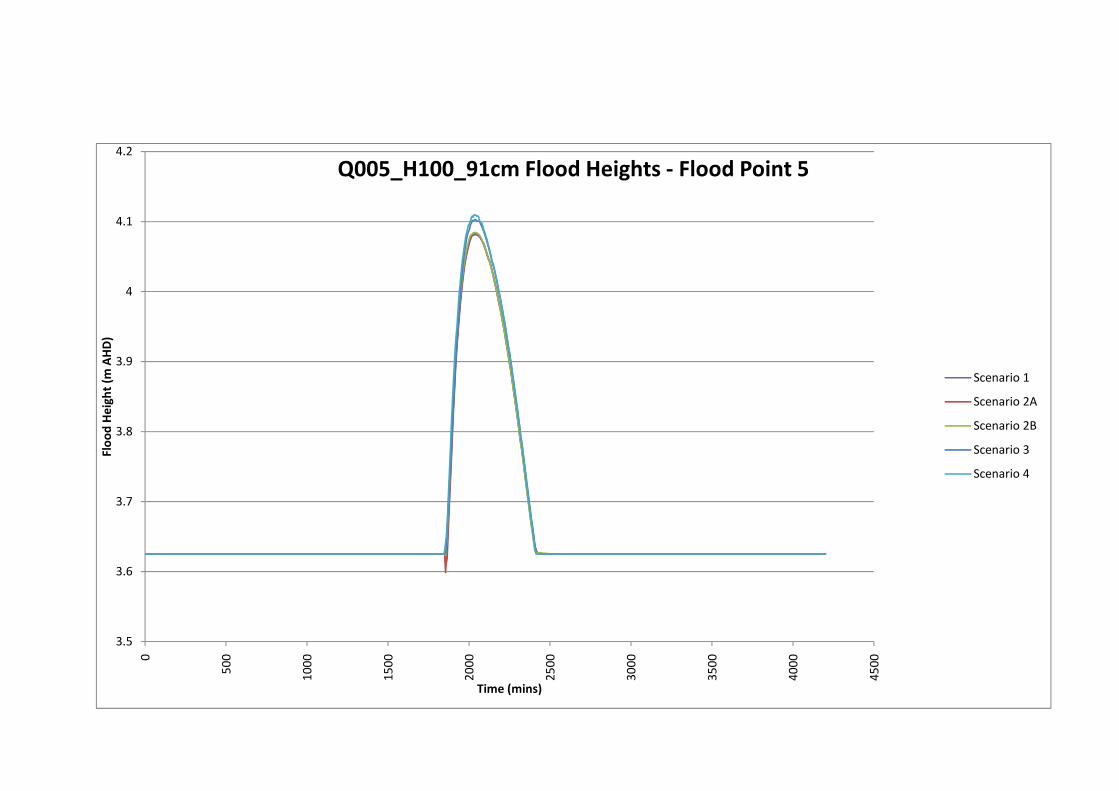
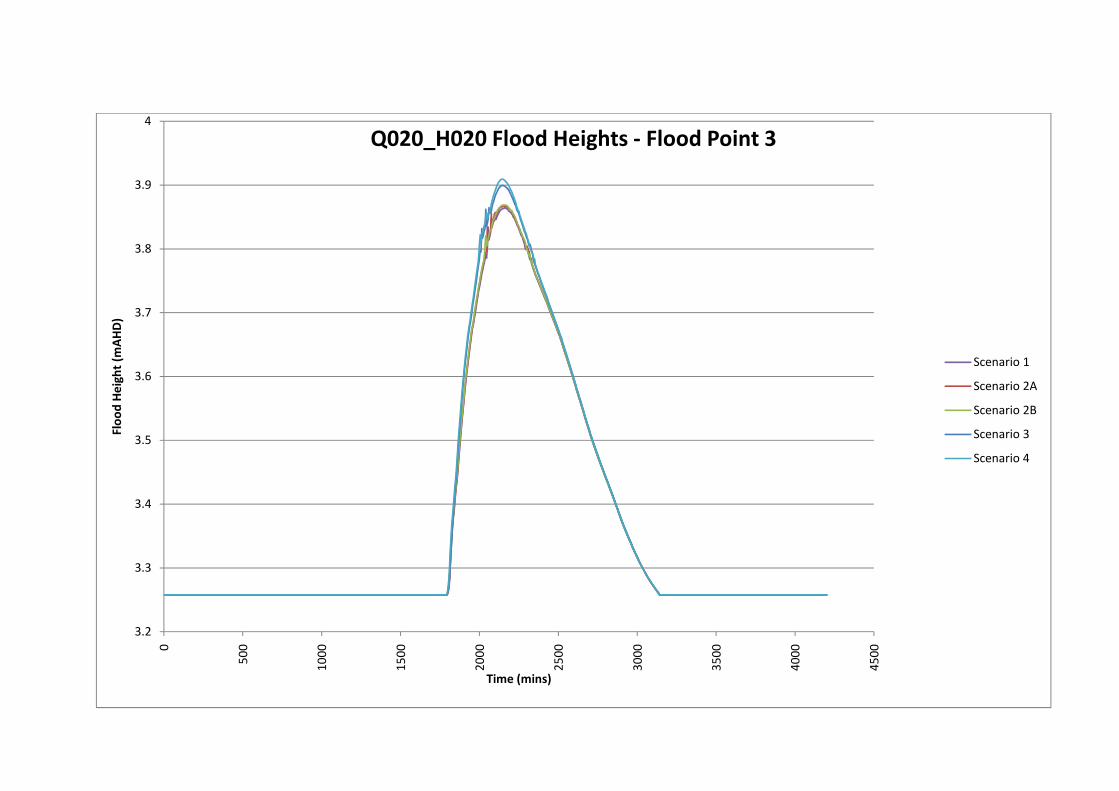
3.8 Changes to Flood Duration - All Development Scenarios
The modelling showed no significant increase in the duration of flood inundation at any of the
reporting points for all of the storm events and development scenarios. Please refer to the
graphs in Appendix D for details.
Rous River – Flood Study Page 17 Ref: YC0291 Flood Study R007.docx
4 Trunk Drainage Infrastructure Analysis
In the Memorandum Of Understanding between TSC and the developer, it is noted that the
existing open drain in the south-western corner of the site is not functioning as intended. This
has led to water ponding within the channel leading to issues such as odours, boggy grounds
etc. that have been the focus of complaints from current residents. A detailed analysis of the
existing culvert as well as the proposed channel where undertaken and detailed within ‘Section
4’ of the ‘Conceptual Site Based Stormwater Management Plan’ by Yeats Consulting. Please
refer to this report for further details.

Rous River – Flood Study Page 18 Ref: YC0291 Flood Study R007.docx
5 Summary and Conclusions
This report has addressed the requirements outlined in the Tweed Shire Council Memorandum
of Understanding letter dated December 2010, and has identified the potential impacts from the
proposed Stage 4 of the Riva Vue Estate residential development located at Barnby Street,
Murwillumbah.
This report has the following components:
• Identified the various scenarios of filling related to the above development;
• Analysis of the various scenarios and their impacts external to the development in three
different locations utilising the information provided by Tweed Shire Council and the
TUFLOW hydraulic software; and
• Tabulating the results of the various scenarios for the listed design events;
The modelling demonstrates that stages 1-3 have minimal impacts on the flood levels
surrounding the site, and negligible affects approximately 1km upstream and downstream of the
site. It also demonstrates that while the proposed stage 4 will cause flood levels to increase in
the areas surrounding the site, the increase will be less than 15mm and occurs over rural land
to the north and the golf course and rural land to the west of the Riva Vue Estate. These
increases are therefore less than the acceptable limit of 15mm over urban land and 50mm over
rural land as set down by Tweed Shire Council officers at a meeting on the 26th of September
2005.
The main contributing scenario for impacts to the flood levels is the connection of Rous River
Way to Queensland / Cane Road and filling of Lot 22 above the Q100 flood level. This is
demonstrated in Impact Scenario B, with results showing an increase in flood depths of more
than 50mm over the land adjacent to Lot 22. The alignment of the Rous River adjacent to Lot
22 exposes much of that lot to inundation, as in effect it forms part of a floodway. When
viewing flood maps from the scenarios that do not include filling within Lot 22, it is clear that
the entire lot is inundated by flood water for all storm events. Therefore filling within Lot 22 will
result in significant increases in flood levels over the surrounding land.
In summary, this report concludes that, for all scenarios, excepting connection of Rous River
Way and filling of Lot 22, rezoning and subsequent filling of Stage 4 of Riva Vue Estate as
proposed will not have significant adverse impacts and would not be inconsistent with Council's
adopted acceptable limits for flood level increases.

Rous River – Flood Study Page 19 Ref: YC0291 Flood Study R007.docx
6 References
Institution of Engineers, Australia (2001) “Australian Rainfall and Runoff – A guide to flood
estimation”.
Neville Jones & Associates (1992) “Queensland Urban Drainage Design Manual (QUDM)”, Edition
2.

Appendix A
Study Area Locality Plan


Appendix B
Flood Point Locations
Appendix C
Flood Extents Mapping


Appendix D
Flood Event Graphs

0
0.5
1
1.5
2
2.5
3
3.5
4
4.5
0
50
0
10
00
15
00
20
00
25
00
30
00
35
00
40
00
45
00
Flo
od
He
igh
t (m
AH
D)
Time (mins)
Q005_H005 Flood Heights - Flood Point 1
Scenario 1
Scenario 2A
Scenario 2B
Scenario 3
Scenario 4

3.24
3.26
3.28
3.3
3.32
3.34
3.36
3.38
3.4
3.42
0
50
0
10
00
15
00
20
00
25
00
30
00
35
00
40
00
45
00
Flo
od
He
igh
t (m
AH
D)
Time (mins)
Q005_H005 Flood Heights - Flood Point 3
Scenario 1
Scenario 2A
Scenario 2B
Scenario 3
Scenario 4

3.5
3.6
3.7
3.8
3.9
4
4.1
4.2
0
50
0
10
00
15
00
20
00
25
00
30
00
35
00
40
00
45
00
Flo
od
He
igh
t (m
AH
D)
Time (mins)
Q005_H005 Flood Heights - Flood Point 5
Scenario 1
Scenario 2A
Scenario 2B
Scenario 3
Scenario 4

0
0.5
1
1.5
2
2.5
3
3.5
4
4.5
0
50
0
10
00
15
00
20
00
25
00
30
00
35
00
40
00
45
00
Flo
od
He
igh
t (m
AH
D)
Time (mins)
Q005_H100 Flood Heights - Flood Point 1
Scenario 1
Scenario 2A
Scenario 2B
Scenario 3
Scenario 4

3.24
3.26
3.28
3.3
3.32
3.34
3.36
3.38
3.4
3.42
0
50
0
10
00
15
00
20
00
25
00
30
00
35
00
40
00
45
00
Flo
od
He
igh
t (m
AH
D)
Time (mins)
Q005_H100 Flood Heights - Flood Point 3
Scenario 1
Scenario 2A
Scenario 2B
Scenario 3
Scenario 4
3.5
3.6
3.7
3.8
3.9
4
4.1
4.2
0
50
0
10
00
15
00
20
00
25
00
30
00
35
00
40
00
45
00
Flo
od
He
igh
t (m
AH
D)
Time (mins)
Q005_H100 Flood Heights - Flood Point 5
Scenario 1
Scenario 2A
Scenario 2B
Scenario 3
Scenario 4

0
0.5
1
1.5
2
2.5
3
3.5
4
4.5
0
50
0
10
00
15
00
20
00
25
00
30
00
35
00
40
00
45
00
Flo
od
He
igh
t (m
AH
D)
Time (mins)
Q005_H100_91cm Flood Heights - Flood Point 1
Scenario 1
Scenario 2A
Scenario 2B
Scenario 3
Scenario 4
3.15
3.2
3.25
3.3
3.35
3.4
3.45
0
50
0
10
00
15
00
20
00
25
00
30
00
35
00
40
00
45
00
Flo
od
He
igh
t (m
AH
D)
Time (mins)
Q005_H100_91cm Flood Heights - Flood Point 3
Scenario 1
Scenario 2A
Scenario 2B
Scenario 3
Scenario 4
3.5
3.6
3.7
3.8
3.9
4
4.1
4.20
50
0
10
00
15
00
20
00
25
00
30
00
35
00
40
00
45
00
Flo
od
He
igh
t (m
AH
D)
Time (mins)
Q005_H100_91cm Flood Heights - Flood Point 5
Scenario 1
Scenario 2A
Scenario 2B
Scenario 3
Scenario 4

0
0.5
1
1.5
2
2.5
3
3.5
4
4.5
5
0
50
0
10
00
15
00
20
00
25
00
30
00
35
00
40
00
45
00
Flo
od
He
igh
ts (
mA
HD
)
Time (mins)
Q020_H020 Flood Heights - Flood Point 1
Scenario 1
Scenario 2A
Scenario2B
Scenario 3
Scenario 4
3.2
3.3
3.4
3.5
3.6
3.7
3.8
3.9
4
0
50
0
10
00
15
00
20
00
25
00
30
00
35
00
40
00
45
00
Flo
od
He
igh
t (m
AH
D)
Time (mins)
Q020_H020 Flood Heights - Flood Point 3
Scenario 1
Scenario 2A
Scenario 2B
Scenario 3
Scenario 4
0
0.5
1
1.5
2
2.5
3
3.5
4
4.5
5
0
50
0
10
00
15
00
20
00
25
00
30
00
35
00
40
00
45
00
Flo
od
He
igh
t (m
AH
D)
Time (mins)
Q020_H020 Flood Heights - Flood Point 5
Scenario 1
Scenario 2A
Scenario 2B
Scenario 3
Scenario 4

0
1
2
3
4
5
6
0
50
0
10
00
15
00
20
00
25
00
30
00
35
00
40
00
45
00
Flo
od
he
igh
t (m
AH
D)
Time (mins)
Q100_H020 Flood Height - Flood Point 1
Scenario 1
Scenario 2A
Scenario 2B
Scenario 3
Scenario 4

0
0.5
1
1.5
2
2.5
3
3.5
4
4.5
5
0
50
0
10
00
15
00
20
00
25
00
30
00
35
00
40
00
45
00
Flo
od
He
igh
t (m
AH
D)
Time (mins)
Q100_H020 Flood Height - Flood Point 3
Scenario 1
Scenario 2A
Scenario 2B
Scenario 3
Scenario 4
0
1
2
3
4
5
6
0
50
0
10
00
15
00
20
00
25
00
30
00
35
00
40
00
45
00
Flo
od
He
igh
t (m
AH
D)
Time (mins)
Q100_H020 Flood Height - Flood Point 5
Scenario 1
Scenario 2A
Scenario 2B
Scenario 3
Scenario 4

0
1
2
3
4
5
6
0
50
0
10
00
15
00
20
00
25
00
30
00
35
00
40
00
45
00
Flo
od
he
igh
t (m
AH
D)
Time (mins)
Q100_10%_H020 Flood Height - Flood Point 1
Scenario 1
Scenario 2A
Scenario 2B
Scenario 3
Scenario 4
0
1
2
3
4
5
6
0
50
0
10
00
15
00
20
00
25
00
30
00
35
00
40
00
45
00
Flo
od
He
igh
t (m
AH
D)
Time (mins)
Q100_10%_H020 Flood Height - Flood Point 3
Scenario 1
Scenario 2A
Scenario 2B
Scenario 3
Scenario 4
0
1
2
3
4
5
6
0
50
0
10
00
15
00
20
00
25
00
30
00
35
00
40
00
45
00
Flo
od
He
igh
t (m
AH
D)
Time (mins)
Q100_10%_H020 Flood Height - Flood Point 5
Scenario 1
Scenario 2A
Scenario 2B
Scenario 3
Scenario 4