Embed Size (px)
Citation preview

PoPulation and develoPment Review 36(4 ) : 6 5 5 – 6 9 2 (d ecembeR 2 0 1 0 ) 655
Routes to Low Mortality in Poor Countries Revisited
Randall Kuhn
a quarter century ago, Population and Development Review published a highly influential article by John caldwell titled “Routes to low mortality in Poor countries” (caldwell 1986). writing at the end of an era of unparalleled mortality improvements in poor countries, caldwell sought to reinvigorate the international health paradigm by looking at the successes of three coun-tries (china, costa Rica, and Sri lanka) and one indian state (Kerala) that achieved exceptional success in lowering mortality at low levels of income. Just as memorably, he framed his analysis with an illustrative list of the world’s superior and poor health achievers, based on comparing a country’s ranking on health indicators to its ranking on income per head. the article was transformative in many respects. while best known for demonstrating the powerful role of women’s education in health outcomes, it also described in vivid historical detail the importance of health systems and social consensus during breakthrough periods of health transition. to mark the twenty-fifth anniversary of caldwell’s achievement, this article examines the fates of caldwell’s original exceptional achievers and charts modern routes to low mortality.
the past quarter century has seen further dramatic change in interna-tional health. by 1986, the post–world war ii epidemiologic transition had decelerated, but no country had yet recorded a sustained reversal in trends in life expectancy. the next two decades saw three unique patterns of rever-sal relating to (1) conflict, especially in sub-Saharan africa; (2) Hiv/aidS in Southern africa; and (3) non-communicable disease and injuries in the former Soviet union (wilson 2001; mcmichael et al. 2004; moser et al. 2005). the 2000 millennium declaration ushered in a period of programmatic action against disease embodied in the united nations millennium development Goals. this effort aimed to harness the untapped economic potential of the world’s poor and was rebranded under the term “global health” (mcmichael and beaglehole 2000; Sachs 2001). Progress has been swift, with rapid spread

656 r o u t e s t o L o w M o r ta L i t y i n P o o r c o u n t r i e s r e v i s i t e d
of antiretroviral therapies (aRts) for Hiv/aidS, declining child and maternal mortality, and reversal of some mortality setbacks (Reniers et al. 2009; Raja-ratnam et al. 2010a). meanwhile, many poor countries have maintained their postwar trajectories of persistent mortality reduction (Hughes et al. 2010).
amid this progress, caldwell’s concerns from an earlier era have re-gained salience just a decade into the global health era. targeted interventions could soon run their course, as Hiv/aidS and preventable diseases give way to a daunting array of life-course health issues (marmot 2005; beaglehole et al. 2008). the new uS Global Health initiative calls for participatory, sus-tainable, and rights-based health systems, but few scalable models exist and history is littered with failures. we thus find ourselves at a propitious time for revisiting the routes to low mortality in poor countries.
this article undertakes a follow-up, a replication, and a renewal of caldwell’s work. i begin by exploring the subsequent economic fates of the original exceptional achievers. i then develop a new list of superior and poor health achievers, focusing on life expectancy rather than infant mortality. Finally, i explore the pathways to exceptional achievement. Given the pau-city of theory and indicator data in 1986, caldwell’s analysis was necessarily inductive, exhaustive, and focused on qualitative relationships. this article builds on hypotheses developed by caldwell and others and incorporates a wider range of quantitative indicators. i begin by charting the influence of caldwell’s article and our subsequent understanding of the distal (i.e., non-proximate) determinants of health.
The hallmarks of exceptional achievers
the background begins with the work of the author himself. caldwell is a prolific and peripatetic scholar. neither a theorist nor an empiricist, he popu-larized new hypotheses that others would test for decades. a review of the 20 most widely cited articles in Population and Development Review finds caldwell as sole author of three and lead author on two others (caldwell 1976, 1980, 1986; caldwell and caldwell 1987; caldwell et al. 1989). with a number of coauthors, most notably his wife Pat, he produced a prolific body of research on family change and mortality in South india, nigeria, and bangladesh. a joke heard in bangladesh held that “Jack caldwell learns more on the taxi ride from the airport than you or i learn in a five-year survey.” caldwell’s unique methods and aggressive hypothesis-formation inspired demographers to pursue research that mixed qualitative and quantitative methods, accounted for contextual forces, and addressed historical and political narratives. while caldwell is perhaps most associated with the wealth flows model of fertility, “Routes to low mortality” had an equally enduring influence.
Such an influential work did not emerge in a vacuum, but rather in a period of paradigmatic transition in studies of mortality. in 1971, abdel

r a n d a L L K u h n 657
omran described the shape of the epidemiologic transition from high levels of preventable childhood, maternal, and infectious mortality risks toward diseases of adulthood (omran 1971). although omran did not specify the exact determining forces behind the transition, a growing body of evidence had begun to demonstrate the significant role of nonincome factors. in 1975, Samuel Preston found that only 10–25 percent of historic variation in life expectancy could be attributed directly to income variation (Preston 1975). these findings stood in sharp contrast to those of thomas mcKeown, who had attributed the historic english mortality decline to economic conditions rather than medicine or public health (mcKeown and Record 1962; mcKeown 1976). while measures of gross domestic product per capita (henceforth re-ferred to simply as income) remain the single best predictors of health at any single point in time (Pritchett and Summers 1996), caldwell demonstrated the importance of noneconomic factors, especially during breakthrough pe-riods of initial improvement.
by focusing on a country’s level of life expectancy achievement relative to its level of income, caldwell deftly captured the role of income while pro-ceeding quickly on to other factors. He began with two simple lists of superior and poor achievers, reproduced in table 1. countries were ranked separately according to income and infant mortality rate (imR). countries were assigned relative rankings on these indicators, on the basis of the difference between the imR and income rankings. countries with imR ranking 25 or more places ahead of income rank were classified as superior, and those with imR ranked 25 or more places behind income rank were poor. Relative life expectancy ranking was reported, but was not used to classify countries. although not a country, the indian state of Kerala appeared atop the list of high achievers, catalyzing a sub-field devoted to the “Kerala miracle.”
caldwell provided a laundry list of hypotheses aimed at the factors relating to superior or poor achievement. He was among the first western scholars of his era to highlight the mortality successes of Socialist countries, drawing particular attention to cuba, whose lack of income data kept it out of the official list. the list of poor achievers included numerous oil-rich states of the middle east and north africa, prompting a discussion of the potential roles of commodity wealth and islam. caldwell dismissed the possibility of a time lag whereby these countries simply had not yet spent their newfound wealth in ways that reduced mortality.
His most significant achievement came in the second half of the article, an in-depth historical and political treatment of the antecedents of superior mortality achievement in costa Rica, Sri lanka, and Kerala. He emphasized the “symbiosis between cultural and health inputs,” pointing to education as the catalyst for changes in the health system and as a complement to actual health provision. Social and political parallels between Sri lanka, Kerala, and costa Rica included substantial female autonomy, a dedication to education,

658 r o u t e s t o L o w M o r ta L i t y i n P o o r c o u n t r i e s r e v i s i t e d
an open political system, a largely civilian society without rigid class structure, and a history of egalitarianism and radicalism. amid these numerous overlap-ping correlates, caldwell traced a narrative of the beneficial synergies between health systems, poverty reduction, education, and the emergence of a political consensus around health. His conclusions diverged from those of Preston,
TabLe 1 exceptional mortality levels relative to income levels for 99 Third World countries, 1982: Rankings separated by at least 25 places as measured by infant mortality rankings: Reproduced from Caldwell (1986)
Infant Ranking Ranking mortality of infant of life rate mortality expectation expectancy Per capita (per 1,000 relative to of life at relative to GNP ($) live births) income birth (years) income
Panel a: Superior health achievers(Kerala) (160–270) (39) (+75) (66) (+73)Sri lanka 320 32 +62 69 +61china 310 67 +46 67 +61burma (now myanmar) 190 96 +39 55 +38Jamaica 1,330 10 +37 73 +32india 260 94 +36 55 +33Zaire (now congo) 190 106 +31 50 +23tanzania 280 98 +31 52 +22Kenya 390 77 +31 57 +22costa Rica 1,430 18 +27 74 +29Ghana 360 86 +26 55 +19thailand 790 51 +25 63 +14
unweighted average 501 64 +36 61 +32
Panel b: Poor health achieversoman* 6,090 123 –70 52 –57Saudi arabia* 16,000 108 –61 56 –50iran* 6,465 102 –52 60 –37libya* 8,510 95 –50 57 –47algeria* 2,350 111 –48 57 –32iraq* 6,465 73 –35 59 –39Yemen (now unified)† 500 163 –34 44 –32morocco† 870 125 –32 52 –18ivory coast† 950 119 –28 47 –37Senegal† 490 155 –27 44 –30Sierra leone† 390 190 –25 38 –25
unweighted average all poor achievers 4,462 124 –42 51 –37 *oil producers 7,647 102 –53 57 –44 †non–oil producers 640 150 –29 45 –28
SouRce: caldwell (1986).

r a n d a L L K u h n 659
mosley, and others, who suggested that culture and social systems were more important determinants of health than health systems themselves (mosley 1984; mosley and chen 1984; Preston and Haines 1991). For caldwell, in-vestments in health and education were not merely cheap and cost-effective, they served to strengthen an emerging social consensus in which continued health improvement is expected. nevertheless, caldwell himself noted the need for some degree of preexisting consensus: “there must be a broad social consensus as to the value of educational and health goals, and as to their cost, for successive governments to accept most of their adversaries’ innovations instead of nullifying them” (1986, p. 210).
caldwell never fully reconciled this causal challenge. what, if anything, could produce such a social consensus? many have hoped that health spend-ing itself could have such multiplier effects, initiating a virtuous circle of investment and consensus (Sen and drèze 1989; Gupta et al. 2002; baldacci et al. 2008). Yet health spending can just as easily lead to low quality of in-puts, bias toward preferred geographic areas, low demand for services, and a disillusioned population (Filmer and Pritchett 1999; Filmer et al. 2000). caldwell identified factors that could predispose a society toward consensus, including promotion of women’s education and autonomy. He also noted the ability of autocratic states such as cuba and china to take a vanguard route, establishing health systems by fiat, encouraging their use through control over resources, and promoting consensus through demonstration of results and vertical ideational change (bryant 1998). lacking a clear answer to this causal question, caldwell concluded his article somewhat vaguely: “what is clearest is that low mortality for all will not come as an unplanned spinoff from economic growth” (1986, p. 210).
this is where we remain today. even mainstream economists agree that mortality improvements are not the inevitable products of economic growth. Rigorous analysis of contemporary and historic data has demonstrated the impact of targeted, cost-effective health interventions (Sen 1998; cutler and miller 2005; cutler et al. 2006; Soares 2007). it is also widely accepted that an exogenous stimulus to health production via externally funded programs could generate some improvements in human capital and income, thus jus-tifying targeted investments in health (Gallup and Sachs 2001; Soares 2005; weil 2007; barham 2009). Yet our understanding of the social, political, and cultural determinants that might generate sustained improvements in health remains incomplete.
Recent years have witnessed a burgeoning literature on the distal de-terminants of health, including political, social, macroeconomic, and cultural factors (Subramanian et al. 2002; marmot 2005; lieberman 2007). this body of research has two interlinked threads. one is aimed at operationalizing the effects of individual determinants such as education, women’s autonomy, governance, inequality, and health systems factors. as i discuss in reviewing

660 r o u t e s t o L o w M o r ta L i t y i n P o o r c o u n t r i e s r e v i s i t e d
specific distal determinants of health, this effort has provided a mountain of evidence but few definitive, policy-relevant conclusions. more significant progress has been made in building caldwell’s work into a grand unifying theory of health systems, although success has come in part at the expense of policy relevance. nathanson (1996), for example, offered a framework for understanding the recurring and remarkably stable role over time of broader national norms of social organization and justice in determining health out-comes, identifying three key traits: (1) degree of state centralization, (2) pres-ence or absence of active grassroots organizations, and (3) societal emphasis on individual or collective risks.
most recently, the wHo commission on the Social determinants of Health (cSdH) offered a new framework for evaluating and addressing the social and political determinants of health (cSdH 2008). these go beyond poverty to include social interactions such as inequality, trade, and migration and their psychological consequences such as stress and depression. cSdH represents a reinterpretation of the distal determinants of health from a gen-eral set of associations to a specific set of social and political risk factors. at a policy level, cSdH creates new roles for health systems in preventing disease by addressing social inequalities and insecurities. at the same time it reopens debate about whether health systems matter at all, or whether political, social, and behavioral risk factors are more consequential (Rasanathan et al. 2009). Finally, cSdH emphasized the need for better measurement and targeting of life-course health issues that have become increasingly important amid the global epidemiologic transition.
National health indicators then and now
the post–cold war era has seen dramatic changes in the construction, measure-ment, and significance of national indicators and in the sheer number of sover-eign states. caldwell drew his list of countries from the 1984 world bank World Development Report (WDR), which included 99 lower-income, middle-income, or high-income oil-exporting countries with population greater than one million (caldwell 1986, p. 175).1 the frequent incidence of national partition, the entry of Soviet bloc countries into national indicator systems, population growth, and improved data quality for small countries resulted in a pool of 134 low- and middle-income countries in the world bank’s 2009 world development indica-tors database, which provided per capita GdP data for my study (world bank 2009).2 only three countries—Zimbabwe, Somalia, and north Korea—were excluded because of poor income data, leaving 131 countries. income measures have also changed. the 1984 WDR measured income in uS dollars. today most sources adjust income for purchasing power parity (PPP), or variations in the cost of living across countries. all income data for this study, including those for caldwell’s original achievers, use PPP adjustments.

r a n d a L L K u h n 661
Health measures come from the 2009 wHo World Health Statistics Report (wHo 2009). Recent years have seen considerable changes in the construc-tion of health measures, reflecting improved capability and changed priori-ties. in 1984 caldwell rejected world bank child death data as unreliable, unstandardized, and unadjusted for model life tables. today, the child mor-tality rate (cmR)—that is, the life table probability of dying before the fifth birthday—is a gold standard indicator of national well-being. the millennium development Goals explicitly aim to reduce cmR by two-thirds between 1990 and 2015 (murray et al. 2007; mathers and boerma 2010). cmR also shows considerably more variability than imR. in 1984, 44 of 99 countries had imR greater than 100 deaths per 1,000 live births. in 2007, only 13 out of 136 countries were at that level, but 36 countries continue to have cmR above 100 per 1,000.
a more momentous shift relates to the increased significance and mea-surement of adult mortality (Gakidou et al. 2004; Rajaratnam et al. 2010b). one measure of adult mortality that has gained increasing salience is the adult mortality rate (amR). amR, like cmR, is actually a life table probability, in this case the probability of a 15-year-old dying before age 60 (
45q
15), expressed
like cmR and imR in per 1,000 terms (wHo 2009). Recent versions of the un Population division estimates, Global burden of disease Study, and World Health Statistics Report have reported amR estimates constructed from a combination of improved survey and death registration data, sibling reports, intercensal estimation, model life tables, and Hiv prevalence assumptions, although each estimate still depends in some way on maintaining correlations between amR and cmR. a recent study in The Lancet incorporated further corrections for coverage bias in sibling mortality reports (Rajaratnam et al. 2010b). amR has also been used as an indicator of survival uncertainty in modeling the economic costs of mortality (de waal 2003; weil 2007).
Routes to low mortality today require successful reductions in amR as well as cmR. in 1984, cmR accounted for the great majority of longitudinal improvements and cross-national variations in life expectancy, but this is no longer the case. to gauge the relative importance of mortality indicators, i used life tables from the wHo 2006 series to adjust each country’s imR, cmR, and amR to the current levels observed for costa Rica.3 imR adjust-ment increased the unweighted average life expectancy by 2.2 years (from 63.9 to 66.1 years), cmR added 3.2 years (to 67.1 years), and amR adjust-ment added 4.6 years (to 68.5). the rise in the significance of adult mortality would be even more pronounced when looking at population-based, rather than life table, mortality given the aging of the global population. From a policy standpoint, continued short-term focus on cmR over amR remains justified. the 0–4-year age range provides a narrower target than 15–49 years, and many low-cost interventions are known to reduce cmR (bryce et al. 2005; boschi-Pinto et al. 2010). nonetheless, a life-course perspective is
662 r o u t e s t o L o w M o r ta L i t y i n P o o r c o u n t r i e s r e v i s i t e d
critical for understanding the distal determinants of health. this analysis of modern health outliers therefore addresses relative life expectancy rankings and explores the unique contributions of cmR and amR. but first i revisit caldwell’s original outliers.
The original outliers: Where are they now?
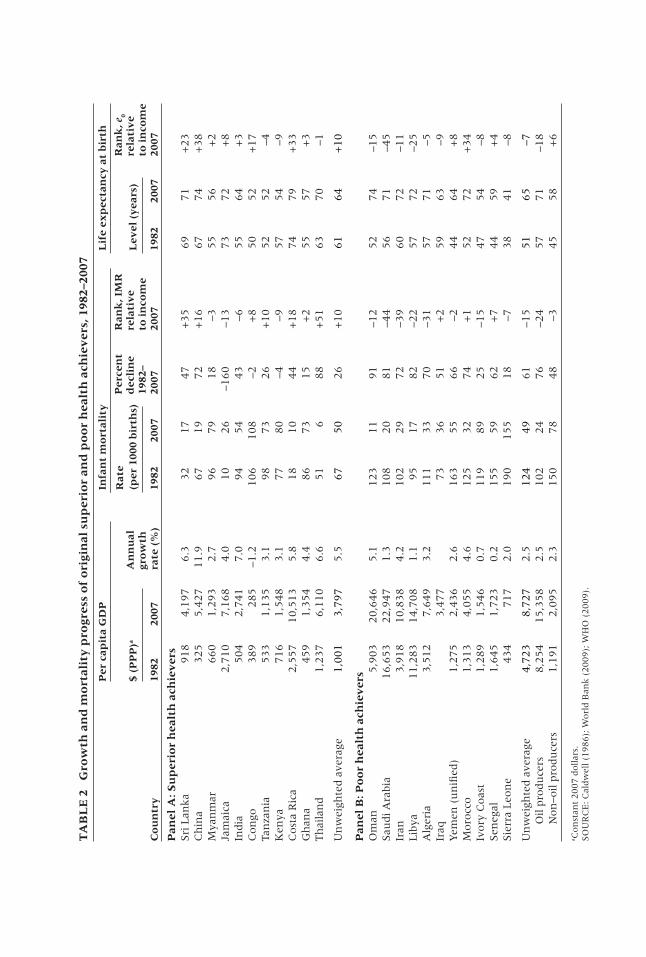
a look back at the original superior and poor health achievers offers insight into the potential economic impacts of health, the magnitude of sociodemo-graphic convergence, and the challenge of remaining on a list of exceptional achievers at two points in time. the first three columns of table 2 look at change over time in per capita GdP.4 in 1982, superior achievers had income of $1,001, compared to $4,723 for poor achievers (both in constant 2007 dollars). this income gap closed considerably over the next 25 years as supe-rior achievers vastly outperformed poor achievers. Superior achievers saw a four-fold increase in income to $3,797 per person (in constant 2007 dollars). their 5.5 percent annualized growth rate was well above the world bank’s low-income-country average of 3.0 percent, even though congo actually saw declining growth. Poor-achiever income barely doubled to $8,727, or a 2.5 percent annualized growth rate. the inclusion of iraq would have fur-ther hindered poor-achiever growth. even the poor achiever with the fastest growth, oman (5.1 percent), still fell below the superior-achiever average. it is impossible to ascertain whether the strong economic growth of superior health achievers reflects a causal pathway from health to growth or merely a tendency for some countries to produce good health and growth outcomes. the achievements of these countries are nonetheless impressive and reinforce a growing consensus that high levels of survival have positive economic im-pacts (Sachs 2001; weil 2007; Hughes et al. 2010).
Just as superior achievers closed the income gap, so poor achievers narrowed the mortality gap. Poor-achiever imR fell 61 percent, from 124 deaths per 1,000 births to just 49. average imR rank relative to income improved from –42 out of 99 countries in 1982 to –15 out of 131 in 2007. overall success came in spite of the faltering progress of three conflict-affected countries—iraq, ivory coast, and Sierra leone. oil producers saw particular progress, with imR declining 76 percent, from 102 to 24 per 1,000. For the most part, oil states did spend their way out of the poorest relative health achievement, although even today their imR rankings remain somewhat lower than their income rankings.
Superior achievers, on the other hand, saw only a 26 percent reduction in infant mortality rate, from 67 to 50 deaths per 1,000 births. this included imR reversals in congo, Kenya, and Jamaica. in the two large countries, china saw a further reduction of 72 percent (from 67 to 19 per 1,000) but india’s imR fell by only 43 percent (from 94 to 54). taking into account
Ta
bL
e 2
G
row
th a
nd
mo
rtal
ity
pro
gres
s o
f o
rigi
nal
su
per
ior
and
po
or
hea
lth
ach
iev
ers,
198
2–20
07
P
er c
apit
a G
DP
Infa
nt
mo
rtal
ity
L
ife
exp
ecta
ncy
at
bir
th
Rat
e
Per
cen
t R
ank
, IM
R
Ran
k, e
0
$ (P
PP
)a
an
nu
al
(per
100
0 b
irth
s)
dec
lin
e re
lati
ve
Lev
el (
yea
rs)
rela
tiv
e
gro
wth
19
82–
to i
nco
me
to i
nco
me
Co
un
try
19
82
2007
ra
te (
%)
1982
20
07
2007
20
07
1982
20
07
2007
Pan
el a
: Su
per
ior
hea
lth
ach
iev
ers
Sri
lan
ka
918
4,1
97
6
.3
32
1
7
47
+
35
6
9
71
+
23
ch
ina
325
5,4
27
1
1.9
6
7
19
7
2
+1
6
67
7
4
+3
8m
yan
mar
660
1,2
93
2
.7
96
7
9
18
–3
5
5
56
+
2Ja
mai
ca
2,7
10
7,1
68
4
.0
10
2
6
–16
0
–13
7
3
72
+
8in
dia
504
2,7
41
7
.0
94
5
4
43
–6
5
5
64
+
3c
on
go
389
28
5
–1.2
1
06
1
08
–2
+
8
50
5
2
+1
7ta
nza
nia
533
1,1
35
3
.1
98
7
3
26
+
10
5
2
52
–4
Ken
ya
716
1,5
48
3
.1
77
8
0
–4
–9
57
5
4
–9c
ost
a R
ica
2,5
57
10,5
13
5
.8
18
1
0
44
+
18
7
4
79
+
33
Gh
ana
459
1,3
54
4
.4
86
7
3
15
+
2
55
5
7
+3
th
aila
nd
1,2
37
6,1
10
6
.6
51
6
8
8
+5
1
63
7
0
–1
un
wei
ghte
d a
vera
ge
1,0
01
3,7
97
5
.5
67
5
0
26
+
10
6
1
64
+
10
Pan
el b
: Po
or
hea
lth
ach
iev
ers
om
an
5,9
03
20,6
46
5
.1
12
3
11
9
1
–12
5
2
74
–1
5Sau
di a
rabi
a 16,6
53
22,9
47
1
.3
10
8
20
8
1
–44
5
6
71
–4
5ir
an
3,9
18
10,8
38
4
.2
10
2
29
7
2
–39
6
0
72
–1
1lib
ya
11,2
83
14,7
08
1
.1
95
1
7
82
–2
2
57
7
2
–25
alg
eria
3,5
12
7,6
49
3
.2
11
1
33
7
0
–31
5
7
71
–5
iraq
3,4
77
73
3
6
51
+
2
59
6
3
–9Yem
en (
un
ified
) 1,2
75
2,4
36
2
.6
16
3
55
6
6
–2
44
6
4
+8
moro
cco
1,3
13
4,0
55
4
.6
12
5
32
7
4
+1
5
2
72
+
34
ivory
coas
t 1,2
89
1,5
46
0
.7
11
9
89
2
5
–15
4
7
54
–8
Sen
egal
1,6
45
1,7
23
0
.2
15
5
59
6
2
+7
4
4
59
+
4Sie
rra
leo
ne
434
71
7
2.0
1
90
1
55
1
8
–7
38
4
1
–8
un
wei
ghte
d a
vera
ge
4,7
23
8,7
27
2
.5
12
4
49
61
–1
5
51
6
5
–7
oil p
rodu
cers
8,2
54
15,3
58
2
.5
10
2
24
7
6
–24
5
7
71
–1
8
non
–oil
pro
du
cers
1,1
91
2,0
95
2
.3
15
0
78
4
8
–3
45
5
8
+6
a con
stan
t 200
7 d
ollar
s.
So
uR
ce
: cal
dw
ell (
1986);
worl
d b
ank (
2009);
wH
o (
2009).
664 r o u t e s t o L o w M o r ta L i t y i n P o o r c o u n t r i e s r e v i s i t e d
income gains and slowed imR improvement, this earlier group of superior achievers saw their relative imR ranking fall from +36 out of 99 countries to only +10 out of 131 today.
the final columns of table 2 look at convergence in life expectancy at birth. Yesterday’s superior imR achievers gained only three years of aggregate life expectancy, from 61 to 64 years, with overall levels of improvement well behind the global average. only china, costa Rica, and to a lesser extent Sri lanka maintained their earlier success. Poor achievers actually achieved a higher absolute level of life expectancy, rising from 51 to 65 years, although they were also far wealthier as a group. among the eight middle east coun-tries that topped the original list, all save conflict-affected iraq added at least 10 years to their life expectancy, with major improvements in oman (from 52 to 74), Yemen (from 44 to 64), and even oil-poor morocco (from 52 to 72). indeed, while morocco remains merely average in terms of its imR, its life expectancy now outranks its per capita GdP by 34 spots.
this follow-up illustrates the strong forces of economic and epide-miologic convergence pushing countries away from exceptional mortality achievement relative to income. exceptional mortality outcomes may place countries on new economic growth paths, in the process making it difficult to reappear on the same list. in developing a list of modern-day mortality achievers, the continued success of countries like china and costa Rica will thus bear special attention.
Modern-day health achievers
a replication of caldwell’s rankings illustrates the narrowed range of superior achievement in child mortality in 2007 as compared to 1982, and the contin-ued extent of poor achievement. Figure 1 plots the 131 countries by cmR and income (on logarithmic scales), which produces almost the same results as if imR were used. to account for the presence of additional outliers, the desig-nation of superior or poor achiever is assigned if cmR ranks 30 spots better or worse than income. today, only nine countries achieve a relative cmR rank at the +30 level. most of these countries fall quite close to the +30 threshold, with an average relative ranking of +41. in contrast, the ten countries with cmR rank below the –30 threshold fare very poorly, with an average relative ranking of –51. they are led by equatorial Guinea, with a cmR of 150 per 1000 on income of $16,347, for a –102 relative rank.
in adult mortality there are numerous outliers on both the negative and positive side, as shown in Figure 2. Sixteen countries rank at least 30 spots lower on amR than income, topped by botswana, which is 22nd in income but 6th from bottom in amR, for a –103 relative rank. the average relative ranking for 16 poor achievers is –61, meaning that the average underachiever ranks almost half a distribution lower on amR than on income. there are also 20 countries that achieve superior amR outcomes, although they average

r a n d a L L K u h n 665
only a +38 relative rank. morocco, a poor achiever in 1982, is now the world’s leading overachiever in amR. because rankings are relative, superior achieve-ment is facilitated in part by the exceptionally poor amR outcomes among other countries. nonetheless, the presence of historic cmR overachievers like china, vietnam, and costa Rica suggests that achieving low amR may indeed require a concerted national effort. because superior achievements on amR and cmR are highly correlated, the following analysis shifts focus to relative achievement in life expectancy, which reflects both cmR and amR.
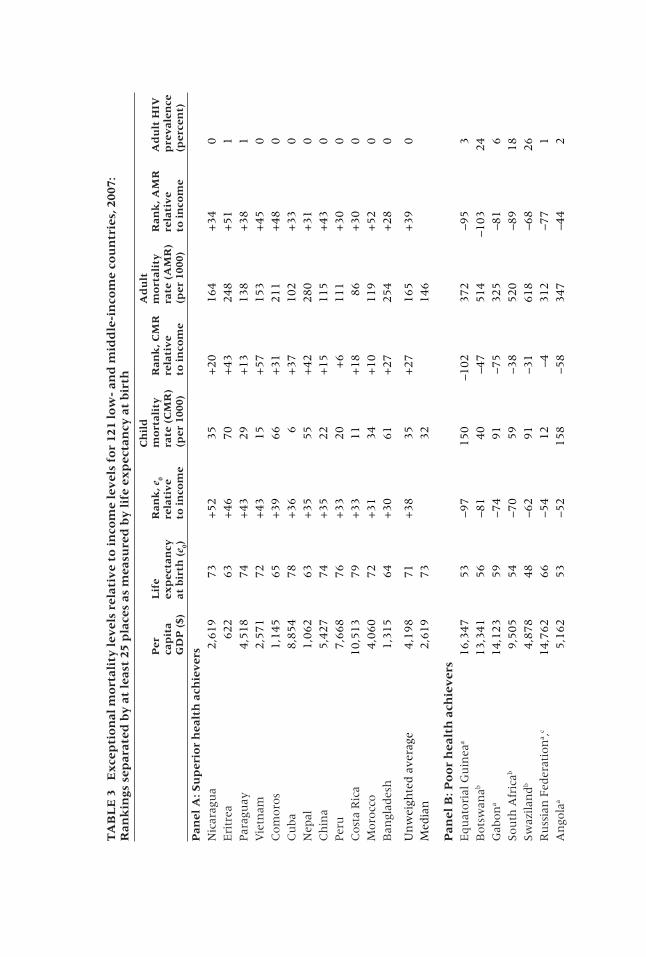
countries with exceptional life expectancy ranking relative to per capita GdP rank in 2007 are shown in table 3. there are 12 high life expectancy achievers with an average relative ranking of +38. the top achievers, nicara-gua and eritrea, are only +52 and +46 (out of 131 countries) while the 1982 leaders, Sri lanka and china, ranked +61 out of 99 countries. today’s 14
FIGURE 1 Child mortality rate and GDP per capita for 131 countries, 2007
SOURCE: World Bank (2009); WHO (2009).
Comoros
Fiji
Cuba
Syria
Thailand
Nepal
Eritrea
Moldova
Vietnam
EquatorialGuinea
Gabon
Angola
Trinidadand Tobago
Botswana
Saudi Arabia
South Africa
Congo
Nigeria
Swaziland
5
15
25
50
100
200
Ch
ild m
ort
alit
y ra
te (
per
1000)
20,00010,0005,0002,5001,000500
GDP per capita ($)
Superior achievers Poor achievers

666 r o u t e s t o L o w M o r ta L i t y i n P o o r c o u n t r i e s r e v i s i t e d
poor health achievers look particularly poor, with a –55 average. (the aver-age would be even worse if Zimbabwe had been included.) the very poorest achievers look especially poor, with equatorial Guinea at –97; in 1982, the poorest life expectancy achiever was oman at only –57.
much of the shift toward greater underachievement in mortality and a greater contribution of adult mortality can be explained by well-documented patterns of extreme mortality disadvantage relating to Hiv/aidS in sub-Saha-ran africa and non-communicable diseases and injuries in the Former Soviet union (FSu). Four underachievers have very high Hiv/aidS prevalence (15 percent or higher), including three of the five worst (see table 3): botswana, South africa, and Swaziland. these four Hiv countries have an average per capita GdP of $8,461, solidly upper-middle income, yet have an average life expectancy at birth of only 54 years and an adult Hiv prevalence of 21 per-
FIGURE 2 Adult mortality rate and GDP per capita for 131 countries, 2007
SOURCE: World Bank (2009); WHO (2009).
Solomon Islands
Tunisia
Morocco
Paraguay
China
Uzbekistan
Tajikistan
Liberia
Madagascar
Costa Rica
Bosnia and Herzegovina
Nicaragua
Albania
Comoros
Cuba
Syria
Nepal
Eritrea
Vietnam
EquatorialGuinea
GabonAngola
Trinidadand Tobago
Botswana
Saudi Arabia
South Africa
Congo
Swaziland
Namibia
Kazakhstan
Turkmenistan
RussianFederation
Latvia
LithuaniaBelarus
100
150
200
300
400
725
Adu
lt m
ort
alit
y ra
te (
per
1000)
20,00010,0005,0002,5001,000500
GDP per capita ($)
Superior achievers Poor achievers

r a n d a L L K u h n 667
cent. these countries also underperform on cmR (–36 on average), owing both to pediatric Hiv and to the socioeconomic impacts of the epidemic, yet poor achievement is driven primarily by a collective amR of 504 per 1,000, or a less than 50/50 chance of surviving from adolescence through adulthood.
Four underachievers emerged from the FSu, where disadvantage is even more concentrated in adulthood (chen et al. 1996; Shkolnikov et al. 2001). they are led by the Russian Federation, whose $14,762 per capita GdP is 16th highest while its 66-year life expectancy at birth is only 70th (–54 relative rank).5 disaggregating by age, Russia’s cmR of 12 per 1,000 is about normal for a country with its income, but its amR of 312 per 1,000 ranks 77 slots below its income. with an adult Hiv/aidS prevalence around 1 percent, Russia’s disadvantage derives almost exclusively from non-communicable disease and injuries (Shkolnikov et al. 2001; men et al. 2003). For FSu un-derachievers as a group, their –43 relative ranking was driven primarily by poor relative rankings on amR (–62), while cmR rankings were close to expectation (–6).6
Finally, today’s poor health achievers still include a number of oil-rich states, although the current group has little overlap with those observed by caldwell. while all of caldwell’s original oil states continue to have moder-ately poor rankings, only Saudi arabia remains on the list, improving from –61 out of 99 countries to –42 out of 131 countries.7 Four poor-achieving countries made more recent oil discoveries, including three in the Gulf of Guinea region (equatorial Guinea, Gabon, and angola) plus trinidad and tobago (henceforth referred to as trinidad). caldwell asserted that the origi-nal oil states had been wealthy for too long for poor achievements to reflect a mere lag effect, yet many of these countries did eventually improve their performance, if not overachieve. it remains to be seen whether today’s new oil states will manage the same feat.
caldwell’s discussion of the original oil states centered on the relationship between a majority-muslim population and poor achievement, a relationship that has weakened considerably over time. at the time, caldwell pointed out that all poor achievers, not merely the oil states, were either majority-muslim or had large muslim minorities, while tanzania was the only majority-muslim state among the superior achievers. today the situation looks quite different, as a result of 25 years of steep mortality reductions in a wide range of muslim countries (Gerring 2008). Saudi arabia is joined only by Kazakhstan, whose poor achievement can be more readily attributed to its reliance on oil, its for-mer membership in the Soviet union, and its large Russian minority. Superior achievers include four majority-muslim countries representing a diversity of ethnic backgrounds. eritrea is the second-best mortality achiever at +46, hav-ing a life expectancy of 63 years on income of only $622. comoros is fifth at +39 ($1,145, e
0 65). Further down the list are morocco (+31, $4,060, e
0 72),
which moved from poor achiever in 1982 to superior in 2007, and bangladesh
Ta
bL
e 3
e
xce
pti
on
al m
ort
alit
y l
evel
s re
lati
ve
to i
nco
me
lev
els
for
121
low
- an
d m
idd
le-i
nco
me
cou
ntr
ies,
200
7:
Ran
kin
gs s
epar
ated
by
at
leas
t 25
pla
ces
as m
easu
red
by
lif
e ex
pec
tan
cy a
t b
irth
Ch
ild
ad
ult
Per
L
ife
Ran
k, e
0 m
ort
alit
y
Ran
k, C
MR
m
ort
alit
y
Ran
k, a
MR
a
du
lt H
IV
ca
pit
a ex
pec
tan
cy
rela
tiv
e ra
te (
CM
R)
rela
tiv
e ra
te (
aM
R)
rela
tiv
e p
rev
alen
ce
G
DP
($)
at
bir
th (
e 0)
to i
nco
me
(per
100
0)
to i
nco
me
(per
100
0)
to i
nco
me
(per
cen
t)
Pan
el a
: Su
per
ior
hea
lth
ach
iev
ers
nic
arag
ua
2,6
19
73
+52
35
+20
164
+3
4
0e
ritr
ea
622
63
+46
70
+43
248
+5
1
1Par
agu
ay
4,5
18
74
+43
29
+13
138
+3
8
1v
ietn
am
2,5
71
72
+43
15
+57
153
+4
5
0c
om
oro
s 1,1
45
65
+39
66
+31
211
+4
8
0c
uba
8,8
54
78
+36
6
+37
102
+3
3
0n
epal
1,0
62
63
+35
55
+42
280
+3
1
0c
hin
a 5,4
27
74
+35
22
+15
115
+4
3
0Per
u
7,6
68
76
+33
20
+6
111
+3
0
0c
ost
a R
ica
10,5
13
79
+33
11
+18
86
+3
0
0m
oro
cco
4,0
60
72
+31
34
+10
119
+5
2
0b
angl
ades
h
1,3
15
64
+30
61
+27
254
+2
8
0
un
wei
ghte
d a
vera
ge
4,1
98
71
+38
35
+27
165
+3
9
0m
edia
n
2,6
19
73
32
146
Pan
el b
: Po
or
hea
lth
ach
iev
ers
equ
atori
al G
uin
eaa
16,3
47
53
–97
150
–102
372
–95
3
bots
wan
ab 13,3
41
56
–81
40
–47
514
–10
3
24
Gab
on
a 14,1
23
59
–74
91
–75
325
–81
6
Sou
th a
fric
ab 9,5
05
54
–70
59
–38
520
–89
1
8Sw
azilan
db
4,8
78
48
–62
91
–31
618
–68
2
6R
uss
ian
Fed
erat
ion
a ,c
14,7
62
66
–54
12
–4
312
–77
1
an
gola
a 5,1
62
53
–52
158
–58
347
–44
2

trin
idad
an
d t
oba
goa
22,4
24
69
–50
35
–53
200
–49
2
Kaz
akh
stan
a ,c
10,8
59
64
–43
32
–26
307
–60
0
Sau
di a
rabi
aa 22,8
81
71
–42
25
–43
163
–38
0
nam
ibia
b 6,1
19
59
–37
68
–27
365
–52
1
5lit
hu
ania
c 17,8
28
71
–37
7
+6
231
–59
0
lat
viac
17,3
50
71
–36
10
–1
213
–52
1
con
go
3,7
24
55
–32
125
–36
371
–35
4
un
wei
ghte
d a
vera
ge
12,8
07
61
–55
65
–38
345
–64
7
med
ian
13,7
32
59
50
336
3
a
oil p
rodu
cers
(7)
17,7
60
73
–69
84
–60
338
–74
2
b
ver
y h
igh
Hiv
(4)
15,2
00
68
–43
15
–6
266
–62
1
cForm
er S
ovi
et (
4)
8,4
61
54
–63
65
–36
504
–78
2
1
So
uR
ce
: worl
d b
ank (
2009);
wH
o (
2009).

670 r o u t e s t o L o w M o r ta L i t y i n P o o r c o u n t r i e s r e v i s i t e d
(+30, $1,315, e0 64). in total, the top quartile of countries in terms of life ex-
pectancy relative rank includes 11 majority-muslim countries.8
For several reasons this listing should not imply a pattern of universal mortality overachievement in majority-muslim countries. First, muslim countries appear throughout the list, with 13 in the bottom quartile of rela-tive achievement.9 Second, superior mortality achievement could surely be viewed instead, just as plausibly, as economic underachievement. third, a number of muslim countries perform more poorly on female mortality than on total mortality.10
Finally, religious identifiers must be interpreted with care. in 1986, caldwell took pains to clarify that he spoke of islam, not of muslim countries, yet his very next section addressed the potential role of buddhism in the mortality achievements of Sri lanka, thailand, vietnam, and myanmar (then burma). the limitations of such religious comparisons are well illustrated by comparing the neighboring island countries of the maldives and Sri lanka. Sri lanka is often identified as buddhist (although it has large muslim, Hindu, and christian minorities), while maldives is almost entirely muslim. in 2007, maldives had a slightly higher per capita GdP than Sri lanka ($4,967 versus $4,271) and a slightly higher life expectancy (73 versus 71), resulting in a slightly higher relative rank. Yet Sri lanka is frequently employed as a case study of health success, while few would even mention the maldives in that context, much less attribute its relative success to any aspect of islam. Yet this is far from the only case of a muslim country outperforming an ostensibly comparable non-muslim country. eritrea outperforms ethiopia (2nd versus 26th), bangladesh outperforms india (12th versus 65th), and majority-mus-lim FSu states outperform non-muslim states. within the Russian Federation, majority-muslim regions like ingushetia and dagestan are far poorer than average, yet have life expectancies of 75 and 73 respectively, making them superior health achievers in an overall context of poor achievement (Zaridze et al. 2009). the final section returns to explanations for this striking level of success in muslim countries.
the remaining superior achievers offer greater continuity with the 1982 list and with well-documented patterns of health achievement. china (+35 relative rank, per capita GdP $5,427, e
0 74) and costa Rica (+33, $10,513, e
0
79) both return. vietnam (+43, $2,571, e0 72) and cuba (+36, $8,854, e
0 78)
both featured heavily in caldwell’s discussion. looking regionally, costa Rica and cuba are joined by three other latin american countries: nicaragua is first (+52, $2,619, e
0 73), Paraguay is third (+43, $4,518, e
0 74), and Peru is
ninth (+33, $7,668, e0 76). another four latin american countries appear in
the top quartile of superior life expectancy achievers. looking beyond this list, every Spanish-speaking country in latin america ranks higher on life expectancy than it does on income, a regional pattern of success that has been documented in other research (mcGuire 2010).11

r a n d a L L K u h n 671
across all regions, superior mortality performance is driven primarily by low amR. all but three of the 14 superior achievers have a better relative ranking on amR than on cmR, although all rank positively on both dimen-sions. costa Rica, for instance, has an amR of 86 per 1,000 (+30 relative rank), lower than the united States, Finland, and France. china was only +15 on cmR (22 per 1,000), but was +43 with an amR of 115, just behind the united States. Such amR success certainly challenges the popular percep-tion of an emerging Russia-style non-communicable disease crisis in china. amR estimates may have flaws. Given china’s unique age structure, tempo effects might bias amR downward, but not likely by enough to affect china’s superior achiever status. more significantly, the lagged effects of smoking on amR have yet to be fully realized in china (Rogers et al. 2005; Preston and wang 2006; Peto et al. 2009). lastly, china and other superior achievers may be receiving credit for low amR simply because they did not experience the adult mortality spikes afflicting poor achievers. before exploring the distal drivers of superior mortality achievement, it is worth asking whether such credit is deserved.
Mortality spikes: Merely exceptional or uniquely identified?
a strict probing exploration of the distal determinants of health must recog-nize that some health risks are far outside national control. indeed the very premise of this article is that per capita GdP is such a powerful determinant of health that other distal forces are better understood by first stripping out income effects. Similar, if controversial, arguments can be forwarded with respect to the Hiv/aidS epidemic and to the mortality crisis in the former Soviet union. while these crises may not have been inevitable in the af-fected countries, they may nonetheless have been inconceivable in other countries, in which case unaffected countries should not receive credit for having avoided them.12
the most heavily Hiv-affected countries are easy to identify region-ally on a map, yet it is more difficult to say whether their epidemics were inevitable, much less whether other countries could have been as severely affected. all eight countries with adult Hiv prevalence over 10 percent are in Southern africa, and no country in that region avoided high prevalence. all countries with prevalence above 15 percent are in the former political and economic sphere of apartheid South africa (caldwell and caldwell 1996; campbell 1997; marks 2002). as to the possibility of a widespread epidemic outside africa’s Southern cone, it is fortunate that global and national action against the disease will likely preclude our ever finding out. uganda may have experienced a peak prevalence above 10 percent, although estimates are quite uncertain and current prevalence is 5 percent

672 r o u t e s t o L o w M o r ta L i t y i n P o o r c o u n t r i e s r e v i s i t e d
(Stoneburner and low-beer 2004; allen 2005). outside Southern africa, Hiv/aidS prevalence bears a strong correlation to income. thus, it seems reasonable to argue that the extreme Hiv/aidS epidemic affecting South-ern africa is unique, and that countries outside this region should not gain credit for having avoided such an epidemic. my subsequent analysis of distal determinants of exceptional mortality achievement will thus exclude eight countries from Southern africa.13
while the inevitability of the post-Soviet mortality spike is debatable, its local specificity is clear. there is nothing inherent in Soviet or post-Soviet government or in Russian culture that makes such a mortality pattern inevitable, and alcohol abuse even declined steeply during Glasnost (Gath-mann and miller 2010). Yet evidence from Russian populations at home and abroad points to the unique cultural nature of this excess mortality pattern (leon and Shkolnikov 1998; marquez et al. 2007). in Kyrgyzstan, relative risks of multiple non-communicable disease and injury mortality were 3–8 times higher for the Russian minority than for the Kyrgyz major-ity, resulting in a life expectancy gap of 20 years (Guillot 2007). Relative to income, Kyrgyzstan, Kazakhstan, and other central asian countries would all have average or above-average mortality in the absence of Russian minorities (becker and urzhumova 2005). Kazakhstan is the only central asian country with a substantial Russian minority (30 percent) and also the region’s only poor health achiever.14 Given the apparent specificity of the phenomenon to ethnic Russians, i exclude Russia and Kazakhstan from the analysis (Pavlenko 2006).
Determinants of exceptional health achievement
with these exclusions, table 4 introduces a refined set of exceptional health achievers for 121 countries. eight countries remained at or above the +30 relative rank indicating superior achievement. another two, nepal and Peru, fell just below that threshold at +29. these can also be regarded as exceptional given the smaller sample and more exacting standard, justifying a slight ex-pansion of the category. no other countries remained even above the +25 relative rank threshold, establishing a distinct group of superior achievers.15 eight of the 14 poor achievers from table 3 remain after the exclusions, in exactly the same rank order, again creating a parsimonious grouping. twenty-five years of theoretical refinements and improvements to the quality of national indicators facilitate an analysis that is both more quantitative than caldwell’s original analysis and more focused on assessing the relative merit of specific hypotheses, many emerging directly from caldwell’s work. the exploration begins with caldwell’s primary emphasis on education, particu-larly for women, as a determinant of health improvement and a reflection of broader emphasis on human capital.

r a n d a L L K u h n 673
Education and gender
Perhaps caldwell’s most widely appreciated contribution was his documen-tation of the country-level association between schooling, particularly for females, and level of mortality. caldwell observed a substantial advantage in primary school enrollment for superior achievers compared to poor ones, and more pronounced male/female enrollment ratios among poor achievers. He used the gross enrollment ratio, or the ratio of students in a particular edu-cational level to every 100 age-appropriate children, irrespective of whether the children enrolled were themselves the appropriate age. in aggregate, gross enrollment ratios in superior countries were 90 for females and 102 for males, compared to 62 and 91 in poor-achieving countries. caldwell argued
TabLe 4 exceptional mortality levels relative to income levels for 121 low- and middle-income countries with adult HIV/aIDS prevalence below 15 percent, 2007: rankings separated by at least 28 places as measured by life expectancy at birth
Child adult Per capita Life Rank, e
0 mortality mortality
GDP expectancy relative rate (per rate (per ($PPP) at birth (e
0) to income 1000) 1000)
Panel a: Superior health achieversnicaragua 2,619 73 +46 35 164eritrea 622 63 +38 70 248Paraguay 4,518 74 +37 29 138vietnam 2,571 72 +37 15 153comoros 1,145 65 +32 66 211cuba 8,854 78 +32 6 102costa Rica 10,513 79 +30 11 86china 5,427 74 +30 22 115nepal 1,062 63 +29 55 280Peru 7,668 76 +29 20 111
unweighted average 4,534 72 +34 32 152
Panel b: Poor health achieversequatorial Guinea 16,347 53 –92 150 372Gabon 14,123 59 –73 91 325angola 5,162 53 –52 158 347trinidad and tobago 22,424 69 –50 35 200Saudi arabia 22,881 71 –42 25 163lithuania 17,828 71 –37 7 231latvia 17,350 71 –36 10 213congo 3,724 55 –34 125 371
unweighted average 14,980 63 –52 75 278
SouRce: world bank (2009); wHo (2009)

674 r o u t e s t o L o w M o r ta L i t y i n P o o r c o u n t r i e s r e v i s i t e d
that women’s schooling was a causal factor driving improved health-seeking behavior, noting that the female schooling disadvantage in poor-achieving countries was even more pronounced when looking back to 1960 enroll-ment levels. in high-achieving countries, males had a 76 to 55 enrollment advantage in 1960, while males in poor-achieving countries had a 55 to 23 ad-vantage. in relative terms, every superior achiever had better-than-expected female schooling outcomes in 1960 (for a +26 average), while every poor achiever fared worse than expected (–43 average). thus female schooling 20 years earlier was as important a predictor of mortality achievement in the 1980s as income itself.
today schooling is a less powerful determinant of exceptional mortality achievement, and women’s schooling is scarcely more salient than men’s. Partly as a result of caldwell’s work, schooling has gained mainstream status as an important determinant of health and as a valuable public good in its own right (Soares 2005; Grignon 2008). Primary school enrollment levels have risen substantially, particularly for females, thus narrowing the varia-tion between superior and poor achievers. table 5 shows net primary school enrollment, or the ratio of age-appropriate children enrolled in primary school to the total number of children of appropriate age, for superior and poor achievers. Schooling data for 2007 come from the uneSco world edu-cation indicators database (uneSco 2010). Superior achievers outperform poor achievers on aggregate net enrollment (85 percent vs. 80 percent), a striking advantage given that their income is barely one-third as high, yet the female advantage (84 percent vs. 78 percent) scarcely differs from the male advantage (86 percent vs. 81 percent). Poor-achieving countries have notably poor relative schooling outcomes, but they are equally poor for males (–59) and females (–56). For superior achievers, the relative level of schooling overachievement (+17) is far smaller, and the relative advantage is no larger for females (+16) than for males (+17). analysis of net secondary school enrollment found more limited association with mortality and male/female variations, and thus is not shown.
to better gauge the longitudinal association between schooling and subsequent health, table 5 also explores relative levels of adult literacy among exceptional health achievers. Poor achievers actually have a 4 percentage point absolute literacy advantage (81 percent to 77 percent) and a slightly greater 7 percentage point male advantage (93 percent to 86 percent). once their substantial income advantage is taken into account, poor achievers do have poor schooling outcomes relative to income (–23 for females, –16 for males), although nothing like their disadvantage in current schooling. Superior health achievers maintain positive levels of lit-eracy relative to income, but once again with little differentiation between females (+16) and males (+17). all superior health achievers except Peru are superior schooling performers. in two countries, females outperform males

r a n d a L L K u h n 675
in schooling (costa Rica, nicaragua), yet in two others males outperform females (china and vietnam).
in short, there remains a strong association between education and exceptional mortality achievement, but the association has diminished since 1982 and the differential association with women’s schooling is almost eliminated. Strong associations of mortality achievement with current school enrollment likely reflect the tendency for countries to underperform in both health and schooling. associations with adult literacy point toward a causal relationship, but the magnitude and consistency of association is attenuated, and male/female differences are minimal.
TabLe 5 Schooling and literacy indicators, exceptional health achievers, c. 2007
Net primary school enrollment (percent) adult literacy
Rate (percent) Relative rank Male Female Male Female Male Female
Panel a: Superior health achieversnicaragua 92 92 79 80 –2 +15eritrea 42 36 58 35 +14 +13Paraguay 92 93 94 93 +23 +27vietnam 96 91 94 87 +37 +26comoros 79 67 79 68 +25 +33cuba 99 99 100 100 +35 +35costa Rica 91 93 96 96 +1 +8china 99 99 96 89 +25 +11nepal 84 73 94 82 –2 –17Peru 97 97 68 40 +15 +10
average 86 84 86 77 +17 +16average relative rank +17 +16 +17 +16
Panel b: Poor health achieversequatorial Guinea 70 63 93 80 –32 –44Gabon 81 80 89 80 –40 –42angola 74 69 83 54 –16 –35trinidad and tobago 92 91 99 98 –9 –7Saudi arabia 85 84 88 77 –56 –55lithuania 92 91 100 100 +3 +8latvia 89 92 100 100 +10 +12congo 62 56 91 55 +15 –21
average 81 78 93 81 –16 –23average relative rank –59 –56 –16 –23
SouRce: world bank (2009); wHo (2009); uneSco (2010).

676 r o u t e s t o L o w M o r ta L i t y i n P o o r c o u n t r i e s r e v i s i t e d
Health systems spending
inasmuch as a wealthy nation bereft of health services or spending would have very poor health standards, health spending must have an effect on health, yet pinpointing this relationship has often proven difficult. beyond the direct causal relationship between spending and cure, caldwell argued that health spend-ing demonstrated a societal commitment to welfare that would be reflected in better outcomes. Several factors undermine such a causal relationship. First, all societies expend some resources on health, limiting the range of variation (Filmer and Pritchett 1999; baldacci et al. 2008). Second, the share of GdP ex-pended on health tends to rise as countries grow wealthier, making it difficult to separate health expenditures from other forces of societal development (Shang and Goldman 2008). third, expenditures are preventative, curative, and pallia-tive, so high levels of spending might indicate a particularly unhealthy popula-tion (aisa and Pueyo 2006). Finally, Filmer et al. (2002) point out that health spending is often not intended to address specific mortality targets, whether as a result of corruption, inefficiency, restriction of access mainly to the wealthy, or an intended focus on broader impacts. with these caveats in mind, spend-ing is a natural first approximation of a health system, and studies have found significant associations between spending and outcomes (anand and Ravallion 1993; nixon and ulmann 2006). table 6 compares the total, public, and private health expenditures of exceptional health achievers, using data from the wHo national Health accounts database (wHo 2010).
total health spending is not a strong correlate of health achievement, and it is primarily related only to poor achievement. Poor achievers spend twice as much per person ($656) as superior achievers ($309), yet they spend considerably less as a percentage of GdP (4.0 percent versus 6.0 percent). this is in spite of a tendency for wealthier countries to spend more on health as a share of GdP. the average poor achiever ranks 12 places lower on expenditure per capita than on GdP per capita. total health spending for overachievers ranks scarcely higher than income. only four superior achievers are rela-tive big spenders (nicaragua, vietnam, cuba, and costa Rica), while three spend slightly less than would be expected (china, Peru, and comoros). it is important to note the role of reverse causation from poor health to greater spending, particularly in poor countries. For countries with a GdP per capita of $2,000 or less, health expenditures as a percentage actually have a strong positive correlation to amR (0.29) and cmR (0.34).
Perhaps more notable than the pattern of total health expenditure is the public–private mix. most of the expenditure deficit among poor achievers results from their lack of private spending. as a share of GdP their private expenditures are half those of superior achievers (1.3 percent versus 2.5 percent) with a much smaller public expenditure gap (2.7 percent versus 3.5 percent). Poor achievers rank 25 spots lower on private health expenditure

Ta
bL
e 6
P
ub
lic,
pri
vat
e, a
nd
to
tal
hea
lth
sp
end
ing
per
cap
ita
and
as
a p
erce
nt
of
GD
P f
or
exce
pti
on
al h
ealt
h
ach
iev
ers,
200
7
T
ota
l sp
end
ing
P
ub
lic
spen
din
g
Pri
vat
e sp
end
ing
Ran
k,
Ran
k,
Ran
k,
P
er
spen
din
g a
s P
er
spen
din
g a
s P
er
spen
din
g a
s
cap
ita
rela
tiv
e p
erce
nt
cap
ita
rela
tiv
e p
erce
nt
cap
ita
rela
tiv
e p
erce
nt
$
to G
DP
o
f G
DP
$
to G
DP
o
f G
DP
$
to G
DP
o
f G
DP
Pan
el a
: Su
per
ior
hea
lth
ach
iev
ers
nic
arag
ua
216
+14
8.3
119
+16
4.5
9
8
+1
8
3.7
eri
trea
20
–3
3.3
9
0
1.5
1
1
–3
1.8
Par
agu
ay
258
+3
5.7
109
–4
2.4
1
49
+
14
3
.3v
ietn
am
183
+10
7.1
72
+5
2.8
1
11
+
22
4
.3c
om
oro
s 37
–10
3.3
21
+3
1.9
1
6
–12
1
.4c
uba
917
+21
10.4
875
+30
9.9
4
2
–53
0
.5c
ost
a R
ica
851
+14
8.1
621
+17
5.9
2
30
+
1
2.2
ch
ina
231
–7
4.3
103
–13
1.9
1
28
+
2
2.4
nep
al
54
+2
5.1
21
+7
2.0
3
2
+1
1
3.1
Per
u
327
–12
4.3
191
–9
2.5
1
36
–9
1
.8
un
wei
ghte
d m
ean
309
+3
6.0
214
+5
3.5
9
5
–1
2.5
Pan
el b
: Po
or
hea
lth
ach
iev
ers
equ
atori
al G
uin
ea
341
–34
2.1
274
–24
1.7
6
7
–55
0
.4G
abon
647
–12
4.6
417
–13
3.0
2
30
–1
5
1.6
an
gola
131
–19
2.5
105
–11
2.0
2
6
–50
0
.5tr
inid
ad a
nd t
oba
go
1,0
77
0
4.8
604
–8
2.7
4
73
+
2
2.1
Sau
di a
rabi
a 782
–16
3.4
621
–7
2.7
1
61
–3
8
0.7
lit
hu
ania
1,1
09
+4
6.2
809
+4
4.5
3
00
–9
1
.7lat
via
1,0
71
+3
6.2
620
–3
3.6
4
51
5
2
.6c
on
go
90
–20
2.4
63
–9
1.7
2
6
–36
0
.7
un
wei
ghte
d a
vera
ge
656
–12
4.0
439
–9
2.7
2
17
–2
5
1.3
So
uR
ce
: worl
d b
ank (
2009);
wH
o (
2009, 2
010).
678 r o u t e s t o L o w M o r ta L i t y i n P o o r c o u n t r i e s r e v i s i t e d
per capita than on GdP per capita. Superior health achievers derive more of their aggregate health expenditure advantage from public spending (+5 relative ranking, $214), yet this almost entirely reflects the remarkably high levels of public health spending in cuba (+30, $875, 9.9 percent of GdP) and to a lesser extent costa Rica. if cuba were removed, superior achievers would perform as well on private spending as on public. indeed, Paraguay, vietnam, china, and nepal all draw a majority of health spending from the private sector and have a higher relative ranking on private expenditure than on public.
these patterns challenge the policy focus on public health expenditures as a determinant of health outcomes. while greater policy leverage over public expenditures may justify this focus, private expenditures are equally significant. Private expenditures can also be stimulated by state policy, for instance through infrastructure investment, regulation, innovation, and pre-vention (berman 1995; mills et al. 2002; travis et al. 2004). Finally, low levels of private health spending may be driven by high rates of poverty (anand and Ravallion 1993; Xu et al. 2003).
Poverty
even after controlling for income level, levels of poverty are likely to be criti-cal for health. the undernourishment associated with poverty is perhaps the world’s leading proximate cause of excess mortality (ezzati et al. 2004). as noted above, those in poverty may be unable to purchase even inexpensive medical treatments. table 7 thus explores the poverty profile of exceptional health achievers. because poverty is highly correlated with income, the analysis identifies countries that have high or low levels of poverty even given their income level. unfortunately, no single poverty indicator exists for all countries. instead, raw indicators were drawn, when available, for income poverty (percent of population living on less than $2 per day) (world bank 2009), total percent undernourished (Fao 2009), and percent of children un-derweight (uniceF 2010). a poverty index was constructed from a country’s average score on all available indicators.16
Poverty indicators for exceptional achievers display the now common pattern whereby the deficits of poor achievers far outweigh the strengths of superior achievers. Relative to income levels, poor achievers perform below average on each indicator and on the composite index. latvia and lithu-ania perform above expectation on poverty, again marking them as outliers. trinidad and Gabon perform poorly in relative terms, although better than the worst performers. Superior achievers rank significantly higher on child underweight outcomes than on income (+13 average), but their average per-formance on income poverty and total undernourishment results in a mere +4 average on the composite index. all of the latin american countries are

r a n d a L L K u h n 679
strong relative performers on individual indicators and on the poverty index, perhaps reflecting the success of recent income redistribution programs. out-side latin america, however, superior health achievers actually rank lower on the poverty index than they do on income.
Poverty is an important dimension of health achievement, perhaps even more significant than health expenditure, but it is more closely associated with poor health achievement than with superior achievement. the list of superior achievers actually includes a number of countries with poor poverty outcomes even relative to income. Research in developed countries suggests that levels of income inequality, rather than poverty per se, might better ex-plain cross-national mortality variations (macinko et al. 2003; Subramanian
TabLe 7 Poverty indicators for exceptional health achievers, 1996–2006
Income Total Child Relative under under- under- rank on $2/day nourished weight Poverty poverty (%) (%) (%) indexa index
Panel a: Superior health achieversnicaragua 32 22 0.6 –0.3 +10eritrea –– 68 11.5 2.5 –4Paraguay 14 11 0.5 –0.7 +22vietnam 48 14 5.0 0.1 0comoros 65 52 8.5 1.3 –8cuba –– 5 0.0 –0.9 +14costa Rica 9 5 0.4 –0.9 +14china 36 9 1.2 –0.5 –8nepal 78 15 10.0 0.8 –12Peru 19 15 0.5 –0.6 +13
average 38 22 3.8 0.1 +4average relative rank +2 0 +13
Panel b: Poor health achieversequatorial Guinea –– –– 4.3 0.0 –59Gabon 20 5 2.1 –0.7 –25angola 70 46 8.4 1.3 –51trinidad and tobago 14 10 0.5 –0.7 –24Saudi arabia –– 5 2.8 –0.6 –46lithuania 1 5 –– –1.1 +6latvia 1 5 –– –1.1 +9congo 74 22 2.7 0.3 –15
average 30 14 3.5 –0.3 –26average relative rank –18 –24 –36
aSee endnote 16. SouRce: world bank (2009); wHo (2009); uniceF (2010); Fao (2010).

680 r o u t e s t o L o w M o r ta L i t y i n P o o r c o u n t r i e s r e v i s i t e d
and Kawachi 2004; wilkinson and Pickett 2006). this pathway is difficult to assess given the lack of Gini coefficients for income distribution in most poor countries. a comparison of Gini coefficients for countries with available data found no difference between superior and poor achievers (not shown), while a number of superior health achievers actually had notably high (e.g., latin american countries) or rising (e.g., china) levels of income inequality.
Governance and society
one final pathway that might explain poor health outcomes among high-poverty countries is the quality or nature of governance, so i conclude the exploration of distal determinants with governance factors. caldwell’s original discussion frequently touched on the role of democracy, social activism, and social solidarity or consensus in bringing about superior health achievements. Since then, all manner of econometric evidence has been brought to bear on the relationship between governance indicators and health, with inconclusive results. a number of studies find small but significant effects of democracy on improved health (Szreter 1997; Shandra et al. 2004; besley and Kudamatsu 2006), but others have found limited effects (Ross 2006) or even negative effects for specific outcomes such as vaccine coverage (Gauri and Khalegian 2002). a more consistent line of research addresses the role of governance efficacy (Shen and williamson 2001; Rajkumar and Swaroop 2008; Gupta et al. 2002). using data from the world bank Governance indicators database, table 8 compares exceptional health achievers on measures of efficacy (range –1.7 to +1.25), corruption (range –1.53 to +1.35), and democracy (range 0 to 10). indicators of stability, regulation, and law and order were also available, but did not vary between superior and poor achievers and are not shown.
as in earlier explorations, each governance indicator is associated with exceptional health achievement in the expected direction, although once again associations are far stronger for poor achievers. on each indicator, poor health achievers ranked well below their income ranking (–34 efficacy, –38 corruption, –42 democracy). as in earlier analyses, latvia and lithuania again performed well on all indicators, outperforming most superior achievers, while Gabon and trinidad performed somewhat better than other oil-rich states.
Superior achievers do not demonstrate a strong aggregate performance on any single governance indicator, yet significant patterns emerge when looking across the indicators. confirming the findings of caldwell and others, there appear to be distinct democratic and undemocratic routes to superior health achievement. Four regimes were not at all democratic (eritrea, viet-nam, cuba, china), while five were quite democratic at least relative to their GdP (nicaragua, Paraguay, comoros, costa Rica, and Peru). nepal scored 1 out of 10, although its recent history prior to the royalist coup of 2005 was quite democratic.

r a n d a L L K u h n 681
a separate look at autocratic societies also highlights the role of other governance factors. the fourth column of table 8 presents the relative rank-ing on the governance indicator on which a country performs best. each superior achiever performed positively on at least one indicator. among the five current autocracies, four rank high on efficacy: china (+22), vietnam (+25), nepal (+22), and eritrea (+13), while cuba’s –54 relative ranking seems unduly harsh given its success in many areas of social development. eritrea (+56) and nepal (+40) also perform well on the index of corruption. in contrast, most poor achievers perform very poorly on all indicators. even outlier countries like latvia, lithuania, and trinidad do not perform well on any governance indicator. in aggregate, superior health achievers average +32 on their best governance indicator while the poor achievers average –27
TabLe 8 Governance indicators for exceptional health achievers, 2007
best Majority relative ethnicity efficacy Corruption Democracy rank (% of total)
Panel a: Superior health achieversnicaragua –1.0 –0.8 8 +44 (d) 69eritrea –1.2 –0.6 0 +56 (c) 50Paraguay –0.9 –1.0 8 +29 (d) 95vietnam –0.4 –0.7 0 +25 (e) 88comoros –1.7 –0.7 6 +50 (d) 97cuba –0.9 –0.2 0 +6 (c) 51costa Rica 0.3 0.4 10 +27 (d) 94china 0.0 –0.7 0 +22 (e) 92nepal –0.9 –0.7 1 +40 (c) 16Peru –0.5 –0.4 9 +23 (d) 45
average –0.7 –0.5 4.2 +32 70average relative rank –4 +10 +7
Panel b: Poor health achieversequatorial Guinea –1.3 –1.4 0 –89 (d) 83Gabon –0.6 –0.9 0 –50 (c) 40angola –1.2 –1.1 2 –19 (d) 37trinidad and tobago 0.2 –0.2 10 +4 (d) 40Saudi arabia –0.3 –0.1 0 –16 (c) 90lithuania 0.8 0.2 10 +7 (d) 81latvia 0.7 0.3 8 +5 (c) 58congo –1.3 –1.0 0 –54 (d) 48
average –0.4 –0.5 3.8 –27 60average relative rank –34 –38 –42
note: e = efficacy, c = corruption, d = democracy. SouRce: world bank (2009, 2010); wHo (2009, 2010).

682 r o u t e s t o L o w M o r ta L i t y i n P o o r c o u n t r i e s r e v i s i t e d
on their best indicator. in other words, superior achievers are usually strong in one area of governance, while poor achievers never are.
the final column of table 8 explores one indicator of social solidarity, the population share of the majority ethnic group. Superior achievers tend more than poor achievers to be ethnically homogeneous. Four superior achievers had at least 90 percent of the population from a single ethnic group, compared to only one of eight poor achievers. additionally, the list of superior achievers includes two other countries, cuba and eritrea, that saw strong levels of social solidarity emerge from liberation struggles. ethnic homogeneity alone is not a strong predictor of health achievement, but it may, along with governance and education, provide clues to the role of social solidarity in health promo-tion, as i discuss below.
Discussion and conclusion
John caldwell’s groundbreaking article offered two routes to low mortality: a direct route involving women’s schooling and a circuitous one involving the interplay between governance, social consensus, and empowerment. twenty-five years on, the direct route is almost exhausted. thanks in part to caldwell’s voice, a generation of schooling investments has yielded tremen-dous progress in schooling outcomes and has narrowed male/female gaps in enrollment and attainment. while schooling remains associated with mortal-ity, the association is neither as strong nor as consistent as it had been, and continued success leaves diminished room for further improvement. educa-tion undoubtedly has a causal effect on mortality, particularly for children, but the relationship may be overshadowed by factors relating to health systems, poverty, and governance.
the modern path to superior health achievement thus requires a more circuitous route. Superior achievers are identified by success on some devel-opment indicators and by the lack of abject failure on all dimensions. along with schooling, health expenditure and poverty play minor roles. Superior achievers also distinguish themselves from poor achievers by performing well on at least one governance indicator and by avoiding extremely poor performance on all. but no simple narrative of success presents itself, much less clear policy prescriptions. this story is made more difficult by the rising significance of adult mortality and the more complex set of underlying social and political risk factors (Rajaratnam et al. 2010b).
the significance of adult mortality is apparent in the number of coun-tries burdened by exceptionally poor adult mortality outcomes relative to per capita income, even after accounting for unique burdens like Hiv/aidS in Southern africa and the post-Soviet mortality spike. today’s poor health achievers are overidentified by limitations across the domains of education, health spending, poverty reduction, and governance. there are reasons for guarded optimism that such countries can shift toward less extreme levels of

r a n d a L L K u h n 683
underachievement, including the eventual improvements seen by caldwell’s generation of poor achievers, global progress in scale-up of Hiv/aidS treat-ment, and signs of increased health investment and poverty reduction. but moderate levels of achievement are not the goal of global health, and so we inevitably return to the lessons we might learn from superior achievers.
the very idea of superior health achievement should be self-limiting. a follow-up of caldwell’s original health achievers revealed the extent of income and mortality convergence between superior and poor achievers. Superior achievers grew wealthier, raising the standard for inclusion. Poor achievers fell behind economically even as they closed the mortality gap. as the systems, technologies, and rules governing health become more glo-balized, exceptional health outcomes relative to income should grow more unusual (mcmichael and beaglehole 2000; beaglehole et al. 2004). Given these forces of homogenization, the continued success of china, cuba, costa Rica, and vietnam is both inspiring and puzzling. the fact that each country extended earlier child mortality advantages into adult mortality success im-plies the existence of a path to sustainable health improvement. Yet the few common themes that once unified these countries’ routes to success have lately vanished. while china and vietnam made considerable efforts to rein in and privatize health expenditures, cuba and costa Rica pursued the op-posite route.
How do we explain the continued success of china and vietnam? con-cerns over the robustness of these results, most notably the possibility of an eventual lagged smoking effect, were noted above. a more positive explana-tion relies on life-course effects, with the possibility that earlier success in promoting child health has carried over into adulthood and future genera-tions. Given considerable micro-level evidence on the effects of health in early life on metabolic and immunologic function in adulthood, comparable macro-level analysis is needed (barker and osmond 1986; Preston et al. 1998; crimmins and Finch 2006). life-course effects may also operate through be-havioral pathways. effective health systems may engender a culture of health demand that can survive the scaling back of public health investment. Some analysts have in fact argued that china’s unusually high household savings rate, particularly in rural areas, derives from the anticipation of catastrophic health expenditures no longer covered by the state (Yip and Hsiao 2008).
even as national indicators offer little insight into old or new superior health achievers, two emerging patterns of regional success, in latin america and the muslim world, bear closer scrutiny. latin america’s success story is now increasingly well understood. beyond the four superior achievers from latin america, every Spanish-speaking nation in latin america ranks higher on life expectancy than on income, even as non-Spanish neighbors lag behind. in his history of mortality success in four latin american and four asian societies, mcGuire (2010) pointed to cost-effective primary health care programs and increasing democratic inclusion as pillars of success in latin

684 r o u t e s t o L o w M o r ta L i t y i n P o o r c o u n t r i e s r e v i s i t e d
america, although it was often not clear whether democratization was leading to improved health, or health was leading to democratization.
equally significant for latin america is the relationship between mor-tality success and progress toward peace and reconciliation in the wake of decades of conflict and autocracy (Shiffman and del valle 2006). Since the unsteady resolution of civil war in 1992, Guatemala, historically the region’s most troubled nation, has moved from a relative underachiever (–7 relative ranking) to a relative overachiever (+7). el Salvador has made a similar move from –4 in 1990 to +15 in 2007. bolivia, perhaps the setting of the region’s deepest conflict at present, is also the poorest relative health achiever (+1). by contrast, Paraguay, the world’s top relative health achiever, is notable not just for its ethnic homogeneity (a large majority are mestizo) but also for the fact that 90 percent of the population speak both Spanish and the indigenous Guarani language (Rubin 1985). while the pathway from conflict to health system failure is now well understood, the potential path from conflict resolu-tion or recovery to comprehensive success deserves much greater attention.
Recent mortality reductions in the muslim world are less widely known but equally remarkable. Substantial reductions in child and adult mortality have taken place in every region, and some of the most striking successes have come in the arab heartland. while relative success is in part a product of economic failure, even the absolute achievements are substantial, particularly in light of the pessimism caldwell expressed in 1986. at the proximate level, improvements stem from targeted investments in health systems and from a dramatic narrowing of the male/female schooling gap. muslim populations may also have been less affected by Hiv/aidS and spikes in non-communi-cable disease as a result of protective behavioral factors (idler 2009; Rogers et al. 2010), although testing such a hypothesis would require great sensitivity to research design, causation, and heterogeneity.
looking beyond proximate risks, the successes and failures of muslim countries offer a roadmap of the routes to low mortality. First, countries that are dependent on human capital as a source of economic growth saw far greater success than those that were resource dependent. the most successful muslim countries are those, like morocco, Syria, Jordan, and bangladesh, that depend on human capabilities for development, just as china and vietnam did a generation before. bangladesh, perhaps the most widely publicized suc-cess, reduced mortality in an era of steep fertility decline and rising women’s status, each driven by the country’s dependence on human capital (amin et al. 2002; amin and lloyd 2002; trapp et al. 2004).
Human capital dependence may predispose countries to superior health achievement, but why do some countries convert this motivation into success and not others? Here i return to the complex relationship between social soli-darity, democratic change, health systems, and mortality success first introduced by caldwell. bangladesh ranks as one of the more democratic countries in the muslim world, but mortality decline began in a period of autocracy from

r a n d a L L K u h n 685
1982 to 1990 (cleland et al. 1994; chowdhury 1995; Kabir et al. 2008; Hale et al. 2009). what is perhaps clearer is that the bangladesh’s success relates in part to the spirit of solidarity and innovation engendered by the country’s independence in 1971 from Pakistan (cleland et al. 1994; chowdhury 1995; basu et al. 2000). contrast this experience with that of lebanon, which is the most democratic country in the arab world but also a poor health achiever. a sharp sectarian divide, civil conflict, and israeli occupation and invasion have hampered both the consistent delivery of health services and the formation of national consensus. lebanon may offer a different version of the reversed cau-sation between democracy and health. Perhaps autocratic regimes in the region have maintained power because they improved the delivery of basic health and education, while lebanon’s push toward democracy and the rancorous dissent among its Shia population stem from a failure to make such improvements.
this raises a final point relating to ethnic homogeneity and social con-sensus. the countries of latin america and the muslim world tend to be more homogeneous than average. the more homogeneous countries within each sphere have also achieved greater success in lowering mortality. but this should not imply a simple path from homogeneity to health. First, many of the countries in question were homogeneous long before they reduced mortality, so homogeneity is not a sufficient condition for success. Second, the study of imagined communities demonstrates how fluid the construction of ethnic iden-tity and difference can be, particularly when unity is motivated by collective national interest (anderson 1991; Hollinger 2006). Jordan has an almost ex-clusively arab population, yet as late as 1970 its population was deeply divided between native Jordanians and Palestinians displaced from israel and the west bank. Poor health standards and civil war portended collapse, not the gradual process of multicultural integration that actually unfolded.
Reversing our chain of causation once again, one may ask whether homogeneous countries produce better health, or whether healthier popula-tions produce unified countries. the answer, of course, may be both. Partition may have paved the way for success in bangladesh, bosnia and Herzegovina, and eritrea, but collective trauma may also create opportunities for solidarity in which health systems offer one platform for unity. this latter case would seem to apply in Jordan, in ethnically diverse eritrea (muller 2005), and even in bangladesh, whose ethnic homogeneity in 1971 belied a bloody division between separatists and those who wished to remain in Pakistan. in all in-stances, dependence on human resources, rather than on minerals, may have reinforced incentives for unity.
caldwell’s ideas on the importance of health systems and national con-sensus are still valid, yet it remains unclear whether and how these lessons can be put into action. the past decade of action on global health has seen remarkable progress, but we are now entering the most critical period of all. as poor achievers seek hoped-for health improvements and millennium de-velopment Goals are met, there will also be opportunities for governments
686 r o u t e s t o L o w M o r ta L i t y i n P o o r c o u n t r i e s r e v i s i t e d
and donors to declare victory and move on to other priorities. but there will also be opportunities for poor-achieving countries to jump directly to superior achievement, to reduce health disparities, and to renew their social contracts. these opportunities are further enhanced by new action-learning platforms that allow governments, donors, communities, and diasporas to work to-gether on identifying needs, implementing programs, and maintaining mutual accountability and sustainability (Gruen et al. 2008). with improved informa-tion technologies and a better understanding of the national determinants of health, we may yet find ways for all countries to be superior achievers.
Notes
Figures in this article are available in color in the electronic edition of the journal.
the author gratefully acknowledges the financial, intellectual, and moral support of the Frederick S. Pardee center for international Futures at the university of denver. drafts of this article were presented to a workshop on “the distal determinants of Health,” spon-sored by the clinton Global initiative and the Frederick S. Pardee center for the Study of the longer-Range Future at boston university, and to numerous students in “Global Health affairs: theory and Practice” at the university of den-ver. the author wishes to thank Jane menken, Rick Rogers, Sangeetha madhavan, britt Reiers-gord, and most of all his wife, linda mamoun, for their advice and editorial support.
1 WDR included 99 countries with a pop-ulation over one million that were classified as lower income (34), lower middle income (38), upper middle income (32), and high income oil exporters (5) (world bank 1984). data on imR and life expectancy were available for all countries, but income data were not available for 13 of these countries, including six lower income countries (afghanistan, bhutan, Kam-puchea aka cambodia, laos, mozambique, vietnam); four lower middle income (cuba, north Korea, lebanon, mongolia); and two upper middle income (iran, iraq).
2 caldwell excluded eight east european non-market economies because of a lack of economic data. these eight subsequently split into 22 nations: albania, Romania, bulgaria, Poland, and Hungary emerged as five unitary countries (5); czechoslovakia emerged as the czech Republic and Slovakia (2); uSSR split into armenia, azerbaijan, belarus, estonia,
Georgia, Kazakhstan, Kyrgyzstan, latvia, lith-uania, moldova, Russian Federation, tajikistan, turkmenistan, ukraine, and uzbekistan (15 countries); while German democratic Republic dissolved into Federal Republic of Germany (–1). elsewhere, seven nations were added: namibia gained independence from South af-rica in 1990, eritrea split from ethiopia in 1993, timor-leste emerged from indonesia in 2002, and, as of 2007, the partition of Yugoslavia, which was itself replaced by Serbia, led to the formation of croatia in 1991, Slovenia in 1991, bosnia and Herzegovina in 1992, and macedo-nia (Former Yugoslav Republic) in 1993. two other former Yugoslav republics, montenegro and Kosovo, were not yet included in 2007 statistics. Yemen, PdR and Yemen, aR reunited in 1990, reducing the net total of additional nations to 28. Seven countries passed the one million population mark: botswana, Gabon, Gambia, Guinea-bissau, mauritius, Qatar, Swaziland. Six countries with between 500,000 and one million people were added: bahrain, comoros, djibouti, equatorial Guinea, Fiji, Guyana. Finally, eight countries graduated to high-income status: estonia, Greece, Hong Kong, Hungary, Portugal, Singapore, Slovenia, and South Korea.
3 For imR, 1q
0 was adjusted; for cmR,
1q
0
and 4q
1; for amR,
5q
15,
5q
20, …,
5q
55.
4 with the PPP adjustment, the income gap between superior and poor achievers is reduced from the original 8-to-1 ratio to a still sizable ratio of about 5-to-1.
5 this gap between income and expec-tancy level partly obscures a unique pattern of extreme male mortality disadvantage in the Russian Federation. if Russia’s men and

r a n d a L L K u h n 687
women were ranked separately, women would have a life expectancy of 73 and would fall all the way to 28th poorest (with a –14 relative ranking). Russian men would have a life expectancy of 60 and a relative rank of –73.
6 other FSu nations that are moderately poor achievers include turkmenistan at 19th (–25), belarus at 21st (–23), azerbaijan at 26th (–17), and ukraine at 31st (–11). if esto-nia were still considered a developing country it would have entered the list at 24th (–20).
7 libya is 22nd poorest (–23 relative ranking), oman 28th (–15), iran 40th (–7), iraq 47th (–4), and algeria 51st (–3).
8 tajikistan is 13th (+30), Syria 15th (+28), tunisia 19th (+26), bosnia and Herze-govina 20th (+26), uzbekistan and Kyrgyzstan are tied for 27th (+21), and Jordan is 29th (+21).
9 chad 16th poorest (–27), nigeria 17th (–26), turkmenistan 18th (–25), lebanon 20th (–24), libya 22nd (–23), malaysia 24th (–19), azerbaijan 26th (–17), djibouti 27th (–16), oman 28th (–15), afghanistan 29th (–13), bahrain 30th (–13).
10 on the whole, majority-muslim su-perior achievers do not perform much worse when looking only at females. all 11 countries remain in the top quartile of superior achieve-ment. bangladesh leaves the list of superior achievers but remains in the top quartile and is replaced in the group of superior achievers by bosnia and Herzegovina. muslim nations do feature more prominently on the list of poor female life expectancy achievers, how-ever. Qatar, nigeria, and lebanon would join the group of poorest achievers, and 20 of the 33 countries in the poorest quartile on female life expectancy achievement would be muslim compared to only 13 for total life expectancy.
11 colombia is 21st (+25), Panama 23rd (+24), Honduras 25th (+23), and ecuador 30th (+21). non-Spanish-speaking countries fare worse. in addition to trinidad’s poor-achiever status, Guyana has a relative rank of –3 and Suriname –7.
12 we also should be able to exclude countries on the basis of an independent causal force behind the crisis, not merely mortality itself, so as not to sample on the dependent variable.
13 i exclude five middle-income coun-tries from the former South african economic sphere that also happen to have adult Hiv prevalence of 15 percent or higher and poor mortality achievement: Swaziland (26 per-cent), botswana (24 percent), South africa (18 percent), lesotho (23 percent), namibia (15 percent). Zimbabwe was already excluded for other reasons. the remaining three coun-tries in the region are both poorer and have lower Hiv/aidS prevalence. only Zambia (15 percent) would have joined the list of poor mortality achievers with the exclusion of these other five countries, while malawi (12 per-cent) and mozambique (12 percent) are even poorer and close to the middle of the relative life expectancy rankings, so their exclusion will not affect subsequent results.
14 the Russian mortality disadvantage is more difficult to identify in the european FSu nations, where Russian minorities are simultaneously smaller, more similar to the majority ethnic groups, and better assimilated into society. disparities exist between Russian and majority populations, but after correcting for the inevitable ethnic misidentifications, life expectancy disparities may not exceed 2 years. latvia and lithuania are comparable in rela-tive mortality rank, yet lithuania’s Russian majority amounts to only 9 percent compared to latvia’s 30 percent.
15 From the earlier list, morocco and bangladesh fell to a +24 relative ranking, tied with tajikistan and more distant from nepal and Peru than they are from a group of ten trailing nations at or above +20, together con-stituting a group of strong mortality achievers. these are Philippines (+20), colombia (+21), liberia (+21), madagascar (+21), Panama (+21), bosnia and Herzegovina (+22), Haiti (+22), Syria (+22), tunisia (+22), tajikistan (+24).
16 For each indicator, countries with available data were assigned a z-score indicat-ing the number of standard deviations from the mean. income poverty data were avail-able for 99 countries, total undernourished for 112 countries, and child underweight for 109 countries. all 121 countries had data on at least one indicator, 110 had data on two or more, 88 had data on all three. For each coun-try, the poverty index was then calculated as the average of all available z-scores.

688 r o u t e s t o L o w M o r ta L i t y i n P o o r c o u n t r i e s r e v i s i t e d
References
aisa, Rosa and Fernando Pueyo. 2006. “Government health spending and growth in a model of endogenous longevity,” Economics Letters 90(2): 249–253.
allen, tim. 2005. “aidS and evidence: interrogating some ugandan myths,” Journal of Biosocial Science 38(1): 7–28.
amin, Sajeda, alaka malwade basu, and Rob Stephenson. 2002. “Spatial variation in contracep-tive use in bangladesh: looking beyond the borders,” Demography 39(2): 251–267.
amin, Sajeda and cynthia b. lloyd. 2002. “women’s lives and rapid fertility decline: Some les-sons from bangladesh and egypt,” Population Research and Policy Review 21(4): 275–317.
anand, Sudhir and martin Ravallion. 1993. “Human development in poor countries: on the role of private incomes and public services,” The Journal of Economic Perspectives 7(1): 133–150.
anderson, benedict. 1991. Imagined Communities: Reflections on the Origin and Spread of National-ism. new York and london: verso.
baldacci, emmanuele, benedict clements, Sanjeev Gupta, and Qiang cui. 2008. “Social spending, human capital, and growth in developing countries,” World Development 36(8): 1317–1341.
barham, tania. 2009. “effects of family planning and child health interventions on adolescent cognitive functioning: evidence from matlab in bangladesh,” institute of behavioral Sci-ence working Paper Series. university of colorado, boulder.
barker, david J. P. and clive osmond. 1986. “infant mortality, childhood nutrition, and ischae-mic heart disease in england and wales,” The Lancet 327(8489): 1077–1081.
beaglehole, Robert et al. 2008. alma-ata: Rebirth and Revision 3 improving the prevention and management of chronic disease in low-income and middle-income countries: a priority for primary health care. The Lancet 372: 940–49.
beaglehole, Robert, Ruth bonita, Richard Horton, orvill adams, and martin mcKee. 2004. “Public health in the new era: improving health through collective action,” The Lancet 363(9426): 2084–2086.
becker, charles m. and dina S. urzhumova. 2005. “mortality recovery and stabilization in Kazakhstan, 1995–2001,” Economics & Human Biology 3(1): 97–122.
berman, Peter. 1995. “Health sector reform: making health development sustainable,” Health Policy 32(1-3): 13–28.
besley, timothy and masayuki Kudamatsu. 2006. “Health and democracy,” American Economic Review 96(2): 313–318.
black, Robert e. et al. 2010. “Global, regional, and national causes of child mortality in 2008: a systematic analysis,” The Lancet 375(9730): 1969–1987.
boschi-Pinto, cynthia, mark Young, and Robert e. black. 2010. “the child health epidemiology reference group reviews of the effectiveness of interventions to reduce maternal, neonatal and child mortality,” International Journal of Epidemiology 39(Supplement 1): i3.
bryant, John. 1998. “communism, poverty, and demographic change in north vietnam,” Population and Development Review 24(2): 235–269.
bryce, Jennifer et al. 2005. “can the world afford to save the lives of 6 million children each year?,” The Lancet 365(9478): 2193–2200.
caldwell, John c. 1976. “toward a restatement of demographic transition theory,” Population and Development Review 2(3/4): 321–366.
———. 1980. “mass education as a determinant of the timing of fertility decline,” Population and Development Review 6(2): 225–255.
———. 1986. Routes to low mortality in poor countries,” Population and Development Review 12(2): 171–220.
caldwell, John c. and Pat caldwell. 1987. “the cultural context of high fertility in sub-Saharan africa,” Population and Development Review 13(3): 409–437.
———. 1996. “the african aidS epidemic,” Scientific American 274(3): 62–68.caldwell, John c., Pat caldwell, and Pat Quiggin. 1989. “the social context of aidS in sub-
Saharan africa,” Population and Development Review 15(2): 185–234.

r a n d a L L K u h n 689
campbell, catherine. 1997. “migrancy, masculine identities and aidS: the psychosocial context of Hiv transmission on the South african gold mines,” Social Science and Medicine 45(2): 273–281.
chen, lincoln c., Friederike wittgenstein, and elizabeth mcKeon. 1996. “the upsurge of mortality in Russia: causes and policy implications,” Population and Development Review 22(3): 517–530.
chowdhury, Zafrullah. 1995. The Politicals of Essential Drugs: The Makings of a Successful Health Strategy: Lessons from Bangladesh. london: Zed books.
cleland, J., J. F. Phillips, S. amin, and G. m. Kamal. 1994. The Determinants of Reproductive Change in Bangladesh: Success in a Challenging Environment. washington, dc: world bank.
commission on the Social determinants of Health (cSdH). 2008. Closing the Gap in a Genera-tion: Health Equity Through Action on the Social Determinants of Health. Geneva: world Health organization
crimmins, eileen m. and caleb e. Finch. 2006. “infection, inflammation, height, and longevity,” Proceedings of the National Academy of Sciences 103(2): 498–503.
cutler, david, angus deaton, and adriana lleras-muney. 2006. “the determinants of mortal-ity,” The Journal of Economic Perspectives 20(3): 97–120.
cutler, david and Grant miller. 2005. “the role of public health improvements in health ad-vances: the twentieth-century united States,” Demography 42(1): 1–22.
de waal, alex. 2003. “why the Hiv/aidS pandemic is a structural threat to africa’s governance and economic development,” Fletcher Forum of World Affairs, 27: 6–24.
ezzati, majid, alan d. lopez, anthony Rodgers, and christopher J. l. murray, eds. 2004. Comparative Quantification of Health Risks: Global and Regional Burden of Disease Attributable to Selected Major Risk Factors. Geneva: world Health organization.
Fao. 2009. FaoStat online database «http://faostat.fao.org». Filmer, deon, Jeffrey S. Hammer, and lant H. Pritchett. 2000. “weak links in the chain: a diagno-
sis of health policy in poor countries,” The World Bank Research Observer 15(2): 199–224.———. 2002. “weak links in the chain ii: a prescription for health policy in poor countries,”
The World Bank Research Observer 17(1): 47–66.Filmer, deon and lant H. Pritchett. 1999. “the impact of public spending on health: does money
matter?,” Social Science and Medicine 49(10): 1309–1323.Food and agriculture organization of the united nations (Fao). 2010. “Fao countryStat
database,” «www.fao.org/corp/statistics/en/.»Gakidou, emmanuela, margaret Hogan, and alan d. lopez. 2004. “adult mortality: time for a
reappraisal,” International Journal of Epidemiology 33(4): 710–717.Gallup, John luke and Jeffrey d. Sachs. 2001. “the economic burden of malaria,” The American
Journal of Tropical Medicine and Hygiene 64(1): 85–96.Gathmann, christine and Grant miller. 2010. The Gorbachev Anti-Alcohol Campaign and Russia’s
Mortality Crisis.Gauri, varun and Peyvand Khaleghian. 2002. “immunization in developing countries: its politi-
cal and organizational determinants,” World Development 30(12): 2109–2132.Gerring, John. 2008. Public Health Performance: A Model-Based Approach.Grignon, michel. 2008. “the role of education in health system performance,” Economics of
Education Review 27(3): 299–307.Gruen, Russell l. et al. 2008. “Sustainability science: an integrated approach for health-pro-
gramme planning,” The Lancet 372(9649): 1579–1589.Guillot, michel. 2007. “mortality in Kyrgyzstan since 1958: Real patterns and data artifacts,”
Espace populations sociétés, Space populations and societies 2007(1): 113–126.Gupta, Sanjeev, marjin verhoeven, and erwin R tiongson. 2002. “the effectiveness of govern-
ment spending on education and health care in developing and transition economies,” European Journal of Political Economy 18(4): 717–737.
Hale, lauren, Julie davanzo, abdur Razzaque, and mizanur Rahman. 2009. “which factors explain the decline in infant and child mortality in matlab, bangladesh?,” Journal of Population Research 26(1): 3–20.

690 r o u t e s t o L o w M o r ta L i t y i n P o o r c o u n t r i e s r e v i s i t e d
Hollinger, david a. 2006. “From identity to solidarity,” Daedalus 135(4): 23–31.Hughes, barry b. et al. 2010. Improving Global Health: Patterns in Potential Human Progress. volume
3. boulder, co: Paradigm Publishers. idler, ellen l. 2009. “Health and religion” in william cockerham (ed.), The New Blackwell Com-
panion to Medical Sociology. oxford: wiley-blackwell.Kabir, m., Rafiquel islam chowdhury, and Ruhul amin. 2008. “infant and child mortality levels
and trends in bangladesh,” Journal of Biosocial Science 27(02): 179–192.leon, david a. and vladmir m. Shkolnikov. 1998. “Social stress and the Russian mortality
crisis,” Journal of the American Medical Association 279(10): 790.lieberman, evan S. 2007. “ethnic politics, risk, and policy-making: a cross-national statisti-
cal analysis of government responses to Hiv/aidS,” Comparative Political Studies 40(12): 1407–1432.
macinko, James a., leiyu Shi, barbara Starfield, and John t. wulu. 2003. “income inequality and health: a critical review of the literature,” Medical Care Research and Review 60(4): 407–452.
marks, Shula. 2002. “an epidemic waiting to happen? the spread of Hiv/aidS in South africa in social and historical perspective,” African Studies 61(1): 13–26.
marmot, michael. 2005. “Social determinants of health inequalities,” The Lancet 365(9464): 1099–1104.
marquez, Patricio, marc Suhrcke, martin mcKee, and lorenzo Rocco. 2007. “adult health in the Russian Federation: more than just a health problem,” Health Affairs 26(4): 1040–1051.
mathers, colin and ties boerma. 2010. “mortality measurement matters: improving data col-lection and estimation methods for child and adult mortality,” PLoS Medicine 7(4).
mcGuire, James w. 2010. Wealth, Health, and Democracy in East Asia and Latin America. cambridge, uK: cambridge university Press.
mcKeown, thomas. 1976. The Modern Rise of Population. new York: academic Press. mcKeown, thomas and R. G. Record. 1962. Reasons for the decline of mortality in england and
wales during the nineteenth century,” Population Studies 16(2): 94–122.mcmichael, anthony J. and Robert beaglehole. 2000. “the changing global context of public
health,” The Lancet 356(9228): 495–499.mcmichael, anthony, martin mcKee, vladimir Shkolnikov, and tapani valkonen. 2004. “mor-
tality trends and setbacks: global convergence or divergence?,” The Lancet 363(9415): 1155–1159.
men, tamara, Paul brennan, Paolo boffetta, and david Zaridze. 2003. “Russian mortality trends for 1991–2001: analysis by cause and region,” British Medical Journal 327(7421): 964–969.
mills, anne, Ruairi brugha, Kara Hanson, and barbara mcPake. 2002. “what can be done about the private health sector in low-income countries?,” Bulletin of the World Health Organization 80: 325–330.
moser, Kath, vladimir Shkolnikov, and david a. leon. 2005. “world mortality 1950–2000: divergence replaces convergence from the late 1980s,” Bulletin of the World Health Organi-zation 83(3): 202–209.
mosley, w. Henry. 1984. “child survival: Research and policy,” Population and Development Review 10(Supplement): 3–23.
mosley, w. Henry and lincoln c. chen. 1984. “an analytical framework for the study of child sur-vival in developing countries,” Population and Development Review 10(Supplement): 25–45.
muller, tanja R. 2005. “Responding to the Hiv/aidS epidemic: lessons from the case of eritrea,” Progress in Development Studies 5(3): 199–212.
murray, christopher J. l., thomas laakso, Kenji Shibuya, Kenneth Hill, and alan d. lopez. 2007. “can we achieve millennium development Goal 4? new analysis of country trends and forecasts of under-5 mortality to 2015,” The Lancet 370(9592): 1040–1054.
nathanson, constance a. 1996. “disease prevention as social change: toward a theory of public health,” Population and Development Review 22(4): 609–637.
nixon, John and Philippe ulmann. 2006. “the relationship between health care expenditure and health outcomes,” The European Journal of Health Economics 7(3): 7–18.

r a n d a L L K u h n 691
omran, abdel R. 1971. “the epidemiologic transition: a theory of the epidemiology of popula-tion change,” Milbank Memorial Fund Quarterly 49(4): 509–538.
Pavlenko, aneta. 2006. “Russian as a lingua franca,” Annual Review of Applied Linguistics 26: 78–99.
Peto, Richard, Zheng-ming chen, and Jillian boreham. 2009. “tobacco: the growing epidemic in china,” CVD Prevention and Control 4: 61–70.
Preston, Samuel H. 1975. “the changing relation between mortality and level of economic development,” Population Studies 29(2): 231–248.
Preston, Samuel H. and michael R. Haines. 1991. Fatal Years: Child Mortality in Late Nineteenth-century America. Princeton university Press.
Preston, Samuel H., mark e. Hill, and Greg l drevenstedt. 1998. “childhood conditions that predict survival to advanced ages among african-americans,” Social Science and Medicine 47(9): 1231–1246.
Preston, Samuel H. and Haidong wang. 2006. “Sex mortality differences in the united States: the role of cohort smoking patterns,” Demography 43(4): 631–646.
Pritchett, lant and lawrence H. Summers. 1996. “wealthier is healthier,” Journal of Human Resources 31(4): 841–868.
Rajaratnam, J. K. et al. 2010a. “neonatal, postneonatal, childhood, and under-5 mortality for 187 countries, 1970–2010: a systematic analysis of progress towards millennium devel-opment Goal 4,” The Lancet 375: 1988–2008.
Rajaratnam, Julie Knoll et al. 2010b. “worldwide mortality in men and women aged 15–59 years from 1970 to 2010: a systematic analysis. The Lancet 375(9727): 1704–1720.
Rasanathan, Kumanan, eugenio villar montesinos, don matheson, carissa etienne, and tim evans. 2009. “Primary health care and the social determinants of health: essential and complementary approaches for reducing inequities in health,” Journal of Epidemiology and Community Health.
Rajkumar, andrew Sunil and vinaya Swaroop. 2008. “Public spending and outcomes: does governance matter?,” Journal of Development Economics 86(1): 96–111.
Reniers, Georges et al. 2009. “Steep declines in population-level aidS mortality following the introduction of antiretroviral therapy in addis ababa, ethiopia,” AIDS 23(4): 511–518.
Rogers, Richard G., Robert a. Hummer, Patrick m. Krueger, and Fred c. Pampel. 2005. “mor-tality attributable to cigarette smoking in the united States,” Population and Development Review 31(2): 259–292.
Rogers, Richard G., Patrick m. Krueger, and Robert a. Hummer. 2010. “Religious attendance and cause-specific mortality in the united States,” in christopher G. ellison and Robert a. Hummer (eds.), Religion, Families, and Health: Population-Based Research in the United States. new brunswick, nJ: Rutgers university Press, pp. 292–320.
Ross, michael. 2006. “is democracy good for the poor?,” American Journal of Political Science 50(4): 860–874.
Rubin, J. 1985. “the special relation of Guarani and Spanish in Paraguay,” in nessa wolfson and Joan manes (eds.), Language of Inequality. new York: mouton, pp. 111–120.
Sachs, Jeffrey d. 2001. “macroeconomics and health: investing in health for economic develop-ment: report,” Geneva: world Health organization.
Sen, amartya. 1998. “mortality as an indicator of economic success and failure,” The Economic Journal 108(446): 1–25.
Sen, amartya, and Jean drèze. 1989. Hunger and Public Action. wideR Studies in development economics. oxford: oxford university Press.
Shandra, John m., Jenna nobles, bruce london, and John b. williamson. 2004. “dependency, democracy, and infant mortality: a quantitative, cross-national analysis of less developed countries,” Social Science and Medicine 59(2): 321–333.
Shang, baoping and dana Goldman. 2008. “does age or life expectancy better predict health care expenditures?,” Health Economics 17(4): 487–501.
Shen, c. e., and John b. williamson. 2001. “accounting for cross-national differences in infant

692 r o u t e s t o L o w M o r ta L i t y i n P o o r c o u n t r i e s r e v i s i t e d
mortality decline (1965–1991) among less developed countries: effects of women’s status, economic dependency, and state strength,” Social Indicators Research 53(3): 257–288.
Shiffman, Jeremy and ana lucía Garcés del valle. 2006. “Political history and disparities in safe motherhood between Guatemala and Honduras,” Population and Development Review 32(1): 53–80.
Shkolnikov, vladmir, martin mcKee, and david a. leon. 2001. “changes in life expectancy in Russia in the mid-1990s,” The Lancet 357(9260): 917–921.
Soares, Rodrigo R. 2005. “mortality reductions, educational attainment, and fertility choice,” American Economic Review 95(3): 580–601.
———. 2007. “on the determinants of mortality reductions in the developing world,” Population and Development Review 33(2): 247–287.
Stoneburner, Rand l. and daniel low-beer. 2004. “Population-level Hiv declines and behav-ioral risk avoidance in uganda,” Science 304(5671): 714–718.
Subramanian, S. v., Paolo belli, and ichiro Kawachi. 2002. “the macroeconomic determinants of health,” Annual Review of Public Health 23(5): 287–302.
Subramanian, S. v. and ichiro Kawachi. 2004. “income inequality and health: what have we learned so far?,” Epidemiologic Reviews 26(1): 78–91.
Szreter, Simon. 1997. “economic growth, disruption, deprivation, disease, and death: on the importance of the politics of public health for development,” Population and Development Review 23(4): 693–728.
trapp, erin m., Jill williams, Jane menken, and Shannon Fisher. 2004. “disappearing sex-bias in child health in bangladesh,” institute of behavioral Science, university of colorado at boulder, working Paper Pac 2004-3.
travis, Phyllida et al. 2004. “overcoming health-systems constraints to achieve the millennium development Goals,” The Lancet 364(9437): 900-906.
uneSco institute for Statistics. 2010. “world education indicators,” http: //www.uis.unesco.org/».
uniceF. 2010. “childinfo: monitoring the situation of women and children,” new York. «http: //www.childinfo.org/statistical_tables.html».
weil, david n. 2007. “accounting for the effect of health on economic growth,” Quarterly Journal of Economics 122(3): 1265–1306.
wilkinson, Richard G. and Kate e. Pickett. 2006. “income inequality and population health: a review and explanation of the evidence,” Social Science and Medicine 62(7): 1768–1784.
wilson, chris. 2001. “on the scale of global demographic convergence 1950–2000,” Population and Development Review 27(1): 155–171.
world bank. 1984. World Development Report 1984. new York: oxford university Press.———. 2009. world development indicators database. washington, dc.———. 2010. worldwide Governance indicators. «http://info.worldbank.org/governance/
wgi/». world Health organization (wHo). 2009. World Health Statistics Report. Geneva.———. 2010. national Health accounts database. Geneva. http: //www.who.int/nha/en/Xu, Ke, david b. evans, Kei Kawabata, Riadh Zeramdini, Jan Klavus, and christopher J.l.
murray. 2003. “Household catastrophic health expenditure: a multicountry analysis,” The Lancet 362(9378): 111-117.
Yip, winnie and william c. Hsiao. 2008. “the chinese health system at a crossroads,” Health Affairs 27(2): 460-468.
Zaridze, david et al. 2009. “alcohol poisoning is a main determinant of recent mortality trends in Russia: evidence from a detailed analysis of mortality statistics and autopsies,” Interna-tional Journal of Epidemiology 38(1): 143–153.