Embed Size (px)
Citation preview
8/6/2019 Royal Ceramics Lanka PLC
http://slidepdf.com/reader/full/royal-ceramics-lanka-plc 1/11
Page 1
Equity Research Report
20 May 201165, Braybrooke Place, Colombo 2, Sri Lanka
[email protected], +94 11 5220200
Equity Research-Q4 2011 Earnings Review
Royal Ceramics Lanka PLC (RCL: LKR 155.60)
Disclaimer: In compiling this report, Bartleet Mallory Stockbrokers (Pvt) Ltd (BMS) has made every endeavour to
ensure its accuracy, but cannot hold ourselves for any errors that may be found herein. We further disclaim all respon-
sibilities for any loss or damage which may be suffered by any person relying upon such information or any options,
conclusions or recommendations herein whether that loss or damage is caused by any fault or negligence on the part
of BMS.
RCL Price Vs ASPI Movement
Sector PER and PBV Trend
BMS Research Team
Net Revenue up 29.2% YoY to LKR 5,751mn from LKR 4,451mn
We believe the growth in volumes to be the key catalyst that led to top line growth.
The prices have remained constant for both its Tile and Sanitary ware segment; indi-
cating that the growth in volumes drove revenue in FY 2011. We expect a Net Reve-
nue growth of 19.1% to LKR 6,848mn (previous estimate- LKR 7,460mn) for FY 2012E
and a growth of 20.9% to LKR 8,279mn for FY 2013E, further steered by increased
volumes.
Flat Gross Profit MarginsRCL achieved a Gross Profit growth of 25.4% to LKR 2,656mn in FY 2011. We expect
RCL’s Gross Profit to grow by 17.4% YoY to LKR 3,120mn (previous estimate- LKR
3,446mn) in FY 2012E and by 22.8% to LKR 3,828 in FY 2013E. Gross Profit margins
are expected to be steady at 45.6% for FY 2012E and 46.2% for FY 2013E.
EBIT growth of 27.2% in FY 2011 to LKR 1,579mn (previous estimate – LKR
1,560mn)
EBIT is adjusted for non-recurring gains of LKR 164mn in FY 2011. We expect an EBIT
growth of 5.5% to LKR 1,665mn (previous estimate-LKR 1,875mn) in FY 2012E and
25.2% to LKR 2,085mn in FY 2013E. We believe the growth in volumes coupled with
cost savings will aid in EBIT growth.
Valuation – Attractive at the current price of LKR 155.60; upside potential
of 11.8%
Based on our new estimates we have arrived at a target price of LKR 173.93
(previous estimate-LKR 165.28). Our valuations are based on a WACC of ~ 9.4% and
terminal growth of 3.0%. The WACC is based on a debt to equity of 50%, beta of 0.91
(based on ASPI vs. RCL stock price movements), risk free rate of 7.3% and an equity
risk premium of 4.0%.
% Change in Price Movement
RCL - EPS
Research Manager—Nikita Tissera
Senior Research Analyst - Nusrath Mohideen
Research Analyst - Vajirapanie BandaranayakeResearch Analyst - Sahani De Silva
Research Analyst - Jennita Silva
Research Analyst - Thilini Yatawara
Business Analyst - Premali Fernando
Trainee Research Analyst - Rakshila Perera
5.00
8.00
11.00
14.00
17.00
20.00
2005 2006 2007 2008 2009 2010 6-May-11
%
12 Months TB Yield
0.8
1.4
2.0
2.6
3.2
5
10
15
20
25
2007 2008 2009 2010 May-11
PBV (x)PER (x)
PER PBV
3.00
7.00
11.00
15.00
19.00
2007 2008 2009 2010 2011E 2012E 2013E
-4.00%
-2.00%
0.00%
2.00%
4.00%
6.00%
8.00%
Mar-10 Jun-10 Oct-10 Feb-11
% change in price movement
RCL ASPI
50
70
90
110
130
150
170
3,500
4,250
5,000
5,750
6,500
7,250
8,000
8,750
Mar-10 May-10 Aug-10 Oct-10 Jan-11 Apr-11
A SP I R CL Cl os in g p ric es
2007 2008 2009 2010 2011E 2012E 2013E
Revenue 2,594,180 3,474,819 3,741,172 4,451,169 5,751,383 6,848,465 8,279,889 Revenue growth (%) 33.6% 33.9% 7.7% 19.0% 29.2% 19.1% 20.9%
Gross profit 1,039,214 1,472,464 1,643,484 2,118,720 2,656,531 3,119,691 3,828,261
Gross profit margin (%) 40.1% 42.4% 43.9% 47.6% 46.2% 45.6% 46.2%
EBIT recurring 608,340 940,409 993,384 1,241,042 1,578,687 1,665,580 2,084,550
EBIT growth (%) 32.7% 54.6% 5.6% 24.9% 27.2% 5.5% 25.2%
EBIT margin (%) 23.5% 27.1% 26.6% 27.9% 27.4% 24.3% 25.2%
BMS EPS As Adjusted (Rs) 3.26 5.07 5.15 7.43 11.69 12.19 16.45
BMS EPS growth (%) 15.7% 55.6% 1.6% 44.2% 57.3% 4.2% 34.9%
NAV per share (Rs) 14.75 23.95 27.62 35.08 45.75 55.44 68.44
P/E (x) 5.4 x 4.2 x 2.7 x 7.6 x 13.4 x 12.7 x 9.7 x
P/BV (x) 1.2 x 0.9 x 0.5 x 1.6 x 3.4 x 2.8 x 2.3 x
ROCE % 20.2% 21.6% 18.2% 21.8% 23.8% 21.7% 25.0%
ROE % 23.6% 26.2% 20.0% 23.7% 28.9% 24.1% 26.6%
Gearing (%) 53.4% 49.2% 46.0% 32.0% 32.7% 21.7% 14.3%
8/6/2019 Royal Ceramics Lanka PLC
http://slidepdf.com/reader/full/royal-ceramics-lanka-plc 2/11
Page 2
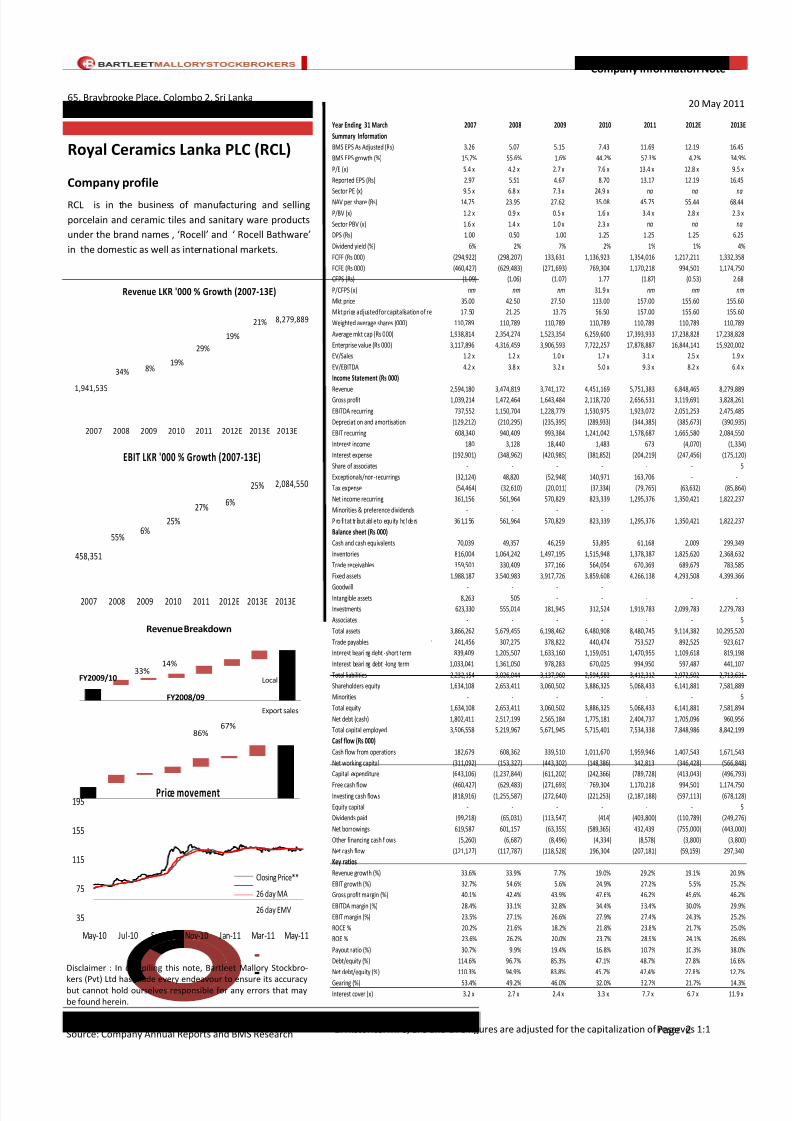
Royal Ceramics Lanka PLC (RCL)
Company profile
RCL is in the business of manufacturing and selling
porcelain and ceramic tiles and sanitary ware products
under the brand names , ‘Rocell’ and ‘ Rocell Bathware’
in the domestic as well as international markets.
Company Information Note
20 May 2011
Source: Company Annual Reports and BMS Research
Disclaimer : In compiling this note, Bartleet Mallory Stockbro-
kers (Pvt) Ltd has made every endeavour to ensure its accuracybut cannot hold ourselves responsible for any errors that may
be found herein.
65, Braybrooke Place, Colombo 2, Sri Lanka
[email protected], +94 11 5220200
Information Notes:
1. Historical MPS, EPS and DPS figures are adjusted for the capitalization of reserves 1:1
1,941,535
8,279,889
34%
21%
8%
19%
19%
29%
2007 2008 2009 2010 2011 2012E 2013E 2013E
Revenue LKR '000 % Growth (2007-13E)
458,351
6%
2,084,550
55%6%
25%
27%
25%
2007 2008 2009 2010 2011 2012E 2013E 2013E
EBIT LKR '000 % Growth (2007-13E)
86%
14%
67%
33%
Revenue Breakdown
Local sales
Export sales
FY2008/09
FY2009/10
35
75
115
155
195
May-10 Jul-10 Sep-10 Nov-10 Jan-11 Mar-11 May-11
Price movement
Closing Price**
26 day MA
26 day EMV
Year Ending 31 March 2007 2008 2009 2010 2011 2012E 2013E
Summary Information
BMS EPS As Adjusted (Rs) 3.26 5.07 5.15 7.43 11.69 12.19 16.45
BMS EPS growth (%) 15.7% 55.6% 1.6% 44.2% 57.3% 4.2% 34.9%
P/E (x) 5.4 x 4.2 x 2.7 x 7.6 x 13.4 x 12.8 x 9.5 x
Reported EPS (Rs) 2.97 5.51 4.67 8.70 13.17 12.19 16.45
Sector PE (x) 9.5 x 6.8 x 7.3 x 24.9 x na na na
NAV per share (Rs) 14.75 23.95 27.62 35.08 45.75 55.44 68.44
P/BV (x) 1.2 x 0.9 x 0.5 x 1.6 x 3.4 x 2.8 x 2.3 x
Sector PBV (x) 1.6 x 1.4 x 1.0 x 2.3 x na na na
DPS (Rs) 1.00 0.50 1.00 1.25 1.25 1.25 6.25
Dividend yield (%) 6% 2% 7% 2% 1% 1% 4%
FCFF (Rs 000) (294,922) (298,207) 133,631 1,136,923 1,354,016 1,217,211 1,332,358
FCFE (Rs 000) (460,427) (629,483) (271,693) 769,304 1,170,218 994,501 1,174,750
CFPS (Rs) (1.09) (1.06) (1.07) 1.77 (1.87) (0.53) 2.68
P/CFPS (x) nm nm nm 31.9 x nm nm nm
Mkt price 35.00 42.50 27.50 113.00 157.00 155.60 155.60
Mkt price adjusted for capitalisation of re 17.50 21.25 13.75 56.50 157.00 155.60 155.60
Weighted average shares (000) 110,789 110,789 110,789 110,789 110,789 110,789 110,789
Average mkt cap (Rs 000) 1,938,814 2,354,274 1,523,354 6,259,600 17,393,933 17,238,828 17,238,828
Enterprise value (Rs 000) 3,117,896 4,316,459 3,906,593 7,722,257 17,878,887 16,844,141 15,920,002
EV/Sales 1.2 x 1.2 x 1.0 x 1.7 x 3.1 x 2.5 x 1.9 x
EV/EBITDA 4.2 x 3.8 x 3.2 x 5.0 x 9.3 x 8.2 x 6.4 x
Income Statement (Rs 000)
Revenue 2,594,180 3,474,819 3,741,172 4,451,169 5,751,383 6,848,465 8,279,889 Gross profit 1,039,214 1,472,464 1,643,484 2,118,720 2,656,531 3,119,691 3,828,261
EBITDA recurring 737,552 1,150,704 1,228,779 1,530,975 1,923,072 2,051,253 2,475,485
Depreciation and amortisation (129,212) (210,295) (235,395) (289,933) (344,385) (385,673) (390,935)
EBIT recurring 608,340 940,409 993,384 1,241,042 1,578,687 1,665,580 2,084,550
Interest income 180 3,128 18,440 1,483 673 (4,070) (1,334)
Interest expense (192,901) (348,962) (420,985) (381,852) (204,219) (247,456) (175,120)
Share of associates - - - - - - 5
Exceptionals/non-recurrings (32,124) 48,820 (52,948) 140,971 163,706 - -
Tax expense (54,464) (32,610) (20,011) (37,334) (79,765) (63,632) (85,864)
Net income recurring 361,156 561,964 570,829 823,339 1,295,376 1,350,421 1,822,237
Minorities & preference dividends - - - -
P ro fi t at tr ibut abl e to equ ity hol de rs 36 1,1 56 561,964 570,829 823,339 1,295,376 1,350,421 1,822,237
Balance sheet (Rs 000)
Cash and cash equivalents 70,039 49,357 46,259 53,895 61,168 2,009 299,349
Inventories 816,004 1,064,242 1,497,195 1,515,948 1,378,387 1,825,620 2,368,632
Trade receivables 359,501 330,409 377,166 564,054 670,369 689,679 783,585
Fixed assets 1,988,187 3,540,983 3,917,726 3,859,608 4,266,138 4,293,508 4,399,366
Goodwill - - - - Intangible assets 8,263 505 - - - - -
Investments 623,330 555,014 181,945 312,524 1,919,783 2,099,783 2,279,783
Associates - - - - - - 5
Total assets 3,866,262 5,679,455 6,198,462 6,480,908 8,480,745 9,114,382 10,295,520
Trade payables 241,456 307,275 378,822 440,474 753,527 892,525 923,617
Interest beari ng debt -short term 839,409 1,205,507 1,633,160 1,159,051 1,470,955 1,109,618 819,198
Interest beari ng debt -long term 1,033,041 1,361,050 978,283 670,025 994,950 597,487 441,107
Total liabilities 2,232,154 3,026,044 3,137,960 2,594,583 3,412,312 2,972,502 2,713,631
Shareholders equity 1,634,108 2,653,411 3,060,502 3,886,325 5,068,433 6,141,881 7,581,889
Minorities - - - - - - 5
Total equity 1,634,108 2,653,411 3,060,502 3,886,325 5,068,433 6,141,881 7,581,894
Net debt (cash) 1,802,411 2,517,199 2,565,184 1,775,181 2,404,737 1,705,096 960,956
Total capital employed 3,506,558 5,219,967 5,671,945 5,715,401 7,534,338 7,848,986 8,842,199
Casf flow (Rs 000)
Cash flow from operations 182,679 608,362 339,510 1,011,670 1,959,946 1,407,543 1,671,543
Net working capital (311,092) (153,327) (443,302) (148,386) 342,813 (346,428) (566,848)
Capital expenditure (643,106) (1,237,844) (611,202) (242,366) (789,728) (413,043) (496,793)
Free cash flow (460,427) (629,483) (271,693) 769,304 1,170,218 994,501 1,174,750 Investing cash flows (818,916) (1,255,587) (272,640) (221,253) (2,187,188) (597,113) (678,128)
Equity capital - - - - - - 5
Dividends paid (99,218) (65,031) (113,547) (414) (403,800) (110,789) (249,276)
Net borrowings 619,587 601,157 (63,355) (589,365) 432,439 (755,000) (443,000)
Other financing cash flows (5,260) (6,687) (8,496) (4,334) (8,578) (3,800) (3,800)
Net cash flow (121,127) (117,787) (118,528) 196,304 (207,181) (59,159) 297,340
Key ratios
Revenue growth (%) 33.6% 33.9% 7.7% 19.0% 29.2% 19.1% 20.9%
EBIT growth (%) 32.7% 54.6% 5.6% 24.9% 27.2% 5.5% 25.2%
Gross profit margin (%) 40.1% 42.4% 43.9% 47.6% 46.2% 45.6% 46.2%
EBITDA margin (%) 28.4% 33.1% 32.8% 34.4% 33.4% 30.0% 29.9%
EBIT margin (%) 23.5% 27.1% 26.6% 27.9% 27.4% 24.3% 25.2%
ROCE % 20.2% 21.6% 18.2% 21.8% 23.8% 21.7% 25.0%
ROE % 23.6% 26.2% 20.0% 23.7% 28.9% 24.1% 26.6%
Payout ratio (%) 30.7% 9.9% 19.4% 16.8% 10.7% 10.3% 38.0%
Debt/equity (%) 114.6% 96.7% 85.3% 47.1% 48.7% 27.8% 16.6%
Net debt/equity (%) 110.3% 94.9% 83.8% 45.7% 47.4% 27.8% 12.7%
Gearing (%) 53.4% 49.2% 46.0% 32.0% 32.7% 21.7% 14.3%Interest cover (x) 3.2 x 2.7 x 2.4 x 3.3 x 7.7 x 6.7 x 11.9 x
8/6/2019 Royal Ceramics Lanka PLC
http://slidepdf.com/reader/full/royal-ceramics-lanka-plc 3/11
Page 3
BMS Equity Research
www.bartleetstock.com
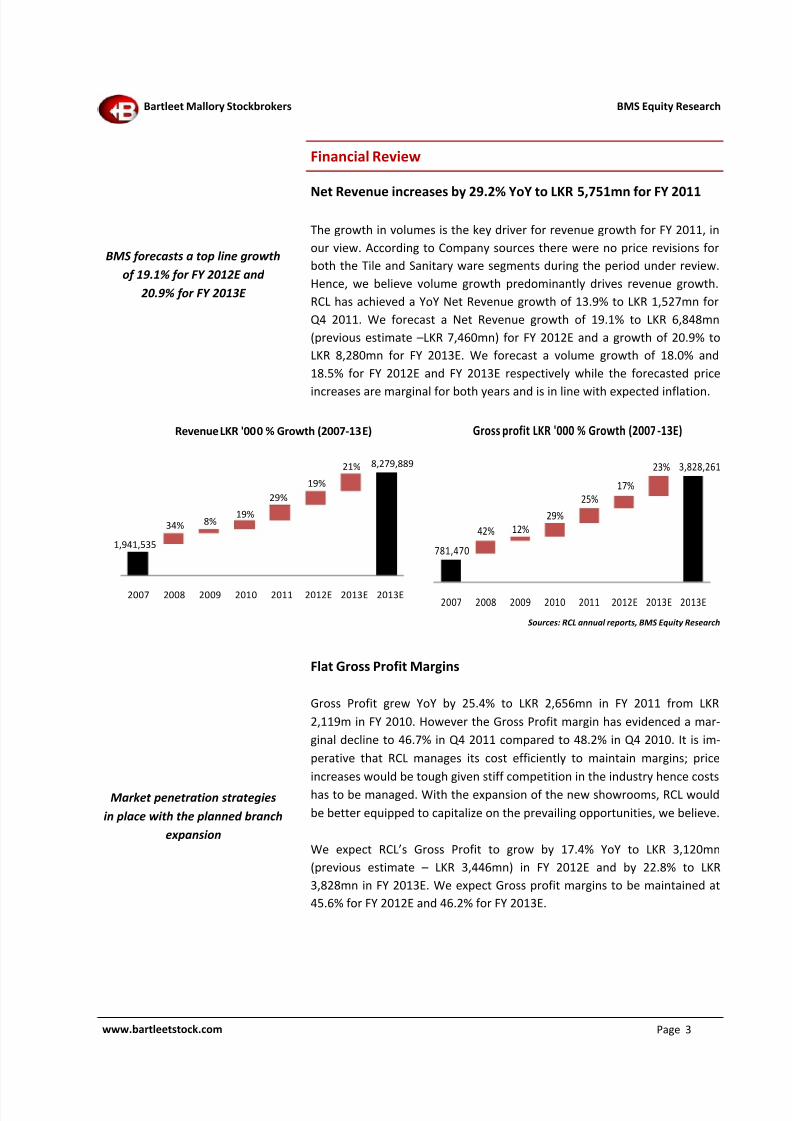
Net Revenue increases by 29.2% YoY to LKR 5,751mn for FY 2011
The growth in volumes is the key driver for revenue growth for FY 2011, in
our view. According to Company sources there were no price revisions for
both the Tile and Sanitary ware segments during the period under review.
Hence, we believe volume growth predominantly drives revenue growth.
RCL has achieved a YoY Net Revenue growth of 13.9% to LKR 1,527mn for
Q4 2011. We forecast a Net Revenue growth of 19.1% to LKR 6,848mn
(previous estimate –LKR 7,460mn) for FY 2012E and a growth of 20.9% to
LKR 8,280mn for FY 2013E. We forecast a volume growth of 18.0% and
18.5% for FY 2012E and FY 2013E respectively while the forecasted price
increases are marginal for both years and is in line with expected inflation.
Flat Gross Profit Margins
Gross Profit grew YoY by 25.4% to LKR 2,656mn in FY 2011 from LKR
2,119m in FY 2010. However the Gross Profit margin has evidenced a mar-
ginal decline to 46.7% in Q4 2011 compared to 48.2% in Q4 2010. It is im-
perative that RCL manages its cost efficiently to maintain margins; price
increases would be tough given stiff competition in the industry hence costs
has to be managed. With the expansion of the new showrooms, RCL would
be better equipped to capitalize on the prevailing opportunities, we believe.
We expect RCL’s Gross Profit to grow by 17.4% YoY to LKR 3,120mn
(previous estimate – LKR 3,446mn) in FY 2012E and by 22.8% to LKR
3,828mn in FY 2013E. We expect Gross profit margins to be maintained at
45.6% for FY 2012E and 46.2% for FY 2013E.
BMS forecasts a top line growth
of 19.1% for FY 2012E and
20.9% for FY 2013E
Financial Review
Market penetration strategies
in place with the planned branch
expansion
Bartleet Mallory Stockbrokers
Sources: RCL annual reports, BMS Equity Research
1,941,535
8,279,889
34%
21%
8%
19%
19%
29%
2007 2008 2009 2010 2011 2012E 2013E 2013E
Revenue LKR '000 % Growth (2007-13E)
781,470
17%
3,828,261
42% 12%
29%
25%
23%
2007 2008 2009 2010 2011 2012E 2013E 2013E
Gross profit LKR '000 % Growth (2007-13E)
8/6/2019 Royal Ceramics Lanka PLC
http://slidepdf.com/reader/full/royal-ceramics-lanka-plc 4/11
Page 4
BMS Equity Research
www.bartleetstock.com
Easing of the debt burden will
act as a catalyst in strengthening
bottom line
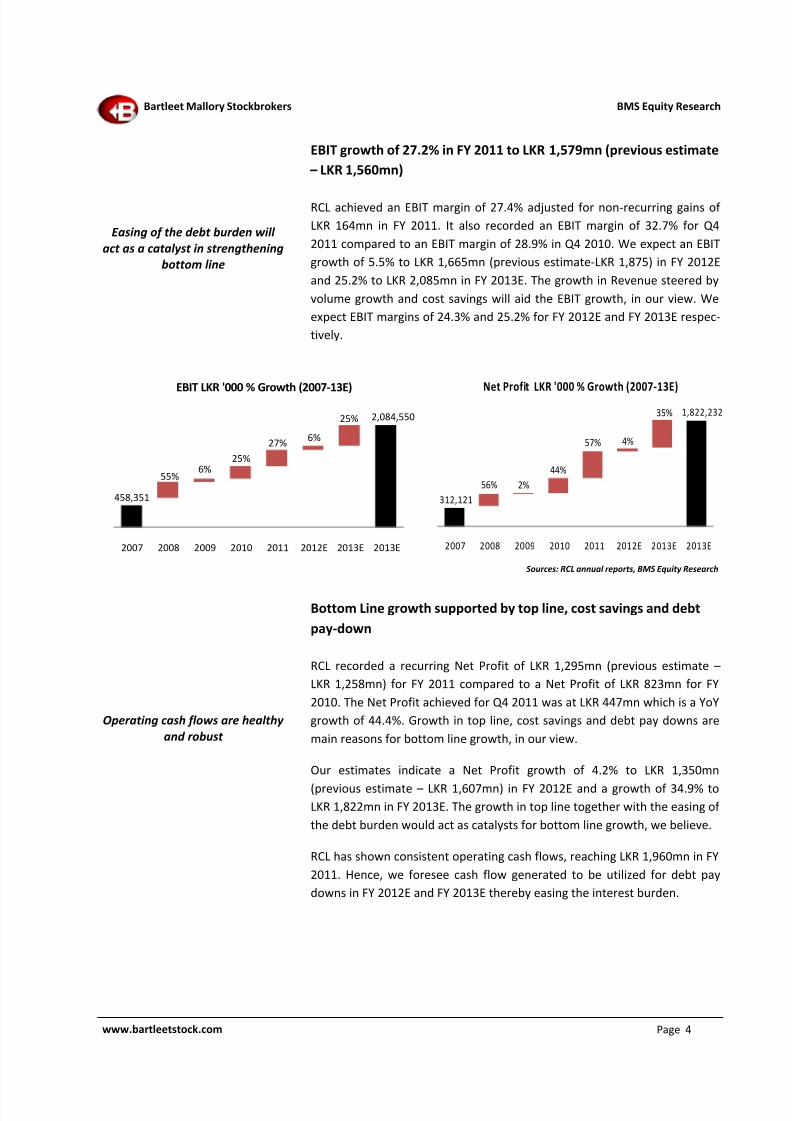
EBIT growth of 27.2% in FY 2011 to LKR 1,579mn (previous estimate
– LKR 1,560mn)
RCL achieved an EBIT margin of 27.4% adjusted for non-recurring gains of
LKR 164mn in FY 2011. It also recorded an EBIT margin of 32.7% for Q4
2011 compared to an EBIT margin of 28.9% in Q4 2010. We expect an EBIT
growth of 5.5% to LKR 1,665mn (previous estimate-LKR 1,875) in FY 2012E
and 25.2% to LKR 2,085mn in FY 2013E. The growth in Revenue steered by
volume growth and cost savings will aid the EBIT growth, in our view. We
expect EBIT margins of 24.3% and 25.2% for FY 2012E and FY 2013E respec-
tively.
Bottom Line growth supported by top line, cost savings and debt
pay-down
RCL recorded a recurring Net Profit of LKR 1,295mn (previous estimate –
LKR 1,258mn) for FY 2011 compared to a Net Profit of LKR 823mn for FY
2010. The Net Profit achieved for Q4 2011 was at LKR 447mn which is a YoY
growth of 44.4%. Growth in top line, cost savings and debt pay downs are
main reasons for bottom line growth, in our view.
Our estimates indicate a Net Profit growth of 4.2% to LKR 1,350mn
(previous estimate – LKR 1,607mn) in FY 2012E and a growth of 34.9% to
LKR 1,822mn in FY 2013E. The growth in top line together with the easing of
the debt burden would act as catalysts for bottom line growth, we believe.
RCL has shown consistent operating cash flows, reaching LKR 1,960mn in FY
2011. Hence, we foresee cash flow generated to be utilized for debt pay
downs in FY 2012E and FY 2013E thereby easing the interest burden.
Operating cash flows are healthy
and robust
Bartleet Mallory Stockbrokers
Sources: RCL annual reports, BMS Equity Research
458,351
6%
2,084,550
55%6%
25%
27%
25%
2007 2008 2009 2010 2011 2012E 2013E 2013E
EBIT LKR '000 % Growth (2007-13E)
312,121
4%
1,822,232
56% 2%
44%
57%
35%
2007 2008 2009 2010 2011 2012E 2013E 2013E
Net Profit LKR '000 % Growth (2007-13E)
8/6/2019 Royal Ceramics Lanka PLC
http://slidepdf.com/reader/full/royal-ceramics-lanka-plc 5/11
Page 5
BMS Equity Research
www.bartleetstock.com
EPS estimates – LKR 12.19 (previous estimate LKR 14.50) FY 2012E
and LKR 16.45 FY 2013E
The expected increase in Revenue led by volume growth is the primary fac-
tor contributing to the EPS growth. The expansions currently taking place in
the country mainly driven by the resurgence of the Hotel sector coupled
with RCL’s new ventures into the sanitary ware market are the main drivers,
we believe. RCL has achieved a recurring EPS of LKR 11.69 for FY 2011.
Valuation – Attractive at the current price of LKR 155.60; upsidepotential of 11.8%
Our main method of valuation is Free Cash Flow basis. Based on our new
estimates we have arrived at a potential value of LKR 173.93 (previous esti-
mate - LKR 165.28). Our valuations are based on a WACC of ~ 9.4% and ter-
minal growth of 3.0%. The WACC is based on a debt to equity of 50%, beta
of 0.91 (based on ASPI vs. RCL stock price movements), risk free rate of
7.3% and an equity risk premium of 4.0%. In addition, our estimates factor
in normalized sales growth 20% and EBIT margins of 20% for both FY 2014E
and FY 2015E. On a relative valuation basis, the stock has a forward PE mul-
tiple of 12.8x based on FY 2012E EPS of LKR 12.19 and current price of LKR
155.60. Based on FY 2013E EPS of LKR 16.45 the stock has a PE multiple of
9.5x. The sector PE stands at 22.9x as at 13 May 2011. The expected NAV
per share for FY 2012E and FY 2013E is LKR 55.44 and LKR 68.44 respec-
tively.
Valuations
Capex
We have factored in ~ LKR 413mn as capital expenditure for FY 2012E and~LKR 497mn for FY 2013E, which amounts to ~6% of the Net Revenue. RCL
has incurred a total capital expenditure of LKR 790mn for the FY 2011. The
Company’s plans to invest in capacity expansion at its manufacturing facility
in Horana, is in process. The expansion would add a further 3,500sqm/day,
increasing total capacity to 14,300sqm/day from the current capacity levels
of 10,800sqm/day (Eheliyagoda 3,500sqm/day and Horana 7,300sqm/day).
RCL also intends to open 10 new showrooms outside the Western Province;
however they have not incurred any expenditure on the showrooms to
date. The management of RCL is of the view that one of the showrooms will
be opened during Q1 2012E. The estimated cost is ~ LKR 50mn with an
BMS adjusted EPS is LKR 12.19 for FY 2012E
RCL has a value ~ LKR 173.93
based on free cash flow
valuations
Capex is estimated at 6% of Net
Revenue for FY 2012E
Capex and Risk Evaluation
Bartleet Mallory Stockbrokers
8/6/2019 Royal Ceramics Lanka PLC
http://slidepdf.com/reader/full/royal-ceramics-lanka-plc 6/11
Page 6
BMS Equity Research
www.bartleetstock.com
Cheap imports from rivalry
nations is the biggest threat to
RCL
Escalating crude oil prices could
have adverse impacts to the
bottom line, in our view
average cost of LKR 5mn per showroom. RCL plans to fund capex through me-
dium term debt at floating interest rates, spanning a 5-year period.
Risk Evaluation
We feel the cheap imports from overseas rivals such as China and India invad-
ing the local Ceramic market as the prime risk faced by RCL. According to the
sources from the Department of Commerce, under the Indo Lanka Free Trade
Agreement, Indian ceramic tiles receive a 100% duty concession by the GOSL
effective from 31 March, 2008; making the Ceramic Tile market more com-
petitive. In such a backdrop we find that RCL’s recent diversification strategy
to venture in to the Bath Ware market, a forward looking decision. As low
cost imports and high end brands are dominant in the market, RCL’s successin this area depends on how they position themselves and price their prod-
ucts.
In RCL’s cost structure, ~ 33% constitutes of energy cost, thus, any fluctuation
in the crude oil prices and electricity has a direct and significant impact on the
Bottom Line. Even in a rising energy cost scenario, RCL will find it difficult to
go for a price revision, owing to fierce competition, in our view. Due to the
global economic recovery, rising demand from vibrant economies of China
and India, and the upheaval in the Middle East, crude oil prices crossed the
USD 100 mark during April 2011. This is a hike of over 35% compared to the
price levels in April 2010. However rising energy cost is a systematic risk,
hence availability of risk minimization strategies are minimal, we believe.
RCL’s exposure to FOREX risk is insignificant, as exports contribute only ~5%
to total sales. Since the management concentration is to expand the foothold
in the domestic market, we expect the export sales to remain in its existing
levels; also as RCL’s raw material imports are limited to only chemicals, we
see no notable risk pertaining to RCL’s foreign exchange transactions.
FOREX risk is insignificant
for RCL
Bartleet Mallory Stockbrokers
8/6/2019 Royal Ceramics Lanka PLC
http://slidepdf.com/reader/full/royal-ceramics-lanka-plc 7/11
Page 7www.bartleetstock.com
BMS Equity Research
Financial Analysis
Bartleet Mallory Stockbrokers
All numbers in LKR '000 2006 2007 2008 2009 2010 2011 2012E 2013E
Gross turnover 2,208,821 2,957,038 3,971,252 4,250,995 4,961,533 6,413,304 7,643,376 9,240,948
T/O taxes (267,286) (362,858) (496,433) (509,823) (510,364) (661,921) (794,911) (961,059)
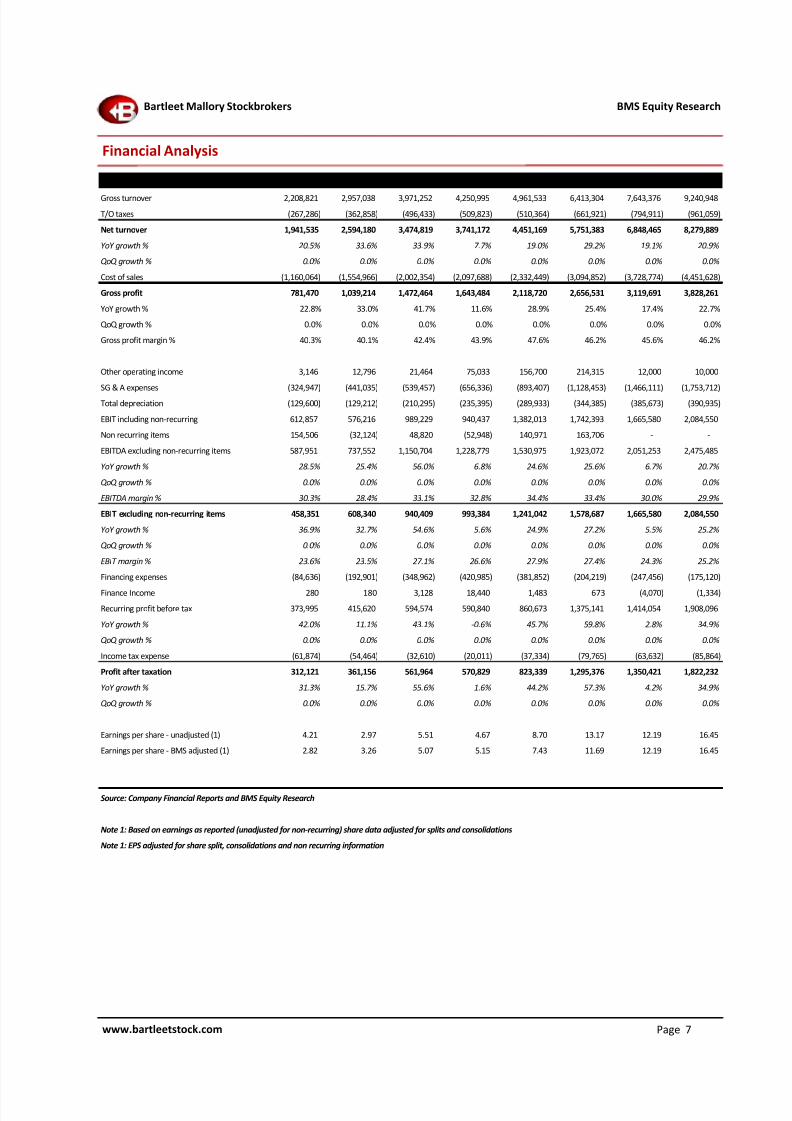
Net turnover 1,941,535 2,594,180 3,474,819 3,741,172 4,451,169 5,751,383 6,848,465 8,279,889
YoY growth % 20.5% 33.6% 33.9% 7.7% 19.0% 29.2% 19.1% 20.9%
QoQ growth % 0.0% 0.0% 0.0% 0.0% 0.0% 0.0% 0.0% 0.0%
Cost of sales (1,160,064) (1,554,966) (2,002,354) (2,097,688) (2,332,449) (3,094,852) (3,728,774) (4,451,628)
Gross profit 781,470 1,039,214 1,472,464 1,643,484 2,118,720 2,656,531 3,119,691 3,828,261
YoY growth % 22.8% 33.0% 41.7% 11.6% 28.9% 25.4% 17.4% 22.7%
QoQ growth % 0.0% 0.0% 0.0% 0.0% 0.0% 0.0% 0.0% 0.0%
Gross profit margin % 40.3% 40.1% 42.4% 43.9% 47.6% 46.2% 45.6% 46.2%
Other operating income 3,146 12,796 21,464 75,033 156,700 214,315 12,000 10,000
SG & A expenses (324,947) (441,035) (539,457) (656,336) (893,407) (1,128,453) (1,466,111) (1,753,712)
Total depreciation (129,600) (129,212) (210,295) (235,395) (289,933) (344,385) (385,673) (390,935)
EBIT including non-recurring 612,857 576,216 989,229 940,437 1,382,013 1,742,393 1,665,580 2,084,550
Non recurring items 154,506 (32,124) 48,820 (52,948) 140,971 163,706 - -
EBITDA excluding non-recurring items 587,951 737,552 1,150,704 1,228,779 1,530,975 1,923,072 2,051,253 2,475,485
YoY growth % 28.5% 25.4% 56.0% 6.8% 24.6% 25.6% 6.7% 20.7%
QoQ growth % 0.0% 0.0% 0.0% 0.0% 0.0% 0.0% 0.0% 0.0%
EBITDA margin % 30.3% 28.4% 33.1% 32.8% 34.4% 33.4% 30.0% 29.9%
EBIT excluding non-recurring items 458,351 608,340 940,409 993,384 1,241,042 1,578,687 1,665,580 2,084,550
YoY growth % 36.9% 32.7% 54.6% 5.6% 24.9% 27.2% 5.5% 25.2%
QoQ growth % 0.0% 0.0% 0.0% 0.0% 0.0% 0.0% 0.0% 0.0%
EBIT margin % 23.6% 23.5% 27.1% 26.6% 27.9% 27.4% 24.3% 25.2%
Financing expenses (84,636) (192,901) (348,962) (420,985) (381,852) (204,219) (247,456) (175,120)
Finance Income 280 180 3,128 18,440 1,483 673 (4,070) (1,334)
Recurring profit before tax 373,995 415,620 594,574 590,840 860,673 1,375,141 1,414,054 1,908,096
YoY growth % 42.0% 11.1% 43.1% -0.6% 45.7% 59.8% 2.8% 34.9%
QoQ growth % 0.0% 0.0% 0.0% 0.0% 0.0% 0.0% 0.0% 0.0%
Income tax expense (61,874) (54,464) (32,610) (20,011) (37,334) (79,765) (63,632) (85,864)
Profit after taxation 312,121 361,156 561,964 570,829 823,339 1,295,376 1,350,421 1,822,232
YoY growth % 31.3% 15.7% 55.6% 1.6% 44.2% 57.3% 4.2% 34.9%
QoQ growth % 0.0% 0.0% 0.0% 0.0% 0.0% 0.0% 0.0% 0.0%
Earnings per share - unadjusted (1) 4.21 2.97 5.51 4.67 8.70 13.17 12.19 16.45
Earnings per share - BMS adjusted (1) 2.82 3.26 5.07 5.15 7.43 11.69 12.19 16.45
Source: Company Financial Reports and BMS Equity Research
Note 1: Based on earnings as reported (unadjusted for non-recurring) share data adjusted for splits and consolidations
Note 1: EPS adjusted for share split, consolidations and non recurring information
8/6/2019 Royal Ceramics Lanka PLC
http://slidepdf.com/reader/full/royal-ceramics-lanka-plc 8/11
Page 8www.bartleetstock.com
BMS Equity Research
Financial Analysis
Bartleet Mallory Stockbrokers
All numbers in LKR '000 2011 Q1 11/12E Q2 11/12E Q3 11/12E Q4 11/12E 2012E 2013E
Gross turnover 6,413,304 1,532,323 1,850,469 2,232,117 2,028,466 7,643,376 9,240,948
T/O taxes (661,921) (159,362) (192,449) (232,140) (210,960) (794,911) (961,059)
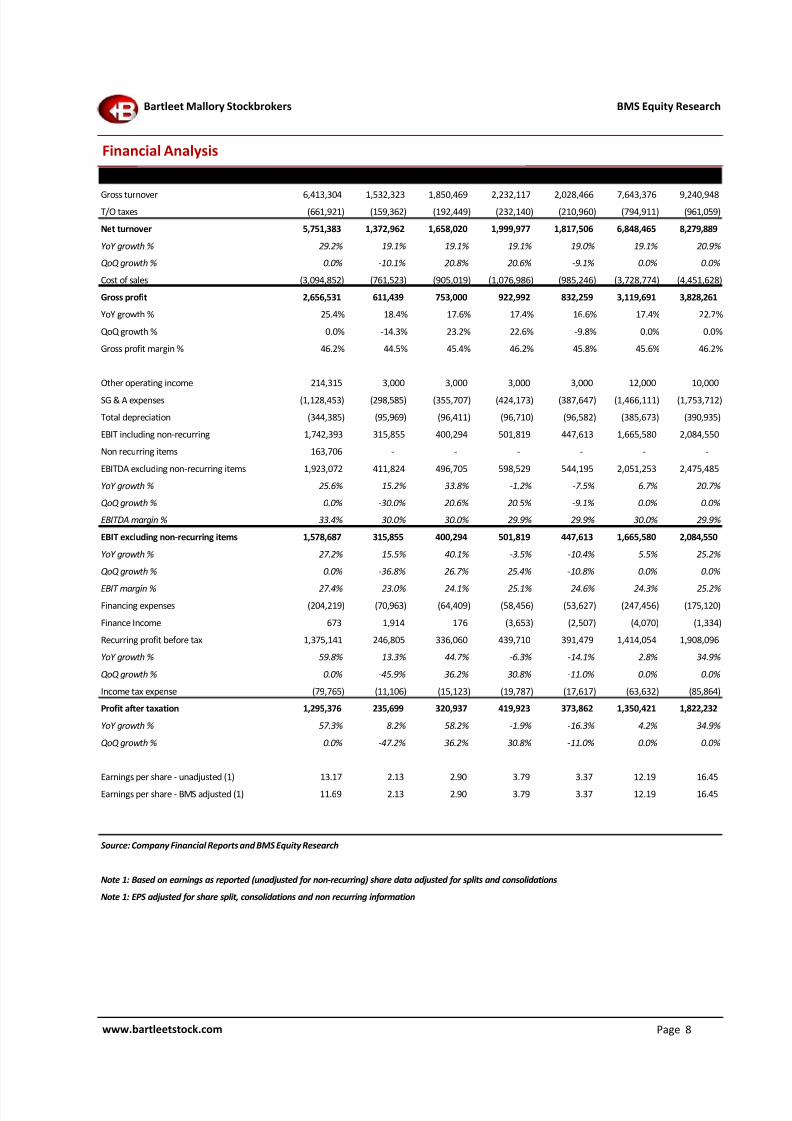
Net turnover 5,751,383 1,372,962 1,658,020 1,999,977 1,817,506 6,848,465 8,279,889
YoY growth % 29.2% 19.1% 19.1% 19.1% 19.0% 19.1% 20.9%
QoQ growth % 0.0% -10.1% 20.8% 20.6% -9.1% 0.0% 0.0%
Cost of sales (3,094,852) (761,523) (905,019) (1,076,986) (985,246) (3,728,774) (4,451,628)
Gross profit 2,656,531 611,439 753,000 922,992 832,259 3,119,691 3,828,261
YoY growth % 25.4% 18.4% 17.6% 17.4% 16.6% 17.4% 22.7%
QoQ growth % 0.0% -14.3% 23.2% 22.6% -9.8% 0.0% 0.0%
Gross profit margin % 46.2% 44.5% 45.4% 46.2% 45.8% 45.6% 46.2%
Other operating income 214,315 3,000 3,000 3,000 3,000 12,000 10,000
SG & A expenses (1,128,453) (298,585) (355,707) (424,173) (387,647) (1,466,111) (1,753,712)
Total depreciation (344,385) (95,969) (96,411) (96,710) (96,582) (385,673) (390,935)
EBIT including non-recurring 1,742,393 315,855 400,294 501,819 447,613 1,665,580 2,084,550
Non recurring items 163,706 - - - - - -
EBITDA excluding non-recurring items 1,923,072 411,824 496,705 598,529 544,195 2,051,253 2,475,485
YoY growth % 25.6% 15.2% 33.8% -1.2% -7.5% 6.7% 20.7%
QoQ growth % 0.0% -30.0% 20.6% 20.5% -9.1% 0.0% 0.0%
EBITDA margin % 33.4% 30.0% 30.0% 29.9% 29.9% 30.0% 29.9%
EBIT excluding non-recurring items 1,578,687 315,855 400,294 501,819 447,613 1,665,580 2,084,550
YoY growth % 27.2% 15.5% 40.1% -3.5% -10.4% 5.5% 25.2%
QoQ growth % 0.0% -36.8% 26.7% 25.4% -10.8% 0.0% 0.0%
EBIT margin % 27.4% 23.0% 24.1% 25.1% 24.6% 24.3% 25.2%
Financing expenses (204,219) (70,963) (64,409) (58,456) (53,627) (247,456) (175,120)
Finance Income 673 1,914 176 (3,653) (2,507) (4,070) (1,334)
Recurring profit before tax 1,375,141 246,805 336,060 439,710 391,479 1,414,054 1,908,096
YoY growth % 59.8% 13.3% 44.7% -6.3% -14.1% 2.8% 34.9%
QoQ growth % 0.0% -45.9% 36.2% 30.8% -11.0% 0.0% 0.0%
Income tax expense (79,765) (11,106) (15,123) (19,787) (17,617) (63,632) (85,864)
Profit after taxation 1,295,376 235,699 320,937 419,923 373,862 1,350,421 1,822,232
YoY growth % 57.3% 8.2% 58.2% -1.9% -16.3% 4.2% 34.9%
QoQ growth % 0.0% -47.2% 36.2% 30.8% -11.0% 0.0% 0.0%
Earnings per share - unadjusted (1) 13.17 2.13 2.90 3.79 3.37 12.19 16.45
Earnings per share - BMS adjusted (1) 11.69 2.13 2.90 3.79 3.37 12.19 16.45
Source: Company Financial Reports and BMS Equity Research
Note 1: Based on earnings as reported (unadjusted for non-recurring) share data adjusted for splits and consolidations
Note 1: EPS adjusted for share split, consolidations and non recurring information
8/6/2019 Royal Ceramics Lanka PLC
http://slidepdf.com/reader/full/royal-ceramics-lanka-plc 9/11
Page 9www.bartleetstock.com
BMS Equity Research
Financial Analysis
Bartleet Mallory Stockbrokers
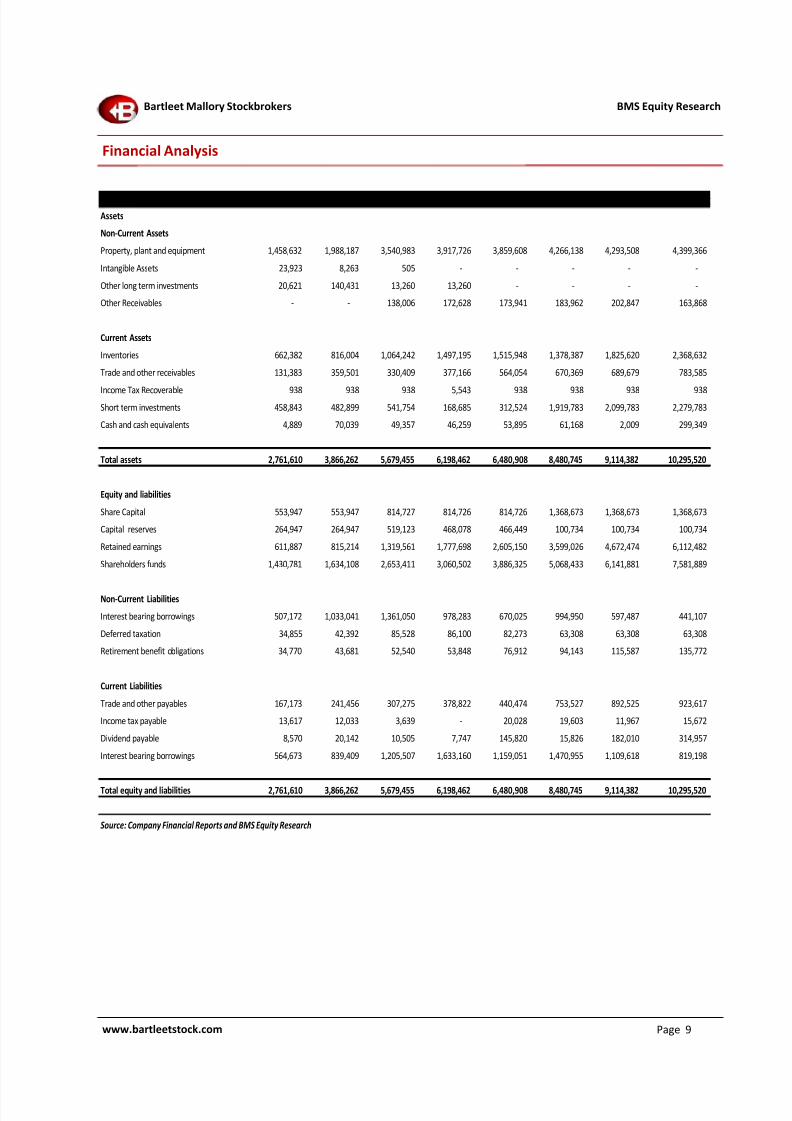
All numbers in LKR '000 2006 2007 2008 2009 2010 2011 2012E 2013E
Assets
Non-Current Assets
Property, plant and equipment 1,458,632 1,988,187 3,540,983 3,917,726 3,859,608 4,266,138 4,293,508 4,399,366
Intangible Assets 23,923 8,263 505 - - - - -
Other long term investments 20,621 140,431 13,260 13,260 - - - -
Other Receivables - - 138,006 172,628 173,941 183,962 202,847 163,868
Current Assets
Inventories 662,382 816,004 1,064,242 1,497,195 1,515,948 1,378,387 1,825,620 2,368,632
Trade and other receivables 131,383 359,501 330,409 377,166 564,054 670,369 689,679 783,585
Income Tax Recoverable 938 938 938 5,543 938 938 938 938 Short term investments 458,843 482,899 541,754 168,685 312,524 1,919,783 2,099,783 2,279,783
Cash and cash equivalents 4,889 70,039 49,357 46,259 53,895 61,168 2,009 299,349
Total assets 2,761,610 3,866,262 5,679,455 6,198,462 6,480,908 8,480,745 9,114,382 10,295,520
Equity and liabilities
Share Capital 553,947 553,947 814,727 814,726 814,726 1,368,673 1,368,673 1,368,673
Capital reserves 264,947 264,947 519,123 468,078 466,449 100,734 100,734 100,734
Retained earnings 611,887 815,214 1,319,561 1,777,698 2,605,150 3,599,026 4,672,474 6,112,482
Shareholders funds 1,430,781 1,634,108 2,653,411 3,060,502 3,886,325 5,068,433 6,141,881 7,581,889
Non-Current Liabilities
Interest bearing borrowings 507,172 1,033,041 1,361,050 978,283 670,025 994,950 597,487 441,107
Deferred taxation 34,855 42,392 85,528 86,100 82,273 63,308 63,308 63,308
Retirement benefit obligations 34,770 43,681 52,540 53,848 76,912 94,143 115,587 135,772
Current Liabilities
Trade and other payables 167,173 241,456 307,275 378,822 440,474 753,527 892,525 923,617
Income tax payable 13,617 12,033 3,639 - 20,028 19,603 11,967 15,672
Dividend payable 8,570 20,142 10,505 7,747 145,820 15,826 182,010 314,957
Interest bearing borrowings 564,673 839,409 1,205,507 1,633,160 1,159,051 1,470,955 1,109,618 819,198
Total equity and liabilities 2,761,610 3,866,262 5,679,455 6,198,462 6,480,908 8,480,745 9,114,382 10,295,520
Source: Company Financial Reports and BMS Equity Research
8/6/2019 Royal Ceramics Lanka PLC
http://slidepdf.com/reader/full/royal-ceramics-lanka-plc 10/11
Page 10www.bartleetstock.com
BMS Equity Research
Financial Analysis
Bartleet Mallory Stockbrokers
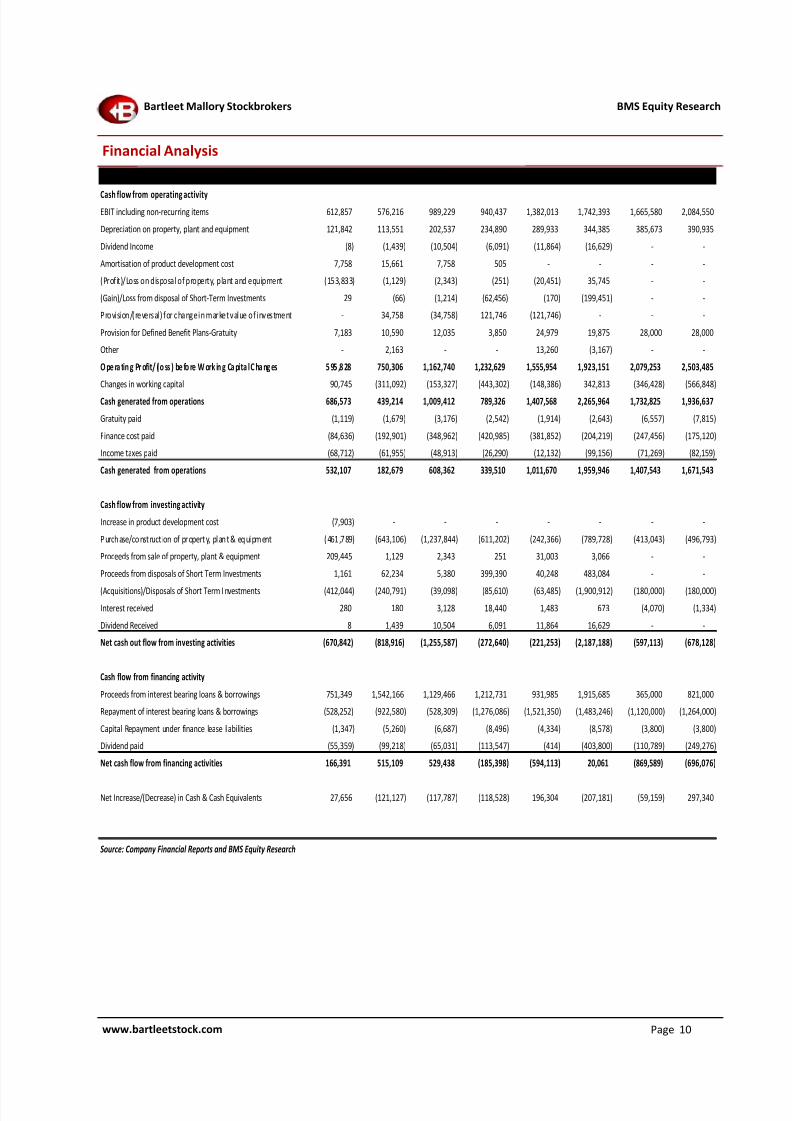
All numbers in LKR '000 2006 2007 2008 2009 2010 2011 2012E 2013E
Cash flow from operating activityEBIT including non-recurring items 612,857 576,216 989,229 940,437 1,382,013 1,742,393 1,665,580 2,084,550
Depreciation on property, plant and equipment 121,842 113,551 202,537 234,890 289,933 344,385 385,673 390,935
Dividend Income (8) (1,439) (10,504) (6,091) (11,864) (16,629) - -
Amortisation of product development cost 7,758 15,661 7,758 505 - - - -
(Profit)/Loss on disposal of property, plant and equipment (153,833) (1,129) (2,343) (251) (20,451) 35,745 - -
(Gain)/Loss from disposal of Short-Term Investments 29 (66) (1,214) (62,456) (170) (199,451) - -
Provision/(reversal) for change in market value of investment - 34,758 (34,758) 121,746 (121,746) - - -
Provision for Defined Benefit Plans-Gratuity 7,183 10,590 12,035 3,850 24,979 19,875 28,000 28,000
Other - 2,163 - - 13,260 (3,167) - -
O pe ra tin g Pr ofit/ (lo ss ) be fo re W ork in g Ca pita l C ha ng es 5 95 ,8 28 750,306 1,162,740 1,232,629 1,555,954 1,923,151 2,079,253 2,503,485
Changes in working capital 90,745 (311,092) (153,327) (443,302) (148,386) 342,813 (346,428) (566,848)
Cash generated from operations 686,573 439,214 1,009,412 789,326 1,407,568 2,265,964 1,732,825 1,936,637
Gratuity paid (1,119) (1,679) (3,176) (2,542) (1,914) (2,643) (6,557) (7,815)
Finance cost paid (84,636) (192,901) (348,962) (420,985) (381,852) (204,219) (247,456) (175,120)
Income taxes paid (68,712) (61,955) (48,913) (26,290) (12,132) (99,156) (71,269) (82,159)
Cash generated from operations 532,107 182,679 608,362 339,510 1,011,670 1,959,946 1,407,543 1,671,543
Cash flow from investing activity
Increase in product development cost (7,903) - - - - - - -
P urchase/construct ion of property, plant & equipm ent (461,789) (643,106) (1,237,844) (611,202) (242,366) (789,728) (413,043) (496,793)
Proceeds from sale of property, plant & equipment 209,445 1,129 2,343 251 31,003 3,066 - -
Proceeds from disposals of Short Term Investments 1,161 62,234 5,380 399,390 40,248 483,084 - -
(Acquisitions)/Disposals of Short Term I nvestments (412,044) (240,791) (39,098) (85,610) (63,485) (1,900,912) (180,000) (180,000)
Interest received 280 180 3,128 18,440 1,483 673 (4,070) (1,334)
Dividend Received 8 1,439 10,504 6,091 11,864 16,629 - -
Net cash out flow from investing activities (670,842) (818,916) (1,255,587) (272,640) (221,253) (2,187,188) (597,113) (678,128)
Cash flow from financing activity
Proceeds from interest bearing loans & borrowings 751,349 1,542,166 1,129,466 1,212,731 931,985 1,915,685 365,000 821,000
Repayment of interest bearing loans & borrowings (528,252) (922,580) (528,309) (1,276,086) (1,521,350) (1,483,246) (1,120,000) (1,264,000)
Capital Repayment under finance lease liabilities (1,347) (5,260) (6,687) (8,496) (4,334) (8,578) (3,800) (3,800)
Dividend paid (55,359) (99,218) (65,031) (113,547) (414) (403,800) (110,789) (249,276)
Net cash flow from financing activities 166,391 515,109 529,438 (185,398) (594,113) 20,061 (869,589) (696,076)
Net Increase/(Decrease) in Cash & Cash Equivalents 27,656 (121,127) (117,787) (118,528) 196,304 (207,181) (59,159) 297,340
Source: Company Financial Reports and BMS Equity Research
8/6/2019 Royal Ceramics Lanka PLC
http://slidepdf.com/reader/full/royal-ceramics-lanka-plc 11/11
Page 11
Bartleet Mallory Stockbrokers (Pvt) Ltdwww.bartleetstock.com
BMS Equity Research - [email protected]


![Sri Lanka Telecom PLC · Sri Lanka Telecom PLC Annual Report 2015 [ 03 ] Welcome to Sri Lanka Telecom PLC’s Annual Report 2015 This Annual Report 2015 of Sri Lanka Telecom PLC is](https://img.pdfslide.net/doc/110x75/5ec1c7bf44f9c177e824dbb3/sri-lanka-telecom-plc-sri-lanka-telecom-plc-annual-report-2015-03-welcome-to.jpg)