Embed Size (px)
Citation preview
RÓzanski, K., Chmura, L., Gakowski, M., NCKI, J., Zimnoch, M., Bartyzel,J., & O'doherty, S. (2017). Monitoring of Greenhouse Gases in theAtmosphere – A Polish Perspective. Papers on Global Change IGBP, 23(1),111-126. https://doi.org/10.1515/igbp-2016-0009
Publisher's PDF, also known as Version of record
License (if available):CC BY-NC-ND
Link to published version (if available):10.1515/igbp-2016-0009
Link to publication record in Explore Bristol ResearchPDF-document
This is the final published version of the article (version of record). It first appeared online via De Gruyter athttps://doi.org/10.1515/igbp-2016-0009 . Please refer to any applicable terms of use of the publisher.
University of Bristol - Explore Bristol ResearchGeneral rights
This document is made available in accordance with publisher policies. Please cite only the publishedversion using the reference above. Full terms of use are available:http://www.bristol.ac.uk/pure/about/ebr-terms

OPEN
DOI: 10.1515/igbp-2016-0009 PAPERS on GLOBAL CHANGE, 23, 111–126, 2016
MONITORING OF GREENHOUSE GASES IN THE ATMOSPHERE – A POLISH PERSPECTIVE
KAZIMIERZ RÓŻAŃSKI, ŁUKASZ CHMURA, MICHAŁ GAŁKOWSKI, JAROSŁAW NĘCKI, MIROSŁAW ZIMNOCH, JAKUB BARTYZEL
Faculty of Physics and Applied Computer Science,AGH University of Science and Technology30-059 Kraków, Al. Mickiewicza 30, Poland
e-mail: [email protected], lukasz.chmura@fi s.agh.edu.pl, michal.galkowski@fi s.agh.edu.pl, [email protected], [email protected],
jakub.bartyzel@fi s.agh.edu.pl
SIMON O’DOHERTYAtmospheric Chemistry Research Group, University of Bristol, Cantock’s Close,
Clifton, Bristol BS8 1TS, United Kingdome-mail: [email protected]
ABSTRACT: An overview of systematic observations of the trace-gas composition of the atmosphere over southern Poland is presented, against the background of data available for other greenhouse gas (GHG) monitoring stations in Europe. The results of GHG monitoring for three major greenhouse gases (CO2, CH4, N2O) are discussed. Measurements were performed at two locations of contrasting characteristics, i.e. (i) the high-altitude mountain station of Kasprowy Wierch in the High Tatras, representing atmospheric conditions relatively free of local infl uences, and (ii) an urban station located in the Krakow agglomeration. The GHG data available for the Kasprowy Wierch station were compared with relevant data available for two marine reference stations (Mace Head, Ireland and Terceira Island, Azores), and two continental stations (Hohenpeissenberg, Germany and Pallas-Sammaltunturi, Finland). The growth rates for the CO2 mole fraction recorded at these fi ve stations reveal only small temporal changes that almost coincide, leading to a quasi-linear increase of the CO2 mixing ratio over the European continent over the past 20 years. While N2O observations also reveal a steady increase over this
Brought to you by | University of BristolAuthenticated
Download Date | 6/2/17 1:04 PM

112 K. Różański, Ł. Chmura, M. Gałkowski, J. Nęcki, M. Zimnoch, J. Bartyzel, S. O’Doherty
time period, the mole fraction accounted for by CH4 is increasing again, after a period of stagnation in the years 2001–2007. The impact of continental sources of CH4 and N2O is seen clearly in the Kasprowy Wierch records. The mean departure between the CH4 mixing ratios recorded at Kasprowy Wierch and at the marine reference stations in the period 1994–2014 is of 27.3 ppb, and stems from continental emissions of this gas originating mainly from anthropogenic activities (leaking natural-gas distribution networks, landfi lls and livestock). For N2O, a departure of 1 ppb was observed for the period 2009–2014. Comparison of quasi-continuous measurements of CO2, CH4 and N2O mixing ratios made in the urban atmosphere of Krakow and at the regional reference site Kasprowy Wierch (located approximately 100 km away), allows for a deeper insight into the mechanisms controlling daily variations in atmospheric mixing ratios of these gases at the two sites. The development of a nocturnal inversion layer in the atmosphere above the city leads to local enhancements of CO2, CH4 and N2O mole fractions in the Krakow atmosphere during the night hours, with these exceeding the baseline level signifi cantly.
KEY WORDS: monitoring, trace gases, atmosphere, greenhouse effect.
INTRODUCTION
Greenhouse gases (GHGs) are trace compounds whose specifi c physical properties ensure them of an important role where the radiative balance of Earth’s atmosphere is concerned (IPCC 2013). The most important of the gases are water vapour (H2O), carbon dioxide (CO2), methane (CH4) and nitrous oxide (N2O). By way of the natural (non-augmented) greenhouse effect these ensure comfortable temperatures at the Earth’s surface. However, anthropogenic activities have been modifying atmospheric composition in different ways; among which perhaps the most important is the overall increase in the mole fractions accounted for by the aforesaid major greenhouse gases – a process ongoing since the mid-19th century (IPCC 2013). Nowadays, the composition of the atmosphere is being watched on the basis of increasing awareness, on the local, regional or global scales.
Although isolated measurements of CO2 mixing ratios in the atmosphere were already being made using chemical methods by the second half of the 19th century, it was Charles D. Keeling around a century later who realised the importance of regular measurement of GHGs in the atmosphere (Keeling 1960). It was he who started regular measurements of atmospheric CO2 mole fractions in June 1956, at the Mauna Loa Observatory on Hawaii island in the Pacifi c Ocean, at an elevation of 3397 m a.s.l. (www.esrl.noaa.gov/gmd/obop/mlo/).
Today, regular observations of the trace-gas composition of the atmosphere are made, via global and regional monitoring networks, such as Global Atmosphere Watch (www.wmo.int/pages/prog/gaw), NOAA Earth Systems Research Laboratory (www.esrl.noaa.gov/gmd/) or the Advanced Global Atmospheric Gases Experiment
Brought to you by | University of BristolAuthenticated
Download Date | 6/2/17 1:04 PM

113Monitoring of greenhouse gases in the atmosphere…
(www.agage.eas.gatech.edu). New regional initiatives also now being pursued include the Integrated Carbon Observation System (www.icos-infrastructure.eu), and the National Ecological Observatory Network (www.neonscience.org).
If properly designed and maintained, atmospheric monitoring networks can serve several functions. First, they document spatial and temporal evolution of the composition of Earth’s atmosphere as a result of natural processes and human activities. Second, they help in the assessment of the effectiveness of international agreements aimed at reducing atmospheric mixing ratios of key trace substances, such as CO2, CH4 and N2O, infl uencing the radiative balance of Earths’ atmosphere, as well as substances depleting stratospheric ozone reserves (e.g. N2O, chlorofl uorocarbons, and others). Finally, they provide valuable data for current research on the global carbon cycle (Global Carbon Project 2015), and the behaviour of various trace substances in the Earth-atmosphere system.
Historically, observations of the trace-gas composition of Earths’ atmosphere relied either on a limited number of remote sites at which air samples were collected for subsequent laboratory analyses, or on an even more limited number of in-situ measurement sites such as Mauna Loa Observatory. Atmospheric observations at those remote locations were used in simple box-type models to derive estimates of atmospheric budgets of greenhouse gases or ozone-depleting substances on a global scale. The rapid growth of scientifi c understanding and computational power allowed for expansion of these simple modelling tools, and for the inclusion of more-sophisticated representations of atmospheric processes. This provided an even more detailed picture of the behaviour of trace gases in the present-day atmosphere, on various temporal and spatial scales. These advanced numerical tools (models) rely heavily on atmospheric observations. With increased complexity of representation of atmospheric processes in these models, there is a growing need for observational data. Regional analyses of greenhouse gas budgets are subject to strict requirements concerning temporal resolution, spatial extent, precision and accuracy of observational data. These requirements are refl ected in the accuracy and precision levels set for stations monitoring greenhouse gas by fi nal data users, i.e. researchers or policymakers (e.g. WMO 2013).
Stationary, ground-based monitoring networks are not the sole source of information about GHG mixing ratios in the atmosphere. Nowadays, selected GHGs can be studied by remote sensing via dedicated satellites, as another option by which information about the trace-gas composition of Earth’s atmosphere can be obtained. Satellite observations offer extensive spatial coverage, combined with a possibility of information being provided on vertical profi les of measured atmospheric constituents. Disadvantages of remote sensing include lower measurement precision, lower temporal resolution and uneven spatial and temporal coverage (e.g. Takagi et al. 2011, Nassar et al. 2014). Currently, the usage of remote sensing in GHG monitoring of lower troposphere is limited to CO2 and CH4, though the release of a new generation of satellites may also make information retrieval about other atmospheric constituents (including N2O) a real possibility in the near future.
Brought to you by | University of BristolAuthenticated
Download Date | 6/2/17 1:04 PM
114 K. Różański, Ł. Chmura, M. Gałkowski, J. Nęcki, M. Zimnoch, J. Bartyzel, S. O’Doherty
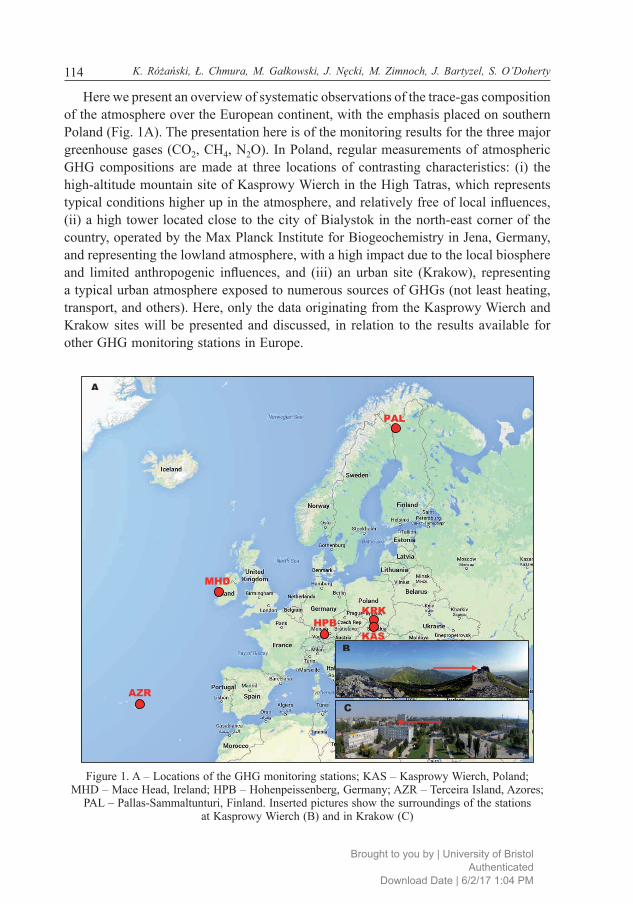
Here we present an overview of systematic observations of the trace-gas composition of the atmosphere over the European continent, with the emphasis placed on southern Poland (Fig. 1A). The presentation here is of the monitoring results for the three major greenhouse gases (CO2, CH4, N2O). In Poland, regular measurements of atmospheric GHG compositions are made at three locations of contrasting characteristics: (i) the high-altitude mountain site of Kasprowy Wierch in the High Tatras, which represents typical conditions higher up in the atmosphere, and relatively free of local infl uences, (ii) a high tower located close to the city of Bialystok in the north-east corner of the country, operated by the Max Planck Institute for Biogeochemistry in Jena, Germany, and representing the lowland atmosphere, with a high impact due to the local biosphere and limited anthropogenic infl uences, and (iii) an urban site (Krakow), representing a typical urban atmosphere exposed to numerous sources of GHGs (not least heating, transport, and others). Here, only the data originating from the Kasprowy Wierch and Krakow sites will be presented and discussed, in relation to the results available for other GHG monitoring stations in Europe.
Figure 1. A – Locations of the GHG monitoring stations; KAS – Kasprowy Wierch, Poland; MHD – Mace Head, Ireland; HPB – Hohenpeissenberg, Germany; AZR – Terceira Island, Azores;
PAL – Pallas-Sammaltunturi, Finland. Inserted pictures show the surroundings of the stations at Kasprowy Wierch (B) and in Krakow (C)
Brought to you by | University of BristolAuthenticated
Download Date | 6/2/17 1:04 PM

115Monitoring of greenhouse gases in the atmosphere…
The measurements of atmospheric mixing ratios of CO2 and CH4 at the Kasprowy Wierch station go back to 1994 (Nęcki et al. 2003). N2O has been measured there regularly, since 2009 (Gałkowski 2015). Measurements of CO2, CH4 and N2O mixing ratios in the Krakow atmosphere have been being made on an intermittent basis since 2003 (Chmura et al. 2008, Chmura 2009, Gałkowski 2015).
DESCRIPTION OF MONITORING SITES
The Kasprowy Wierch station (49°14’ N, 19°59’ E, 1989 m a.s.l., air intake at 4 m a.g.l.) is situated on top of the Kasprowy Wierch peak located in the Tatra Mountains, at the intersection of three main valleys on the border between Poland and Slovakia (Fig. 1B). Since Kasprowy Wierch is situated within the transition zone between the free troposphere and the planetary boundary layer, and is relatively free of local infl uences, this site is considered a regional reference station for trace gas measurements in the lower atmosphere over Central and Eastern Europe.
The GHG monitoring site in Krakow (50°04’ N, 19°55’ E, 220 m a.s.l.) is situated on the University campus located in the western part of the city, bordering recreation and sports grounds (Fig. 1C). The air intake is placed approx. 40 m above the local ground. Krakow is located some 100 km north of the Tatra Mountains, in which the Kasprowy Wierch station operates. With about one million inhabitants, rapidly growing car traffi c and signifi cant industrial activities, the Krakow agglomeration represents a typical urban environment in Eastern Europe. Characteristic features of the local climate are generally weak winds and frequent thermal inversions in the lower troposphere, extending over several days at times, particularly during the winter season. These factors favour accumulation of trace gases originating from surface emissions in the lower atmosphere over the city.
METHODS
Atmospheric mole fractions of CO2, CH4 and N2O are measured at Kasprowy Wierch and in Kraków using automated gas chromatographs (Nęcki et al. 2003, Gałkowski 2015). This analytical set-up allows for the monitoring of CO2, CH4 and N2O in quasi-continuous mode, with consecutive measurements performed every 15–30 minutes, in a standard–sample–standard sequence. Each working standard is calibrated against two reference gases certifi ed by the NOAA Earth Systems Research Laboratory, which provide a direct connection to the internationally recommended measurement scales for all three gases analysed. The scales used are WMO X2007 for CO2, NOAA 2004 for CH4 and NOAA 2006A for N2O. In addition, both sites are participating in inter-laboratory comparison programmes to ensure adequate measurement intercomparability (CUCUMBER 2016).
Brought to you by | University of BristolAuthenticated
Download Date | 6/2/17 1:04 PM

116 K. Różański, Ł. Chmura, M. Gałkowski, J. Nęcki, M. Zimnoch, J. Bartyzel, S. O’Doherty
RESULTS AND DISCUSSION
This section presents the results of GHG monitoring available for the Kasprowy Wierch and Krakow stations, going on to discuss them in the context of data available for other GHG monitoring sites in Europe.
CARBON DIOXIDE
The record for CO2 mixing ratios available for the Kasprowy Wierch station is as shown in Figure 2. The record covers the time period from September 1994 through to December 2015. Three types of data are presented in this fi gure. First, daily means for the measured CO2 mixing ratios are shown in the background (in orange), these being calculated from the results of quasi-continuous monitoring, after an appropriate, three-step data selection procedure has been applied to the raw measurement results. These selected data represent the background conditions at the station (Nęcki et al. 2003). Second, daily mean values were further smoothed using the routine recommended by NOAA (CCGvu 4.40 – Thoning et al. 1989), resulting in the curve shown in blue. Finally, the trend curve derived from daily means after deseasoning and further smoothing of the data following the CCGvu4.40 routine, is shown in black. The mole fraction for CO2 at Kasprowy Wierch has increased by 11.8%, from 361.9 ppm in 1994 to 403.9 ppm in 2015.
Figure 2. The record of CO2 mixing ratios available for the Kasprowy Wierch stationShown are daily means (in orange) calculated on the basis of raw measurement data, following
application of an appropriate data-selection procedure. Daily means are smoothed using the CCGvu 4.40 routine (Thoning et al. 1989). The resulting curve is shown in dark blue. Also shown (in black)
is the trend curve. See text for details.
Brought to you by | University of BristolAuthenticated
Download Date | 6/2/17 1:04 PM

117Monitoring of greenhouse gases in the atmosphere…
The CO2 trend curve for Kasprowy Wierch is compared in Figure 3 with those calculated for four other GHG monitoring stations located on the European continent: two stations representing regional marine background conditions (Mace Head, Ireland, 53°33' N, 9°80' E, 5 m a.s.l. and Terceira Island, Azores, Portugal, 38°77' N, 27°38' W, 19 m a.s.l.), and two continental stations (Hohenpeissenberg, Germany, 47°80' N, 11°02' E, 936 m a.s.l. and Pallas-Sammaltunturi, Finland, 67°97' N, 24°12' E, 560 m a.s.l.). The CO2 trend curves for those stations were calculated using the same smoothing routine as in the case of Kasprowy Wierch (CCGvu 4.40 – Thoning et al. 1989), applied to the data retrieved from the NOAA ESRL Carbon Cycle Cooperative Global Air Sampling Network (http://www.esrl.noaa.gov/gmd/dv/data/ – Dlugokencky et al. 2015). It is apparent from Figure 3 that mean rates of growth for the CO2 mole fraction observed at fi ve GHG monitoring stations in Europe are very similar (Kasprowy Wierch – 1.99 ppm year–1; Mace Head – 2.00 ppm year–1; Terceira Island – 1.97 ppm year–1; Hohenpeissenberg – 2.06 ppm year–1; Pallas-Sammaltunturi – 2.16 ppm year–1). The sustained difference of ca. 3 ppm between values noted at the marine background stations and at the Pallas-Sammaltunturi station may stem from the reduced role of the biospheric sink at high northern latitudes, as a factor controlling atmospheric mixing ratios of CO2 in this region.
A distinct seasonal cycle is to be noted for the CO2 mole fraction and the Kasprowy Wierch data (cf. Fig. 2), with higher values in winter and lower values in summer. This cycle is driven by seasonal photosynthetic activity of the biosphere. In the period in question, the peak-to-peak amplitude to the seasonal fl uctuations of CO2 mixing ratios measured at this site ranged between 12.8 ppm (2003) and 20.9 ppm (2001). The low
Figure 3. Comparison of CO2 trend curves calculated for fi ve European GHG monitoring stationsKAS – Kasprowy Wierch, Poland; MHD – Mace Head, Ireland; HPB – Hohenpeissenberg,
Germany; AZR – Terceira Island, Azores; PAL – Pallas-Sammaltunturi, Finland.
Brought to you by | University of BristolAuthenticated
Download Date | 6/2/17 1:04 PM

118 K. Różański, Ł. Chmura, M. Gałkowski, J. Nęcki, M. Zimnoch, J. Bartyzel, S. O’Doherty
amplitude in 2003 can be attributed to a very hot summer in Europe that reduced photosynthetic activity in the biosphere regionally (Ciais et al. 2005).
Figure 4 compares mean seasonal cycles of atmospheric CO2 mixing ratios measured at the fi ve European GHG monitoring stations (Mace Head, Terceira Island, Hohenpeissenberg, Kasprowy Wierch and Pallas-Sammaltunturi). After the detrending procedure had been applied to daily means, monthly mean CO2 mixing ratios were calculated for the period 2007–2014 for each station. As seen in Figure 4, there are distinct differences between the marine and continental stations, with respect to both the amplitude characterising the seasonal CO2 cycle and the timing of maximum and minimum values for the CO2 mixing ratio in the course of a year. Marine stations show a reduced peak-to-peak amplitude of the seasonal CO2 cycle (Mace Head – 14.8 ppm; Terceira Island – 10.5 ppm) as compared with continental stations (Hohenpeissenberg – 22.7 ppm; Pallas-Sammaltunturi – 17.5 ppm). The amplitude of the CO2 seasonal cycle at the Kasprowy Wierch station (14.3 ppm) is similar to that observed at Mace
Figure 4. Mean seasonal CO2 cycle at the fi ve European GHG monitoring stationsKAS – Kasprowy Wierch, Poland; MHD – Mace Head, Ireland; HPB – Hohenpeissenberg,
Germany; AZR – Terceira Island, Azores; PAL – Pallas-Sammaltunturi, Finland. Shown is the mean seasonal CO2 cycle for the period 2007–2014 following removal of the trend. Typical uncertainties
associated with the data points are in the range 0.1–0.6 ppm.
Head and Terceira Island. Reduced CO2 amplitude at this site when compared to other continental stations is related to its high elevation. The seasonal maximum for the CO2 mole fraction is recorded at marine stations in April, and is shifted towards the beginning of a year at continental sites, i.e. February at Hohenpeissenberg and Pallas-Sammaltunturi and March at Kasprowy Wierch. The minimum CO2 mole fraction is recorded at all fi ve stations during the month of August. These differences in the mean
Brought to you by | University of BristolAuthenticated
Download Date | 6/2/17 1:04 PM

119Monitoring of greenhouse gases in the atmosphere…
seasonal CO2 cycle between marine and continental stations stem from regional and local factors such as the varying role of anthropogenic emissions in terms of timing and intensity, and differences in the biospheric sink within the footprints of the discussed GHG monitoring sites.
METHANE
Figure 5 shows the available record for atmospheric CH4 mixing ratios measured at the Kasprowy Wierch station. Daily means for CH4 mixing ratios are shown, as calculated following the application of a three-step data-selection procedure to raw measurement data. That procedure is aimed at selecting data representative of background conditions at this station (Nęcki et al. 2003). Also shown is the trend curve calculated on the basis of daily means using the CCGvu 4.40 smoothing routine (Thoning et al. 1989).
Figure 5. The record of CH4 mixing ratios available for the Kasprowy Wierch stationShown are daily means (in orange) calculated following the application to the raw measurement data of an appropriate data-selection procedure. The trend curve is also shown (in black). See text for details.
The mole fraction of atmospheric CH4 measured at Kasprowy Wierch has increased from 1843 ppb in 1994 to 1927 ppb in 2015. The data for methane are also seen to differ from those on CO2 in not manifesting a seasonal cycle. Furthermore, the long-term trend is generally more variable than in the case of CO2, with annual growth rates varying from –32.9 ppb year–1 in 2003 to +18.3 ppb year–1 in 2012.
Figure 6 summarizes the trend curves calculated for CH4 mixing ratio records available for four European GHG monitoring stations (Mace Head, Terceira Island, Kasprowy Wierch and Pallas-Sammaltunturi). The trend curves for Mace Head, Terceira
Brought to you by | University of BristolAuthenticated
Download Date | 6/2/17 1:04 PM

120 K. Różański, Ł. Chmura, M. Gałkowski, J. Nęcki, M. Zimnoch, J. Bartyzel, S. O’Doherty
Figure 6. Comparison of CH4 trend curves calculated for the European GHG monitoring stationsKAS – Kasprowy Wierch, Poland; MHD – Mace Head, Ireland; AZR – Terceira Island, Azores;
PAL – Pallas-Sammaltunturi, Finland.
Island and Pallas-Sammaltunturi were calculated on the basis of data retrieved from the NOAA ESRL Carbon Cycle Cooperative Global Air Sampling Network (http://www.esrl.noaa.gov/gmd/dv/data/ – Dlugokencky et al. 2015a). Following stagnation during the 2001–2007 period, the atmospheric mixing ratios for CH4 have begun to increase again in the recent years. This is a world-wide phenomenon, attributed to increased surface emissions of CH4, mainly by wetlands in tropical South America and in boreal Eurasia (Bousquet et al. 2011). It is clear from Figure 6 that mole fractions of CH4 recorded at Kasprowy Wierch and Pallas-Sammaltunturi are shifted towards higher levels than is the case at the marine reference stations (Mace Head and Terceira Island). For Kasprowy Wierch, the departure has so far varied within the range 9.2 ppb in 2003 to 62.4 ppb in 2002. The higher mixing ratios for CH4 recorded at Kasprowy Wierch, as opposed to Mace Head, refl ect continental emissions and a gradual loading with CH4 of air masses on their way from the Atlantic coast towards the centre of the European continent. The CH4 trend curve for the Pallas-Sammaltunturi station is shifted by ca. 15 ppb towards higher CH4 mixing ratios, as compared with the Kasprowy Wierch data. This offset is expected, and refl ects the combined infl uence of: (i) high CH4 emissions originating from wetlands in high-latitude Eurasia, (ii) anthropogenic sources (mainly located in European parts of Russia), and (iii) reduced intensity of CH4 sinks in the polar atmosphere (Aalto et al. 2007). The origin of the anomalously high CH4 mole fractions recorded at Kasprowy Wierch in 2002 is unclear, and needs to be investigated further. Such a distinct maximum in
Brought to you by | University of BristolAuthenticated
Download Date | 6/2/17 1:04 PM

121Monitoring of greenhouse gases in the atmosphere…
the CH4 mole fraction was not observed at this time at any other GHG monitoring station in Europe.
NITROUS OXIDE
The N2O record available to date for the Kasprowy Wierch station is as presented in Figure 7. Daily means for N2O mixing ratios measured at this station, and the resulting N2O trend curve, are compared in this fi gure with the trend curve for Mace Head, calculated on the basis of the data available for this station (http://agage.eas.gatech.edu, Prinn et al. 2000). As in the case of CH4, continental emissions of N2O result in an apparent departure of readings for Kasprowy Wierch from those characterising Mace Head, of the order of 1 ppb. The observed long-term growth rate is equal to 0.83 ppb year–1 and is similar to the globally averaged value of 0.73 ppb year–1 (IPCC 2013). The reason behind this growth is the imbalance in the global N2O budget, caused mainly by enhanced fugitive emissions from internal metabolic processes of terrestrial and marine microorganisms (e.g. nitrifying and denitrifying bacteria). These emissions are directly related to the availability of reactive nitrogen compounds in a wide range of ecosystem types. This availability has increased drastically in the 20th century, following the industrialization of the Haber-Bosch process. As the rate of transport between the troposphere and the stratosphere (where N2O is destroyed by photolysis) is too slow to respond to the rising levels of N2O, a long-term increase in the concentration of this gas is to be observed.
Figure 7. The record of N2O mixing ratios available for the Kasprowy Wierch stationShown are daily means (in orange) calculated following application to the raw measurement data
of an appropriate data-selection procedure. Also shown are trend curves for Kasprowy Wierch (thick line in black) and the Mace Head station (thin line in magenta).
Brought to you by | University of BristolAuthenticated
Download Date | 6/2/17 1:04 PM

122 K. Różański, Ł. Chmura, M. Gałkowski, J. Nęcki, M. Zimnoch, J. Bartyzel, S. O’Doherty
GREENHOUSE GASES IN THE URBAN ATMOSPHERE
Urban areas are characterized by a high density of GHG sources. Local transport and heating systems release considerable amounts of CO2 arising from the burning of fossil fuels. Globally, the emissions of CO2 from fossil-fuel burning and cement production have increased by about 59%, from 22.4 PgCO2 in 1990 to 35.9 PgCO2 in 2014 (Global Carbon Project 2015). Urbanised regions are also major emitters of CH4, which leaks from gas distribution networks and local landfi lls (Zimnoch et al. 2010). In urban areas located at mid and high latitudes, the intensity of GHG emissions can be modulated seasonally. The winter season is usually characterized by enhanced CO2 emissions due to fossil-fuel burning for heating purposes, while increased emissions of CH4 are expected from landfi lls and wetlands during the summer season.
Figure 8. Mean diurnal cycle for the CO2, CH4 and N2O mole fractions recorded at the Kasprowy Wierch (KAS) and Krakow (KRK) stations between July 10th and August 10th 2014
Thick lines represent mean values of hourly binned measurements. Shaded areas represent the 1σ uncertainty range.
A high intensity of surface emissions of greenhouse gases in urban areas combines with distinct diurnal changes in the intensity of vertical mixing in the lower atmosphere, to produce the characteristic changes in GHG mixing ratios that are recorded in the near-ground urban atmosphere in the course of a day. High mole fractions of trace gases emitted from the surface are usually recorded during night hours, when a nocturnal inversion layer develops, while daily GHG minima are usually observed at midday and in the early afternoon hours, when vertical mixing of the lower atmosphere is at its maximum. An example of diurnal changes in CO2, CH4 and N2O mixing ratios measured in Krakow and Kasprowy Wierch is shown in Figure 8. The diagram depicts mean diurnal variations in CO2, CH4 and N2O mixing ratios in the Krakow atmosphere calculated for the one-month period between July 10th and August 10th, 2014. While distinct midday minima are observed for all three gases in Krakow, CO2, CH4 and N2O values recorded at Kasprowy Wierch reveal broad maxima at this time. These are associated with diurnal changes in atmospheric circulation in the vicinity of the station (the mountain breeze). In the course of the day, air masses from the nearby town of
Brought to you by | University of BristolAuthenticated
Download Date | 6/2/17 1:04 PM

123Monitoring of greenhouse gases in the atmosphere…
Zakopane that are loaded with greenhouse gases emitted from the surface (within the city and its surroundings) are lifted along the main valleys towards the mountain ridges, leading to the elevation of values for the mixing ratios that are recorded at the Kasprowy Wierch site (Nęcki et al. 2003, Gałkowski 2015).
Figure 9. Daily variations of CO2, CH4 and N2O mixing ratios recorded at the Krakow (blue) and Kasprowy Wierch (red) stations, between July 10th and August 10th 2014
Figure 9 shows the CO2, CH4 and N2O mole fractions recorded at Krakow and Kasprowy Wierch in a single month. As Figure 9 makes clear, the local enhancements of CO2, CH4 and N2O in the Krakow atmosphere during the night hours can be substantial. The presented record includes night-time mixing ratios exceeding the baseline level by up to 40% in the case of CO2 and CH4, and ca. 3% for N2O.
CONCLUSIONS
Long-term, systematic observations of atmospheric levels of the major greenhouse gases allow for quantifi cation of their temporal evolution under growing anthropogenic stress. They also allow for a deeper insight into the processes controlling the levels of these gases in the continental atmosphere over different time scales. In fact, several
Brought to you by | University of BristolAuthenticated
Download Date | 6/2/17 1:04 PM

124 K. Różański, Ł. Chmura, M. Gałkowski, J. Nęcki, M. Zimnoch, J. Bartyzel, S. O’Doherty
important characteristics are revealed from the presentation here of the way the atmospheric mixing ratios for CO2, CH4 and N2O over Europe and the adjacent portions of the Atlantic Ocean have evolved.
First, the growth rates for the CO2 mole fraction recorded at stations both marine (Mace Head, Ireland; Terceira Island, Azores) and continental (Hohenpeissenberg, Germany; Kasprowy Wierch, Poland; Pallas-Sammaltunturi, Finland) reveal only small temporal changes and almost coincide, leading to a quasi-linear increase in the CO2 mole fraction over the European continent as a whole. While values for the N2O mole fraction also display steady growth over this time period, the mole fractions characterising CH4, has been increasing again over the past several years, following a 2001–2007 stagnation period.
Second, the mean seasonal CO2 cycle reveals distinct differences among the monitoring sites considered, depending on the location of the given station, and as a refl ection of differences in seasonal biospheric impact and the extent of surface anthropogenic emissions of this gas. The weak seasonality characterising the CH4 and N2O records for Mace Head is hardly noted in the centre of the continent. It is also possible to note a distinct offset between the trend curve for CH4 mixing ratios measured at Kasprowy Wierch, and those representing the marine (Mace Head and Terceira Island) reference stations. The mean size of the departure involved in the case of CH4 is 27.3 ppb over the 1995–2014 period, and is a refl ection of continental emissions of CH4 linked mainly to anthropogenic activities (leaks from natural-gas distribution networks, landfi lls and livestock). For N2O, a similar if far smaller departure, of the order of 1 ppb, is to be observed for the 2009–2014 period.
Comparison of quasi-continuous measurements of CO2, CH4 and N2O mixing ratios made in the urban atmosphere of Krakow and at the regional reference site of Kasprowy Wierch, i.e. locations approximately 100 km apart, allows for a deeper insight into the mechanisms controlling daily variations in the atmospheric mixing ratios of these gases at the two sites. Development of a nocturnal inversion layer in the atmosphere above the city leads to local enhancements of CO2, CH4 and N2O mole fractions in the Krakow atmosphere during night hours, signifi cantly exceeding the baseline level. Daily fl uctuations of CO2 and CH4 mixing ratios recorded at Kasprowy Wierch are shifted in phase (daily maxima and nocturnal minima), and are much weaker than those observed in Krakow. They are related to local circulation of the atmosphere, bringing air with higher mixing ratios of CO2 and CH4 from the surrounding valleys up to the station during daytime. During the night, the station is often situated above the nocturnal inversion layer.
ACKNOWLEDGMENTS
The authors wish to thank the numerous individuals and institutions which have supported the measurement of the trace-gas composition of the atmosphere over southern Poland in the past twenty years. The ongoing monitoring activities are supported by the
Brought to you by | University of BristolAuthenticated
Download Date | 6/2/17 1:04 PM

125Monitoring of greenhouse gases in the atmosphere…
EU FP7 InGOS project, as well as Poland’s Ministry of Science and Higher Education (statutory funds, project no. 11.11.220.01).
REFERENCES
Aalto T., Hatakka J., Lallo M., 2007, Tropospheric methane in northern Finland: seasonal variations, transport patterns and correlations with other trace gases, Tellus, 59B, 251–259.
Bousquet P., Ringeval B., Pison I., Dlugokencky E.J., Brunke E.-G., Carouge C., Chevalier F., Fortems-Cheiney A., Frankenberg C., Hauglustaine, D.A., Krummel P.B., Langenfelds R.L., Ramonet M., Schmidt M., Steele L.P., Szopa S., Yver C., Viovy N., Ciais P., 2011, Source attribution of the changes in atmospheric methane for 2006–2008, Atmos. Chem. Phys., 11, 3689–3700.
Chmura Ł., Różański K., Nęcki J.M., Zimnoch M., Korus A., Pycia M., 2008, Atmospheric concentration of carbon dioxide in southern Poland: comparison of mountain and urban environments, Pol. J. Environ. Stud., 17, 859–867.
Chmura Ł., 2009, Greenhouse gases in the atmosphere over southern Poland; temporal and spatial variability during the period 1994–2007, PhD Thesis, AGH University of Science and Technology, Kraków (in Polish).
Ciais P., Reichstein M., Viovy N., Granier A., Ogée J., Allard V., Aubinet M., Buchmann N., Bernhofer Chr., Carrara A., Chevalier F., De Noblet N., Friend A.D., Friedlingstein P., Grünwald T., Heinesch B., Keronen P., Knohl A., Krinner G., Loustau D., Manca G., Matteucci G., Miglietta F., Ourcival J.M., Papale D., Pilegaaed K., Rambal S., Seufert G., Soussana J.F., Sanz M.J., Schulze E.D., Vesala T., Valentini R., 2005, Europe-wide reduction in primary productivity caused by the heat and drought in 2003, Nature, 437, 529–533.
CUCUMBER 2016, Website of the CUCUMBER intercomparison programme, http://cucumbers.uea.ac.uk/, accessed on 18.03.2016
Dlugokencky E.J., Lang P.M., Masarie K.A., Crotwell A.M., Crotwell M.J., 2015, Atmospheric carbon dioxide dry air mole fractions from the NOAA ESRL Carbon Cycle Cooperative Global Air Sampling Network, 1968–2014, Version: 2015-08-03, ftp://aftp.cmdl.noaa.gov/data/trace_gases/co2/fl ask/surface/
Dlugokencky E.J., Lang P.M., Crotwell A.M., Masarie K.A., Crotwell M.J., 2015a, Atmospheric methane dry air mole fractions from the NOAA ESRL Carbon Cycle Cooperative Global Air Sampling Network, 1983–2014, Version: 2015-08-03, ftp://aftp.cmdl.noaa.gov/data/trace_gases/ch4/fl ask/surface/
Gałkowski M., 2015, Temporal and spatial variability of nitrous oxide in the atmosphere over Malopolska region: determination of loads and emissions, PhD Thesis, AGH University of Science and Technology, Kraków.
Global Carbon Project, 2015, Carbon budget and trends 2015, http://www.globalcarbonproject.org/carbonbudget, accessed on 18.03.2016.
IPCC, 2013, Climate Change 2013: The Physical Science Basis. Contribution of Working Group I to the Fifth Assessment Report of the Intergovernmental Panel on Climate Change, Cambridge, United Kingdom and New York, NY, USA, Cambridge University Press.
Brought to you by | University of BristolAuthenticated
Download Date | 6/2/17 1:04 PM

126 K. Różański, Ł. Chmura, M. Gałkowski, J. Nęcki, M. Zimnoch, J. Bartyzel, S. O’Doherty
Keeling Ch.D., 1960, The concentration and isotopic abundances of carbon dioxide in the atmosphere, Tellus, 12, 200–203.
Nassar R., Sioris C.E., Jones D.B.A., McConnell J.C., 2014, Satellite observations of CO2 from a highly elliptical orbit for studies of the Arctic and boreal carbon cycle, J. Geophys. Res. Atmos., 119, 2654–2673.
Nęcki J.M., Schmidt M., Różański K., Zimnoch M., Korus A., Lasa J., Graul R., Levin I., 2003, Six-year record of atmospheric carbon dioxide and methane at a high-altitude mountain site in Poland, Tellus, 55B, 94–104.
Prinn R.G., Weiss R.F., Fraser P.J., Simmonds P.G., Cunnold D.M., Alyea F.N., O’Doherty S., Salameh P., Miller B.R., Huang J., Wang R.H.J., Hartley D.E., Harth C., Steele L.P., Sturrock G., Midgley P.M., McCulloch A., 2000, A history of chemically and radiatively important gases in air deduced from ALE/GAGE/AGAGE, J. Geophys. Res., 105(D14), 17751–17792.
Takagi H., Saeki T., Oda T., Saito M., Valsala V., Belikov D., Saito R., Yoshida Y., Morino I., Uchino O., Andres R.J., Yokota T., Maksyutov S., 2011, On the benefi t of GOSAT observations to the estimation of regional CO2 fl uxes, SOLA, 7, 161−164.
Thoning K.W., Tans P.P., Komhyr W.D., 1989, Atmospheric carbon dioxide at Mauna Loa Observatory 2. Analysis of the NOAA GMCC data, 1974–1985, J. Geophys. Res., 94, 8549–8565.
WMO 2013. GAW Report No. 213, 17th WMO/IAEA Meeting on Carbon Dioxide, Other Greenhouse Gases and Related Tracers Measurement Techniques (GGMT-2013), Beijing, China, 10–13 June 2013, World Meteorological Organization, Geneva, Global Atmosphere Watch.
Zimnoch M., Godlowska J., Nęcki J.N., Różański K., 2010, Assessing surface fl uxes of CO2 and CH4 in urban environment: a reconnaissance study in Krakow, Southern Poland, Tellus 62B, 573–580.
(www.esrl.noaa.gov/gmd/obop/mlo/)(www.wmo.int/pages/prog/gaw)(www.esrl.noaa.gov/gmd/) (www.agage.eas.gatech.edu)(www.icos-infrastructure.eu) (www.neonscience.org)(http://www.esrl.noaa.gov/gmd/dv/data/)
Brought to you by | University of BristolAuthenticated
Download Date | 6/2/17 1:04 PM