Embed Size (px)
Citation preview
RPM Reports Fiscal 2021 Second-Quarter Results
• Record second-quarter sales, earnings and cash from operations
• Sales increased 6.0% to $1.49 billion and were boosted by the acquisition of Ali Industries
• Net income increased 65.7% to $127.7 million as the MAP to Growth operating improvement
program enabled RPM to leverage moderate sales growth to bottom line
• Diluted EPS increased 66.1% to $0.98; adjusted diluted EPS increased 39.5% to $1.06
• EBIT increased 49.8% to $178.7 million; adjusted EBIT increased 29.7% to $199.3 million
• Record cash from operations of $579.5 million for the first half was due to margin improvements
and good working capital management
• Fiscal 2021 third-quarter outlook calls for mid-single-digit sales growth and adjusted EBIT
growth of 30% or more
MEDINA, OH – January 6, 2021 – RPM International Inc. (NYSE: RPM), a world leader in specialty
coatings and sealants, today reported record sales, earnings and cash from operations for its fiscal 2021
second quarter ended November 30, 2020.
Second-Quarter Consolidated Results
Fiscal 2021 second-quarter net sales were a record $1.49 billion, up 6.0% over the $1.40 billion reported a
year ago. Net income was up 65.7% to $127.7 million versus $77.0 million in the year-ago period. Diluted
earnings per share (EPS) were $0.98, an increase of 66.1% over the $0.59 reported in the year-ago quarter.
Income before income taxes (IBT) was $167.0 million, up 64.1% compared to $101.8 million reported in
the prior year’s second quarter. RPM’s consolidated earnings before interest and taxes (EBIT) were up
49.8% to $178.7 million compared to $119.3 million reported in the year-ago period.
The fiscal 2021 second quarter included $18.6 million in charges for restructuring related to the company’s
MAP to Growth operating improvement plan and other charges, as well as a $2.0 million charge for the
resolution of a legacy investigation by the Securities and Exchange Commission (SEC). The same period
of fiscal 2020 included charges of $34.4 million for restructuring and acquisition-related costs. Excluding
these charges, RPM’s adjusted EBIT was up 29.7% to $199.3 million compared to $153.7 million during
the year-ago period. The company has excluded the impact of gains and losses from marketable securities
from adjusted EPS, as their inherent volatility is outside of management’s control and cannot be predicted
with any level of certainty. These investments resulted in a net pre-tax gain of $7.5 million for the second
quarter of fiscal 2021 and $5.9 million during the same quarter last year. Excluding the restructuring and
other charges, as well as investment gains and losses, adjusted diluted EPS increased 39.5% to $1.06
compared to $0.76 in fiscal 2020.
“Thanks to the efforts of our associates to grow the top line during challenging economic conditions
worldwide, coupled with operational improvements, we achieved record second-quarter sales, earnings and
cash flow,” stated Frank C. Sullivan, RPM chairman and CEO.
“Once again, our MAP to Growth program generated strong leverage to the bottom line, despite moderate
sales growth. Organic sales grew 3.5% during the second quarter. Acquisitions contributed 2.3% and
included the recent addition of Ali Industries, which positively impacted both sales and earnings while also
RPM Reports Fiscal 2021 Second-Quarter Results
January 6, 2021
Page 2 of 7
demonstrating our renewed focus on growth. Foreign currency translation added 0.2% to sales as
international markets, particularly those in Europe, continued to improve.
“On an adjusted basis, our consolidated EBIT margin increased 240 basis points to 13.4% during the
quarter, driven by three of our four segments registering substantial EBIT margin improvements. This was
even more impressive given a tough comparison to last year when adjusted EBIT increased by 22.0%,”
stated Sullivan.
Second-Quarter Segment Sales and Earnings
During the fiscal 2021 second quarter, Construction Products Group net sales increased 0.8% to
$503.5 million from $499.5 million a year ago, reflecting organic growth of 1.2%, which was somewhat
offset by foreign currency translation headwinds of 0.4%. Segment IBT was $71.8 million compared with
$57.1 million a year ago. EBIT increased 25.0% to $74.0 million compared to $59.2 million in the fiscal
2020 second quarter. The segment incurred restructuring-related expenses and other costs of $4.5 million
during the second quarter of fiscal 2021 and $2.7 million during the same period of fiscal 2020. Excluding
these charges, fiscal 2021 second-quarter adjusted EBIT increased 26.8% to $78.5 million from adjusted
EBIT of $61.9 million reported during the year-ago period.
“Our Construction Products Group was able to leverage modest sales growth into outstanding results on the
bottom line, due in large part to our MAP to Growth program, aggressive discretionary cost cuts and
proactive management to improve its product mix,” stated Sullivan. “This was achieved despite commercial
and institutional construction markets that continue to be soft in North America and Europe. The segment
was able to maintain its top line by focusing on renovation and restoration projects, expanding its position
as a single-source provider of building envelope systems and continuing to take market share with industry-
leading construction technologies, including its Nudura insulated concrete forms.”
Fiscal 2021 second-quarter Performance Coatings Group net sales decreased 11.6% to $258.8 million from
$292.7 million a year ago, reflecting an organic decline of 12.2%, offset somewhat by foreign currency
translation of 0.4% and acquisitions of 0.2%. Segment IBT and EBIT were $24.0 million compared with
$33.3 million a year ago, a decrease of 27.8% compared to the year-ago period. The segment reported
second-quarter restructuring and other charges related to the company’s MAP to Growth program of $4.0
million in fiscal 2021 and $3.7 million during the same period of fiscal 2020. Adjusted EBIT, which
excludes these charges, decreased 24.2% to $28.0 million during the second quarter of fiscal 2021 from
adjusted EBIT of $37.0 million during the year-ago period.
“Similar to last quarter, the Performance Coatings Group’s sales continued to be impacted by Covid-19
restrictions that limited access to construction sites and weak energy markets that have caused deferred
industrial maintenance spending. Conditions in emerging markets were particularly challenging. In
addition, its Carboline business was temporarily disrupted by a series of hurricanes in the Gulf region of
the U.S.,” stated Sullivan. “The segment’s earnings were impacted by declining sales, partially offset by
MAP to Growth savings and discretionary cost reductions. Out of all our segments, the Performance
Coatings Group has been unfavorably affected the most by the pandemic. However, it also stands to benefit
significantly from the pandemic’s end, as its customers catch up on deferred maintenance and construction
projects.”
RPM Reports Fiscal 2021 Second-Quarter Results
January 6, 2021
Page 3 of 7
The Consumer Group generated a 21.4% increase in sales, which grew to $547.5 million from
$450.9 million in the fiscal 2020 second quarter. Organic sales increased 15.2%, while acquisition growth
contributed 5.8% and foreign currency translation increased sales by 0.4%. The top line benefitted from the
current-quarter acquisition of Ali Industries, which is the largest acquisition that RPM has executed since
fiscal 2013. Consumer Group IBT and EBIT were $88.4 million compared with $34.5 million in the prior-
year period, an increase of 156.2%. The segment incurred restructuring and other charges related to the
company’s MAP to Growth program and acquisition costs totaling $2.2 million during the second quarter
of fiscal 2021 and $20.2 million of restructuring-related costs during the same period of fiscal 2020.
Excluding these expenses, adjusted EBIT was up 65.8% to $90.7 million for the fiscal 2021 second quarter
versus adjusted EBIT of $54.7 million for the year-ago period.
“The Consumer Group’s outstanding performance was driven by our broad distribution and market-leading
position as consumers tackled significantly more projects while homebound because of the pandemic. We
are investing in paint-making and aerosol filling capacity to help meet this demand. The top line also
benefited from brisk cleaning product sales, favorable translational foreign exchange and the recent
acquisition of Ali Industries, provider of Gator brand sandpaper and other abrasive products,” stated
Sullivan. “Raw material costs were stable overall during the second quarter, but are currently rising. High
sales volumes and MAP to Growth savings were leveraged to the segment’s strong bottom line.”
During the second quarter of fiscal 2021, the Specialty Products Group reported sales of $176.1 million, an
increase of 11.3% compared to $158.2 million in the year-ago period. Organic sales increased 6.6%, a recent
acquisition added 3.8% and foreign currency translation increased sales by 0.9%. Specialty Products Group
IBT was $28.4 million compared with $18.8 million in the prior-year period. EBIT was $28.5 million, an
increase of 51.7% compared to $18.8 million in the fiscal 2020 second quarter. The segment reported
second-quarter restructuring and other charges related to the company’s MAP to Growth of $1.1 million in
fiscal 2021 and $4.4 million during the same period of fiscal 2020. Adjusted EBIT, which excludes
restructuring-related expenses, was $29.6 million in the fiscal 2021 second quarter, an increase of 27.7%
compared to $23.2 million in the year-ago period.
“Recent management changes at the Specialty Products Group have helped to turn around results at the
segment this quarter. Sales were boosted by increased hurricane and wildfire activity, which drove demand
for our water restoration equipment, as well as fluorescent pigments, which are used in fire retardant tracer
dyes. Additionally, we continued to experience strong demand for our expanding lineup of disinfectants,
air purification equipment and HEPA filters. A few of this segment’s end markets have improved. For
example, sales of its industrial wood protection products increased as a result of a stronger residential
market that has driven demand for lumber, furniture and cabinets in the U.S. We also expanded sales in our
forestry chemicals business in Australia and New Zealand,” stated Sullivan. “The segment’s bottom line
increased due to higher sales volumes, operational improvements and MAP to Growth savings.”
First-Half Consolidated Sales and Earnings
Fiscal 2021 first-half net sales increased 7.6% to $3.09 billion from $2.87 billion during the first six months
of fiscal 2020. Organic growth was 6.5%, with acquisitions adding 1.4%. Foreign currency translation
headwinds reduced sales slightly by 0.3%. Net income was $308.3 million, an increase of 68.2% compared
to $183.2 million in the fiscal 2020 first half. Diluted EPS increased 68.1% to $2.37 versus $1.41 a year
RPM Reports Fiscal 2021 Second-Quarter Results
January 6, 2021
Page 4 of 7
ago. IBT was up 66.9% to $408.3 million compared to $244.6 million reported in the fiscal 2020 first half.
EBIT was $429.1 million, an increase of 50.5% versus the $285.1 million reported last year.
The fiscal 2021 first half included restructuring and other charges of $37.4 million, as well as the
$2.0 million charge for the resolution of the legacy SEC investigation. The same period during fiscal 2020
included the impact of charges of $61.2 million primarily for restructuring and acquisitions. Excluding these
charges, RPM’s first-half adjusted EBIT was up 35.3% to $468.5 million compared to adjusted EBIT of
$346.2 million during the year-ago period. Investments resulted in a net pre-tax gain of $18.1 million for
the first half of fiscal 2021 and $8.7 million during the same period last year. Excluding the restructuring
and other charges, as well as investment gains and losses, adjusted diluted EPS increased 46.2% to $2.50
compared to $1.71 in fiscal 2020.
First-Half Segment Sales and Earnings
Fiscal 2021 first-half sales in the Construction Products Group were up 1.5% to $1.05 billion from
$1.04 billion in the fiscal 2020 first half. Organic sales increased 2.4% and were somewhat offset by foreign
currency translation headwinds of 0.9%. IBT for the segment was $170.2 million compared to $139.8
million in fiscal 2020. EBIT of $174.4 million was up 21.2% compared to $143.9 million in the first half
last year. The segment incurred restructuring and other expenses of $6.4 million during the first half of
fiscal 2021 and restructuring and acquisitions costs of $4.9 million during the same period of fiscal 2020.
Excluding these charges, Construction Products Group adjusted EBIT increased 21.5% to $180.8 million
from adjusted EBIT of $148.8 million a year ago.
Performance Coatings Group first-half sales for fiscal 2021 were $518.6 million, a decrease of 12.1% from
$590.0 million in the fiscal 2020 first half. Organic sales declined 12.2%, while foreign currency translation
reduced sales by 0.1%. Acquisition growth added 0.2%. Segment IBT was $52.6 million versus the $61.4
million reported in fiscal 2020. EBIT decreased 14.5% to $52.6 million compared to $61.5 million in the
first half last year. The segment reported restructuring-related charges of $6.3 million during the fiscal 2021
first half and restructuring and acquisition charges of $12.4 million for the same period of fiscal 2020.
Performance Coatings Group adjusted EBIT, which excludes these charges, was $58.9 million, a decrease
of 20.3% from adjusted EBIT of $73.9 million a year ago.
First-half sales for the Consumer Group grew 27.8% to $1.19 billion from $930.2 million a year ago.
Organic sales growth was 24.9%, acquisitions added 2.8%, while foreign currency translation increased
sales by 0.1%. The Consumer Group reported IBT of $221.1 million versus $93.6 million during the prior-
year first half. EBIT of $221.2 million for the first six months of fiscal 2021 increased 135.9% compared
to $93.8 million in the prior-year period. The segment incurred restructuring and acquisition expenses of
$6.2 million during the first half of fiscal 2021 and restructuring-related charges of $22.6 million during the
first six months of fiscal 2020. Excluding these charges, fiscal 2021 first-half Consumer Group adjusted
EBIT was up 95.4% to $227.4 million from adjusted EBIT of $116.4 million in the year-ago period.
Specialty Products Group sales were $334.1 million, an increase of 5.0% compared to $318.3 million in the
2020 first half. Acquisitions contributed 4.0%, foreign currency translation increased sales by 0.6% and
organic sales added 0.4%. IBT for the segment was $48.9 million compared to $42.1 million in fiscal 2020.
For the first half of fiscal 2021, segment EBIT was $49.0 million, an increase of 16.5% compared to $42.1
million a year ago. The segment reported restructuring-related charges of $4.7 million for the first six
RPM Reports Fiscal 2021 Second-Quarter Results
January 6, 2021
Page 5 of 7
months of fiscal 2021 and $9.7 million for the same period of fiscal 2020. Specialty Products Group adjusted
EBIT, which excludes these charges, was $53.7 million, an increase of 3.6% versus adjusted EBIT of $51.8
million during the first six months of fiscal 2020.
Record Cash Flow and Financial Position
For the first half of fiscal 2021, cash from operations grew by 93.1% to a record $579.5 million compared
to $300.2 million a year ago. This increase of $279.3 million was due to initiatives to improve working
capital metrics and profit margins. Capital expenditures of $70.9 million compared to $71.4 million during
the first half of last year. Total debt at November 30, 2020 was $2.30 billion, compared to $2.52 billion at
November 30, 2019 and $2.54 billion at May 31, 2020. At November 30, 2020, total liquidity was
$1.56 billion and included cash of $272.9 million and $1.29 billion in committed available credit. “Our
balance sheet is stronger than it has ever been. We have been strategic in managing our record cash flow,
using it to pay down debt, make acquisitions and increase our cash reserves,” stated Sullivan.
Business Outlook
“Looking ahead to the fiscal 2021 third quarter, we anticipate consolidated sales to grow in the mid-single-
digit range with strong leverage to the bottom line for adjusted EBIT growth of 30% or more. Our third
quarter typically provides modest sales activity each year because it falls during the winter months when
painting and construction activity slow. This seasonal reduction of activity will benefit our Consumer
Segment by allowing it to replenish retail inventories after working to meet the unprecedented demand over
the last six months,” stated Sullivan.
“On a segment basis, we expect fiscal 2021 third-quarter sales to be flat to negative in the Construction
Products Group as it focuses on building restoration, renovation and innovation to outperform its peers in
a challenging construction market. We anticipate that negative sales growth will continue in the
Performance Coatings Group, which serves our most challenged end markets. The Consumer Group is
expected to continue its double-digit sales growth and will benefit on both the top and bottom line from the
recent acquisition of Ali Industries, which is performing better than projected. We anticipate positive sales
growth from the Specialty Products Group to continue into the third quarter, driven by new management,
improved business development initiatives and a recovering OEM customer base,” stated Sullivan. “Sales
in all four segments should be up in the fiscal 2021 fourth quarter due to an easier comparison to last year’s
fourth quarter, which is when the economic interruption caused by the pandemic was most severe.”
“Our MAP to Growth program continues to have tremendous momentum. As previously announced, the
disruption caused by the outbreak of Covid-19 has delayed the finalization of MAP to Growth past the
original target completion date of December 31, 2020. We expect that we will reach the planned run rate of
$290 million in annualized savings by the conclusion of our fiscal year ending May 31, 2021,” stated
Sullivan. “That said, through our culture of continuous improvement, we continue to add to our robust
pipeline of cost saving initiatives and operational improvements that will carry into fiscal 2022 and beyond
after the formal MAP to Growth program has ended.”
RPM Reports Fiscal 2021 Second-Quarter Results
January 6, 2021
Page 6 of 7
Webcast and Conference Call Information
Management will host a conference call to discuss these results beginning at 10:00 a.m. EST today. The
call can be accessed by dialing 833-323-0996 or 236-712-2462 for international callers. Participants are
asked to call the assigned number approximately 10 minutes before the conference call begins. The call,
which will last approximately one hour, will be open to the public, but only financial analysts will be
permitted to ask questions. The media and all other participants will be in a listen-only mode.
For those unable to listen to the live call, a replay will be available from approximately 1:00 p.m. EST on
January 6, 2021 until 11:59 p.m. EST on January 13, 2021. The replay can be accessed by dialing 800-585-
8367 or 416-621-4642 for international callers. The access code is 4878187. The call also will be available
both live and for replay, and as a written transcript, via the RPM website at www.RPMinc.com.
About RPM
RPM International Inc. owns subsidiaries that are world leaders in specialty coatings, sealants, building
materials and related services. The company operates across four reportable segments: Consumer Group,
Construction Products Group, Performance Coatings Group and Specialty Products Group. RPM has a
diverse portfolio with hundreds of market-leading brands, including Rust-Oleum, DAP, Zinsser, Varathane,
Day-Glo, Legend Brands, Stonhard, Carboline, Tremco and Dryvit. From homes and workplaces, to
infrastructure and precious landmarks, RPM’s brands are trusted by consumers and professionals alike to
help build a better world. The company employs approximately 14,600 individuals worldwide. Visit
www.rpminc.com to learn more.
For more information, contact Russell L. Gordon, vice president and chief financial officer, at 330-273-
5090 or [email protected].
# # #
Use of Non-GAAP Financial Information
To supplement the financial information presented in accordance with Generally Accepted Accounting Principles in the United
States (“GAAP”) in this earnings release, we use EBIT, adjusted EBIT and adjusted earnings per share, which are all non-GAAP
financial measures. EBIT is defined as earnings (loss) before interest and taxes, with adjusted EBIT and adjusted earnings per
share provided for the purpose of adjusting for one-off items impacting revenues and/or expenses that are not considered by
management to be indicative of ongoing operations. We evaluate the profit performance of our segments based on income before
income taxes, but also look to EBIT as a performance evaluation measure because interest expense is essentially related to
acquisitions, as opposed to segment operations. For that reason, we believe EBIT is also useful to investors as a metric in their
investment decisions. EBIT should not be considered an alternative to, or more meaningful than, income before income taxes as
determined in accordance with GAAP, since EBIT omits the impact of interest and investment income or expense in determining
operating performance, which represent items necessary to our continued operations, given our level of indebtedness.
Nonetheless, EBIT is a key measure expected by and useful to our fixed income investors, rating agencies and the banking
community all of whom believe, and we concur, that this measure is critical to the capital markets' analysis of our segments' core
operating performance. We also evaluate EBIT because it is clear that movements in EBIT impact our ability to attract financing.
Our underwriters and bankers consistently require inclusion of this measure in offering memoranda in conjunction with any debt
underwriting or bank financing. EBIT may not be indicative of our historical operating results, nor is it meant to be predictive of
potential future results. See the financial statement section of this earnings release for a reconciliation of EBIT and adjusted EBIT
to income before income taxes, and adjusted earnings per share to earnings per share. We have not provided a reconciliation of
our third-quarter fiscal 2021 adjusted EBIT because material terms that impact such measures are not in our control and/or cannot
be reasonably predicted, and therefore a reconciliation of such measures is not available without unreasonable effort.
RPM Reports Fiscal 2021 Second-Quarter Results
January 6, 2021
Page 7 of 7
Forward-Looking Statements
This press release contains “forward-looking statements” relating to our business. These forward-looking statements, or other
statements made by us, are made based on our expectations and beliefs concerning future events impacting us and are subject to
uncertainties and factors (including those specified below), which are difficult to predict and, in many instances, are beyond our
control. As a result, our actual results could differ materially from those expressed in or implied by any such forward-looking
statements. These uncertainties and factors include (a) global markets and general economic conditions, including uncertainties
surrounding the volatility in financial markets, the availability of capital and the effect of changes in interest rates, and the
viability of banks and other financial institutions; (b) the prices, supply and capacity of raw materials, including assorted
pigments, resins, solvents, and other natural gas- and oil-based materials; packaging, including plastic and metal containers; and
transportation services, including fuel surcharges; (c) continued growth in demand for our products; (d) legal, environmental and
litigation risks inherent in our construction and chemicals businesses and risks related to the adequacy of our insurance coverage
for such matters; (e) the effect of changes in interest rates; (f) the effect of fluctuations in currency exchange rates upon our
foreign operations; (g) the effect of non-currency risks of investing in and conducting operations in foreign countries, including
those relating to domestic and international political, social, economic and regulatory factors; (h) risks and uncertainties
associated with our ongoing acquisition and divestiture activities; (i) the timing of and the realization of anticipated cost savings
from restructuring initiatives and the ability to identify additional cost savings opportunities; (j) risks related to the adequacy of
our contingent liability reserves; (k) risks relating to the recent outbreak of the coronavirus (Covid-19); and (l) other risks detailed
in our filings with the Securities and Exchange Commission, including the risk factors set forth in our Annual Report on Form
10-K for the year ended May 31, 2020, as the same may be updated from time to time. We do not undertake any obligation to
publicly update or revise any forward-looking statements to reflect future events, information or circumstances that arise after
the date of this release.
CONSOLIDATED STATEMENTS OF INCOMEIN THOUSANDS, EXCEPT PER SHARE DATA(Unaudited)
November 30, November 30, November 30, November 30, 2020 2019 2020 2019
Net Sales 1,485,915$ 1,401,292$ 3,092,586$ 2,874,056$ Cost of Sales 899,743 871,894 1,852,759 1,769,904Gross Profit 586,172 529,398 1,239,827 1,104,152Selling, General & Administrative Expenses 399,418 403,357 795,370 803,923Restructuring Charges 4,918 4,801 9,151 11,423Interest Expense 21,266 26,341 43,011 54,658Investment (Income), Net (9,519) (8,805) (22,281) (14,190)Other Expense, Net 3,133 1,951 6,251 3,736Income Before Income Taxes 166,956 101,753 408,325 244,602Provision for Income Taxes 39,072 24,431 99,655 60,784Net Income 127,884 77,322 308,670 183,818Less: Net Income Attributable to Noncontrolling Interests 225 292 416 600
127,659$ 77,030$ 308,254$ 183,218$
Earnings per share of common stock attributable toRPM International Inc. Stockholders:
Basic 0.98$ 0.60$ 2.38$ 1.42$
Diluted 0.98$ 0.59$ 2.37$ 1.41$
Average shares of common stock outstanding - basic 128,500 128,393 128,459 128,639
Average shares of common stock outstanding - diluted 129,090 129,079 129,078 129,294
Three Months Ended
Net Income Attributable to RPM International Inc.
Six Months Ended
SUPPLEMENTAL SEGMENT INFORMATIONIN THOUSANDS(Unaudited)
November 30, November 30, November 30, November 30,
2020 2019 2020 2019Net Sales: CPG Segment 503,520$ 499,510$ 1,051,210$ 1,035,615$ PCG Segment 258,833 292,712 518,622 589,953 Consumer Segment 547,508 450,900 1,188,676 930,230 SPG Segment 176,054 158,170 334,078 318,258 Total 1,485,915$ 1,401,292$ 3,092,586$ 2,874,056$
Income Before Income Taxes:CPG Segment
Income Before Income Taxes (a) 71,832$ 57,123$ 170,182$ 139,803$ Interest (Expense), Net (b) (2,141) (2,074) (4,251) (4,101) EBIT (c) 73,973 59,197 174,433 143,904
MAP to Growth related initiatives (d) 4,794 2,674 6,659 4,326 Acquisition-related costs (e) - - - 548 Adjustment to Exit Flowcrete China (g) (305) - (305) -
Adjusted EBIT 78,462$ 61,871$ 180,787$ 148,778$
PCG Segment Income Before Income Taxes (a) 24,047$ 33,320$ 52,561$ 61,377$ Interest Income (Expense), Net (b) 9 25 (22) (104) EBIT (c) 24,038 33,295 52,583 61,481
MAP to Growth related initiatives (d) 3,999 3,676 6,325 12,413 Acquisition-related costs (e) - 35 - 35
Adjusted EBIT 28,037$ 37,006$ 58,908$ 73,929$
Consumer Segment Income Before Income Taxes (a) 88,368$ 34,456$ 221,089$ 93,614$ Interest (Expense), Net (b) (64) (56) (127) (161) EBIT (c) 88,432 34,512 221,216 93,775
MAP to Growth related initiatives (d) 1,055 20,172 4,999 22,605 Acquisition-related costs (e) 1,178 - 1,178 -
Adjusted EBIT 90,665$ 54,684$ 227,393$ 116,380$
SPG Segment Income Before Income Taxes (a) 28,406$ 18,762$ 48,855$ 42,089$ Interest Income (Expense), Net (b) (73) (7) (155) 19 EBIT (c) 28,479 18,769 49,010 42,070
MAP to Growth related initiatives (d) 1,140 4,418 4,683 9,746 Adjusted EBIT 29,619$ 23,187$ 53,693$ 51,816$
Corporate/Other (Loss) Before Income Taxes (a) (45,697)$ (41,908)$ (84,362)$ (92,281)$ Interest (Expense), Net (b) (9,478) (15,424) (16,175) (36,121) EBIT (c) (36,219) (26,484) (68,187) (56,160)
MAP to Growth related initiatives (d) 6,641 3,393 13,809 11,499 Unusual executive costs, net of insurance proceeds (f) 49 - 56 - Settlement for SEC Investigation & Enforcement Action (h) 2,000 - 2,000 -
Adjusted EBIT (27,529)$ (23,091)$ (52,322)$ (44,661)$
Consolidated
Income Before Income Taxes (a) 166,956$ 101,753$ 408,325$ 244,602$
Interest (Expense) (21,266) (26,341) (43,011) (54,658)
Investment Income, Net 9,519 8,805 22,281 14,190
EBIT (c) 178,703 119,289 429,055 285,070
MAP to Growth related initiatives (d) 17,629 34,333 36,475 60,589
Acquisition-related costs (e) 1,178 35 1,178 583
Unusual executive costs, net of insurance proceeds (f) 49 - 56 -
Adjustment to Exit Flowcrete China (g) (305) - (305) - Settlement for SEC Investigation & Enforcement Action (h) 2,000 - 2,000 -
Adjusted EBIT 199,254$ 153,657$ 468,459$ 346,242$
(a)
(b)
(c)
(d)
(e)
(f)
(g)
(h) On December 22, 2020, the Court entered its Final Judgment resolving the legacy "SEC Investigation & Enforcement Action." We agreed to pay a civil monetary penalty of $2.0 million under Section 21(d)(3) of the Exchange Act. The settlement amount has been accrued for in our consolidated financial statements as of the period ending November 30, 2020.
Six Months Ended
The presentation includes a reconciliation of Income (Loss) Before Income Taxes, a measure defined by Generally Accepted Accounting Principles in the United States (GAAP), to EBIT and Adjusted EBIT.
Interest Income (Expense), Net includes the combination of Interest Income (Expense) and Investment Income (Expense), Net.
Three Months Ended
In FY18, we added back a charge to exit our Flowcrete China business. Included in that charge from FY18 was an accrual for a contingent liability. During Q2 2021, the contingent liability was resolved, and a favorable adjustment of ~ $0.3 million was recognized.
Reflects unusual compensation costs, net of insurance proceeds, recorded unrelated to our MAP to Growth initiative, including stock and deferred compensation plan arrangements.
Reflects restructuring and other charges, all of which have been incurred in relation to our Margin Acceleration Plan initiatives, as follows.
During fiscal 2021: Product line and SKU rationalization at our Consumer Segment and accelerated expense related to the shortened useful lives of facilities and equipment that is currently in use but that is in the process of being retired associated with facility closures, offset somewhat by the reversal of prior period product line and SKU rationalization inventory charges due to the sale of immaterial amounts of previously reserved inventory at our Consumer Segment, all of which have been recorded in Cost of Goods Sold; headcount reductions, closures of facilities and related costs, all of which have been recorded in Restructuring Expense; Professional fees incurred in connection with our MAP to Growth, early retirements of key executives within the Consumer Group, headcount reductions, implementation costs associated with our ERP consolidation plan, accelerated expense related to the shortened useful lives of facilities and equipment that is currently in use but that is in the process of being retired associated with facility closures, immaterial reversal of a prior period charge associated with the divestiture of a business in our PCG segment, an immaterial charge to writeoff the remaining cumulative translation adjustment associated with a prior period divestiture in our CPG segment, immaterial reversal of a prior period charge to our allowance for doubtful accounts as a result of a change in market and leadership strategy, all of which have been recorded in Selling, General & Administrative Expenses.
During fiscal 2020: Costs associated with exiting unprofitable product lines, inventory-related charges that reflect product line and SKU rationalization at our Consumer Segment, as well as inventory write-offs in connection with restructuring activities at our Construction Products and Performance Coatings Segments, all of which have been recorded in Cost of Goods Sold; headcount reductions, closures of facilities and related costs, all of which have been recorded in Restructuring Expense; increases in our allowance for doubtful accounts deemed uncollectible as a result of a change in market and leadership strategy, and implementation costs associated with our ERP consolidation plan, professional fees incurred in connection with our MAP to Growth, the net gain incurred for the divestiture of assets and unprofitable businesses, all of which have been recorded in Selling, General & Administrative Expenses.
Acquisition costs reflect amounts included in gross profit for inventory disposals and step-ups related to recent acquisitions.
EBIT is defined as earnings (loss) before interest and taxes, with Adjusted EBIT provided for the purpose of adjusting for items impacting earnings that are not considered by management to be indicative of ongoing operations. We evaluate the profit performance of our segments based on income before income taxes, but also look to EBIT, or adjusted EBIT, as a performance evaluation measure because interest expense is essentially related to acquisitions, as opposed to segment operations. For that reason, we believe EBIT is also useful to investors as a metric in their investment decisions. EBIT should not be considered an alternative to, or more meaningful than, income before income taxes as determined in accordance with GAAP, since EBIT omits the impact of interest and investment income or expense in determining operating performance, which represent items necessary to our continued operations, given our level of indebtedness. Nonetheless, EBIT is a key measure expected by and useful to our fixed income investors, rating agencies and the banking community all of whom believe, and we concur, that this measure is critical to the capital markets' analysis of our segments' core operating performance. We also evaluate EBIT because it is clear that movements in EBIT impact our ability to attract financing. Our underwriters and bankers consistently require inclusion of this measure in offering memoranda in conjunction with any debt underwriting or bank financing. EBIT may not be indicative of our historical operating results, nor is it meant to be predictive of potential future results.
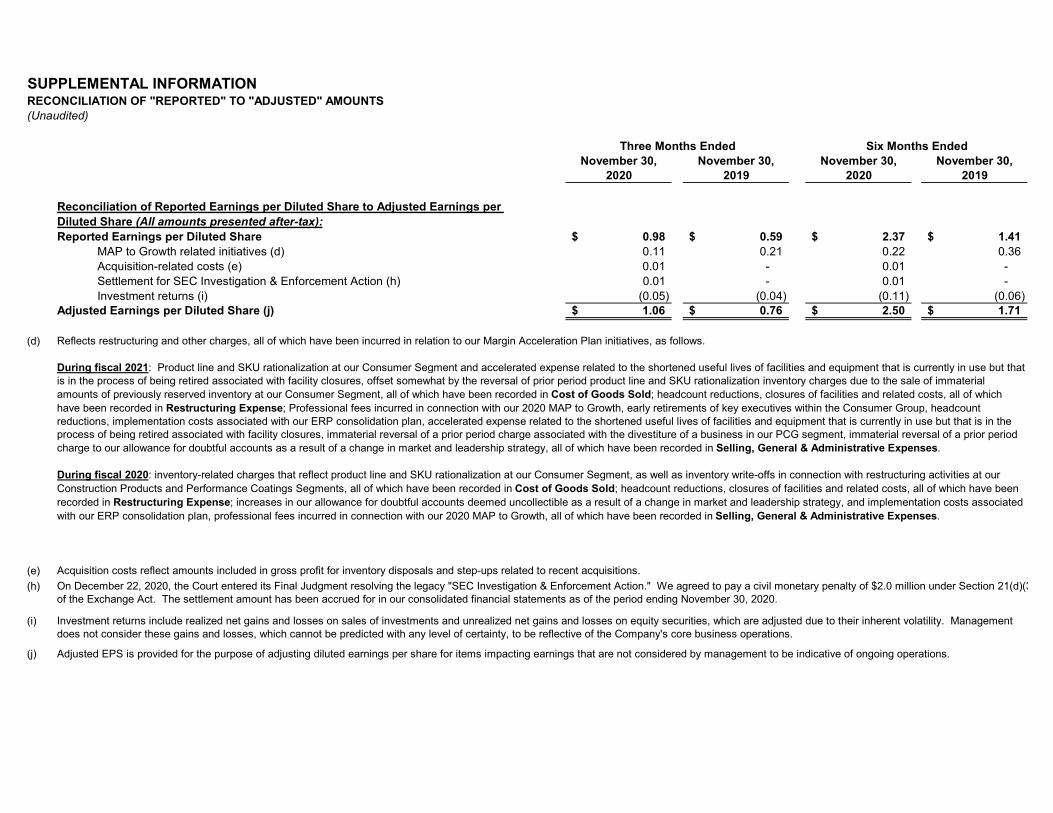
SUPPLEMENTAL INFORMATIONRECONCILIATION OF "REPORTED" TO "ADJUSTED" AMOUNTS(Unaudited)
November 30, November 30, November 30, November 30,
2020 2019 2020 2019
Reconciliation of Reported Earnings per Diluted Share to Adjusted Earnings per Diluted Share (All amounts presented after-tax):Reported Earnings per Diluted Share 0.98$ 0.59$ 2.37$ 1.41$
MAP to Growth related initiatives (d) 0.11 0.21 0.22 0.36 Acquisition-related costs (e) 0.01 - 0.01 - Settlement for SEC Investigation & Enforcement Action (h) 0.01 - 0.01 - Investment returns (i) (0.05) (0.04) (0.11) (0.06)
Adjusted Earnings per Diluted Share (j) 1.06$ 0.76$ 2.50$ 1.71$
(d)
(e)
(h)
(i)
(j)
Reflects restructuring and other charges, all of which have been incurred in relation to our Margin Acceleration Plan initiatives, as follows.
During fiscal 2021: Product line and SKU rationalization at our Consumer Segment and accelerated expense related to the shortened useful lives of facilities and equipment that is currently in use but that is in the process of being retired associated with facility closures, offset somewhat by the reversal of prior period product line and SKU rationalization inventory charges due to the sale of immaterial amounts of previously reserved inventory at our Consumer Segment, all of which have been recorded in Cost of Goods Sold; headcount reductions, closures of facilities and related costs, all of which have been recorded in Restructuring Expense; Professional fees incurred in connection with our 2020 MAP to Growth, early retirements of key executives within the Consumer Group, headcount reductions, implementation costs associated with our ERP consolidation plan, accelerated expense related to the shortened useful lives of facilities and equipment that is currently in use but that is in the process of being retired associated with facility closures, immaterial reversal of a prior period charge associated with the divestiture of a business in our PCG segment, immaterial reversal of a prior period charge to our allowance for doubtful accounts as a result of a change in market and leadership strategy, all of which have been recorded in Selling, General & Administrative Expenses.
During fiscal 2020: inventory-related charges that reflect product line and SKU rationalization at our Consumer Segment, as well as inventory write-offs in connection with restructuring activities at our Construction Products and Performance Coatings Segments, all of which have been recorded in Cost of Goods Sold; headcount reductions, closures of facilities and related costs, all of which have been recorded in Restructuring Expense; increases in our allowance for doubtful accounts deemed uncollectible as a result of a change in market and leadership strategy, and implementation costs associated with our ERP consolidation plan, professional fees incurred in connection with our 2020 MAP to Growth, all of which have been recorded in Selling, General & Administrative Expenses.
Investment returns include realized net gains and losses on sales of investments and unrealized net gains and losses on equity securities, which are adjusted due to their inherent volatility. Management does not consider these gains and losses, which cannot be predicted with any level of certainty, to be reflective of the Company's core business operations.
Adjusted EPS is provided for the purpose of adjusting diluted earnings per share for items impacting earnings that are not considered by management to be indicative of ongoing operations.
Six Months Ended
Acquisition costs reflect amounts included in gross profit for inventory disposals and step-ups related to recent acquisitions.
Three Months Ended
On December 22, 2020, the Court entered its Final Judgment resolving the legacy "SEC Investigation & Enforcement Action." We agreed to pay a civil monetary penalty of $2.0 million under Section 21(d)(3) of the Exchange Act. The settlement amount has been accrued for in our consolidated financial statements as of the period ending November 30, 2020.
CONSOLIDATED BALANCE SHEETSIN THOUSANDS
(Unaudited)
November 30, 2020 November 30, 2019 May 31, 2020
Assets
Current Assets
Cash and cash equivalents 272,945$ 208,173$ 233,416$
Trade accounts receivable 1,135,383$ 1,107,637 1,193,804
Allowance for doubtful accounts (53,542) (59,824) (55,847)
Net trade accounts receivable 1,081,841 1,047,813 1,137,957
Inventories 829,617 883,722 810,448
Prepaid expenses and other current assets 268,029 220,557 241,608
Total current assets 2,452,432 2,360,265 2,423,429
Property, Plant and Equipment, at Cost 1,851,794 1,712,511 1,755,190
Allowance for depreciation (962,395) (890,736) (905,504)
Property, plant and equipment, net 889,399 821,775 849,686
Other Assets
Goodwill 1,300,777 1,259,556 1,250,066
Other intangible assets, net of amortization 620,399 595,311 584,380
Operating lease right-of-use assets 297,695 284,852 284,491
Deferred income taxes, non-current 37,154 34,719 30,894
Other 192,352 224,520 208,008
Total other assets 2,448,377 2,398,958 2,357,839
Total Assets 5,790,208$ 5,580,998$ 5,630,954$
Liabilities and Stockholders' EquityCurrent Liabilities
Accounts payable 540,678$ 475,288$ 535,311$
Current portion of long-term debt 75,709 102,136 80,890
Accrued compensation and benefits 161,515 139,403 185,531
Accrued losses 23,717 21,646 20,021
Other accrued liabilities 331,074 245,595 271,827
Total current liabilities 1,132,693 984,068 1,093,580
Long-Term Liabilities
Long-term debt, less current maturities 2,224,627 2,421,339 2,458,290
Operating lease liabilities 256,045 243,863 244,691
Other long-term liabilities 560,749 415,838 510,175
Deferred income taxes 65,651 112,590 59,555
Total long-term liabilities 3,107,072 3,193,630 3,272,711
Total liabilities 4,239,765 4,177,698 4,366,291
Stockholders' Equity
Preferred stock; none issued - - -
Common stock (outstanding 130,106; 129,767; 129,511) 1,301 1,298 1,295
Paid-in capital 1,035,539 1,007,554 1,014,428
Treasury stock, at cost (595,851) (547,683) (580,117)
Accumulated other comprehensive (loss) (649,819) (576,707) (717,497)
Retained earnings 1,756,571 1,516,230 1,544,336
Total RPM International Inc. stockholders' equity 1,547,741 1,400,692 1,262,445
Noncontrolling interest 2,702 2,608 2,218
Total equity 1,550,443 1,403,300 1,264,663
Total Liabilities and Stockholders' Equity 5,790,208$ 5,580,998$ 5,630,954$
CONSOLIDATED STATEMENTS OF CASH FLOWSIN THOUSANDS
(Unaudited)
2020 2019
Cash Flows From Operating Activities:
Net income 308,670$ 183,818$
Adjustments to reconcile net income to net
cash provided by (used for) operating activities:
Depreciation and amortization 72,506 77,572
Restructuring charges, net of payments (2,291) (1,713)
Fair value adjustments to contingent earnout obligations 2,712 -
Deferred income taxes 1,786 (5,426)
Stock-based compensation expense 21,118 13,034
Net (gain) on marketable securities (20,172) (8,741)
Other (194) (705)
Changes in assets and liabilities, net of effect
from purchases and sales of businesses:
Decrease in receivables 91,027 183,782
Decrease (increase) in inventory 21,655 (41,129)
Decrease in prepaid expenses and other 8,782 8,524
current and long-term assets
Increase (Decrease) in accounts payable 8,331 (70,712)
(Decrease) in accrued compensation and benefits (28,919) (53,589)
Increase in accrued losses 3,377 1,894
Increase in other accrued liabilities 89,020 13,644
Other 2,095 (90)
Cash Provided By Operating Activities 579,503 300,163
Cash Flows From Investing Activities:
Capital expenditures (70,943) (71,393)
Acquisition of businesses, net of cash acquired (113,618) (36,281)
Purchase of marketable securities (23,292) (14,332)
Proceeds from sales of marketable securities 21,189 13,100
Other 703 2,183
Cash (Used For) Investing Activities (185,961) (106,723)
Cash Flows From Financing Activities:
Additions to long-term and short-term debt 15 539,277
Reductions of long-term and short-term debt (256,096) (542,744)
Cash dividends (96,019) (92,040)
Repurchases of common stock - (100,000)
Shares of common stock returned for taxes (15,729) (10,155)
Payments of acquisition-related contingent consideration (2,218) (187)
Other - (664)
Cash (Used For) Financing Activities (370,047) (206,513)
16,034 (1,922)
39,529 (14,995)
233,416 223,168
272,945$ 208,173$
Cash and Cash Equivalents at Beginning of Period
Cash and Cash Equivalents at End of Period
Six Months EndedNovember 30,
Effect of Exchange Rate Changes on Cash and
Cash Equivalents
Net Change in Cash and Cash Equivalents