Embed Size (px)
Citation preview

APPENDIX III
Boulder Mining Corporation West Lake Abitibi Property, Ontario
Boulder Mining Corporation West Lake Abitibi Property, Ontario
Reverse Circulation Overburden Drillingand Heavy Mineral Geochemical Sampling
for Gold and Kimberlite
byStuart A. Averill and Donald R. S. HolmesOverburden Drilling Management Limited
Nepean, Ontario, CanadaJune 05, 2002
42A16NE2003 2.24342 GALNA 010

TABLE OF CONTENTS
Page
1. SUMMARY l2. INTRODUCTION 22.1 Property Location, Access and Ownership 22.2 Project Background and Objectives 23. METHODS AND COSTS 93.1 Contractors 93.2 Field Procedures 93.3 Sample Processing and Indicator Mineral Logging Procedures 103.4 Analytical Procedures 183.5 Drill Performance and Project Costs 184. RESULTS 204.1 Bedrock Geology and Geochemistry 204.2 Overburden Stratigraphy 274.3 Gold Grain Counts 274.4 Kimberlite Indicator Mineral Counts 334.5 Mineralogy and Geochemistry of the Heavy Mineral Fraction of the Till 335. CONCLUSIONS AND RECOMMENDATIONS 386. CERTIFICATE 397. REFERENCES 41
FIGURES
Figure l Location of the West Lake Abitibi Project relative to the Superior Province andAbitibi Subprovince of the Canadian Shield 3
Figure 2 Property size and relationship to historical exploration activity in the LakeAbitibi area 4
Figure 3 Geological compilation of the Lake Abitibi - Lake Timiskaming region showing the major, E-W trending, gold-bearing deformation zones, the NW-SE trending faults of the Lake Timiskaming Structural Zone and the main kimberlite pipes associated with this structural zone 5
Figure 4 Airborne magnetic/electromagnetic map of the main claim block showing thelocations of the reverse circulation drill holes 7
Figure 5 Airborne magnetic/electromagnetic map of the northern satellite claims showing the locations of the reverse circulation drill holes on the two magnetic anomalies that were targeted as kimberlite pipes 8
Figure 6 Schematic diagram of a reverse circulation drilling system 12
Figure 7 Heavy mineral processing flow sheet for the till samples 13

TABLE OF CONTENTS (cont'd)
FIGURES (cont'd) Page
Figure 8 Backscatter electron images of gold grains from till illustrating the relationshipbetween grain wear and distance of glacial transport 17
Figure 9 Jensen cation plot for greywacke, siltstone and chert samples 23
Figure 10 Jensen cation plot for mafic volcanic, gabbro, pyroxenite and diabase samples 25
Figure 11 Reverse circulation drill section A-A' 28
Figure 12 Reverse circulation drill section B-B' 29
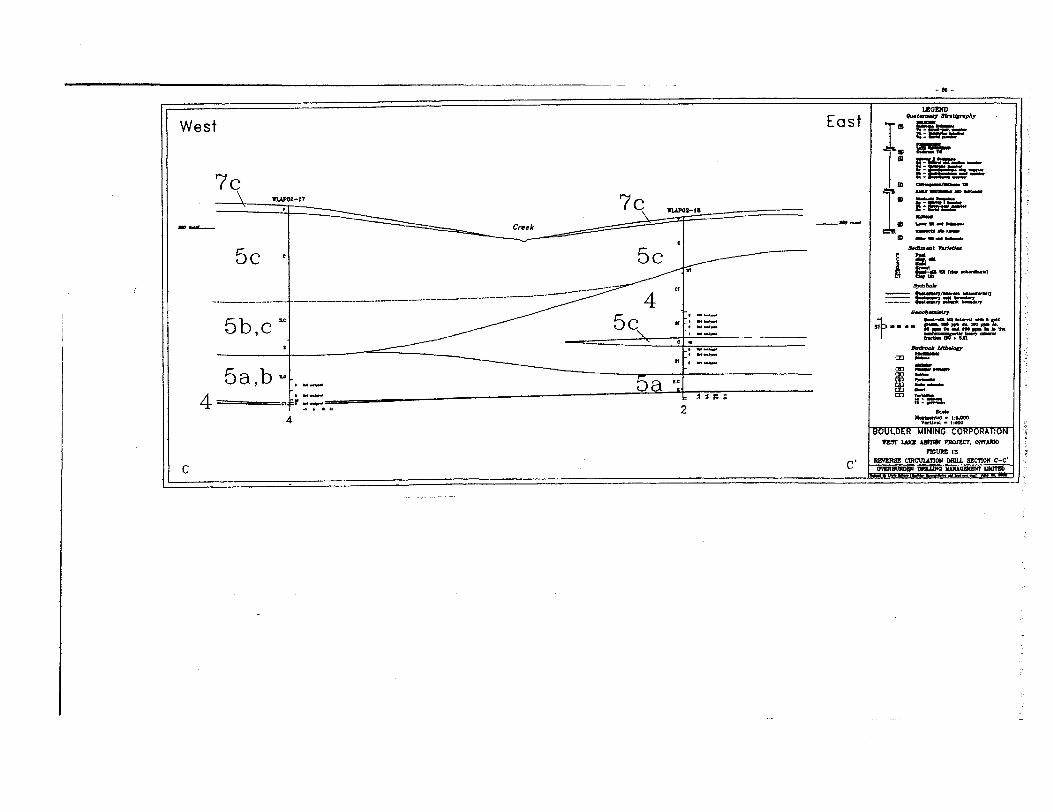
Figure 13 Reverse circulation drill section C-C' 30
TABLES
Table l Drill hole statistics 11
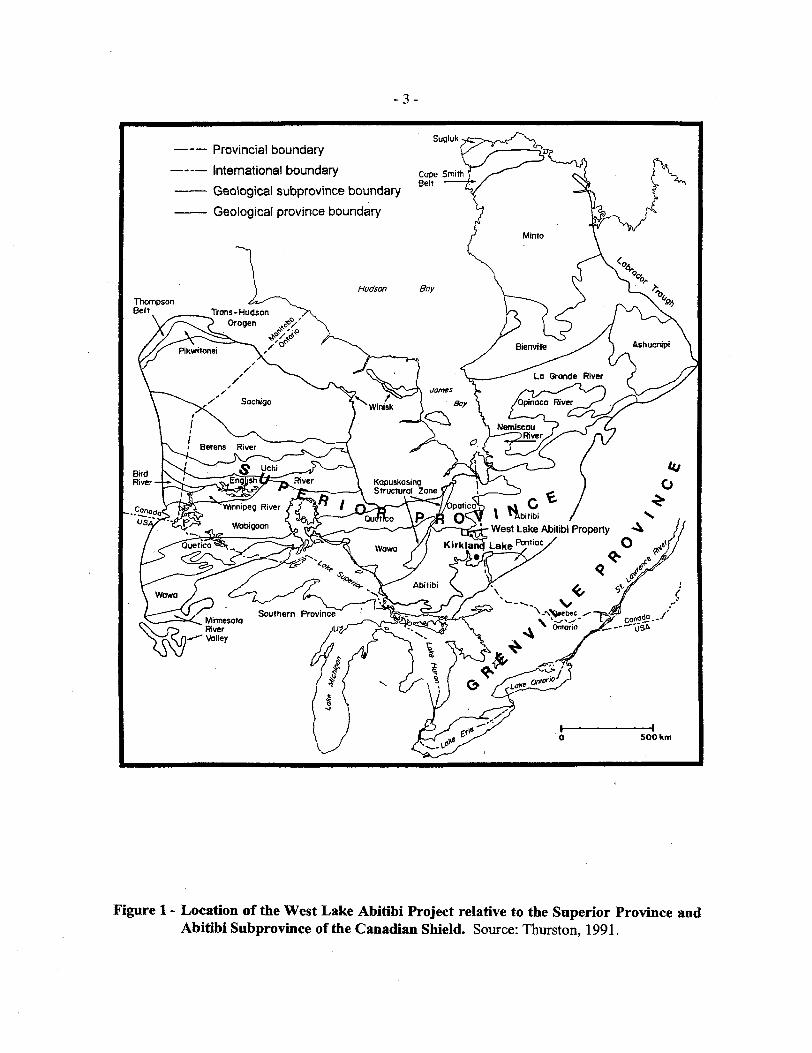
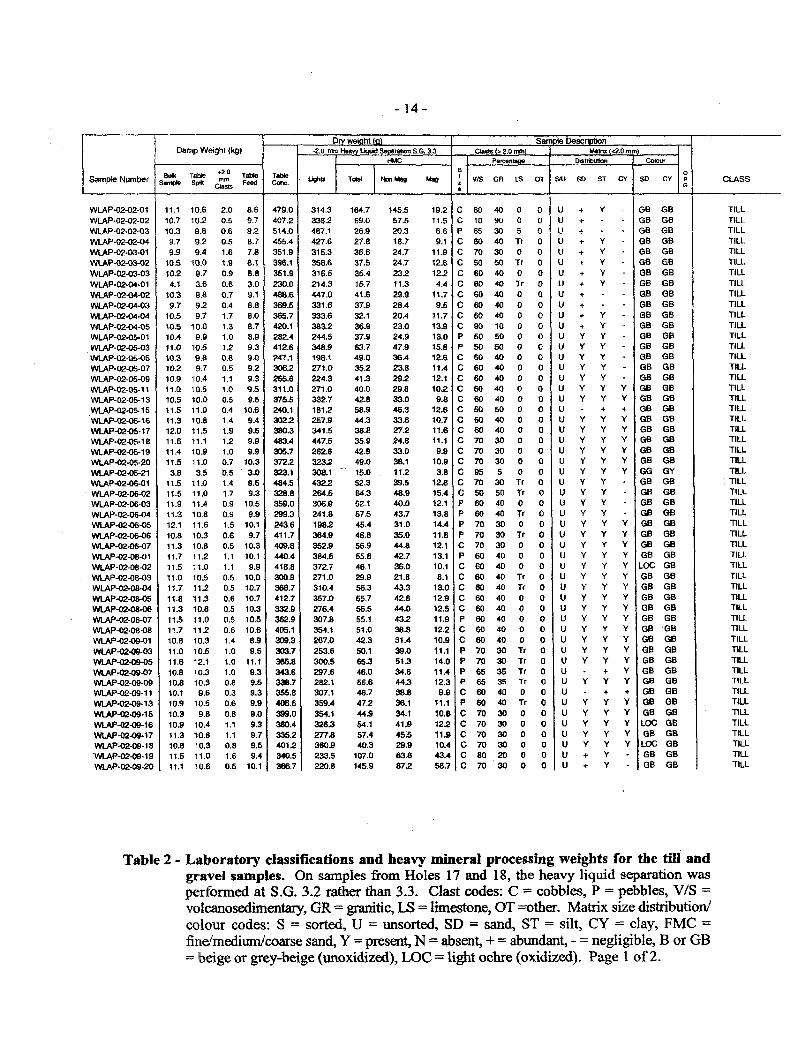
Table 2 Laboratory classifications and heavy mineral processing weights for the till andgravel samples 14,15
Table 3 Comparison of budgeted and actual project costs 19
Table 4 Whole rock and rare earth element analyses for the bedrock samples 22
Table 5 Geochemical analyses for the bedrock samples26
Table 6 Gold grain summary for the till and gravel samples with calculated visible goldassay values for the nonferromagnetic heavy mineral fraction 31,32
Table 7 Heavy mineral concentrate weights and KIM abundances for the medium (0.25- 0.5 mm), coarse (0.5-1.0 mm) and very coarse (l .0-2.0 mm) sand fractions of the till and gravel samples from the satellite claims 34
Table 8 Major nonferromagnetic heavy minerals present in the till and gravel samplesfrom the satellite claims 35
Table 9 Geochemical analyses for the -2.0 mm nonferromagnetic heavy mineral fractionof the till samples from the main claim block 36,37

TABLE OF CONTENTS (cont'd)
APPENDICES
Appendix A Reverse Circulation Drill Hole Logs
Appendix B Binocular Microscope Descriptions of the Bedrock Cuttings
Appendix C Till and Gravel Gold Grain Counts with Calculated Visible Gold Assays for the Nonferromagnetic Heavy Mineral Fraction
PLANS
Plan l Locations and Bedrock Geology of the Reverse Circulation Drill Holes Pocket

1. SUMMARY
This report describes a program of reverse circulation drilling that was conducted 80 km north of Kirkland Lake, Ontario, on the West Lake Abitibi Property which is held under option by Boulder Mining Corporation. Sixteen holes were drilled on the main claim block to test the inferred western extension of the thickly overburden-covered, E-W trending, gold-fertile Lake Abitibi Deformation Zone. The locations of the drill holes were based on the assumption that the deformation zone forms the
contact between northern turbidites of the Scapa Assemblage and southern komatiites of the Stoughton - Roquemaure Assemblage and that this contact lies 3 km further north than previously thought. Two additional holes were drilled on kimberlite-suggestive aeromagnetic bullseyes on a satellite claim block further to the north.
The drilling was intended to sample both the glacial till and underlying bedrock. Sixteen holes were completed successfully, and the average depth of these holes, including about 1.5 m of bedrock, was 43.5 m. Ninety-seven till samples and two gravel samples were processed to extract their heavy mineral fraction and visually separate any gold grains and, on the satellite claims, kimberlite indicator minerals. Most of the heavy mineral concentrates and all bedrock samples were also geochemically analyzed. The project was completed on budget with total drilling, geological and laboratory costs of S96,032.67 or S138.047metre.
The contact between the turbidites and komatiites was found to be in the anticipated northerly location but this contact is unsheared, unaltered and unmineralized. Magnetic pyroxenite and nonmagnetic cherry exhalites were intersected on the northerly magnetic anomalies that were targeted as kimberlite. The chert is anomalous in chalcopyrite which could indicate proximity to volcanogenic massive sulphides.
The buried bedrock surface is relatively flat. Consequently any old, unconsolidated sediments deposited by early glaciations were left unprotected during final S SE ice flow and were replaced by younger Matheson Till, esker gravel and varved Lake Ojibway clay, silt and sand. Ice meltdown in the glacial lake led to much interlayering of the till with the other sediments. The till is also molded into large drumlins which locally rise through the clay cover and impart a S SE grain to the surface topography. Its heavy mineral fraction contains only normal background levels of gold grains, reflecting the observed infertility of the underlying bedrock. The till on the satellite claims is devoid of kimberlite indicator minerals; therefore not only the two targeted magnetic bullseyes but also any others to the north are due to lithologies other than kimberlite.
The Lake Abitibi Deformation Zone, if present on the property, must be in the traditionally accepted position on the southern boundary where a formational conductor suggestive of structurally incompetent graphitic mudstone interrupts the magnetic komatiites. All diamond drill records from this area should
be scrutinized for evidence of the deformation zone and signs of gold mineralization before contemplating any further gold exploration. Several short, weak electromagnetic anomalies near the chalcopyrite-bearing exhalites on the satellite claims should be investigated as possible volcanogenic massive sulphide targets but no further kimberlite exploration is warranted.

-2-
2. INTRODUCTION
2.1 Property Location, Access and Ownership
The West Lake Abitibi Property, which was the focus of the reverse circulation drilling program
described in this report, is 80 km north of Kirkland Lake in northeastern Ontario (Fig. 1). Geologically,
it lies in the Abitibi Subprovince (Abitibi Granite-Greenstone Belt) of the Archean-age (~2700 Ma)
Superior Province of the Canadian Shield.
The property consists of one large, 3952 ha claim block and several small satellite blocks (Fig. 2). The
main block extends westward 13 km from Northwest Bay of Lake Abitibi, the largest remnant of glacial
Lake Ojibway. It straddles the boundary between Bowyer and Marathon Townships in the north and
Galna and Moody Townships in the south. The drilling focussed on this claim block and on the nearest
satellite block, 3 km to the north in eastern Marathon Township.
The nearest towns (Fig. 3) are Iroquois Falls, 30 km to the west, and Cochrane, 60 km to the northwest.
Road access is gained from Cochrane by travelling east 54 km on Route 652, then south 17.5 km on
Abitibi Consolidated's Single Lake logging road to the abandoned CN railway line and continuing 8 km
further south to Traill Lake in Moody Township (Plan l, in pocket).
The West Lake Abitibi Property was staked by C. J. Baker, an independent consulting geologist from
Ottawa with historical prospecting experience in the Lake Abitibi area. The property is optioned to
Boulder Mining Corporation ("Boulder") of Vancouver, B. C. Boulder funded the reverse circulation
drilling program.
2.2 Project Background and Objectives
The main claim block of the West Lake Abitibi Property is thought to host the western extension of the
regional-scale, east-west trending Lake Abitibi Deformation Zone (Fig. 2). This deformation zone is
considered attractive for gold exploration because: 1) most of the major gold deposits of the Abitibi
Subprovince are hosted by similar deformation zones, notably the Destor - Porcupine Fault Zone and
Cadillac - Larder Lake Break to the south (Fig. 3) and the Casa Berardi Fault to the northeast (Pattison
-3-
——— Provincial boundary—— International boundary——— Geological subprovince boundary——— Geological province boundary
SugluH .
West Lake Abitibi Property A
K irk laraT Lake P"."''00 S O
SOOkm
Figure l - Location of the West Lake Abitibi Project relative to the Superior Province and Abitibi Subprovince of the Canadian Shield. Source: Thurston, 1991.

Marathon Twp. Bowyer Twp.
Abitiibi Deformation ZcNorthwest
Bay
pitftl-Poitlt
oAbitibi O
QMoodv Twp.
Legend for gold in HMC (RG holes)
O 0-lg/t -- Fault lEsker
CH Non WALP claimsGold in Qtz Boulders
O Cold in Esker
Direction of Ice Flows Mun
Esker
Figure 2 - Property size and relationship to historical exploration activity in the Lake Abitibi area. Courtesy C. J. Baker (after Meyer 2001) 80316=1:2,000,000.

Figure 3 - CeoSogical compilation of the Lake Abitibi - Lake Timiskaming region showing the major, E-W trending, gold-bearing deformation zones, the NW-SE trending faults of the Lake Timiskaming Structural Zone and the main kimberlite pipes associated with this structural zone. Source: OGS Map 2543. 1991. Scale ---- 1:1,000.000.

-6-
et al,3 1986}^ 2) high-grade gold-quartz boulders have been identified along the Munro Esker in
Milligan Township south (glacially down-river) of the inferred fault (Ferguson and Freeman, 1978; Fig.
2), and 3) anomalous concentrations of gold grains have been identified by panning along both the
Munro and Long Point Eskers and the anomalies extend only as far north (glacially up-river) as
Northwest Bay where the deformation zone is located.
While the evidence for significant lode gold mineralization in or near the Lake Abitibi Deformation
Zone is compelling, the actual position of the fault in the area west of the lake is uncertain because the
bedrock surface is covered by glacial till and gravelly to clayey esker and Lake Ojibway sediments up to
80 m thick. Most maps, including the Ontario Geological Survey's 1992 compilation (Fig. 3), place the
fault in north-central Moody and Galna Townships, roughly coincident with the southern boundary of
the main claim block of the West Lake Abitibi Property. This position was first proposed by Pyke et al.
(1972) and follows a linear conductive zone (Fig. 4) interpreted to be the contact between northern
turbidites of the Scapa Assemblage and southern, komatiitic, mafic to ultramafic volcanics of the
Stoughton-Roquemaure Assemblage (Jackson and Fyon, 1992). On the basis of reprocessed
aeromagnetic data, however, Ayer et al. (1999) placed the fault contact 3 km further north in a non-
conductive zone near the centre of the main clam block. The reverse circulation drilling targeted this
inferred northern fault corridor.
The drilling on the satellite claims was targeted not on gold but rather on two small magnetic bullseyes
(Fig. 5) suggestive of serpentinized kimberlite pipes. The potential for kimberlite was considered high
because 1) the property lies on the northwestern extension of the Lake Timiskaming Structural Zone
(Sage, 1996) which hosts numerous kimberlite pipes in the Matheson, Kirkland Lake and New Liskeard
areas (Fig. 3), and 2) the pipes tend to be clustered at the intersections of this NW-SE trending structural
zone with the major E-W trending, gold-bearing deformation zones.
The reverse circulation drilling sampled both the till and the underlying bedrock. The till samples were
processed for gold grains and, on the satellite claims, for kimberlite indicator minerals. The bedrock
samples were used to map various geological relationships including stratigraphy, structure and
alteration as no outcrops are present on the property. This report documents the work performed and the
results obtained.

Figure 4 - Airborne magnetic/electromagnetic map of (he main claim block showing the locations of the reverse circulation drill holes. Source'OGS ]9S9a. Scale = l :-10.0()().

Figure 5 - Airborne magnetic/electromagnetk map of the northern satellite dairns showing the locations of the reverse circulation drill boles on the two magnetic anomalies that were targeted as kimberlite pipes. Source: OGS. 1989b. Scale - 1:20.000.

-9-
3. METHODS AND COSTS
3.1 Contractors
Overburden Drilling Management Limited ("ODM") of Nepean, Ontario chose the locations of the drill
holes and access roads, arranged the drilling contract, oversaw the drilling, logged the holes, processed
the till samples for heavy indicator minerals and interpreted the data. ODM's field geologist was Donald
Holmes. Remy Huneault supervised the sample processing, Stuart Averill logged the bedrock samples,
interpreted the data and prepared the report and Llyle Duchene produced the report and illustrations.
C.J. Baker laid out the drill sites in the field and supervised the road bulldozing work which was
performed by John Wlad St. Sons of Iroquois Falls. Heath Si Sherwood Drilling (1986) Limited of
Kirkland Lake performed the drilling and also supplied meals and accommodations at a temporary trailer
camp erected near Traill Lake. The samples were collected under ODM's direction by R. Mowat, a
resident of Wahgoshig First Nations Reserve on the south shore of Lake Abitibi. Actlabs Limited of
Ancaster, Ontario, analyzed both the bedrock samples and ODM's heavy mineral concentrates from the
till samples.
3.2 Field Procedures
The inferred shear zone that was targeted on the main claim block trends roughly E-W. It was tested
with a single traverse of drill holes but this traverse was broken into shorter, WNW-ESE trending
segments (Fig. 4; Plan 1) in order to repeatedly cross the target and efficiently map the bedrock geology.
These WNW-ESE segments are roughly normal to the final SSE ice flow (Fig. 2) that generated the
main till horizon (Matheson Till) in the area and would also intercept possible remnants of a slightly
older phase of the till that was deposited by WSW to SSW ice flow. Such till remnants could be
preserved in protective E-W trending preglacial valleys along the targeted deformation zone or in
sinkholes over kimberlite pipes (Averill and Mcclenaghan, 1994). On the northern satellite claims, a
single hole was drilled on each of the two kimberlite-suggestive magnetic anomalies.
The routes of the tractor roads to the drill holes were chosen from 1970s stereo air photos of 1:50,000
scale. Wherever possible, historical logging trails and open areas of muskeg were utilized to minimize

- 10-
vegetation damage. Timber cutting was required along only l .5 km of the 12 km long road on the main
claim block. The old railway bed and an off-branching logging trail were used to reach the northern
kimberlite targets. Although the drill holes were accurately sited from the air photos, their geographic
co-ordinates were also measured by GPS (Table l). However, hole elevations determined by OPS were
found to be very inaccurate, requiring estimates to be made from the air photos and topographic maps.
A reverse circulation drill string consists of two coaxial pipes and a tricone bit (Fig. 6). Air and water
are injected between the pipes to the bit and clay to pebble-sized sediment particles and cm-sized
cuttings of boulders and bedrock are flushed instantly through the centre pipe to surface where they are
logged (Appendix A) and bulk samples weighing 8 to 10 kg are collected. Fine silt and clay suspended
in the drill water are settled in a special tank and the water is recirculated down the drill hole. Heath SL
Sherwood's drill was mounted on a Nodwell tracked carrier for off-road mobility and was fully enclosed
for all-weather operation. Water was hauled to the drill with a smaller Go-Track carrier.
The drill holes were prefixed WLAP-02 (for West Lake Abitibi Property, 2002) and were numbered
consecutively in the sequence drilled. The samples from each hole, whether of till or bedrock, were
numbered consecutively (e.g. WLAP-02-05-01 to 22 in Hole 05).
3.3 Sample Processing and Indicator Mineral Logging Procedures
The bedrock samples were sieved to separate coarse (+2.0 mm), clean cuttings suitable for binocular
microscope logging (Appendix B) and geochemical analysis. The till samples were processed using the
procedures shown in Figure 7. All processed samples (Table 1) were tested for gold grains but only the
samples from the two drill holes on the satellite claims were tested for kimberlite indicator minerals
("KIMs").
The flow sheet of Figure 7 utilizes procedures that are designed to progressively reduce the bulk sample,
concentrate all of the heavy minerals, and finally clean and sort these minerals to simplify identification
of any indicator mineral grains. First the sample is wet screened at 2.0 mm and a -2.0 mm table
concentrate is prepared. Geological observations on the character of the sample are made during both
the screening and tabling operations (Table 2). The table concentrate is purposely large (typically 300-

OPS Co-ordinates (NAD 27, Zone 17)
^i^/rn A/A HoteNo. Easting
^ XX4* dro/ WLAP02-01 551120^/^4-ero/ WLAP02^2 551873^/,Zx?^7^Z- VVLAP02-03 552064^ /Z'r&'T'-'Z* VVLAP02-04 552800
A/Z^^^AS" WLAP02-05 553508
tfZ.l'S'? 0 ^ WLAP02-06 554246ZJZ'fSY'^ WLAP02-Q7 554559
t/ 2-3- 8 f&fc WLAP02-06 55597424-&70 3 WLAP02-09 556680
^/Z42*7f)e1 WLAP02-10 556681^ /^ 8 7 ^6 WLAP02-1 1 555451^ x S 7 o^, WLAP02-1 2 555245
^/^ * (O 0! WLAP02-13 557332t- ' 2-3-^7 o7 VVLAP02-14 557909
^ /.Z^ST// WLAP02-15 556829^/Z--f-87^/ WLAP02-16 550976
WLAP02-17 550974WLAP02-18 552177
16
Average
Northing
5413749
541372254141415414020
5414002
54138965414368
54140015413768541412054147585414119
541396354139585413794541375454188945418381
per hole:
SamplesElevation
(masl)
280278276275
280
279277283282282280280
286273269"280
286284
Metres DrilledOverburden Bedrock
41.0
39.036.846.0
52.0
39.619.5
29.855.548.626.851.3
35.625.035.950.553.246.8
672.4
42.0
0.01.31.21.5
1.0
0.90.0
1.72.50.90.81.0
1.41.51.62.01.82.2
23.3
1.5
Hole Depth (m)
41.0
40.338.047.5
53.0
40.519.5
31.558.049.527.652.3
37.026.537.552.555.049.0
695.7
43.5
Sample Interval
36.031.031.525.035.044.34.551.523.0
(m)
to 40.5to 39.0to 36.8to 26.0to 37.2to 46.0to 452to 52.0to 39.6
No Sample14.813.016.525.518.241.7 31.520.026.043.346.525.334.5
to 29.8to 55.5to 48.6to 26.8to 37.5to 51.3 to 35.6to 25.0to 35.9to 50.5to 53.2to 32.0to 40.5
TillCollected
3
4312220
170
82011195 2255143
116
7.3
Processed
0
4312213170
8138155 2255343
97
6.1
SandS Gravel
0
000000000
0000000000200
2
0.1
Bedrock
0
111
1
10
-' ^#\:
t
1
1
1
2
171.1
Table l - Drill hole statistics. Holes not completed to bedrock are grey-toned and excluded from project total and average values.

-12-
Cyclone
Figure 6 - Schematic diagram of a reverse circulation drilling system.

Character Sample, -300 g:STORE Split
^.0 mm:STORE
Light Fraction: STORE
i-iTable Split:
Dissaggregate (if required); Wet Sieve at 2 D mm
^.0 mm:Table Separation;
Count Visible Gold Grains Mf:tble Concentrate: Micropanningand Visible Gold Grain Cuuni
(selected samples)
Table Concentrate:Calculate Assay Value of V.G.
Light Fraction:STORE
Table Concentrate:Heavy Liquid Separation
(SG 3.20)
i Ferromagnetic Fraction:STORE - Heavy Fraction:
Ferromagnetic SeparationNonferromagnetlc Fraction:
Submit for Geochemical Analysis
mw^~^
: Nonfemomagnettc Fraction: Dry Sieve to 0.25 mm
-0.25 mm: Available for Geochemical Analysis
OJ25 to 1.0 mm NonferromagneticFraction: Oxalic Acid Wash
(oxidized samples only)
NonfWTomagmtic Fraction:Dry Sieve at 0.25, 0.5 and 1.0 mm
0.25 to 0.5 mm NonterromagnaticFraction: Paramagnetic Separation
(Drum Carpoo)0.5 to 1.0 mm and 1.0 to 2.0 mm
Nonlerramagnetic friction:Indicator Loggtng/PlcWng
0.25 to 0.5 mm Paramagnetic ind Nonparamagnetlc Fraction*
Indicator Logging/Picking
Resolve Ambiguous Grains by Qualitative SEM Analysis; Organize All Grains m Viate
Figure 7 - Heavy mineral processing flow sheet for the till samples. All samples were processed for gold grains. Only the samples from Holes 17 and ] 8 on the satellite claims were processed for KIMs and the heavy mineral concentrates from these samples were not submitted for geochemical analysis.
-14-
Sample Number
WLAP-02-02-01WLAP-02-02-02WLAP-02-02-03WLAP-02-02-04WLAP-02-03-01WLAP-02-03-02WLAP-02-03-03WLAP-02-04-01WUAP-02-04-02WLAP-02-04-03WLAP-02-04-04WLAP-02-04-05WLAP-02-05-01WLAP-02-05-03WUAP-02-05-05WLAP-02-06-07WLAP-02-05-09WLAP-02-05-11WLAP-02-05-13WLAP-02-05-1SWLAP-02-05-16WLAP-02-05-17WLAP-02-05-18WLAP-02-05-19WLAP-02-06-20WLAP-02-05-21WLAP-02-06-01WLAP-02-06-02WLAP-02-06-03WLAP-02-06-04WLAP-02-06-05WLAP-02-06-06WLAP-02-06-07WLAP-02-OB-01WLAP-02-08-02WLAP-02-08-03WLAP-02-08-04WLAP-02-08-OSWLAP-02-08-06WLAP-02-OB-07WLAP-02-08-08WLAP-02-09-01WLAP-02-09-03WLAP-02-09-05WLAP-02-09-07WLAP-02-09-09WLAP-02-09-11WLAP-02-09-13WLAP-02-09-15WLAP-02-09-16WLAP-02-09-17WLAP-02-09-18•WLAP-02-09-19WLAP-02-09-20
Damp Weight (kg)
Balk Tot* *" Table S.**, SpK ^ Feed
11.1 10.6 2.0 8.610.7 10.2 0.5 9.710.3 9.8 0.6 9.2
9.7 92 0.5 B.79.9 9.4 1.6 7.8
10.5 1 0.0 1.9 8.110.2 9.7 0.9 8.84.1 3.6 0.6 3.0
10.3 9.8 0.7 9.19.7 9.2 0.4 8.8
10.5 9.7 1.7 8.010.5 10.0 1.3 8.710.4 9.9 1.0 8.911.0 10.5 1.2 9.310.3 9.8 0.8 9.010.2 9.7 0.5 9.210.9 10.4 1.1 9.311.0 10.5 1.0 9.510.5 10.0 0.5 9.511.5 11.0 0.4 10.611.3 10.8 1.4 9.412.0 11.5 1.9 9.611.6 11.1 1.2 9.911.4 10.9 1.0 9.911.5 11.0 0.7 10.33.8 3.5 0.5 3.0
11.5 11.0 1.4 9.611.5 11.0 1.7 9.311.9 11.4 0.9 10.611.3 10.8 0.9 9.912.1 11.6 1.5 10.110.8 10.3 0.6 9.711.3 10.8 0.5 10.311.7 115 1.1 10.111.5 11.0 1.1 9.911.0 10.5 0.5 10.011.7 11.2 0.5 10.711.8 11.3 0.6 10.711.3 10.8 0.5 10.311.5 11.0 0.5 10.511.7 11.2 0.6 10.610.8 10.3 1.4 6311.0 10.6 1.0 9.511.6 12.1 1.0 11.110.8 10.3 1.0 9.310.8 10.3 0.8 9.510.1 9.6 0.3 9.310.9 10.6 0.6 9.910.3 9.8 0.8 9.010.9 10.4 1.1 9.311.3 10.8 1.1 9.710.8 10.3 0.8 9.511.5 11.0 1.6 9.411.1 10.6 0.5 10.1
Dry weight (a)
Table Cone.
479.0407.2514.0455.4351.9396.1351.9230.0468.6369.5365.7420.1282.4412.6247.1306.2265.6311.0375.5240.13022380.3483.4305.7372.2323.1484.5328.8359.0299.3243.6411.7409.8440.4418.8300.9366.7412.7332.9362.9405.1309.3303.7365.8343.6338.7355.8406.6399.0380.4335.2401.2340.5366.7
-2.0 mm Heavy Liquid Separation S.G. 33
LJBhtS
314.3338.2487.1427.6315.3358.6316.5214.3447.0331.6333.63835244.5348.9198.1271.0224.3271.0332.71815257.9341.5447.5262.83235308.14325264.5306.9241.81985364.9352.9384.6372.7271.0310.4357.0276.4307.8354.1267.0253.6300.5297.6282.1307.1359.4354.1326.3277.83605233.5220.8
Total
164.769.026.927.836.637.535.415.741.637.932.136.937.963.749.035.241 340.042.858.944.338.835.942.949.015.052.364.352.157.545.446.856.955.846.129.956.355.756.555.151.042.350.165.346.056.648.747.244.954.157.440.3
107.0145.9
HMC
NonMag Mag
145.5 19.257.5 11.520.3 6.618.7 9.124.7 11.924.7 12.823.2 12.211.3 4.429.9 11.728.4 9.520.4 11.723.0 13.924.9 13.047.9 15.836.4 12.623.8 11.4295 12.129.8 10533.0 9.846.3 12.633.6 10.727.2 11.624.8 11.133.0 9.938.1 10.911.2 3.839.5 12*48.9 15.440.0 12.143.7 13.831.0 14.435.0 11.844.8 12.142.7 13.136.0 10.121.8 8.143.3 13.042.8 12.944.0 12.543.2 11.938.8 12.231.4 10.939.0 11.151.3 14.034.6 11.444.3 12.338.8 9.936.1 11.134.1 10.841.9 125455 11.929.9 10.463.6 43.487.2 58.7
Sample Description
sti t
CCpcccccccccppccccccccccccccppppcpcccccpccppppcpcccccc
Claas (* 2.0 mm)Percentage
V/S Gfl LS OT
60 40 0 010 90 0 065 30 5 060 40 Tr 070 30 0 050 50 Tr 060 40 0 060 40 Tr 060 40 0 060 40 0 060 40 0 090 10 0 050 50 0 050 50 0 060 40 0 060 40 0 060 40 0 060 40 0 060 40 0 050 50 0 060 40 0 060 40 0 070 30 0 070 30 0 070 30 0 095 5 0 070 30 Tr 050 50 Tr 060 40 0 060 40 Tr 070 30 0 070 30 Tr 070 30 0 060 40 0 060 40 0 060 40 Tr 060 40 Tr 060 40 0 060 40 0 060 40 0 060 40 0 060 40 0 070 30 Tr 070 30 Tr 065 35 Tr 065 35 Tr 060 40 0 060 40 Tr 070 30 0 070 30 0 070 30 0 070 30 0 080 20 0 070 ' 30 0 0
Matrix 1*2.0 mm)Distribution
S/U SD ST CY
U YUUU YU YU YU YU YUUU YU YU Y YU Y YU Y YU Y YU Y YU Y Y YU Y Y YU - t tU Y Y YU Y Y YU Y Y YU Y Y YU Y Y YU Y Y YU Y YU Y YU Y YU Y YU Y Y YU Y Y YU Y Y YU Y Y YU Y Y YU Y Y YU Y Y YU Y Y YU Y Y YU Y Y YU Y Y YU Y Y YU Y Y YU Y Y YU - * YU Y Y YU - t *U Y Y YU Y Y YU Y Y YU Y Y YU Y Y YU * YU t Y
Colour0
SD CY R G
GB GB6B GB3B GBGB GBGB GBGB GBGB GBGB GBGB GBGB GBGB GBGB GBGB GBGB GBGB GBGB GBGB GBGB GBGB GBGB GBGB GBGB GBGB GBGB GBGB GBGG GYGB GBGB GBGB GBGB GBGB GBGB GBGB GBGB GB
LOG GBGB GBGB GBGB GBGB GBGB GBGB GBGB GBGB GBGB GBGB GBGB GBGB GBGB GBGB GB
LOC GBGB GB
LOC GBGB GBGB GB
CLASS
TILLTILLTILLTILLTILLTILLTILLTILLTILLTILLTIUTIU.TILLTIUTILLTIUTIU-TILLTILLTILLTILLTILLTILLTILLTILLTILLTILLTILLTILLTILLTILLTILLTILLTILLTILLTILLTILLTILLT1U-TILtTILLTILLTILLTILLTILLTILLTIU-TILLTILLTILLTILLTILLTIU-TILL
Table 2 - Laboratory classifications and heavy mineral processing weights for the till and gravel samples. On samples from Holes 17 and 18, the heavy liquid separation was performed at S.G. 3.2 rather than 3.3. Clast codes: C - cobbles, P = pebbles, V/S = volcanosedimentary, GR granitic, LS = limestone, OT ^ther. Matrix size distribution/ colour codes: S = sorted, U ^ unsorted, SD = sand, ST = silt, CY ^ clay, FMC = fine/medium/coarse sand, Y = present, N ^ absent, + = abundant, - = negligible, B or GB ^ beige or grey-beige (unoxidized), LOC light ochre (oxidized). Page l of 2.
- 15-
Sample Number
WLAP-02-10-01WLAP-02-10-03WLAP-02- 1 0-05WLAP-02-10-07WLAP-Q2-10-08WLAP-02- 10-09WLAP-02-10-10WLAP-02-10-11WLAP-02-11-01WLAP-02-12-01WLAP-02-12-03WLAP-02-12-05WLAP-02-12-07WLAP-02-12-09WLAP-02-12-10WLAP-02-12-11WLAP-02-12-12WLAP-02-12-13WLAP-02-12-14WLAP-02-13-01WLAP-02-13-02WLAP-02-14-01WLAP-02-14-02WLAP-02-15-01WLAP-02-15-02WLAP-02- 15-03WLAP-02- 15-04WLAP -02-15-05WLAP-02-16-01WLAP-02-16-02WLAP-02-16-03WLAP-02-16-04WLAP-02-16-05WLAP-02-17-01WLAP-02-17-02WLAP-02-17-03WLAP-02-18-01WLAP-02-18-02WLAP-02-18-03WLAP-02-18-04WLAP-02-18-05WLAP-02-18-06WLAP-02-18-07
Damp Weigh! (kg)
Bulk Table *" Table Sample Sp*! C™K Feed
10.9 10.4 1.3 9.110.3 9.8 0.6 9.211.3 10.8 0.9 9.910.9 10.4 0.8 9.611.2 10.7 1.0 9.711.7 11.2 0.7 10.510.9 10.4 0.3 10.14.3 4.0 0.3 3.7
11.7 11.2 1.0 10.210.6 10.1 0.9 9.210.5 10.0 1.8 8211.4 10.9 0.8 10.111.6 11.1 1.1 10.011.3 10.8 0.3 10.511.4 10.9 1.3 9.610.1 9.6 1.0 8.611.4 1.9 0.1 1.810.2 9.7 0.7 9.011.2 10.7 0.6 10.110.1 9.6 0.3 9.311.9 11.4 0.5 10.911.9 11.4 1.3 10.111.1 10.6 1.0 9.611.6 11.1 2.0 9.110.8 10.3 1.4 8.911.0 10.5 0.8 9.711.3 10.8 0.8 10.011.3 10.8 1.0 9.810.2 9.7 1.2 8.510.3 9.8 0.5 9.311.3 10.8 1.2 9.612.3 11.8 0.7 11.111.4 10.9 0.8 10.1
9.2 8.7 1.3 7.411 10.5 1.5 9.0
9.7 9.2 1.4 7.812 11.5 1.8 9.7
11.7 11.2 0.9 10.311.1 10.6 0.9 9.710.6 10.1 1.6 8.511.2 10.7 0.5 10.211.1 10.6 1.2 9.410.4 9.9 0.4 9.5
Dry weight (g)
Tat* Cone.
259.5219.7387.6374.1338.8343.7381.5231.4358.7409.3289.0279.3326.4320.4206.8300.0342.0325.0352.9364.2438.0522.4357.6501.0414.0460.8393.6582.0463.1382.2466.4436.2412.9
1,021.21,243.3
617.3494.5690.7484.1426.3799.3760.2419.0
-2.0 mm Heavy Liquid Separation S.G. 3.3
Lights
207.8165.0328.0324.6298.3300.2335.5211.8299.6364.6256.4231.7285.4288.9157.3245.2275.9251.8283.5319.7370.8467.5306.6442.4360.73992
334.5452.7402.3332.8396.4263.0314.3910.5
1,076.6460.1383.6595.6410.9345.6631.3641.1319.7
HMC
Total
51.754.759.649.540.543.546.019.659.144.732.647.641.031.549.554.866.173.269.444.567.254.951.058.653.361.659.1
129.360.849.470.0
173.298.6
110.7166.7157.2110.9
95.173.280.7
168.0119.199.3
NonMag Hag
38.7 13.041.4 13.345.3 14.337.5 12.029.6 10.933.0 10.535.1 10.913.2 6.445.5 13.633.7 11.022.3 10.335.0 12.629.0 12.022.5 9.040.5 9.034.9 19.948.8 17.354.2 19.052.5 16.935.9 8.650.1 17.139.5 15.438.2 12.840.6 18.038.8 14.548.0 13.645.5 13.665.5 63.844.7 16.134.3 15.140.0 30.0
104.3 68.959.4 39.2652 25.5
125.3 41.4103.3 53.995.9 15.0832 11.962.4 10.870.9 9.8
126.0 42.0100.2 18.9
88.1 11.2
Sample DescriptionClass ^ 2.0 mm)
Sie
Cccccccccppccpccpcccpppcccccccccccccccccccc
Percentage
VrS GR LS OT
60 40 0 060 40 0 060 40 0 060 40 0 070 30 0 070 30 0 070 30 0 060 40 0 060 40 0 060 40 Tr 060 40 Tr 060 40 Tr 060 40 Tr 060 40 Tr 060 40 Tr 060 40 Tr 070 30 0 080 20 0 090 10 0 060 40 0 070 30 0 060 40 Tr 060 40 Tr 060 40 0 060 40 0 060 40 0 060 40 0 070 30 0 050 50 0 060 40 0 060 40 Tr 060 40 Tr 070 30 0 050 50 0 050 50 0 070 30 0 050 50 0 060 40 0 060 40 0 060 40 0 065 35 0 060 40 0 060 40 0 0
Malrnt ^2.0 mm)Distribution
SAJ SD ST CY
U t YU t YU 4 YU * YU t YU -r YU + YU + YU * YU 4 YU + YU * YU t YU * YU -i- YU * YU t YU t YU -f YU -f YU -f YU t YU t Y -U t YU + YU -f YU -f YU Y YU * Y ~U * YU t YU t Y -U * YS FMC - NS FMC Y NU -fU -f YU tU * YU -i- YU Y Y YU tU -1- Y
Colour
0 SO CY R
G
GB GBGB GBGB GBGB GBGB GBGB GBGB GBGB GBGB GBGB GBGB GBGB GBGB GBGB GBGB GBGB GBGB GBGB GBGB GBGB GBGB GBGB GBGB GBGB GBGB GBGB GBGB GBGB GBGB GBGB GBGB GBGB GBGB GBGB GYGB GYGB GYB BB BB GBB GBB GBB GBB GB
CLASS
TILLTILLTILLTILLTILLTILLTILLTILLTILLTILLT1LLTILLTILLTILLTILLTILLTILLTILLTILLTILLTILLTILLTILLTILLTILLTILLTILLTILLTILLTILLTILLTILLTILL
SAND 8 GFWiVELSAND S GfWiVEL
TILLTILLTILLTILLTILLTILLTILLTILL
Table 2 - Laboratory classifications and heavy mineral processing weights for the till and gravel samples. On samples from Holes 17 and 18, the heavy liquid separation was performed at S.G. 3.2 rather than 3.3. Clast codes: C = cobbles, P = pebbles, V/S = volcanosedimentary, GR = granitic, LS = limestone, OT ^ther. Matrix size distribution/ colour codes: S = sorted, U = unsorted, SD = sand, ST = silt, CY = clay, FMC = fine/medium/coarse sand, Y = present, N = absent, + = abundant, - = negligible, B or GB ^ beige or grey-beige (unoxidized), LOC ^ light ochre (oxidized). Page 2 of 2.

- 16-
500 g) and of low grade (10-30 percent heavy minerals) in order to achieve a high, 80-90 percent
recovery rate for all desired indicator minerals irrespective of their grains size or specific gravity. The
gold grains, which are mostly silt-sized, are observed at this stage with the aid of micropanning and are
counted, measured and classified as to degree of wear (i.e. distance of glacial transport; Fig. 8). Their
gold assay value is also calculated (Appendix C). For samples that are being tested for KIMs, the table
reject is reprocessed to scavenge possible unrecovered KIMs, especially the largest grains which are the
most difficult to recover.
If the heavy mineral fraction is to be geochemically analyzed for gold and base metals, the -2.0 mm table
concentrate is separated in methylene iodide at S.G. 3.32. If KIMs are targeted, the methylene iodide is
diluted with acetone to S.G. 3.20 to ensure recovery of the least dense KIM species. Undesirable
magnetite is then removed from the heavy liquid concentrate using a ferromagnetic separator. If KIMs
are being targeted, the finer, -0.25 mm grains are sieved from the nonferromagnetic heavies and the
retained 0.25-2.0 mm grains are cleansed with oxalic acid to remove limonite stains that would
otherwise impede mineral identification. The clean heavies are then sieved at 0.5 and 1.0 mm. The
0.25-0.5 mm fraction, which contains the most mineral grains, is sorted electromagnetically into strongly
^0.6 amp), moderately (0.6-0.8 amp), weakly (0.8-1.0 amp) and non-paramagnetic (5-1.0 amp) fractions
which are of simpler mineralogy, thereby easing indicator mineral logging. This logging is done by
experienced exploration geologists/mineralogists, not by technicians. These mineralogists are familiar
with all minerals in the concentrate, not just a limited suite of KIMs, and are therefore able to recognize
minerals indicative of any type of deposit and mineral textures and distribution patterns critical to
follow-up exploration. To this end, they also systematically record the major, regional heavy mineral
suite or assemblage of each sample, thereby monitoring any significant changes in the overall
provenance of the till. Any difficult mineral grains are resolved by energy dispersive x-ray spectrometry
("EDS") analysis using a scanning electron microscope ("SEM"). All indicator mineral grains, or
representative examples of larger populations of such indicators, are carefully vialed for future
reference.

Till Gold Grain Morphology
Pristine
100m
Modified
500m
Reshaped
,000 to > 10,000 m
Distance of Transport
Figure 8 - Backscatter electron images of gold grains from till illustrating the relationship between grain wear and distance of glacial transport. The wear processes are compressional (infolding and compaction) and do not reduce the mass of the gold grain. Scale bars ~ 50 microns.

-18-
3.4 Analytical Procedures
The heavy mineral concentrates of the till samples from the satellite claims were not analyzed
geochemically. The concentrates from the main claim block were analyzed for Au, As, Ag, Cu, Pb, Zn,
Ni, Cd, Mo, Mn and S. Both Au and As were determined by instrumental neutron activation (INA)
analysis using up to a 60 g (as available) aliquot with no acid digestion. The other nine elements were
determined by inductively coupled plasma/mass spectrometry (1CP/MS) on a milled 0.5 g aliquot using
aqua regia acid digestion. All bedrock samples were milled, wholly fused or partially digested as
required and analyzed by a similar IN A + ICP/MS combination for whole rock oxides plus 32 elements
including rare earths and the metals that were determined for the till concentrates.
3.5 Drill Performance and Project Costs
The work performed and/or supervised by ODM (i.e. everything except laying out the drill hole sites in
the field and clearing roads to these sites) was budgeted at 5106,615.50 (Table 3). This budget was
based on drilling 20 holes at Heath *fe Sherwood's quoted hourly contract prices assuming an average
hole depth of 40 m for a total of 800 m, a production rate of 6 m per drilling/moving hour (excluding
moving time between the two properties), 10 percent mechanical down-time, changing the tricone bit
every 60 m and processing an average of 6.5 till samples per hole. The expected cost per metre was
therefore S133.27; of this, S86.05 was allocated to Heath A Sherwood's drilling operations and camp
charges.
Eighteen holes were actually drilled. Two, Nos. 01 and 07, did not reach bedrock and were replaced by
Holes 16 and 11, respectively. The average depth of the 16 completed holes was 43.5 m (Table 1), or 11
percent deeper than forecast, for a total of 695.7 m. Twelve tricone bits were used for an average of 58
m/bit, very close to the expected 60 m. An average of 6.2 "till" samples (includes two gravel samples
from Hole 17) was processed from these holes. This is slightly below the budgeted 6.5 samples;
however, an average of 7.4 samples/hole was actually collected but in Holes 05,09,10 and 12, only the
odd-numbered samples from the upper parts of extra-thick till sections were processed. Actual
mechanical down-time was only 0.4 percent but this does not include time spent rectifying a fluid bypass
problem in the drill string that was the main reason for abandoning Holes 01 and 07. If these two

Total CostsBudget Actual
Completed Holes OnlyService
1. Pre-drilling
2. Drilling operations and camp charges
3. Road Clearing
4. Field supervision, logging and sampling
5. Sample shipping
6. Sample processing
7. Analytical
8. Report
TOTALS
GST
GRAND TOTALS
CompanyODM
Heath Z Sherwood
STotal1,000.00
68,841.50
Contracted separately by Boulder Mining
ODM (includes Boulder's sampling assistant) 1 4,01 1 .00
Various
ODM
Actlabs
ODM
360.00
11,503.00
4,900.00
6,000.00
S1 06,61 5.50
S7,463.09
S1 14,078.59
S/Metre1.25
86.05
it/Foot0.38
26.23
STotal934.21
65,279.40
S/Metre1.34
93.83
S/Foot0.41
28.60
Corporation
17.51
0.45
14.38
6.13
7.50
133.27
6.82
140.09
5.34
0.14
4.38
1.87
2.29
40.62
2.84
43.46
11,408.95
881.10
7,198.10
2,762.00
7,568.91
$96,032,67
S6.722.29
S1 02,754.96
16.40
1.27
10.35
3.97
10.88
138.04
9.66
147.70
5.00
0.39
3.15
1.21
3.32
42.07
2.95
45.02
Table 3 - Comparison of budgeted and actual project costs.

-20-
unfinished holes are excluded, average productivity was only 5.1 m per drilling/moving hour, or 15
percent below forecast. The lower productivity is not all due to the two lost holes; it also reflects the
excessive hole depth as the penetration rate of a reverse circulation drill decreases with depth. With
fewer metres drilled per hour, the cost per metre of Heath & Sherwood's drilling operations rose
significantly to S93.83 or 9 percent more than forecast, but the total project cost was kept 10 percent
below budget at S96,032.67 by reducing the number of holes drilled and till samples processed.
4. RESULTS
4.1 Bedrock Geology and Geochemistry
As expected, most of the drill holes that reached bedrock intersected either northern turbidites of the
Scapa Assemblage or southern mafic volcanics of the Stoughton - Roquemaure Assemblage (Plan l, in
pocket). Although the contact between the two assemblages is in the location predicted by Ayer et al.
(1999), it is neither sheared nor hydrothermally altered. The Scapa turbidites and Stoughton -
Roquemaure komatiites both face south (Jackson and Fyon, 1992), and komatiites are typically the
lowermost horizons of volcanic successions deposited in submarine basins. Therefore the contact
between the two assemblages is probably a normal, conformable contact.
Minor intersected lithologies include cherty exhalative sediments in Hole 18, gabbro in Hole 04,
pyroxenite in Hole 17, feldspar porphyry in Hole 08 and a Proterozoic diabase dyke in Hole 14. The
cherry sediments occur within the northern turbidites and coincide with the easternmost magnetic
bullseye that was targeted as kimberlite (Fig. 5) but the drill hole was not centered on the anomaly and
the 2.2 m drill intercept (Table l) does not contain magnetite or pyrrhotite. It does, however, contain a
thin (O.4 m; Appendix A) interval of mafic volcanics. This suggests that the cherty exhalations are
related to a volcanic event that briefly interrupted turbidite sedimentation an event that may have been
a precursor to major Stoughton - Roquemaure volcanism or residual to earlier calc-alkaline volcanism.
The gabbro and pyroxenite also occur within the turbidites and thus may have been feeder intrusions for
Stoughton - Roquemaure volcanism. The pyroxenite is responsible for the second, more westerly
magnetic bullseye that was targeted as kimberlite (Fig 5). The feldspar porphyry occurs within the
southern komatiites and may represent a feeder for younger, more evolved calc-alkaline volcanism

-21 -
higher in the volcanic pile. The porphyry coincides with a magnetic low between two magnetic diabase
dykes (Fig 4) which have the north-south trend typical of the 2454 Ma Matachewan dyke swarm
(Osmani, 1991). The diabase intersection of Hole 14 is on a similar dyke further east.
Most of the turbidite intersections are fine-grained siltstones, with greywacke occurring only in Hole 10
and as minor laminations within the siltstone of Hole 03. The siltstone cuttings vary in colour from grey
to green but their grain size is so uniform typically 0.05 mm that bedding is seldom evident. The
0.05 mm silt particles are too small for mineralogical resolution by binocular microscope but in
aggregate are relatively soft indicating that they consist mainly of saussuritized plagioclase with little
quartz. A finer silt/clay component is represented by 20-50 percent chlorite (variably sericite). Some
samples are spotted with up to 5 percent small (0.1-0.3 mm) biotite metacrysts indicating metamorphism
of the turbidites at mid-greenschist facies. The Hole 10 greywacke is a poorly sorted, fine to medium
(0.1-0.5 mm) sand with 15 percent finer-grained matrix chlorite/biotite. The sand component consists
mainly of saussuritized plagioclase plus visually similar intermediate volcanic lithic grains with only 15
percent quartz grains. Chemically the turbidites are equivalent to calc-alkaline andesite (Table 4; Fig.
9). All are well-foliated to semi-schistose but not sheared. Carbonates are generally either absent or
restricted to minor, fracture-hosted calcite. Primary pyrite (or more rarely pyrrhotite) stringers and
disseminations are often present but their maximum concentration is only l percent.
The chert of Hole 18 is a pale green-white, sugary-textured rock with a grain size of 0.05-0. l mm. It is
an impure, silty chert as it contains 5*M) chlorite/biotite and its SiCh content, although higher than that of
all other intersected lithologies except feldspar prophyry, is only 69 percent (Table 4). The most
noteworthy feature of the chert is the presence of l percent primary, disseminated to stringer pyrite
which is accompanied by 0.1 percent chalcopyrite. Two bedrock samples rather than the usual 1.5 m
sample were collected from Hole 18 (Table 1) and the sulphide mineralization extends through both
samples including the mafic volcanic interval that interrupts the chert. Sphalerite is absent but the
weakly mineralized chert could nevertheless represent an exploration cue because anomalous exhalite
beds occur near many volcanogenic massive sulphide deposits.
The mafic volcanics are dark green, variably foliated rocks with a grain size of 0. l -0.3 mm. They lack
amygdules and have the equigranular, interlocking texture typical of the unquenched central parts of
basalt flows extruded in deep submarine basins. Mineralogically they consist of subequal chlorite and

SAMPLE NO. SIO2 AI2O3 Fe2O3Vo
MnO MgO CaO Na2O K2O TIO2 P2O5 LOI TOTAL Ba Sr Y Se Zr Be V'/e "/o '/e "/o "^ jjpm ppm pom ppm ppm ppm ppm
WLAP 02-05WLAP 03-04WLAP 04-06WLAP 05-22WLAP 06-08WLAP 08-09WLAP 09-21WLAP 10-1 2WLAP 11 -02WLAP 12-1 5WLAP 13-03WLAP 14-03WLAP 15-06WLAP 16-06WLAP 16-06 RerunWLAP 17-04WLAP 18-08WLAP 18-09WLAP 18-09 (Pulp duplicate)
67.1563.8259.7561.4349.7469.9554.6669.9062.2162.2347.0250.8147.2063.3763.2344.3169.2563.4163.49
13.5017.2415.3614.7913.7115.5812.3513.8216.2215.7014.9013.6915.5716.0916.027.51
16.2215.3915.29
7.536.266.55
10.3414.42
1.3314.894.126.967.92
14.9914.3212.586.546.528.252.564.914.94
0.0450.0370.0860.0610.2060.0180.2370.0490.0580.0730.1820.2050.1380.0580.0570.1360.0240.0720.073
2.462.793.912.876.560.546.262.303.263.857.925.515.702.712.69
20.282.404.074.07
1.260.824.361.678.722.451.881.502.181.736.348.677.571.901.894.562.565.555.57
1.903.723.552.562.306.591.134.602.962.942.262.841.852.982.961.362.992.812.79
2.23 0.4851.88 0.5191.24 0.6142.09 0.6380.31 1.6141.16 0.2140.24 1.1291.06 0.4352:75 0.5571.99 0.6180.36 1.6960.80 1.1960.29 1.1892.29 0.4722.29 0.4600.81 0.2621.56 0.2491.22 0.4111.14 0.405
0.160.160,110.160.150.090.120.130.140.170.160.130.150.130.140.130.090.260.26
3.162.913.763.372.441.795.772.042.572.694.301.906.862.892.89
11.052.041.771.80
99.88100.1699.2999.97
100.1799.7198.6899.9499.8799.91
100.13100.0899.0899.4299.1598.6699.9599.8899.83
525442328522
55752
77308877511
55199113601597168353410406
146252253228145841
54282152236148189127245245322391593588
1010111137
2259
131438283412107399
1314241747
333
91619493940131310
31212
9610584
1111019078
12510211510996
10310910647769088
2 952 941 1471 120
-1 3822 22
-1 2771 672 1071 124
-1 378-1 298-1 2782 861 85
-1 391 232 892 89
N)
Table 4 - Whole rock and rare earth element analyses for the bedrock samples. The samples were analysed by Actlabs Limited, Ancaster, Ontario.

FeO * Fe 20g
FeO 4- Fe2O3 + TiO2
AI203
K) OJ
A12O3 MgO
Figure 9 - Jensen cation plot for greywacke, siltstone and chert (No. 18-08) samples.

-24-
saussuritized plagioclase with <l percent visible quartz. They lack the magnetite that is typical of high-
Fe tholeiites and most are relatively enriched in MgO (Table 4, Fig. 10). In most samples, part of the
chlorite has been transformed to actinolite the equivalent of the mid-greenschist facies biotite
observed in the turbidites. Calcite and pyrite levels are even lower than in the turbidites.
The gabbro of Hole 04 has a grain size of 0.7-1.0 mm, nearly five times coarser than the mafic
volcanics. It is also significantly less mafic, containing more (3 percent versus l percent) quartz and
less (30 percent versus 50 percent) chlorite/actinolite and is more carbonatized, with 10 percent calcite.
Chemically it is equivalent to calc-alkalic andesite (Table 4, Fig. 10).
The pyroxenite of Hole 17 is a completely hydrated and carbonatized rock consisting of subequal
proportions of talc, chlorite and Fe-Mg carbonate. Originally it was probably a websterite as talc is
chemically equivalent to hydrated orthopyroxene and chlorite to hydrated clinopyroxene. The rock
contains 20 percent MgO (Table 4; Fig. 10) which is high for pyroxenite; however a peridotite protolith
is improbable because the rock contains 5 percent plagioclase and only 1-2 percent olivine-suggestive
(i.e. patchily disseminated) magnetite. This minor magnetite explains the weak, kimberlite-suggestive
magnetic signature (Fig. 5) of the pyroxenite.
The feldspar porphyry of Hole 08 is a pale grey-white, weakly foliated granitoid rock with 10 percent
coarse, l .5-4 mm plagioclase phenocrysts in a medium-grained, 0.5-1.0 m groundmass. It is a two-mica
porphyry containing 2 percent biotite/chlorite plus 5 percent muscovite and has a rather high quartz (30
percent) and SiO2 (70 percent; Table 4) content. It also contains 0.5 percent coarsely disseminated cubic
pyrite but otherwise is unaltered and unmineralized.
The Matachewan diabase intersected in Hole 14 is a massive, unmetamorphosed, diabasic-textured,
green and white rock. It consists of 60 percent fresh, unsaussuritized plagioclase and 40 percent primary
green to grey-brown clinopyroxene. The diabase also contains l percent interstitial magnetite,
explaining the linear, north-south trending aeromagnetic anomalies that trace the dyke swarm (Fig. 4).
Chemically it is equivalent to tholeiitic basalt (Table 4, Fig. 10).
In keeping with their unsheared and unaltered condition, the bedrock samples yielded only normal
background Au analyses (Table 5). The highest value is 8 ppb in the mafic volcanics of Hole 13; all
other samples yielded ^5 ppb Au. The As, Ag, Cu, Pb, Zn, Ni, Cd and Mo values are similarly low, the

FeO t-
FeO H- Fe2O3 ± TiO2
SYMBOLSk Mafic Volcanics
Gabbro Pyroxenite Diabase
K)
AI203
A12O3 MgO
Figure 10 - Jensen cation plot for mafic volcanic, gabbro, pyroxenite and diabase samples.

SAMPLE NO.
WLAP 024)5WLAP 034)4WLAP 044)6WLAP 05-22WLAP 064)8WLAP 084)9WLAP 09-21WLAP 10-12WLAP 114)2WLAP 12-15WLAP 134)3WLAP 144)3WLAP 154)6
INA Matt Au A*fa) ppm ppm
26.3824.9123.4427.2927.1722.0423.4623.8826.4225.8425.4230.3123.73
-55
-5-5•5-S•S-5-5•58-5•5
173
-27
-2-232
1062
-25
WLAP 154)6 RerunWLAP 164)6WLAP 174)4WLAP 184)8WLAP 184)9WLAP 184)9(Pulp duplicate)
24.0422.7028.0829.9225.47
-5•5•5-5•5
46
-2-2•2
Ag ppm
0.64X2-0.24X2-0.2-0.2-0.2-0.243.24X24X24X245.24X24X24X24X2-0.2-0.2
Cd ppm
-0.5•0.5-0.6-0.5-0.541.5-0.5-0.5-0.5-OS4X5-0.5-0.54X5-0.5•0.5•0.5-0.5-0.5
Cu ppm
3124725958-1
1516
284357
16069862110
251217233
Mn ppm t
300279405382658138
1599359364457543375704665392774150236263
Mo *pm
2-2-2-2-29
-22
-2•2•2-2-2-2-2•2•2-2-2
Ni Pb oofii ppm
1059175904996
10454
1071436740
1049670
418142427
32344
•265345
•22
•2545
-2-2-2
ZnOPfll
656456736314
121366281686866635521112022
Alf.
1.631.831.582.152.190.383.991.252.012.242.401.522.612.661.721.110.971.381.53
A* ppm
18•10-10-10•10•10-10-10•10-10-10•10•10-10-10-10-10-10•10
Ba Be ppm ppm
1027596
10251
2304278
269145
1541989893
10063
269295
•1-1-1-1-1-1• 1•1-1-1-1• 1-1-1-1-1-1-1-1
Bt ppm
-10-10•10•10•10-10-10•10•10-10-10-10-10-10•10•10•10•10•10
Cay.
0.930.482.281.042.001.791.080.921.060.821.671.511.601.761.163.440.251.231.40
Co ppm
2422272331
125854172431343236361852
81314
Cr ppm
828566959617
1341101261789713
16716669
1395104752
Fa
4.824.003.376.505.430.87
10.422,644.325.115.705.496.356.244.023.941.411.892.08
K
0.160.090.100.180.070.130.020.090.440.360.010.060.020.020.110.130.090.320.35
Mg
1.261.461.591.501.930.213.771.251.692.112.861.222.252.201.356,011.121.521.66
Na*
0.030.040.060.050.100.100.050.080.060.050.030.120.040.040.040.040.040.090.10
Pt,
0.0510.0490.0340.0510.0450.0250.0380.0400.0460.0550.0480.0420.0440.0430.0420.0460.0260.0800.086
Sb Se ppm ppm
-10-10-10-10-10-10-10-10-10-10-10•10•10-10-10•10•10•10-10
4368
111
2558
1065
121335
•144
Sn ppm
-10-10-10•10-10-1022
-10-10-1014
-10•10•10-1067
-10•10-10
Sr ppm
231316433382272030381523424427
255107082
TlIt
0.030.010.060.060.330.040.270.130.150.120.090.160.360.400.020.050.010.100.11
Vppm
38386376
16910
302516582
16720714014434398
4449
W Y ppm ppm
-to-10-10-10•10701-1018
-10• 10-10•10-10•10-10-10-10-10-10
-1-1-1-1-1-11
-1-1-1-1-1-1-1-1-1-1-1-1
Zr ppm
3322406622
10232486461187137384221232832
S
0.5550.0120.0520.1640.0950.2520.0080.1280.0200,2300.0640.1040.0030.0050.0540.0940.5420.4240.453
Table 5 - Geochemical analyses for the bedrock samples. The samples were analysed by Actlabs Limited, Ancaster, Ontario.

only exceptions being weak, 217-251 ppm Cu anomalies in the two chert samples from Hole 18,
reflecting the 0. l percent chalcopyrite observed in this chert, and 418 ppm Ni in the pyroxenite of Hole
17, reflecting the presence of Ni-scavenging orthopyroxene and olivine in the pyroxenite at the time of
crystallization.
4.2 Overburden Stratigraphy
The glacigenic sediment and surficial peat layers intersected in the drill holes are shown on Sections A-
A' to C-C1 (Figs. 11 to 13) and the section lines are shown on Plan 1.
The bedrock surface is flat to gently undulating and thus, during the final SSE ice flow event, afforded
little protection to unconsolidated sediments generated by earlier, southwesterly ice flow. Consequently
only young Matheson Till and associated esker gravel and varved Lake Ojibway clay, silt and fine sand
are present. The till typically forms a 2-10 m thick blanket over the bedrock but is locally moulded into
thicker drumlinoid ridges that rise through the clay cover and impart a SSE grain to the otherwise flat
surface topography (Plan 1). It is also variably interlayered with the clay, silt, sand and gravel,
reflecting the fact that ice meltdown and till deposition occurred in Lake Ojibway. The deep lake water
added buoyancy to the ice sheet. Instead of melting steadily northward, the ice front became mobile,
repeatedly overriding the initial till and sediment layers on the lake bottom and topping them with new,
similar layers. The texture of the individual till layers oscillates considerably from clayey to sandy
depending on the nature of the overridden sediments.
4.3 Gold Grain Counts
Most of the till samples yielded one to eight gold grains (Table 6, Appendix C). The maximum
concentration is fifteen grains and some samples yielded no gold grains. The gold grain concentration in
thick till sections does not change significantly from top to bottom (Figs. 11 to 13) and more than 90
percent of the grains are reshaped (i.e. far travelled; Fig. 8). Therefore the 0-15 grain level simply
represents the regional gold background, and no anomalies are present.

West
P'j
1o
East
A'
4-. 835-
t""
—— -.- BOULDER MINING CORPORATION l
vm un ama PWOJICT. Oncun it
t otcuunai EMU. SKTKH *-A |

West
7c
East T .
B'
01
tip-- *-
CORPORATKJW
West
7c
East
c'
LSSWD tufanM17 Stntlfreptly
T•••i *B in td*?
CD
n ~
BOULDER MINING CORPORATIONTC9T IUX ABtTTBI PROJWT. ONTABO
cmcuunoM mau. stcncm c-c' oviBBUrow Dmumj muoocmr umrro

-31 -
Sample NumberNumber of Visible Gold Grains
Total Reshaped Modified Pristine
Nonmag HMC
Weight(g)
Calculated PPB Visible Gold in HMC
Total Reshaped Modified Pristine
WLAP-02-02-01WLAP-02-02-02WLAP-02-02-03WLAP-02-02-04WLAP-02-03-01WLAP-02-03-02WLAP-02-03-03WLAP-02-04-01WLAP-02-04-02WLAP-02-04-03WLAP-02-04-04WLAP-02-04-05WLAP-02-05-01WLAP-02-05-03WLAP-02-05-05WLAP-02-05-07WLAP-02-05-09WLAP-02-05-11WLAP-02-05-13WLAP-02-05-15WLAP-02-05-16WLAP-02-05-17WLAP-02-05-18WLAP-02-05-19WLAP-02-05-20WLAP-02-05-21WLAP-02-06-01WLAP-02-06-02WLAP-02-06-03WLAP-02-06-04WLAP-02-06-05WLAP-02-06-06WLAP-02-06-07WLAP-02-08-01WLAP-02-08-02WLAP-02-08-03WLAP-02-08-04WLAP-02-08-05WLAP-02-08-06WLAP-02-08-07WLAP-02-08-08WLAP-02-09-01WLAP-02-09-03WLAP-02-09-05WLAP-02-09-07WLAP-02-09-09WLAP-02-09-11WLAP-02-09-13WLAP-02-09-15
21234121343031444470393674111921112234586812133586
20234121342021344470293663111821112224586812123586
0100000000101100000100011000100000010000000010000
0000000000000000000000000000000000000000000000000
145.557.520.318.724.724.723.211.329.928.420.423.024.947.936.423.829.229.833.046.333.627.224.833.038.111.239.548.940.043.731.035.044.842.736.021.843.342.844.043.238.831.439.051.334.644.338.836.134.1
31
1614584115243314345
3410
49265536650
3020
42865881
10154718
1051361258
112839154310948759277141396334118
30
1614584115243314345
3370
48244536650
3020108658818954718
1031361258
112891543109487592.77
131396334118
0100000000401
210000032000
1110002000000
290000000010000
0000000000000000000000000000000000000000000000000
Table 6 - Gold grain summary for the till and gravel samples with calculated visible gold assay values for the nonferromagnetic heavy mineral fraction. Page l of 2.

-32-
Sample NumberNumber of Visible Gold Grains
Total Reshaped Modified Pristine
Nonmag HMC
Weight(g)
Calculated PPB Visible Gold in HMC
Total Reshaped Modified Pristine
WLAP-02-09-16WLAP-02-09-17WLAP-02-09-18WLAP-02-09-19WLAP-02-09-20WLAP-02-10-01WLAP-02-10-03WLAP-02-10-05WLAP-02-10-07WLAP-02-10-08WLAP-02-10-09WLAP-02-10-10WLAP-02-10-11WLAP-02-11-01WLAP-02-12-01WLAP-02-12-03WLAP-02-12-05WLAP-02-12-07WLAP-02-12-09WLAP-02-12-10WLAP-02-12-11WLAP-02-12-12WLAP-02-12-13WLAP-02-12-14WLAP-02-13-01WLAP-02-13-02WLAP-02-14-01WLAP-02-14-02WLAP-02-15-01WLAP-02-15-02WLAP-02-15-03WLAP-02-15-04WLAP-02-15-05WLAP-02-16-01WLAP-02-16-02WLAP-02-16-03WLAP-02-16-04WLAP-02-16-05WLAP-02-17-01WLAP-02-17-02WLAP-02-17-03WLAP-02-18-01WLAP-02-18-02WLAP-02-18-03WLAP-02-18-04WLAP-02-18-05WLAP-02-18-06WLAP-02-18-07
83135235453300131310218472643315301035873028401242
7313523545330013131021845264331530935853008401242
100000000000000000000000200000000100020020000000
000000000000000000000000000000000000000000000000
41.945.529.963.687.238.741.445.337.529.633.035.113.245.533.722.335.029.022.540.534.948.854.252.535.950.139.538.240.638.848.045.565.544.734.340.0104.359.485.2125.?103.395.983.262.470.9126.0100.288.1
339615554588890187284002
212
494038394381149
2,738181756410501027545823001
403901
5422212
2896
15554
588890187284002
212
494038394351149
2,738181756410461027545753000
4039'
01
5422212
500000000000000000000000300000000400060010000000
000000000000000000000000000000000000000000000000
Table 6 - Gold grain summary for the till and gravel samples with calculated visible gold assay values for the nonferromagnetic heavy mineral fraction. Page 2 of 2.
-33-
4.4 Kimberlite Indicator Mineral Counts
The glacial sediments in contact with the magnetic kimberlite targets at Holes 17 and 18 on the northern satellite claim block consist of till interdigitated with esker sand/gravel (Fig. 13). Ten samples of these sediments were processed for kimberlite indicator mineral grains (Table 7). No indicator minerals were found.
4.5 Mineralogy and Geochemistry of the Heavy Mineral Fraction of the Till
The regional heavy mineral assemblages of the till/gravel samples from Holes 17 and 18 on the northern satellite claims were recorded (Table 8) while logging the concentrates for kimberlite indicator minerals. The main minerals present are paramagnetic almandine and hornblende and nonparamagnetic diopside and epidote. The unlogged heavy mineral concentrates from the main claim block probably have essentially the same mineralogy because their gold grain content is the same. However, since the latter concentrates were geochemically analyzed and the analytical package included sulphur (Table 9), the pyrite content of the concentrates can be estimated. Most samples yielded ^ percent sulphur but a few yielded 5-30 percent, indicating the presence of 10 to 60 percent pyrite.
To be considered anomalous in gold, a heavy mineral concentrate must yield M 000 ppb Au. Furthermore, the anomaly must be caused by ten or more small, pristine to modified (i.e. little-travelled; Fig. 8) gold grains or by gold hidden in sulphide minerals, not by one or two large, reshaped gold grains. Four Au anomalies MOOO ppb (Table 9) were obtained from the analysed till samples (i.e. samples
collected on the main claim block). These anomalies are in Samples 05 (l 100 ppb) and 07 (l 060 ppb) from Hole 06, Sample 19 from Hole 09 (l 050 ppb) and Sample 02 from Hole 14(1970 ppb). However,
none are genuine anomalies. The strongest anomaly, in Hole 14, had been forecast (Table 6, Appendix C), on the basis of a large gold grain that was observed when the sample was processed. Similar large gold grains were not observed in the other three samples but nevertheless are inferred to have been present because the anomalous samples are bracketed by barren samples (Figs. 11,12) and also yielded low sulphur analyses, indicating that the gold is not hidden in sulphide minerals. Furthermore, the Au is not accompanied by anomalous As, Ag, Cu, Zn or Pb; indeed all analyzed metals occur at low concentrations throughout the till on the main claim block.

Sample Number
WLAP-02-17-01WLAP-02-17-02WLAP-02-17-03WLAP-02-18-01WLAP-02-18-02WLAP-02-18-03WLAP-02-18-04WLAP-02- 18-05WLAP-02-18-06WLAP-02-18-07
<2.0 mm Table Concentrate
Total
1,021.21,243.3
617.3494.5690.7484.1426.3799.3760.2419.0
Heavy Liquid Separation S.G 3.20
Heavy M Liquid ™g U9hls HMC
910.5 25.51,076.6 41.4
460.1 53.9383.6 15.0595.6 11.9410.9 10.8345.6 9.8631.3 42.0641.1 18.9319.7 11.2
Nonferromagnetlc HMC
Total ^.25 mm -0.25 0.25 to 0.510 1.010 (wash) mm 0.5mm 1.0mm 2.0mm
85.2 1.6 38.3 22.7 16.5 6.1125.3 3.3 63.9 29.3 22.3 6.5103.3 1.7 49.3 27.6 18.2 6.595.9 0.9 71.8 14.2 6.7 2.383.2 0.5 66.7 10.4 4.3 1.362.4 0.9 49.6 7.9 3.7 0.370.9 0.5 55.5 9.9 4.0 1.0
126.0 2.6 77.9 26.3 13.9 5.3100.2 1.2 74.5 14.1 8.0 2.4B8.1 0.6 75.1 7,8 3.8 0.8
Selected PseudoKIMs
1.0-2.0 0.5-1.0 0.25-0.5 mm mm mm
Low-Cr Low-Cr Low-Cr diopside diopside diopside
005
002
0020020020 1 30 0 10050 0 1005
KIM Count
1.0 to 2.0 mm
GP GO DC IM CR FO
000000000000000000000000000000000000000000000000000000000000
0.5 to 1.0mm
GP GO DC IM CR FO
000000000000000000000000000000000000000000000000000000000000
0.25 to 0.5 mm
GP GO DC IM en FO
000000000000000000000000000000000000000000000000000000000000
Total KIMs
0000000000
U)
Table 7 - Heavy mineral concentrate weights and KIM abundances for the medium (0.25-0.5 mm), coarse (0.5-1.0 mm) and very coarse (1.0-2.0 mm) sand fractions of the till and gravel samples front the satellite claims. GP = purple Cr-pyrope garnet; GO = orange CR-poor pyrope or eclogitic pyrope-almandine garnet; DC - Cr-diopside; IM = Mg-ilmenite; CR zr chromite and FO = forsterite olivine.

-35-
Sample No. Heavy Mineral Assemblage
WLAP-02-17-01 WLAP-02-17-02 WLAP-02- 17-03 WLAP-02-18-01 WLAP-02- 18-02 WLAP-02- 18-03 WLAP-02- 18-04 WLAP-02- 18-05 WLAP-02- 18-06 WLAP-02-18-07
Almandine-hornblende/diopside-epidote assemblage. Almandine-hornblende/diopside-epidote assemblage. Almandine-hornblende/diopside-epidote assemblage. Almandine-hornblende/diopside-epidote assemblage. Almandine-hornblende/diopside-epidote assemblage. Almandine-hornblende/diopside-epidote assemblage. Hornblende-almandine/diopside-epidote assemblage. Augite-hornblende/epidote-diopside assemblage. Almandine-hornblende-augite/epidote-diopside assemblage. Almandine-hornblende-augite/epidote-diopside assemblage.
Table 8 - Major nonferromagnetic heavy minerals present in the till and gravel samples from the satellite claims. The assemblage almandine-homblende/diopside-epidote indicates that only four major minerals are present, with almandine exceeding hornblende in the paramagnetic (O.8 amp) fraction and diopside exceeding epidote in the nonparamagnetic (M.O amp) fraction. Only the pale green, white and orange varieties of epidote are nonparamagnetic; common pistachio-green epidote reports to the neutral (0.8-1.0 amp) fraction and is not included in the mineral assemblage.

-36-
SAMPLE
WLAP-02 02-01WLAP-02 02-02WLAP-02 02-03WLAP-02 02-04WLAP-02 03-01WLAP-02 03-02WLAP-02 03-03WLAP-02 04-01WLAP-02 04-02WLAP-02 04-02WLAP-02 04-03WLAP-02 04-04WLAP-02 04-05WLAP-02 05-01WLAP-02 05-03WLAP-02 05-05WLAP-02 05-07WLAP-02 05-09WLAP-02 05-11WLAP-02 05-1 3WLAP-02 05-1 5WLAP-02 05-1 6WLAP-02 05-1 7WLAP-02 05-1 7WLAP-02 05-1 8WLAP-02 05-1 9WLAP-02 05-20WLAP-02 05-21WLAP-02 06-01WLAP-02 06-02WLAP-02 06-03WLAP-02 06-04WLAP-02 06-05WLAP-02 06-06WLAP-02 06-07WLAP-02 08-01WLAP-02 08-02WLAP-02 08-03WLAP-02 08-03WLAP-02 08-04WLAP-02 08-05WLAP-02 08-06WLAP-02 08-07WLAP-02 08-08WLAP-02 09-01WLAP-02 09-03WLAP-02 09-05WLAP-02 09-07WLAP-02 09-09
INA Mass
(g)62.654.517.315.621.621.720.2
8.326.8
(Rerun)25.317.420.021.844.833.320.726.126.729.943.230.524.1
(Rerun)21.729.935.0
9.636.345.836.840.627.931.941.639.632.918.8
(Rerun)40.339.841.040.235.828.436.048.431.641.3
Au As Ag Cd Cu Mn Mo Nl Pb Zn ppb ppm ppm ppm ppm ppm ppm ppm ppm ppm
-51389
72377
125606
-560
30952
3125
38690
12943
446103649
263
4572-5-5
84430
288252
110030
10601252444
2256487248-5-580-512
795915274243203118
1642302816152514138
102250
8015203913201420179
1822
618
13-29
-1141210111211
-0.2-0.2-0.2-0.2-0.2-0.2-0.2-0.2-0.2-0.2-0.2-0.20.3
-0.2-0.2-0.2-0.2-0.2-0.2-0.2-0.2-0.20.7
-0.2-0.2-0.2-0.2-0.2-0.2-0.2-0.2-0.2-0.2-0.2-0.2-0.2-0.2-0.2-0.2-0.2-0.2-0.2-0.2-0.2-0.2-0.2-0.2-0.2-0.2
-0.5-0.5-0.5-0.5-0.5-0.5-0.5-0.5-0.5-0.5-0.5-0.5-0.5-0.5-0.5-0.5-0.5-0.5-0.5-0.5-0.5-0.5-0.5-0.5-0.5-0.5-0.5-0.5-0.5-0.5-0.5-0.5-0.5-0.5-0.5-0.5-0.5-0.5-0.5-0.5-0.5-0.5-0.5-0.5-0.5-0.5-0.5-0.5-0.5
33671041899389
106101115
14664674433751
126343335505150
1054252
123232935196827132921393033201553417640392530
132201267161
81125193189208229258328343268
545784
10212817224224827627826419259987096
140191271341362356284208
6588
114157237347458425404411229
7346-2-2-22
-2245623
-2-2-2-2-2-2-2-2-2-2-22
-2-23
-2-2-2-2-2-2-2-2-2-2-2-2-2-2-2-2-2-2-2-2-2
6234
932
10689526916161661
15336342431422618203144515364388822313028
14824172416181617191622244524251917
187
1512151614161321141721181312251920141716171515121627101113142126212017181010111516191717232414
1323
1823224526
324
2656
61624168857
20172611203937
81323
5117578638
125
1789
12566
S"/o
27.08619.3320.3561.9072.4804.1431.2822.9202.2852.7802.6882.8686.7341.6381.0340.8921.2931.6640.8210.6310.7461.1872.1802.4852.9621.5291.2163.7880.8011.3751.9521.0502.7490.8390.5270.8380.5630.8180.6090.5840.6640.5250.8221.0181.5290.7320.7600.5970.705
Table 9 - Geochemical analyses for the -2.0 mm nonferromagnetic heavy mineral fraction of the till samples from the main claim block. The samples were analyzed by Actlabs Limited, Ancaster, Ontario. Samples from the satellite claims were not analyzed. Page l of 2).

-37-
SAMPLE
WLAP-02 09-11WLAP-0209-13WLAP-02 09-1 5WLAP-02 09-1 6WLAP-02 09-1 7WLAP-02 09-1 8WLAP-02 09-1 9WLAP-02 09-20WLAP-02 10-01WLAP-02 10-03WLAP-02 10-05WLAP-02 10-07WLAP-02 10-08WLAP-02 10-08WLAP-02 10-09WLAP-02 10-10WLAP-02 10-11WLAP-02 11 -01WLAP-02 12-01WLAP-02 12-03WLAP-02 12-05WLAP-02 12-07WLAP-02 12-09WLAP-02 12-10WLAP-02 12-11WLAP-02 12-12WLAP-02 12-13WLAP-02 12-1 4WLAP-02 12-1 4WLAP-02 13-01WLAP-02 13-02WLAP-02 14-01WLAP-02 14-02WLAP-02 15-01WLAP-02 15-02WLAP-02 15-03WLAP-02 15-04WLAP-02 15-05WLAP-02 16-01WLAP-02 16-02WLAP-02 16-03WLAP-02 16-04WLAP-02 16-04WLAP-02 16-05
INA Mass
(g)35.833.131.139.042.426.960.660.235.738.442.334.526.6
(Rerun)30.032.110.242.530.719.332.026.019.537.531.945.851.349.5
(Rerun)33.047.136.535.137.635.945.142.562.641.731.337.062.6
(Rerun)56.5
Au As Ag ppb ppm ppm
41186180118
3039
10507849408079
954
68-564-515-5
40762-58
46325243
10136
141970
1491765-5-550
210858
-5
270
116
199
14128
-22217121316
141416-212-26
12-271
160113050
2624101122161217-217183918
14
-0.25.5
-0.2-0.2-0.2-0.2-0.2-0.2-0.2-0.2-0.2-0.2-0.2-0.2-0.2-0.2-0.2-0.2-0.2-0.2-0.2-0.2-0.2-0.2-0.2-0.2-0.2-0.2-0.2-0.2-0.2-0.2-0.2-0.2-0.2-0.2-0.2-0.2-0.2-0.2-0.2-0.2-0.2-0.2
Cd ppm
-0.5-0.5-0.5-0.5-0.5-0.5-0.5-0.5-0.5-0.5-0.5-0.5-0.5-0.5-0.5-0.5-0.5-0.5-0.5-0.52.0
-0.5-0.5-0.5-0.5-0.5-0.5-0.5-0.5-0.5-0.5-0.5-0.5-0.5-0.5-0.5-0.5-0.5-0.5-0.5-0.5-0.5-0.5-0.5
Cu Mn Mo Ni Pb Zn ppm ppm ppm ppm ppm ppm
211828132852591944503927
36879592725
329151325253954
10137454552554921462728
241513459
158304646
264217216182166150114826462
19223828523920921319115596655965
236271305301310317287225196110
81280393398377325374402319329236195
-2-2-2-2-2-2-2-2-2-2-2-2-2-2-2-2-2-2-2-2-2-2-225-282
-24
-2-2-2-2-26
-2-2-2-24
-2-2-2-2
1727181718223918212119193032221839
92322181718356133353629252230274735376031384570474347
1316181616151611109
1821221716162714139
209
13181617171919161513101315211618161923241818
65
1655
1216
4146
121111186
1229-1146
31539
173123241234
91114126864
453
2719
115
S"/o
0.5600.6950.6940.5600.5171.1221.3460.3930.8520.7560.7200.7331.1621.2500.8350.6881.7070.4790.7590.5860.4950.6310.647
16.1041.4511.2601.4381.3861.2731.1161.3100.9590.8661.7751.4790.9971.3290.5671.6792.4097.4491.6591.7761.430
Table 9 - Geochemical analyses for the -2.0 mm nonferromagnetic heavy mineral fraction of the till samples from the main claim block. The samples were analyzed by Actlabs Limited, Ancaster, Ontario. Samples from the satellite claims were not analyzed. Page 2 of 2).

-38-
5. CONCLUSIONS AND RECOMMENDATIONS
The reverse circulation drill holes on the main claim block of the West Lake Abitibi Property were targeted on the contact between the Scapa turbidites and Stoughton - Rocquemaure komatiites based on the assumptions that l) this overburden-covered contact is further north than previously thought and thus is virtually unexplored, and 2) the contact represents the western extension of the gold-fertile Lake Abitibi Deformation Zone. The drilling has verified the northerly location of the contact but has also demonstrated that the contact is unsheared, unaltered and unmineralized and therefore is probably a normal, conformable contact. Furthermore, the till overlying the contact contains only background levels of gold grains and its heavy mineral fraction, although locally enriched in pyrite, is not anomalous in gold or any of the usual gold-associated metals. Therefore no further exploration is warranted along or up-ice (north) of the contact. However, the Lake Abitibi Deformation Zone could alternatively follow a formational conductor within the komatiites on the southern edge of the property as originally proposed by Pyke et al. (1972). This regional-scale conductive zone resembles the one associated with the structurally incompetent graphitic mudstones that host the productive Casa Berardi Fault in Quebec (Pattison et al. 1986). The deformation/alteration zone at Casa Berardi is up to l km wide and is flanked by additional, outlying shear zones. Therefore the Lake Abitibi Deformation Zone, if it is indeed present on the West Lake Abitibi Property, should be of a sufficient scale to have been intersected during diamond drilling programs previously conducted in the area. It is recommended that all available diamond drill hole logs be scrutinized for evidence of the deformation zone and associated mineralization before contemplating any further gold exploration on the property.
The two reverse circulation drill holes on the northern satellite claims were targeted on kimberlite- compatible aeromagnetic anomalies. The drilling has shown that the western anomaly is caused by weakly magnetic pyroxenite. Nonmagnetic cherty sediments interleaved with mafic volcanics were intersected at the eastern anomaly but the drill hole was not centered on the anomaly. Therefore the anomaly is unexplained. It could be caused by a magnetite-bearing facies of the chert or mafic volcanics or by a second, smaller pyroxenite intrusion but it is definitely not due to kimberlite as no KIMs were obtained from the till and gravel overlying either magnetic anomaly. Kimberlite pipes normally occur in clusters or "fields" that produce major, regional-scale KIM dispersal plumes in the till. Therefore the total absence of KIMs at the targeted anomalies not only condemns these two anomalies but also all others for many kilometres up-ice. Consequently no kimberlite exploration is warranted on the other, untested satellite claim blocks of the West Lake Abitibi Property.

-39-
The only positive result of the reverse circulation drilling is the discovery of disseminated chalcopyrite mineralization in the cherty exhalites of Hole 18. The mineralization is very weak (only 200-300 ppm Cu) but the ratio of chalcopyrite to pyrite is appealing (1:10) and could signal proximity to economically significant volcanogenic massive sulphide mineralization. Although the area is thought to be underlain by monotonous Scapa turbidites, the overburden cover is so thick that the geology is essentially unknown. Felsic volcanics could be present and short, weak airborne electromagnetic anomalies occur several hundred metres to the north and south (Fig. 5). If found to be undrilled, these anomalies should be ground checked as potential volcanogenic massive sulphide targets.

-40-
6. Certificate - Stuart A. Averill
I, Stuart A. Averill, residing at 192 Powell Avenue, Ottawa, Ontario hereby certify as follows:
That I attended the University of Manitoba at Winnipeg, Manitoba and graduated with a B.Se. (Rons.) in
Geology in 1969;
That I have worked continuously in the field of mining exploration geology since 1971;
That I am President and principal owner of Overburden Drilling Management Limited, 107-15 Capella
Court, Nepean, Ontario, an independent geological consulting company that I founded in 1974;
That I am a Fellow of the Geological Association of Canada and a Member of the Association of
Professional Engineers and Geoscientists of Newfoundland;
That this technical report is based on data gathered on the subject property by Donald Holmes, a
geologist employed for 17 years by Overburden Drilling Management Limited;
That I personally interpreted the data;
That I directly and indirectly hold 110,000 and 70,000 share purchase warrants of Boulder Mining
Corporation.
"Stuart A. Averill"
Stuart A. Averill, B.Sc. (Mons.)
Dated at Ottawa, Ontario this 5 th day of June, 2002

-41 -
7. REFERENCES
Averill, S.A.2001: The Application of Heavy Indicator Mineralogy in Mineral Exploration with
Emphasis on Base Metal Indicators in Glaciated Metamorphic and Plutonic Terrains; in: Drift Exploration in Glaciated Terrain (Mcclenaghan, M. B., Bobrowsky, P. T., Hall, G. E. M. SL Cook, S. J., eds.), Geological Society, London, Special Publication No. 185, pp. 69-81.
Averill, S.A.,Mcclenaghan, M.B. ;1994: Distribution and Character of Kimberlite Indicator Minerals in Glacial Sediments, C14
and Diamond Lake Kimberlite Pipes, Kirkland Lake, Ontario; Geological Survey ofCanada, Open File 2819,48 p.
Ayer, J.A., i Berger, B.R., Trowell, N.F.1999: Geological Compilation of the Lake Abitibi Area, Abitibi Greenstone Belt; Ontario
Geological Survey, Map P.3398, scale 1:100 000.
Ferguson, S.A.,Freeman, E.B.1978: Milligan Township Float Train No. l - Au; in: Ontario Occurrences of Float, Placer Gold
and Other Heavy Minerals; Ontario Geological Survey, Mineral Deposits Circular 17, p.65.
Jackson, S.L.,Fyon, J.A.1991: The Western Abitibi Subprovince in Ontario; in: Geology of Ontario (P.C. Thurston,
H.R. Williams, R.H. Sutcliffe and G.M. Stott, eds.), Ontario Geological Survey, SpecialVolume 4, Part l, p. 405-484.
Ontario Geological Survey1989a: Airborne Electromagnetic and Total Intensity Survey, Detour - Burntbush - Abitibi Area,
Marathon, Bowyer, Moody, Galna, Kerrs Townships, District of Cochrane, Ontario; by Geoterrex Limited for the Ontario Geological Survey, Geophysical/Geochemical Series, Map 81243, scale 1:20,000.
1989b: Airborne Electromagnetic and Total Intensity Survey, Detour - Burntbush - Abitibi Area, Findlay, Henley, Marathon, Bowyer Townships, District of Cochrane, Ontario; by Geoterrex Limited for the Ontario Geological Survey, Geophysical/Geochemical Series, Map 81233, scale 1:20,000.

-42-
Osmani, LA,1991: Proterozoic Mafic Dyke Swarms in the Superior Province of Ontario; in: Geology of
Ontario (P.C. Thurston, H.R. Williams, R.H. Sutcliffe and G.M. Stott, eds.), OntarioGeological Survey, Special Volume 4, Part l, p. 661-681.
Pattison, E.F.,Sauerbrei, J.A.,Hannila, J.J.,Church, J.F.1986: Gold Mineralization in the Casa-Berardi Area, Quebec, Canada; Proceedings of Gold
'86 an International Symposium on the Geology of Gold: Toronto 1986, A.J.MacDonald (ed.), pp. 170-183.
Pyke, D.R., Ayres, L.D., Innes, D.G.1972: Geological Compilation Series: Timmins-Kirkland Lake, Cochrane, Sudbury and
Timiskaming Districts; Ontario Division of Mines, Map 2205, scale 1:253,440.
Sage, R.P.1996: Kimberlites of the Lake Timiskaming Structural Zone; Ontario Geological Survey, Open
File Report 5937, 435 p.
Thurston, P.C.1991: Geology of Ontario: Introduction; in: Geology of Ontario (P.C. Thurston, H.R. Williams,
R.H. Sutcliffe and G.M. Stott, eds.), Ontario Geological Survey, Special Volume 4, Partl, p. 3-25.

Appendix A
Reverse Circulation Drill Hole Logs

n -rp
OVERBURDEN DRILLING MANAGEMENT LIMITED REVERSE CIRCULATION DRILL HOLE LOG
HOLE NO WLAP-oi-ol LOCATION S'TE f L
GEOLOGIST H*L" e * DRILLER G.'WZ**- B | T NO..
SHIFT HOURS______TO -————
TOTAL HOURS
CONTRACT HOURS
MOVE TO HOLE r-V. npni f**-- "
npn i ER o."iys - 8 -— - ' 2 "-f /*
B(T
. 7-
MECHANICAL DOWN TIME .
DRILLING PROBLEMS OTHER"" **~^— e
MOVE TO MCXT HOLE tr*-**f .- ?vio /"r?
B'"TJ
f A G. E i
DEPTH IN
METRES APH LOG DESCRIPTIVE LOG
/\ A
A .
8-
9-
10-
13
14-
15-
w-i
17-
18
lao4
O - I-O
l, o-3i.o
S 'f "f"
c ley "-J Si/*'
.j.^-."^ -~ -
Arx^^KTi'J - oj /S"-*-

OVERBURDEN DRILLING MANAGEMENT LIMITED REVERSE CIRCULATION DRILL HOLE LOG
DATE 20:25-
SHIFT HOURS _____ TO
HOLE NOGEOLOGIST ——
MOVE TO HOLE .
DRILL ——————
LOCATIONDRILLER . . BIT NO.
.ELEVATION.BIT FOOTAGE .
TOTAL HOURS
CONTRACT HOURS
MECHANICAL DOWN TIME ,
DRILLING PROBLEMS ——
OTHER ———..—————-——
MOVE TO NEXT HOLE .
ZZ< enDESCRIPTIVE LOG
1B-
l 1 -:
3s-
A i
3*-.
39 A. 0
oA
EC. rt
i*1*: 02
:os
HI
s '"fi.
- 7
li."
.rfc/ j*. •5'"LL ? eft* .r-?'
r,y —— t

OVERBURDEN DRILLING MANAGEMENT LIMITED REVERSE CIRCULATION DRILL HOLE LOG
r , .HATF ' fB***A^y ^T pf) *~
SHIFT HOURSTO
TOTAL HOURS
CONTRACT HOURS
nni F NO UJ L A r- "i -02- mrATinw s.re*-t-RpninRiRT tfix-n#S ^ npru PB *Z~ot*yeA8- BIT Mn V^
Mnup m nni Fnnni Tl-J^'/o-.^o^/*,
DRII 1 INR PRORI FMS
OTHFP 1r*~c* 7;**-7:*.tS\
MflVF TD NEXT HHL.E
FI FVATION•^•i P |T pnnTAfic o-Vo.3
^/iw/W
DEPTH IN
METRESGRAPHIC
LOG MP NO.DESCRIPTIVE LOG
13
15
18-
u*/ ^ *— * ^
5- —— J y ^f.O-
; 7.0 -29. 5 ^rCjt^y
f.ft

OVERBURDEN DRILLING MANAGEMENT LIMITED REVERSE CIRCULATION DRILL HOLE LOG
DATE Fit HOLE N0 LOCATION .DRILLER , . BIT NO..
.ELEVATION. BIT FOOTAGE .
SHIFT HOURS______TO ———-
MOVE TO HOLE .
DRILL ——————
TOTAL HOURS
CONTRACT HOURS
MECHANICAL DOWN TIME .
DRILLING PROBLEMS ——-
OTHER -——————..———
MOVE TO NEXT HOLE .
DE I MEMP NO.
DESCRIPTIVE LOG
71-
73-
24-
27-
19 ~
94-
A
? 8-
31-0-31.03t*-?2.-
TILL
for, i
f-o — J
""X * 1-to f
•iftt fl""1 ''"* 4 ]i )!-~**t~*-
tr. /.——— ''
37.0 -"/0.3'tt

OVERBURDEN DRILLING MANAGEMENT LIMITED REVERSE CIRCULATION DRILL HOLE LOG
DATE ~A* 206Z-
SHIFT HOURS______TO ————.
TOTAL HOURS
CONTRACT HOURS
GEOLOGIST ""'
MOVE TO HOLE .
DRILL ———————
DR1LLER
MECHANICAL DOWN TIME .
DRILLING PROBLEMS ——.
OTHER ———————-.—
MOVE TO NEXT HOLE .
BIT NOELEVATION —.— BIT FOOTAGE ^ r-
//'jo -
DE I MEAMP NO.
DESCRIPTIVE LOO
A AA 0-/.0
10
13
19
l.o -/•.it," (f*y f -if -t
'"" Vftr
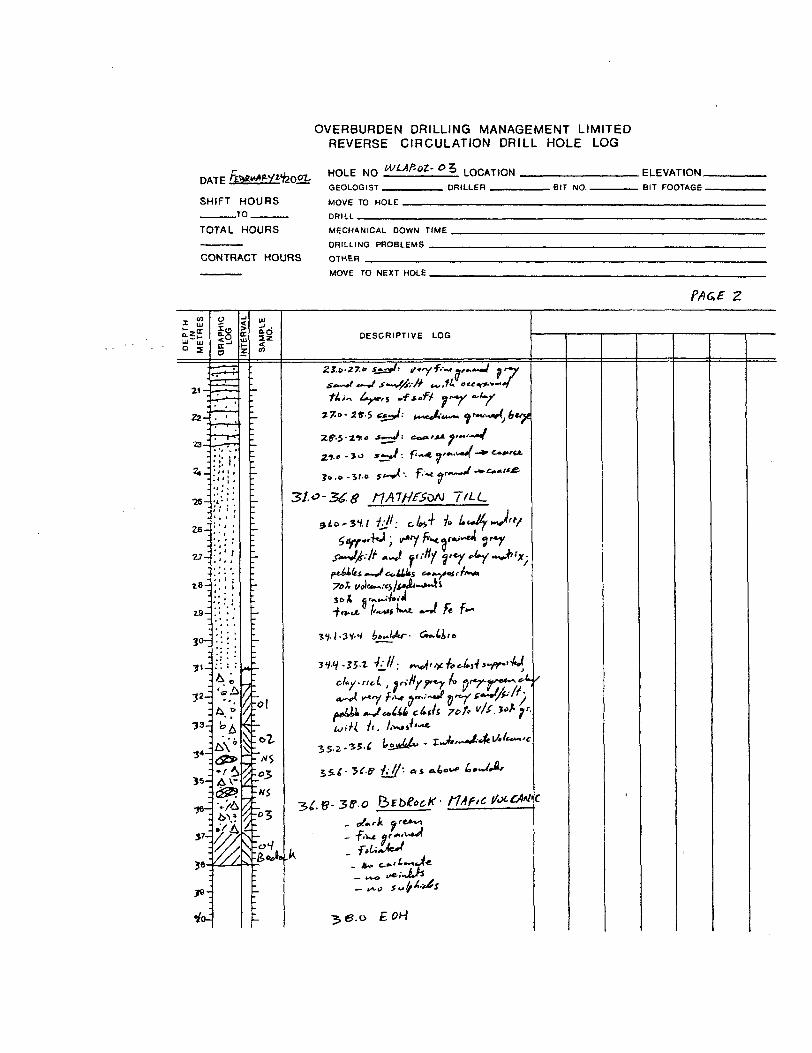
OVERBURDEN DRILLING MANAGEMENT LIMITED REVERSE CIRCULATION DRILL HOLE LOG
PATF FiVUfAf-^^ofT,
SHIFT HOURS Tn
TOTAL HOURS
CONTRACT HOURS
HOI F Kin wuir-oz-of, LOCATIONrscninRiRT ,, ,, ,, ,, . . nml i fa
MOVF TO HOI F ,
MECHANICAL DOWH TIME ,
nml 1 IIMR PRORI FMB , , ...||| ,. I|
OTHER
El PVATION
BIT wn ... PIT cnnTAnc
MOVE TO NEXT HOLE.
DEPTH IN
METRES GRAPHI LOG MP NO.
DESCRIPTIVE LOG
21-
22-
23
•24-
75-
Zfi-
tJ-
Z.9-
30-
•33- fi 4'r
/A
y-V
31-0-36.8
-l-ZI'-J i*-Wtr-
/.. A-•55.^ tj
•5 f.e" ^
. ff- 3ff".o
If.L
36.0

OVERBURDEN DRILLING MANAGEMENT LIMITED REVERSE CIRCULATION DRILL HOLE LOG
HOLE NO ^^f'02.' 0H LOCATION 5/T2 oV_______ ELEVATION.—————- GEOLOGIST Hv-ne-5 DRILLER jA***yz*6- BIT Mn lzy/65 BIT FOOTAGE ^e- 5 •' 1 'r-^
SHIFT HOURS______TO ————.
MOVE TO HOLE .
DRILL ———————
1VV?5S ^ - H7.5JJ:.~- Fe&t-t
TOTAL HOURS
CONTRACT HOURS
MECHANICAL DOWN TIME
DRILLING PROBLEMS —— OTHER Fe&.Zl
MOVE TO NEXT HOLE .
li DESCRIPTIVE LOG
18
O -l- 0
/.o . 21-0 cji

OVERBURDEN DRILLING MANAGEMENT LIMITED REVERSE CIRCULATION DRILL HOLE LOG
HATP fowW/Zlftnc.
SHIFT HOURSTO
t MOI F NH ^^^0
RpninniRT
MOVF TO HOI F ..,,...
nnin
^•^7 inCATinN. nnn i PR PIT un ...
EI FVATIONBIT FnnTARC
TOTAL HOURS
CONTRACT HOURS
MECHANICAL DOWN TIME ,
DRILLING PROBLEMS ———
OTHER .^^————-———
MOVE TO NEXT HOLE .
0 Sli
MPLE NO.
DESCRIPTIVE LOG
21
2*-.
23-
•aH
27-
26-
Z.9
30-
rt"^* 7fa.
LAyztEb
-fJ d*?-
f-'
y,. /^,. Fef—A
3*z-*'-*lne*\-i
y "7

OVERBURDEN DRILLING MANAGEMENT LIMITED REVERSE CIRCULATION DRILL HOLE LOG
OATF f^A^^^y^o0
SHIFT HOURS tn
HOI F NO W^r-^Z-
r.fnt nrsiRT .,. ,
uni/F m nni F ^
ppn i
"^ LOCATION
. poi| i PP , . ,, PIT un
FI FVATION
PIT conTArsc
TOTAL HOURS
CONTRACT HOURS
MECHANICAL DOWN TIME
DRILLING PROBLEMS ———
OTHER ———^^.—^^—.
MOVE TO NEXT HOLE .
DEPTH IN
METRES GRAPHI LOG DESCRIPTIVE LOG
V4 -A-'.
13-
17—
18-
18 "
20^
~-yx*-aA*y . o.S~ w-r
-V
rv./.- A. fr.f-
W.o-
ftmr
17.5

OVERBURDEN DRILLING MANAGEMENT LIMITED REVERSE CIRCULATION DRILL HOLE LOG
DATE
SHIFT HOURS______TO —————
TOTAL HOURS
CONTRACT HOURS
HOLE NO LOCATION ELEVATION
MOVE TO HOLE .DRILL ———^——
MECHANICAL DOWN TIME
DRILLING PROBLEMS ———
OTHER _____________i
MOVE TO NEXT HOLE .
iaujUJ ujo z
ia.z\
GRAPHI LOG DESCRIPTIVE LOG
A //l
/\ S
i'!
-A(J
A " 'o^
12-
13-
'-&- 0
•A : 0 7
o A
20^ A
o-l.o
fti"l j
ra L
''~d
V^A t/-- /-

OVERBURDEN DRILLING MANAGEMENT LIMITED REVERSE CIRCULATION DRILL HOLE LOG
PlflTF fGifHMflfy
SHIFT HOURSTO
t nni p NO WUtr.r.cninftisT
MOVE TO HOI F ...,ntji(l
07 -f o inr-ATinwnnn i CD BIT wn
EIFVATinivl
RIT FnnTARC
TOTAL HOURS
CONTRACT HOURS
MECHANICAL DOWN TIME .
DRILLING PROBLEMS ———
OTHER ——————————.
MOVE TO NEXT HOLE .

OVERBURDEN DRILLING MANAGEMENT LIMITED REVERSE CIRCULATION DRILL HOLE LOG
riATP kte**f-f i*200
SHIFT HOURS———— TO ____ —
TOTAL HOURS
^ nni F wn UfUtr-oi- "? , nr.ATiowrscninniRT ,, , , , , ... nnii i en
unup TO uni F
nnii i
MECHANICAL DOWN TIME . . ,.
FI F VAT ION
"'T NO , , . PIT Frv-iTirtC
CONTRACT HOURSDRILLING PROBLEMS
OTHER ,^——————
MOVE TO NEXT HOLE.
//K e 3DEPTH
IN METREGRAPHIC
LOG DESCRIPTIVE LOG
r-
/ . /~-
VB-
J3
zi•zz.
y*-JS-
Je-j
P-.
P-.
"j: ' t r' ' -.'ll-/ otc-~l*'~rX T *** '"- '
*y
iljfit iJoLC^tlC
5-3.0 E *

DATE fefl^tfg
OVERBURDEN DRILLING MANAGEMENT LIMITED REVERSE CIRCULATION DRILL HOLE LOG
HOLE NO MLAP-ot-o6 LOCATION s TE *l_______. ELEVATION.DRILLER . . BIT
SHIFT HOURS______TO ————-
MOVE TO HOLE
TOTAL HOURS
CONTRACT HOURS
MECHANICAL DOWN TIME
DRILLING PROBLEMS
OTHER ____" -7:00- i?'--v
MOVE TO NEXT HOLE
IT f Ac.
UJo
in
li01
DESCRIPTIVE LOG
18
19
20-
•tzr
- 2 J o '^""
c* r-y S
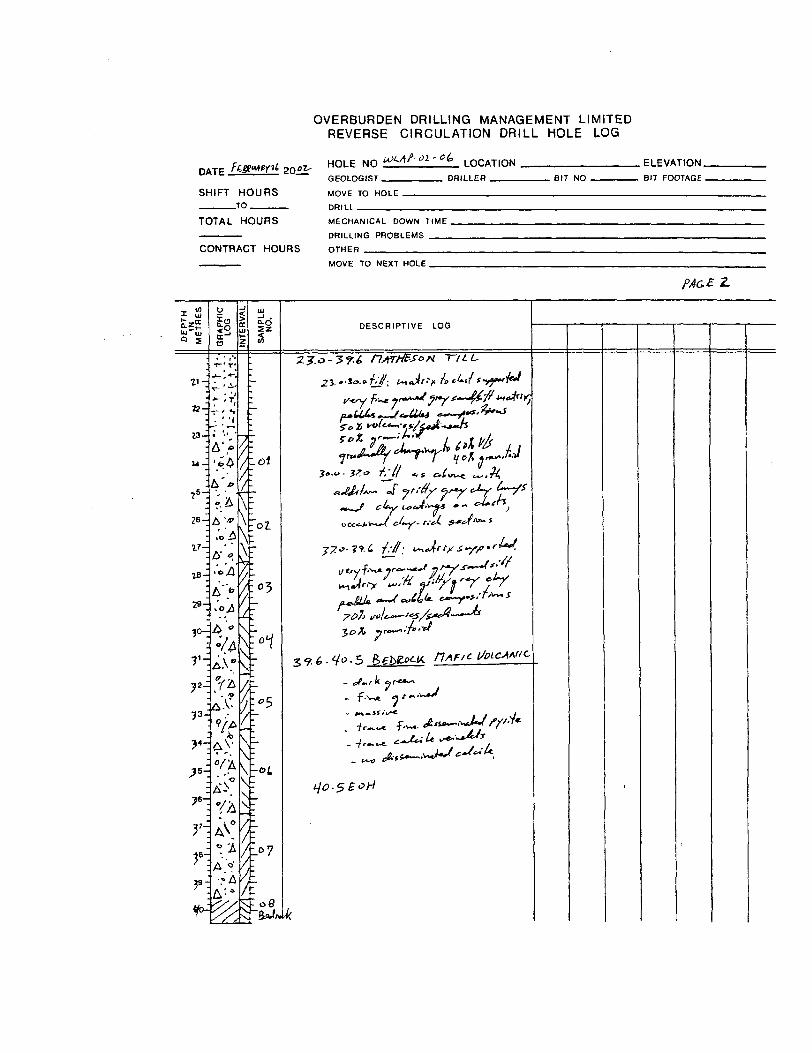
OVERBURDEN DRILLING MANAGEMENT LIMITED REVERSE CIRCULATION DRILL HOLE LOG
nATF ft.St***1-* 20"
SHIFT HOURSTO
nni F ND wt-W-npni onisT
nRFii
"2 '" fo .oCATinw. nml i en BIT NO ..
ELEVATIONPIT FnnT40F
TOTAL HOURS
CONTRACT HOURS
MECHANICAL DOWN TIME .
DRILLING PROBLEMS ——
OTHER -———————^——
MOVE TO NEXT HOLE .

OVERBURDEN DRILLING MANAGEMENT LIMITED REVERSE CIRCULATION DRILL HOLE LOG
DATE;SHIFT HOURS____TO,———
HOLE. NOGEOLOGIST __Z
MOVE TO HOLE
DRILL ——————
inCATIONDRILLER BIT NO.
ELEVATIONBIT FOOTAGE
8"o An- t/-. i^
TOTAL HOURS
CONTRACT HOURS
MECHANICAL DOWN TIME
DRILLING PROBLEMS
OTHER —
MOVE TO NEXT HOLE .
DEPTH IN
METRESDESCRIPTIVE LOG
3-
10
16-
17-
18-
19 ~
20^
r ' T
.s- ?
-^e*
— ff
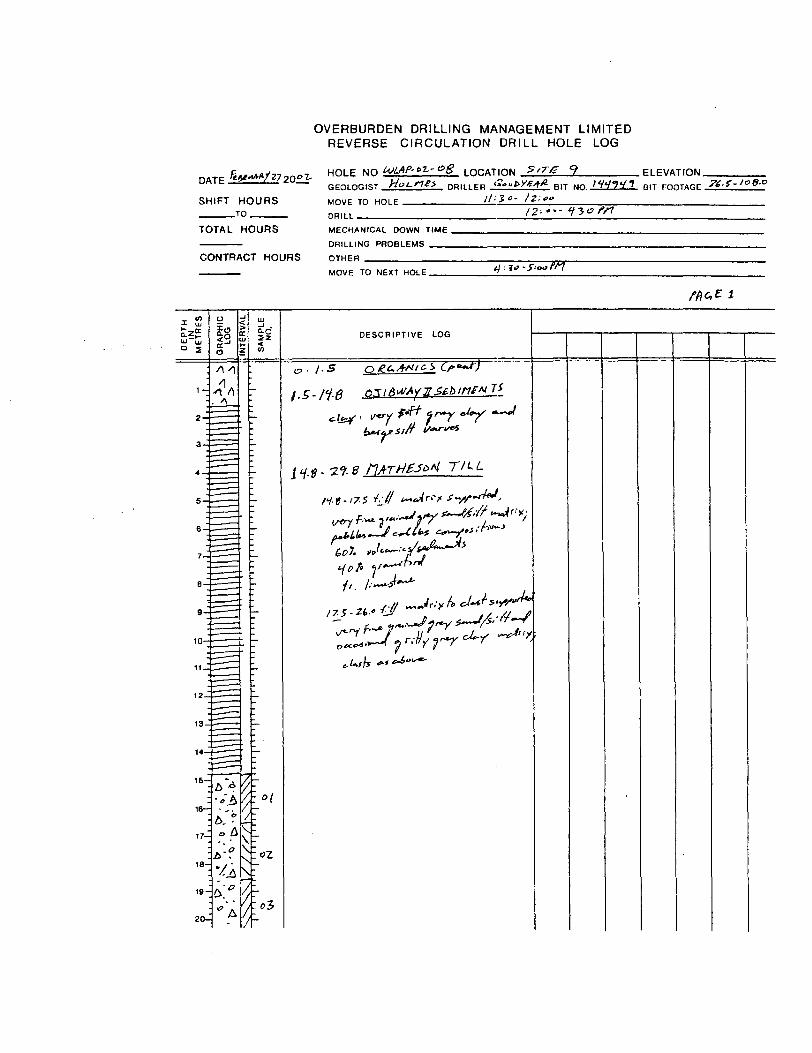
OVERBURDEN DRILLING MANAGEMENT LIMITED REVERSE CIRCULATION DRILL HOLE LOG
DATP 6*M*V2720 0 *-
SHIFT HOURSTO
TOTAL HOURS
CONTRACT HOURS
nni p NO WLAP- "Z.- OK IDEATION S'T/s Y FI PVATIONrjpninRisT HoL.1t* : npu i CH ^oobYK+fi- R1T Mn /W7V PIT cnnrinp ?6.S-lo8-c
Mnyp TO HOI c lT'%0- l2:ff"12-.—— t*** f*
MFCHANICAt DOWN TIME
nnni ING pRnm FMSOTHFR
MOUF TONFXTHOIE,. t) :1O - 5'oofn
DEPTH IN
METRESP O.
DESCRIPTIVE LOG
*A,
10
13
15-
16-
-.07.
20-
T
'.#- -Zt-8 r /^ L

OVERBURDEN DRILLING MANAGEMENT LIMITED REVERSE CIRCULATION DRILL HOLE LOG
nATP^T'*7 2oO
SHIFT HOURSTO
TOTAL HOURS
, M™ F wn ^^•"-oPmcATinuRcmnrsiRT , nnn i FB
unvp -rn uni P
PIRN r
MFCHANICAL HOWN TIMF ,
FI PVATIONKIT wn PIT FnnTARF
CONTRACT HOURSDRILLING PROBLEMS
OTHER -——.————..
MOVE TO NEXT HOLE .
DESCRIPTIVE LOG
"\
: "7
?1 -
/:
/ :
•?4 -
?8-
cJe-rl-
.,/ A
ji.S

OVERBURDEN DRILLING MANAGEMENT LIMITED REVERSE CIRCULATION DRILL HOLE LOG
SHIFT HOURS______ TO -———
TOTAL HOURS
CONTRACT HOURS
DRILL
MECHANICAL DOWN TIME
DRILLING PROBLEMS
OTHER - 7.7 tr~^re,*"-7:t*pSi fe^t-H C "3*-
MDUF TO NEKT HDLE
HI UJD 2
GBAPHI LOG DESCRIPTIVE LOG
A. A
10
15-
16-
18-
19-
20-
t
O'fi'/
-
O-O.5 le.*
0.3-13.0
•f. .-H.*
l-S.o-SS.5 TtU-
Y* t f—'ir. *
7*7, 5 aA -r
'

OVERBURDEN DRILLING MANAGEMENT LIMITED REVERSE CIRCULATION DRILL HOLE LOG
DATE
SHIFT HOURS
HOLE NOGEOLOGIST ———
MOVE TO HOLE .
DRILL —-,—-—
LOCATIONDRILLER . . BIT NO.
.ELEVATION. BIT FOOTAGE .
TOTAL HOURS
CONTRACT HOURS
MECHANICAL DOWN TIME ,
DRILLING PROBLEMS —-—.
OTHER --—.————.-..—
MOVE TO NEXT HOLE .
DE I MEMP NO.
DESCRIPTIVE LOG
a-
2J-
Z4-
26-
•9-j
79-
Xy
f ^ \\X0?
"7
-^7
-.Ay-i07
- lo
)8-
fiS
- Z f- 5 ; ne~~-'f*
•SZ.J.-32-* ^o
, / 60 l t,*(c*~"

OVERBURDEN DRILLING MANAGEMENT LIMITED REVERSE CIRCULATION DRILL HOLE LOG
SHIFT HOURS-————-TO —————
TOTAL HOURS
HOLE NOGEOLOGIST ——-
MOVE TO HOLE .
DRILL ———^——
LOCATIONDRILLER . . BIT NO. .
.ELEVATION.BIT FOOTAGE .
CONTRACT HOURS
MECHANICAL DOWN TIME .
DRILLING PROBLEMS ————
OTHER —————-.———.
MOVE TO NEXT HOLE .
DEPTH IN
METRESDESCRIPTIVE LOG
A -o' Z
i 1/
Y'-jV 6 -:
1*-.
V-.
i A*'
A ;
fO-A •o
P-
6v
o-S
55-5- /w MM
/x; -

OVERBURDEN DRILLING MANAGEMENT LIMITED REVERSE CIRCULATION DRILL HOLE LOG
HOLE NO tOCATlON .ELEVATION.DA E——————— — fjcninmsT S/vLlfS nan i FB tZw*yE##- n \r un l iV iff g HIT FnnyarsF '
SHIFT HOURS MOVE TO HAI c Fe^i-S /;3^-Z""XV7_______________________TO
TOTAL HOURS
CONTRACT HOURS
DRILL _
MECHANICAL DOWN TIME
DRILLING PROBLEMS
OTHER .
—^—^——————.——ip ~7:u*- e-y* /f/t
MOVE TO NEXT HOLE
DE I ME
SAMPLE NO.
DESCRIPTIVE LOG
10
13
1S
18-
20-^ '*7
- 15.6if*ry f^ff iw^-'jpfirf' fir* yc^JL (^**
is.i- w-t TtLL

OVERBURDEN DRILLING MANAGEMENT LIMITED REVERSE CIRCULATION DRILL HOLE LOG
p/vjF """* 'wni F NO ^L/tf-o^- 10 , nr. ATinN
20"^ ricroinnicT noil i CD PIT wn
ELEVAPIT pnr
TIONiTAnp
SHIFT HOURS unuprnunic
TO npin
TDTAI HOURS MFCHANICAL DOWN TIME
—————— nmii iNfi PRORIFMR
CONTRAHT HOURS rvmFR
. . MnVF TO NEXT HOLE
fA&E Z.
W~\u
0 s'.
71-
•22 -j
•23-
•J j ^
-
- 1
7.5-
Z6-
i
^^
j
^"i^2-
v-^4-
7
7e~
? 7-
je-
J9-
^
(J ^
iE m So 5
A"
KSA 'f ^t'A /
4 m- f
** f
o A/
A ' " S
"^
AO ^X
" *b ^
^
^,J' A
*.rc^"" - ^A'.' ''o K
A-?'o ^
*VA
UJ.J
<CO
- r
If-^ "
'l1 - >t ,ft -
-
foV
l 05:r^5-r:Lt~-/-t -' -/~ 07
i-^'7
\|
DESCRIPTIVE LOG
yi.o-jf.^^^Mf. c&.t.teit/ *J **@(
cJt&zT f**^^*fr*f' Gfr**.**- 1 ™
bc* t^L^Kt^
-*,z.?-~ "J 1-0 AV/: K^r.'x it cJ+ftftf*"s f. v^ c^--*^ y -^//Tj-*t^C^t^f 6f* ytle^^cs/^o^^
' t-ff'fff 1r"~'
- arc*J**jfy ^"'-ySS' ™*
7*t "A , jj oft ljfr'*~*'
fi

OVERBURDEN DRILLING MANAGEMENT LIMITED REVERSE CIRCULATION DRILL HOLE LOG
DATE on ,r 20.1J-
SHIFT HOURS
TOTAL HOURS
HOLE NOGEOLOGIST ———
MOVE TO HOLE .
DRILL———————
LOCATIONDRILLER . . BIT NO..
.ELEVATION.BIT FOOTAGE .
CONTRACT HOURS
MECHANICAL DOWN TIME .
DRILLING PROBLEMS ———
OTHER ————————————
MOVE TO NEXT HOLE .
DE I MEGRAPH LOG SAMP NO.
DESCRIPTIVE LOG
•H
fi f-
16-
6V.
{D
12-
13-
14-
16-
16-^
17-
18-]
19-j
20-^
J**/
ye-0
11: —— *
z-*f?''

OVERBURDEN DRILLING MANAGEMENT LIMITED REVERSE CIRCULATION DRILL HOLE LOG
r,ATC DATEHOLE N0
-0 2-11
SHIFT HOURS
TOTAL HOURS
TO
DRILLER t""
2--V- t:"^ fi. BIT
ELEVATIONBIT
CONTRACT HOURS
DRILL ——™-—-—————
MECHANICAL DOWN TIME .
DRILLING PROBLEMS ———
OTHER —————.——-—. f : o- . 7; J
TO NFXT HOLE
S AC, Z
DE I ME
GRAPHIC LOG DESCRIPTIVE LOG
AA
A *.
13-
14-
15-
16H
Av-
.M
'- /2-?
•try
.-y
"'
2 y- -y

OVERBURDEN DRILLING MANAGEMENT LIMITED REVERSE CIRCULATION DRILL HOLE LOG
DATE.
SHIFT HOURS______TO _____
HOLE NOGEOLOGIST ,,
MOVE TO HOLE .
DRILL ——————
- liLOCATION
DRILLER , . BIT NO..
.ELEVATION.BIT FOOTAGE .
TOTAL HOURS
CONTRACT HOURS
MECHANICAL DOWN TIME .
DRILLING PROBLEMS ———
OTHER ———..—.—^——.
MOVE TO NEXT HOLE .

OVERBURDEN DRILLING MANAGEMENT LIMITED REVERSE CIRCULATION DRILL HOLE LOG
DATEL 20±Z- HOLE N0 t"Lfff"ai ~ L2~ LOCATION Ssre 8
DRILLER
_____ ELEVATION. BIT MO /7V?7 g B | T
SHIFT HOURS______TO ————
TO HOLE .- V.'ou //"l
TOTAL HOURS
CONTRACT HOURS
MECHANICAL DOWN TIME .
DRILLING PROBLEMS ———
OTHER ___i
TO NEXT HOLE ,
B t T
x UJ
"•dlzw
DESCRIPTIVE LOG
3-T-
i 'A
17-^
18-H
19 H
2(H
*
e-5
5 .5- 12-So. S -2-
2.0- 12.
•h.
/r. A
•/r- fe f
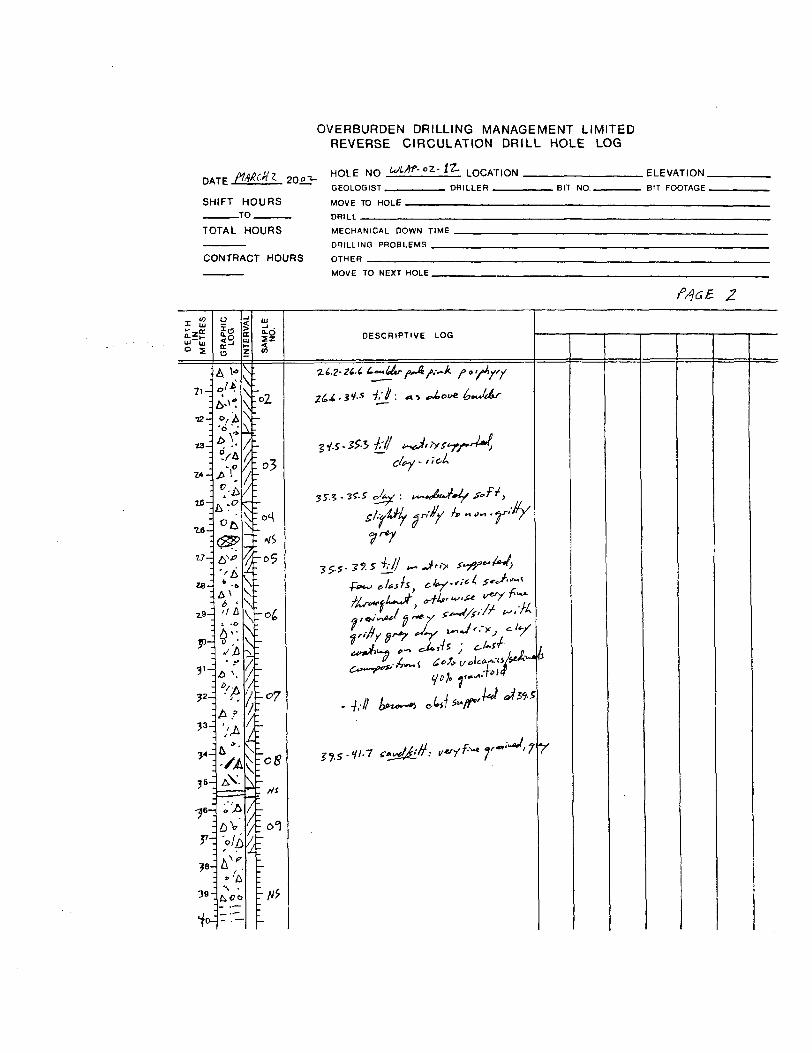
OVERBURDEN DRILLING MANAGEMENT LIMITED REVERSE CIRCULATION DRILL HOLE LOG
DATE 200-
SHIFT HOURS———TO ————TOTAL HOURS
HOLE NOGEOLOGIST ——
MOVE TO HOLE .
DRILL ———————
LOCATIONDRILLER . . BIT NO.,
.ELEVATION.BIT FOOTAGE .
CONTRACT HOURS
MECHANICAL DOWN TIME .
DRILLING PROBLEMS ———
OTHER -———-———————
MOVE TO NEXT HOLE .
DE I ME
O
O
DESCRIPTIVE LOG
/**
12-
TA-
2.zs-
2.9-
J2-
33-
^ 07
: fts
7-
je-
39
•H
I'll', a.*,
?. f
39-
A- " ^ -
r"'"^,?Y

DATE
OVERBURDEN DRILLING MANAGEMENT LIMITED REVERSE CIRCULATION DRILL HOLE LOG
HOLE NO WLAf-oZ- 12- LOCATION _______________ ELEVATION.
GEOLOGIST__________ DRILLER _________BIT NO.——————— BIT FOOTAGE.
SHIFT HOURS______ TO ———
MOVE TO HOLE ,
DRILL ———————
TOTAL HOURS
CONTRACT HOURS
MECHANICAL DOWN TIME .
DRILLING PROBLEMS ———
OTHER ——————————
MOVE TO NEXT HOLE .
DE I ME
GRAPHIC LOG
SAMPLE NO.
DESCRIPTIVE LOG
1 7-7- 4Z-1 W/:
jo 30}
t*-.
1S ~.
Y 8 -
rV8 -
i*-
K.o.K-7
Jtf
i'/
41.0.M-7 ^.7-15.0
y s- t r-* i ^.'M//~f
I- 5
ft.j* 511-52:
*7~.}B-
59 ~.
^
sz.i ^"/-'

OVERBURDEN DRILLING MANAGEMENT LIMITED REVERSE CIRCULATION DRILL HOLE LOG
DATE
SHIFT HOURS______TO.^———
GEOLOGIST .
MOVE TO HOLE .
DRILL ———————
inr.ATinN 5 /^DRILLER B | T NO
ELEVATION.7 B1T FOOTAGE O
O
TOTAL HOURS
CONTRACT HOURS
MECHANICAL DOWN TIME
DRILLING PROBLEMS
OTHER -30-MOVE TO NEXT HOLE .
2
DE I ME
GRAPHIC LOG DESCRIPTIVE LOG
A A
8-
9-
10-]
11 —
12-
13-
18
O - o-S
6.5'H-O ffblSl6*Tf
TILL.
e^t^w^ c*"*fc ' i
r- J \,^-L±A*tt~*-AS So A "al "^' ; /^
fO Jt/
V
v^-;r-7; t/./r-

OVERBURDEN DRILLING MANAGEMENT LIMITED REVERSE CIRCULATION DRILL HOLE LOG
DATE 20 oZ-
SHIFT HOURS_____TO ————
TOTAL HOURS
HOLE NO r; mi nn 1ST
MOVE TO HOLE .
DRILL —————.
' LOCATIONDRILLER . . BIT NO.
.ELEVATION.BIT FOOTAGE .
CONTRACT HOURS
MECHANICAL DOWN TIME , DRILLING PROBLEMS ———
OTHER ———^——.———.MOVE TO NEXT HOLE .
/'AC, f- Z
DE I ME
GRAPHIC LOG
SAMPLE NO.
DESCRIPTIVE LOG
1A-
\014-
•u-
of,
3H
..o A A '-PI
V
f:
-A
JS.(,
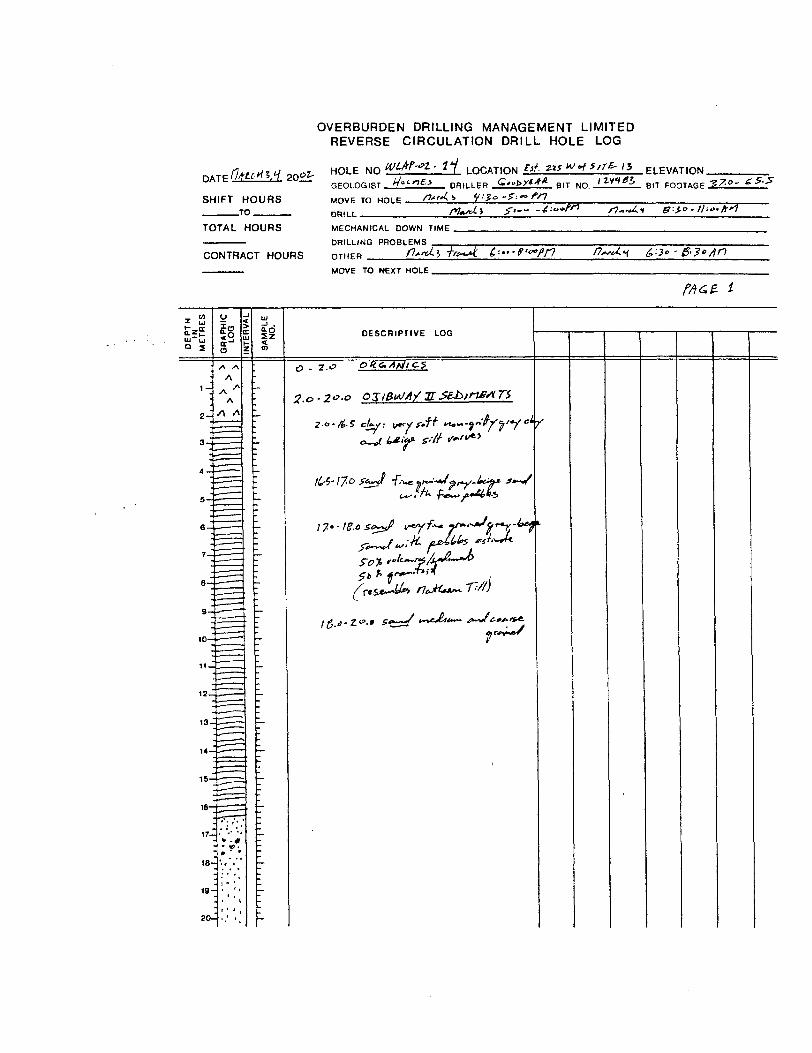
OVERBURDEN DRILLING MANAGEMENT LIMITED REVERSE CIRCULATION DRILL HOLE LOG
HOLE NO WLM-*t- i j LOCATION M. **s *f-tftrS-l* F , FVATlnNDA
SH
TF y litLL-K i,i. 20^^ ' -; r . J. . ' ' — ^ . . ..
IFT HOURSTO
TOTAL HOURS
npniOfiiRT /r-'-'/c.-' nnn i PR v.'*J^*'*A BIT kin ' iV'rfcS BIT FOCTTARP ^7-0- tf5--S"
nn,,, /^SU/i^J ^' — -•tio+frt rt~,^* &--ZO. ll-.a.frtl
MECHANICAL DOWN TIME. , .
nan L ING PRORI EMSCONTRACT HOURS OTHER /7-ii/J -/VaW i---f'o'Pn /3~*4f t,'-l* ' 6*J" A^
DEPTH IN
METRES
.
\-
2-
3-
4 -
5-
6-
7 —
8-
9-
10-
11 —
13-
14-
15-
16-
17-
18-
19
20-
o loSg0
/^ ^
y\
A
S\ A
—. — '*
-^ - ~- —. li"- 1 —. — i
j... — ~^. — - — "— —— "
— — — ' ' —
T
— — - —
^- — — ~
- ———
^ — — — — - -— - —— .— — — -^ —— .
^— — - — ' -— —— "
-— — —— ^-— —~
—
* .g' 'O '* * *
L
SAMPLE NO.
|~-
~r
'r
|-
^
UnUF TO NEXT HOLE ,,
DESCRIPTIVE LOG
xi . ? O OK.^At^lC.%
^.^.o oxMMv&to'VHr*
Zj uL gfffi *-"**
^* * ^?T" " -T-//IfreSe******' /lc**t***~- ' '"'
1 A f. 2.0. t S^y mfJUi~- ^-K/ c-fff*-
s
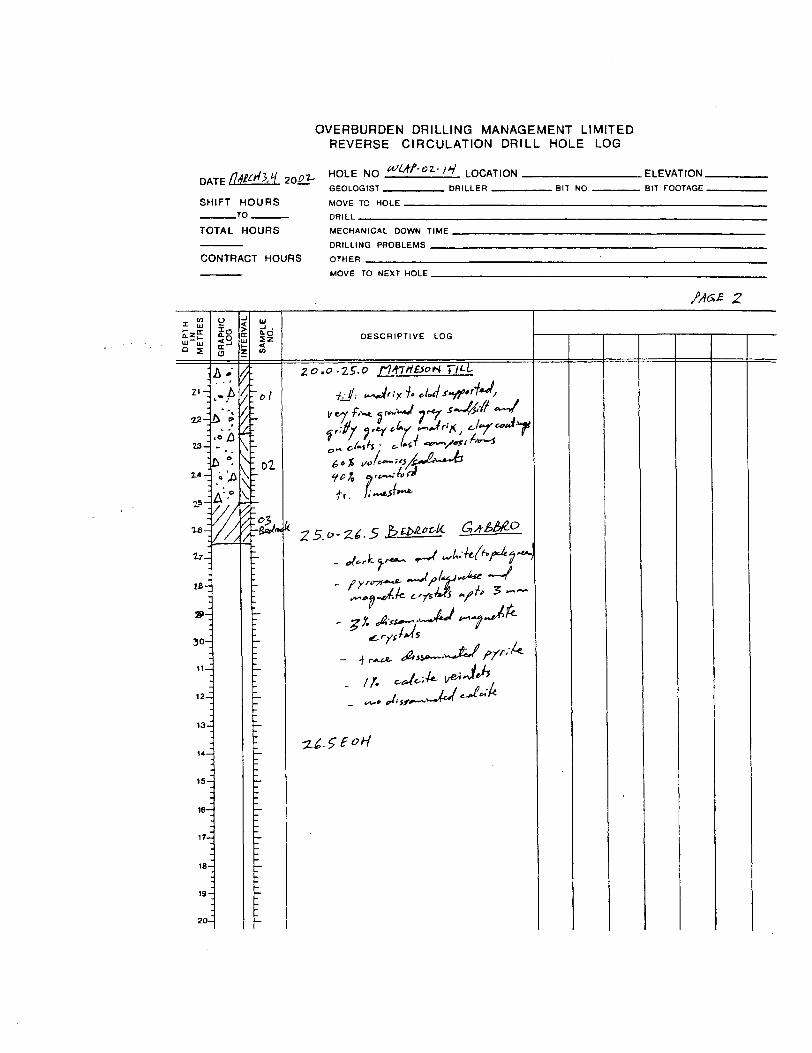
OVERBURDEN DRILLING MANAGEMENT LIMITED REVERSE CIRCULATION DRILL HOLE LOG
DATE 2021r
SHIFT HOURS______ TO ,^——-
HOLE NOGEOLOGIST ———
MOVE TO HOLE ,
DRILL J——————
LOCATIONDRILLER . . BIT NO.
.ELEVATION. BIT FOOTAGE.
TOTAL HOURS
CONTRACT HOURS
MECHANICAL DOWN TIME .
DRILLING PROBLEMS ———
OTHER ————————^^.^—
MOVE TO NEXT HOLE .
DE I ME li DESCRIPTIVE LOG
Z1-
22-
Z3-
i*-
TS-
27-
16-
30-
11-
12-
13-
14-
15-
16-
17-
18-
f'"
.'i
o" h
0}
20. 0-1.5.0 TI Lk
: , —— /r.'
f, t f,

OVERBURDEN DRILLING MANAGEMENT LIMITED REVERSE CIRCULATION DRILL HOLE LOG
DA
Sh
TP tf/WC-rf V
IFT HOURSTO
TOTAL HOURS
- wniF NO wurr-oe.-i* , nr.ATinN ^/^ 17™ HIT MI-1 J ZVV85
"OVF Tn nn| p . . //-.w M'* *fl1
E LEVABIT FOC
TION
nnn i It -y f- y-"" 1
MECHANICAL OOWN TIME...,,,,
nmi i IMR pnnni FMRCONTRACT HOURS OTHFR ^~V f :}* - C.:*~M
DEPTH IN
METRES
1-
2-
-3-
1 —
6-
7-
8-
9-
10-
11 —
12—
13-
14—
15-
16—
17—
18-
19-
20-
GRAPHIC LOG
— — —— - •— - — —— — i—
f ————
.-a — —
*- —— - — - ^- — —" — '
, — — — ~—
rf —— "
—
—— ———
^ — — '
—— - ——
^^
. — — —— '
— — —— '
. —— — -~-— — —— - — —- —
— - —— —
^
u
SAMPLE NO.
r
'r
~
-
|-
-]-
J-
—
UOVF TO NFXT HDI F j?I w "- S-fOff^
M6.B l
DESCRIPTIVE LOG
o- 2&O oii&ujA/E sebtme-rt'TS
'
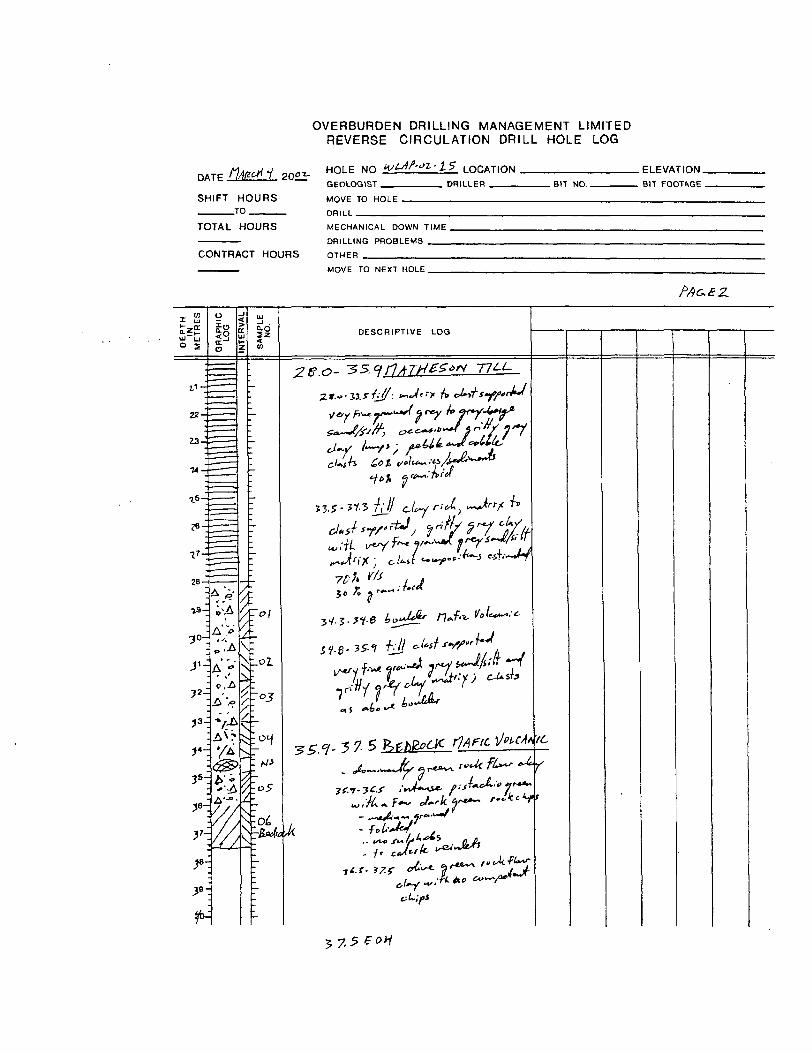
OVERBURDEN DRILLING MANAGEMENT LIMITED REVERSE CIRCULATION DRILL HOLE LOG
DATF HAltcJI 200*-
SHIFT HOURSTO
TOTAL HOURS
CONTRACT HOURS
HOI F NO IVLAr-oi-15 10CATION
unyp rn uni F
nni^ i
MPTHANirAI DOWN TIME
OTHFB
ELFVATION
PIT FnnT4RF
MOVE TO NEXT HOLE .
DE I ME
GRAPHI LOG
SAMPL NO.DESCRIPTIVE LOG
2 e.o- 35.
18^
•H!
A
?H
?H
0Z.
'-03;
,55.?- (L
j, 7.5
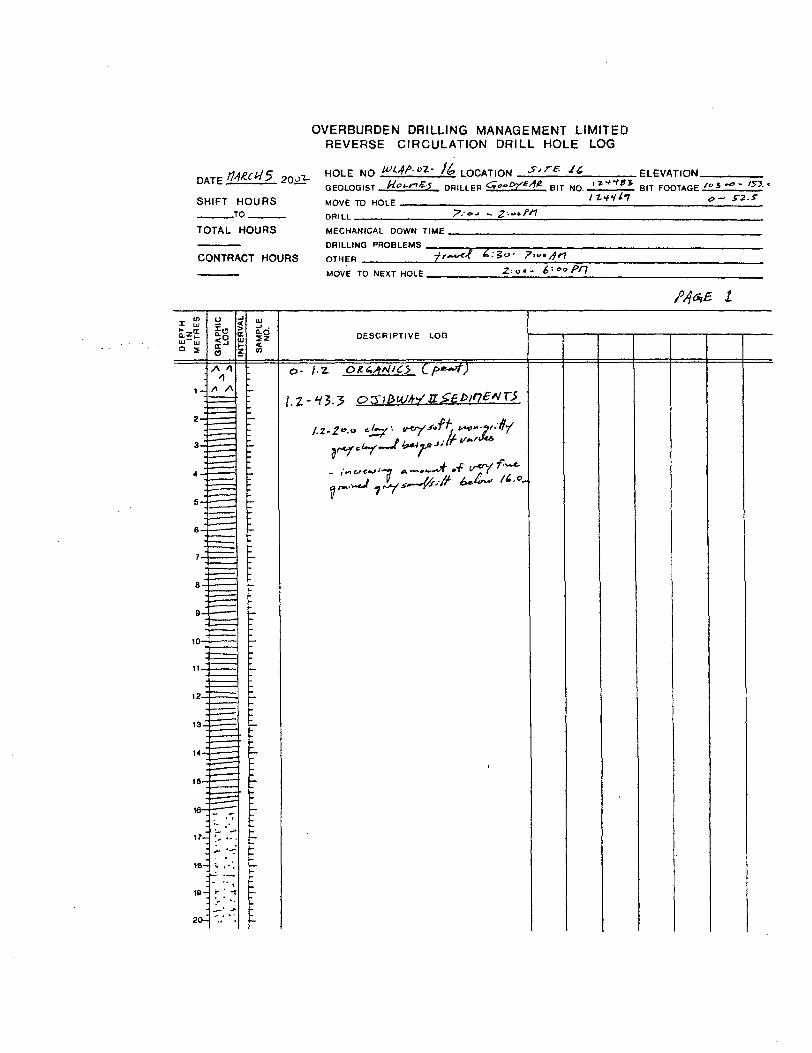
OVERBURDEN DRILLING MANAGEMENT LIMITED REVERSE CIRCULATION DRILL HOLE LOG
DA
SK
T c t]fiK.C*i^
IIFT HOURSTO
TOTAL HOURS
^ HDI F NO Wijf-ol- /b mr,ATinN S' re. J cnpni nnictT . Hoi^rtK-}^ npi| | po ^.f.-fr' 48- BIT Mr, f-'*'***
MOVF TO ""1 F -,..,..,, _ /Z--/V "7
E LEVABIT FO(
TiniM
- nnin /'.-o-' -~ Z-.vtfn
MECHANICAL DOWN TIME . ,,
DRIILIMG PHOBI FMS
CONTRACT HOURS ITTHFR -j-r*~*X 6. -go- r^.jn
DEPTH IN
METRES
1 —
2-
3-
4-
5-
6-
8-
9-
10—
11—.
13-
14-,
18-
16—
17-
18-
19-
20-
GRAPHIC LOG
A 1 1
A /\
l~ -.1 1 1— - — ' —— '
^ —. — 1 —— ™^. II II 1"
^. ' "1 ^-"— —— —— -"
, — - -^ -- — — '""—— - — -
—— — —
—1 ~~
- — n- 1 1"
Jl — —
1— " —
^ — —~
'•. -\
"it- -T
INTERVAL SAMPLE NO.
^
^~
r
.~
-;-
~-
MOVE TO NEXT HOLE -Z : "" ^ oo PH
W*e i
o- 1:2. Of.6*A*4iC.5 Cf**-**?)
^.^i nrmuMsxsewetrs
-r**ct~f~~* t b*i'L* J '' **

OVERBURDEN DRILLING MANAGEMENT LIMITED REVERSE CIRCULATION DRILL HOLE LOG
SHIFT HOURS______TO —-.——.
HOLE NO
GEOLOGIST..——
MOVE TO HOLE .
DRILL ———————
LOCATIONDRILLER , . BIT NO..
.ELEVATION.BIT FOOTAGE .
TOTAL HOURS
CONTRACT HOURS
MECHANICAL DOWN TIME ,
DRILLING PROBLEMS ——.
OTHER -^^——-—————.
MOVE TO NEXT HOLE .
DE I ME
GRAPHIC LOG SAMP NO.
DESCRIPTIVE LOG
7s-
ZB-
77-
r-
yi;M
-— /

OVERBURDEN DRILLING MANAGEMENT LIMITED REVERSE CIRCULATION DRILL HOLE LOG
; HOLE NO ^LAf-o2- /i LOCATION _______________ ELEVATION.GEOLOGIST__________ DRILLER__________BIT NO.________ BIT FOOTAGE.
SHIFT HOURS______TO ————
TOTAL HOURS
MOVE TO HOLE .
DRILL —————.
CONTRACT HOURS
MECHANICAL DOWN TIME ,
DRILLING PROBLEMS ———.
OTHER ————.—-.———.
MOVE TO NEXT HOLE .

OVERBURDEN DRILLING MANAGEMENT LIMITED REVERSE CIRCULATION DRILL HOLE LOG
HOLE NO tiJAP- 02- i? LOCATION -f'™ /yww/ /H FI FX/ATinMDA
SH
TP 'MKCIfc./D
IFT HOURSTO
TOTAL HOURS
rtfninni^T //oi-^/JJ nni| i PR (Z-aS-y&Afc HIT NO. li'jH ^?, BIT FO(iTAr.P^-J-- /-f-Jc* ~- -^~S"- **
- nflnp rt~r*,{l, re:-' -X Z --•A? /7a/^< 7. 7:3., - //-v-ASJ /l*s*le 1 2'"" - ^-T* f"r\
MFCHANICAI DOWN TIMF .'lotet, i (Z:**-*S*J n~'~t7 ll:o*4n-* E^f r}*~{* C-t* ~ ir-H/ir,
nniniwR pnnniFMR By/fey p r.i^~* /-e^^i/ ^r ei— j.--, he+J1,**/ **~tt ~~J*i-sw;v*(CONTRACT HOURS OTHFR 7voW 1~U. i /A,^ /r^e//?*/-*^ 7 z/...*'* fs*~*fn~~*ti tt~o**s
DEPTH IN
METRES
2-
3-
4-
5-
6-
8-
9-
;10-
-11-
12—
K-
15—
16-
18-
19-
20-
GRAPHIC LOG
A ^\
A A A
A.*
^-^—^~
—— ——
.
— ——— f
————
— —— .
~
-j <
j
SAMPLE NO.
r
-
'~
~-
—
~
~
;
7
-
MnvF TO NEXT HOLE fft-t.9 -f-.tf - f :*O SK
O -79 O^G/^N '^S C/3*^* X
•7 c; 7 *7 c^TJ^'VAy 7^" ^"^ C^^BlN.'TS
- v&y T'~'^Ltjr^ i "*g* fiF*~y - b&ft^ Scx.*^
r*t*3T*rl*~y*G} Uw,?**) "2^.0 fc**

OVERBURDEN DRILLING MANAGEMENT LIMITED REVERSE CIRCULATION DRILL HOLE LOG
rmTFfl*"^.7S 200 Z-
SHIFT HOURSTO
HOI F NO W-W-0
Mi-"VF TO HOI f -,,...
nnii i
^1 ' inCATIOM EI FVATION
BIT FnnTar.c
TOTAL HOURS
CONTRACT HOURS
MECHANICAL DOWN TIME .
DRILLING PROBLEMS ———
OTHER —————————^—
MOVE TO NEXT HOLE .
DE I ME
GRAPHI LOG DESCRIPTIVE LOG
19-
35-
y-
?9 -
yt. C-

DATE:
OVERBURDEN DRILLING MANAGEMENT LIMITED REVERSE CIRCULATION DRILL HOLE LOG
HOI F MO WUf-OT- l 7 l DCATIDN _________________ ELEVATION.
GEOLOGIST __________ DRILLER _________ BIT NO. ——————— BIT FOOTAGE .
SHIFT HOURS______TO_____
MOVE TO HOLE .
DRILL ——.——.
TOTAL HOURS
CONTRACT HOURS
MECHANICAL DOWN TIME .
DRILLING PROBLEMS ,
OTHER .——————————
MOVE TO NEXT HOLE.
Z O "5
SS-o Z-OH

OVERBURDEN DRILLING MANAGEMENT LIMITED REVERSE CIRCULATION DRILL HOLE LOG
8.1 20 oi."- —— —— ~
HOLE NO W-Af' OZ ~ ie LOCATION -S/r-g f,
SHIFT HOURS______TO —————
TOTAL HOURS
GEOLOGIST "'
MOVE TO HOLE
DRILL ———^——
DRILLER
g *
B , T BIT FOOTAGE er- "
-j: Jo
CONTRACT HOURS
MECHANICAL DOWN TIME
DRILLING PROBLEMS -—
OTHER
MOVE TO NEXT HOLE
DE I MEAMP NO.
DESCRIPTIVE LOG
o- J.o
9-
ID-
11-
12.
13
14
15-
16~
17-
18-
19
-"
i.o- L.S
af f.'
Tit-L
f D

OVERBURDEN DRILLING MANAGEMENT LIMITED REVERSE CIRCULATION DRILL HOLE LOG
DATE 6.1 2011
SHIFT HOURS ______ TO -——
TOTAL HOURS
HOLE NO
GEOLOGIST ———
MOVE TO HOLE .
DRILL ———————
LOCATIONDRILLER BIT NO.
.ELEVATION. BIT FOOTAGE .
CONTRACT HOURS
MECHANICAL DOWN TIME ,
DRILLING PROBLEMS ——.
OTHER ,^^——^———^——
MOVE TO NEXT HOLE .
2.
DEPTH IN METRE DESCRIPTIVE LOG
tz-
2.3-:
y-.
-/A
/A
19-
)4 ~:
7-i r~.
P/A'"Vi
7A
s
07
9—— ,.Z i'tl; C-/.J/ A '——*'0
^^.u
J37^.38 --o^.. #.5. ^~f
;5

OVERBURDEN DRILLING MANAGEMENT LIMITED REVERSE CIRCULATION DRILL HOLE LOG
DATE
SHIFT HOURS______ TO ^————
TOTAL HOURS
CONTRACT HOURS
HOLE NO GEOLOGIST ——
MOVE TO HOLE ,
DRILL _______
LOCATIONDRILLER , . BIT NO..
.ELEVATION.BIT FOOTAGE .
MECHANICAL DOWN TIME .
DRILLING PROBLEMS ———
OTHER -———.-.-——-——
MOVE TO NEXT HOLE .
DEPTH IN
METRESQRAPHIC
LOG DESCRIPTIVE LOG
0?
Y2 -
Y3 -i
l4 --
^~:
l 8 -:og
os
XA
^^J
13-1
16H
18H
zoq
4o..t-vz.vtJ!:
u — .5,~M
e -W

Appendix B
Binocular Microscope Descriptions of the Bedrock Cuttings

Sample Number
WLAP-0202-05
03-04
04-06
05-22
06-08
Colour Structure Grain Size (mm)
Variable grey to Fine grained Primary: 0.05green with sedimentary with no Metacrysts: 0.1-ochre- visible bedding. 0.2weathered Strongly foliated,metacrysts and semi-schistose. lO'/owhite veinlets. white quartz
veinlets. Unsheared.
a)(80"7oof Fine to coarse- a) 0.05cuttings): grained sedimentary, b) 0.3-1.0Variably grey or Bedded. Stronglygreen. foliated, semi-b) (200Xo of schistose.cuttings): Pale Unsheared.grey-green.
Mottled dark Coarse magmatic. 0.7-1.0green and grey- Strongly foliated andwhite. weakly lineated.
Unsheared.
Variable grey to Fine-grained 0.05green. sedimentary with no
visible bedding.Strongly foliated,semi-schistose.Unsheared. Samplecontains 30'!^assorted pebblecontamination.
Dark green. Unquenched flow. 0.2-0.3Moderately foliated.Unsheared.
TextureSilicates
Silty. Variably spotted Feldspathic siltwith small biotite and/or with 30-50"7o fine-carbonate metacrysts. grained chlorite
(variably biotite)and D.5% biotitemetacrysts.
a) Silty. a) Feldspathic siltb) Medium to coarse with SO-50% greysandy. to green chlorite
and tracetourmaline.b) 10"Xo quartzsand grains, 70'!'oplagioclase +lithic sand grains,20"Xo greenchloritic matrix.
Equigranular 30Va actinoliteinterlocking. (mainly) +
chlorite, 69-700/.saussuritizcdplagioclase,3"Xo quartz.
Silty. Feldspathic siltwith SO-50% fine grained chlorite(variably sericite).
Equigranular 500Xo chloriteinterlocking. (mainly) -t-
actinolite,50"Xo saussuritizedplagioclase,< 1 "/o quartz.
MineralogyCarbonates Sulphides Other
Wa Fe/Mg carbonate, \Vt primary pyrite No FefTi oxides.metacrysts (mostly stringers andweathered to laminations.limonite).
a) Nil. a) Trace finely a) Trace leucoxene.b) Nil. disseminated b) Nil.
pyrite.b) Nil.
lO^o evenly Trace finely Trace disseminateddisseminated calcite, disseminated ilmenite.
pyrite.
Nil. Nil. No Fem oxides
D.5% fracture-hosted Q.1% fracture- No FeATi oxides.calcite. hosted pyrite.
Name
Siltstone
a) Siltstoneb) Greywacke
Gabbro
Siltstone
Mafic volcanic

Sample Colour Number
Structure Grain Size (mm)
Texture Mineralogy NameSilicates Carbonates Sulphides Other
WLAP-0208-09 Grey-white, Coarse magmatic. Plagioclase Plagioclase-phyric with 1(W plagioclase 3"Xo disseminated
speckled green-Weakly foliated. phenoerysts: 1.5- equigranular interlocking phenocrysts. calcite.black Unsheared. 4 groundmass.
Groundmass: 0.5- 1
90% groundmass = 60"Xo saussuritized plagioclase, 300Xo quartz, 2"Xo chlorite (variably biotite), 5"Xo muscovite, 0. l Ve titanite.
C.5% coarsely No Fe/Ti oxides.disseminated cubicpyrite.
Feldspar porphyry
09-21 Dark green with All primary structure 0.05 in cross- Acicular, lineated. Subequal chlorite Nil. 15"Xo white masked by strong section but Cherty zones are rodded, and saussuritized quartz zones. foliation 4- lineation elongated 5-10:1 sugary. plagioclase.
and rodding. No visible quartz Cherty zones may be other than in former pillow cherty zones, selvages. Weakly sheared.
Nil. No Fe/Ti oxides. Mafic volcanic
10-12 Medium to pale Medium to fine- 0.1-0.5 grey-green. grained sedimentary
with no visible bedding. Weakly foliated. Unsheared.
Poorly sorted fine to medium sandy.
1 5 0Xo quartz sand grains, 70"Xo undifferentiated feldspar + lithic sand grains, 15"Xo chloritic matrix
2"Xo fracture-hosted calcite.
Trance primary disseminated pyrite.
(variably biotitic).
Trace leucoxene. Greywacke
11-02 Medium grey- Fine-grained Primary O.05. green. sedimentary with no Biotite
visible bedding. metacrysts 0.2- Moderately foliated. 0.3. Unsheared.
Silty; spotted with small Feldspathic silt G.5% fracture-hosted Nil. biotite metacrysts. with 10-200X0 fine- calcite.
grained chlorite(variably sericite)and 5-100Xo biotitemetacrysts.
No resolvable Fe-Ti Siltstone oxides.
12-15 Dark grey. Fine-grained Primary O.05.sedimentary with no Biotitevisible bedding. metacrysts 0.15-Strongly foliated but 0.3.not schistose.Unsheared.
Silty; spotted with small Feldspathic silt Trace fracture-hosted Q.5% finely biotite metacrysts. with 2Wo fine- calcite. disseminated
grained chlorite primary pyrrhotite.(variably sericite)and 3"Xo biotitemetacrysts.
No resolvable Fe-Ti Siltstone oxides.
13-03 Dark green. Unquenched flow. 0.1-0.15 Equigranular Moderately foliated. interlocking. Unsheared.
50"Xo chlorite l "Xo patchily (mainlyj+actinolit disseminated and e, fracture-hosted 50"Xo saussuritized calcite, plagioclase, l/'o quartz.
Trace pyrite. Trace disseminated ilmenite.
Mafic volcanic
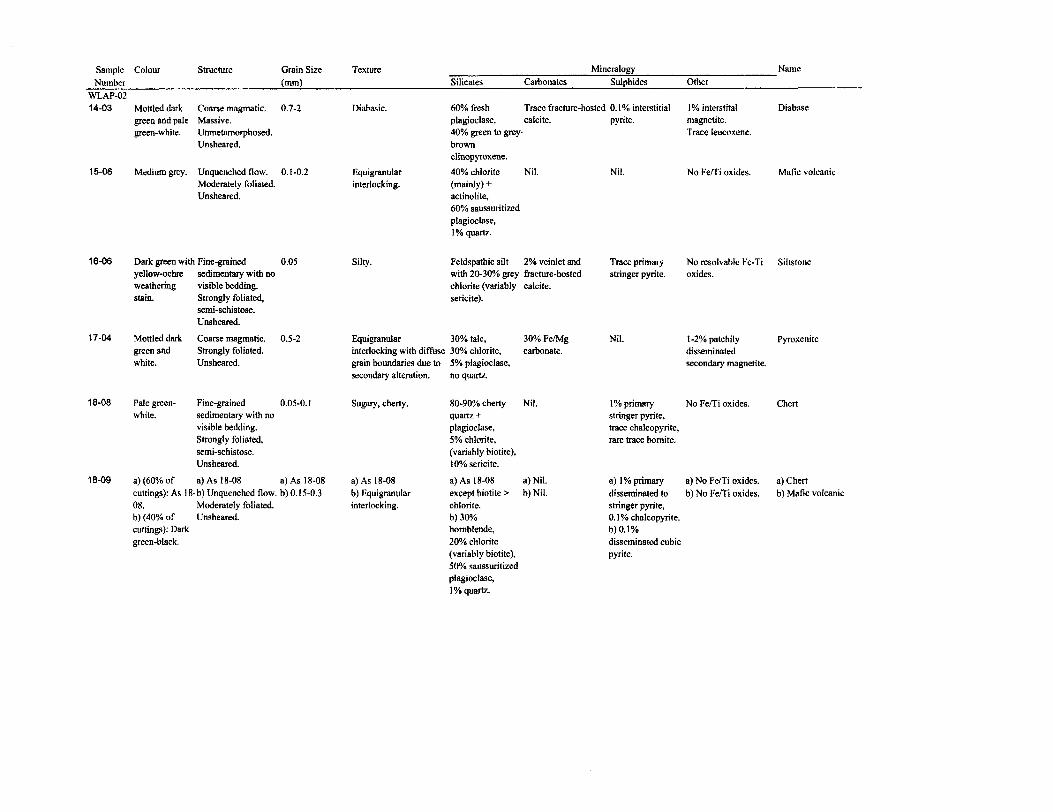
Sample Number
WLAP-0214-03
15-06
16-06
17-04
18-08
18-09
Colour Structure Grain Size (mm)
Mottled dark Coarse magmatic. 0.7-2green and pale Massive.green-white. Unmetamorphosed.
Unsheared.
Medium grey. Unquenched flow. 0.1-0.2Moderately foliated.Unsheared.
Dark green with Fine-grained 0.05yellow-ochre sedimentary with noweathering visible bedding.stain. Strongly foliated,
semi-schistose.Unsheared.
Mottled dark Coarse magmatic. 0.5-2green and Strongly foliated.white. Unsheared.
Pale green- Fine-grained 0.05-0. 1white. sedimentary with no
visible bedding.Strongly foliated,semi-schistose.Unsheared.
a) (60"Xo of a) As 1 8-08 a) As 1 8-08cuttings): As 1 8- b) Unquenched flow, b) 0. 1 5-0.308. Moderately foliated.b) (40"Xo of Unsheared.cuttings): Darkgreen-black.
Texture
Diabasic.
Equigranularinterlocking.
Silty.
Equigranularinterlocking with diffusegrain boundaries due tosecondary alteration.
Sugary, cherty.
a) As 18-08b) Equigranularinterlocking.
MineralogySilicates Carbonates
60Va fresh Trace fracture-hostedplagioclase, calcite.40"Xo green to grey-brownclinopyroxene.40"Xo chlorite Nil.(mainly) +actinolite,60"Xo saussuritizcdplagioclase,Wo quartz.
Feldspathic silt 2Vo veinlet andwith 20-30"Xo grey fracture-hostedchlorite (variably calcite.sericite).
30"Xo talc, 300Xo Fe/Mg30% chlorite, carbonate.5% plagioclase,no quartz.
SO-90% cherty Nil.quartz -t-plagioclase.5"Xo chlorite,(variably biotite),ID'% sericite.
a) As 18-08 a) Nil.except biotite > b) Nil.chlorite.b) 300Xohornblende,20Va chlorite(variably biotite),5Wa saussuritizedplagioclase,rXo quartz.
Sulphides Other
0. 1 "Xo interstitial 1 "Xo interstitalpyrite. magnetite.
Trace leucoxene.
Nil. No FeATi oxides.
Trace primary No resolvable Fe-Tistringer pyrite. oxides.
Nil. l-2')ipatcnilydisseminatedsecondary magnetite.
l"Xo primary No Fe/Ti oxides.stringer pyrite,trace chalcopyrite,rare trace bornite.
a) l"Xo primary a) No Fe/Ti oxides.disseminated to b) No Fe/Ti oxides.stringer pyrite,G.1% chalcopyrite.b)0.1 0Xodisseminated cubicpyrite.
Name
Diabase
Mafic volcanic
Siltstone
Pyroxenite
Chert
a) Chertb) Mafic volcanic

Appendix C
Till and Gravel Gold Grain Counts with Calculated Visible Gold Assays for the Nonferromagnetic Heavy Mineral Fraction

Sample NumberPannedYes/No
Dimensions (microns)
Thickness Width Length
Number of Visible Gold Grains
Reshaped Modified Pristine Total
NonmagHMC
Weight(9)
CalculatedV.G. Assay
in HMC(PPb)
Remarks
WLAP-02-02-01 No
WLAP-02-02-02 No
WLAP-02-02-03 No
WLAP-02-02-04 No
WLAP-02-03-01 No
WLAP-02-03-02 No
WLAP-02-03-03 No
WLAP-02-04-01 No
WLAP-02-04-02 No
WLAP-02-04-03 No
WLAP-02-04-04 No
WLAP-02-04-05 No
WLAP-02-05-01 No
WLAP-02-05-03 Yes
8 C13 C
25 5050 75
8 C 25 50
WLAP-02-05-05 No
13 C25 C
20 C22 C29 C
8 C10 C13 C
13 C
10 C13 C
13 C
13 C18 C25 C
8 C10 C13 C15 C
8 C15 C31 C
NO VISIBLE
5 C10 C18 C
5 C8 C10 C13 C18 C50 M
e c10 C15 C18 C
50125
7575100
2550SO
50
5050
50
5075100
25255050
2550125
GOLD
255075
2525505075125
25505075
75125
125150200
505075
75
5075
75
75100150
507575100
50100200
2550100
25505075100175
5050100100
112
11
112
1113
1124
11
112
11
1113
11114
1113
1113
142421
14
11114
145.5
57.5
20.3
18.7
24.7
24.7
23.2
11.3
29.9
28.4
20.4
24.9
47.9
36.4
3
1
161
458
41
15
24
33
143
45
341
49
265
53
No sulphides.

Sample NumberPannedYes/No
Dimensions (microns)
Thickness Width Length
Number of Visible Gold Grains
Reshaped Modified Pristine Total
Nonmag HMC
Weight(g)
Calculated V.G. Assay
in HMCftwb)
Remarks
WLAP-02-05-07 No
WLAP-02-05-09 No
WLAP-02-05-11 Yes
WLAP-02-05-13 No
WLAP-02-05-15 No
WLAP-02-05-16 Yes
WLAP-02-05-17 No
WLAP-02-05-18 Yes
WLAP-02-05-19 Yes
WLAP-02-05-20 No
WLAP-02-05-21 No
WLAP-02-06-01 No
WLAP-02-06-02 No
10 C13 C15 C
8 C13 C15 C
4 C8 C13 C15 C18 C31 C
50 5050 7550 100
25 5050 7550 100
15 2525 5050 7550 10075 100125 200
NO VISIBLE GOLD
8 C13 C20 C
4 C5 C8 C10 C13 C15 C18 C
10 C13 C18 C
7 C10 C13 C18 C
4 C8 C10 C13 C15 C18 C
5 C18 C18 C
25 5050 7575 125
15 2525 2525 5050 5050 7575 7575 100
50 5050 7575 100
15 5050 5050 7575 100
15 2525 5050 5050 7550 10075 100
25 2550 12575 100
8 C
7 C
13 C
25 50
15 50
50 75
1214
1214
1112117
1113
11122119
1113
13116
1111127
2114
11
11
11
23.8
29.2
29.8
46.3
33.6
27.2
24.8
33.0
38.1
11.2
39.5
48.9
66
50
1
302
42
1
86
58
1
81
101
54
7
1
8
No sulphides.
No sulphides.
No sulphides.
No sulphides.

Sample NumberPannedYes/No
Dimensions (microns)
Thickness Width Length
Number of Visible Gold Grains
Reshaped Modified Pristine Total
Nonmag HMC
Weight(g)
Calculated V.G. Assay
in HMC(PPb)
Remarks
WLAP-02-06-03 No
WLAP-02-06-04 No
WLAP-02-06-05 No
WLAP-02-06-06 No
WLAP-02-06-07 No
WLAP-02-08-01 No
WLAP-02-08-02 No
WLAP-02-08-03 No
WLAP-02-08-04 No
WLAP-02-08-05 No
WLAP-02-08-06 Yes
WLAP-02-08-07 Yes
WLAP-02-08-08 Yes
WLAP-02-09-01 No
WLAP-02-09-03 No
5 C8 C
10 C13 C
25255050
25 C 100
25505075
150
22 C 100 125 27 C 100 175
13 C 50 75
10 C 25 75
13 C 50 75
8 C13 C
13 C15 C
4 C10 C15 C
8 C10 C10 C
4 C8 C
13 C18 C
8 C10 C13 C18 C25 C
5 C10 C13 C15 C
5 C8 C
10 C13 C15 C20 C
25 C
8 C10 C
2550
5050
152550
252550
15255075
25505075100
25505050
252525507575
100
2525
5075
75100
2575100
507550
255075100
505075100150
255075100
2550757575125
150
5075
141219
112
11
11
11
112
112
1113
1124
11215
411118
12126
2211118
11
112
40.0
43.7
31.0
35.0
44.8
42.7
36.0
21.8
43.3
42.8
44.0
43.2
38.8
31.4
39.0
105
136
12
5
8
11
28
39
15
43
109
48
75
92
7
No sulphides.
No sulphides.
No sulphides.
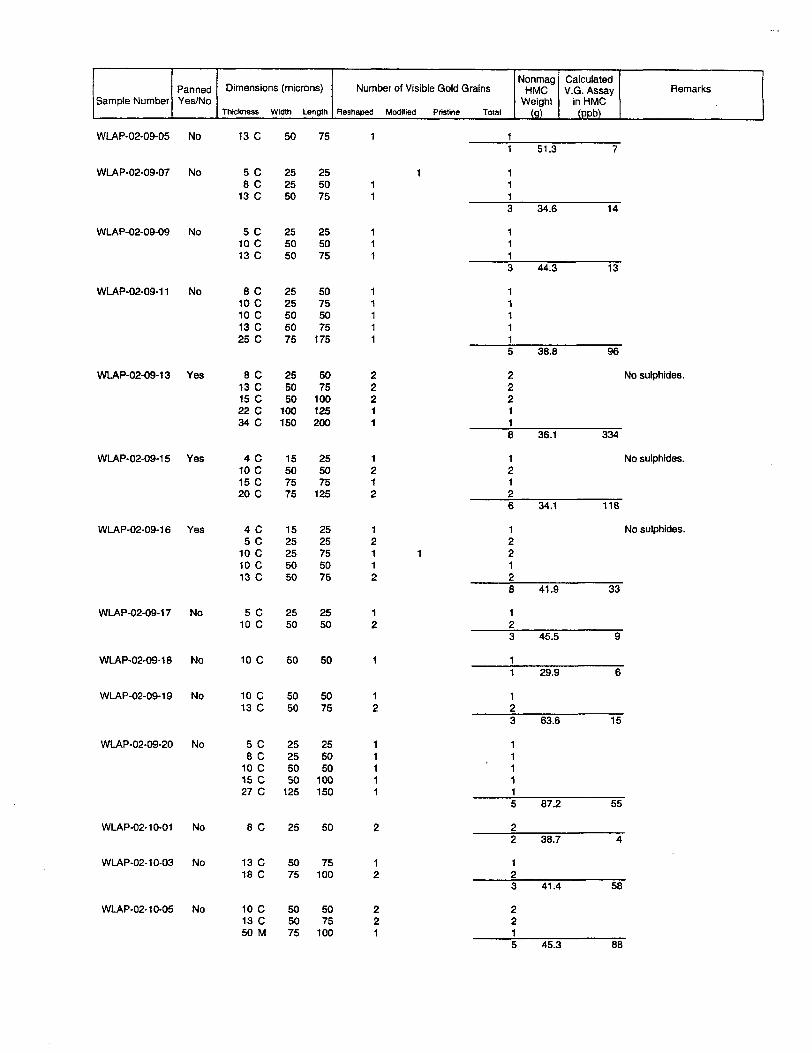
Sample NumberPannedYes/No
Dimensions (microns)
Thickness Width Length
Number of Visible Gold Grains
Reshaped Modified Pristine Total
NonmagHMC
Weight(g)
CalculatedV.G. Assay
in HMC(PPb)
Remarks
WLAP-02-09-05 No
WLAP-02-09-07 No
WLAP-02-09-09 No
WLAP-02-09-11 No
WLAP-02-09-13 Yes
WLAP-02-09-15 Yes
WLAP-02-09-16 Yes
WLAP-02-09-17 No
WLAP-02-09-18 No
WLAP-02-09-19 No
WLAP-02-09-20 No
WLAP-02-10-01 No
WLAP-02-10-03 No
WLAP-02-10-05 No
13 C
5 C8 C
13 C
5 C 10 C 13 C
8 C 10 C 10 C 13 C 25 C
8 C 13 C 15 C 22 C 34 C
4 C 10 C 15 C 20 C
4 C5 C
10 C 10 C 13 C
5 C 10 C
10 C
10 C 13 C
5 C8 C
10 C15 C27 C
8 C
13 C 18 C
10 C 13 C 50 M
50 75
252550
255050
2525505075
255050
100150
15507575
1525255050
2550
255075
255075
50755075175
5075100125200
255075125
2525755075
2550
50
5050
25255050
125
5075
505075
50
5075
255050
100150
25 50
75100
5075
100
11
1113
1113
111115
222118
12126
122128
123
11
123
111115
22
123
2215
51.3
34.6
44.3
38.8
36.1
34.1
41.9
45.5
29.9
63.6
87.2
38.7
41.4
45.3
7
14
13
96
l
334
1
118
l
33
9
6
15
55
4
58
88
No sulphides.
No sulphides.
No sulphides.

Sample NumberPanned Yes/No
Dimensions (microns)
Thickness Width Length
Number of Visible Gold Grains
Reshaped Modified Pristine Total
Nonmag HMC
Weight (a)
Calculated V.G. Assay
in HMC (ppb)
Remarks
WLAP-02-10-07 No 10 C 25 75 2 220 C 75 125 2 2
WLAP-02-10-08
WLAP-02-10-09
WLAP-02-10-10
WLAP-02-10-11
WLAP-02-11-01
WLAP-02-12-01
WLAP-02-12-03
WLAP-02-12-05
WLAP-02-12-07
WLAP-02-12-09
WLAP-02-12-10
WLAP-02-12-11
WLAP-02-12-12
WLAP-02-12-13
WLAP-02-12-14
WLAP-02-13-01
No 5 C13 C18 C50 M
No 10 C13 C
No 5 C8 C
25 2550 7575 100
100 100
50 5050 75
25 2525 50
1211
12
21
No NO VISIBLE GOLD
No NO VISIBLE GOLD
No 8 C
No 4 C8 C
13 C
No 8 C
No 5 C13 C18 C
No 8 C
25 50
15 2525 5050 75
25 50
25 2550 7575 100
25 50
1
111
1
111
1
No NO VISIBLE GOLD
No 4 C8 C
No 13 C
No 4 C8 C
10 C13 C15 C
No 4 C5 C8 C
No 5 C8 C
10 C13 C15 C
15 2525 50
50 75
15 2525 5025 7550 7550 100
15 2525 2525 50
25 2525 5025 7550 7575 75
11
1
12131
112
2
111
37.5 90
12115
123
213
11
1113
11
1113
11
112
11
121318
1124
311117
29.6
33.0
35.1
33.7
22.3
35.0
29.0
22.5
34.9
48.8
54.2
52.5
35.9
187
28
4
2
21
2
49
4
3
8
39
4
38

Sample NumberPannedYes/No
Dimensions (microns)
Thickness Width Length
Number of Visible Gold Grains
Reshaped Modified Pristine Total
Nonmag HMC
Weight(9)
Calculated V.G. Assay
in HMC(PI*)
Remarks
WLAP-02-13-02 No
WLAP-02-14-01 No
WLAP-02-14-02 No
WLAP-02-15-01 No
WLAP-02-15-02 No
WLAP-02-15-03 Yes
WLAP-02-15-04 No
WLAP-02-15-05 No
WLAP-02-16-01 Yes
WLAP-02-16-02 No
WLAP-02-16-03 No
WLAP-02-16-04 No
WLAP-02-16-05 No
10 C13 C
5 C8 C13 C18 C
5 C8 C
73 C
5 C8 C
15 C
8 C10 C13 C
4 C5 C8 C10 C10 C13 C15 C
10 C15 C18 C
5050
25255075
2525
400
252550
252550
15252525505075
507575
5075
255075100
2550
475
2550100
507575
25255075507575
5075100
NO VISIBLE GOLD
8 C10 C10 C13 C
13 C18 C22 C
5 C8 C
13 C18 C20 C
10 C13 C20 C
3 C8 C10 C13 C27 C
25255050
5075100
25255075100
505075
1525505075
50755075
75100125
255075100100
5075125
15505075200
332
1332321
15
111
2143
10
50.1 11
39.5 49
38.2 2738
40.6 18
38.8 17
No sulphides.
48.0 56
45.5 41
No sulphides.
44.7 50
11 13 34.3
11111
102
40.0 75
8 104.3
1131
J—————. 7 59.4
45
82

Sample NumberPannedYes/No
Dimensions (microns)
Thickness Wkilh Length
Number of Visible Gold Grains
Reshaped Modified Pristine Total
NonmagHMC
Weight(a)
CalculatedV.G. Assay
in HMCtoPtt
Remarks
WLAP-02-17-01 No
WLAP-02-17-02
WLAP-02-17-03
No
No
WLAP-02-18-01 Yes
WLAP-02-18-02 No
WLAP-02-18-03
WLAP-02-18-04
WLAP-02-18-05 No
WLAP-02-18-06 No
WLAP-02-18-07 No
8 C13 C22 C
25 SO50 75100 125
NO VISIBLE GOLD
7 C8 C
5 C8 C13 C15 C18 C20 C
8 C10 C20 C20 C
15 5025 50
25 2525 5050 7575 7575 10075 125
25 5050 5075 125100 100
No NO VISIBLE GOLD
No 8 C 25 50
5 C 65 C
10 C 13 C 15 C 18 C
8 C18 C
25300
50505075
2575
25450
5075
100100
50100
85.2 30
103.3
95.9 40
83.2 39
70.9
126.0 542
100.2
88.1
22
12

'•' ''- .-.• I-..--if.';-- "" .. - . - --.j i-'...-v/.'•' '-: -.' -: .^* 1.-. 1 '-*i'
;^.--j .,-- ' . ;_____ ' , ' - -i- . . . .1. - ; l l\-f^ -- "' J ' v ' l : -' ' 'K^r:i^^Vr;^^zSl^^:;iH-----'----f^!;
PROTEROZOICmen m m m mCD ;^SU
BOULDER MINING CORPORATIONWnt Like Abitibi Project
Ptat l - UxMiou did Bedrock Ceotouof Ae Revtne Cifmlrijon Drill Hole!
OvntuftM Mnng Memgxmn UmHO

CDNX: YBR CDNX: YBR CDA/X; YBR CDNX: YBR
WAL(Kimberlte)
\ Lake Abitibi DeformationMarathon Twp.
Legend for GOLD in HMC (RC Holes)
H O O -1 g/t - - Fault
O - 3 g/t ^
1 - 3 g/t —H WALP Claims (Gold)
H WALP Claims (Kimberlite)
3 -12 g/t ^ Gold in Quartz Boulders
12-18 g/t O Gold in Esker
BOULDER MINING CORPORATION
ABITIBI LAKE PROJECTLARDER LAKE MINING DIVISION, ONTARIO

Northwest Bav \\
G2. __ __ __ __l_ '\ ___

ONTARIO MINISTRY OF NORTHERN DEVELOPMENT AND MINES
Work Report Summary
Transaction No: W0280.01573
Recording Date: 2002-OCT-10
Approval Date: 2003-FEB-24
Client(s):301275 BAKER, CLEMENT J.
SurveyType(s):ASSAY
Status: APPROVED
Work Done from: 2002-FEB-22
to: 2002-MAR-05
POVERB
Work Report Details:
Claim*L
L
LL
LL
LL
L
L
L
L
L
L
L
L
1242137
1242142
1244752
1248701
1248702
1248703
1248704
1248705
1248706
1248707
1248708
1248709
1248710
1248711
1248712
1248713
Perform
soSO
so526,484
516,924
SO
SO
518,507
525,910
50
SO
533,848
SO
57,423
SO
SO
5129,096
External Credits:
Perform Approve
SO
SO
SO
522,800
514,600
SO
SO
S 15, 950
522,300
SO
50
S29.243
50
S6.400
SO
SO
5111,293
50
Applied
56,400
56,000
S6.400
56,400
56,400
56,400
S6.400
56,400
S6.400
56,400
S6.400
S6.400
54,800
56,400
56,400
54,800
S98.800
Applied Approve
56,400
S6.000
56,400
56,400
56,400
S6.400
56,400
56,400
56,400
56,400
56,400
56,400
S4.800
56,400
S6.400
54,800
S98.800
Assign50SOSO
S15.388
54,124
SO
SO
55,707
513,110
SO
so521,048
SO
31,023
SO
SO
560,400
Assign Approve
0
0
0
15,388
5,147
0
0
5,707
13,110
0
0
21,048
0
0
0
0
560,400
Reserve
SO
SO
so54,696
56,400
SO
SO
56,400
56,400
50
SO
56,400
SO
SO
SO
SO
S30.296
Reserve Approve
SO
SO
SO
51,012
53,053
SO
SO
53,843
52,790
SO
50
51,795
SO
SO
SO
SO
512,493
Due Date
2004-FEB-19
2004-FEB-19
2003-NOV-15
2004-MAR-06
2004-MAR-06
2004-MAR-06
2004-MAR-06
2004-MAR-06
2004-MAR-06
2004-MAR-06
2004-MAR-06
2004-MAR-06
2004-MAR-06
2004-MAR-06
2004-MAR-06
2004-MAR-06
Reserve:51 2,493 Reserve of Work
512,493 Total Remaining
Report*: W0280.01 573
Status of claim is based on information currently on record.
42A16NE2003 2.24342 GALNA 900
2003-Feb-27 11:28 Armstrong^! Page 1 of 1

Ministry ofNorthern Developmentand Mines
Date: 2003-FEB-24
Ministere du Developpement du Nord et des Mines Ontario
GEOSCIENCE ASSESSMENT OFFICE 933 RAMSEY LAKE ROAD, 6th FLOOR SUDBURY, ONTARIO P3E 6B5
CLEMENT J. BAKER 147CLOVERBRAEST., NORTH BAY, ONTARIO P1A4J3 CANADA
Tel: (888)415-9845 Fax:(877)670-1555
Dear Sir or Madam
Submission Number: 2.24342 Transaction Number(s): W0280.01573
Subject: Approval of Assessment Work
We have approved your Assessment Work Submission with the above noted Transaction Number(s). The attached Work Report Summary indicates the results of the approval.
At the discretion of the Ministry, the assessment work performed on the mining lands noted in this work report may be subject to inspection and/or investigation at any time.
The total value of work approved for this submission is S111,293.00.
If you have any question regarding this correspondence, please contact LUCILLE JEROME by email at [email protected] or by phone at (705) 670-5858.
Yours Sincerely,
Ron GashinskiSenior Manager, Mining Lands Section
Cc: Resident Geologist
Nelson W Baker (Agent)
Clement J. Baker (Assessment Office)
Assessment File Library
Clement J. Baker (Claim Holder)
Visit our website at http://www.gov.on.ca/MNDM/LANDS/mlsmnpge.htm Page: 1 Correspondence 10:17996

HIMHlirVOF HCflTHEFWDEVfLQPMEHT
PFUVIKMLtWIIM
MINING LAND TENURE
MAP
lnK WTmB Ml KM Him EUUK moral MlmOE M1KOS BSIDDDf~ *
^ thoiiia(iq)w(jtivllh1lv4l^mKM Mining R r^irVDinn alibi HlMBtry irfMinlliBrn.D )Hls(*tnnilit* Mipiiipativ H lin Irfirn
ci bt a In Ml Hiruutfi Ihu Nw d imtt TRIM RI
General Information and Llm l tat Ions
, i* fuMri (iun4ivlM driv **fl*H In fen PrmrvUi MhW| R wo r H r* Offr* hm RomthiB Mntaliy aiMtrhirn .DwMopw*in te\t Wnn wb *Ma
a* M h mi H* turf*"' Ufflu 1 q D Fm CHwHMH L+UlP T.I KKB vnaiy LWl Rairi f** 1 4l^
i NAOB3UTMMIdiw*!)k: D tt* SB w LI:.,.L*'*' ^
fvlitirMl lindlMUra tntt Muni* n.im4 H ik)M vi mt.hoilfll*nyM*.HUHM, K 0i
md InlMHt fm m ttw Crawi..*l*Q CH^kt .kKII* DI puhipir(FM wvrr O D** mining E)MPIinm.
Date l Time of Issue Oct 11 2002
TOWNSHIP/ AREA
GALNA
11: 1th Eastern
PLAN
Q-5601
ADMINISTRATIVE DISTRICTS l DIVISIONSMining Division Larder LakeLand Titlei/floglstry D Iw hi ion COCHRANE
Ministry of Nitural Resource* District COCHRANE
TOPOGRAPHIC
Ikjj P.dvlhttlil.lllr*r'f iL'J-j \nmnHmrn
LJ C'll- *l tflPl'li
LAND TENURE
LAND TENURE WITHDRAWALS
IMPORTANT NOTICES
LAND TENURE WITHDRAWAL DESCRIPTIONS
""——————OJO- 0
2134 UMm
vt*.*.-t*ia2 mn Nwsfa
HPFLPCatWNPiMD HO UNDEA.FUILhC LJIMDEACF
ItlFEET lUKfACI K'llHTI HEE&1W1.TIDH JWOUNB ALL L*t(l* * WVEPU
FHOODIH4 14 COM faun Bfl FT * H1 FT.C O^REP IY L-0**?l
VLOQONOILIVATIOh[HI FT Lfl, H74
FlOMMQE^FVATCUlBII tt LO Od rt
'(,oriow(|KLfcV*TBN:Bll H LO.B874
(li fi F t tUht Kc.nntHl I REififlUiriOH.Ai.CNG
nHfHOHIiaP *LLLJWEt*finrt-ftl
HN'm aid tarlKfl HfllrH ^tfmrfPP Sivttar.H of H Mbihf HctflW
l W4.L-JOtiil am, NW^HI.#H Mw.ihH wmwif^ i.B(^.ritrn
liHI h bfetit f rkpnM E) F*r rwykil(JH*iM m* B* WtbhttttbtUftHH ch
MiFinf *d MrTHw r^rvi nldiririinl CHHtafi.M di mi Mifrt| AotRE
t *yj.L-*M1i|1 DHT, N*r. Jl.JOtt Mott: ttita taunt mt cMi* r*"*
IM h fettiipripBM ri l*r HWWHJ1 JiiM n*y t* WiBHIvttOlttaM' *H
v WLL StMH1 OM1, wp/- "i -MH *laW Dili b
tiM If hirlni prip*tt4 Or iiwiWhniMl m^ b
W-U-M1I22 Wlfc HDV2IWI1 MIHH H
* W4.L iM (41 Drit. N*. M.jail Ho t*, l*
Hlilm md ItrfKi tn*i*^*"rtmiSKtoitaioini Ifctap Ad KM KWM4ir
4 WLL ZW1*1 0*11. N*V. 21.BW1 lain (Hi tOUB*BV****^ r*'H*1M *4 VM
INK H kvlrw pippvMd Mr 'WIMUH.IM Ni*i blttWlKIU MrEHrchMf*.
HHIN HID brfm n**-*^r*-**Mt*r w M HMni AH HIP iw OH* t wik.jwi*i MI\ riv, ZI.HHM Ndi* in* houniHvciiiu*.r4f*Hn IM wt*
n in* mw b* n*r
W4i P1V? Mnt Nflvziznm
MMng wd tutfwa rl|hti HHMmMKKton.HDllUHhlii| hd ftIO H" Ordv
l W4.L-2niA1 ONVNaV.ZI.2dD1 HUM Ml DOUHflVltttW^'H****1 ***
in* M tilrti rrof awti fK r*(LWJoi irri irm bi ni^Mlit tvnnt cbMBL
Kninf md Burt** riiktt WMhMiMI CMMhX M WBMi* fm FLEO IBM Ordw
rWJ.L.2W1fl1(JFtl Hou 21.7001 wi* PH pfio** py m*f^ r^ipHHhOw MM
inn H Bin HHffHM W r**lfrlan M* m* t* vMwdft flKflw' CNHH.
ifWLL-ZMIfll OHI Nw..?t.K*t M.tatpm bam^Br itovih rK"*MiM*t**i,
IN* H ttftif, |ir*p***i{ ni r*vl*tlaq tiri m* Ml M*KMa tanr*- Hi W tt.,
WnliV M* fKiriHl rt lHi iri*i4Mm SBctan.36 li taNbihi Ad AK IW 6***
P* Wtt JOBtJOI OHT Nw,2l, 2M) Wnte Bifctam^aT tMdy.rif' H*nU*M vu
Ihrt d 1 9*1 1 PMPBM* mi*** Wu wri mm bo Mbtartlvrhrtfe' ehwt*
Minim na ihirfvci DBM* w*ifln"* s*cwn.?8 o nwnvti An **o iw Onur
.VWl.L2ni.ai DHT, Hi. .31. MI1 Huw
tlllllW Md fell HI liphW HUHMl SKhMi B El In HhibiiAd R*0 l*t* Wcr
JfWLL iDBIJlt DHr.Hw.21. ZOU HolH Llhh tiDimtHy chii^.rB(H**Mi *w am
4hrikihi*ipprap*H^rirr*WWn*.*4ll mnr fat HHItcttQ frith!' cima*.
Mmna MN Tunvwnihn WAMIMMI IWUM.H ci tt* Wflki) Ad "*(* "" W
*W1 1 JMIIfll HIT, Hw. 71. Mtl Hdto thbhaunt^ cbl* r^rwrfi Hw mi
IM H btiriiprapiH*rBr(iqiii*tUB.*w mivii* wHjfcriotnrtht' ohwia
Oo
IS
M