Embed Size (px)
Citation preview

HSE Health & Safety
Executive
Analysis and Design of Profiled Blast Walls
Prepared by Imperial College London for the Health and Safety Executive 2004
RESEARCH REPORT 146

HSE Health & Safety
Executive
Analysis and Design of Profiled Blast Walls
Dr L A Louca and J. W. Boh Imperial College London
Department of Civil and Environmental Engineering South Kensington
London SW7 2AZ
This report presents the study on the design and analysis of stainless steel profiled barriers subjected to blast loading generated from typical hydrocarbon explosions. The Technical Note 5 (TN5) issued by the Fire and Blast Information Group and a time domain finite element commercial software packages will be used for the above purposes. Particular attention is given to the plastic response of the blastwalls. Through this study, extensive discussions will be given to the adequacy of the simple design tool commonly used by the offshore industry for the analysis and design of blastwalls. In addition, appropriate guidance will also be presented on the use of the finite element numerical tool for the above purpose.
This report and the work it describes were funded by the Health and Safety Executive (HSE). Its contents, including any opinions and/or conclusions expressed, are those of the authors alone and do not necessarily reflect HSE policy.
HSE BOOKS

© Crown copyright 2004
First published 2004
ISBN 0 7176 2808 6
All rights reserved. No part of this publication may bereproduced, stored in a retrieval system, or transmitted inany form or by any means (electronic, mechanical,photocopying, recording or otherwise) without the priorwritten permission of the copyright owner.
Applications for reproduction should be made in writing to: Licensing Division, Her Majesty's Stationery Office, St Clements House, 2-16 Colegate, Norwich NR3 1BQ or by e-mail to [email protected]
ii

SUMMARY
Profiled barriers have been increasingly used as blastwalls in typical offshore topsides modules
to provide a safety barrier for working personnel and critical equipments. Most of the blastwalls
are designed using Single Degree of Freedom Method as recommended in the design guidance
Technical Note 5. One of the uncertainties in blastwalls design remains in the accurate
evaluation of the explosion loading. As such, they are normally designed against a nominal
pressure of 0.5 bar which often results in the elastic response of the section. However, recent
large scale explosion tests on the blastwalls have shown the possibility of as high as 4 bar
overpressure with a shorter duration in a typical module. Under such conditions, elastic design
of blastwalls, in which most blastwalls has been traditionally designed, is no longer economical
and feasible.
This report presents the study on the design and analysis of stainless steel profiled barriers
subjected to blast loading generated from typical hydrocarbon explosions. The Technical Note 5
(TN5) issued by the Fire and Blast Information Group and a time domain finite element
commercial software packages will be used for the above purposes. Particular attention is given
to the plastic response of the blastwalls. Through this study, extensive discussions will be given
to the adequacy of the simple design tool commonly used by the offshore industry for the
analysis and design of blastwalls. In addition, appropriate guidance will also be presented on the
use of the finite element numerical tool for the above purpose.
In essence, the study considers 3 different profiled barrier sections, distinguished by the depth of
the sections, classified as either plastic, compact or slender section in accordance to the TN5,
and subjected to both static and dynamic loadings. These barriers are made up of either Grade
SS2205 or SS316 stainless steel, both of which are commonly used in the industry. The design
overpressures and duration are selected so as to represent realistic values that results in either an
elastic and plastic response of the blast barrier.
Therefore the study has attempted to cover a wide spectrum of design scenarios and hope that
the document presented here can be served as an additional reference source for the design and
analysis of stainless steel profiled barrier subjected to typical hydrocarbon explosion, which is
clearly limited in the public domain.
iii

iv

CONTENTS
Summary iii
Contents v
1.0 In troduction 1
1.1 Current Status 1
1.2 Scope of Report 3
2.0 Technical Note 5 (Single Degree of Freedom method) 5
2.1 Introduction 5
2.2 Design Guidance 5
2.2.1 Design Basis 5
2.2.2 Single Degree of Freedom Method 6
2.3 General Limitations 7
3.0 Non-Linear Finite Element Method 9
3.1 Introduction 9
3.2 Mesh Sensitivity 9
3.3 Parametric Studies 10
3.4 Types of Analysis 11
3.5 Boundary Details 12
3.6 Imperfections 12
3.7 Material Modelling 13
4.0 Methodology 15
4.1 Design Guidance from Technical Note 5 15
4.2 Finite Element Modelling 16
5.0 Static Analysis 19
5.1 Mesh Densities and Number of Bays 19
5.2 Effects of Material Idealisation 19
5.3 Effects of Boundary Conditions 21
5.3.1 In-Plane Restraint 21
5.3.2 Boundary Conditions Along Outer Corrugations 21
v

5.3.3 Full and Half Corrugated Model 23
5.4 Static Peak Capacity and Maximum Response 23
5.4.1 The Reduction Factors 24
5.4.2 Results and Discussions 26
5.5 Deformation of Sections 29
5.6 Comparison of S1, S2 and S3 Sections 30
5.7 Comparison of SS2205 and SS316 32
5.8 Initial Imperfections 33
6.0 Dynamic Analysis 37
6.1 Design Pressure Profile 37
6.2 Maximum Dynamic Response 37
6.3 Dynamic Effects 40
6.3.1 Dynamic Load Factors 40
6.3.2 Initial Imperfections 41
6.3.3 Strain Rate Effects 42
6.4 Limitation of SDOF and the Resistance Function 43
6.5 Effects of Spikes in Pressure Time Histories 45
7.0 Conclusions and Recommendations 49
7.1 Conclusions 49
7.1.1 Finite Element Modelling 49
7.1.2 TN5 and SDOF 51
7.2 Recommendations for Future Works 52
References 53
vi

1. INTRODUCTION
1.1 CURRENT STATUS
Blast barriers are integral structures in a typical offshore topside module to protect personnel
and safety crit ical equipment by preventing the escalation of events due to hydrocarbon
explosions. As such, the blast barriers are expected to retain their integrity against any blast
loading and fire that may subsequently follows. It is the aspects for the former loading that this
report has focused. In addition, although there are many forms of blastwalls available, such as
the stiffened or unstiffened panels and composite sandwiched panels, only stainless steel
profiled sheeting will be considered here due to its widespread use in the industry. A typical
structural configuration of a stainless steel profiled blastwall is shown in Figure 1-1 below. Its
popularity can be attributed to the excellent mechanical properties of the stainless steel against
blast loading, which exhibits considerable energy absorption and ductility characteristics. Other
advantages include good fire and corrosion resistance properties.
Figure 1-1 Typical structural arrangement for a profiled blastwall
The design of blast barriers under extreme loading levels is likely to involve large plastic
deformations, weld tearing and possible contact with adjacent plant or structural components.
Many designs of existing barriers only consider low blast pressures of the order of 0.5 bar.
Depending on the profiles and grades of the profiled walls, the response is likely to be in the
elastic regime. However, a recent joint industry project in blast and fire engineering for topside 1
structures , which has addressed key issues relating to the characteristics of offshore
hydrocarbon explosion have shown overpressures of several bar are possible in a typical
offshore module. Surprisingly little hard data exists for the design of profiled barriers subjected
to overpressures typically produced by hydrocarbon exp losions, particularly those involving
1

large permanent deformations. This lack of information is mainly the results of difficulty in
selecting an economical section of adequate depth while still fulfilling the requirements of
adequate ductility and thus a more stringent allowable slenderness limit is usually required
when compared to the design against static loading. As a result, most of the existing blastwalls
respond in an elastic manner2. Although peak deflections are lower in the elastic range, this
however will result in a relatively heavier section and can give rise to unacceptable reaction
forces to the supporting structure. In addition, their design has been traditionally been carried
out using simple beam theory and static analyses which for a larger overpressure gives a deeper
profile in which it must be noted that a deeper profile does not imply a corresponding increase
in the energy dissipating capability. In fact, there is little scope for absorbing energy by
deflection, implying larger shear forces that may result in premature shear buckling failure of
the web elements. In summary, the design of such sections is relatively straightforward but is
sometimes limited to local effects such as buckling of the compression flange and web as plastic
flow is not permitted. Therefore, there are some economic and structural advantages in allowing
plastic deformation of the blastwalls. These sections often have considerable residual strength
above design value which can allow for future upgrade of sections if required. The governing
factor for the design of plastic sections is often the ductility limit that is dependent of the overall
design considerations such as the amount of allowable damage to the blastwall as well as
proximity to any critical equipment. This is coupled with the problem of large rotation at the
connections that must be accounted for by ensuring the connection details can provide the high
rotational ductility.
In general, the design of blastwalls can be carried out by either the commonly used Single
Degree of Freedom Method3
(SDOF) or by means of an advanced numerical technique such as
the Non-Linear Finite Element Method (NLFEA). The SDOF, or sometimes called the Biggs
method, is widely used in the offshore industry for predicting dynamic structural response. It is
a simple approach which idealises the actual structure into a spring mass model and is thus very
useful in routine design procedures that can obtain accurate results for relatively simple
structures subjected to limited ductility. The technical guidance, Design Guide for Stainless
Steel Blastwalls 2 (TN5), by the Fire and Blast Information Group is based on the SDOF method.
On the other hand, NLFEA provides a detailed analysis of the blastwall and is capable of giving
a better overall picture in terms of the responses of the blastwall such as connection failure,
buckling or membrane effects, all of which cannot be adequately accounted for in the SDOF.
The SDOF and NLFEA methods will be adopted in the present work for blast barrier
assessments and are discussed in greater detail in following chapters. Apart from the two
methods, encouraging results have been also achieved by some researchers in the attempt to
further understand the behaviour of profiled panels under blast loading. Schleyer and Campbell4
developed a simple energy formulation to determine the displacement time history of various
flat and corrugated profiles. Comparison with large-scale experimental data showed good
agreement. The formulation could be modified to account for pinned or rigid boundary
conditions and negligible in-plane resistance for modelling the corrugated profiles. Recent
studies by Malo5
have presented experimental test results on quasi-statically loaded small scale
corrugated panels using a water pressure chamber. Good correlation was achieved with finite
element analyses in the elastic range and up to the point of local panel buckling. Leach6
has
recently extended the Biggs method to panels with different boundary conditions and has
provided design charts for the elasto-plastic design of corrugated cladding panels subjected to
blast loading. Plane et al7
has investigated the response of a full scale corrugated panel with
both finite element methods and simplified yield line techniques. He used thick she ll elements
to model the panel and a fillet weld in a single trough of a corrugation where the strain was
shown to be critical in an initial analysis. The results from the finite element study compared
favourably with the experimental results. The results overestimated the deflections measured in
the experiments which were attributed to the material model adopted which was based on
guaranteed minimum values of yield stress.
2

1.2 SCOPE OF REPORT
In this study, 3 different profiled barrier sections , distinguished by the depth of the sections,
classified as either plastic, compact or slender section in accordance to the TN5, and subjected
to both static and dynamic loadings. These barriers are made up of either Grade SS2205 or
SS316 stainless steel, both of which are commonly used in the industry. The design
overpressures and duration are selected so as to represent realistic values that results in either an
elastic and plastic response of the blast barrier.
Chapter 1 gives an overview of the current state of the art relating to the subject. Chapter 2 and
Chapter 3 give a general review on some of the essential elements of the SDOF and NLFEA
methods respectively. The discussions will be restricted to issues directly related to the present
work. In particular, general limitations of the SDOF and some guidelines to the NLFEA
modelling will be presented. More specific issues will be presented in the latter chapters.
Chapter 4 presents the methodology in carrying out the studies including the finite element and
material modelling. Chapter 5 and Chapter 6 give comparisons on the responses of the blast
barriers obtained from both the SDOF and NLFEA methods. Chapter 5 deals with the static
analysis for the blast barriers while Chapter 6 discusses the dynamic response of the blast
barriers. In addition, the results obtained for validation studies of the finite element model will
be given in Chapter 5. Other discussions include responses of the blast barriers due to
parametric changes such as in-plane axial restraints, sensitivity to geometric imperfections and
strain rate effects. A brief discussion on the response of an assumingly infinite long blastwall
will also be given. Conclusions for the above works and the uncertainties uncovered in the
present work will be presented in the form of future recommendations in Chapter 7.
3

4

2. TECHNICAL NOTE 5 (SINGLE DEGREE OF FREEDOM METHOD)
2.1 INTRODUCTION
The SDOF method is particularly suited in assessing the response of the profiled barriers against
blast loading as the profiled barrier can be conveniently idealised to a certain extent as a simple
beam model where design charts are readily available. The method involves the idealisation of
the load and resistance functions, as well as converting the real system to an equivalent system
so that the displacement-time response of the equivalent system is exactly the same as that of a
particular point of interest in the real system. This is achieved through the use of transformation
factors. This is equivalent in equating the energies of both the real and equivalent systems. The
recommendations given by the Technical Note 5 from FABIG in the design of stainless steel
blastwall are based on the SDOF method and effective width concept. They are briefly reviewed
as follows.
2.2 DESIGN GUIDANCE
2.2.1 Design Basis
The design guide (TN5) on the design of stainless steel blastwalls is based on Eurocode 3 Part
1.4 which dealt with the design standard for structural stainless steel. Since hydrocarbon
explosion is a low probability event, load and material factors can be taken as unity, and large
deflections are usually allowed. The recommended deflection limits are in the range of span/40
to span/25 depending on the geometry of the blastwall and the proximity of any critical
equipment. Larger deflection is permissible if failure of the connections due to large rotations
and in-plane movement, and premature local failure are prevented.
When blastwalls are subjected to dynamic blast loadings, maximum moment usually occurs at
the mid span of the wall, possibly leading to local buckling that can results in a fold line at this
region. This local effect can limit the moment capacity of the section and cause gross rotation at
the support connection and shortening of the span. The suscept ibility of the section to local
bucking is classified as plastic (Class 1), compact (Class2), semi-compact (Class 3) and slender
(Class 4) sections. Class 1 elements are defined as sections which can form a plastic hinge with
adequate rotation capacity that justify a plastic analysis. At the other extreme, Class 4 elements
are defined as sections which their moment resistance is likely to be reduced by local buckling
effects. To allow for the reduction in moment capacity, an effective width concept is employed
to determine the effective regions of the gross section. TN5 propose the ductility limit of 1 for
Class 2, Class 3 and Class 4 sections, and 1.5 for Class 1 sections , although higher ductility
limits are allowed for sections verified by a finite element analysis.
The overall moment resistance of the blastwall may be governed by the local bucking effect,
flattening of cross section and any local crushing forces that may be generated from large
deflection. As stainless steel has no distinct yield point in their constitutive behaviour, the 0.2%
proof stress is often taken as the design yield stress to determine the moment resistance of the
section. Due to the dynamic nature of the loading, it is permissible to make use of the enhanced
design strength due to the strain rate effects. Typical strain rates for various classes of sections
are given in TN5 whereby appropriate enhancement factors can be used. Although most blast
walls can be regarded as simply supported (see Figure 1), possible end moments may be
generated. The enhanced stiffness and resistance are accounted for by adopting the effecting
length of the wall. Similarly, any rotation of the end supports will reduce the stiffness of the
wall and a reduced stiffness should be used as recommended in the TN5.
5

Blastwalls response should be governed by bending rather than shear failure as the latter can
result in brittle connection failure. Most blastwalls have adequate shear resistance but can be
critical in deep trough profiles where there is little scope for dissipation of bending energy. TN5
does not address this particular issue although it is required that the shear force induced by the
blast load must be less than either the plastic shear resistance or shear buckling resistance,
whichever is the lesser. In addition, transverse interactive effects of moments and axial stresses
due to local forces are explicitly required by the TN5 to check for adequacy after these local
stresses are determined by carrying out a local 1st
order frame analysis . These local loading
effects may reduce the material strength available to support longitudinal bending effects.
A flow chart illustrating the design procedures is reproduced from the technical note and shown
in the Appendix.
2.2.2 Single Degree of Freedom Method
As mentioned above, the design guidelines given by TN5 is based on the SDOF method. The
schematic diagram of idealising the real system into an equivalent spring mass model is shown
in Figure 2-1.
Figure 2-1 Equivalent spring mass model
The problem may then by formulated by means of the D’Alembert’s principle of dynamic
equilibrium and the resulting equation of motion for an undamped linear elastic system is
"" ( ) (2-1) M X + K X = F t e e e
where M K F t are the equivalent mass, stiffness and load of the equivalent system. These , , ( ) e e e
parameters can be obtained by applying the transformation factors to the corresponding
parameters in the real system. The transformation factors are determined on the basis of
assuming an appropriate shape function for the real system which can be determined from static
application of the dynamic loads. By equating the kinetic energies and work done between the
equivalent and real systems will result in explicit expressions for the equivalent mass and
equivalent load. The transformation factors are then conveniently defined as the ratio of the
equivalent system to the real system for the various parameters. By defining the resistance of the
system in terms of the load distribution for which the analysis is being carried out, the stiffness
transformation factor will be equal to the load transformation factor3. It follows that the
equation of motion can now be further simplified by introducing a load-mass factor KLM which
is defined as the ratio of the mass to load transformation factors. Furthermore, for a more
6

general nonlinear elastic plastic system, the stiffness term in Equation 1 is replaced by Rm for
the real system, i.e.
"" ( ) (2-2) MX + R = F t KLM m
Equation 2 can be solved by closed form solutions for some simple systems, or more commonly
by time stepping numerical techniques. For some simple beam or one way slab problems with
commonly encountered load time functions, the solutions for Equation 2 have been formulated
in useful design charts for both elastic and elastic perfectly plastic systems, damped or
undamped, which are available in Biggs3
and Interim Guidance Notes 8. In particular, the
concept of ductility factors are introduced for the elastic plastic systems whereby damage is
sometimes more appropriate to be assessed in terms of inelastic deformation rather than
maximum deformation.
2.3 GENERAL LIMITATIONS
Although the design procedures recommended by the TN5 is a relatively simple approach in
solving transient dynamic problems such as blast barriers subjected to explosion loadings, there
are some limitations in the approach which must be aware of. They are discussed as follows.
The accuracy of the SDOF method relies heavily on the representation of the real system with
the equivalent system. In some cases, this idealisation is not easy to accomplish such as
complex connection details or blast panels that respond anisotropically. The former case can
result in different support stiffnesses that are neither pinned nor fixed which most design charts
are derived from. For a simply supported blast barrier, the TN5 do allow for the reduction of
panel stiffness due to rotation of supports which is based on effective span concept. The
approach is somewhat ambiguous and further clarification is required. In addition, for complex
loading functions which can possibly vary spatially and temporally, the efficiency of the method
is limited. Furthermore, it must be remembered that since idealisation of the real system is based
on a single degree of freedom in the real system, there is only a one to one correspondence to
the equivalent system.
The present guide (TN5) allows for strain rate effects by applying an appropriate enhancement
factor to the design yield strength (0.2% proof stress) based on average strain rate experienced
by different class of sections for different response regime (elastic or plastic). It is well known
that strain rate has different degree of enhancement to the yield strength and ultimate strength
for stainless steel, with the former being more sensitive to rate effects. This may result in unsafe
predictions in large plastic deformation. In any case, it is unrealistic to expect strain rate to be
uniform spatially and temporally throughout the response. It is presumed that the recommended
strain rates is based on typical triangular load profile which may not necessary represent the
worse case scenario given the fact that there is still many uncertainties in terms of load
predictions that can be generated from explosions in a topside module. The effects of the
stiffening of the blast panel on the integrity of the connection details have also not been
addressed. Nevertheless, a time stepping solution for the single degree of freedom system can
allow the updates of the enhanced stress periodically, but will however complicate the solution
procedures and may not be efficient for the purpose of routine design.
The minimum specified rupture strain given in the guidance as well as in most design codes are
based on quasi-static uniaxial tensile test. This may be uncons ervative due to the presence of
multi axial stresses and dynamic effects that is known to reduce the rupture strain for stainless
steel.
7

For most typical blastwalls installations, membrane actions which can influence on large
displacement response may not be significant due to the lack of axial restraints of the
connection details. This however requires further investigations to quantify the effects of
various connection details on the membrane effects. It is noted that further works are now being 11
carried out by NORSOK9
and FABIG 10,
to incorporate membrane effects into the SDOF
method.
The ductility concept as mentioned above is an effective means of assessing the allowable
permanent deformation of the blast panel with respect to its elastic peak deformation. They
however do not consider any local ductility and local instabilities that may govern the design of
the blast barrier. TN5 has provisions for separate checks on local instabilities due to the local
out of plane forces caused by the longitudinal moments. This involves the derivation of the local
forces and a subsequent detailed frame analysis. On another scale of consideration, the present
TN5, as in most static codes of practice, provides only element design guidance and therefore
do not give any information on the interactive effects of the components in the entire structural
system.
The present SDOF method has not considered imperfections and higher frequency modes that
can have significant effects on the response of the blast barrier especially for Class 4 sections
subjected to higher load levels. Further discussions on the effect of imperfections are presented
in a later chapter. It will also be clear later that the method generally is not a good predictive
tool when severe plasticity is present. This is mainly the direct result of using idealised
resistance function which is either elastic or elastic perfectly plastic. A more elaborate approach
in defining this function is clearly required.
8

3. NON-LINEAR FINITE ELEMENT METHOD
3.1 INTRODUCTION
Explosion loading, such as that generated from hydrocarbon explosions, is a low probability
event and therefore large deflection and permanent deformation are usually allowed. Therefore,
non-linear geometrical and material behaviours should be accounted for in the response
assessment. This is best efficiently carried out by some forms of numerical algorithm such as a
non-linear finite element code (NLFEA). The NLFEA is probably the most accurate method to
account for these effects including accurate modelling of the supports which are vital in a blast
response assessment. In essence, the finite element method attempts to discretize a continuous
structure into a numbers of elements that can be represented by a displacement function:
n x = ∑ Nixi (3-1)
i =1
where Ni is the interpolation or shape function, x i is the basic nodal degree of freedom at node i , n is the number of degree of freedoms being considered. In fact, some of the main advantages
of the finite element method over other methods, such as the Rayleigh-Ritz method, are that the
interpolation functions are relatively simple, and formulations into a computer program can be
relatively easier.
The pres ent works involve the use of a general purpose commercial finite element package,
ABAQUS. The use of a finite element analysis has the added advantages of addressing some
inherent limitations of simplified techniques such as the SDOF method discussed in Section 2.3.
In principle, finite element method is no different from SDOF method in which both attempt to
idealise the real system into an equivalent system which can be readily solved by
numerical/analytical techniques. The major difference lies in the fact finite element method is a
far more versatile analysis tool and is applicable to a wide range of structural systems. For
example, there are no particular restrictions on the use of complex material response data,
loading profiles and boundary conditions. In addition, three-dimensional effects may be needed
for most blast assessment problems. A major drawback on the method is the time and expertise
involved in pre and post processing for a given structural system, which should improve upon
the analyst experiences. It is also necessary to provide detailed checks on the generated results
since the method inherently under estimates the displacement response since inadequate
discretization of the real system can result in too stiff a response. Some issues relating the use of
a NLFEA on blast response assessment will be given in this chapter.
3.2 MESH SENSITIVITY
It must be noted that the validity of the obtained results from a finite element analysis is at best
equivalent to the representation of the mesh elements of the idealised system to the real system.
Inappropriate mesh systems can sometimes lead to the masking of other failure modes such as
buckling which may otherwise dominate the response of the blast panels. A fine mesh may also
be needed to capture th e onset and spread of plasticity more accurately. It is difficult to establish
guidelines on the appropriate number of elements but prior experience on the investigation of
blast response of corrugated panel indicates that approximately 3000 and 8000 first order shell
elements may be appropriate for shallow and deep corrugated profiles respectively to obtain the
global response of the panel with good accuracy. This coincides with the design guide’s
recommendation of 4000 to 8000 elements. It is proposed that the required mesh density should
9

be based on prior experience on a similar system. In the absence of this, mesh sensitivity studies
should be carried out to determine a ‘converged’ solution. This is essential in non-linear
problems involving large deformation or discontinuous event such as contact.
T he strain fields at the connecting regions of the profiled barriers are highly sensitive to the
mesh density. These regions exhibit large strain gradient and strain singularities behaviour.
Therefore, a cont inued increase in the mesh density will although provide more information on
the strain variations, but the predicted maximum strain will increase correspondingly. Large
strain gradient regions are due to the physical restraints provided at the connections, and the
presence of the strain singularities are the direct results of simplification in the geometric
modelling caused by omission of the weld details and the assumed sharpness of the kinks in the
corrugation profile. It is recommended that to ensure an adequate mesh density, the strain values
at Gauss points are to remain relatively close to that obtained from the nodal points of the
element where the strain values are extrapolated and averaged from the Gauss points of the
connecting elements 12
.
For efficiency and adequate accuracy, it has been found that first order reduced integration shell
elements are appropriate for general blast assessment purpose. They are intended for both thick
and thin shell applications, and are designed for the analysis of structural problems involving
large displacements as well as finite membrane strains. Reduced integration helps to minimise
the possibility of over -stiff behaviour of the element by removing the additional integration
points that tend to capture higher deformation modes. Uniform mesh consisting of small and
low order elements has found to be suited for explicit numerical scheme. It helps to reduce
computational run time and yet able to produce accurate enough solutions. These elements are
built in with hour glass control to prevent zero energy modes and it takes account of the change
in thickness with the element deformation. Adequate mesh refinement and constraints to the
model may be required if hourglassing is significant. Numerical integrations are carried out at
the integration points so as to capture the material behaviour more accurately. Where detailed
analysis is required to determine the plastic strain developing in the weld of typical connection
details, solid elements are preferred. However this may require a very high resolution of the
mesh and can be hindered by the available computer resources. A local model may need to be
set up where its initial boundary and kinematics conditions are obtained from a global analysis
of the entire model.
Abrupt changes to the mesh densities will represent a poor discretization of the finite element
resulting in artificial wave reflections and should be avoided. Where mesh density is graded,
there should be no great discrepancy between the sizes of adjacent elements. As a general rule,
the equivalent dimensions in adjacent elements should not vary by more than a factor of 2. In
addition, the aspect ratio of the elements should be no greater than 2. Distorted elements can be
excessively stiff and unreliable results may be obtained especially at high ductility levels.
3.3 PARAMETRIC STUDIES
Another major advantage of using finite element method is the relatively ease in carrying out
parametric studies so as to develop an envelope of response for the blast barrier. At extreme
values of loading, the ductility values will become sensitive to the loading distribution. Coupled
with the sensitivity of the mesh density, it may be appropriate to carry out a parametric study to
establish the likely limits of containment pressures. It should also be noted that at high ductility
values, the response of the blast barrier can be very sensitive to the rise time of the pressure
profiles.
In some cases, where the actual pressure time profiles may be available, they can be directly
feed into the finite element analysis to provide a more realistic spatial and temporal load
distribution on the blast barrier. Sensitivity of any spikes in the pressure profiles, where the
10

magnitudes of such spikes can be several orders of magnitude greater than the design
overpressure, can also be assessed.
3.4 TYPES OF ANALYSIS
Depending on the objectives of the study, several types of analysis can be performed. Most
commonly, a static analysis can be carried out to validate the finite element model with
elementary static calculations, as well as carrying out sensitivity studies to establish a suitable
meshing scheme. This will provide confidence in the responses obtained from a full non-linear
dynamic analysis. If a quasi-static analysis is used to replace a dynamic analysis, then one will
have to ensure that the kinetic energy must be small (say 10%) when compared to the internal
energy in order for the solution to be valid. A linear dynamic analysis can also be carried out to
extract the natural frequencies and its corresponding deformation modes for subsequent
imperfection studies. As mentioned above, non-linearities should be included in blast response
assessment whenever possible. This included material and geometrical non-linearities as well as
non-linear response with respect to time such as strain rate. Non-linear geometric analysis is
necessary to capture any buckling response that may dominate the response for Class 4 sections.
Figure 3-1 Types of FE analyses for blast response assessment
Figure 3-1 shows the influence on the blast response by the various modelling assumptions on
the FE procedures. It is obvious that for a given deflection limit above 0.1% proof stress, a
linear elastic analysis can give a grossly unconservative prediction on the static capacity of the
blast barrier and its use is very limited. It is important to incorporate geometric nonlinearity and
some forms of stability functions to drive a fully NLFEA (including material nonlinearity)
solution so that representative response can be obtained. The types of stability functions used
depend largely on its availability with the FE packages considered. In Abaqus/Standard
package, the Riks algorithm is adopted in this study to determine the post peak response. In this
algorithm, the magnitude of the load does not follow any prescribed path and is itself part of the
solution. It may be also possible to make use of artificial viscous damping forces to stabilise the
solution or alternatively make use of dynamic analysis to predict the unstable response. The
prediction made by TN5 is also included in the figure and a more detailed discussion of
results will be presented later.
11

Both the implicit and explicit codes are available in most commercial finite element software
packages for the solution procedures. Implicit schemes involve the formation of a global
stiffness matrix and together with the residual nodal forces are used to compute the
displacement solutions. Explicit schemes involve integration of the computed acceleration
obtained by the nodal residual forces and masses. It is proposed to use the explicit codes for
brief non-linear transient analysis particularly when large deformation is involved since the
advantage of a bigger time step offered by the implicit scheme cannot be realised. The explicit
formulation is essentially a direct integration method which is particularly efficient in solving
large three-dimensional non-linear problems such as brief transient events caused by blast
loading. Computations are carried out element by element level and no assemblage of matrix is
necessary which would otherwise require the solution of a series of coupled equations as in an
implicit analysis. This allows non-linearities arising from contact and tearing to be handled in a
simple manner. Together with these computational advantages, the explicit scheme has the
added benefit of automatically accounting for local buckling effects due to the inherent
destabilising influence of the inertia which is built into the elements. However, this does not
imply that the correct buckling mode is reproduced due to the lack of initial distortions. Implicit
schemes on their own are not capable of capturing the sudden drop in the load displacement
relationship unless some forms of stabilizing algorithms are incorporated. Nevertheless, for
quasi-static and static analyses, implicit schemes still provide a more economical solution.
3.5 BOUNDARY DETAILS
Care need to be taken in modelling the end connection details as this can affect the degree of
mobilisation of the membrane effects. An under prediction of the membrane effects can over
predict the response of the blast panel and unsafe predictions of the reaction forces, while an
over prediction can prevent the onset of buckling. It is proposed that adequate details beyond
the blast panel should be provided so that a more representative of restraint and stiffness
conditions can be modelled.
For structural blast barrier systems, its integrity is often governed by the response of the
connection. If required, this should be further assessed. This may be achieved by modifying the
constitutive relationships (e.g. strain based failure criteria12
) or attachment algorithm of the
elements (e.g. nodal force based failure criteria 13, 14
). It may also be appropriate to carry out a
separate detailed analysis on the regions of interest by some forms of fracture mechanics
approach. For example, submodelling technique can be employed where the solutions
(boundary and kinematics conditions) obtained from the global model are used to drive the
solutions of a more detailed local sub model. Alternatively, the solutions from the submodels
can also be used as the performance criteria for the global models.
The recommendations given by the TN5 for the blast response assessment are based on a single
corrugation strip that assumed to behave as a simple beam model. In order not to over estimate
the restrained conditions along the boundaries, it may be necessary to carry out the study on a 2
or 3 corrugations model. Ev en so, particular attention may still need to model the boundary
conditions accurately so as not to affect the global response of the panel5. In cases where there
are uncertainties to the anticipated failure modes, a full panel or corrugated model is necessary
and symmetry or antisymmetry conditions should be avoided all together.
3.6 IMPERFECTIONS
Due to possibility of bucking of the section profile, imperfections may be required for the finite
element model. It is recommended in TN5 to study the effect of imperfections in a sensitivity
study from a NLFEA. An element size of less than 1/6 to 1/8 of the local buckling length is also
proposed by the technical note. In cases where the imposed boundary conditions are suspected
to hinder the buckling response, a full corrugation strip or panel should be modelled. This also
12

applies when axisymmetric bucking modes may be possible as for the case of stiffened sections.
In some cases, initial symmetry conditions may result in antisymmetry buckling response as in
the case of a shallow arch subjected to uniform pressure15
. More discussions on the effects of
imperfections are given along with the presented results in Chapter 5.
3.7 MATERIAL MODELLING
The constitutive relationship of the material in the plastic range can have a direct and significant
effect on the response and subsequent failure modes of the blast barrier. TN5 recommends the
use of actual stress strain curve material model if available, or otherwise an appropriate
idealised stress strain curve. The effects of the strain hardening range of the material model are
further discussed in Chapter 5.
On the other hand, strain rate effects can be easily incorporated into the material model by
means of a constitutive strain rate equation such as the Cowper Symond’s equation, or more
realistically by providing a full rate enhancement effects for all strain ranges. Care needs to be
exercised in using the Cowper Symonds equation to take account for the strain rate effects since
in some FE software packages, the enhancement factor has been decoupled from strain,
meaning that the same enhancement is predicted at all strain levels, which is obviously
unconservative at high strain levels. Moreover, the material parameters required for the equation
are normally provided by tests carried out at the proof stress region for a particular range of
strain rates.
13

14

4. METHODOLOGY
4.1 DESIGN GUIDANCE FROM TECHNICAL NOTE 5
In accordance to the design guidance from TN5, the maximum capacities and maximum
deflections of 3 profiled barrier sections as shown in Figure 4-1 were determined. These
sections have satisfied the geometric limits for the application of the design guidance given in
the technical note. The orientation of the profile with the blast pressure resulted in the wider of
the two flanges in tension. Table 4-1 shows the geometric properties of the 3 sections with span
X.
Figure 4-1 Geometry of corrugated profile
Table 4-1 Geometric properties of profiled barriers (mm)
Section t s h ? ? l1 l2 l3 L X X/r l1/t s/t l3/t s/l3
S1 11 639.8 554 60.0 200 320 240 1280 6000 29.4 18.2 58.2 21.8 2.7
S2 9 256.1 200 51.3 160 160 160 800 4000 51.3 17.8 28.5 17.8 1.6
S3 2.5 60.2 45 48.4 62.5 40 45 250 2322 130.4 25.0 24.1 18.0 1.3
Given the distinctive depth of the 3 sections, they may be arbitrary classified as deep (S1),
intermediate (S2) and shallow (S3) sections respectively. All barriers are assumed to be simply
supported at both ends. Both SS2205 and SS316 grades of stainless steel are considered in this
study. They have a minimum 0.2% proof stress of 460 N/mm2
and 220 N/mm2 respectively with
a corresponding Young’s modulus of 200 000 N/mm2. Other physical properties are based on
annealed condition according to BS EN 100088. Strain rate enh ancement factors for the design
strength are given in the technical note. The ductility of the sections is classified in accordance
to their material and geometric properties. They are summarised in Table 4-2 together with their
ductility limits given by the guide. In addition the checks of these criteria given by the static
code for stainless steel (SCI- P291) are also given in the table for comparison. All enhanced
design strengths due to strain rates have been used. A comparison between the two codes
indicates that TN5 has slightly less stringent criteria which do not reflect the need to have more
stringent slenderness limits due to a higher ductility demand caused by dynamic loading. The S1
SS2205 section is classified as Class 4 slender section and thus explicit provisions for reduced
effective section will need to be considered when determining the resistance of the section.
15

Further checks as stipulated in the technical guide have however shown that its full section is
effective. With lower yield strength, all SS316 sections have been classified as Class 1 plastic.
Table 4-2 Limiting width to thickness (compression flange) ratios for section classification
S1 S2 S3
Plastic Limit SS2205 17.1
(TN5) SS316 24.7
Plastic Limit (SCI- SS2205 16.7
P291) SS316 24.2
Classification SS2205 Slender Compact Compact
(TN5) SS316 Plastic Plastic Plastic
Ductility Limit SS2205 1.0 1.0 1.0
SS316 1.5 1.5 1.5
All responses for the barriers using the SDOF (Biggs Model) method are carried out as
described above. To facilitate the use of available design charts for maximum response
predictions, elastic perfectly plastic material behaviour is assumed. In addition, a simple
spreadsheet of the SDOF method has been prepared to obtain the time domain response.
4.2 FINITE ELEMENT MODELLING
The corrugated profile shown in Figure 4-1 and the connecting end plates are modelled by
means of first order reduced integration shell elements. Due to symmetry, only half of the blast
barrier s are first considered in the finite element models. Figure 4-2 shows the finite element
models for half corrugated S1 sections. The boundary conditions for the fictitious edges were
prescribed with symmetry conditions about the vertical planes perpendicular to these edges. For
validation of the finite element models, a single and three corrugation strips of the blast barrier
were set up. In addition, two mesh resolutions of 19 and 48 elements in its transverse direction
were studied.
To illustrate the effects of the above assumed boundary conditions, full corrugation models are
later investigated. Typical FE models for the 3 sections using the F3 mesh resolution are shown
in Figure 4-3.
Both the static and dynamic responses of the blast barrier were investigated by finite element
software packages Abaqus/Standard and Abaqus/Explicit respectively. To study the post
buckling and collapse behaviour for the static analyses, RIKS algorithm was implemented in the
solution procedures. Various types of analyses have also been carried out to investigate their
influence on the response behaviour of the blast barrier and make useful comparisons with the
responses predicted by the technical note. The boundary condition along the supporting edge
was initially assumed to be released in the axial direction so as not to induce significant
membrane forces. The effects of such restraints were later investigated in the dynamic analyses.
An initial analysis was also performed to extract the natural frequencies and corresponding
mode shapes. The natural frequenc ies obtained by the finite element models compares
favourably with that predicted by the TN5.
16

Figure 4-2 Finite element models for half corrugated S1 section
Figure 4-3 Finite element models for full corrugated profile barriers
17

Both the stress strain behaviour of the SS316 and SS2205 are derived based on the minimum
properties of the material (BS EN 10088). For many calculations, it is sometimes necessary to
idealise the stress strain curves. The design charts referenced in TN5 for an elastic plastic
system are based on an elastic perfectly plastic stress strain behaviour. To investigate the effect
of the strain hardening range of the stress strain curves of the material, the elastic perfectly
plastic material behaviour is compared with a more realistic modified Ramberg and Osgood
formulation which describes a continuous reduction in the plastic modulus with increasing
straining. The true uniaxial stress strain curves for the SS2205 and SS316 are given in Figure 4-
4. The figure includes the true stress strain plots of an assumed linear hardening behaviour for
comparison. Multi axial stress strain behaviour was calculated using Von Mises yield criterion
with an associated flow rule and corresponding isotropic hardening rule.
Figure 4-4 True stress strain material curves
18

5. STATIC ANALYSIS
This chapter presents a validation study on the influence of mesh density, number of corrugated
bays and idealisation of stress strain material curves for the finite element models. The static
resistance capacity and its corresponding response for the various profiled sections were also
established based on TN5 guidelines and elementary static calculations, and compared with that
obtained from the finite element analysis. Much of the works presented can be directly
translated in dynamic response for blast barriers giving the range of typical duration of
hydrocarbon explosions.
5.1 MESH DENSITIES AND NUMBER OF BAYS
Figure 5-1 shows the mid span deflections of S1 SS2205 for the finite element models with
various mesh densities and number of corrugations (Figure 4-2). A full non-linear analysis using
Abaqus/Standard ver 5.8 was performed for this study.
Figure 5-1 Sensitivity of mesh density and number of corrugations (S1 SS2205)
The various FE models have very little effects on the predicted maximum deflections but the
difference in the response behaviour of the post bucking phase is obvious. The coarse mesh
models (C1 and C3) do not predict any instability behaviour while the fine mesh models (F1
and F3) predict different post buckling response. F1 model gives a more ductile form of failure
and the failure of F3 model is brittle in nature. With this observation, it is perceived that the fine
mesh models will gives a more representative behaviour of the blast barrier under study. This
simple sensitivity study illustrates that inappropriate mesh schemes can lead to the masking of
failure modes such as buckling and the number of bays included in the model can affect on the
predicted ductility of the barriers. The latter effect will be more pronounced with high X/L
ratios since the response will tend to move from beam behaviour towards plate behaviours.
5.2 EFFECTS OF MATERIAL IDEALISATION
As mentioned above, the material properties for the stainless steel material are obtained from its
guaranteed minimum values. However, in most cases where there is absence of available test
19

data, some assumptions are still required to construct the full stress strain curves for input into
the FE models. Most simplified methods will assume elastic perfectly plastic analysis while the
assumption of linear hardening post yield response up to ultimate stress is also not uncommon.
A more realistic stress strain curve can be obtained by the modified Ramberg and Osgood
formulation16
which describes a continuous reduction in the plastic modulus with increasing
straining which is shown in Equation 5-1.
σ σ n
ε = +0.002 forσ σ 0.2
< E
0 σ0.2
(5-1)
ε σ σ σ0.2
σ σ0.2
m
forσ σ 0.2
− − = +0.002 + + ε >
σ σ E0 E
0.2 pu
u − 0.2
where
,ε σ Engineering strain and stress respectively
E0.2
,σ Tangent modulus and stress at 0.2% plastic strain respectively 0.2
,ε σ Ultimate plastic strain and stress respectively pu u
E0
Elastic modulus
,n m Strain hardening constant (5, 2.5)
σ0.2
and E0.2
= (σ / E )+ 0.002n
0.2 0
It should be noted that the modified Ramberg and Osgood formulation gives nonlinear response
of the material at all strain levels although nonlinearity becomes significant only at 0.2% proof
stress. The effects of the strain hard ening in the material models are shown in Figure 5-2. The
elastic perfectly plastic model under predict the static capacity of the blast barrier by
approximately 5% but the difference in the ductility before instability is about 100%.
Furthermore, a more ductile failure response at the plastic deflection limit is predicted by the
modified Ramberg and Osgood formulation.
Figure 5-2 Effects of material idealisation
20
The issue to take note here is that stress strain data derived from simple material test, if
available, should be used for an economical design. Unrepresentative material data could result
in unconservative predictions. For example, the yield strength from coupon test can be in the
order of 10-20% greater than the guaranteed minimum values. These differences must be
accounted for when assessing integrity of the connection as well as reaction forces transferred to
the primary support structure. If carbon steel is used as the blast barrier, the distinctive
difference between the upper and lower yie ld point may also need to be considered. For inelastic
response, it is the lower yield stress of interest although upper yield strength is often quoted
from coupon test certificates.
5.3 EFFECTS OF BOUNDARY CONDITIONS
Correct representation of the boun dary conditions cannot be over emphasized as it can
significantly influence the response of the blast barrier. There are three boundary regions
related to finite element modelling that need to be considered for the blast barriers:
5.3.1 In-Plane Restraint
T his refers to the support conditions at the ends of profiled blast barrier section. Typical blast
barriers connections consist of welded end plates that are extended from the flange of a support
girder (Figure 1-1). Together with most other connection details used on offshore topsides, the
assumption of simply support condition may suffice. However, care still need to be taken in
modelling this end connection details as this can affect the degree of mobilisation of the
membrane effects. An under prediction of the membrane effects can over predict the response of
the blast barrier and unsafe prediction on the reaction forces, while an over prediction can
prevent the onset of buckling. The actual response for most blast barriers will behave
somewhere between the two different conditions since significant mobilisation of the membrane
forces are unlikely in typical connection details but at the same time in-plane movement is
limited due to the bending stiffness of the end plates. It is proposed that adequate details beyond
the blast barrier should be provided so that a more representative of restraint and stiffness
condition can be modelled. Quantification of this effect will again be highlighted in the later
part of this chapter.
5.3.2 Boundary Conditions along Outer Corrugations
It has been illustrated above that at least 3 corrugation bays must be included in the model to
give a representative full response of the blast barrier. Symmetry conditions have been imposed
along the longitudinal edges of the outer corrugations in this study. A typical blastwall in the
offshore topside can run up to several metres in the transverse direction of the corrugations and
thus the assumed boundary conditions may no longer be valid as the degree of restraint along
these edges has been reduced. Using the S1 (SS2205 and SS316) sections as examples to
quantify any differences, comparisons between these two conditions are shown in Figure 5-3.
It is clear that the imposed boundary conditions along the edges of the outer corrugations have
under estimated the capacity of both the blast barriers although the maximum deflections at
peak load remain relatively unaffected. The capacity of the SS2205 is reduced by about 8% and
a massive 40% reduction for the SS316 barrier. In addition, the failure of the unrestrained
SS316 panel is gradual and remains relatively ductile after the ultimate load is reached. Thus it
is conservative to assume symmetry conditions along these boundary edges as the actual degree
of restrain is often difficult to assess.
21

Figure 5-3 Effects of restraints along outer corrugations
Figure 5-4 Deformed profiles for longitudinal restrained and unrestrained conditions
22
The resulting deformed shapes of the barriers are shown in Figure 5-4. For the SS2205 barrier,
no noticeable change in the failure behaviour is observed and therefore only slight differences
noted in the load displacement plots in Figure 5-3. For the SS316 panel, the deformed shapes of
the centre corrugation do not differ greatly. However, the trough failure of the end corrugations
is not observed for the unrestrained condition which explains the considerable reserve capacity
after peak load as shown in Figure 5-3. More extensive yielding is also noted for the
unrestrained condition that results in the gradual unloading phase after peak load. It is
worthwhile to note that the effect of this boundary condition on the deflection response is also
dependent on the ratio of length and overall width17
.
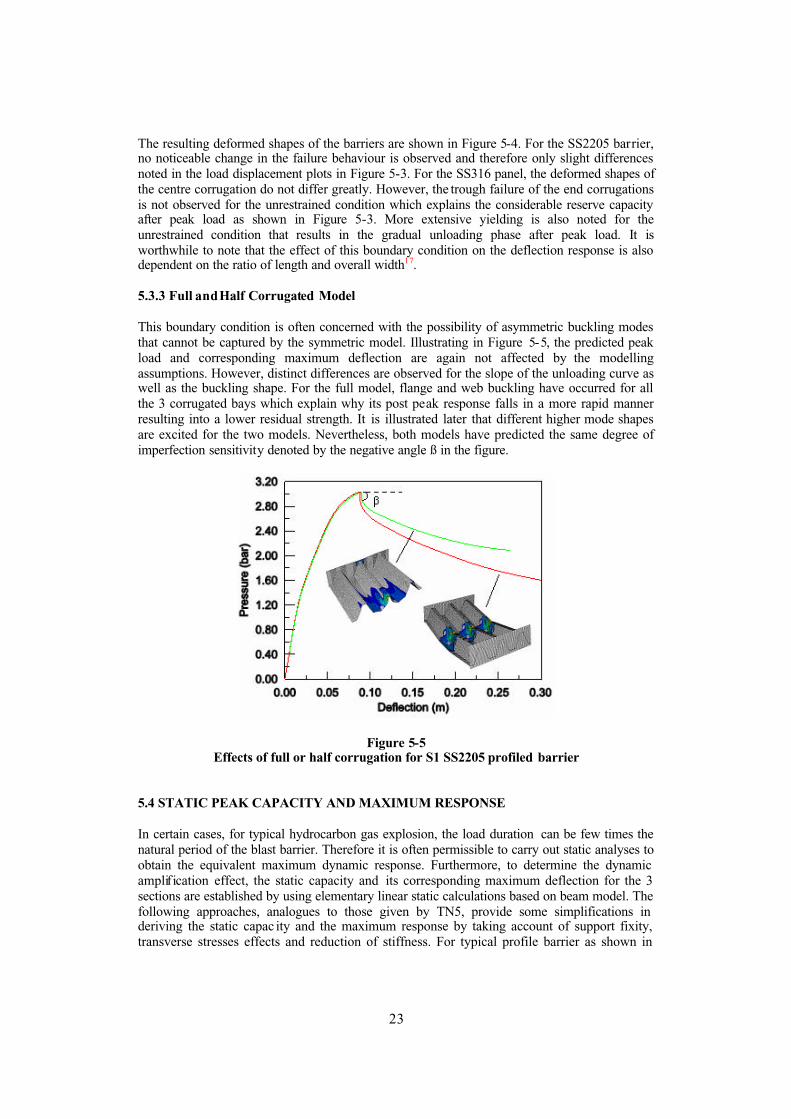
5.3.3 Full and Half Corrugated Model
This boundary condition is often concerned with the possibility of asymmetric buckling modes
that cannot be captured by the symmetric model. Illustrating in Figure 5-5, the predicted peak
load and corresponding maximum deflection are again not affected by the modelling
assumptions. However, distinct differences are observed for the slope of the unloading curve as
well as the buckling shape. For the full model, flange and web buckling have occurred for all
the 3 corrugated bays which explain why its post peak response falls in a more rapid manner
resulting into a lower residual strength. It is illustrated later that different higher mode shapes
are excited for the two models. Nevertheless, both models have predicted the same degree of
imperfection sensitivity denoted by the negative angle ß in the figure.
Figure 5-5 Effects of full or half corrugation for S1 SS2205 profiled barrier
5.4 STATIC PEAK CAPACITY AND MAXIMUM RESPONSE
In certain cases, for typical hydrocarbon gas explosion, the load duration can be few times the
natural period of the blast barrier. Therefore it is often permissible to carry out static analyses to
obtain the equivalent maximum dynamic response. Furthermore, to determine the dynamic
amplif ication effect, the static capacity and its corresponding maximum deflection for the 3
sections are established by using elementary linear static calculations based on beam model. The
following approaches, analogues to those given by TN5, provide some simplifications in
deriving the static capac ity and the maximum response by taking account of support fixity,
transverse stresses effects and reduction of stiffness. For typical profile barrier as shown in
23

Figure 4-3, the static capacity per unit area and its corresponding maximum deflection can be
estimated as
8 p zyPS = ⋅ fF ⋅ fC (5-2) 2X LE
5 p zX 2 ⋅ fCYS = ⋅ y E ⋅ fF (5-3)
48 EI fK
where
PS = static capacity of barrier
py = design strength (0.2% proof stress)
z = elastic/plastic section modulus
X E = effective length for partial fixation at support
E = Young's modulus
I = 2nd moment of area
= factor for flattening of cross section fF
= factor for local transverse stresses fC
= factor for stiffness reduction due to support rotation fK
5.4.1 The Reduction Factors
The factors are introduced to Equation 5-2 and 5-3 to take account of some effects that cannot
be explicitly considered by the SDOF method. They can be determined in accordance to the
procedures given in the design guidance. Assuming the similar top and bottom connections for
the blast barriers, the derivations of these factors are given below.
Figure 5-6 Reduction factor for flattening of cross section
Figure 5-6 shows the plot of fF with respect to the ratio of relative total local flanges deflection
and depth of section. The local flange deflections shown are in the sense of positive direction. In
24

this study, these local deflections are obtained at the point of instability or peak loading. It is
clear that the equation for fF given in the figure is not sensitive to the fact that the degree of
flattening is also dependent on the ? and the stiffness of the inclined web member. For example,
flattening is still possible with small ? while these local deflections remain negligible. In
addition, it is noted that although Yt for S2 is relatively high when compared with S1 section, it
is mainly due to the complex deformation mode (e.g. torsional with side sway of the web) of the
barrier and not the flattening of the section. Thus S2 and S3 sections have approximately similar
reduction factor. Nevertheless, Figure 5-6 also illustrates that the reduction factor is usually
small for the practical range of the x-axis values, especially for the S1 and S2 sections.
The reduction factor for transverse stresses effects fC are obtained by consideration of the
moment distribution of the entire cross section due to the presence of external forces cause by
the blast load and internal forces caused by the out of plane components of the longitudinal
bending stress. For the purpose of deriving the factor fC , it is simpler to assume only the
compression flange that is simply supported at its ends by the webs and loaded by the external
and internal forces as shown in Figure 5-7. This assumption allows one to avoid the more
elaborate moment distribution of the loading and is valid as long as the moment at mid span
remains sagging. This is indeed the case since the blast loading on the web and flanges are of
the same magnitude and has been verified for the 3 sections considered here (Note that the
assumption is possible since fC is dependent on the sum of absolute values for the end and
sagging moments of the compression flange assumed to be rigidly fixed at its ends, and in an
elastic analysis the sum is equal to the sagging moment of an assumed simply supported beam).
Figure 6 shows the plot of factor fC for the range of M A / M values. Reduction is only FLANGE
necessary when exceeds 80% of the compression flange moment capacity. M A
Figure 5-7 Reduction factor for transverse stresses effects
The factor fK is included to take account of the fact that for most blast barriers connections,
some rotation at the supports will occur and result in the loss of some initial stiffness K of the
blast barriers. To show the relationship between effective length and reduction of stiffness, the
factor can be reformulated from TN5 by considering the effective length factor as shown in
Figure 5-8. Note that there is an important inconsistency implied by the figure which shows that
25

with a smaller effective length, there is a greater reduction of the initial stiffness. It is unknown
at the moment the basis of this factor derived from TN5.
Figure 5-8 Reduction factor for stiffness
5.4.2 Results and Discussions
Table 5-1 shows the capacity and its corresponding response for the 3 sections. The subscripts
0.2 and PDL refer to responses obtained at 0.2% proof stress and at plastic deflection limit
respectively. The plastic deflection limit may be defined as a limit point where all the reserve
strength of the blast barrier has been used up. Some of the sections investigated do not exhibit
any such limit points due to the onset of the membrane forces. As such, the limit points are
arbitrary chosen as where the membrane effect starts to become significant. These membrane
forces are caused by the restraint in movement in the in-plane direction under large deflections.
Responses obtained from this boundary condition are shown in brackets.
Table 5-1 Peak static capacity and maximum response
Grade S TN5 NLFEA
Ff Cf Kf SP SY 0.2
P 0.2
Y PDLP P DLY
(bar) (mm) (bar) (mm) (bar) (mm)
S1 1.00 1.00 0.97 2.40 28.3 2.43 48.5 3.00 88.8
(2.57) (43.2) (3.19) (79.5)
SS
2205
S2 0.96 1.00 0.91 2.00 42.5 1.55
(1.67)*
61.2
(45.6)
2.11
(1.87)
341.3
(92.8)
S3 0.97 1.00 0.88 0.38 62.6 0.24
(0.12)*
74.7
(19.1)
0.34
(0.19)
231.2
(60.7)
S1 1.00 1.00 0.98 1.50 17.9 1.21 32.3 1.60 145.9
(1.29) (28.4) (1.65) (72.7)
SS
316
S2 0.96 1.00 0.84 1.07 19.7 0.75
(0.87)*
39.7
(29.7)
1.14
(0.99)
400.5
(82.5)
S3 0.98 1.00 0.77 0.22 29.0 0.12 50.2 0.17 220.4
(0.07)* (42.1) (0.11) (56.5)
26

The table shows that transverse stress effects( fC ) are negligible for all sections and the
flattening ( fF ) of the section is insignificant for the S1 sections as expected. It is, however, still
worthwhile to note that for the transverse stress effect, the internal crushing forces becomes
relatively greater than the external forces for smaller sections. This is because the moment
created by the peak external forces is rapidly diminishing for smaller l3 and the internal force, a
function of the longitudinal force and curvature resulting from bending, increases relatively
rapidly for smaller distance between the compression flange and the neutral axis of the section.
The stiffness reduction factor ( f ) is quite significant for the S3 SS316 section due to a smaller K
effective length ( X ) that is obtained by the consideration of the moment capacity of the end
plates and the barrier.
E
Figure 5-9Load displacement response for SS2205
Figure 5-10Load displacement plot for SS316
27

The comparison of the static capacity for the S1 SS2205 section correlates very well with the FE
prediction obtained at 0.2% proof stress. There is a discrepancy in the displacement prediction
since in TN5 yield is assumed to commence at 0.2% proof stress but yielding is in fact slowly
building up from the 0.1% proof stress as shown in Figure 4-4. The comparison of the rest of
sections correlate better with the FE predictions at the plastic deflection limits since they are
assumed to develop plastic moment for the compact sections and exhibit ductile characteristics
for the plastic sections.. It is also noted that significantly different responses have been obtained
from the 2 boundary conditions in the FE analyses.
The load displacement plots for these sections are shown in Figure 5-9 and Figure 5-10 for
SS2205 and SS316 respectively. It is clear from both figures that the restrained boundary
condition has resulted in a higher initial stiffness for all sections and different peak values. In
some cases higher peak pressures are predicted by the no in-plane restrained condition for
certain displacement range. This is evident for the plots of S2 and S3 sections before the
activation of membrane action since prior to this, there will be significant rotation of the end
plates that cause the reduction in the capacity of the barrier before significant tensile forces can
be mobilised, after which there is an apparent increase of stiffness. In contrast, rotation of the
end plates are not as severe for the no in-plane restrained condition as this is compensated for
the ‘shortening’ of the barrier due to in-plane movement. The stiffness predicted by TN5 lies
somewhere between these two extreme conditions and the predicted capacity is under predicted
for the slender section (i.e. S1 SS2205) and most importantly unconservative for the compact
and plastic sections particularly for the S2 and S3 sections. The peak capacity for the S3 section
has been over predicted by 10% and 22% for SS2205 and SS316 respectively. This is the direct
result of the use of plastic section modulus in the determination for plastic and compact sections
of the plastic moment capacity in an assumingly linear elastic fashion. From the observation of
stainless steel behaviour, non-linearity may become significant as early as 0.1% proof stress.
This behaviour of stainless steel has shown to be adequately described by the Modified
Ramberg & Osgood material stress strain curves16
.
For the purpose of comparison, the reserve capacity defined as P / P and ductility defined as PDL 0.2
YPDL / Y is tabulated below. The indicative values are given in extreme range from the two
different boundary conditions as discussed above.
0.2
Table 5-2 Comparison of reserve capacity and ductility upon yield stress
Grade
SS
Section
S 1
0.2/PPDL P 1.23-1.24
0.2/YPDL Y 1.83-1.84
2205 S 2 1.36-1.12 5.57-2.03
S 3 1.42-1.58 3.10-3.18
SS S 1 1.31-1.28 4.24-2.56
316 S 2 1.52-1.14 10.1-2.78
S 3 1.42-1.57 4.39-1.34
It is clear that there is considerable reserve capacity beyond the capacity predicted by the TN5
or at 0.2% proof stress. The S1 SS2205 barrier reaches its plastic deflection limit at 3 bar with a
ductility ratio of about 1.83 even for this slender section. Therefore only about 80% of the
barrier capacity is utilised. For the S3 sections, there is as high as about 50% of reserve
capacity. Comparison of the ductility ratios with those given in Table 4-2 highlights that the
ductility limits given by TN5 are rather conservative. All the barriers have been under predicted
for their available ductility that is dependent on geometry, material and stability as indicated in
Figure 5-9 and 5-10.
28

5.5 DEFORMATION OF SECTIONS
The deformed sectional profiles, for both in-plane restrained (R) and unrestrained conditions,
near mid span of the barriers are shown in Figure 5-11 below. All S1 sections are subjected to
severe local buckling irrespective of their classification. However, it must be mentioned that
buckling for the SS316 sections that are classified as plastic only occurs after substantial
inelastic deformation as shown in Figure 5-10. These local failures modes can be identified as
local bulging of the compression flange, flange failure, web failure, trough failure and as well as
the torsional side sway failure that is apparent for the S1 SS316 section due to its much lower
stiffnesses than the SS2205 sections, apart from its high s/t ratio. The latter failure mode has
also been noted in a previous study18
although it has yet to be identified in the TN5. It is also
noted that S1 SS316 section is subjected to severe non symmetric buckling and thus full
corrugation should be included in the finite element whenever possible. It is still however
unknown what has caused this complex failure mode. The in-plane restraining condition has
found to have pronounced effects on these deformations. It is evident that there are much higher
local crushing forces at the mid span of the barrier due to the in-plane movement of the barrier
resulting in very high localised curvatures. Due to this reason, the cross section for the S2 and
S3 sections under in-plane restrained condition remain relatively intact.
29

Figure 5-11 Sectional deformedprofiles
5.6 COMPARISON OF S1, S2 AND S3 SECTIONS
The response of the deep, intermediate and shallow sections for SS2205 is reproduced from
above and show in Figure 5-12 to investigate the effects of geometry. The deformation mode is
included in the figure. The S1 section (deep) has a brittle behaviour and is imperfection
sensitive. The initial stiffness of S3 (shallow) section is relatively low and continues to deform
indefinitely in the post peak phase after reaching the peak load. This ductile response is
somewhat expected due to its low s/l3, l3/t and s/t ratios. A past study17
has shown that instability
becomes critical when s/l3 is above 1.51 for a corrugated flooring system where only the flange
is transversely loaded. This correlates approximately in the present study.
30

Figure 5-12 Effects of geometry for SS2205
The response of the various sections is obviously also governed by the global parameter of X/r,
i.e. column slenderness of the barrier where r is the radius of gyration. For low slenderness ratio,
shear effects may become important and shear buckling of the web may occur. The S3 barrier is
seriously flattened at the end of the analysis. The S2 (intermediate) section offers an excellent
compromise between the S1 and S3 sections where its initial stiffness is comparable to that from
S1 and undergoes substantial ductile response into the post peak region before instability occurs.
Therefore, the S2 section has a higher dissipated energy capability than the other two sections.
What is also important is that both the S2 and S3 sections are not imperfection sensitive. This
study indicates that for relatively deep section, local stability may be the governing response for
the blast barrier, whereas for relatively shallow section, slenderness rat io of the barrier and
flattening of the panel may be important considerations. Apart from geometry parameters, the
material plays a significant role on the response of the blast barrier as well as shown in Figure 5-
11.
It is worthy to note from that the increase in capacity of the section by increasing its depth is not
equivalent in efficiency in the energy dissipating capability of the section. As a simple
illustration, the capacity M C of a profiled barrier plastic section with equal flanges can be given
by
p tH yMC = (2l +s) (5-4) 2
3
.
produce curvature of the section. It is given by
The strain energy S E of the section is made equal to the work done by the applied moment to
ε y.
3)S E = ∫
p t (2 l + sdX (5-5)
2 f
where f is the ratio of the distance from the extreme fibre to the neutral axis and the depth of
the section. Equation 5-5 suggests that increasing the depth of the section will not make any
significant improvement to the energy dissipating capability of the barrier when compared to the
increase in the bending capacity. Further to the effect of increasing the depth of the section, the
31

dynamic shear forces can be unacceptably high and increase the possibility of brittle connection
failure especially when subjected to short duration pressure loading.
Given the above discussions, the S2 sections generally perform better than the other sections
due to their ductile characteristics without the problems of instability. Nevertheless if the
membrane action of the S2 and S3 sections (see Figure 5-9 and 5-10) can be properly utilised
without compromising the integrity of the connections and nearby critical equipment, they are
very efficient form of energy dissipating barriers.
5.7 COMPARISON OF SS2205 AND SS316
With reference to the load displacement plots in Figure 5-9 and 5-10, the response for the S1
SS2205 section is much stiffer than the S1 SS316 section before the plastic deflection limit,
after which a relatively more brittle form of failure is observed. The S1 SS316 section develops
a more gradual loss of stiffness until an ultimate load is reached. Although there is a sudden
drop in capacity due to instability, the residual capacity is still somewhat stable partly because
of its superior strain hardening char acteristic. Stiffened profiles may be needed if the design is
governed by local bucking behaviour. The load deformation characteristics of the rest of the
sections are similar as they exhibit considerable ductility with no instability behaviour.
Figure 5-13 Dissipated energy of various barriers
Figure 5-13 above shows the dissipated energy for the various barriers. It is clear that the SS316
barriers are superior in their energy dissipating capability and is a more economical material
choice for blast barrier subjected to ductility level blast provided their capacities are adequate
against the design load. This capability is extremely important as it allows the dissipation of
local forces that built up and thus reduce the possibility of local instability, and at the same time
reduce the amount of reaction forces transferred to the support systems. In addition, plastic
yielding can helps to dampen out the elastic natural vibration that can be critical in congested
offshore topsides. Conversely, a plastic design that attempts to capitalise the full capacity of the
section will necessitate a closer attention to the possibility of local and global instabilities due to
large deformation.
Note that the benefits of the plastic dissipated energy for the S1 SS2205 slender section before
peak load cannot be gained under the current guidance of the TN5. A considerable heavier
32

section will thus be needed to ensure an elastic response for the given loading. The dissipated
energies shown for the S3 sections are due to membrane actions and have undergone very large
displacements. Thus it is likely that their limiting (critical) strain will be exceeded and their use
may be very limited to very low design overpressures (Critical or fracture strain of the material
is not considered in this study but the minimum fracture strain derived from static uniaxial
tensile test, 20% and 40% for SS2205 and SS316 respectively, is likely to be unconservative
due to dynamic and multi-axial stress state effects19
).
5.8 INITIAL IMPERFECTIONS
It has been generally recognised that apart from strength, stiffness and ductility that form the
basis of the acceptance criteria for a given blast barrier, stability criteria that are affected by the
degree of imperfections can influence the barrier response significantly. Initial imperfection can
be of initial distortion and residual stresses resulting from the fabrication or welding process
(welding process can also induce different tensile and compressive zones that result in initial
distortion). T he effect of imperfection is a function of modes of imperfection and its amplitude.
In general, the imperfection mode shapes can be related to the barrier fundamental mode shapes.
Due to the relatively complex geometry and loading for a profiled blast barrier, it is often
unclear which modes of imperfection is the governing response since higher modes may be
excited during dynamic load. This will be discussed in the next chapter. Figure 5-14 shows the
first ten natural modes shapes with the corresponding natural frequencies shown in brackets.
The mode shapes for half corrugated barriers are included to illustrate the gross differences with
full corrugated barriers.
Figure 5-14Mode shapes for S1 section
33

For most typical offshore structures, the mag nitude of the initial imperfection, Yo, may be
related as 20
2
l 3
σ0.2 (5-5) Y t = (0.05 to 0.15)
0/
t E0
The second term in the RHS of the equation may be considered as the slenderness parameter of
the flange or web. Taking S1 SS2205 section as an example, this term is approximately 1.1.
Figure 5-15 Effects of initial imperfection for S1 SS2205 barrier (static)
Table 5-3 Response of imperfect barriers (S1 SS2205)
Mode Yo/t ?/l3 Y/t KR PR RR Post Failure Response
0.05 1.0 6.8 1.0 0.96 0.74 Sudden
1 0.10 1.0 6.6 1.0 0.96 0.96 Gradual
0.15 1.0 6.6 1.0 0.96 0.96 Gradual
0.05 1.5 6.6 1.0 0.96 0.52 Sudden
2 0.10 1.5 6.5 1.0 0.96 0.52 Sudden
0.15 1.5 6.3 1.0 0.95 0.52 Sudden
0.05 1.0 8.1 1.0 1.00 1.00 Gradual
3 0.10 1.0 8.1 1.0 1.00 1.00 Gradual
0.15 1.0 8.1 1.0 1.00 1.00 Gradual
Notes:
Yo initial deflection
? local buckle wavelength at the centre of middle bay
Y total deflection
KR global stiffness ratio of imperfect to perfect barrier
PR peak load ratio of imperfect to perfect barrier
RR residual load ratio of imperfect to perfect barrier taken at 100t
34

Figure 5-15 shows the response of the imperfect barriers for the first 3 fundamental mode
shapes which are indicated in the figure. The proximity of the natural periods shown in the
brackets also indicates the imperfection sensitivity of the blast barrier. Table 5-3 gives a
summary of the responses in terms of those from a perfect barrier. It is noted that the global
stiffnesses and peak loads are barely affected by the range of imperfections considered. A more
significant effect is on the residual strength where only approximately 50% of the perfect barrier
can be obtained for the Mode 2 case. This is mainly due to the more severe instability behaviour
characterised as bulging of compression flange, web buckling and under more severe loading
the torsional coupled with trough buckling mode of the outer corrugated bays.
In terms of FE modelling, imperfections ar e a real feature and must be incorporated into the
model to induce possible instability phenomenon. However, the degree of imperfection has the
effects of smoothening out the sudden change of response near the peak load as illustrated in
Figure 5-15 by the comparison of the plots for Mode 1 5% and 10%. Table 5-3 also shows that
local buckling with wavelength of 240 -360 mm in the longitudinal direction at the centre of the
middle bay is about 1-1.5 times the compression width and can be captured accurately by 6-9
elements in the model.
Figure 5-16 shows an interesting finding of the response of the blast barrier with no
imperfection predicted by different versions of the Abaqus/Standard program running in the
same machine. The plots are obtained at the nodal positions indicated in Figure 5-17 that shows
the deformed shape of a S1 SS2205 barrier obtained from Abaqus/Standard version 5.8. When
compare Figure 5-17 with Figure 5-4 which is obtained from a latter version of the program
(version 6.3), it is immediately obvious that the different versions of the program have predicted
different deformed shapes which is also illustrated in Figure 5-16. However, the plot at nodal
position N10900 from Figure 5-4 compares favourably with the plot at nodal position N10948
obtained from Figure 5-17. This indicates that the general response behaviours are still similar
although different buckling shapes are predicted. The discrepancies are suspected to be due to
different numerical sensitivity of the two versions of the program.
Figure 5-16Comparison of different Abaqus/Standard version
35

Figure 5-17Deformed profile of S1 SS2205 obtained from Abaqus/Standard version 5.8
36

6. DYNAMIC ANALYSIS
This chapter presents the non-linear finite element dynamic analysis of the blast barriers
examined in the previous chapter. Their responses are compared with the responses obtained in
accordance to the guidance given in the Technical Note 5. Particular attention is given to the
validity of the SDOF (Biggs) method. Further works on the effects of in-plane restraint, initial
imperfections and strain rate effects are also discussed. The FE models developed here are in
accordance to the validating studies presented in Chapter 5.
6.1 DESIGN PRESSURE PROFILE
The response of a profiled barrier subjected to blast loading, particularly the local response at
high ductility values, can be significantly sensitive to the pressure time history curves. For most
offshore structures, their natural period to loa d duration ratio usually falls in the dynamic or
quasi-static regime. For most design of blast barriers against vapour cloud explosion such as
hydrocarbon explosion, it is generally suffice to assume an isosceles triangular distribution of
loading as shown in Figure 6-1 below. It will be later demonstrated that such is not always the
case and care need to be taken in adopting a design profile. All loads are assumed to distribute
uniformly across the barrier in the studies that follow. Therefore, any strain concentration in the
connecting regions is assumed insignificant.
Figure 6-1 Typical design pressure profile
6.2 MAXIMUM DYNAMIC RESPONSE
The approach given in Section 5.4 can be easily extended to predict the maximum dynamic
response of a blast barrier subjected to pressure loading as shown in Figure 6-1. In this case, the
* design yield strength py is replaced by py in Equation 5-2 and 5-3 to take account of the strain
rate effects and the inertia of the system is provided for by the Dynamic Load Factor (DLF ). For
plastic response, the concept of ductility factor µ is adopted where it is multiplied to the right
hand side of Equation 5-3 to obtain the plastic deformation. They are given as follows:
37

*8p zyRM = ⋅ fF ⋅ fC (6-1)
2X LE
YME =
FMAX X E ⋅ D LF E (6-2)
f KK
*
y E fF ⋅ µYMP = 5 ⋅
p zX 2
⋅ ⋅ fC (6-3)
48 EI fK
E M ,RM is the maximum resistance of the system and Y YM
P is the maximum displacement in the
elastic and plastic response regime. The Dynamic Load Factor DLF E is given in the elastic
d / d /response regime and is a function of t T . The ductility factor is a function of t T and the
maximum dynamic load factor that the blast barrier can resist, given by
F DLF P =
RM (6-4)
MAX
For blast barriers which can be idealised as a SDOF system, design charts and tables are
available2,3,8
to obtain the maximum dynamic response for the idealised system which is
assumed to possess certain resistance function subjected to various idealised forms of blast
loadings. Some typical resistance functions are shown in Figure 6-2. The idealised elastic
perfectly plastic function without taking account of the formation of intermediate hinges and
possible stiffen ing of the barrier due to membrane action is most common and will be adopted
here since their design charts are readily available.
Figure 6-2 Typical resistance functions
In accordance to the procedures outlined in TN5 and making use of Equation 6-1 to 6-4, typical
maximum response of the S1 section for SS316 and SS2205 are shown in Table 6-1 and 6-2
respectively.
38

Table 6-1 Dynamic response for S1 SS316
Loadings Dynamic Analysis
M AXF (bar)
t d(ms)
TN5 NLFEA (R)
E LY (mm)
µ MY
(mm)
0.2Y (mm)
µ MY
(mm)
0.5 30 17.4 0.44 7.7 - - 7.5
0.5 40 17.4 0.37 6.4 - - 5.9
0.5 50 17.4 0.34 6.0 - - 5.3
0.5 100 17.4 0.36 6.3 - - 5.7
0.5 150 17.4 0.34 6.0 - - 5.7
1.5 30 17.4 1.80 31.3 24.2 1.75 42.4
1.5 40 17.4 1.25 21.7 24.2 1.67 40.4
1.5 50 17.4 1.12 19.5 24.7 1.53 37.7
1.5 100 17.4 1.25 21.7 28.4 1.48 41.9
1.5 150 17.4 1.10 19.1 24.8 1.53 38.0
Table 6-2 Dynamic response for S1 SS2205
Loadings Dynamic Analysis
M AXF (bar)
t d(ms)
TN5 NLFEA (R)
E LY (mm)
µ MY
(mm)
0.2Y
(mm)
µ MY
(mm)
2 30 26.5 1.37 36.4 - - 38.7
2 40 26.5 0.95 25.3 - - 32.4
2 50 26.5 0.89 23.5 - - 28.6
2 100 26.5 0.94 25.0 - - 29.3
2 150 26.5 0.89 23.5 - - 28.8
3 30 26.5 4.50 119.2 40.1 1.85 74.0
3 40 26.5 4.60 121.8 40.0 1.67 66.6
3 50 26.5 5.00 132.4 40.3 1.48 59.8
3 100 26.5 9.98 264.5 40.5 1.42 57.7
3 150 26.5 20.48 542.7 41.0 1.38 56.4
39

In view of the range of values of the factors fF and fC given in Table 5-1 and the inevitable
uncertainties often involved in blast assessment, the value of the combined factor is
conservatively taken as 0.9. Checks can be carried out by the procedures outlined above. Only
in-plane restrained condition is considered here. Note that load durations td below 50ms are in
the dynamic regime while the rest are in the quasi-static regime (The natural period T for the S1
barrier is approximately 22 ms). For ductility ratio greater than unity, TN5 generally does not
permit plastic response for the S1 SS2205 section. It must be mentioned that no buckling
instability has been observed by the results discussed here.
As noted, there is good correlation between the NLFEA and the TN5 predictions for the case of
2 bar and 0.5 bar for SS2205 and SS316 respectively. It is obvious that in the quasi-static
regime, the duration of loading has little effect on the responses, but in the dynamic regime the
sensitivity of td becomes obvious. The highest response is obtained for the
( d /td = 30ms t T ≈ 1) case since the ductility factor is higher in this region when RM / F ≥ 1.0 .MAX
At higher loads level, the maximum response will generally increase with the t T ratio. When d /
overpressures exceed the static capacity at yield stress, the responses of SS2205 predicted by the
SDOF method become excessively large when compared to the NLFEA. This behaviour can be
explained by the design charts of an undamped elastic perfectly plastic system developed by the
SDOF method. At low RM / F ratio, the response is generally unbounded and has the MAX
tendency to grow exponentially with the t T ratio. Other factors that contribute to the d /
discrepancies include the inherent damping in the FE models, membrane effects and strain
hardening. In contrast, for the SS316 section, SDOF under predicts the response for the 1.5 bar
load cases as plastic deformation is still not extensive. This has also been observed in static case
as discussed above.
6.3 DYNAMIC EFFECTS
6.3.1 Dynamic Load Factors
Figure 6-3 Dynamic load factor
F igure 6-3 shows the plots of dynamic load factors (DLF) for the maximum response with
respect to the t T ratio. In general, DLF is dependent on the boundary conditions and the d /
40

d /
load functions. The DLF for the S2 and S3 sections are noted to be relatively small since under
static loading, they exhibit substantial ductility before attaining their maximum response.
load magnitudes. However, in a purely elastic analysis, DLF is only a function of t T and
Figure 6-3 also illustrates that for most cases of blast barriers subjected to hydrocarbon
explosions where t T is usually large, the maximum dynamic displacement response can be d /
predicted by static analysis, provided any premature failure can be prevented. This is also
illustrated in Figure 6-4 that shows the load displacement plots of the three sections for SS2205
material subjected to both dynamic and static loads. The plots for the S1 barrier also indicate
that dynamic instability occurs at a relatively higher pressure load than in the static case.
Figure 6-4 Dynamic response for SS2205 barrier
6.3.2 Initial Imperfections
The sensitivity of dynamic response to initial imperfection is shown in Figure 6-5. For the
dynamic case, buckling of the panel does not occur until 3.5 bar for a relatively long duration
(see Figure 6-4). This shows that buckling and imperfection are less susceptible to rapid
dynamic loading. It has been found that for low overpressures with short duration, imperfection
has little effects on the global displacement response. However, Figure 6-5 illustrates that the
Mode 1 imperfection has resulted in a greater response with the effects more pronounce for the
150 ms duration load. The effect of increasing imperfections has no significant effects but to
dampen the residual response and imperfection sensitivity increase with increasing peak load
and duration. In general, the buckling shapes shown in Figure 6-6 regardless of eigenmodes are
not very different from the static case as shown in Figure 5-11, although comparison of Figure
5-15 and Figure 6-5 indicates that the dominant mode of response is different from the static and
dynamic case. Unfortunately, no direct comparison is possible since at 3 bar (approximately
buckling load in static case) , dynamic loading does not result in any buckling phenomenon for
the duration investigated.
41

Figure 6-5 Effects of initial imperfection for S1 SS2205 barrier (dynamic)
Figure 6-6 Buckling failure for S1 SS2205 barrier (FMAX = 4 bar, td = 100 ms)
6.3.3 Strain Rate Effects
The effect of strain rate is shown typically for S1 SS2205 in Figure 6-7 for no in-plane restraint
condition. It is seen that apart from the slight variations in peak deflections, the effects are
generally minimal. This is due to the relatively small rate of strain at the middle of the blast
barrier. The highest strain rate obtained from NLFEA for the 2 bar load case is approximately
0.33 s-1
which is very much higher than the typical strain rate of 0.02 s-1
for a Class 4 section as
recommended in TN5. These given typical strain rates are independent of the magnitude and
duration of the loading. The resulting discrepancy may be translated as an under prediction of
the design yield strength of about 5%. Given the ensuing assumptions and uncertainties, this
may not have any significance. However it should be noted that at high load levels, for example,
the strain rate for the 3 bar load case may go much higher to about 1.3 s- 1
(see Section 6.4).
Presence of in-plane restraint conditions has found to result in slightly lower rate of strain and
42

the strain effects are expected to be significant at the connecting regions of the barriers and end
plates.
Figure 6-7 Typical strain rate effects for S1 SS2205
6.4 Limitation of SDOF and the Resistance Function
Although the SDOF method is a relatively simple approach in obtaining the maximum response
of the profiled barrier subjected to blast loadings, the above studies has highlighted some
limitations which need to be considered in a design study.
The accuracy of the method relies heavily on the representation of the real system with the
equivalent system. In some cases, this idealisation is not easy to accomplish such as complex
load functions or connection details that can result in different support stiffnesses which are
neither pinned nor fixed which most design charts are derived from. Nevertheless the design
charts are still of immense value in the initial design stage as long as the ductility level remains
low. However, some discrepancies have been observed and in some cases unconservative
predictions obtained as noted above. This is mainly the result of idealised resistance function
(elastic or elastic perfectly plastic) that no longer holds for the nonlinear behaviour, including
strain hardening and membrane effects, of the stainless steel profiles barriers. Membrane effect
is governed by the connection details and the membrane stiffness has shown to be as high as
35% of the initial stiffness for the S2 section investigated above and cannot be ignored. The use
of the idealised function implicitly assumes that there is a sudden change in the dynamic
characteristic of the barrier once plastic deformation occurs. The formation of the discrete
plastic hinges also assumes that deformation will become unbounded. It is important to note that
this can result in unconservative dynamic reactions calculated from the SDOF method due to the
different extent of plastic deformation along the barrier. For the above reasons, some efforts
have been made to incorporate some of these effects in the design charts, notably the NORSOK9
that takes account of initial shear stiffness for relatively short beam and membrane effects.
If it is assumed that the dynamic resistance of the blast barrier against deformation can be
represented by its corresponding static resistance, the uncertainties in the geometrical and
material effects can be minimised in the SDOF method. This is indeed a valid assumption
judged from the similar deformed shapes of the barriers when subjected to both static and
dynamic loadings. For the purpose of this study, the static resistance function can be
conveniently obtained from Figure 5-9 or 5-10. Some selected results are shown in Figure 6-8
43

and 6-9 below. In es tablishing the time domain response from the SDOF method, the constant-
velocity time stepping algorithm 3
is used. This method is simple and straightforward but
requires relatively large number of time increments. The time increment is made at least less
than hundredth of the natural period of the barrier. Upon attaining the maximum response,
unloading is assumed to occur at a stiffness equivalent to the average of the initial stiffness up to
0.2% proof stress.
This procedure is extremely useful sinc e in the initial design stage where the design loading is
usually unknown, one only needs to derive the static resistance curve once, after which the
SDOF method can be used conveniently to obtain fast prediction of various design loading
scenarios.
Figure 6-8 Dynamic response for S1 SS2205
Figure 6-9Dynamic response for S2 SS2205
44

Figure 6-8 and 6-9 show the time domain dynamic response for S1 and S2 sections subjected to
relatively long duration of loading (150 ms). To gauge the accuracy of the SDOF method, the
overpressures of 2 bar and 3 bar are selected so as to induce little and extensive inelastic
deformation respectively. For the reasons given above, the SDOF method is not capable of
predicting a close enough approximation to the NLFEA results for the 3 bar load case. When the
idealised resistance functions are replaced by the static resistance curves (denoted by *)
obtained from the NLFEA results, substantial improvements are observed for the 2 bar load case
where deformation and plastic ity are still limited. Obviously, some discrepancies still exist for
the 3 bar load case and the improved Biggs model tends to give a higher prediction. This is
because dynamic effects have not been taken into account in the model. To further improve the
correlation, the static resistance curves are enhanced by some suitable rate factors. However, the
initial part of the curve, up to the 0.2% proof stress, remains unaffected (The initial stiffness of
stainless steel is known not to be affected by rate effec ts). The factors of 1.05 and 1.10 are
proposed for the S1 SS2205 slender section and S2 SS2205 plastic section respectively2. These
plots (denoted by **) are given in the figures and the peak loads are very well predicted. The
residual deformations are slightly under predicted as expected due to the use of blanket
enhanced factor to the entire resistance curve (except the initial region). Although not shown
here, more detailed enhanced factors can be derived to take account of the fact that strain rate
effects diminishes with increasing strain. It is interesting to note that if the resistance curves
shown in Figure 5-9 and 5-10 are idealised as bi linear (or tri linear if membrane effects are
considered) curves by preserving the strain energy of the system, only little improvements are
made. This shows the importance of representing the resistance function with the actual load
deformation characteristic of the system.
6.5 Effects of Spikes in Pressure Time Histories
A typical pressure time history generated from a hydrocarbon explosion is almost always not
smooth in nature and exhibit characteristics of spikes typically less than 1ms as shown in Figure
6-10. Four idealisations of the pressure traces as shown in the figure will be investigated. P1 is
constructed based on the average peak stress of 1.5 bar with both the rise time and decay time
profiles intersecting the actual pressure trace at 10% peak. P2 is the more commonly adopted
pressure profile with equal rise and decay times. Both idealisations can also be extended to
include the negative pressure time profiles as P1-N and P2-N respectively. In addition, the raw
test data is smoothed by running average of raw data over 0.001 s. All idealisations do not take
account of the impulse of the original impulses.
Figure 6-10 Test and idealized pressure time profiles
45

The deflection time plot in Figure 6-11 shows that very good correlation can be obtained with
the idealisation techniques described above given its rather crude approach. P2 profile gives a
bett er approximation than P1 profile possibly due to its higher rate of increase in rise time that
compensate a slightly severe response brought by the spikes. As expected, the consideration of
the negative pressures has no effect on the predicted peaks but to dampen the residual response.
In cases where the profile barrier is used as floor construction supporting heavy machineries or
where there is rapid decay of the pressure trace from a very intense peak, it may not be
conservative to neglect these negative pressures.
Figure 6-11Effects of spikes (S1 SS2205): global deflection
Figure 6-12 Effects of spikes (S1 SS2205): plastic strain/dissipated energy
However, the investigation of the dissipated energy and the strain deformation gives a very
different conclusion that warrants some attention. This is illustrated in Figure 6-12. Both the P1
and P2 profiles have under-predicted the amount of total dissipated energy of the barrier and the
46

equivalent plastic strain at the mid-point (M) of the barrier. Perhaps a more important
observation is that there is evidence of local straining in the connection region (C) that is not
captured by the P1 and P2 profiles. Thus care needs to be taken when adopting the idealised
profiles for blast assessment especially when membrane effects are included in the analysis and
in cases where spikes of the pressure traces can be above 10 orders of magnitude than the
proposed idealised profiles.
47

48

7. CONCLUSIONS AND RECOMMENDATIONS
7.1 CONCLUSIONS
In this report, the current status for the design of blastwalls, particularly for stainless steel
profiled barriers, is reviewed. The distinctive response behaviour of various sections (plastic,
compact and slender) has been presented and some analysis tools for assessment of the blast
barriers are also discussed. The study highlighted several limitations inherent to the Single
Degree Of Freedom method. Validation studies on the design guidance given by TN5 have also
been discussed. Where detailed assessment of the blastwall is required, the study is best carried
out by a finite element study. Some recommendations pertaining to the numerical technique are
given so that an accurate response of the blastwall can be obtained.
7.1.1 Finite Element Modelling
It is now acceptable in the industry to make use of finite element analysis tool to derive an
economical and accurate solution at the final design stage for the blast barriers which are a vital
safety critical element. The study has given a comprehensive review on the general
considerations on the modelling of response of blast barrier. These reviews and some
recommendations given are based on prior experience on similar analyses and results have been
validated with experimental results. These are particular useful to marine or offshore engineers
that want to exploit the post elastic strength of the blast barriers by using NLFEA.
Issues that need closer attention include strain singularity and modelling of tearing or weld
failure. In general, strain singularity cannot be eliminated in a profiled blast barrier and it is
often only necessary to ensure that the difference between nodal and Gauss points values is not
too large. Provided the connection remains intact, such differences have found generally not to
exceed 10%. When subjected to high straining, tearing of panel near the connection can occur.
This must be included in the model and when only global response of the barrier is required,
simple numerical algorithms have been suggested without resorting to a detailed fracture
mechanical approach.
Three profile sections with various classifications were analysed to highlight the significance of
the coupling effects between connection and barrier response. In this study, the barrier response
has been isolated from the influence of connection for illustrative purposes. In practice, the
detailed modelling of the connection is necessary. In addition, the use of minimum guaranteed
material values often given in design codes should also warrant some attention. This will affect
the classification of section and in extreme case can give rise to unconservative prediction on
the integrity of the connecting regions due to the higher connection forces caused by the
stiffening of the barr ier.
For general analyses such as to predict the static peak capacity, the use of a single bay profile
with relative coarse mesh has shown to be adequate. However, other information such as failure
modes and structural ductility can be misleading. The discrepancy can be expected to be even
more significant in a dynamic analysis using explicit solution procedures. At least 3 bays are
recommended to be included in the FE model for most cases. However, this should be
considered in the context of overall length to width ratio. For barriers with relatively long span
and short width, the response may become increasingly sensitive to the number of bays included
in the FE model. The various meshing schemes of the above study have similarly resulted in
various different post-failure responses although the predicted maximum deflections are
somewhat unaffected. Inappropriate meshing schemes or models, as well as types of analyses,
49

can grossly distort the blast barrier response by masking the instability behaviour. Some
guidelines in regards to the number of elements required are also given.
It has been proposed here to make use of static nonlinear analysis to establish the validity of the
finite element model before proceeding to a more detailed dynamic analysis. More importantly,
the dynamic amplification factor can be determined so as the physical meaning of dynamic
response for the blast barrier can be appreciated. Nevertheless, static analysis has found to be
appropriate for assessment of the blast response in the quasi-static regime except in the case
where high pressure loading resulted in severe inelastic deformation. This approach has helped
to establish the effects of material idealisation, boundary conditions and imperfection sensitivity
of the blast barrier as presented in this work. Furthermore, the threshold for the buckling load
has also been found to be higher for dynamic loading case. This is mainly the direct result of
susceptibility of buckling to increasing load duration as buckling has shown to be a time
dependent phenomenon.
The commonly adopted elastic perfectly plastic material behaviour has shown to give
unconservative prediction on the deflection response after yielding (0.2% proof stress) and the
predicted peak and ductility also do not correlate well with the actual material model. The
adoption of the commonly used Cowper Symonds constitutive equation to take account of the
strain effects has also been discussed. Material constants for this equation are normally adopted
from tensile tests carried out in the range from1.4 × 10-4
s-1
to 8 s-1. This is generally adequate
for most purposes but in regions where high strain values are anticipated, the equation may no
longer be valid and interpretation needs to be carried out with care. For many modern topsides,
higher overpressures with shorter duration can be generated from a typical hydrocarbon
explosion resulting in substantially higher loading rates and dynamic effects.
The imposed boundary condition on the FE model is another area that requires some
considerations before carrying out the analysis. The work here has shown that correct modelling
of the in plane restraint conditions cannot be ignored especially for deep sections subjected to
relatively long duration of high overpressures since buckling can be prevented in the presence of
membrane action due to the shift of neutral axis towards the compression zone. The assumption
of symmetry condition along the longitudinal edges of the outer corrugated bays results in
conservative pred iction and thus can be safely adopted for relatively long wall construction.
Half corrugated FE models can also been safely adopted as long as only peak load with its
corresponding deflection is of interest. This model however cannot give realistic post pe ak
behaviour and the forms of buckling shapes are also fundamentally different This is especially
crucial if the residual capacity of the blast damage barrier is to be determined to assess the
possibility of progressive collapse of the structure following an escalation of events.
It has been shown that relatively shallow sections (S3) are sensitive to the peak overpressure but
not to the duration of loading. In contrast, the deep sections (S1) are very sensitive to the
duration of loading. Intermediate sections (S2) generally give a superior performance than the
other two sections due to its ductile capability without indicating signs of instability up to the
overpressures investigated here (2 bar).
Only S1 SS2205 section was found to be imperfection sensitive in this study. This can be
conveniently investigated by the natural frequencies of the barrier or the shape of the static load-
deflection plot by comparing the primary stable path (predicted) and the unstable path. The
introduction of imperfection can help to trigger the otherwise missed unstable behaviour.
However, it is often unclear what are the fundamental modes of imperfection and their
corresponding amplitudes. In the absence of the required data, it is best to approach the problem
by conducting parametric studies to obtain the response envelopes of the barrier. This area of
study has been identified here that requires a more extensive and comprehensive study than
those presented here.
50

The effects of spikes as noted in a typical pressure time history obtained from hydrocarbon
explosion test data has always caused some concerns since some of the spikes can be many
orders of magnitude greater than the running average although they usually occur for a short
duration. The present study indeed shows that such spikes can result in localised effects that
may not be captured accurately by the idealised pressure profiles. The dissipated energy of the
barrier can also be misrepresented depending on the idealised profiles. This should be accounted
for and factored into the design calculation in regions of high strain gradient if possible. Global
deflection response, however, is barely affected by these spikes provided a representative
idealised pressure profile is adopted.
7.1.2 TN5 and SDOF
Some of the reduction factors to take account of the loss of stiffness due to support rotation,
local transverse effects and flattening of the profiled barrier have been discussed. Several
inherent limitations of the Single Degree of Freedom Method or Biggs Method ar e highlighted
and NLFEA study is required for detailed assessment of the blast barriers unless an appropriate
resistance function, suitably adjusted for any dynamic effects, for the entire blastwall system
(including connections) is readily available.
Good correlation between the predictions made by TN5 and NLFEA can be generally obtained
up to the elastic limit for the elastic section (S1 SS2205). The predictions made by the TN5 on
the plastic and compact sections can be unreliable and sometimes unconservative if significant
nonlinearity exists in the early part of the stress strain curve for the stainless steel which can be
described by the Modified Ramberg and Osgood Formulation. In any case, the use of the SDOF
design charts which are derived based on idealised resistance function should not be expected to
produce good prediction when there is extensive inelastic deformation. This is because the
idealised resistance function assumes the formation of discrete plastic hinge and upon further
loading, the deformation can be infinitely large especially at high ductility levels. This
discrepancy can be coupled with the effects of idealised support conditions that can significantly
influence the membrane action of the S2 and S3 sections as highlighted in the study. The
adoption of a strain rate enhanced resistance function of the real system has shown to be capable
of producing equivalent results that are predicted by NLFEA.
Given the increasingly complex geometries of a topside module, higher explosion load can be
generated and result in plastic response of the blast wall. The TN5 do not permit plastic
response for Class 4 slender sections. This is based on the assumption that they cannot achieve
their yield strength as observed in a stub test where the column is axially loaded. However, the
investigation of the S1 SS2205 profile has demonstrated that there is still considerable reserve
capacity of the section before instability. A more efficient design will result if this reserve
capacity can be exploited. F or the S1 SS2205 section, the static capacity can be increased by
approximately 25% with a ductility ratio of 1.84 before instability occurred if plastic
deformation is allowed. Similarly for the S1 SS316 section, the ductility ratio of up to 4 at
instability is much higher than the ductility limit recommended by TN5. For the remaining
sections, considerable higher reserve capacity and ductility is observed. This potential in saving
is expected to be even more significant in the dynamic load case since the instability of S1
sections is more susceptible to long duration loads.
The strain rates measured from the NLFEA are much higher than the strain rates recommended
by the design guide which ignore the effects of load magnitudes and durations. This however
did not result in any significant difference in the predicted response although discrepancy will
bound to increase for higher loadings than that considered here. The present sections have
shown to be less susceptible to buckling instability when subjected to dynamic loading than
static loading. At the current status, the provisions of slenderness limit check by the design
51

guide takes account of dynamic effect by adopting an enhance yield strength. With more
validation studies, it may be possible to relax the limits to allow for more efficient design.
This study has shown that there are considerable advantages in the use of SS316 material for
blastwall design. It allows better dissipating energy capability that can prevent the sudden onset
of instability and thus provide a better mean of retaining the integrity of the blast barrier under
high load levels that can cause permanent deformation. It is also noted that blast barriers which
are allowed to respond plastically have generally more reserve capacity and ductility.
Nevertheless, for plastic design, particular attention needs to be given to possible local and
global instabilities due to large deformation. For lower design pressure level, SS316 sections are
recommended for an efficient design. It however remains a challenge to make use of the SS316
sections to design against extreme blast levels due to its lower yield strength. The S2 section in
this study has also shown to have better performance than the S1 and S3 sections due to its
reasonable initial stiffness and ductile characteristics without any instability problem. Its
considerable membrane capacity can also be used to advantage if proper connections can be
detailed.
Although not presented here, it is clear that the TN5 does not give any slenderness limits on the
web/flange ratio (s/l3) and may potentially lead to an unconservative design. Additional
guidance is clearly required. The current slenderness limits of the flange and web element are
basically derived from static stub girder tests. Extensive works have since been carried out to
ensure a conservative design based on this specification with an effective width concept adopted
for the actual stress state. This is however not true for profiled sections subjected to blast and
little data is currently available to provide the same extent of validation. There is clearly a need
to take account of the interaction of various elements for the slenderness of the section.
7.2 RECOMMENDATIONS FOR FUTURE WORKS
Apart from some of the recommended works discussed above, the following proposals are
believed to be able to improve the understanding of the response of the blast barriers which can
directly lead to a more efficient design.
Given the increasingly complex geometries of a topside module, hig her explosion load can be
generated and result in plastic response of the blastwalls. More works should thus be directed in
developing simple methods for a plastic response analysis. The traditional approach of using
plastic modulus to obtain the plastic capacity and corresponding response for stainless steel
barriers is unsatisfactory especially at high load levels. Adequate provisions should also be
given to take account of the complexity of the connection details that can influence significantly
the response of the blastwalls. Ideally, the proposed method should be able to take account of
strain rate, membrane effects and local instability. Encouraged by the results shown here, it will
be invaluable if the derivation of an appropriate and adequate resista nce function for the SDOF
method could be obtained.
The efficiency and performance offered by the S2 section and SS316 material are encouraging
in this study. Further works should focus on the sensitivity of the model to slenderness that may
translate directly into potential design savings. This involves the investigation of different
profiled shapes such as the angle of corrugation and various width to thickness ratio. The former
governs the moment capacity while the latter affects the stability of the section. An optimal
design would results in maximum ductility with the given constraints.
The works discussed above have neglected the possibility of connection failure. Further
investigations in this region have shown significant yielding and straining especially for the S3
sections. There is obviously a lack of universal criteria that can investigate the integrity of the
barrier and its connecting parts.
52

61
REFERENCES
1. SELBY, C.A. AND BURGAN, B.A. Joint Industry Project on Blast and Fire Engineering for Topside Structures Phase 2 The Steel Construction Institute, 1998
2. BREWERTON, R. Design Guide for Stainless Steel Blast Wall – Technical Note 5 Fire and Blast Information Group, 1999
3. BIGGS, J.M. Introduction to Structural Dynamics McGraw-Hill, London, 1964
4. SCHLEYER, G.K. AND CAMBELL, D. Development of Simplified Analytical Methods for Predicting the Response of Offshore Structures to Blast and Fire Loading Marine Structures, Vol. No. 9, pp949-970, 1996.
5. MALO, K.A. AND ILSTAD, H. Response of Corrugated Steel Walls due to Pressure Loads Structures Under Shock and Impact, Bulson, P. S. (editor), Computational Mechanics Publications, 1994, pp165-173.
6. LEACH, P. Design Charts for Elasto-Plastic Design of Cladding panels Subjected to Dynamic Loading Proceeding of the Institution of Civil Engineers, Structures and Buildings, 1993, 99, pp55-
7. PLANE, C.A., BEDROSSIAN, A.N. AND GORF, P.K. FE Analysis and Full Scale Blast Tests of an Offshore Firewall Panel Int. Conf. On Offshore Structural Design Against Extreme Loads , ERA, London, 1994
8. BOWERMAN, H., OWENS, G.W., RUMLEY, J.H. AND TOLLOCZKO, J.J.A. Interim Guidance Notes for the Design and Protection of Topside Structures Against Explosion and Fire The Steel Construction Institute, SCI-P-112/299UK, 1992.
9. AMDAHL, J Design Oriented Methods for Assessment of Accidental Explosions Effects Response to Extreme Loading 2003, Paper 004, Toronto, 2003
10. BURGAN, B. Technology Transfer from Offshore to Onshore Structures The Structural Engineer, March, 2003 pp 15-16
11. IZZUDDIN, B.A. An Improved SDOF Model for Steel Members Subjected to Explosion Loading-Generalised Support and Catenary Action Report to The Steel Construction Institute, 2001
53

12. LOUCA, L.A. AND FRIIS, J. Modelling Failure of Welded Connections to Corrugated Panel Structures under Blast Loading Offshore Technology Report 2000/088, Health & Safety Executive, 2000
13. BOH, J.W., LOUCA, L.A. AND CHOO, Y.S. Finite Element Failure Modelling of Corrugated Panel Subjected to Dynamic Blast Loading Proc. of the Int. Conf. on Scientific Engineering and Computations, ed. by H.P. Lee and K. Kumar. Singapore, 2002, pp. 591-594.
14. BOH, J.W., LOUCA, L.A. AND CHOO, Y.SFailure Modelling of Corrugated Panel subjected to Dynamic Blast Loading Proc. of the 2nd Int. Conf. on Structural Stability and Dynamics, ed. by C.M. Wang, G.R. Liu and K.K. Ang. Singapore, 2002, pp. 698-703.
15. COOK, R.B. Finite Element Modelling For Stress Analysis John Wiley & Sons, U.S. 1995.
16. RAMUSSEN, K.J.R. Full Range Stress Strain Curves for Stainless Steel Alloys Journal of Constructional Steel Research. 59. 47-61. 2003.
17. ROCKEY, K.C. AND EVANS, H.R.The Behaviour of Corrugated Flooring System Thin Walled Steel Structures: Their design and use in buildings. Ed by K.C. Rockey and Harold V Hill. 236-258. 1969.
18. LOUCA, L.A., BOH, J.W. AND CHOO, Y.S. Deformation and Failure of Profiled Barriers Subjected to Hydrocarbon Explosions The Institution of Civil Engineers Proceedings- Structures and Buildings Journal. 2003. Accepted for Publication.
19. BOH, J.W., LOUCA, L.A. AND CHOO, Y.S. Strain Rate Effects on the Response of Stainless Steel Corrugated Firewalls Subjected to Hydrocarbon Explosions Journal of Constructional Steel Research. 2003. Accepted for publication.
20. SMITH, C.S. Imperfection Effects and Design Tolerance in Ships and Offshore Structures Transaction of The Institute of Engineers and Shipbuilders. Paper No: 1434. Scotland. 1981.
54

Printed and published by the Health and Safety ExecutiveC30 1/98
Printed and published by the Health and Safety Executive C0.06 02/04

ISBN 0-7176-2808-6
RR 146
78071 7 628087£20.00 9