Embed Size (px)
Citation preview

Health and Safety Executive
Safety culture on the Olympic Park
Prepared by the Health and Safety Laboratory for the Health and Safety Executive 2012
RR942 Research Report
Health and Safety Executive
Safety culture on the Olympic Park
Nicola Healey & Caroline Sugden Health and Safety Laboratory Harpur Hill Buxton Derbyshire SK17 9JN
Preparations for hosting the London 2012 Olympic Games and Paralympic Games have involved large scale construction programmes to deliver new venues and fit out existing buildings and infrastructure. The Health and Safety Executive (HSE), as the Government’s independent regulator for work related health and safety issues, wanted the 2012 Games to drive improvements in health, safety and welfare standards in the construction industry. Simultaneously, the construction client for London 2012, the Olympic Delivery Authority (ODA), was committed to ensuring this was the ‘safest and healthiest build on record’.
This research explored the Safety Climate during the construction phase of the London 2012 Games. The Health and Safety Laboratory (HSL) Safety Climate Tool (SCT) was used to collect data between 2008-2010. Positive SCT scores provided evidence of a strong safety culture. SCT scores were analysed alongside safety performance measures taken from across the Park (eg injury accidents, reportable accidents, and health and safety near misses), and demonstrated the effectiveness of the initiatives employed on the Park.
Interviews and focus groups were used to identify and explore the wealth of good practices across the Park, and enabled the development of case studies outlining the initiatives and practices that were employed. The London 2012 Games has demonstrated that it is possible and feasible to develop high standards of health and safety, and a culture that supports this aspiration within the construction sector. Many of the areas of good practice are frequently cited as being too complex to apply to the construction sector. This research provides evidence that it is possible, through engagement, worker involvement and organisational commitment to develop a strong safety culture.
This report and the work it describes were funded by the Health and Safety Executive (HSE). Its contents, including any opinions and/or conclusions expressed, are those of the authors alone and do not necessarily reflect HSE policy.
HSE Books
© Crown copyright 2012
First published 2012
You may reuse this information (not including logos) free of charge in any format or medium, under the terms of the Open Government Licence. To view the licence visit www.nationalarchives.gov.uk/doc/open-government-licence/, write to the Information Policy Team, The National Archives, Kew, London TW9 4DU, or email [email protected].
Some images and illustrations may not be owned by the Crown so cannot be reproduced without permission of the copyright owner. Enquiries should be sent to [email protected].
ACKNOWLEDGEMENTS
HSL would like to thank Sarah Binch and Victoria Bennett (HSL), Simon Armitage, Louise Brearey and Shila Patel (HSE), David Bottomley (Merlin Analytical Solutions), Lawrence Waterman, Karen Elson, Clare Ramsden, Heather Pilkington and Ros Seal (ODA), and all the companies and individuals who participated in the discussion groups and interviews – their time and effort is greatly appreciated.
This research is part of a suite of research projects and independent evaluations undertaken on health and safety on the London 2012 construction programme comprising:
n Leadership and worker involvement on the Olympic Park. n Occupational health provision on the Olympic Park and
Athletes’ Village. n London 2012: The Construction (Design and Management)
Regulations 2007 – duty holder roles and impact. n Safety culture on the Olympic Park. n Pre-conditioning for success. n Communication and action for a safer London 2012
Olympic and Paralympic Games. n Supply chain management for health and safety n Food safety and sustainability (Case study).
Research summaries are accessible on the London 2012 Learning Legacy website (http://learninglegacy.london2012. com/themes/health-and-safety/index.php) and should be read in conjunction with the summary for the project below which provides an overview of health and safety on the London 2012 construction programme:
n Delivering health and safety on the development of the London 2012 Olympic Park and Athletes’ Village.
Full research reports for all projects are/will be published on the HSE or IOSH websites.
ii
KEY MESSAGES
The Olympic Park project has demonstrated that it is possible and feasible to develop high standards of health and safety, and a culture that supports this aspiration, within the construction sector.
Safety culture was measured using a modified version of the Health and Safety Laboratory’s Safety Climate Tool (SCT). Scores for contractors working on the Olympic Park project were higher than the SCT ‘all industry’ dataset.
The Olympic Delivery Authority and its delivery partner played a key part in the development of a positive safety culture on the Olympic Park. They communicated their expectations clearly from the outset, requiring all Tier 1 contractors (i.e. primary contractors with overall responsibility for individual projects) to subscribe to the same Health, Safety and Environment (HS&E) Standard and regular reporting by Tier 1 Chief Executives to the ODA Board on HS&E performance.
A number of elements contributed to the development of an effective safety culture on the Olympic Park site, including:
• The strategic role of the ODA across the Park, with safety being set as a priority and integrated into the companies from the outset through standards and requirements.
• The clarity throughout the supply chain of the organisational standards and requirements, including the desire for cultural alignment (i.e. consistent commitment to the same Health Safety & Environment standard).
• The empowerment of Tier 1 contractors to develop their own processes and systems to deliver the ODA’s objectives. The ODA focused on engaging contractors, enabling them to develop their own good practice and drive their own performance. This allowed contractors to use and develop their own company processes.
• Recognition of the prestige of working on the Olympic Park and striving for excellence in all activities, including health and safety.
• The scale of the project and the length of the construction phase meant that there was sufficient time for initiatives to become embedded, and could be tailored to ensure their efficacy and success.
• Belief by workers in the genuine commitment within organisations, as the message was consistent and reiterated across the Olympic Park over time.
Through discussion with a sample of workers, supervisors and managers, HSL identified a wealth of good practice that had been implemented on site in relation to the eight factors of the SCT. This was distilled into eight case studies, one focusing on each of the factors. The research provides evidence that it is possible, through engagement, worker involvement and organisational commitment, to develop a strong safety culture.
The good practice identified in the case studies, plus the broader findings of the research, provide valuable learnings for the construction sector and wider industry as a model for making safety integral to ‘how we do things around here’.
iii

iv
EXECUTIVE SUMMARY
This report presents the findings of a research study commissioned by the Health and Safety Executive (HSE) and the Olympic Delivery Authority (ODA) to identify good practices amongst the construction companies working on the Olympic Park. The original intent was to develop case studies based on company-specific good practice. However during the research it emerged that the activities were not unique to any specific companies; therefore, case studies were developed based on the findings from across the companies for each Safety Climate Tool (SCT) factor. Information was collected using the SCT and the results are presented as case studies based on the following SCT factors:
1. Organisational commitment 5. Engagement in health and safety
2. Health and safety oriented behaviours 6. Peer group attitude
3. Health and safety trust 7. Resources for health and safety
4. Usability of procedures 8. Accident and near miss reporting
The high scores on the SCT demonstrated that the ODA and its delivery partner had created a structure that enabled the development of a good safety culture. SCT scores from the companies included in the study are currently the highest in the HSL SCT ‘all industry’ dataset. The findings from the SCT were supported by many examples of good practice discussed in the interviews and focus groups which were also used to identify ‘learning legacy points’ - the various practices, which led to the positive results observed on the Olympic Park.
The elements that contributed to the development of an effective safety culture on the Olympic site included:
• The strategic role of the ODA across the Park, with safety being set as a priority and integrated into the companies from the outset through standards and requirements
• The clarity throughout the supply chain of the organisational standards and requirements, including the desire for cultural alignment (i.e. consistent commitment to the same Health Safety & Environment standard).
• The empowerment of Tier 1 contractors (i.e. primary contractors with overall responsibility for individual projects) to develop their own processes and systems to deliver the ODA’s objectives. The ODA focused on engaging contractors, enabling them to develop their own good practice and drive their own performance. This allowed contractors to use and develop their own company processes.
• Recognition of the prestige of working on the Olympic Park and striving for excellence in all activities, including health and safety.
• The scale of the project and the length of the construction phase, which meant that initiatives had time to ‘bed in’, and could be tailored to ensure their efficacy and success.
• Belief by workers in the genuine commitment within organisations, as the message was consistent and reiterated across the Olympic Park over time.
The persistent effort devoted to leadership and engagement of staff, such that the desired behaviours and attitudes became embedded on site and were recognised as the only way of working is identified as the key to developing the good safety culture that was apparent across
v

the construction companies. Senior managers were aware of the risks of diverting attention from health and safety, consistently reiterated its importance and relevance to the workforce and put effort into it ‘feeling fresh’.
The examples described in the case studies are exemplary, and should be considered for adoption across the construction and other sectors. The following points are derived from the case studies and could be considered to achieve a positive safety culture:
Organisational commitment
• Management should appreciate the value of leading by example and demonstrating positive behaviours.
• Management should be visible and approachable.
• Management should provide support where conflicting pressures may arise.
Health and Safety Oriented Behaviours • Tailor workshops and campaigns to make them relevant and appropriate to workers (i.e.
based on trends in recent incidents/injuries on site), and incorporate interesting activities to engage the workforce.
• Use credible champions and guest speakers to help deliver campaigns and training messages.
• Use incentives to encourage positive behaviours on site (e.g. donating money to charity for observations submitted).
• Involve workers as well as management in observing behaviours on site, and recording observations.
Health and Safety Trust
• Use a variety of reward and recognition schemes within the workplace to encourage positive behaviours.
• Management should carefully consider the impact of their decisions and recognise the possibility of human error.
• Create regular opportunities for workers to discuss health, welfare, safety and environmental issues with managers and ensure agreed actions are followed through.
Usability of procedures
• Develop risk assessments following a structured process, with involvement from appropriately experienced workers who are familiar with the work tasks being assessed.
• Ensure workers have a clear understanding of risk assessment/method statement documents.
• Encourage workers to review the risk assessment documentation at the point of work
• Involve workers in discussions around risk assessments, method statements and other documentation, and use this as a basis for daily briefings to maintain high situational awareness.
Engagement in Health and Safety
• Develop a variety of reporting methods, communicate these to workers and consider ways of refreshing the methods adopted to keep their importance at the forefront of workers’ minds.
vi
• All workers should feel confident and empowered to discuss health and safety issues with anyone on site.
• Set clear health and safety expectations from the outset through the training and induction of new employees.
• Consider the development of a behavioural-based safety initiative to identify and embed good health and safety behaviours.
Peer group attitude • Devote time and resource to enable workers to develop strong, positive, working
relationships, and take responsibility for their own and others health and safety. • Workers and managers need to recognise the importance of fostering a safe and
supportive working environment and put measures in place to achieve it. • Make the working environment and job a positive experience for workers, encouraging
them to continue their employment, reducing transience and turnover where possible.
Resources for health and safety • Begin planning of work early to ensure resources (human and equipment) are agreed
and allocated prior to the project start date and to ensure enough time is allocated to complete the work safely.
• Consider the training needs of workers (e.g. role, tasks and equipment) and provide relevant training to affect lasting attitude and behavioural change and help ensure the competence of staff.
• Deliver training during working hours.
Accident and Near Miss Reporting • Ensure workers understand the purpose and value in reporting observations and near
misses using training, briefings and campaigns. • Develop targeted training to enhance workers’ understanding of what a near miss is. • Provide clear, timely feedback to workers to demonstrate the value of their observations
and any resulting actions, and make changes where appropriate. • Take prompt, appropriate actions, i.e. raising standards through improvements to
procedures and practices, to prevent accidents, reduce bullying and improve the working environment.
vii

viii
CONTENTS PAGE
1. INTRODUCTION ........................................................................ 1 1.1 Building the Olympic Park 1 1.2 Health and Safety on the Olympic Park 1 1.3 Use of the Safety Climate Tool on the Olympic Park 2
2. METHODOLOGY ....................................................................... 4 2.2 Case Studies 5
3. RESULTS................................................................................... 6 3.1 Overview of findings 6 3.2 Statistical analysis 6 3.3 Development of eight case studies 8 3.4 Findings and lessons learned from the 8 case studies 9 3.5 Dissemination of information 28 3.6 Learning legacy points 28
4. DISCUSSION AND CONCLUSIONS....................................... 33 4.1 Discussion 33 4.2 Conclusions 34 4.3 Transferability of lessons learnt 35
5. APPENDIX ............................................................................... 36 5.1 Appendix A - Example of case study briefing note 36 5.2 Appendix B - Statistical analysis of SCT and safety performance data 37
ix

x
1. INTRODUCTION
1.1 BUILDING THE OLYMPIC PARK
The Olympic Delivery Authority (ODA) was the public body responsible for developing and building the new venues and infrastructure for the London 2012 Olympic Games and Paralympic Games and their use after 2012. One of the key responsibilities of the ODA was building the Olympic Park, where many of the events and activities in 2012 will take place.
The Park had previously been characterised by largely industrial land which was fragmented, polluted and divided by waterways, overhead pylons, roads and railways. Major ground clearance works were therefore required before the site could be developed. Two hundred buildings were taken down and 90 per cent of these demolition materials reused on the site. Fifty-two electricity pylons were removed, and contaminated soil was cleaned and reused using innovative techniques including soil washing and bioremediation. Nearly 2 million cubic metres of earth were moved to form the platform for the Park’s ‘big build’, 20 million gallons of contaminated groundwater treated, and 5km of riverbanks refurbished.
The construction phase involved creating major venues for use during and after the events of 2012 (e.g. Aquatics Centre, Olympic Stadium), as well as the landscaping of new parklands (more than 4,000 trees, 74,000 plants, 60,000 bulbs and 300,000 wetlands plants being planted to create a new open green space for London – the largest planting project ever undertaken in the UK), and extensive infrastructure development. The peak workforce was estimated to be around 12,000 people and it is expected that around 30,000 people will have worked on the Park and Village over the lifetime of the project.
ODA appointed CLM Delivery Partner Ltd to undertake much of the work on its behalf. CLM managed the construction programme for venues and infrastructure in the Park and was responsible to ODA for ensuring that the construction work was delivered on time, to budget and to the specified quality. CLM was also appointed as principal contractor for certain areas of the Park. The work was organised via primary contractors who took overall responsibility for their individual projects (e.g. the building of the Aquatics centre). These were called Tier 1 contractors. Their sub-contractors are referred to as Tier 2s and their sub-contractors Tier 3s etc.
1.2 HEALTH AND SAFETY ON THE OLYMPIC PARK
ODA stated a commitment to the health and safety of workers and set out to provide a safe working environment. The ODA engaged and worked with contractors on health and safety issues, both directly and through CLM, to ensure that contractors also made this a priority. ODA’s Health, Safety and Environment (HS&E) standard outlined the requirements for those wishing to work on the project and formed part of the Work Instructions for every ODA construction project. The standard outlined a number of requirements relevant to leadership and worker engagement. Each Tier 1 contractor was required to have a behavioural safety management system in place, and to adopt a ‘no blame’ culture.
The construction sector is one of the most dangerous in Great Britain with 42 fatal injuries in 2009/10, a rate of 2.2 deaths per 100 000 workers1. The Health and Safety Executive (HSE), as the Government’s independent regulator for occupational health, safety and welfare, aimed to ensure that the construction phase of the 2012 Games helped to drive up standards of health,
1 The Health and Safety Executive Annual Statistics Report 2009/10. 1
1.3
safety and welfare in this industry. In addition, the ODA as the construction client for the London 2012 Games, committed to ensuring that the project was the safest build on record.
HSE engaged with the ODA from the project’s inception to develop a legacy from the London 2012 Games. This legacy aims to ensure that there are lasting benefits from the construction phase by embedding the lessons learned into other projects, both large and small. Throughout this report, a working definition of 'good practice' is used to describe standards that in some instances go beyond legal requirements (i.e. best practice). Lessons learned based on best practice have been included where there are clear business benefits.
USE OF THE SAFETY CLIMATE TOOL ON THE OLYMPIC PARK
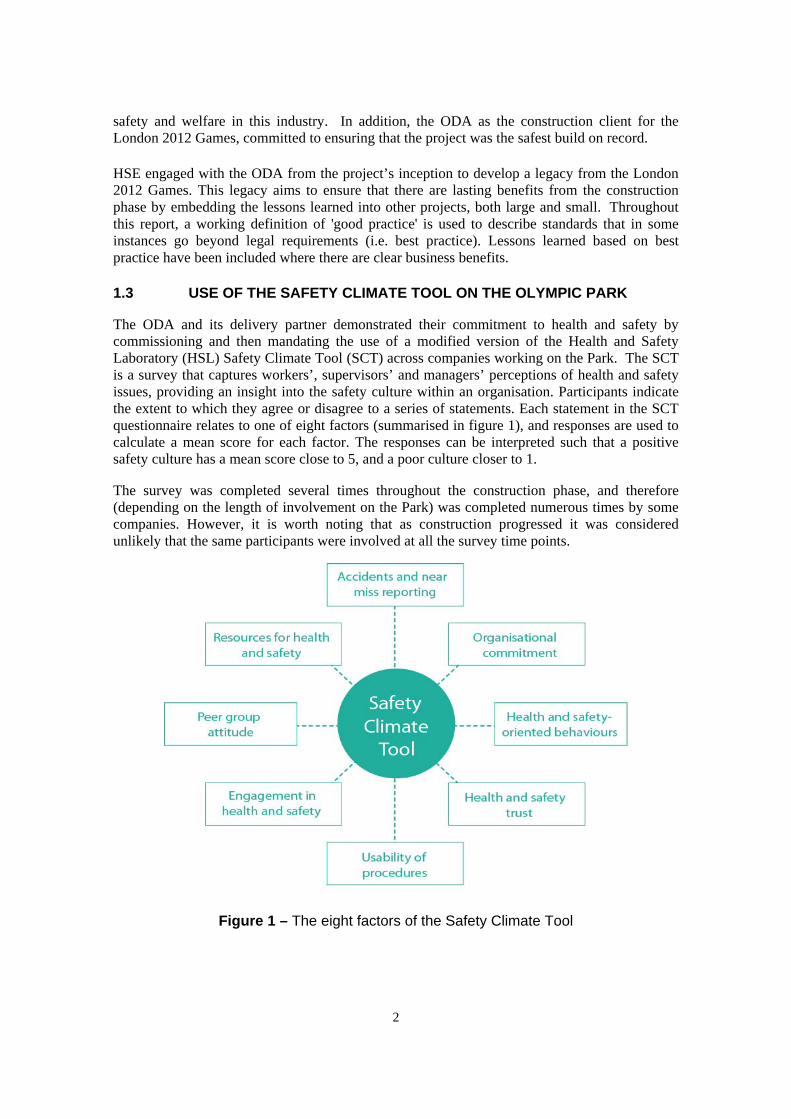
The ODA and its delivery partner demonstrated their commitment to health and safety by commissioning and then mandating the use of a modified version of the Health and Safety Laboratory (HSL) Safety Climate Tool (SCT) across companies working on the Park. The SCT is a survey that captures workers’, supervisors’ and managers’ perceptions of health and safety issues, providing an insight into the safety culture within an organisation. Participants indicate the extent to which they agree or disagree to a series of statements. Each statement in the SCT questionnaire relates to one of eight factors (summarised in figure 1), and responses are used to calculate a mean score for each factor. The responses can be interpreted such that a positive safety culture has a mean score close to 5, and a poor culture closer to 1.
The survey was completed several times throughout the construction phase, and therefore (depending on the length of involvement on the Park) was completed numerous times by some companies. However, it is worth noting that as construction progressed it was considered unlikely that the same participants were involved at all the survey time points.
Figure 1 – The eight factors of the Safety Climate Tool
2

1.3.1 Research Objectives
The use of the safety climate tool to “benchmark” health and safety performance is seen as the first step towards the development of 'real-life' examples identifying the ways that good safety cultures are delivered. The positive safety culture, and the examples of how this was achieved can assist organisations across sectors (regardless of their take up in using the SCT) to improve their own safety performance.
As part of the legacy work associated with the London 2012 build, HSL analysed the SCT results to identify companies across the Park with positive and/or improved SCT scores, and used this to develop a series of eight case studies based around each of the SCT factors2. The aim of each case study was to identify relevant good practices from companies across the Park that related to the positive responses received in relation to each factor.
Therefore the two main research aims were:
• To develop eight case studies from the construction phase of the London 2012 Games each relating to one of the eight factors within the SCT3:
1. Organisational commitment 5. Engagement in health and safety
2. Health and safety oriented behaviours 6. Peer group attitude
3. Health and safety trust 7. Resources for health and safety
4. Usability of procedures 8. Accident and near miss reporting
• To use the eight case studies to communicate health and safety legacy learnings for the Construction industry.
2In addition to the SCT framework, four additional factors (well being, occupational health, equality and inclusion and the environment) were included in the SCT questionnaires. The additional data was not analysed by HSL, and the report focuses on the eight case studies, relating to the eight SCT factors.
3 The original objective to develop eight good practice case studies relating to eight organisations was amended as many of the companies referred to similar activities that had been tailored for their site. Therefore the examples of good practice were organised by the SCT factor they relate to (rather than by organisation) to minimise repetition.
3
2. METHODOLOGY
HSL worked with the ODA to tailor the SCT specifically for use during the construction of the Olympic Park. The ‘shortened’ SCT (7 questions were omitted) was supplemented with additional questions on ‘environment’, ‘training’, ‘equality and inclusivity’, ‘wellbeing’, and ‘occupational health’. Companies were required to complete the SCT at various intervals whilst working on the Park. This was overseen by the ODA, and resulted in almost 10,000 responses across 20 companies between 2008-2011.
2.1.1 Statistical analysis of SCT and safety performance data
Statistical analysis of SCT scores and safety performance data (injury accident rates, reportable accident rates and near miss rates) was carried out to identify evidence of the nature and direction of any relationships. SCT scores collected across different time points were also analysed to identify any trends in SCT scores over time or consistently high (or low) scores. The statistical analyses were carried out using the Statistical Package for the Social Sciences (SPSS).
2.1.2 Development of case studies
Quantitative analysis of the SCT data
SCT scores were analysed to provide a statistical overview of the strengths and weaknesses (indicated by high or low SCT scores) of the organisations operating at the London 2012 sites across each of the eight factors of the SCT.
Data relating to 2008/2009 and 2010 was analysed to identify the “top performers” for each of the eight SCT factors. This information was used to inform the selection of appropriate companies to participate in the case study development, as well as information from ODA and HSE.
Safety Climate Scores across the Olympic Park
London 2012 SCT scores were compared with HSL’s ‘all industry’ dataset4 to highlight areas of strength (or weakness) in the context of health and safety working practice in the UK. This comparison enabled the scores of ‘top performers’ (companies with the most positive or improved SCT scores), to be benchmarked against other construction companies engaged on London 2012 work and industry as a whole.
2.1.3 Qualitative research and analysis
HSL carried out a series of interviews and focus groups across the seven ‘top performers’ to collect qualitative data relating to each of the eight SCT factors. The aim of this qualitative work was to develop an understanding of how the chosen organisations nurtured and developed health and safety success and how these working arrangements could be replicated elsewhere (i.e. more widely within industry). The themes for discussion were based on the SCT factors. The information sheet outlining the topics that were explored in the interviews and focus groups is shown in Appendix A.
4 Containing data collected from companies as part of wider benchmarking work being carried out at HSL.
4
2.2
The sample selection was informed by the results of the quantitative analysis of SCT scores, and for each of the companies identified the aim was to complete:
o An interview with a senior manager;
o An interview with a health and safety manager or Safety Health Environment Leadership Team (SHELT) member;
o One or two discussion groups (4 -6 workers)
It was not always possible to complete the intended number of interviews and discussion groups with each company. In total, 10 focus groups and 12 interviews were completed across the seven companies. These were arranged pragmatically to fit with the practical realities of completing the research (i.e. the adverse weather and to minimise disruption to work on the Park).
A thematic analysis of the focus groups and interviews was carried out to identify common themes and practices across the Park.
CASE STUDIES
The case study approach involves “gathering and analysing data about an individual example as a way of studying a broader phenomenon” (Vogt, 1999 pp 34). This is done on the assumption that the example (the ‘case’) is typical of the broader phenomenon, and may be an event, a society or any other object of analysis.
The examples collected from companies across the Olympic Park were structured around the eight factors within the SCT, and themes within these factors were identified. This information was then written up in the form of eight case studies. The same format was adopted for each case study, which consisted of:
• Definition of the SCT factor explored;
• A comment from the ODA on their vision for the factor;
• What was achieved;
• How it was achieved;
• The main themes (with specific examples); and
• Learning legacy bullet points.
5
3. RESULTS
3.1 OVERVIEW OF FINDINGS By June 2011 the ODA recorded around 62 million man-hours worked with an accident frequency rate (AFR) of 0.17 (calculated per 100,000 hours worked). In addition, 22 periods of one million man-hours had been worked without a RIDDOR-reportable injury accident.
In addition, the mean SCT scores from companies across the Park were greater than the highest scores in HSL’s ‘all industry’ dataset (as at Autumn 2011) for every factor, indicating a more positive safety culture.
The worker discussion groups identified a number of common practices across different companies on the Park. It became clear that whilst some of the specific practices were based on the ODA Health Safety & Environment Standard5, there were a range of ways in which this standard was delivered. For example, many companies had formal induction processes for workers on site, supervisory training, a focus on leadership and worker engagement, as well as the site-wide provision of access to occupational health services. Additionally, the ODA and the delivery partner coordinated activities across the Park using the Safety Health Environment Leadership Team (SHELT) to identify common practices and ensure site-wide adoption of good practices.
3.2 STATISTICAL ANALYSIS
Statistical analysis was conducted to explore the relationship between SCT scores, safety performance outcomes (e.g. injury accidents, reportable accidents, and Health & Safety near misses) and exposure to risk (e.g. number of hours worked by contractors and employees). The analysis was carried out on data from the seven companies selected for the development of the safety culture case studies. The safety performance outcomes were normalised for comparison by calculating the rate of incidents per million man-hours. The analyses showed mixed findings (see Appendix B for further details, including a discussion of the limitations of the data) but overall: • The lines of best fit associated with the scatter plots in Appendix B, describing the
relationship between SCT scores and accident injury rate, tended to suggest the existence of a negative association between the factors, that is, the higher the SCT score, the lower the accident injury rate. However, the values of the correlation coefficients associated with the plots were generally small (0.001-0.179), suggesting the variability in accident injury rate explained by the regressions was generally small.
• The scatter plots describing the relationship between SCT scores and reportable accident rate, in contrast, suggested the association between the factors to be the opposite to the above, that is, the higher the SCT score, the higher the reportable accident rate. In addition, the values of the correlation coefficients associated with the plots were consistently higher than those for SCT score versus accident injury rate (0.034-0.405), suggesting generally better fit between the variables in the regression, and therefore that SCT scores were able to explain more of the variability in reportable injury rate.
• However, equivalent plots for SCT scores versus near miss rate, suggested little or no association between factors (correlation coefficients ranging between 0.001 to 0.017).
5 The ODA stated a commitment to achieving excellence in Health & Safety management. Both the ODA and the delivery partner were responsible for ensuring that contractors meet the ODA Health Safety and Environment Standard.
6

Company-specific relationships between SCT scores and safety performance outcomes were also explored. This required SCT data to be collected at intervals of at least 6 months within the same company (and where safety performance data was also available for the same time period). Data was limited to two companies for these analyses i.e. it was only possible to identify two companies where data could be identified as being collected at specific time points (of at least 6-month intervals), due to the inconsistent records regarding when the data was collected. Comparison of injury accident rates and mean scores in SCT factors observed at earlier relative to later survey points, suggest both to have been subject to significant change over time, with accident rates decreasing and SCT scores increasing over the study period. These trends are also consistent with the view that higher SCT scores tend to be associated with lower accident injury rates. (see Appendix B, Table 9 for further information).
3.2.1 Safety Climate Scores across the Olympic Park
The mean safety climate scores of companies working within the Park were analysed and plotted in Figure 2, along with the upper and lower scores across the eight factors. These are shown alongside mean scores from HSL’s UK-wide SCT data set, which is made up of almost 20,000 returns, representing almost 40 UK sites with contributors from a range of companies including transport, manufacturing, construction, power generation and process industry. The data represents a variety of company sizes, ranging from organisations with 65 to 6,500 responses.
1
2
3
4
5 F1: Organisational commitment
F2: 'Health and safety' behaviours
F3: Health and safety trust
F4: Usability of procedures
F5: Engagement with health and safety
F6: Peer group attitude
F7: Resources for health and safety
F8: Accident and near miss reporting
Highest scores in all industry dataset Lowest scores in all industry dataset ODA mean ODA lower ODA upper
7
3.3
Figure 2: Safety Climate Scores compared to HSL ‘all industry’ data set
From this spider plot it is worth noting that for every factor, the ODA SCT mean scores were greater than the highest scores identified in the ‘all industry’ dataset which indicates that the Olympic Park has a better safety culture on the SCT factors. In fact, the lowest SCT scores from companies working on the Olympic Park were very similar to the highest scores in the ‘all-industry’ dataset.
DEVELOPMENT OF EIGHT CASE STUDIES
Synthesis of the SCT data, discussion groups and semi-structured interviews enabled the development of eight case studies providing an in-depth exploration of each of the eight SCT factors. In addition to the factor case studies, a number of other interesting findings emerged that provided an insight regarding the factors that contributed to the development of an effective safety culture on site. These can be summarised as the organisational climate that enabled a positive safety culture to develop across companies working on the Olympic Park, and included:
• The strategic role of ODA, including safety being set as a priority and integrated into the business through standards and requirements from the outset.
• Clarity throughout the supply chain of the organisational standards and requirements, including the desire for cultural alignment (i.e. consistent commitment to the same ODA Health Safety & Environment standard).
• The ODA empowered Tier 1 contractors to develop their own processes and systems to deliver the ODA’s objectives. This allowed companies to use and develop their own processes rather than adopting ‘client-decreed’ methods.
• The recognition of the prestige of working on the Olympic Park and striving for excellence in all activities, including health and safety.
• The scale and duration of the construction project meant that initiatives had time to bed in, and could be tailored to ensure their efficacy and success. Workers believed in the genuine commitment within organisations, as the message was consistent and reiterated across the Park over time.
The conclusions and outcomes of the case studies are reported in the following section under the eight SCT factors6.
6 Although the eight SCT factors are independent, by their nature they are interrelated. Therefore some examples reported by companies working across the Park were relevant to more than one factor of the SCT.
8
Productionvs. safety
Safety health and environment leadership team
Behaviour based safety
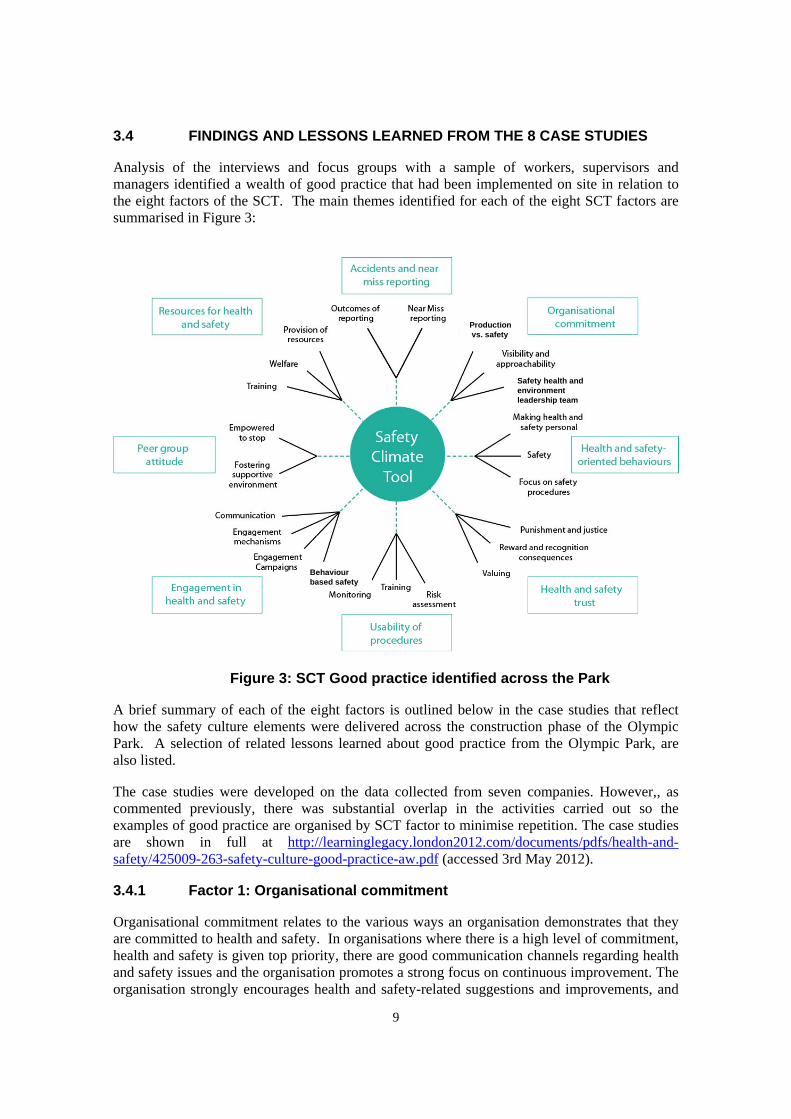
3.4 FINDINGS AND LESSONS LEARNED FROM THE 8 CASE STUDIES
Analysis of the interviews and focus groups with a sample of workers, supervisors and managers identified a wealth of good practice that had been implemented on site in relation to the eight factors of the SCT. The main themes identified for each of the eight SCT factors are summarised in Figure 3:
Production vs. safety
Safety health and environment leadership team
Behaviour based safety
Figure 3: SCT Good practice identified across the Park
A brief summary of each of the eight factors is outlined below in the case studies that reflect how the safety culture elements were delivered across the construction phase of the Olympic Park. A selection of related lessons learned about good practice from the Olympic Park, are also listed.
The case studies were developed on the data collected from seven companies. However,, as commented previously, there was substantial overlap in the activities carried out so the examples of good practice are organised by SCT factor to minimise repetition. The case studies are shown in full at http://learninglegacy.london2012.com/documents/pdfs/health-and-safety/425009-263-safety-culture-good-practice-aw.pdf (accessed 3rd May 2012).
3.4.1 Factor 1: Organisational commitment
Organisational commitment relates to the various ways an organisation demonstrates that they are committed to health and safety. In organisations where there is a high level of commitment, health and safety is given top priority, there are good communication channels regarding health and safety issues and the organisation promotes a strong focus on continuous improvement. The organisation strongly encourages health and safety-related suggestions and improvements, and
9
management behaviour strongly reflects the organisation’s commitment to health and safety by acting promptly over health and safety concerns as well as ensuring that working practices are safe.
The vision for organisational commitment
The ODA adopted a procurement strategy based on employing a number of Tier 1 contractors, and requiring them to both implement the spirit and letter of the ODA’s Health Safety & Environment Standard, and to also bring their own skills, knowledge and expertise to bear to achieve excellent performance. Underpinning this was a clear expectation from the most senior level of the ODA, that all Tier 1 contractors would display a high level of commitment throughout their organisations, from the most senior people on site up to their own Boards.
Good organisational commitment across the Park meant that:
• Workers believed health and safety was a high priority for managers (e.g. workers recognised and valued the ‘open door’ management policy).
• Managers listened to suggestions made by workers, and considered potential solutions before promptly implementing the most suitable option.
• Specific planning measures (e.g. the use of ‘package managers’, responsible for co-ordinating work packages), ensured that work was planned to avoid conflicts within work areas, and ensured early identification and minimisation of potential disruption.
• Investment in training (i.e. in developing communication skills) to ensure effective leadership on site.
• Venue leaders from different companies developed good working relationships (providing opportunities to discuss standard expectations on site, and sharing good practice) through the SHELT forum.
How was good organisational commitment achieved?
3.4.1.1 Productivity vs. safety
Companies across the Park worked hard to actively demonstrate and reinforce their commitment to ‘work safely or not at all’. Managers prioritised health and safety by discussing and resolving issues promptly, leading to clear worker messages (supported by toolbox talks) that ‘short cuts’ were not to be taken. Companies consistently recognised the value and importance of workers, with managers viewing it as their responsibility to shelter workers from pressures to ‘get the job done’ faster or continue working where there were health or safety concerns. Examples of how this was achieved included:
• Conflicts or pressures to get work completed faster were addressed and resolved at the contractor/supplier level, before workers felt pressured to take short cuts.
• Work on the Park was overseen by managers with responsibility (and oversight) of discrete work packages. This avoided overlaps and conflicts within work areas, and helped to identify and minimise disruption.
• Health and safety consistently featured on most meeting agendas, and was given a high priority (e.g. reorganisation of work during the extreme, adverse weather conditions and
10
managers delaying an activity until training in the use of a new piece of lifting equipment had been provided).
• Managers agreed to have a scaffold bridge built for safe access to a work site, in response to concerns raised by workers about a hazardous road crossing (despite a general policy against scaffold bridges being used on site).
3.4.1.2 Visibility and approachability
Companies on the Park consistently referred to the importance of managers who were frequently visible on site, and seen to be doing the right things (i.e. leading by example or questioning unsafe behaviours). Approachable managers enabled workers to feel comfortable raising issues or questions without fear of being criticised and with the belief that appropriate actions would be taken. This demonstrated managers’ commitment to health and safety, by providing consistent messages that managers would do as they say. Examples of how this was achieved included:
• One company highlighted the fundamental benefits of a senior management team that acknowledged the importance of health and safety. Management took a risk-based approach to work on-site, and fully appreciated the need to demonstrate their commitment to health and safety visibly to workers.
• Managers carried out daily walkabouts throughout shifts (i.e. at different times of the day so that they were seen by most workers). Managers took this as an opportunity to be both proactive and reactive to health and safety issues, and to involve workers in informal discussions on site. The management walkabouts were complemented with formal monthly meetings, which provided additional opportunities for two-way communications between workers and managers.
• Workers on one site praised a highly experienced project director as being very approachable due to his ‘open door’ management policy. The project director also stated that he consciously made efforts to appear more approachable to construction workers, and provided the example of removing his tie when engaging with workers (i.e. to minimise the perceptual gap between front line workers and office-based managers). In this way leaders considered how they could relate to their workforce most effectively.
• Managers recognised that historically, supervisors tended to have more technical experience but may not have developed the communication skills required for effectively communicating with workers. A number of companies appreciated the importance of approachable leaders on site, and training was given to help develop communication skills.
3.4.1.3 SHELT
The ODA encouraged SHELT meetings to be set up across the Park, providing an opportunity for leaders from each venue to get together, as well as meet regularly with the ODA and delivery partner. This enabled a common approach to activities across the Park to be developed and risks prioritised by sharing information and good practice and ensuring insight (e.g. trends in near misses) and consistency. These meetings also reinforced the ODA vision for companies working across the Park, and reminded leaders that they were part of a ‘bigger picture’. In addition, companies felt that SHELT:
• Set the benchmark for the culture and expectations of companies and individuals.
11
• Provided opportunities, and a mechanism for sharing good practice, and many of the companies reported implementing these good practices across their wider organisations (i.e. outside of the Olympic Park).
• Created a forum for decision-making. It reinforced the message that workers could stop work on safety grounds, and provided an opportunity to influence senior management from the companies.
3.4.2 Factor 2: Health and Safety Oriented Behaviours
Health and safety oriented behaviours are embedded in the working practices and daily activities of workers and concern the extent to which people work in a safe and healthy manner. This requires a shared understanding of the importance of health and safety at work e.g. safety procedures are strictly adhered to, and individuals do not take risks at work. Overall, there is a strong climate of safety where individuals are aware of the negative consequences of risk-taking behaviour and work safely even in the absence of supervision.
The vision for health and safety oriented behaviours
The ODA had a clear vision of the standards for health and safety behaviours, which was reinforced through various channels, including the obligation to operate a behavioural-based safety programme, provide free access to an occupational health service focusing on ill-health prevention and worker well-being, and above all the requirement for project leaders to ‘live’ the message by consistently demonstrating the behaviours expected from every worker on site. Consistent with this, safety tours, the correct usage of personal protective equipment (PPE), the willingness to stop work while getting safety right, and the emphasis on good health were all recognised as contributing to good health and safety behaviours across the site.
The practices implemented to encourage health and safety oriented behaviours across the Park resulted in the following:
• A shared understanding of the importance of health and safety at work, and its relevance to workers’ personal lives.
• Good health and safety behaviours embedded in daily working practices and activities encouraged workers to work in a safe and healthy manner, even in the absence of supervision.
• Workers appreciated the relevance of the various campaigns and training courses aimed at raising their awareness of health and safety. Individual workers therefore understood the importance of safety at work, and the negative consequences of risk-taking behaviours.
• A range of approaches, including safety stand-downs (where work was stopped to discuss safety issues) and workshops, helped to increase workers’ awareness of their personal susceptibility to injuries/accidents.
• Use of observation cards, regular inspections and site visits helped companies maintain a focus on working to safe procedures on site.
12
How were good health and safety oriented behaviours achieved?
3.4.2.1 Making safety personal
Companies across the Park took measures to ensure that workers understood the benefits of positive health and safety behaviours. Companies emphasised the relevance of the various campaigns and training courses to workers’ personal as well as professional lives. Examples of how this was achieved included:
• Following a serious incident, one company held global stand-downs to observe a minute’s silence, discuss how the incident happened, what could be done to prevent similar incidents from happening in the future, and where appropriate, changes to working practices or the site as a result.
• Following a series of eight minor accidents, one company had a site stand-down. The session was led by senior management, and involved discussions with workers to explore common factors across the incidents. A manual handling issue was identified, and a series of relevant “you tube” videos were shown to workers, followed by more discussions around the topic. A physiotherapist (from Park Health) developed toolbox talks to get the operatives involved (including physical challenges to engage workers). This approach to the site stand-down was intended to effectively deliver a serious message whilst incorporating some fun activities.
• The Injury Free Environment (IFE) process (a method for engaging workers in considering how to avoid accidents in all aspects of their lives) aimed to personalise safety to achieve behaviour change by influencing worker attitudes. Workshops held as part of the IFE process focused on the personal impact of injuries at work. An additional aim of the workshop was to transfer safety practices into workers’ home lives. Following the workshop workers were allowed a half a day’s paid leave to go and discuss the issues covered with their families.
• Filmed testimonies from Ken Woodward and Jennifer Deeney, (individuals affected by workplace accidents, and now involved in advocating safer working lives) were used to increase the impact of messages emphasising workers’ personal susceptibility to injuries in training courses, and helped to cascade the message that ‘it could happen to them’. This also served to highlight the potential impact of poor safe behaviours on friends and families.
3.4.2.2 Health and safety campaigns
Companies across the Park used a series of campaigns to gain and maintain worker commitment to healthy and safe behaviours. Typically, these included the use of a number of safety weeks. Safety weeks were facilitated and organised by supervisors. The weeks were timetabled and communicated to workers in advance, with workers allocated time to attend the events:
o Health and safety weeks included an environment week and a supplier week, which involved demonstrations of equipment and discussions.
o Daily supervisor meetings, where health and safety issues were co-ordinated.
• The introduction of the ‘Stretch and Flex’ procedure aimed to highlight the importance of health and safety, by identifying musculoskeletal problems amongst workers, and encouraging them to think about the relevance of these issues to themselves, their colleagues and their families. Initially, a survey was carried out to gain workers’ opinions on musculoskeletal issues. Campaigns were launched by an army sergeant or member of the
13
fire and rescue service, to gain workers’ respect and interest. In launching the event workers were trained in specific exercises, which were later rolled out to all workers and carried out on site before the daily briefings.
• ‘Beyond Zero’ vision was developed to promote a proactive approach to health and safety and help overcome workforce complacency. A Beyond Zero week was also held, involving the use of credible educators and team building activities.
3.4.2.3 Safety Observation/ Focus on safe procedures
Companies maintained a focus on working to safe procedures on site through the use of observation cards and regular inspections/site visits. For example:
• One company ran a ‘Don’t walk by' campaign, encouraging workers to record and submit onsite observations (both good and bad). Supervisors supported this drive by emphasising the importance of reporting observations, and reassured workers that they did not intend to use these to apportion blame. A summary of observations reported and resultant actions was fed back to workers through displays in the canteen. In addition, one contractor used incentives, and pledged to donate £1 to charity for each observation card submitted, with workers raising over £6000.
• Health, Safety, Environment and Quality (HSEQ) observation cards were used by the workforce to report anything they observed onsite (anonymously if preferred). The majority of observation cards focused on bad practice (90%). Individual feedback was not given but a weekly snapshot was selected and fed into Daily Activity Briefings (DABs).
• Management safety inspections and weekly supervisor visits were also conducted. The management safety inspections were carried out on a rotating basis, and consisted of managers from various companies walking out onto another site in pairs and carrying out inspections/observations, as well as speaking to workers on the site about any issues they had.
3.4.3 Factor 3: Health and Safety Trust
Organisations with high levels of health and safety trust have a strong commitment towards the continuous implementation and improvement of their health and safety procedures. Accident investigations are seen as learning opportunities and suggestions for improvement of safety procedures are always acted upon. Management adopt a proactive approach to health and safety by making sure that safety procedures are followed at all times.
The vision for health and safety trust
The ODA understood that within the construction industry there was a particular challenge around trust. For example, the rapidly changing employment arrangements, where workers had to move to other work sites when their element of work came to an end mitigated against the development of trust. Trust is often a measure of the extent of worker engagement, and the ODA was determined to encourage and demand standards of respect, consultation, daily briefings and other markers, which when applied together, can create a work site on which health safety and environment forms part of the daily “conversation” between workforce, supervisors and management. Trust was seen as essential for near miss reporting and other aspects of a system that engages everyone in continual improvement.
Following the implementation of trust initiatives, the following outcomes were noted:
14

• Workers and managers that had mutual trust and respect for each other and actively cared for one another, resulted in a workforce who felt they were listened to and valued.
• Good horizontal and vertical working relationships between workers and their managers, and a workforce who knew one another, had strong, working relationships, and felt confident to approach colleagues and managers regarding health and safety issues.
• A workforce that was more motivated to follow health and safety procedures.
How was good health and safety trust achieved?
When asked to consider trust, companies typically put forward examples related to fairness with respect to health and safety, indicating that this was central to instilling trust.
3.4.3.1 Valuing the workforce
Companies across the Park considered it important to demonstrate to all workers that their contribution, through their work and ideas, was valued. Companies worked hard to dispel the ‘them and us’ culture and build good working relationships. Management consistently recognised that the workforce was their biggest asset and conveyed this message to workers. This was achieved by:
• Management taking every opportunity to get to know their workers. For example, ensuring all workers displayed their first name on their coat and/or hardhat. This allowed managers and workers to have conversations with each other on a first name basis.
• Management recognition of the presence of human error, the impact of poor management decision-making and the necessity of a ‘no blame’ culture. Communicating this understanding to the workforce was vital.
• Developing (and communicating) documentation in relation to equality, diversity and inclusion to help foster respect. This was supported by leaflets and posters displayed in communal areas within each company.
• Ensuring everyone’s ideas were considered equal, enabling the workforce to feel confident that they could bring any issues to management’s attention, such as suggestions for safer ways of working.
• Allowing workers to work together over an extended period of time, to develop good working relationships.
3.4.3.2 Reward and recognition
Companies across the Park used various methods to recognise and reward their workers for their contribution to health and safety, i.e. for adhering to procedures, completing training, reporting incidents and near misses or putting forward suggestions. These methods helped instil trust, respect and demonstrate fairness to all. Examples of reward and recognition schemes in place included:
• An employee of the month award, whereby workers were encouraged to nominate their colleagues for engaging in good health and safety practices. Winners received a monetary reward and complimentary breakfast with the project manager.
• The use of verbal praise and thanks for reporting issues and adhering to procedures.
15
• The use of rewards such as pin badges, fleeces, water bottles, breakfast vouchers and scratch cards to both workers and managers.
• The implementation of a ‘knock off early on a Friday’ reward when good health and safety behaviours were demonstrated.
• The use of t-shirts or lanyards awarded to those who submitted useful HSEQ observations.
• The use of shields and trophies to reward suppliers. For example, a reward might be given to a supplier who had overcome a hurdle with their method statement, or who responded well following an accident.
• The use of specific rewards for contractors and/or teams. These were awarded on a monthly basis and operated a points system. Points were awarded for tasks, such as checking of method statements, housekeeping, attending meetings and toolbox talks. Points were deducted for failing to carry out these tasks or failing to wear PPE.
• Managers seen to give praise and recognition to workers for stopping work in unsafe conditions. For example, to highlight the importance of stopping work in unsafe conditions, one company implemented a one-month introductory reward and recognition scheme solely to reward those who had stopped work for safety reasons. This helped to increase the uptake of the initiative and give workers the confidence that it was okay to stop work for appropriate (i.e. health and safety) reasons.
• Systems in place to communicate the giving and receiving of rewards. This was typically carried out on a monthly basis and communicated via posters or pictures of the winners displayed in the canteen.
3.4.3.3 ‘Just’ consequences to actions
Companies also addressed any unwanted or unsafe behaviours that occurred by applying ‘just’ consequences. They typically ensured that any consequences were proportionate to the incident. Workers considered that these consequences were fair and helped to embed expectations of safe behaviour. For example:
• Red and yellow cards were issued based on observable poor/unsafe behaviours. Any cards issued were followed up with a discussion with the individual(s) concerned to establish why the behaviour was displayed.
• Additional safety training was offered to workers to address identified, unsafe behaviours.
• In some companies, those who failed to adhere to the rules were removed from site to prevent the rule from being devalued.
3.4.4 Factor 4: Usability of procedures
An organisation’s health and safety procedures should be clear, practical documents that are easy to use. They should be well designed, easy to follow and accurately reflect how the job is actually done. There should be a good balance between the number of health and safety procedures in place and the risks associated with a specific task.
16
The vision for usability of procedures
The ODA was aware that many accidents occurred when a work activity was undertaken outside the agreed processes and procedures, even where the work had been comprehensively described in method statements. However, the ODA also knew that such procedures had to be readily understood, and capable of being used to brief each work team at the start of work. So intelligibility and good communications were seen as equally important as accuracy.
The following outcomes and benefits resulted from the practices implemented to address usability of procedures:
• Good planning and communication during the development of risk assessments and procedures ensured clear, practical documents that were easy to use, and accurately reflected how the job was done.
• Companies followed a structured approach to ensure risk assessments were relevant to the work tasks on site.
• Periodic review of risk assessments and procedures ensured their ongoing relevance to the work being carried out.
• Accurate, up to date documentation enabled detailed work planning to ensure the appropriate allocation of people and equipment for work tasks.
• Training for workers on how to develop risk assessment documentation enabled employees to appreciate the risks on site.
• Monitoring of workers on site enabled managers to identify where workers were not following procedures, and whether this was due to the documentation not being accurate or the result of other issues.
How were usable procedures achieved?
3.4.4.1 Development of risk assessments as ‘live’ documents
Once developed, companies regarded risk assessment documentation as ‘live’ documents, requiring ongoing review and revision. The information collected in these documents enabled detailed work planning, whilst providing concise information that was accessible to workers. Further examples included:
• Risk assessments and method statements were developed relating to each task. Documentation was written by those with responsibility for carrying out the work and therefore knowledge of the best approach to take. This included the contribution and involvement of subcontractors (who would be involved in carrying out the tasks), followed by review of the documentation by the safety team. Where possible, risk assessments and method statements were written in advance of the project starting (around eight months previously) to enable planning of work tasks by managers and the identification of potential conflicts in work activities within a specific area. Procedures were also subject to reviews following feedback from an in-depth external audit.
• Development of ‘blue packs’ (information packs consisting of risk assessments, method statements and site diagrams, and detailing the necessary equipment for each task) to ensure workers had daily access to and could understand and make use of the information recorded
17

on the risk assessments in an accessible format. ‘Blue packs’ were used as the basis for daily briefing meetings, and discussed regularly with workers.
• One company used a dynamic ‘point of work’ risk assessment to review the existing risk assessment documentation and carry out a ‘gap analysis’ to identify any aspect of the job or working conditions that had changed. Any changes could then be assessed, in terms of changes to the associated risks, and workers could then satisfy themselves that they were happy to continue work as planned. Workers were encouraged and supported in stopping work where they were unsure or unhappy to continue (known as the STOP procedure).
• Use of pictures and illustrations in method statements to aid understanding and give instruction.
• Work planning was carried out in conjunction with the information in the risk assessments and method statements, and enabled planning of requirements for permits to work, risk assessments, method statements and rescue plans. These also helped to ensure appropriately experienced workers were involved in writing each document and were available at the right time to carry out the work – something which the workforce felt positively about.
• Supervisors understood local conditions in relation to a specific work task, and so had oversight over changes made to risk assessments or method statements.
3.4.4.2 Training
A number of companies across the park had implemented various types of training to develop and support employees understanding of risk assessment documents. Specific examples include:
• A series of ‘what is risk’ workshops run by the works manager and aimed at developing workers understanding of risk and risk assessment documents. The workshops were run in small groups to ensure effective instruction.
• Specific training on conducting risk assessments to help improve workers’ understanding on the process for completing them, leading to improved usability.
3.4.4.3 Monitoring
Following development of the procedures or method statements, companies used a number of systems for monitoring the ongoing relevance and appropriateness of these documents, and workers’ adherence to them including:
• Six monthly audits of systems and procedures to ensure that both the work task and the procedure remained appropriate and relevant.
• ‘Blue pack meetings’, involved discussions to review the contents of the ‘blue packs’. This was followed by supervisor walkabouts onsite to ensure workers were happy with the documentation. The aim of this approach was to maintain high situational awareness amongst workers.
• Use of discreet CCTV to observe and monitor work i.e. ensuring work was completed according to the relevant documentation and that no shortcuts were taken. Workforce appreciated that fewer shortcuts were taken due to the higher levels of observation and monitoring.
18
3.4.5 Factor 5: Engagement in Health and Safety
There is a high level of employee engagement in health and safety issues within the organisation and two-way communication between management and employees. Supervisors invest a great deal of effort in health and safety issues and ensure that these are openly communicated to, and discussed with employees. The organisation fosters a high degree of employee involvement where workers are given a ‘voice’ and are encouraged to express their views on health and safety issues that matter to them. There is clear line management support and feedback in place.
ODA vision for engagement in health and safety
The ODA was explicitly committed to encouraging positive engagement with the workforce on all aspects of health, safety and environment. It recognised that in addition to meeting legal obligations, effective consultation and engagement was a fundamental mechanism for achieving high standards of health and safety throughout the programme.
Implementation of engagement initiatives for health and safety in companies working across the Park led to the following outcomes:
• Two-way communication had become embedded within companies, with workers being receptive to new ideas and happy/confident to question procedures.
• Workers and supervisors who felt empowered to take responsibility for their own and others’ health and safety, ensuring local, site level issues were accounted for. This increased transparency and compliance of health and safety on site.
• A workforce who had a clear understanding of what was expected from them regarding health and safety.
• A workforce that was competent at communicating with each other and felt confident to stop and engage others concerning health and safety matters.
• An increased awareness of workers’ own personal susceptibility.
• Cascading communication systems helped to empower workers, giving foremen and site supervisors the opportunity to engage and communicate with their team.
How was engagement in health and safety achieved?
3.4.5.1 Ongoing engagement/communication mechanisms
Communication was considered central to ensuring good health and safety practice, with transparency in health and safety activities and decision-making believed to be vital. It was considered vital to ensure two-way communication so that issues were raised and shared, allowing for appropriate solutions to be identified. The standards specified by the ODA obligated companies across the Park to consult with the workforce and provide feedback, this was complemented by the ODA communications strategy (e.g. posters around site and the ‘Park Life’ newsletter).
Key health and safety messages were cascaded down from SHELT meetings, including the project director and project managers, to companies across the Park. A variety of formal and informal communication mechanisms existed to enable this, and the following examples can be broadly categorised into ‘standardised’ and ‘daily’ communication mechanisms.
19
3.4.5.2 Standardised communication mechanisms
• Project safety leadership team meetings involved the discussion and setting of standards for companies, and involved the health and safety manager, project director and relevant safety leads.
• Safety forum meetings consisted of 20-25 health and safety professionals representing all suppliers. The group also participated in site safety walkabouts.
• Risk assessment briefings, workforce engagement meetings and environment sustainability meetings were used regularly.
• ‘Voice meetings’ (workforce representative meetings) enabled workforce representatives to raise any specific health and safety issues to management, and comment on relevant policies, which were amended in light of feedback given. Any workforce representative meetings were run over a series of sessions to ensure all could attend.
• Safety circle meetings (where supplier and site representatives discuss safety issues whilst sat in a circle) provided operatives representing the suppliers, with the opportunity to raise any safety concerns.
• In developing a method statement, the workforce and supervisors were given the opportunity to discuss it, question it and make appropriate amendments to it.
• Twice-weekly coordination meetings provided an opportunity to discuss the work being undertaken, and to enable the identification of overlaps and permission/permits required. This meeting was beneficial for health and safety reasons, as well as productivity, enabling companies to effectively manage any ‘overlaps’ between trades.
• One-to-one interviews between the supervisor and worker allowed for the discussion of the importance of health and safety and the impact it could have on friends and family. The aim was to enhance attitude and behaviour change and develop a good working relationship.
• Key messages were typically delivered by site supervisors, as they were considered to be more ‘in-tune’ with work being undertaken and could add any additional site specific / local issues where appropriate.
• Companies used health and safety campaigns as a means of gaining and maintaining worker engagement in health and safety.
• A variety of reward and recognition schemes were implemented by companies to communicate and recognise good practice. These ranged from verbal praise to monetary rewards, vouchers and ‘knock off early’ schemes. Key to ensuring the success of rewards included:
o Effective communication to all staff about what the rewards were and how they could be achieved.
o An assurance that rewards were available to, and achievable by, all staff groups including suppliers and contractors.
20
3.4.5.3 Daily Communication Mechanisms
Daily informal communication occurred between workers and supervisors on an ongoing basis and mechanisms included toolbox talks and daily activity briefs.
• All workers were briefed before entering the site, regardless of the time of day. Various briefings occurred throughout the day with the aim of obtaining the full engagement of the workforce and ensuring workers felt they were following procedures for the right reasons.
• Daily, morning activity briefings were delivered to the workforce by a supervisor, manager, foreman or engineer before any work began. Briefings typically involved:
• A review of the method statement,
• A discussion of relevant health and safety issues,
• An explanation of any new equipment/machinery to be used and the associated risks,
• A discussion of any site-specific changes,
• An opportunity for each contractor to state what they were working on,
• An explanation of why certain procedures had been put in place,
• An opportunity for all workers to comment on any of the procedures that they were required to follow.
• Mid shift briefings were delivered during the day to inform workers of any specific, recent changes.
• Following the day’s work, a meeting was also held to discuss work planned for the following day.
• Management took every opportunity to get to know their workers. For example, they ensured all workers displayed their first name on their coat and/or hardhat. This allowed managers and workers to have conversations with each other on a first name basis.
• Key to all communication methods was ensuring that the workforce had a thorough understanding of the work and associated procedures. Companies ensured that all health and safety messages and procedures were relevant to workers and fully understood.
3.4.5.4 Behaviour based safety
To aid worker engagement in health and safety, the ODA/Delivery partner set standards for behaviour-based safety training. Companies across the Park were then required to develop their own training programmes, which focused on developing and instilling good practice and safe behaviours. Typically, these programmes had the following features:
• Induction training focused on securing worker engagement and instilling the correct, safe behaviours in workers. This was evident through both the ODA and company specific induction as well as the senior manager’s message to all new starters. New starters were briefed on company procedures related to reporting good and poor behaviours (e.g. the use of observation cards).
21
• Completion of any behaviour-based training soon after entering the site, preferably within one week. The training was tailored to address any trends in worker behaviour or the changing workforce and their tenure on site.
• Specific courses aimed at supervisors to ensure that they developed competent interpersonal skills to complement their existing technical capabilities. Further training consisted of site manager safety training and communication training, as well as a comprehensive safety leadership programme for senior managers, directors and subcontractors.
• The use of workshops to help gain the engagement of the workforce by raising awareness and ownership of personal susceptibility and the importance of transferring safety messages to the home.
• The use of actors to play out typical health and safety scenarios. Courses focused on allowing workers to make changes to the scenario to improve health and safety.
• Developing competency amongst workers by offering them training to deliver training to others. This facilitated the use of credible examples of behaviours from within each company and further enhanced engagement, as workers were familiar with the facilitators.
• Company recognition, i.e. a sticker for workers’ hard hats, following completion of the training / workshops.
3.4.6 Factor 6: Peer group attitude
Peer group attitude is a strong collective awareness of the importance of working safely, where individuals are well aware of the negative consequences of risk-taking, health and safety procedures are followed at all times and staff at all levels take responsibility for their health and safety, viewing it as an integral part of their role. Companies who have a positive peer group attitude take a proactive approach to tackling worker unsafe behaviour and manage interpersonal relationships well. Positive attitudes and relationships towards health and safety exist among the workforce. A supportive work environment is fostered where workers are empowered to stop work if they feel unsafe.
The vision for peer group attitude
The ODA commitment to developing a positive culture on site was based on a recognition that a very powerful agent for high performance was the pressure generated by peers’ attitudes of “this is the way we do things around here”. Peer groups can establish much more consistent behaviour than a more managerial and “policing” approach, hence this emphasis on behavioural safety and worker engagement.
Following the implementation of practices by companies across the Park to develop a positive peer group attitude, the subsequent outcomes/benefits were noted:
• All staff saw the health and safety of workers as the company’s top priority.
• A ‘fair’ culture was developed whereby workers understood that they would not be blamed for raising any health and safety concerns or stopping work on health and safety grounds.
• Strong, positive working relationships had developed; typically due to the length of time workers had spent on site.
22
• A positive team attitude developed, where workers actively cared for one another’s welfare. This had increased workers’ confidence in raising and discussing health and safety issues with anyone on site, and suggesting new ways of working to other colleagues. Managers and supervisors had fostered an attitude of respect.
How were good peer group attitudes achieved?
3.4.6.1 Fostering a supportive environment
Companies working across the Park considered that fostering a supportive working environment was vital. Workers felt empowered, valued, and equal due to the outstanding level of health and safety on site. The following examples were given from companies across the Park to highlight how a supportive working environment had been created:
• The length of time spent on site had a beneficial impact on workers. They had developed strong, working relationships, enabling them to feel comfortable to challenge others on health and safety issues and generally look out for one another. Two-way communication systems had facilitated this. These benefits had extended across company boundaries, with workers also feeling comfortable in challenging subcontractors regarding safe behaviours.
• Individual workers were encouraged to take responsibility for themselves and one another regarding health and safety. For example, if workers noticed anything unsafe on site, they immediately informed others of the situation/issue.
• Team building days were implemented across companies and bullying was not tolerated by any company across the Park.
• Workers knew how to accept any negative feedback given, and were able to take it on board.
• Any health and safety issues identified by workers were visibly dealt with and, where needed, changes were made to company policy and procedure as a result.
3.4.6.2 Empowerment to stop work
Companies across the Park worked hard to establish an open and honest culture where workers felt confident to stop work if they felt unsafe. The message to stop work was frequently communicated to all workers, as a means of empowering the workforce, encouraging worker engagement, safe behaviour and a positive attitude to health and safety. Various examples were seen whereby companies stopped work on health, safety and environmental grounds regardless of potential cost and productivity losses, conveying the message that it was more important to complete work safely.
• On one occasion, one company delayed work by two hours to ensure a lifting certificate was in place.
• Sites were seen to stop work in adverse weather conditions, sending workers home if it was deemed unsafe to continue working.
• Managers were seen to give praise and recognition to workers for stopping work.
• A bi-monthly ‘stop for safety’ scheme operated whereby supervisors visited sites in pairs with the aim of engaging workers through discussions (including specific questions covering people, workplace and plant). Supervisors recorded these discussions, which were
23
collated by the safety team to provide ‘you said, we did’ feedback. This was later displayed on posters.
• In introducing the ‘STOP’ scheme, another organisation firstly ensured that workers understood that they would not be penalised should they stop work for health and safety reasons. Following a STOP, a supervisor was called upon to discuss any issues with the worker. If the worker considered the decision taken to be unsatisfactory, workers could pass their concerns up the management chain. To highlight the importance of the STOP procedure, a scheme was set up to reward those who had stopped work.
3.4.7 Factor 7: Resources for health and safety
Companies who are strong on this factor devote substantial effort and invest considerable resources in health, safety and welfare across the organisation. Workers have the necessary equipment and knowledge to follow health and safety procedures at all times and there are always additional staff resources to complete work safely. Companies also ensure that any worker allocated to a task has the necessary skills and training to complete it competently and safely.
The vision for health and safety resources
The ODA did not allocate huge, specialised resources to health and safety in isolation; instead it was woven into every activity and every element of the ODA operation, as stated explicitly in its HS&E Policy Statement. The key was to relentlessly work with the Delivery Partner and every Tier 1 contractor to ensure that this was how it operated throughout the supply chain, with a particular emphasis on effective pre-planning of all work providing an appropriate channel for HS&E risk assessments and controls to be selected and implemented.
Resources and commitment to safety, health and well-being were part of the procurement process, and helped Tier 1 contractors to develop an awareness of the ODA’s expectations before work had been awarded. This approach led to the following outcomes:
• An improvement in the delivery and engagement of workers in Daily Activity Briefings and toolbox talks (i.e. workers were encouraged to actively take part in inductions and complete team-based exercises).
• Better planning of work tasks and integration of all staff, also resulting in minimal waste or requirement to re-do work on venues across the Park.
• The development of a two-way relationship between workers and managers, i.e. workers felt listened to, appreciated working for a company who invested in them and were more willing to comply with procedures, engage and participate.
How were good resources for health and safety achieved?
3.4.7.1 Provision of resources and time spent planning Companies across the Park prided themselves on investing sufficient time and resources to provide workers with the right equipment, human resource and training as and when it was needed. This reiterated the message that companies were committed to health and safety and considered it their top priority. Examples highlighting how this was achieved included: • Evaluation of work bids/tenders based on a range of factors including health and safety. • Extensive work planning to ensure sufficient time-scales were allocated for work
activities and ensured that projects were completed safely.
24
• Work on site only proceeded when the necessary, fully maintained equipment was provided.
3.4.7.2 Welfare Sufficient investment was devoted to the provision of health and welfare facilities across the Park, helping companies to demonstrate their commitment to health and safety. The aim was to create a ‘feel’ across the Park that the sites were above average, by fostering an environment where workers felt cared for and that allowed workers to perform at the optimum level. Examples included: • The well maintained canteens provided a range of healthy food. • Occupational health facilities, including an onsite health centre. Workers were
encouraged to make use of all facilities and given advice on how to access them. • Changing rooms and shower facilities were provided and rigorously cleaned and
maintained. • Companies made use of campaigns related to health and welfare, including drugs,
alcohol and sexual health. • Managers and workers considered the medical centre on site and the services it offered
invaluable. Their services included: • An occupational hygienist who visited sites to review tasks involving noise
levels, i.e. when using certain pieces of machinery. • Health promotion events, including a sexually transmitted illness clinic for
operatives. • Drug and alcohol testing, as well as awareness raising sessions. • Healthy eating campaigns to raise awareness of the importance of eating
healthily (e.g. the benefits of eating breakfast).
3.4.7.3 Training The provision of effective training helped companies to ensure the competence of all workers, supervisors and managers on sites across the Park, e.g. training in appropriate behaviours, how to use equipment and follow systems and procedures. Examples were given from companies to highlight what training had been implemented. • The training needs of all staff were assessed and appropriate training was developed and
implemented to achieve lasting attitude and behavioural change and ensure the competence of staff.
• Continual reviews of health and safety topics were carried out to identify any further issues or trends, which were then addressed through the training of relevant workers.
• Leadership training for senior managers, directors and subcontractors was acquired through competent, known training providers and then transferred across sites.
• Supervisors held minimum qualifications / accreditation, i.e. National Vocational Qualifications (NVQ).
• Supervisors were given additional training in interpersonal and communication skills to complement their existing technical capabilities. Rather than delivered as one long session, the course was delivered as four half-day sessions.
• Supervisors were given training to deliver method statements. It was felt that supervisors, rather than senior management, should deliver these to encourage workers’ confidence to ask and answer questions about the job. Spot checks (i.e. stopping an operative and questioning them) were carried out to assess recall of pertinent information in the method statement.
• Comprehensive inductions were given to all those entering any site. This included a delivery partner booklet of site rules and induction information, in addition to the relevant company induction booklet for all site workers and visitors.
25

• The length of induction training was addressed to ensure that it was not too long, focused on health, safety, efficiency and quality and emphasised the message that everyone was important, valued and should consider themselves proud to be involved. Induction training included reference to correct behaviours on site and made use of DVDs.
• Companies sought to improve and measure behaviours, developing their own behavioural-based training programme, based on the delivery partner/ODA standards. Behavioural training was aimed at promoting good practice behaviours, such as correct lifting techniques. The training was followed by observations, feedback and the development and implementation of an action plan.
• Workshops were delivered to raise awareness amongst workers of their own and others’ personal susceptibility. Some companies also incorporated a half-day’s paid leave to allow workers to go home and discuss the workshop with friends and family. The aim was to encourage workers to transfer safety practices to the home and consider the potential impact on family members.
• Training was developed to improve the effectiveness of near miss reporting. Time was spent reviewing the current outputs with engineers to obtain a thorough understanding of near miss reporting. This was followed by sessions to discuss near misses with the workforce (i.e. explaining what near misses were and providing them with good examples of what should be reported).
• The ‘Be Safe Home Safe’ training course was used to purposefully promote culture change through education and discussion, making sure all workers, including subcontractors, received the right training to suit their needs. The training focused on raising awareness of personal susceptibility, developing leadership competence and supervisor/leader communication skills. Refresher training was used particularly to aid near miss reporting and reduce worker error. In time, trained workers cascaded the training that they had received.
• Companies aimed to develop competency amongst workers to deliver the training to others, i.e. workers were trained up as facilitators to deliver further training on site. This was received positively, as workers were familiar with the facilitators.
• Additional training was also developed in response to changing circumstances on site, the changing requirements of the work and workers, and the identification of new behaviours to address.
• Training provided by companies was regularly refreshed and formed part of the work planning process.
• To avoid the development of a blame culture, companies focused on offering additional training to those involved in an incident. For example, behavioural safety training courses were offered to workers to address any identified, unsafe behaviours.
• Training (in various forms) was given to develop and support employees’ understanding of risk assessment documents (e.g. ‘what is risk’ workshops and training on how to conduct a risk assessment).
• Training was delivered to staff during working hours, to ensure that they were paid to attend any training.
3.4.8 Factor 8: Accident and Near Miss Reporting
Accidents and near misses are reported so that (where appropriate) a company can review the issues and factors that contribute to incidents, and identify appropriate follow up actions. Organisations use a number of methods for reporting accidents and near misses, and actively encourage workers to report incidents, giving them the confidence to report observations and near misses, and resulting in good rates of both near miss and accident reporting. Workers in
26
these companies view accident reporting as second nature to them and there is a collective sense of responsibility for heath and safety.
ODA vision on accident and near miss reporting The ODA vision was of a workforce and management that explored all accidents and significant near misses to see what lessons could be learned. Applying those lessons across the programme was seen as a powerful tool for leveraging continual improvement.
Following the implementation of initiatives by companies across the Park, the subsequent outcomes/benefits to accident and near miss reporting were noted: • Workers felt that the use of ‘don’t walk by’ cards, which were designed to capture
observations around site, helped them feel involved in health and safety. • A workforce that understood how near miss reporting helped to prevent accidents,
reduce bullying and improve the working environment by raising standards through improvements to procedures and practices on site.
• Training to enhance workers’ understanding of near miss reporting (including the provision of good examples of ‘what’ a near miss was) led to more reports that were of better quality (and therefore more useful to the company).
• Companies who were able to identify trends in incidents, and address this with appropriate actions and targeted interventions.
• Workers who felt a collective sense of responsibility for health and safety, and understood the value in reporting observations and near misses.
• Prompt, appropriate actions, resulting from reports led to the belief that worker involvement in health and safety (through submission of near miss/observation reports) helped to prevent accidents, reduce bullying and improves the working environment by raising standards through improvements to procedures and practices on site.
How was good accident and near miss reporting achieved? Due to the low numbers of accidents reported by companies, the examples provided tended to relate to near miss reporting, as outlined below.
3.4.8.1 Near miss reporting Companies across the Park consistently carried out reviews of their near miss reporting system to improve workers’ understanding of what should be reported (i.e. ‘what is a near miss’?). This resulted in better worker understanding of near misses e.g. what information should be collected/reported, and how this could be used by the company to identify trends in incidents and therefore improvements to the site. This also resulted in an increase in the number of near misses being reported and a better standard of the reports.
Organisations used a variety of methods for reporting near misses: • Near miss/observation cards with the option for the worker reporting a near miss to
remain anonymous. Feedback was provided through weekly briefings, and included information on actions taken as a result of an observation or near miss reported.
• Near miss/observation cards that could be ‘posted’ at various points on site. These were collected daily, and reviewed to identify trends. Managers emphasised the value in identifying the ‘whys’ of an incident, to enable better understanding, and future prevention of similar incidents where possible.
• Near miss cards were completed on site, and submitted to the health and safety team, with feedback given through supervisor meetings. One company felt that changing the format of the cards every few months helped to ‘keep it fresh’ and served as a reminder for workers to think about what they had observed and were reporting.
• One company ran a ‘Don’t walk by ‘campaign, encouraging workers to record and submit onsite observations (both good and bad). Supervisors supported this drive by
27
emphasising the importance of reporting observations, and reassured workers that they would not be used to apportion blame. A summary of observations reported and resultant actions was fed back to workers through displays in the canteen. In addition, the contractor pledged to donate £1 to charity for each observation card submitted, with workers raising over £6000.
• Training was used to improve the effectiveness of near miss reporting. Time was spent reviewing a sample of recent reports with engineers to obtain a thorough understanding of near miss reporting. This was followed by sessions to discuss near misses with the workforce, i.e. explaining what they were and providing them with good examples of what should be reported.
• Managers emphasised that observations were a valuable tool for identifying improvements required on site, and worked to change workers’ perception from ‘ratting’ on their colleagues to proactively identifying improvements.
3.4.8.2 Valuing reports
• Organisations followed up the incidents reported by reviewing reports, carrying out additional investigations where required, and planning actions based on issues or trends identified.
• Recent accidents, incidents and observations were used to actively target workers with tailored initiatives on relevant topics.
• Company policies specifically stated that they would review all accidents or incidents to identify lessons learned (regardless of the severity of the incident).
3.5 DISSEMINATION OF INFORMATION
HSE’s London 2012 website and the ODA’s Learning Legacy website are the main channels used to capture, collate and promote the good practice collected from companies working across the Olympic Park.
3.6 LEARNING LEGACY POINTS
The information collected during the interviews and discussion groups was also used to identify learning legacy points - the various practices, which led to the positive results observed on the Olympic Park. These are outlined in Table 1.
28
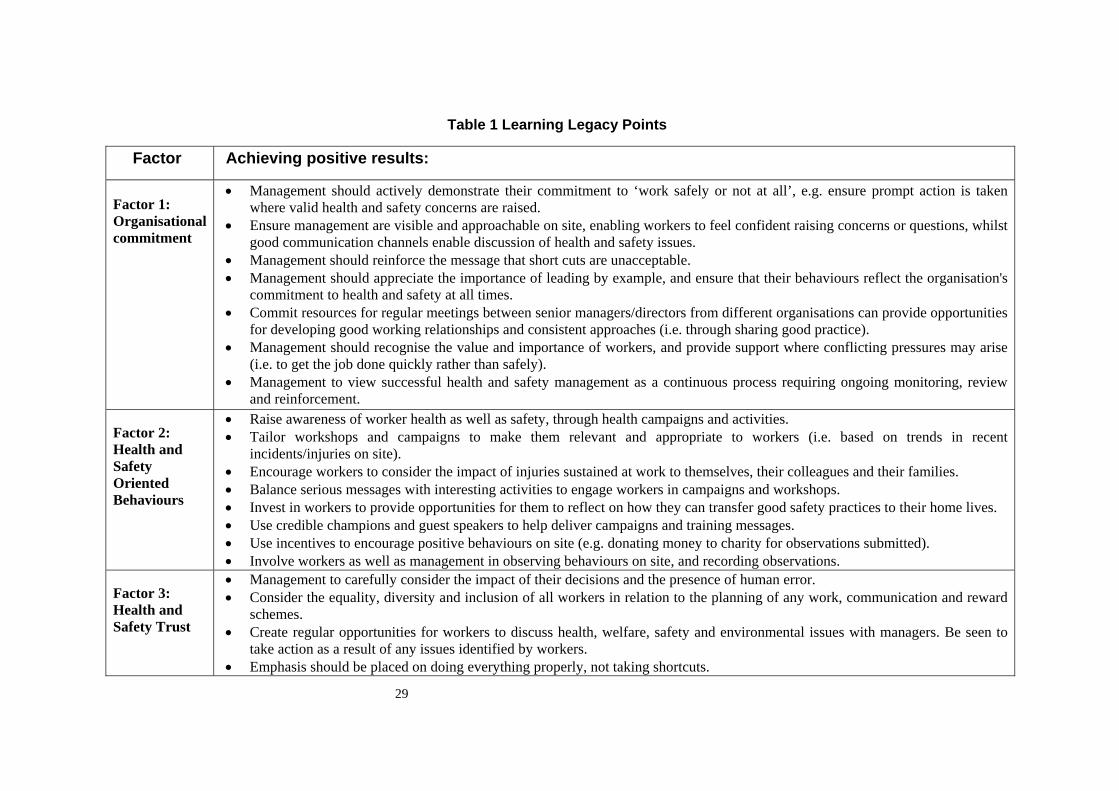
Table 1 Learning Legacy Points
Factor Achieving positive results:
Factor 1: Organisational commitment
• Management should actively demonstrate their commitment to ‘work safely or not at all’, e.g. ensure prompt action is taken where valid health and safety concerns are raised.
• Ensure management are visible and approachable on site, enabling workers to feel confident raising concerns or questions, whilst good communication channels enable discussion of health and safety issues.
• Management should reinforce the message that short cuts are unacceptable. • Management should appreciate the importance of leading by example, and ensure that their behaviours reflect the organisation's
commitment to health and safety at all times. • Commit resources for regular meetings between senior managers/directors from different organisations can provide opportunities
for developing good working relationships and consistent approaches (i.e. through sharing good practice). • Management should recognise the value and importance of workers, and provide support where conflicting pressures may arise
(i.e. to get the job done quickly rather than safely). • Management to view successful health and safety management as a continuous process requiring ongoing monitoring, review
and reinforcement.
Factor 2: Health and Safety Oriented Behaviours
• Raise awareness of worker health as well as safety, through health campaigns and activities. • Tailor workshops and campaigns to make them relevant and appropriate to workers (i.e. based on trends in recent
incidents/injuries on site). • Encourage workers to consider the impact of injuries sustained at work to themselves, their colleagues and their families. • Balance serious messages with interesting activities to engage workers in campaigns and workshops. • Invest in workers to provide opportunities for them to reflect on how they can transfer good safety practices to their home lives. • Use credible champions and guest speakers to help deliver campaigns and training messages. • Use incentives to encourage positive behaviours on site (e.g. donating money to charity for observations submitted). • Involve workers as well as management in observing behaviours on site, and recording observations.
Factor 3: Health and Safety Trust
• Management to carefully consider the impact of their decisions and the presence of human error. • Consider the equality, diversity and inclusion of all workers in relation to the planning of any work, communication and reward
schemes. • Create regular opportunities for workers to discuss health, welfare, safety and environmental issues with managers. Be seen to
take action as a result of any issues identified by workers. • Emphasis should be placed on doing everything properly, not taking shortcuts.
29
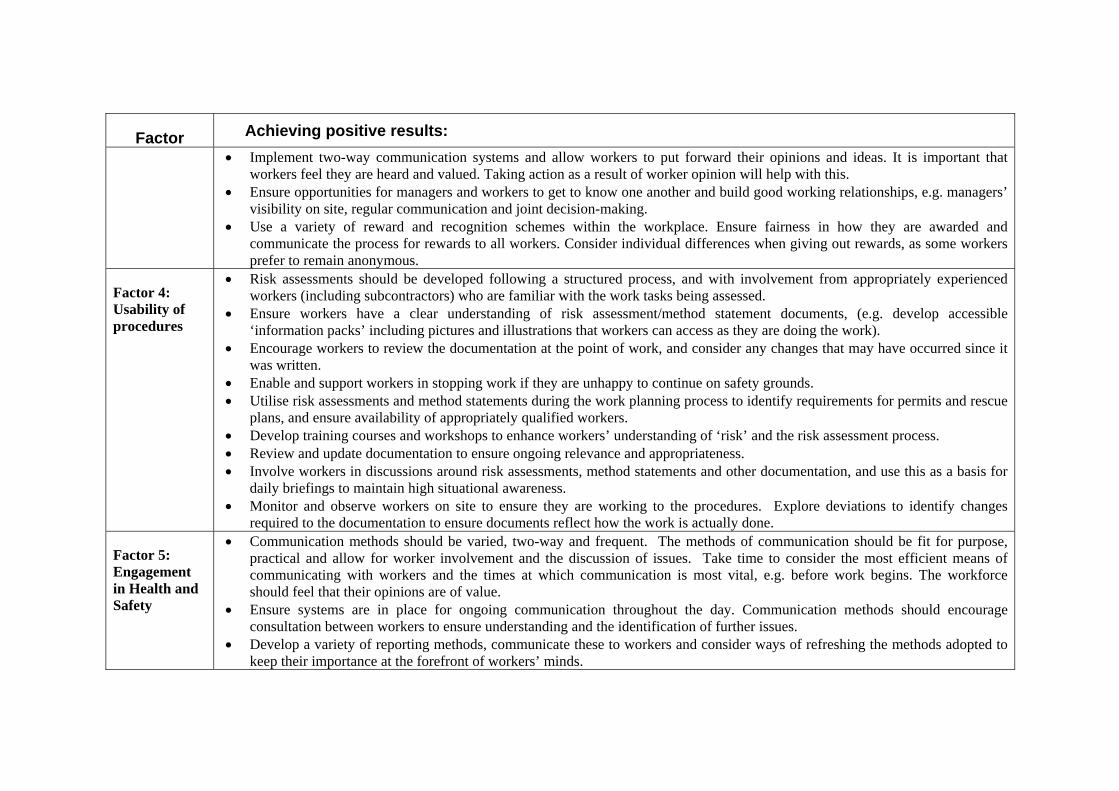
Factor Achieving positive results: • Implement two-way communication systems and allow workers to put forward their opinions and ideas. It is important that
workers feel they are heard and valued. Taking action as a result of worker opinion will help with this. • Ensure opportunities for managers and workers to get to know one another and build good working relationships, e.g. managers’
visibility on site, regular communication and joint decision-making. • Use a variety of reward and recognition schemes within the workplace. Ensure fairness in how they are awarded and
communicate the process for rewards to all workers. Consider individual differences when giving out rewards, as some workers prefer to remain anonymous.
Factor 4: Usability of procedures
• Risk assessments should be developed following a structured process, and with involvement from appropriately experienced workers (including subcontractors) who are familiar with the work tasks being assessed.
• Ensure workers have a clear understanding of risk assessment/method statement documents, (e.g. develop accessible ‘information packs’ including pictures and illustrations that workers can access as they are doing the work).
• Encourage workers to review the documentation at the point of work, and consider any changes that may have occurred since it was written.
• Enable and support workers in stopping work if they are unhappy to continue on safety grounds. • Utilise risk assessments and method statements during the work planning process to identify requirements for permits and rescue
plans, and ensure availability of appropriately qualified workers. • Develop training courses and workshops to enhance workers’ understanding of ‘risk’ and the risk assessment process. • Review and update documentation to ensure ongoing relevance and appropriateness. • Involve workers in discussions around risk assessments, method statements and other documentation, and use this as a basis for
daily briefings to maintain high situational awareness. • Monitor and observe workers on site to ensure they are working to the procedures. Explore deviations to identify changes
required to the documentation to ensure documents reflect how the work is actually done.
Factor 5: Engagement in Health and Safety
• Communication methods should be varied, two-way and frequent. The methods of communication should be fit for purpose, practical and allow for worker involvement and the discussion of issues. Take time to consider the most efficient means of communicating with workers and the times at which communication is most vital, e.g. before work begins. The workforce should feel that their opinions are of value.
• Ensure systems are in place for ongoing communication throughout the day. Communication methods should encourage consultation between workers to ensure understanding and the identification of further issues.
• Develop a variety of reporting methods, communicate these to workers and consider ways of refreshing the methods adopted to keep their importance at the forefront of workers’ minds.
30
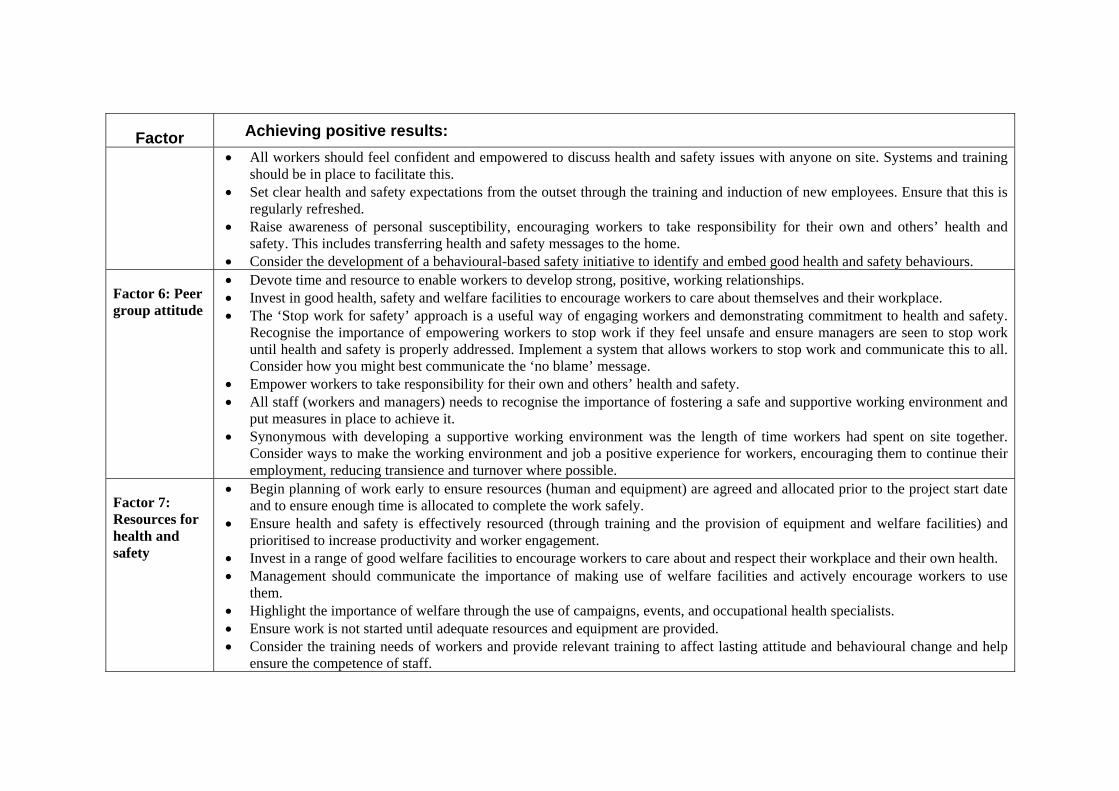
Factor Achieving positive results: • All workers should feel confident and empowered to discuss health and safety issues with anyone on site. Systems and training
should be in place to facilitate this. • Set clear health and safety expectations from the outset through the training and induction of new employees. Ensure that this is
regularly refreshed. • Raise awareness of personal susceptibility, encouraging workers to take responsibility for their own and others’ health and
safety. This includes transferring health and safety messages to the home. • Consider the development of a behavioural-based safety initiative to identify and embed good health and safety behaviours.
Factor 6: Peer group attitude
• Devote time and resource to enable workers to develop strong, positive, working relationships. • Invest in good health, safety and welfare facilities to encourage workers to care about themselves and their workplace. • The ‘Stop work for safety’ approach is a useful way of engaging workers and demonstrating commitment to health and safety.
Recognise the importance of empowering workers to stop work if they feel unsafe and ensure managers are seen to stop work until health and safety is properly addressed. Implement a system that allows workers to stop work and communicate this to all. Consider how you might best communicate the ‘no blame’ message.
• Empower workers to take responsibility for their own and others’ health and safety. • All staff (workers and managers) needs to recognise the importance of fostering a safe and supportive working environment and
put measures in place to achieve it. • Synonymous with developing a supportive working environment was the length of time workers had spent on site together.
Consider ways to make the working environment and job a positive experience for workers, encouraging them to continue their employment, reducing transience and turnover where possible.
Factor 7: Resources for health and safety
• Begin planning of work early to ensure resources (human and equipment) are agreed and allocated prior to the project start date and to ensure enough time is allocated to complete the work safely.
• Ensure health and safety is effectively resourced (through training and the provision of equipment and welfare facilities) and prioritised to increase productivity and worker engagement.
• Invest in a range of good welfare facilities to encourage workers to care about and respect their workplace and their own health. • Management should communicate the importance of making use of welfare facilities and actively encourage workers to use
them. • Highlight the importance of welfare through the use of campaigns, events, and occupational health specialists. • Ensure work is not started until adequate resources and equipment are provided. • Consider the training needs of workers and provide relevant training to affect lasting attitude and behavioural change and help
ensure the competence of staff.
31

Factor Achieving positive results: • Ensure the training needs of different groups of staff are met, e.g. leaders/managers, supervisors, workers, and those working on
specific job tasks or using certain machinery. • Ensure training needs are continually reviewed and addressed in light of changing circumstances, e.g. the work environment,
work tasks, and workforce demographics and composition. • Ensure the site induction is of a suitable length, focuses on health and safety, quality and emphasises the company mission /
vision. An induction should be given to all those wishing to enter the site. • Consider training as a means of addressing incidents and accidents on site. • Deliver training during working hours.
Factor 8: Accident and Near Miss Reporting
• Ensure workers understand the purpose and value in reporting observations and near misses. • Develop targeted training to enhance workers’ understanding of what a near miss is. • Support workers in reporting observations by making it as simple as possible (e.g. offer various methods for reporting incidents,
and consider ‘refreshing’ reporting cards to avoid complacency). • Provide clear, timely feedback to workers to demonstrate the value of their observations and any resulting actions. • Consider supporting near miss reporting through the use of campaigns and incentives. • Use the information reported to actively target workers and changes to the site to prevent future, similar incidents. • Develop policies stating the intention to review accidents and incidents to identify lessons learned (regardless of the severity of
the incident). • Prompt, appropriate actions, resulting from reports support worker’s beliefs that involvement in health and safety (through
submission of near miss/observation reports) prevents accidents, reduces bullying and improves the working environment by raising standards through improvements to procedures and practices on site.
32
4. DISCUSSION AND CONCLUSIONS
4.1 DISCUSSION
The ODA and its delivery partner played a key part in the development of a positive safety culture on the Park. The ODA was committed to being an exemplar in health, safety and environmental management throughout the planning, design and construction operation. The ODA required all Tier 1 contractors to subscribe to the same Health Safety and Environment Standard, and also required the Chief Executive of each Tier 1 contractor to report on HS&E performance to the ODA Board at regular intervals. In doing this, the ODA and its delivery partner clearly communicated their expectations for all contractors from the outset with regards to health and safety. Supporting this was the decision to embed client representatives within the project teams, who supported consideration of health and safety as part of the delivery arrangements.
As a result, expectations for safety during construction were built into contracts across the supply chain. This was supported by an ‘intelligent’ client, who was proactively involved throughout the project as a “motivator, supporter, challenger, advisor, facilitator and nudger”. Despite the clear expectations defined by the client, contractors were encouraged to develop their own process and systems and monitor/improve their safety performance.
During the course of the research a number of themes emerged, which enabled the development of a safe project, and a good safety culture across the site. These themes were:
• Striving for excellence;
• Recognition that health and safety is dynamic and long-term;
• Consistency through the supply chain.
4.1.1 Striving for excellence
Each of the companies involved in the construction of the Park recognised the nature of it as a prestige project and the importance of working on the ‘world’s premier construction site’. As such, the Tier 1 contractors had a desire to be excellent as it was ‘UK plc on the world stage’. This also applied to health and safety, and the companies took advantage of Olympic analogies (‘Going for Gold’, ‘Be the best you can be’) to roll out health and safety commitments to both their direct employees and throughout their supply chain. Additional efforts were made to breakdown the supply chain barriers, and to consider themselves as a team working together. It was not possible to evaluate the effectiveness of this strategy; however, the case studies and their findings are supportive of this, with focus group attendees reflecting on the health and safety standards required when working on the build.
4.1.2 Recognition that health and safety is dynamic and long-term
Another enabling factor concerned the long running nature of the build. The construction phase lasted over 3 years, which is atypical for construction. It was commented that the length of duration meant that there were opportunities for companies to learn from failed endeavours, and for commitment to health and safety to become embedded in daily working practices. Further, the long duration of the construction phase also provided opportunities for the priority of health and safety to be demonstrated, and for the safety culture to become embedded throughout the supply chain. For example, the ODA had planned for certain activities to become self reliant; however, it was found that without the continued support and emphasis from the ODA certain
33
initiatives would not have worked. The continued commitment to health and safety was reflected in the desire never to be content, so that health and safety requirements were constantly revised and revisited. For example, as the make-up of the workforce changed the training given was scaled back to provide the essential elements for reduced time on site.
Companies recognised that all of the elements used across the Olympic Park were essential for the development of a good safety culture, although the ongoing and continued commitment was essential.
4.1.3 Consistency through the supply chain
One of the key features of the Olympic build was the recognition that contractors needed to be culturally aligned. The case study findings reflect this, in that there was limited variability in the safety culture issues considered. This was achieved through the ODA specifying commitments and requirements through the procurement process and making clear the requirements from contractors. As discussed previously, companies were coordinated and collaborated, and integrated teams were developed. This collaboration was supportive of both health and safety and meeting the project requirements. Supply chain commitment was achieved though the procurement process, and the influence of the client.
4.1.4 Effects of the economic climate
There were mixed views on whether the processes and practices, particularly the planning functions, were transferable to other projects. The current economic climate was believed by some to have enabled contractors on the Park to recruit and retain the best workers (i.e. those with positive attitudes), as there was a greater availability of personnel in the marketplace. Companies would be keen to work with the Olympic Park, and would comply with their requirements, which made the adoption of leaner methods of working an easy transition (including the resulting benefits of tidier sites and increased efficiency/integration).
Although there is a common belief regarding the ‘cost’ of the practices carried out on the Park, a number of interviewees stated that such practices (e.g. daily activity briefings) were cost effective, quick, and led to other benefits, such as higher productivity and profitability and contributed to fewer accidents. Discussions were held about the feasibility of transferring the lessons learnt from the Olympic Park across the wider construction sector. Employees were cynical about this; however, project leaders felt that the initiatives were scaleable and feasible and that their application in other organisations would be beneficial.
4.1.5 Statistical Analysis
There are a number of assumptions associated with the analysis of the SCT scores and safety performance. Full data sets were only available for 15 companies within the Olympic Park, and with these the numbers of reportable accidents were low. This meant that there were issues concerning the low variability in accident measures, and there was limited variability in the safety climate scores across the Park, hence robust conclusions from the dataset cannot be made.
4.2 CONCLUSIONS
From the research carried out across the Olympic Park the good practices identified contributed to safety culture defined as ‘the way we do things round here’. The ODA and its delivery partner created a structure that enabled the development of a good safety culture as demonstrated by scores on the Safety Climate Tool. SCT scores from companies across the Olympic Park currently represent the highest scores in the HSL SCT ‘all industry’ dataset and
34
4.3
hence some of the legacy learning could be used to improve standards in other industries. The findings from the survey were supported by the many examples of good practice discussed in the interviews and focus groups, as well as the outcomes of these initiatives.
The interviews and focus groups revealed ‘how’ companies achieved these successes. Many of the activities carried out on site are not surprising or novel and represent well-established good practice. However, the key difference was the persistent effort devoted to leadership and worker engagement, which resulted in the desired behaviours and attitudes becoming embedded on site. Additionally, senior managers were aware of the risks of not paying sufficient attention to health and safety, and constantly reiterated its importance and relevance to the workforce and put effort into it ‘feeling fresh’. The examples described in the case studies are exemplary, and should be considered for adoption across the construction and other sectors. One of the key findings is that the Olympic Park has demonstrated that it is possible and feasible to develop high standards of health and safety, and a culture that supports this aspiration within the construction sector. Many of the examples of good practice, as outlined in the case studies, are often cited as being too complex to apply to the construction sector. This work has demonstrated that it is possible, through engagement, worker involvement and organisational commitment to develop a strong safety culture.
TRANSFERABILITY OF LESSONS LEARNT
The construction sector is typically viewed as idiosyncratic and different from other industries. However, the lessons learned from the Olympic Park could be applied to traditional settings. Findings from the Olympic Park indicate that despite a dynamic project and peripatetic workforce it is possible to maintain a good safety culture. Some of the success may be due to the nature of this large, complex project (i.e. the longer build of the Olympic Park). Although some of the practices may not be easily transferable to smaller construction sites (e.g. due to the associated time and costs), the principles of commitment, engagement and daily activity briefings could be applied just as effectively in smaller sites.
This work demonstrates that the lessons learnt from the Olympic Park should be applicable to other construction sites. In addition, construction companies from the Olympic Park are top performers in HSL’s ‘all industry’ SCT dataset and the research findings could also be applied to other sectors.
35

5.1
5. APPENDIX
APPENDIX A - EXAMPLE OF CASE STUDY BRIEFING NOTE
Organisational commitment refers to how effective, organised and committed an organisation is to health and safety, and looks for examples of: • How health and safety is prioritized and communicated? • How health and safety suggestions and improvements are encouraged? • How management behaviour reflects the organisation’s commitment to health and
safety?
‘Health and safety’ behaviours refers to the extent to which people behave in a safe and healthy manner, and looks for examples of: • How health and safety is embedded into daily working practices? • How important health and safety is at work?
Health and safety trust refers to workforce perceptions of company motivation for health and safety and whether there is a visible commitment towards the continuous implementation and improvement of health and safety procedures. Examples of health and safety trust include: • How the organisation demonstrates they really care about health and safety? • How are accident investigations used? • How are suggestions acted upon? • How proactive are management to health and safety?
Usability of procedures refers to the extent to which procedures are practical, useable, well designed and easy to follow and match how the job is actually done. Examples include: • How are procedures developed and updated? • How is the balance between the number of procedures and the risks involved
maintained?
Engagement in health and safety refers to engagement and involvement in health and safety. Looking for examples of: • How employees are engaged in health and safety? • How are two-way communications maintained?
Peer group attitude refers to attitudes and relationships towards health and safety among the workforce. Looking for examples of: • How they would react to workmates unsafe behaviours? • How interpersonal relationships are managed?
Resources for health and safety refers to whether there are enough people with the right skills and training, and the right equipment to work safely to the procedures. Looking for examples of: • How does the company ensure that the right people and/or equipment are available? • How are skills maintained?
Accidents and near miss reporting refers to the attitudes of the organisation / employees to appropriately reporting accidents and near misses. It also covers the systems in place and the motivation for reporting. Looking for examples of: • How does the organisation encourage incident reporting? • Who is responsible for reporting?
36
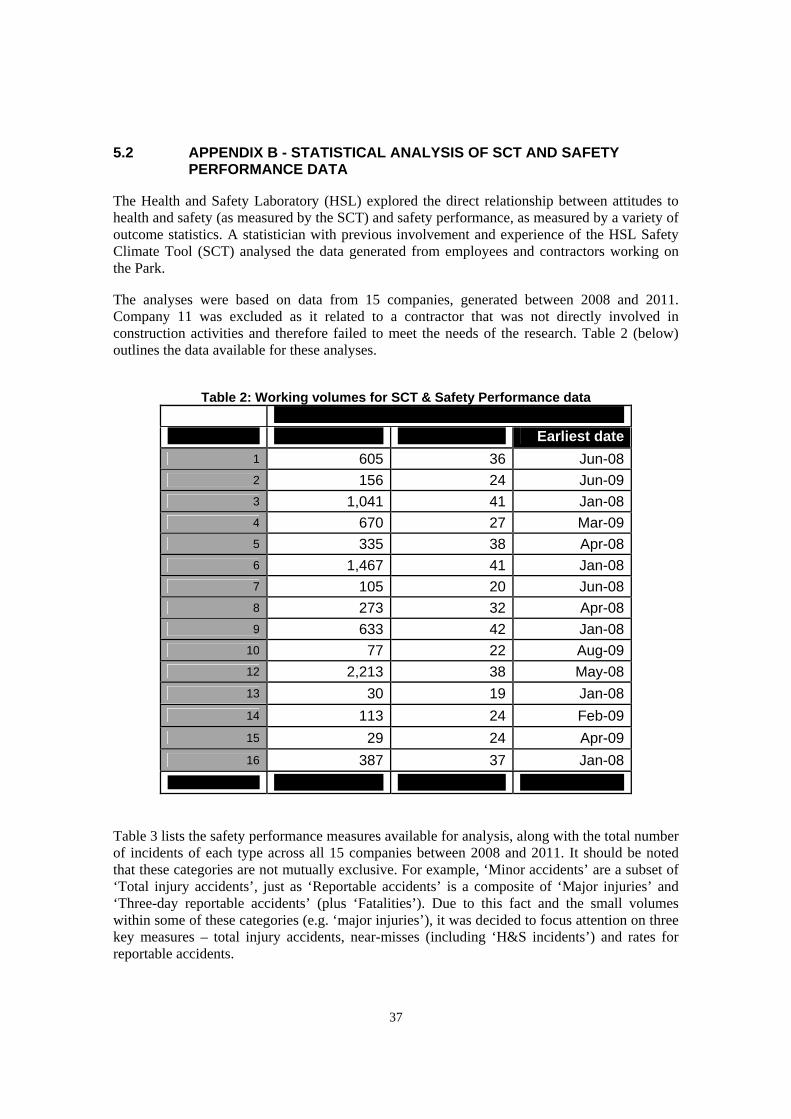
Safety performance data Company SCT responses Months on site
Total 8,134 227
5.2 APPENDIX B - STATISTICAL ANALYSIS OF SCT AND SAFETY PERFORMANCE DATA
The Health and Safety Laboratory (HSL) explored the direct relationship between attitudes to health and safety (as measured by the SCT) and safety performance, as measured by a variety of outcome statistics. A statistician with previous involvement and experience of the HSL Safety Climate Tool (SCT) analysed the data generated from employees and contractors working on the Park.
The analyses were based on data from 15 companies, generated between 2008 and 2011. Company 11 was excluded as it related to a contractor that was not directly involved in construction activities and therefore failed to meet the needs of the research. Table 2 (below) outlines the data available for these analyses.
Table 2: Working volumes for SCT & Safety Performance data
Earliest date 1 605 36 Jun-08 2 156 24 Jun-09 3 1,041 41 Jan-08 4 670 27 Mar-09 5 335 38 Apr-08 6 1,467 41 Jan-08 7 105 20 Jun-08 8 273 32 Apr-08 9 633 42 Jan-08
10 77 22 Aug-09 12 2,213 38 May-08 13 30 19 Jan-08 14 113 24 Feb-09 15 29 24 Apr-09 16 387 37 Jan-08
Table 3 lists the safety performance measures available for analysis, along with the total number of incidents of each type across all 15 companies between 2008 and 2011. It should be noted that these categories are not mutually exclusive. For example, ‘Minor accidents’ are a subset of ‘Total injury accidents’, just as ‘Reportable accidents’ is a composite of ‘Major injuries’ and ‘Three-day reportable accidents’ (plus ‘Fatalities’). Due to this fact and the small volumes within some of these categories (e.g. ‘major injuries’), it was decided to focus attention on three key measures – total injury accidents, near-misses (including ‘H&S incidents’) and rates for reportable accidents.
37
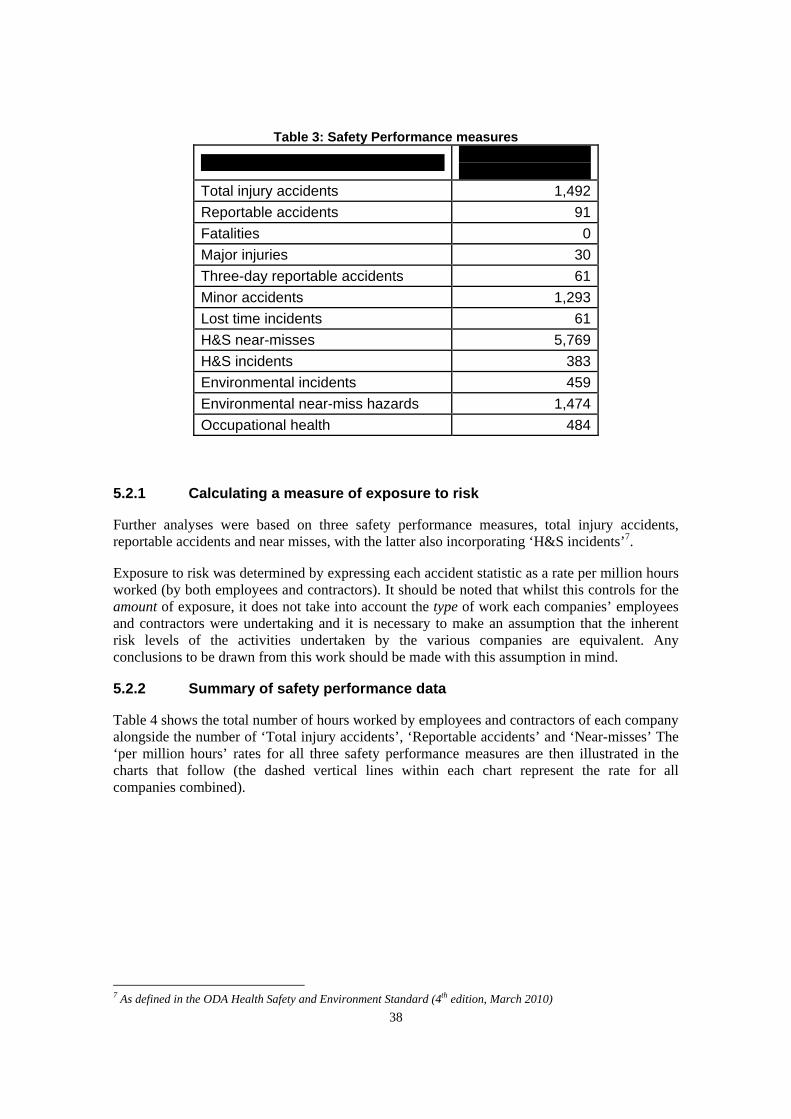
Safety performance measure No. of occurrences
Table 3: Safety Performance measures
Total injury accidents 1,492 Reportable accidents 91 Fatalities 0 Major injuries 30 Three-day reportable accidents 61 Minor accidents 1,293 Lost time incidents 61 H&S near-misses 5,769 H&S incidents 383 Environmental incidents 459 Environmental near-miss hazards 1,474 Occupational health 484
5.2.1 Calculating a measure of exposure to risk
Further analyses were based on three safety performance measures, total injury accidents, reportable accidents and near misses, with the latter also incorporating ‘H&S incidents’7.
Exposure to risk was determined by expressing each accident statistic as a rate per million hours worked (by both employees and contractors). It should be noted that whilst this controls for the amount of exposure, it does not take into account the type of work each companies’ employees and contractors were undertaking and it is necessary to make an assumption that the inherent risk levels of the activities undertaken by the various companies are equivalent. Any conclusions to be drawn from this work should be made with this assumption in mind.
5.2.2 Summary of safety performance data
Table 4 shows the total number of hours worked by employees and contractors of each company alongside the number of ‘Total injury accidents’, ‘Reportable accidents’ and ‘Near-misses’ The ‘per million hours’ rates for all three safety performance measures are then illustrated in the charts that follow (the dashed vertical lines within each chart represent the rate for all companies combined).
7 As defined in the ODA Health Safety and Environment Standard (4th edition, March 2010) 38
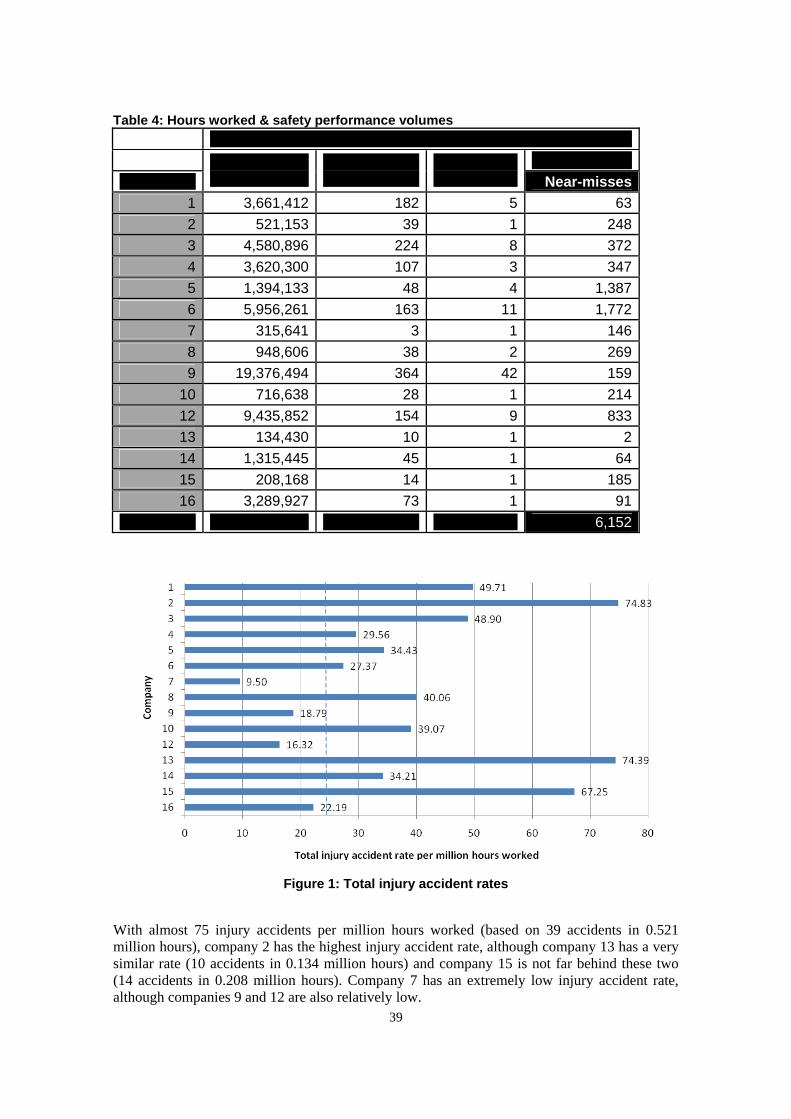
Safety performance data
Company Total hours
worked Total injury
accidentsReportable
accidents
Total 55,475,356 1,492 91
Table 4: Hours worked & safety performance volumes
Near-misses 1 3,661,412 182 5 63 2 521,153 39 1 248 3 4,580,896 224 8 372 4 3,620,300 107 3 347 5 1,394,133 48 4 1,387 6 5,956,261 163 11 1,772 7 315,641 3 1 146 8 948,606 38 2 269 9 19,376,494 364 42 159
10 716,638 28 1 214 12 9,435,852 154 9 833 13 134,430 10 1 2 14 1,315,445 45 1 64 15 208,168 14 1 185 16 3,289,927 73 1 91
6,152
Figure 1: Total injury accident rates
With almost 75 injury accidents per million hours worked (based on 39 accidents in 0.521 million hours), company 2 has the highest injury accident rate, although company 13 has a very similar rate (10 accidents in 0.134 million hours) and company 15 is not far behind these two (14 accidents in 0.208 million hours). Company 7 has an extremely low injury accident rate, although companies 9 and 12 are also relatively low.
39
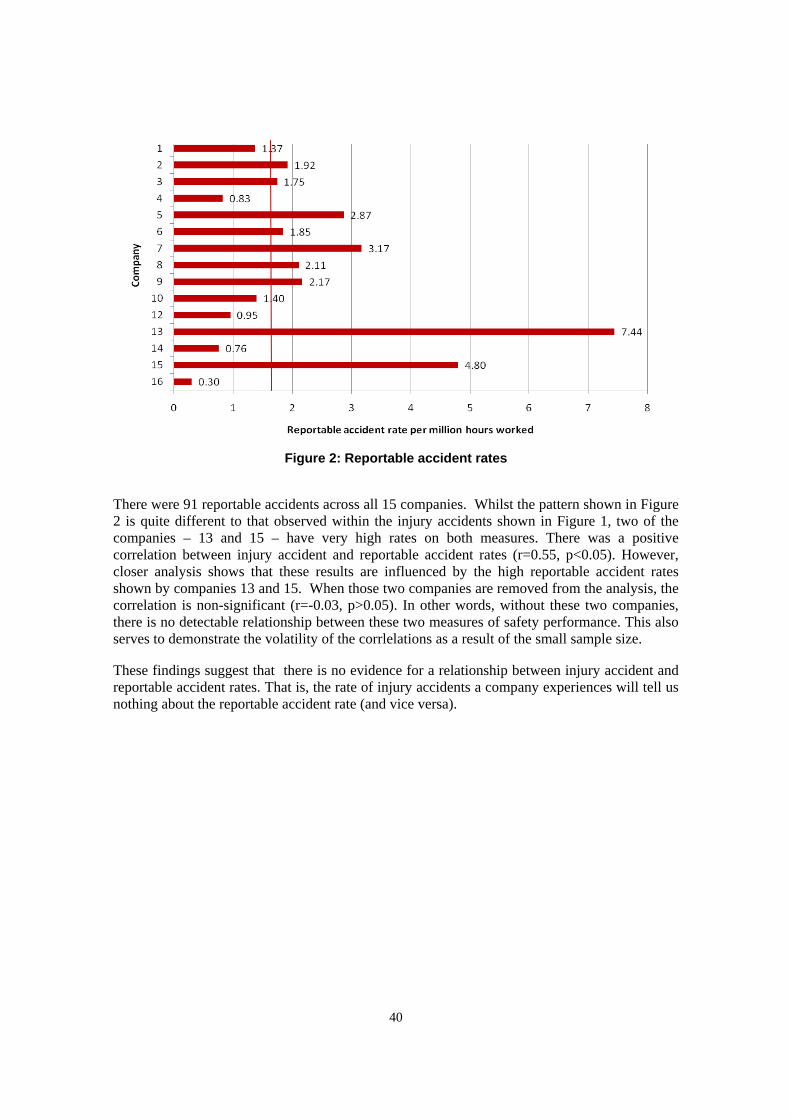
Figure 2: Reportable accident rates
There were 91 reportable accidents across all 15 companies. Whilst the pattern shown in Figure 2 is quite different to that observed within the injury accidents shown in Figure 1, two of the companies – 13 and 15 – have very high rates on both measures. There was a positive correlation between injury accident and reportable accident rates (r=0.55, p<0.05). However, closer analysis shows that these results are influenced by the high reportable accident rates shown by companies 13 and 15. When those two companies are removed from the analysis, the correlation is non-significant (r=-0.03, p>0.05). In other words, without these two companies, there is no detectable relationship between these two measures of safety performance. This also serves to demonstrate the volatility of the corrlelations as a result of the small sample size.
These findings suggest that there is no evidence for a relationship between injury accident and reportable accident rates. That is, the rate of injury accidents a company experiences will tell us nothing about the reportable accident rate (and vice versa).
40
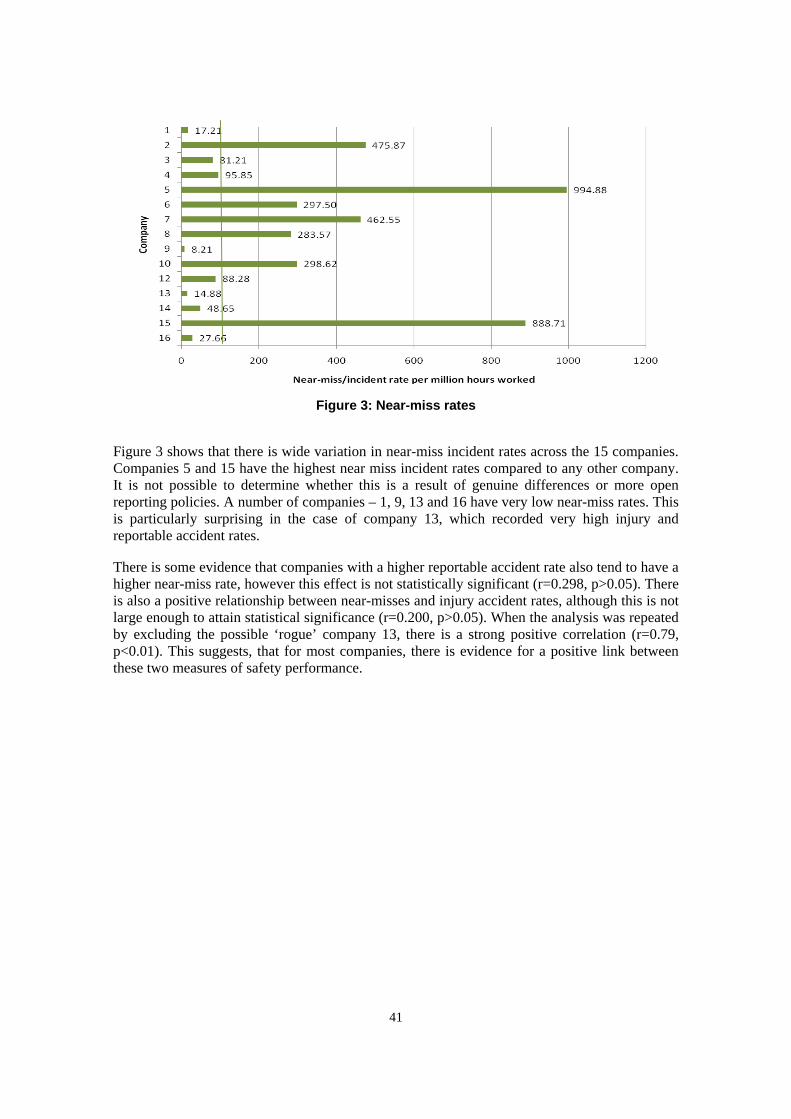
Figure 3: Near-miss rates
Figure 3 shows that there is wide variation in near-miss incident rates across the 15 companies. Companies 5 and 15 have the highest near miss incident rates compared to any other company. It is not possible to determine whether this is a result of genuine differences or more open reporting policies. A number of companies – 1, 9, 13 and 16 have very low near-miss rates. This is particularly surprising in the case of company 13, which recorded very high injury and reportable accident rates.
There is some evidence that companies with a higher reportable accident rate also tend to have a higher near-miss rate, however this effect is not statistically significant (r=0.298, p>0.05). There is also a positive relationship between near-misses and injury accident rates, although this is not large enough to attain statistical significance (r=0.200, p>0.05). When the analysis was repeated by excluding the possible ‘rogue’ company 13, there is a strong positive correlation (r=0.79, p<0.01). This suggests, that for most companies, there is evidence for a positive link between these two measures of safety performance.
41
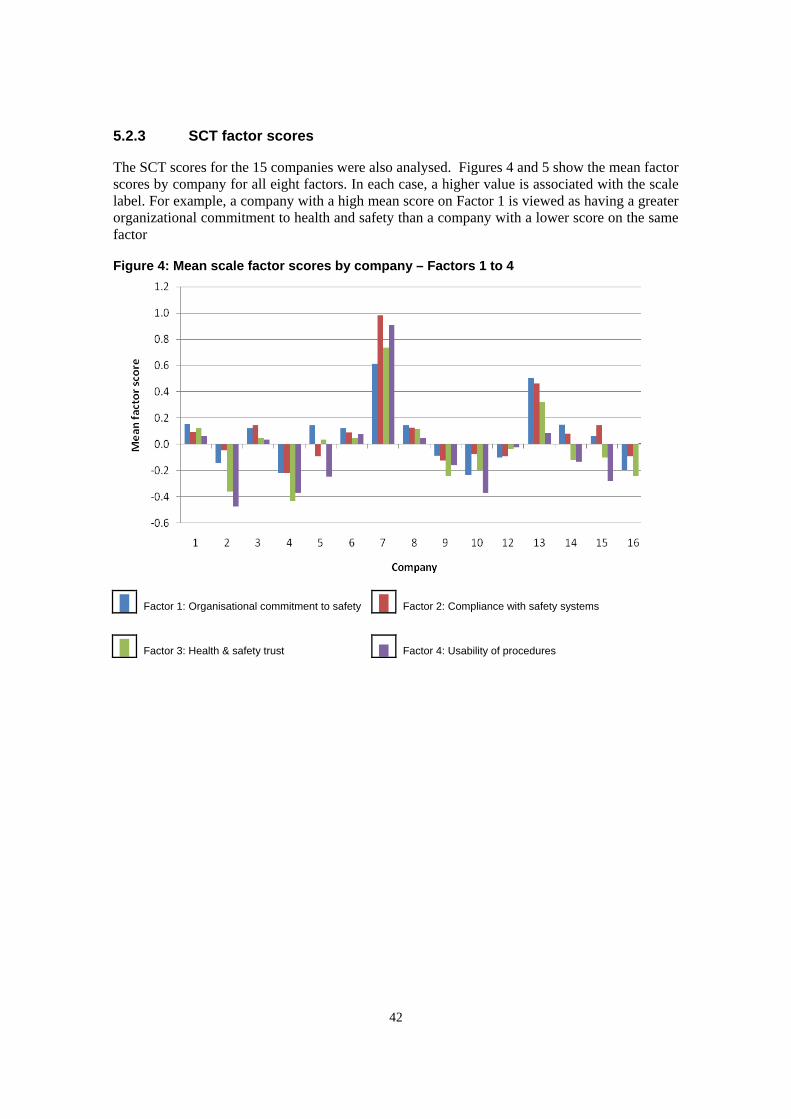
5.2.3 SCT factor scores
The SCT scores for the 15 companies were also analysed. Figures 4 and 5 show the mean factor scores by company for all eight factors. In each case, a higher value is associated with the scale label. For example, a company with a high mean score on Factor 1 is viewed as having a greater organizational commitment to health and safety than a company with a lower score on the same factor
Figure 4: Mean scale factor scores by company – Factors 1 to 4
Factor 1: Organisational commitment to safety Factor 2: Compliance with safety systems
Factor 3: Health & safety trust Factor 4: Usability of procedures
42
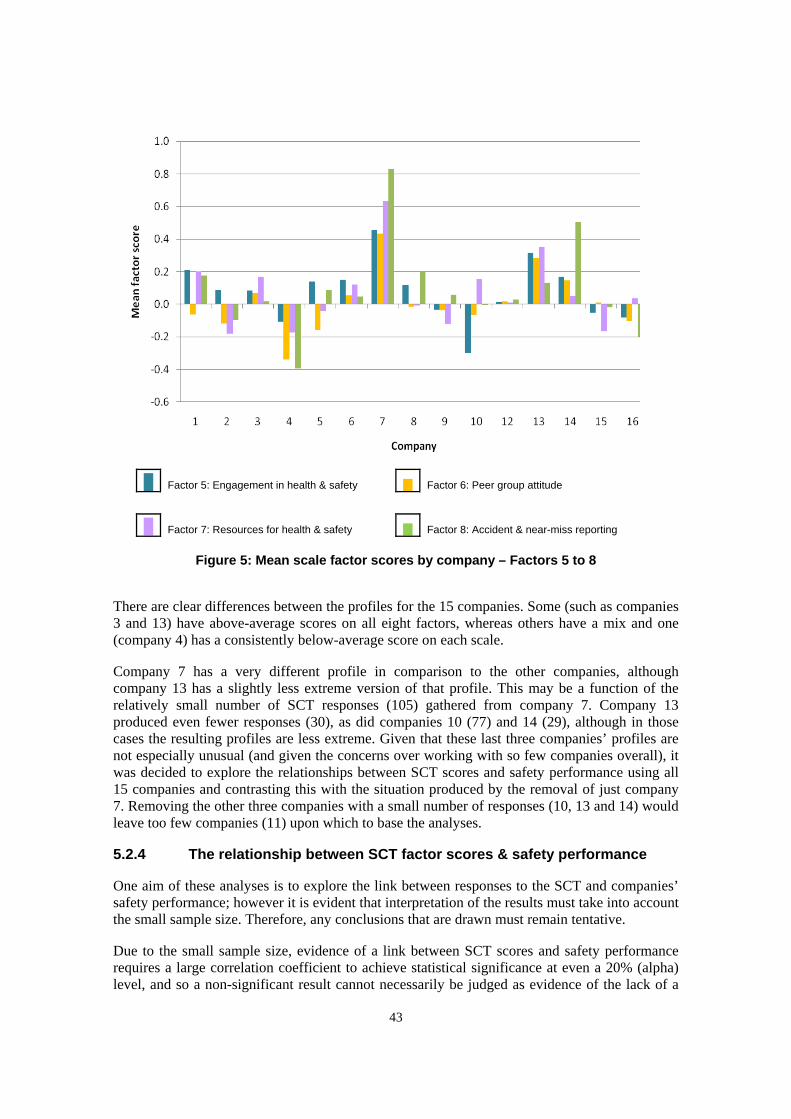
Factor 5: Engagement in health & safety Factor 6: Peer group attitude
Factor 7: Resources for health & safety Factor 8: Accident & near-miss reporting
Figure 5: Mean scale factor scores by company – Factors 5 to 8
There are clear differences between the profiles for the 15 companies. Some (such as companies 3 and 13) have above-average scores on all eight factors, whereas others have a mix and one (company 4) has a consistently below-average score on each scale.
Company 7 has a very different profile in comparison to the other companies, although company 13 has a slightly less extreme version of that profile. This may be a function of the relatively small number of SCT responses (105) gathered from company 7. Company 13 produced even fewer responses (30), as did companies 10 (77) and 14 (29), although in those cases the resulting profiles are less extreme. Given that these last three companies’ profiles are not especially unusual (and given the concerns over working with so few companies overall), it was decided to explore the relationships between SCT scores and safety performance using all 15 companies and contrasting this with the situation produced by the removal of just company 7. Removing the other three companies with a small number of responses (10, 13 and 14) would leave too few companies (11) upon which to base the analyses.
5.2.4 The relationship between SCT factor scores & safety performance
One aim of these analyses is to explore the link between responses to the SCT and companies’ safety performance; however it is evident that interpretation of the results must take into account the small sample size. Therefore, any conclusions that are drawn must remain tentative.
Due to the small sample size, evidence of a link between SCT scores and safety performance requires a large correlation coefficient to achieve statistical significance at even a 20% (alpha) level, and so a non-significant result cannot necessarily be judged as evidence of the lack of a
43
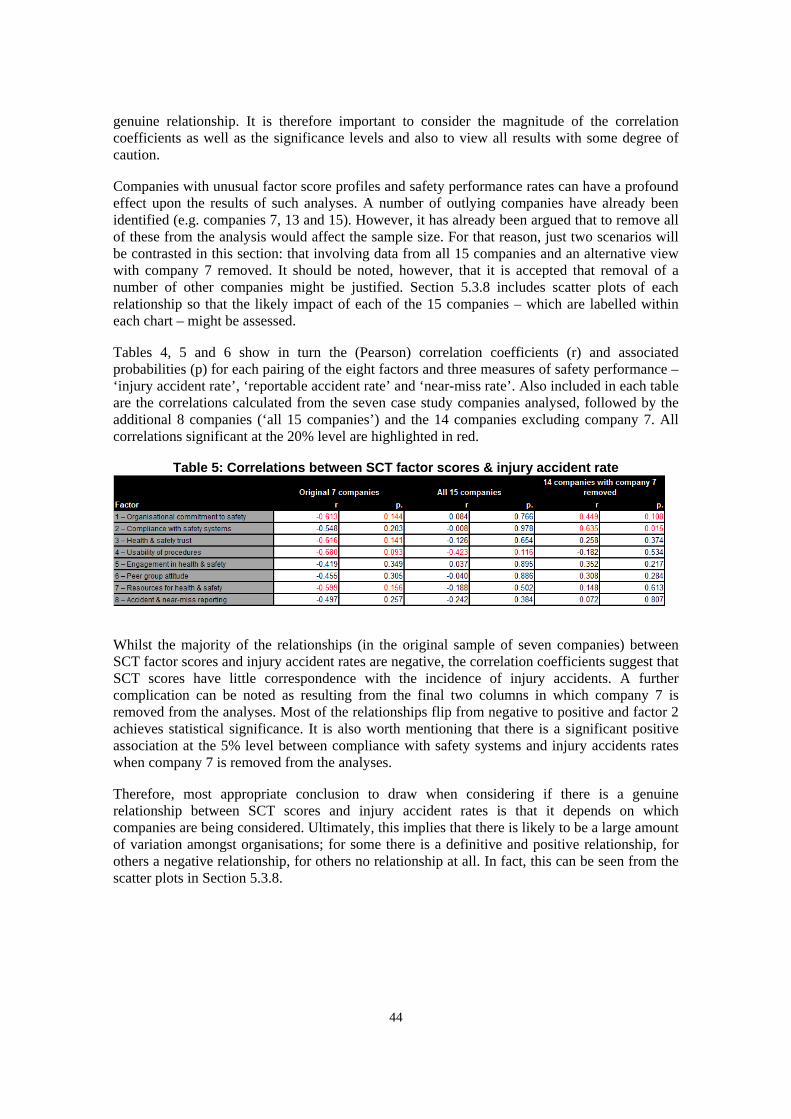
genuine relationship. It is therefore important to consider the magnitude of the correlation coefficients as well as the significance levels and also to view all results with some degree of caution.
Companies with unusual factor score profiles and safety performance rates can have a profound effect upon the results of such analyses. A number of outlying companies have already been identified (e.g. companies 7, 13 and 15). However, it has already been argued that to remove all of these from the analysis would affect the sample size. For that reason, just two scenarios will be contrasted in this section: that involving data from all 15 companies and an alternative view with company 7 removed. It should be noted, however, that it is accepted that removal of a number of other companies might be justified. Section 5.3.8 includes scatter plots of each relationship so that the likely impact of each of the 15 companies – which are labelled within each chart – might be assessed.
Tables 4, 5 and 6 show in turn the (Pearson) correlation coefficients (r) and associated probabilities (p) for each pairing of the eight factors and three measures of safety performance – ‘injury accident rate’, ‘reportable accident rate’ and ‘near-miss rate’. Also included in each table are the correlations calculated from the seven case study companies analysed, followed by the additional 8 companies (‘all 15 companies’) and the 14 companies excluding company 7. All correlations significant at the 20% level are highlighted in red.
Table 5: Correlations between SCT factor scores & injury accident rate
Whilst the majority of the relationships (in the original sample of seven companies) between SCT factor scores and injury accident rates are negative, the correlation coefficients suggest that SCT scores have little correspondence with the incidence of injury accidents. A further complication can be noted as resulting from the final two columns in which company 7 is removed from the analyses. Most of the relationships flip from negative to positive and factor 2 achieves statistical significance. It is also worth mentioning that there is a significant positive association at the 5% level between compliance with safety systems and injury accidents rates when company 7 is removed from the analyses.
Therefore, most appropriate conclusion to draw when considering if there is a genuine relationship between SCT scores and injury accident rates is that it depends on which companies are being considered. Ultimately, this implies that there is likely to be a large amount of variation amongst organisations; for some there is a definitive and positive relationship, for others a negative relationship, for others no relationship at all. In fact, this can be seen from the scatter plots in Section 5.3.8.
44
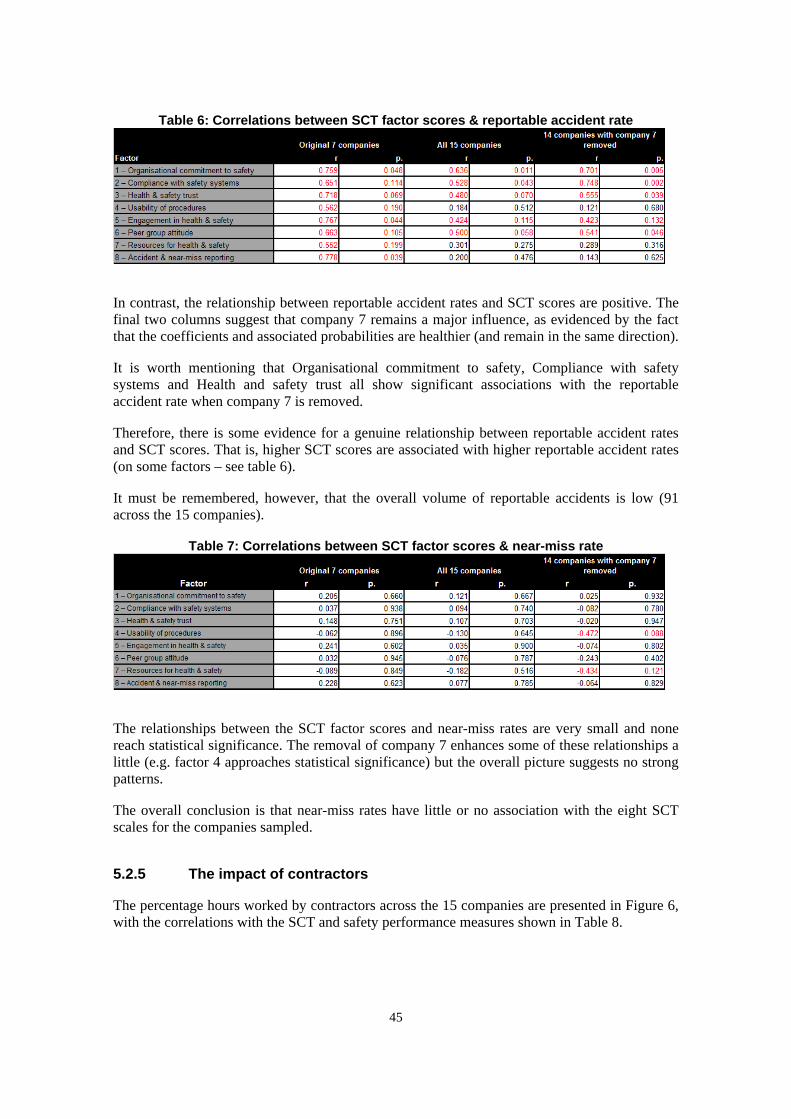
Table 6: Correlations between SCT factor scores & reportable accident rate
In contrast, the relationship between reportable accident rates and SCT scores are positive. The final two columns suggest that company 7 remains a major influence, as evidenced by the fact that the coefficients and associated probabilities are healthier (and remain in the same direction).
It is worth mentioning that Organisational commitment to safety, Compliance with safety systems and Health and safety trust all show significant associations with the reportable accident rate when company 7 is removed.
Therefore, there is some evidence for a genuine relationship between reportable accident rates and SCT scores. That is, higher SCT scores are associated with higher reportable accident rates (on some factors – see table 6).
It must be remembered, however, that the overall volume of reportable accidents is low (91 across the 15 companies).
Table 7: Correlations between SCT factor scores & near-miss rate
The relationships between the SCT factor scores and near-miss rates are very small and none reach statistical significance. The removal of company 7 enhances some of these relationships a little (e.g. factor 4 approaches statistical significance) but the overall picture suggests no strong patterns.
The overall conclusion is that near-miss rates have little or no association with the eight SCT scales for the companies sampled.
5.2.5 The impact of contractors
The percentage hours worked by contractors across the 15 companies are presented in Figure 6, with the correlations with the SCT and safety performance measures shown in Table 8.
45
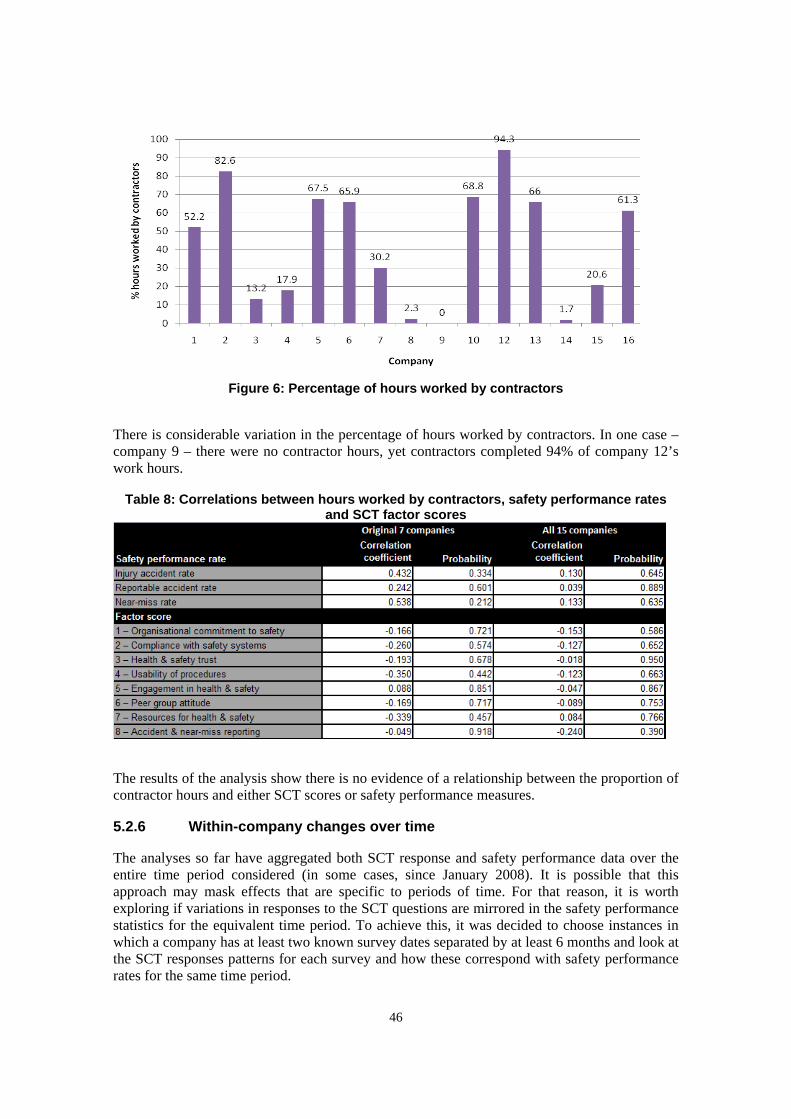
Figure 6: Percentage of hours worked by contractors
There is considerable variation in the percentage of hours worked by contractors. In one case – company 9 – there were no contractor hours, yet contractors completed 94% of company 12’s work hours.
Table 8: Correlations between hours worked by contractors, safety performance rates and SCT factor scores
The results of the analysis show there is no evidence of a relationship between the proportion of contractor hours and either SCT scores or safety performance measures.
5.2.6 Within-company changes over time
The analyses so far have aggregated both SCT response and safety performance data over the entire time period considered (in some cases, since January 2008). It is possible that this approach may mask effects that are specific to periods of time. For that reason, it is worth exploring if variations in responses to the SCT questions are mirrored in the safety performance statistics for the equivalent time period. To achieve this, it was decided to choose instances in which a company has at least two known survey dates separated by at least 6 months and look at the SCT responses patterns for each survey and how these correspond with safety performance rates for the same time period.
46
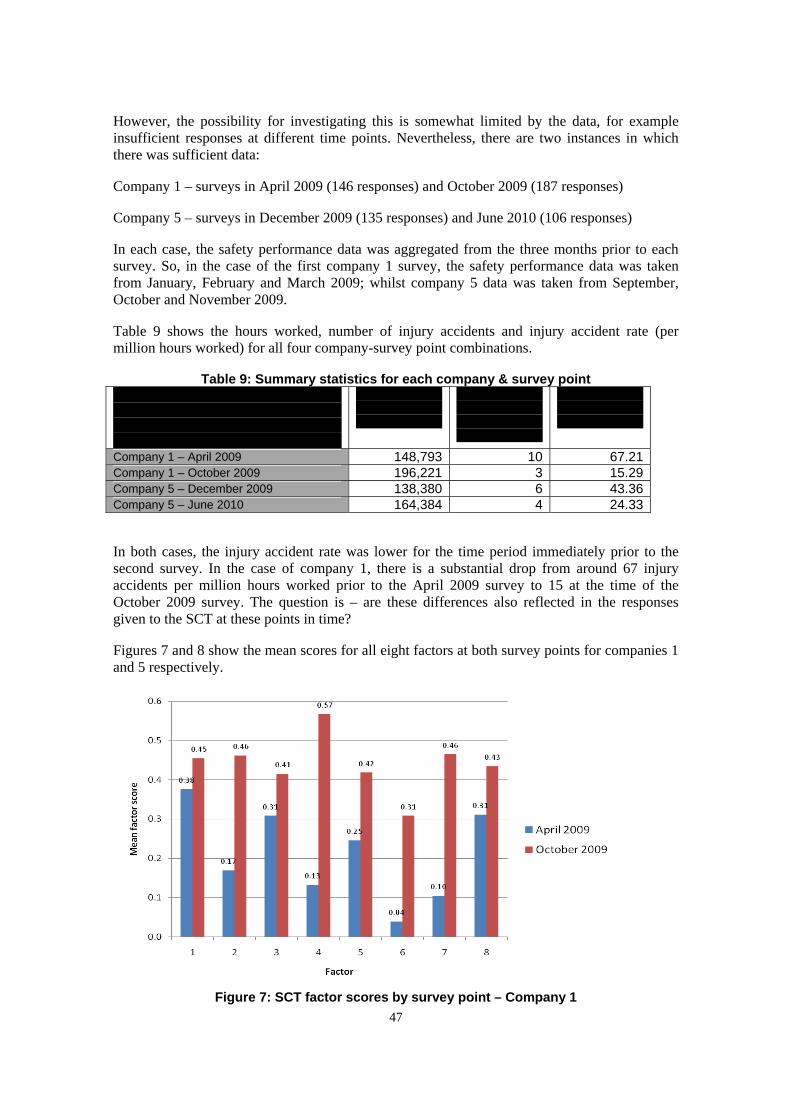
Company/Survey point
Hours worked in previous 3
months
Injury accidents in
previous 3 months
Injury accident
rate
However, the possibility for investigating this is somewhat limited by the data, for example insufficient responses at different time points. Nevertheless, there are two instances in which there was sufficient data:
Company 1 – surveys in April 2009 (146 responses) and October 2009 (187 responses)
Company 5 – surveys in December 2009 (135 responses) and June 2010 (106 responses)
In each case, the safety performance data was aggregated from the three months prior to each survey. So, in the case of the first company 1 survey, the safety performance data was taken from January, February and March 2009; whilst company 5 data was taken from September, October and November 2009.
Table 9 shows the hours worked, number of injury accidents and injury accident rate (per million hours worked) for all four company-survey point combinations.
Table 9: Summary statistics for each company & survey point
Company 1 – April 2009 148,793 10 67.21 Company 1 – October 2009 196,221 3 15.29 Company 5 – December 2009 138,380 6 43.36 Company 5 – June 2010 164,384 4 24.33
In both cases, the injury accident rate was lower for the time period immediately prior to the second survey. In the case of company 1, there is a substantial drop from around 67 injury accidents per million hours worked prior to the April 2009 survey to 15 at the time of the October 2009 survey. The question is – are these differences also reflected in the responses given to the SCT at these points in time?
Figures 7 and 8 show the mean scores for all eight factors at both survey points for companies 1 and 5 respectively.
Figure 7: SCT factor scores by survey point – Company 1 47
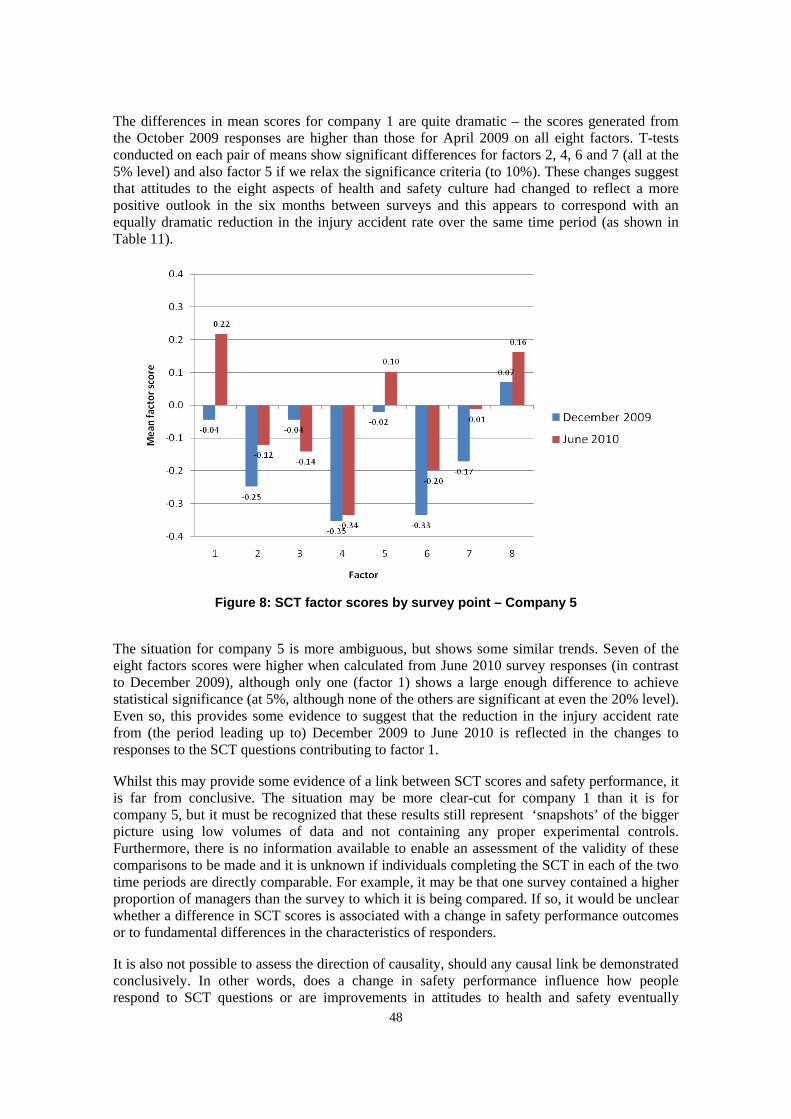
The differences in mean scores for company 1 are quite dramatic – the scores generated from the October 2009 responses are higher than those for April 2009 on all eight factors. T-tests conducted on each pair of means show significant differences for factors 2, 4, 6 and 7 (all at the 5% level) and also factor 5 if we relax the significance criteria (to 10%). These changes suggest that attitudes to the eight aspects of health and safety culture had changed to reflect a more positive outlook in the six months between surveys and this appears to correspond with an equally dramatic reduction in the injury accident rate over the same time period (as shown in Table 11).
Figure 8: SCT factor scores by survey point – Company 5
The situation for company 5 is more ambiguous, but shows some similar trends. Seven of the eight factors scores were higher when calculated from June 2010 survey responses (in contrast to December 2009), although only one (factor 1) shows a large enough difference to achieve statistical significance (at 5%, although none of the others are significant at even the 20% level). Even so, this provides some evidence to suggest that the reduction in the injury accident rate from (the period leading up to) December 2009 to June 2010 is reflected in the changes to responses to the SCT questions contributing to factor 1.
Whilst this may provide some evidence of a link between SCT scores and safety performance, it is far from conclusive. The situation may be more clear-cut for company 1 than it is for company 5, but it must be recognized that these results still represent ‘snapshots’ of the bigger picture using low volumes of data and not containing any proper experimental controls. Furthermore, there is no information available to enable an assessment of the validity of these comparisons to be made and it is unknown if individuals completing the SCT in each of the two time periods are directly comparable. For example, it may be that one survey contained a higher proportion of managers than the survey to which it is being compared. If so, it would be unclear whether a difference in SCT scores is associated with a change in safety performance outcomes or to fundamental differences in the characteristics of responders.
It is also not possible to assess the direction of causality, should any causal link be demonstrated conclusively. In other words, does a change in safety performance influence how people respond to SCT questions or are improvements in attitudes to health and safety eventually
48

reflected in better safety performance? Once again, it would require a tightly controlled, longitudinal research project to investigate this matter fully.
5.2.7 Discussion points regarding the data analysis
The main purpose of this analytical work was to explore the relationships between response patterns to questions on the Safety Climate Tool and outcome measures of safety performance.
There is evidence that the relationships explored are highly dependent upon the specific sample used for the analyses. It has been demonstrated that the removal of just one admittedly highly unusual (and therefore influential) company changes the outcome of some analyses considerably. Such volatility suggests that the true relationships between these concepts are much more complex than can be uncovered within the context of the present work. The sample size remains very small, but the companies included represent a wide range of industry sectors, exposure to risk levels and (most likely) the types of risks workers are exposed to.
None of these factors are controlled within the study and any such differences are likely to have a profound effect upon the nature and strength of any associations between safety culture and performance outcomes. For example, are the relationships the same across a range of industry sectors? Are the relationships the same for large companies as they are for smaller companies? The proportion of contractor hours appears to have no impact, but what about the nature of the work undertaken? Only a wider study that is able to incorporate and control for a wide range of companies is likely to provide more meaningful answers to these questions. Alternatively, a controlled study focusing upon one specific sector as a case study may help to clarify the situation.
5.2.8 Scatter plots of SCT factor scores & safety performance measures
SCT factor scores & injury accident rates
49
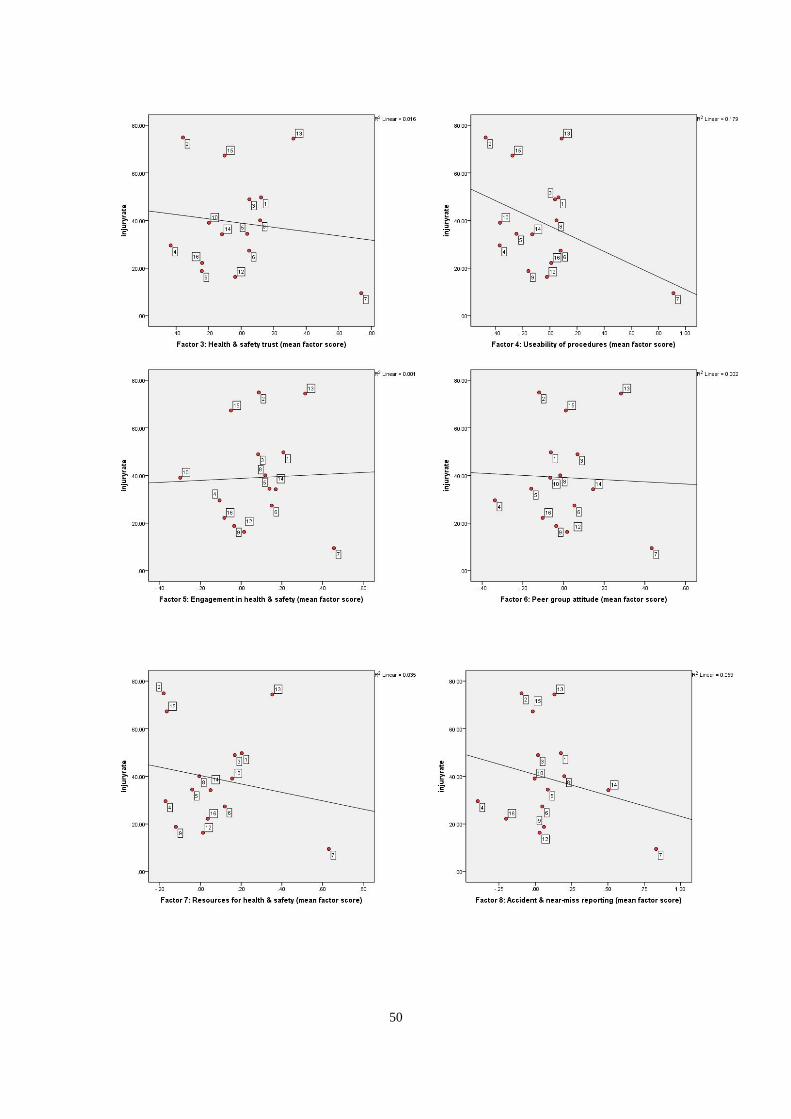
50
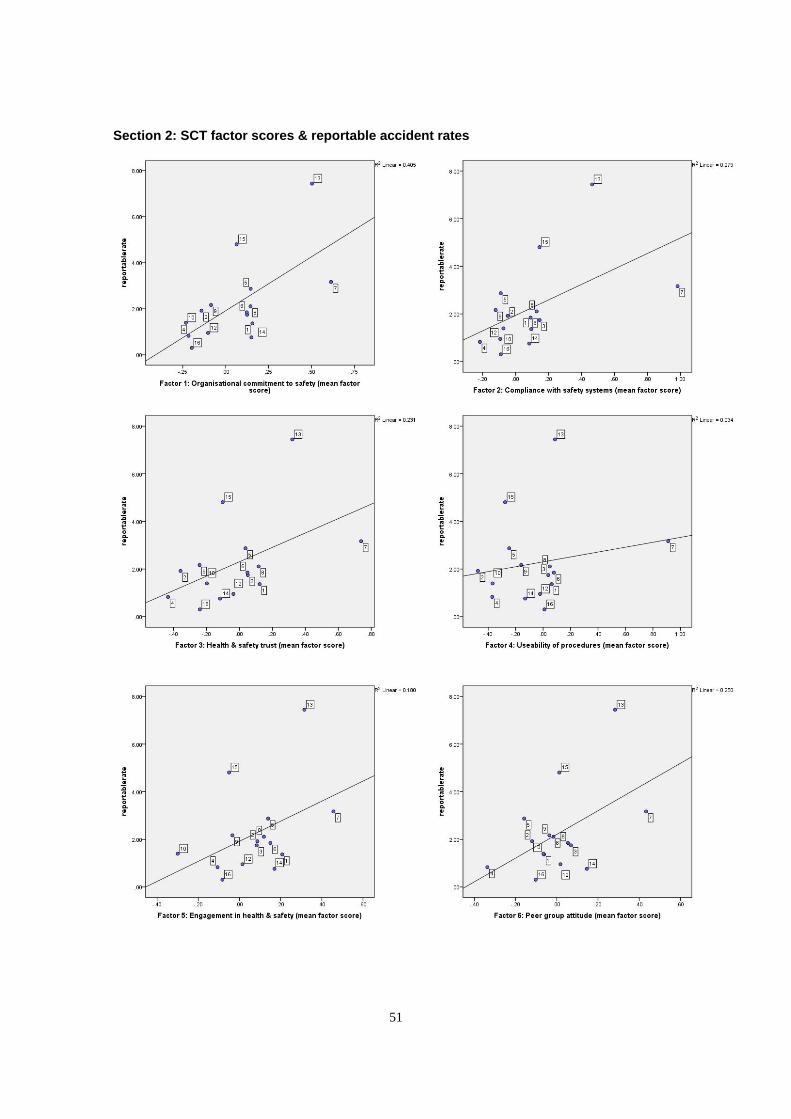
Section 2: SCT factor scores & reportable accident rates
51
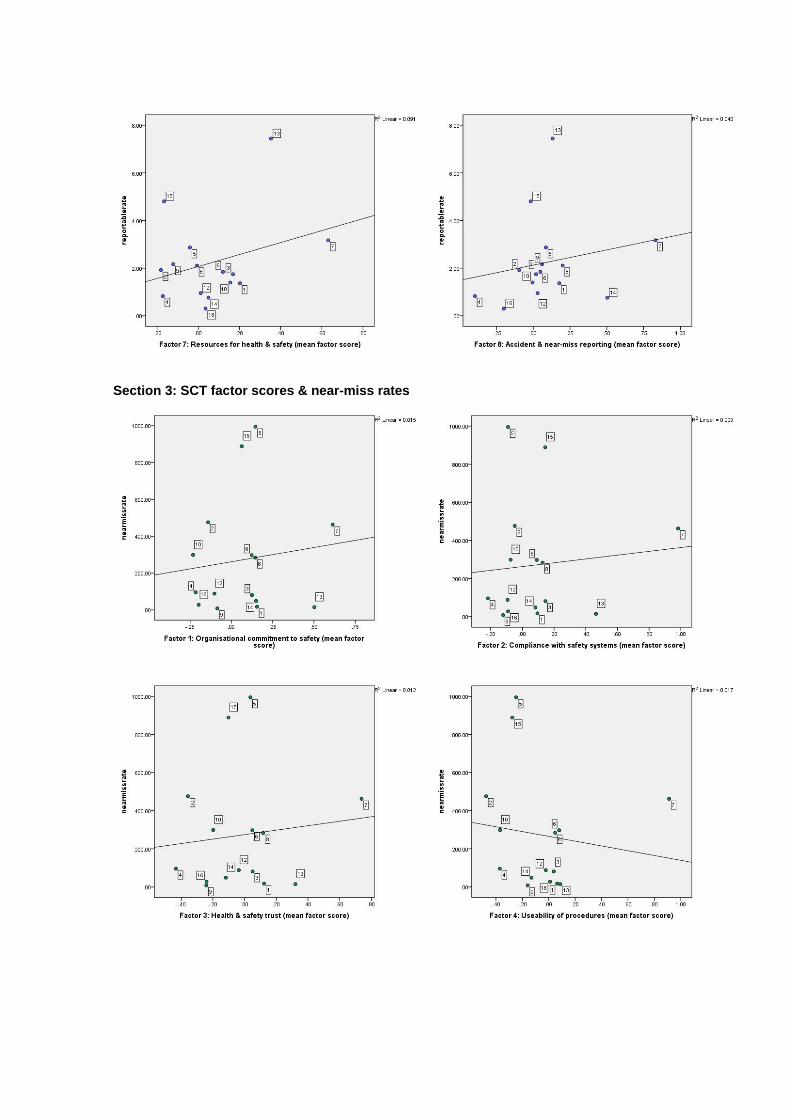
Section 3: SCT factor scores & near-miss rates

53

Published by the Health and Safety Executive 07/12

Health and Safety Executive
Safety culture on the Olympic Park
Preparations for hosting the London 2012 Olympic Games and Paralympic Games have involved large scale construction programmes to deliver new venues and fit out existing buildings and infrastructure. The Health and Safety Executive (HSE), as the Government’s independent regulator for work related health and safety issues, wanted the 2012 Games to drive improvements in health, safety and welfare standards in the construction industry. Simultaneously, the construction client for London 2012, the Olympic Delivery Authority (ODA), was committed to ensuring this was the ‘safest and healthiest build on record’.
This research explored the Safety Climate during the construction phase of the London 2012 Games. The Health and Safety Laboratory (HSL) Safety Climate Tool (SCT) was used to collect data between 2008-2010. Positive SCT scores provided evidence of a strong safety culture. SCT scores were analysed alongside safety performance measures taken from across the Park (eg injury accidents, reportable accidents, and health and safety near misses), and demonstrated the effectiveness of the initiatives employed on the Park.
Interviews and focus groups were used to identify and explore the wealth of good practices across the Park, and enabled the development of case studies outlining the initiatives and practices that were employed. The London 2012 Games has demonstrated that it is possible and feasible to develop high standards of health and safety, and a culture that supports this aspiration within the construction sector. Many of the areas of good practice are frequently cited as being too complex to apply to the construction sector. This research provides evidence that it is possible, through engagement, worker involvement and organisational commitment to develop a strong safety culture.
This report and the work it describes were funded by the Health and Safety Executive (HSE). Its contents, including any opinions and/or conclusions expressed, are those of the authors alone and do not necessarily reflect HSE policy.
RR942
www.hse.gov.uk